Abstract
Shale gas extraction is hindered by the complex geological conditions of shale reservoirs, such as deep burial, low permeability, and multi-zone characteristics. Therefore, horizontal well hydraulic fracturing is essential for improving reservoir permeability. However, fracture interference and fracturing fluid retention can lead to gas–water co-production. Existing models for predicting the productivity of fractured horizontal wells typically focus on single-phase flow or do not fully account for fracture interactions and dynamic water saturation changes. In contrast, this study introduces a novel fast prediction model for the steady-state productivity of fractured horizontal wells under a gas–water two-phase flow. The model extends single-phase fluid seepage theory by incorporating a gas–water two-phase pseudo-pressure function, while also accounting for fracture interference using potential theory and the superposition principle. Furthermore, it dynamically integrates formation pressure and water saturation variations, offering a more accurate prediction of productivity. The result demonstrates that fracture interference significantly affects the distribution of productivity, with end fractures producing up to 5.6 × 10⁴ m3 while intermediate fractures maintain a relatively uniform production of around 0.9 × 10⁴ m3. The sensitivity analysis reveals that productivity increases with an increase in formation pressure, fracture number, fracture half-length, and fracture angle, while an increcase in water saturation and skin factor reduce it. These results highlight the importance of optimizing fracture design and production strategies. This work provides a more comprehensive and efficient method for predicting and optimizing the gas–water two-phase productivity of fractured horizontal wells.
1. Introduction
Shale gas, as a type of unconventional natural gas, holds significant potential for exploration and development. China possesses abundant shale gas resources, particularly in regions such as Sichuan and Chongqing. Notably, the Sichuan Basin emerges as a key zone for shale gas concentration, holding an estimated 3.7 trillion cubic meters of resources, with over 2 trillion cubic meters deemed recoverable [1].
Compared with conventional reservoirs, shale gas reservoirs are characterized by ultra-low permeability, the development of micro–nano-scale pores, and a complex pore structure, making them almost incapable of reaching the capacity of natural production [2]. Under such conditions, large-scale hydraulic fracturing technology is widely applied to shale gas production to modify the reservoir and facilitate economic development. However, this also increases the complexity of shale reservoir characteristics and leads to the phenomenon of gas–water co-production [3]. Therefore, accurately evaluating and analyzing shale gas production after fracturing is crucial for optimizing development strategies and improving production efficiency.
Currently, academic research on shale gas well productivity prediction is extensive, with prediction methods mainly including the production decline analysis method, analytical method, numerical simulation method, and machine learning method. The production decline analysis method does not consider complex flow mechanisms and relies solely on extensive production data for trend analysis. Based on decline trends and type curves, many researchers have proposed different empirical formulas for this method, including the Arps, Duong, and SEPD models [4]. The advantage of this method lies in its simplicity, ease of use, and efficiency, making it particularly suitable for analyzing production trends based on large datasets and early-stage productivity forecasting. Additionally, various empirical formulas can be adapted to different well characteristics. However, its limitations include a lack of support from complex flow theories, its applicability primarily applying to the stable production stage, its high dependency on the quality and quantity of available data, its insufficient accuracy for long-term forecasting, and its inability to explain the physical mechanisms of productivity changes or adequately consider reservoir heterogeneity. Modern DCA methods aim to overcome these limitations by integrating transient flow theories with empirical approaches, thereby improving prediction accuracy and adaptability as production regimes evolve [5]. Numerical simulation methods establish high-precision physical models to accurately describe fluid flow in reservoirs. To enhance the representation of complex geological conditions and describe shale gas flow in intricate fracture networks, Karimi-Fard et al. [6] developed a discrete fracture network (DFN) model. To reduce the computational costs associated with refined matrix grids and avoid irregular matrix grids along fracture directions, Huang et al. [7] proposed the embedded discrete fracture model (EDFM), which embeds fractures into structured matrix grids. Zhao et al. [8] built a model that integrates geological parameter modeling with hydraulic fracture characterization based on EDFM theory and using the finite volume method. Numerical simulation methods are well-suited for characterizing complex geological conditions and fracture networks, offering flexibility and clear physical mechanisms. However, high-precision simulations require substantial computational resources, particularly under complex geological conditions and when using fine grid discretization, leading to significant increases in computational time and cost. In recent years, machine learning methods have been increasingly applied to shale gas well productivity evaluations. He et al. [9] used machine learning methods, applying clustering analysis to study the key factors affecting shale gas well productivity and employing the random forest method for productivity predictions. Han et al. [10] addressed the issue of unclear main controlling factors for single-well shale gas production by analyzing geological engineering and production data, using the gray correlation method to study the key factors affecting single-well productivity. Chen et al. [11] determined the key factors and weights influencing post-fracturing productivity in horizontal shale gas wells using gray correlation analysis and established a productivity prediction model based on BP neural networks for volumetric fracturing in horizontal wells. Machine learning methods have advantages in efficiently handling large datasets, performing multi-factor comprehensive analysis, modeling nonlinear relationships, and achieving high prediction accuracy, making them particularly suitable for identifying patterns in complex data and enabling automated predictions. However, their limitations include a high dependency on data quality and quantity, poor interpretability, the risk of overfitting, and significant computational resource demands. Additionally, they lack an in-depth description of physical mechanisms. Analytical and semi-analytical models are mathematical models established based on certain physical principles. Analytical models are typically based on simplified assumptions, such as simple reservoir conditions, uniform well and formation properties, and single-phase fluid flow. Semi-analytical models approximate real-world conditions by segmenting wellbore trajectories and can address complex well problems. Mohamed et al. [12] defined the relationships among artificial fractures, secondary extension fractures, natural fractures, inorganic matrices, and organic matrices in shale reservoirs using an equivalent continuum model. Liu et al. [13] identified the presence of a two-phase gas–water flow, as well as trilinear and pentalinear flow regimes, in different flow regions. Zeng et al. [14] described the coupled flow mechanisms across multiple media through mathematical expressions of mass transfer control equations, considering various flow mechanisms such as Knudsen diffusion, molecular surface diffusion, and adsorption–desorption, thereby establishing an analytical model for cross-scale shale gas transport. Linear flow models can quickly capture production dynamics for multi-stage fractured horizontal wells but often overlook the pseudo-radial flow phase and fracture interference effects in the outer region. Yang et al. [15] derived productivity calculation models for tight gas fractured horizontal wells using point-source methods and the principle of potential superposition. Hu et al. [16] established a coupled flow model for reservoirs, fractures, and wellbores, accounting for the complex shapes and non-uniform distribution of fractures. Yuan et al. [17] and He et al. [18] introduced gas–water two-phase pseudo-pressure functions and derived gas–water two-phase productivity equations using conformal transformations. However, their models overlook fracture distribution and the angle at which the fracture intersects with the wellbore, leading to potential inaccuracies in some scenarios. Analytical methods, supported by explicit physical principles and mathematical derivations, offer high computational efficiency, strong theoretical foundations, and suitability for specific conditions, particularly for rapid evaluation and sensitivity analyses. However, their limitations include restrictive assumptions, limited applicability, and the omission of secondary factors, making it challenging for them to fully reflect the actual complexity of geological conditions and highly nonlinear problems. Despite these limitations, analytical methods remain valuable for shale gas productivity evaluation, providing reliable support for theoretical research and engineering practices.
This study introduces an innovative fast prediction model of the steady-state productivity of fractured horizontal wells in shale gas reservoirs under gas–water two-phase flow. Building on the elastic unstable seepage theory for single-phase fluids, the model integrates gas–water two-phase pseudo-pressure functions and incorporates fracture interference using potential theory and the superposition principle. A significant contribution of this model is its ability to dynamically predict reservoir pressure and water saturation using material balance equations, which are incorporated into the productivity prediction model. The model further distinguishes itself by accurately accounting for the non-uniform distribution of fractures and the angle between fractures and horizontal wells, factors that are often overlooked in previous studies. This integrated approach significantly enhances the accuracy and efficiency of productivity predictions compared to prior models. Finally, the study investigates the impact of parameters such as reservoir pressure, fracture number, fracture half-length, fracture angle, water saturation, and skin factor on productivity, providing actionable insights for optimizing fracturing designs and production strategies.
2. Materials and Methods
2.1. Physical Model
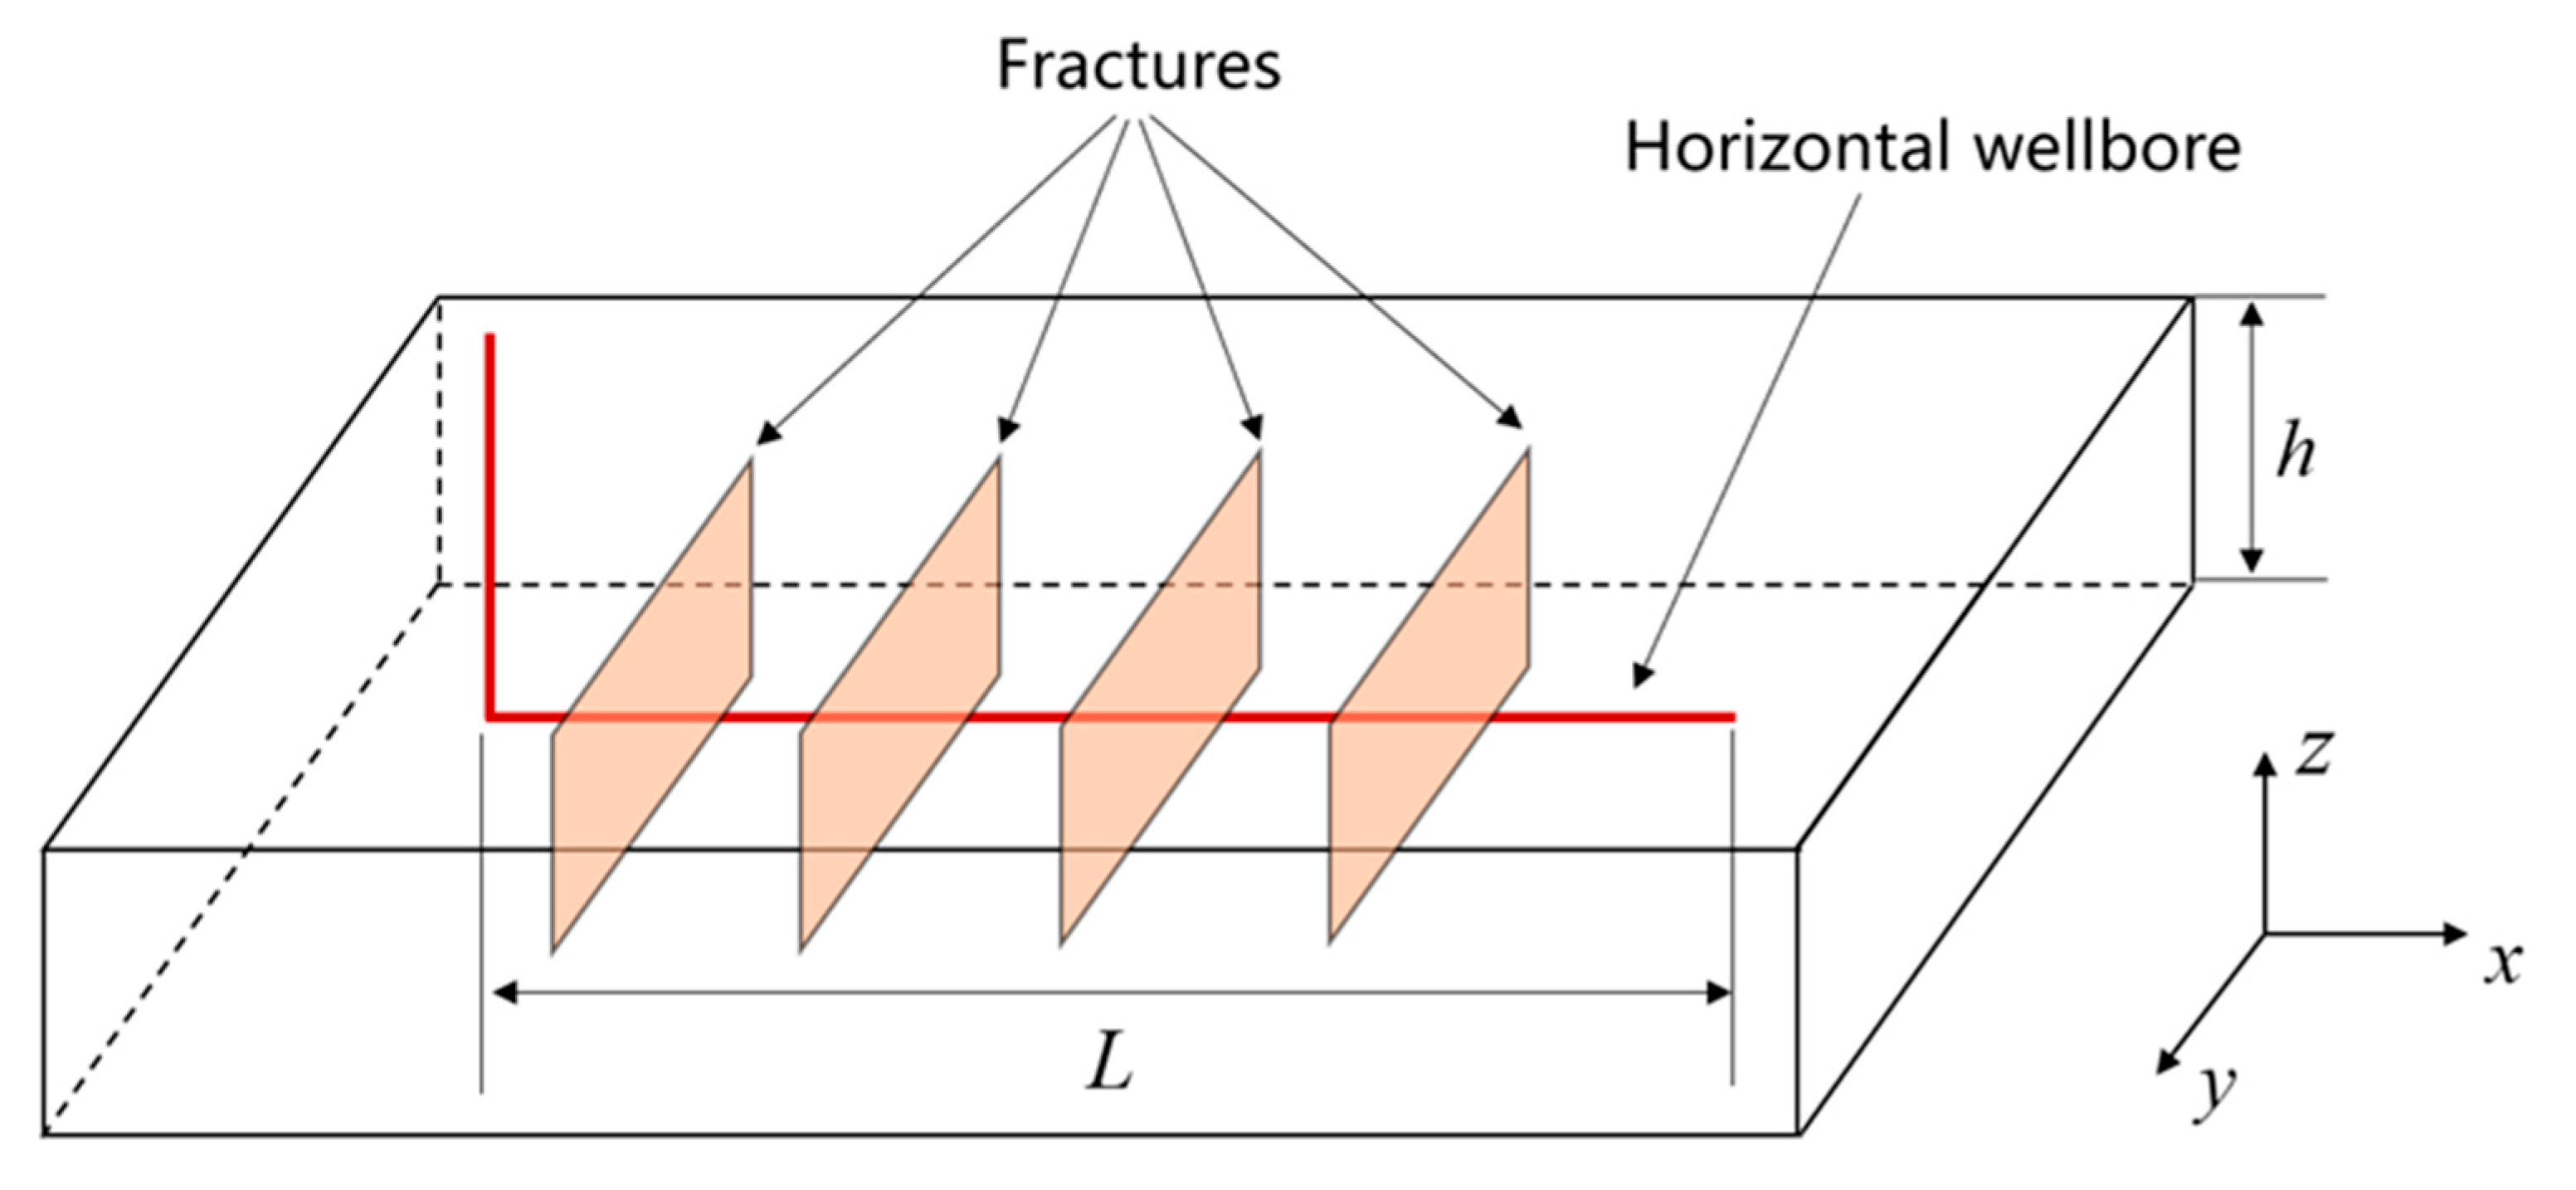
Figure 1 illustrates the physical model for a shale gas fractured horizontal well. The following assumptions are made:
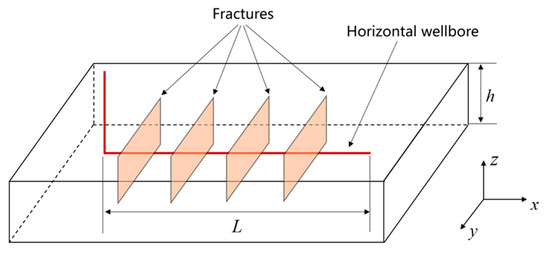
Figure 1.
Physical model of a shale gas fractured horizontal well.
- Central wellbore placement: The wellbore is located centrally in the reservoir, with its length denoted by L. This assumption simplifies the geometric representation of the wellbore and its interaction with the reservoir.
- Fracture asymmetry: Post-fracturing, N fractures are introduced, which exhibit varying asymmetry levels relative to the wellbore. This assumption allows the model to account for non-uniform fracture distributions, although the analysis in this study primarily uses uniform fracture spacing and symmetry for demonstration purposes.
- Flow mechanism: The fluid first travels from the reservoir matrix into the fractures, and then into the wellbore. This assumption reflects the dual-porosity nature of shale gas reservoirs but may not fully capture more complex flow mechanisms, such as the direct matrix-to-wellbore flow in certain scenarios.
- Steady-state flow: The model assumes steady-state flow conditions, which may not fully represent the transient behavior of shale gas reservoirs during early production stages or under rapidly changing reservoir conditions.
- Static fracture network: The fractures are assumed to remain static during production, ignoring potential dynamic changes such as fracture closure or propagation due to stress redistribution or pressure depletion.
These assumptions simplify the model’s formulation and computational requirements, making it suitable for rapid evaluation and sensitivity analyses. However, they may limit the model’s applicability in scenarios with highly complex conditions. Future work could extend the model to address these limitations.
2.2. Mathematical Model
In order to accurately predict the formation pressure and average water saturation at different time points in a gas reservoir, and subsequently incorporate these into the fracture-formation steady-state flow model for dynamic production analyses, this study utilizes the material balance equation and the water saturation formula to describe the reservoir state. The material balance equation is as follows [19]:
where and represent the formation pressure and initial formation pressure ; and are the corresponding deviation factors; is the comprehensive compressibility factor; and represent the cumulative gas production and initial gas volume ; is the cumulative water produced ; and correspond to the formation water volume factor and the initial gas volume factor, respectively. During the calculation, the initial gas volume and production data, derived from the fitting process, are inserted into the equation. This enables the determination of formation pressure at various cumulative gas production levels, as illustrated in Figure 2.
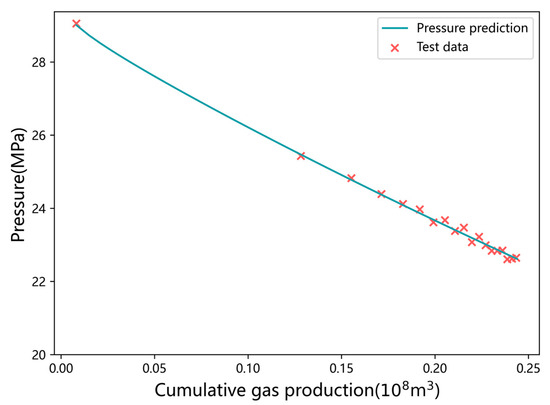
Figure 2.
Dual medium physical model of shale gas fractured horizontal well.
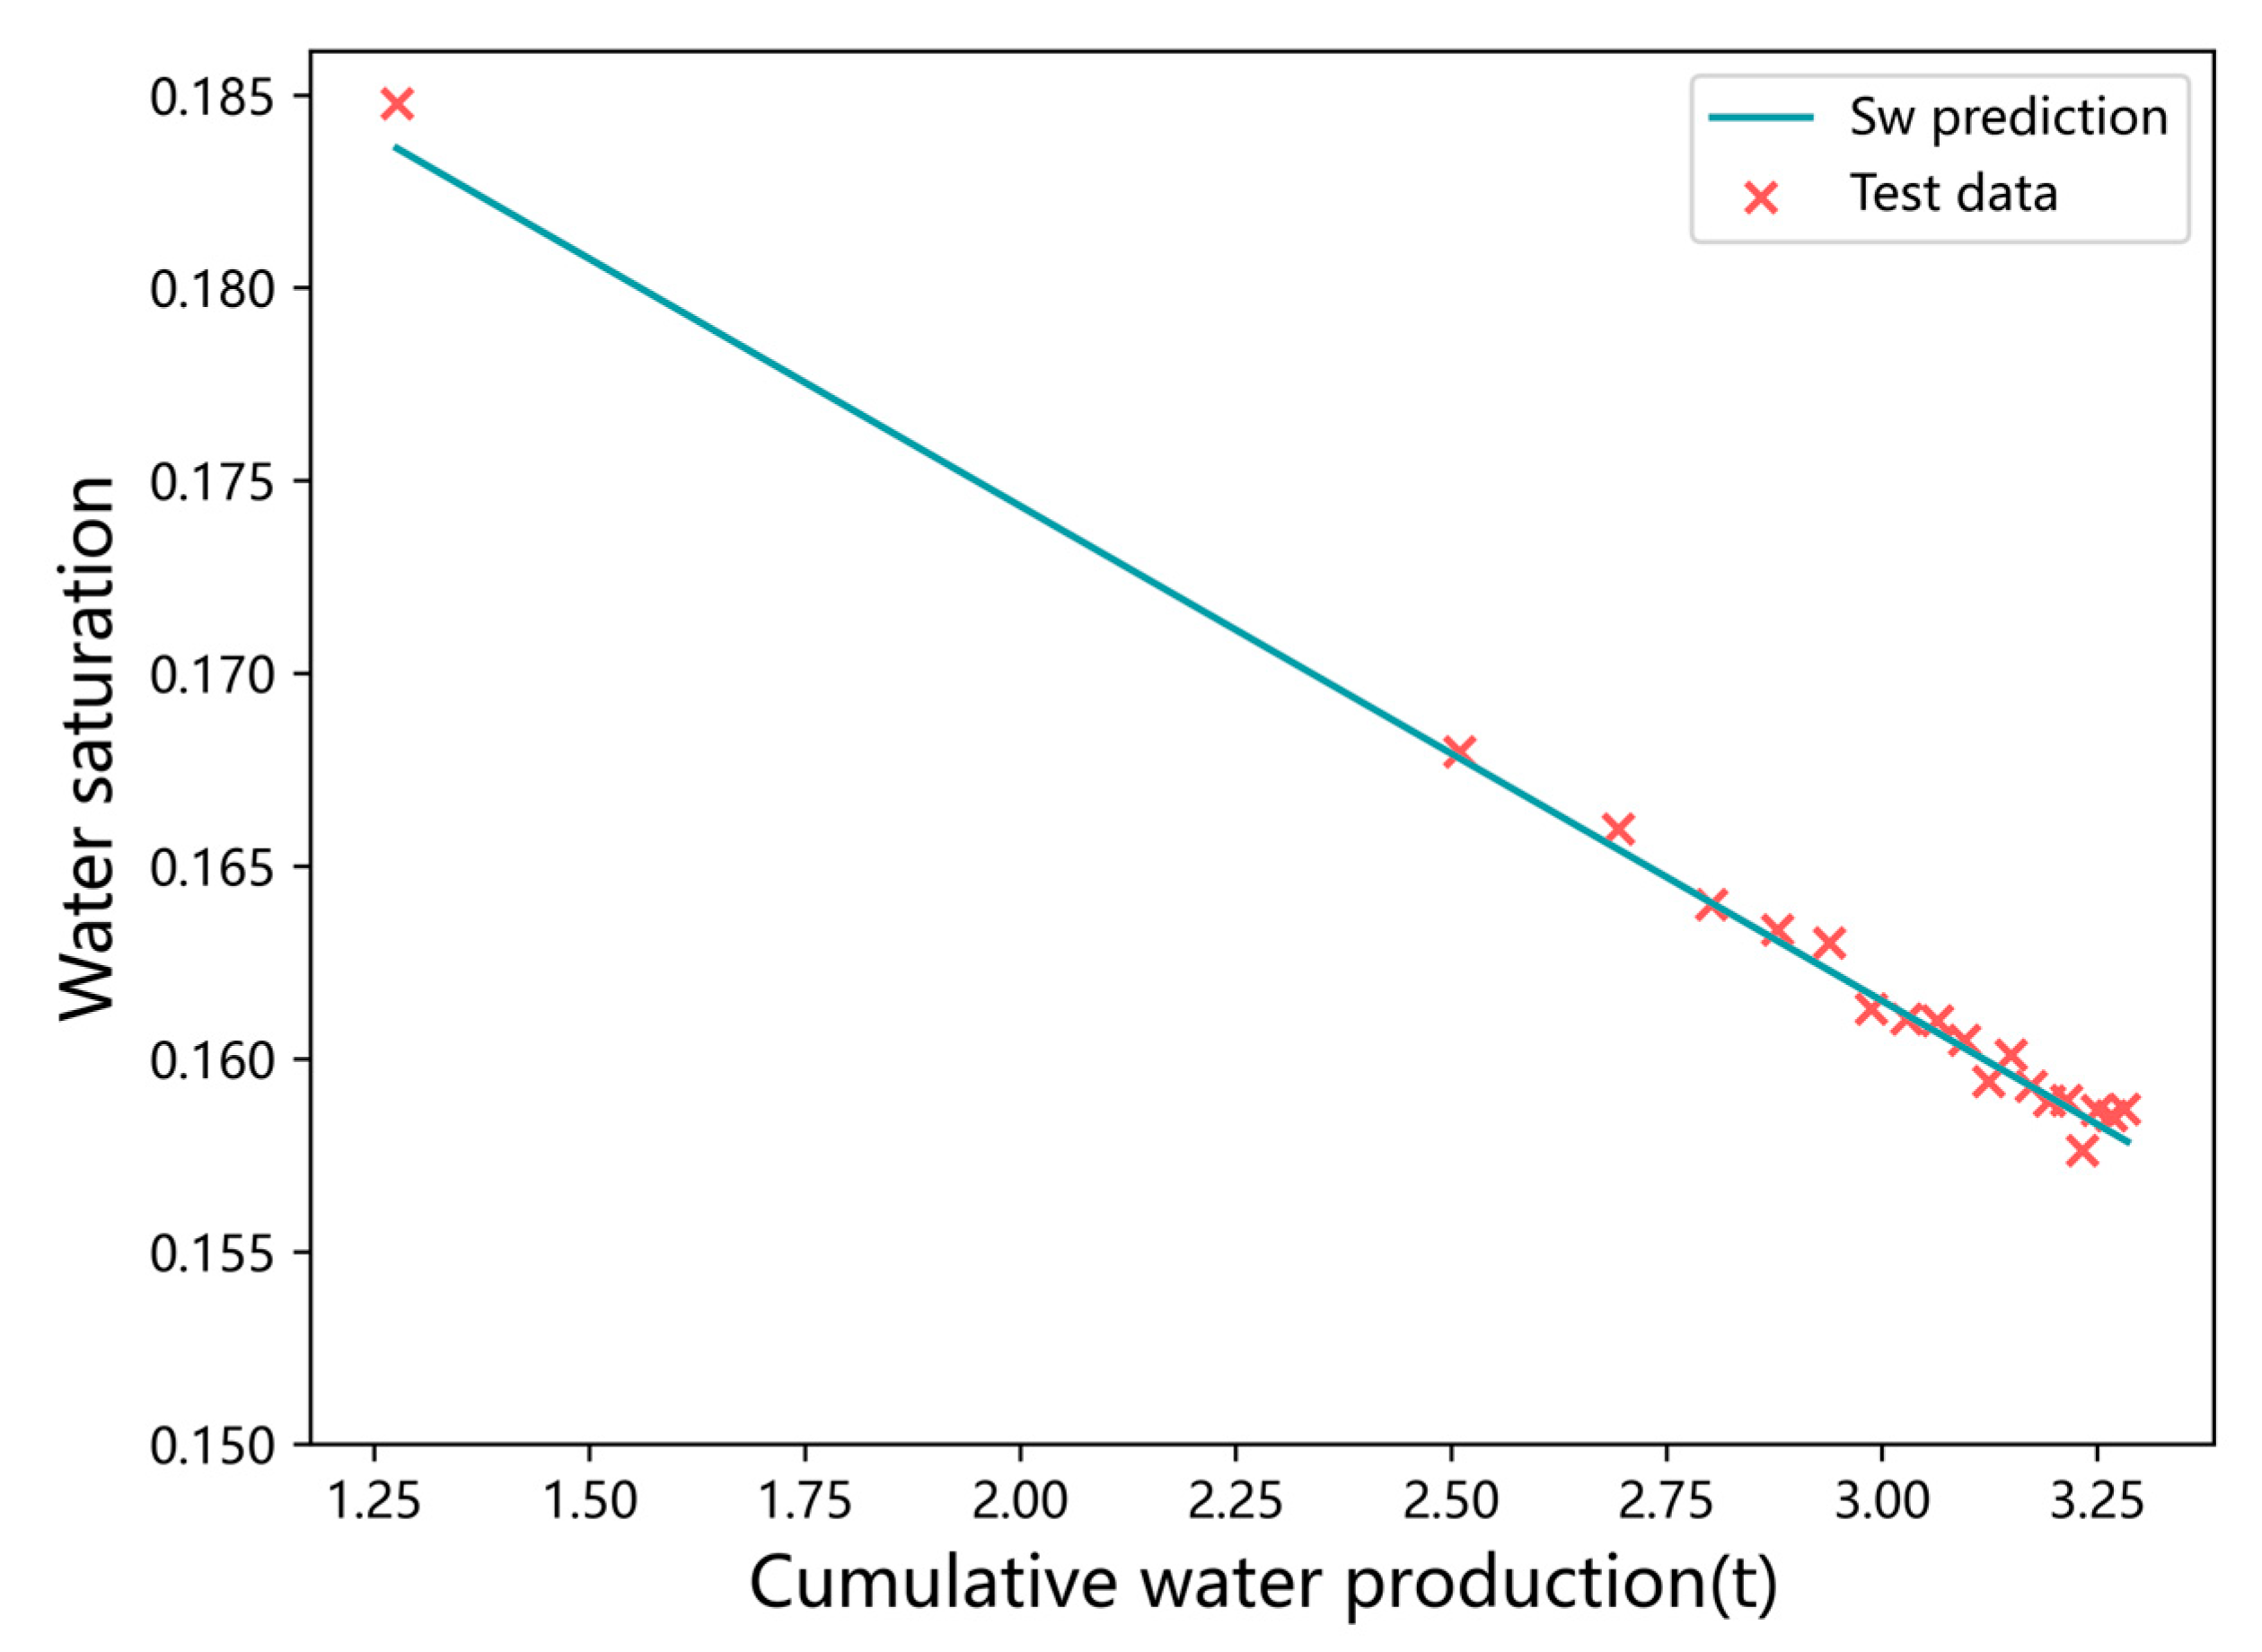
To reflect the dynamic variation in the average water saturation, the following formula is used for the calculation of water saturation:
where is the average water saturation; is the initial water content ; and is the pore volume. The average water saturation at each time point can be obtained after updating the cumulative water production at that moment. As the cumulative water production increases, the average water saturation gradually decreases, as shown in Figure 3.
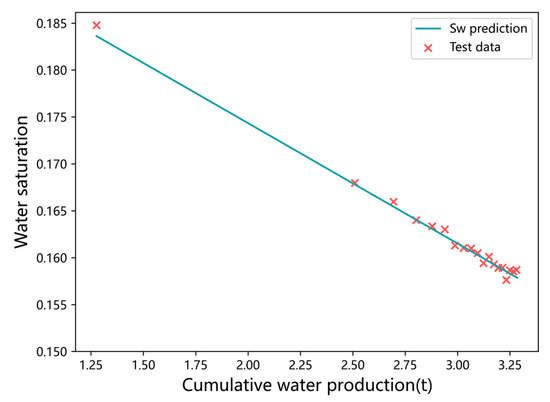
Figure 3.
Change in water saturation under different cumulative water yields.
The study is based on the theory of steady-state single-phase liquid flow, from which the pressure drop formula for a point sink in an infinite homogeneous formation is obtained as follows [20]:
where represent the coordinates of the point sink ; denotes the gas flow rate ; indicates the permeability of the reservoir ; stands for the thickness of the formation ; refers to the viscosity of the gas–water mixture ); and signifies the effective radius . For the gas–water co-production capacity model, the gas–water two-phase pseudo pressure function is introduced to extend the model’s applicability to gas–water two-phase flow. In shale gas reservoirs, due to the low permeability, the slip effect, and stress sensitivity, the gas–water two-phase pseudo pressure function can be defined as follows [21]:
In the gas–water two-phase system, and represent the relative permeabilities of the gas and water phases, respectively; The densities of gas and water in this system are denoted by and ; and the viscosities of the gas and water phases are given by and . By substituting Equation (3) into Equation (4) and simplifying, the pressure drop formula at any point in the formation of a shale gas reservoir, based on the gas–water two-phase pseudo pressure function, is obtained as follows:
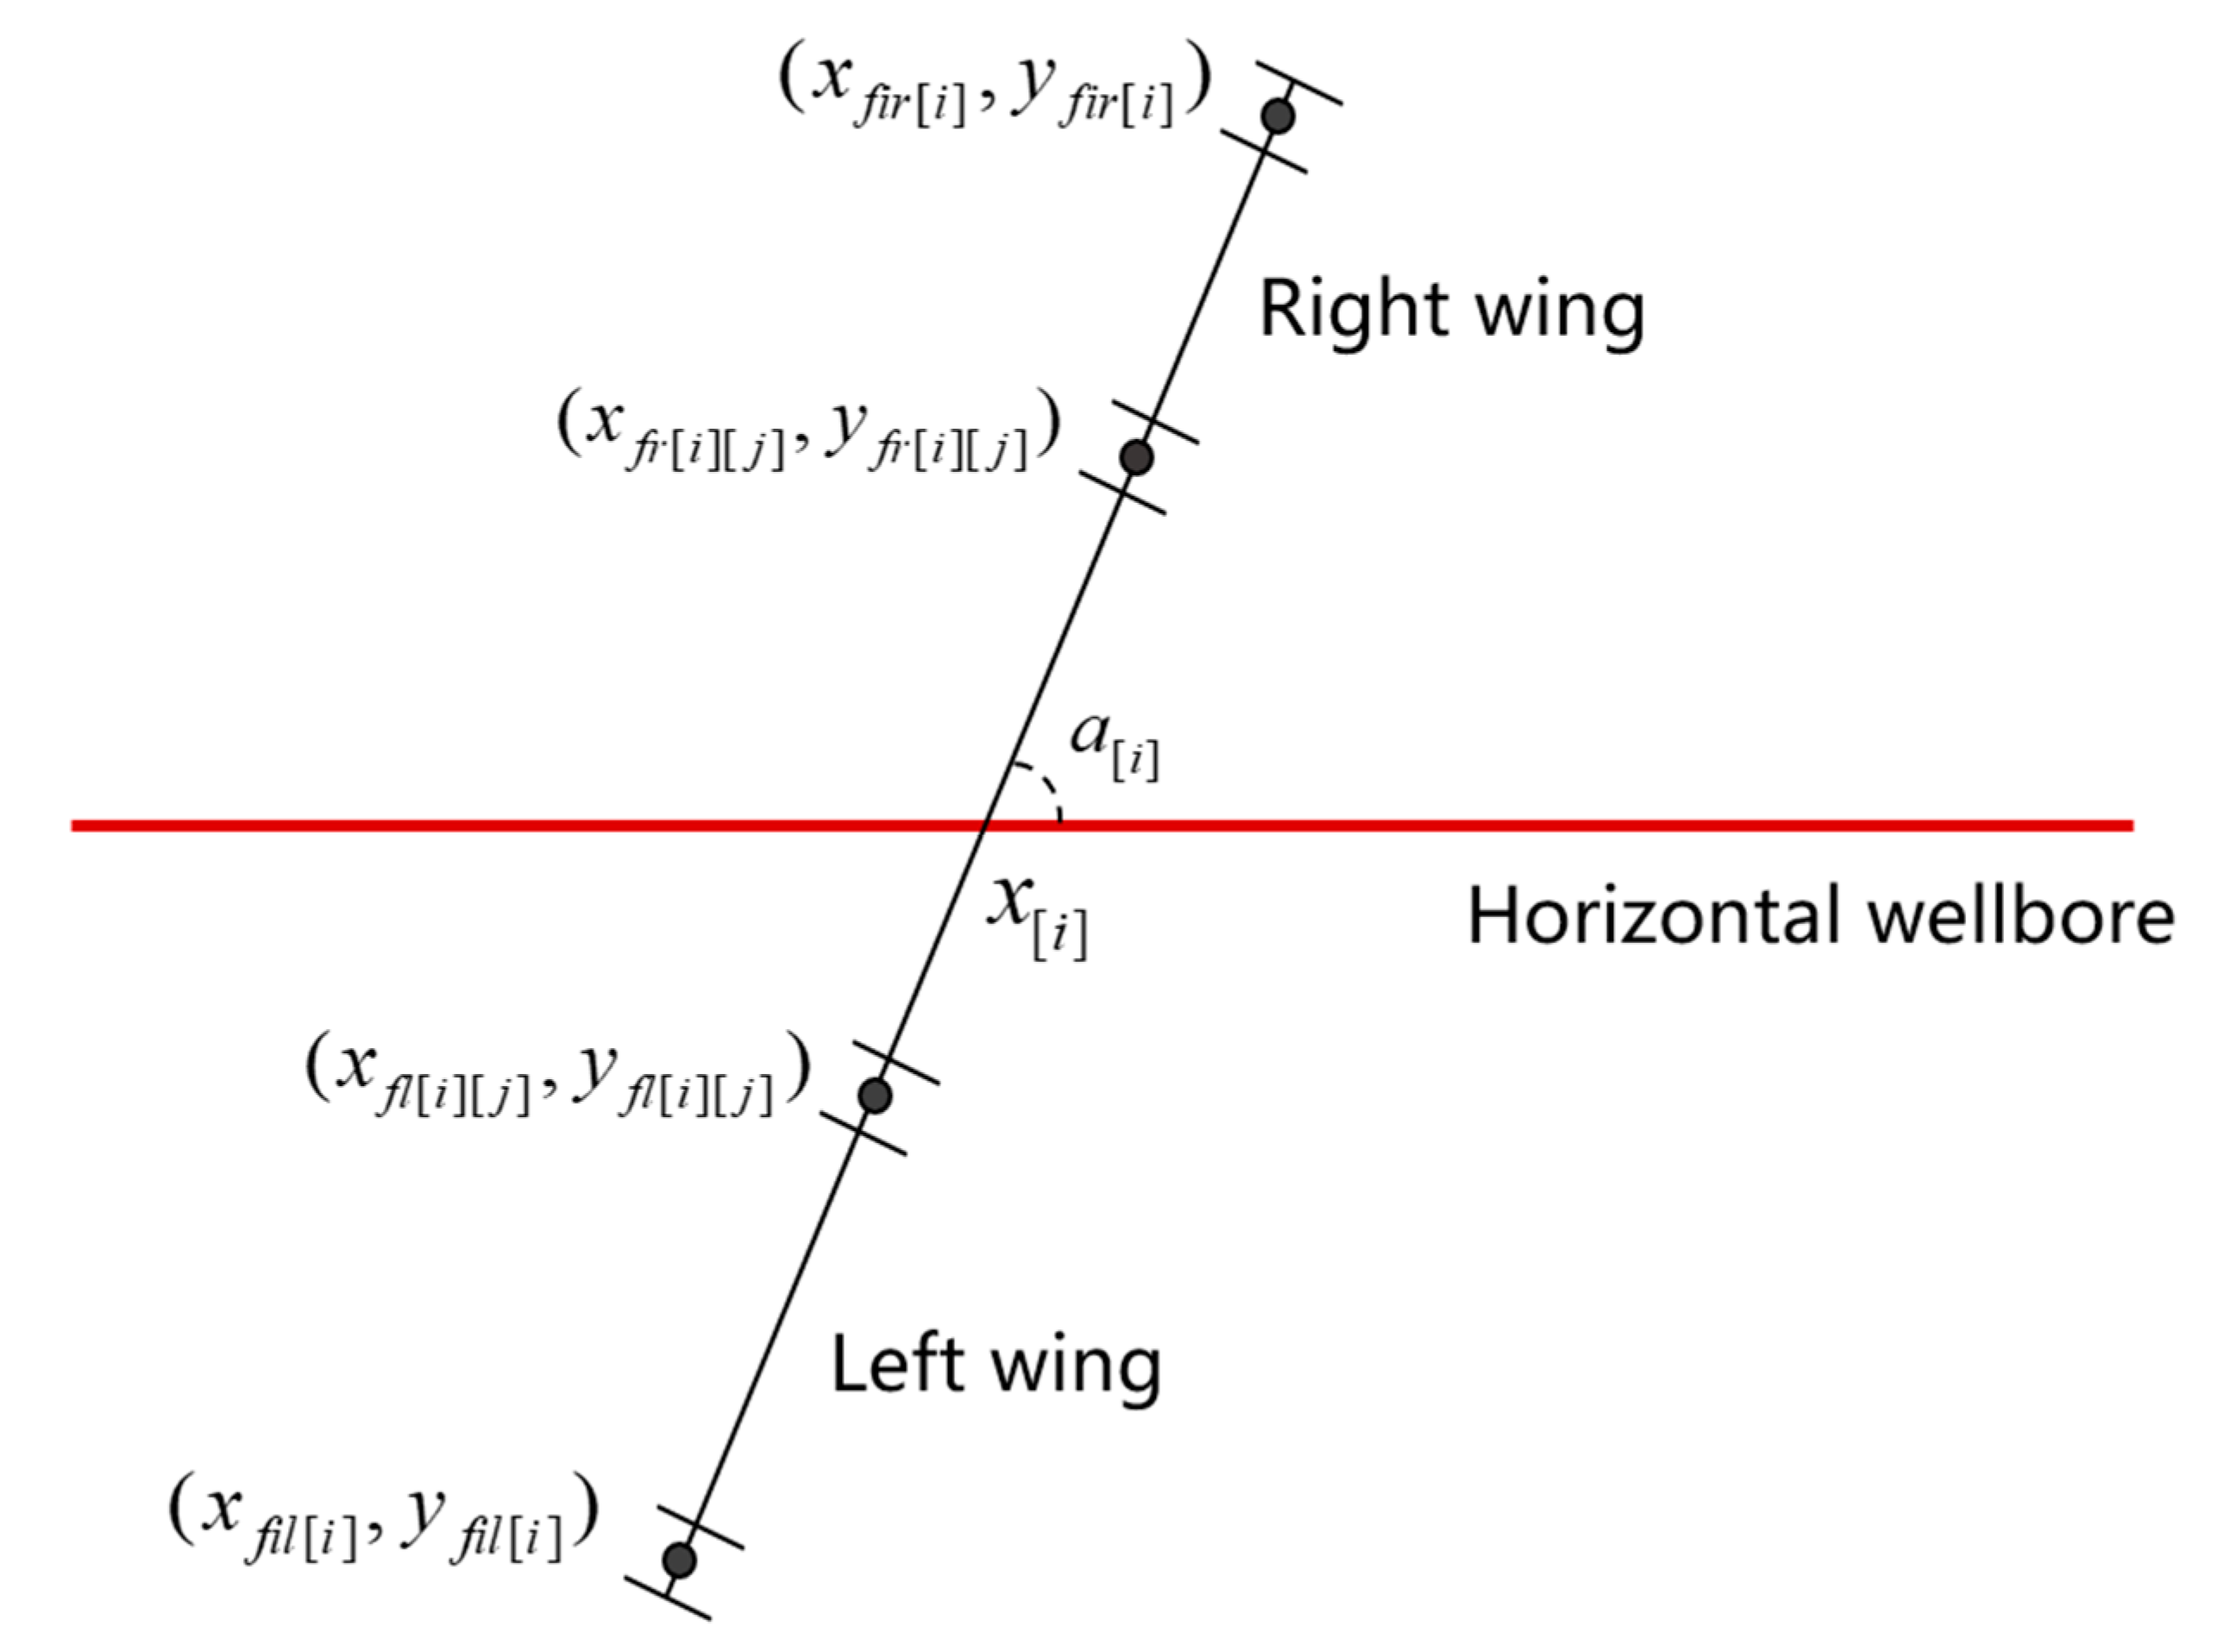
After fracturing a horizontal well, multiple fractures are formed, each consisting of numerous point sources. The fractures can be divided into equal segments on both the left and right wings, with each segment treated as a point source for study. The fractures may not be perpendicular to the wellbore but at a particular angle to it. Assuming the direction of the horizontal well is along the x-axis, and the angle between the fracture and the wellbore axis is , as shown in Figure 4.

Figure 4.
Fracture distribution along horizontal wells (top view).
Let the coordinate of the fracture initiation point of the -th fracture be . The length of the fracture’s right side is denoted as and the angle between the fracture and the horizontal wellbore is represented by . The coordinates of the -th point source on the right side of the fracture are given by . By substituting the coordinates of the -th point source on the fracture’s right side into Equation (5), the pressure drop at any location on the plane caused by this point source can be determined.
where represents the flow rate of the -th segment on the right wing of the -th fracture . Based on the principle of superposition, the total pressure drop at point in the formation is the result of the combined influence of the point sources on the fracture’s right side, which is given by
In a similar manner, the total pressure drop resulting from the point sources on the left side of the fracture can be determined. By adding the pressure drops induced by each fracture at point in the formation, the overall pressure drop at any point in the formation when all fractures are simultaneously producing can be obtained:
The pressure drop generated at the right tip of the -th fracture is the sum of the pressure drops at points located on the left and right wings of all fractures, which converge at the tip. Assuming the coordinate of the right tip is , the pressure drop at the right tip of the -th fracture can be derived from Equation (8) as follows:
In a similar manner, the pressure drop generated at the left tip of the -th fracture can also be written as . However, in practical situations, fractures do not always exhibit symmetry between the left and right sides relative to the horizontal wellbore. Therefore, the effective pressure at the fracture tip is calculated by averaging the pressures at both the left and right fracture tips [22]:
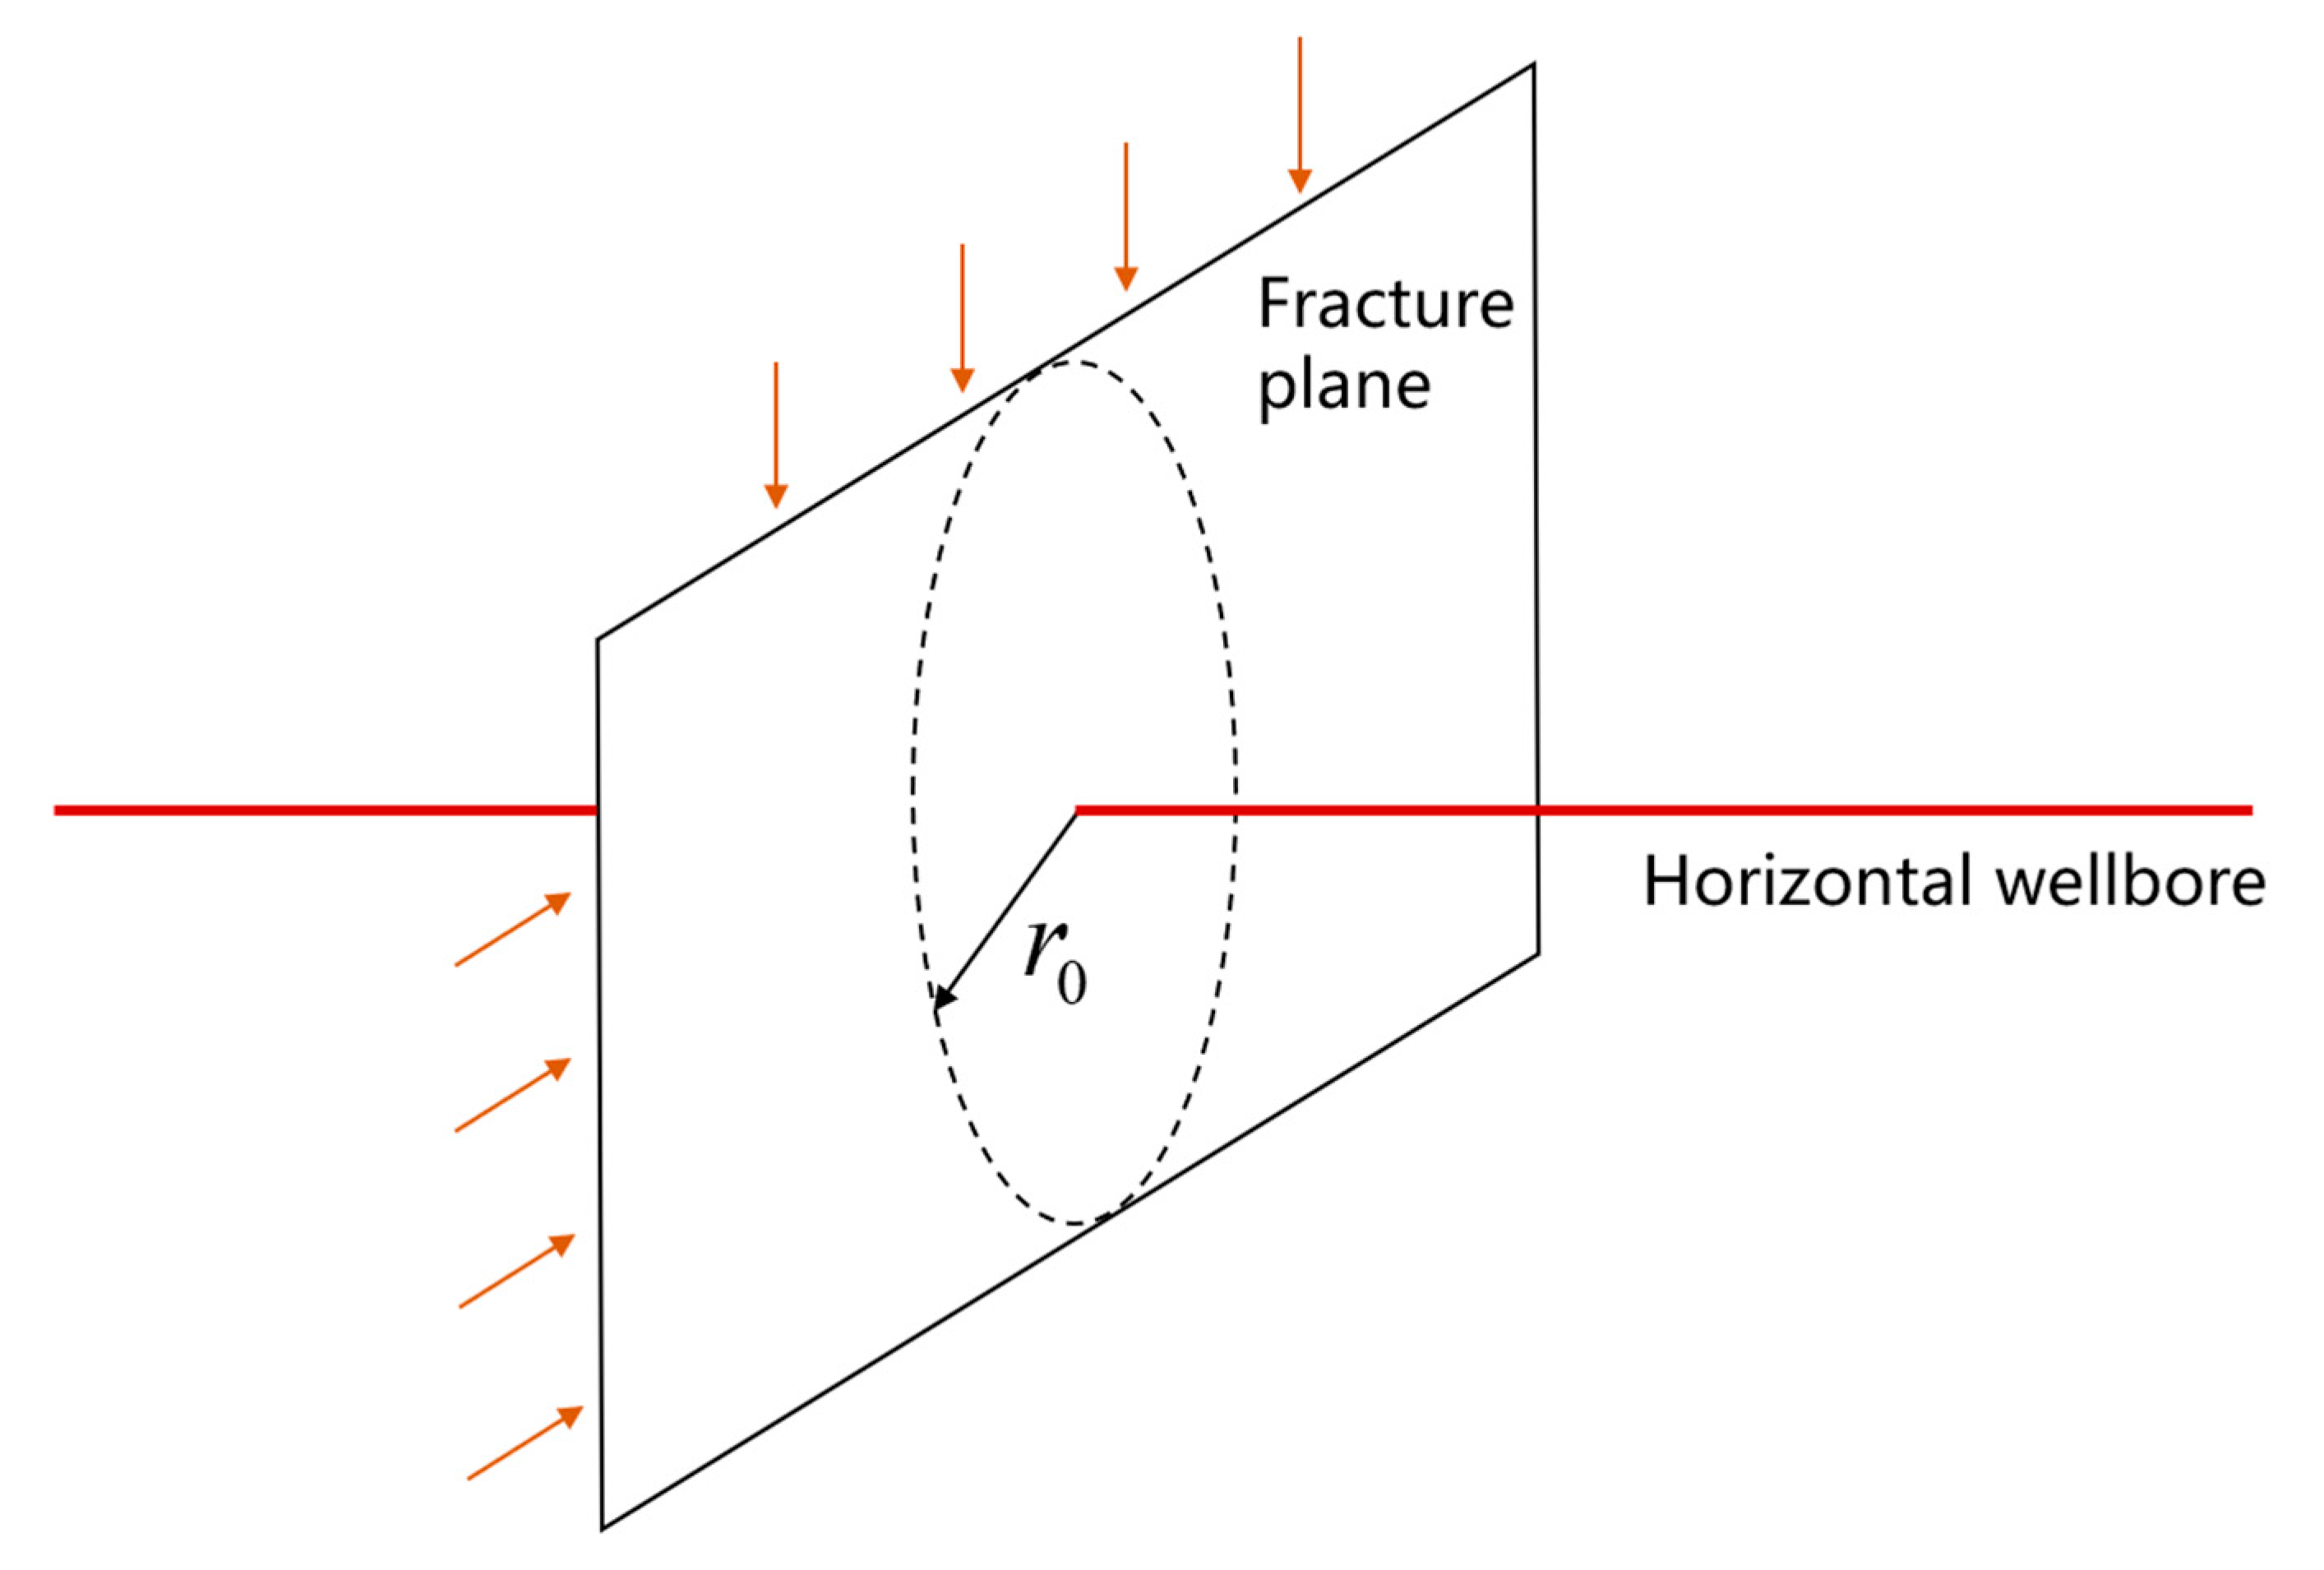
The fluid flow through the -th fracture toward the wellbore can be considered as a miniature gas reservoir with a boundary effective pressure at the fracture tip , a flow radius , a formation thickness , and a bottomhole effective pressure . The flow pattern can be treated as a plane radial flow, as shown in Figure 5. Therefore, the seepage of the fluid from the fracture toward the wellbore can be represented as follows:
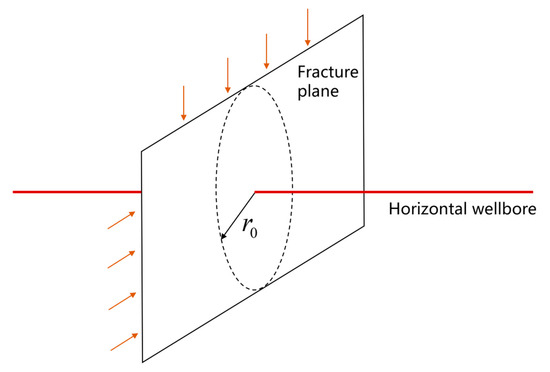
Figure 5.
Fracture–wellbore flow diagram.
The flow rate of the -th fracture is determined by the permeability of the fracture , the radius of the horizontal wellbore , and the skin factor . In practice, fractures are not always symmetric with respect to the horizontal wellbore. Therefore, the flow rate at the -th point on both the left and right wings of the -th fracture can be calculated using the following expression:
Since the resistance to fluid flow within the horizontal wellbore is negligible, it can be approximated that the pressure drop in the wellbore is zero. Therefore, the bottomhole pressure can be considered the same as the pressure at the bottom of the fracture: . By combining the two parts of the seepage process, and using Equations (10) and (11), along with the point flow rate distribution given in Equation (12), the pressure drop for the entire flow process from the reservoir through the -th fracture to the wellbore can be derived as follows:
Based on the assumptions, fluid only flows from the fractures into the wellbore. Therefore, the final production capacity can be expressed as follows [23]:
3. Results
3.1. Fracture Productivity Distribution
In the mechanistic model, it is assumed that the spacing between fractures is uniform, and the horizontal section of the wellbore is considered to be a straight line without fluctuations. The fracture production under these conditions is shown in Figure 6. In the mechanistic model, due to the mutual interference between fractures, the production of the end fractures is significantly higher than that of the intermediate fractures, reaching 5.6 × 10⁴ m3, while the production of fractures in the middle section remains relatively uniform, remaining around 0.9 × 10⁴ m3.
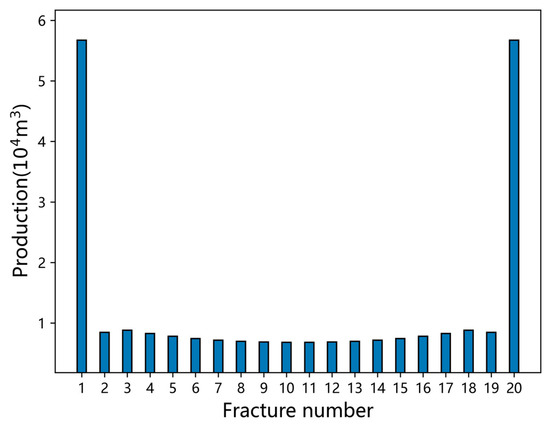
Figure 6.
Fracture productivity distribution.
3.2. Sensitivity Analysis
3.2.1. Impact of Formation Pressure
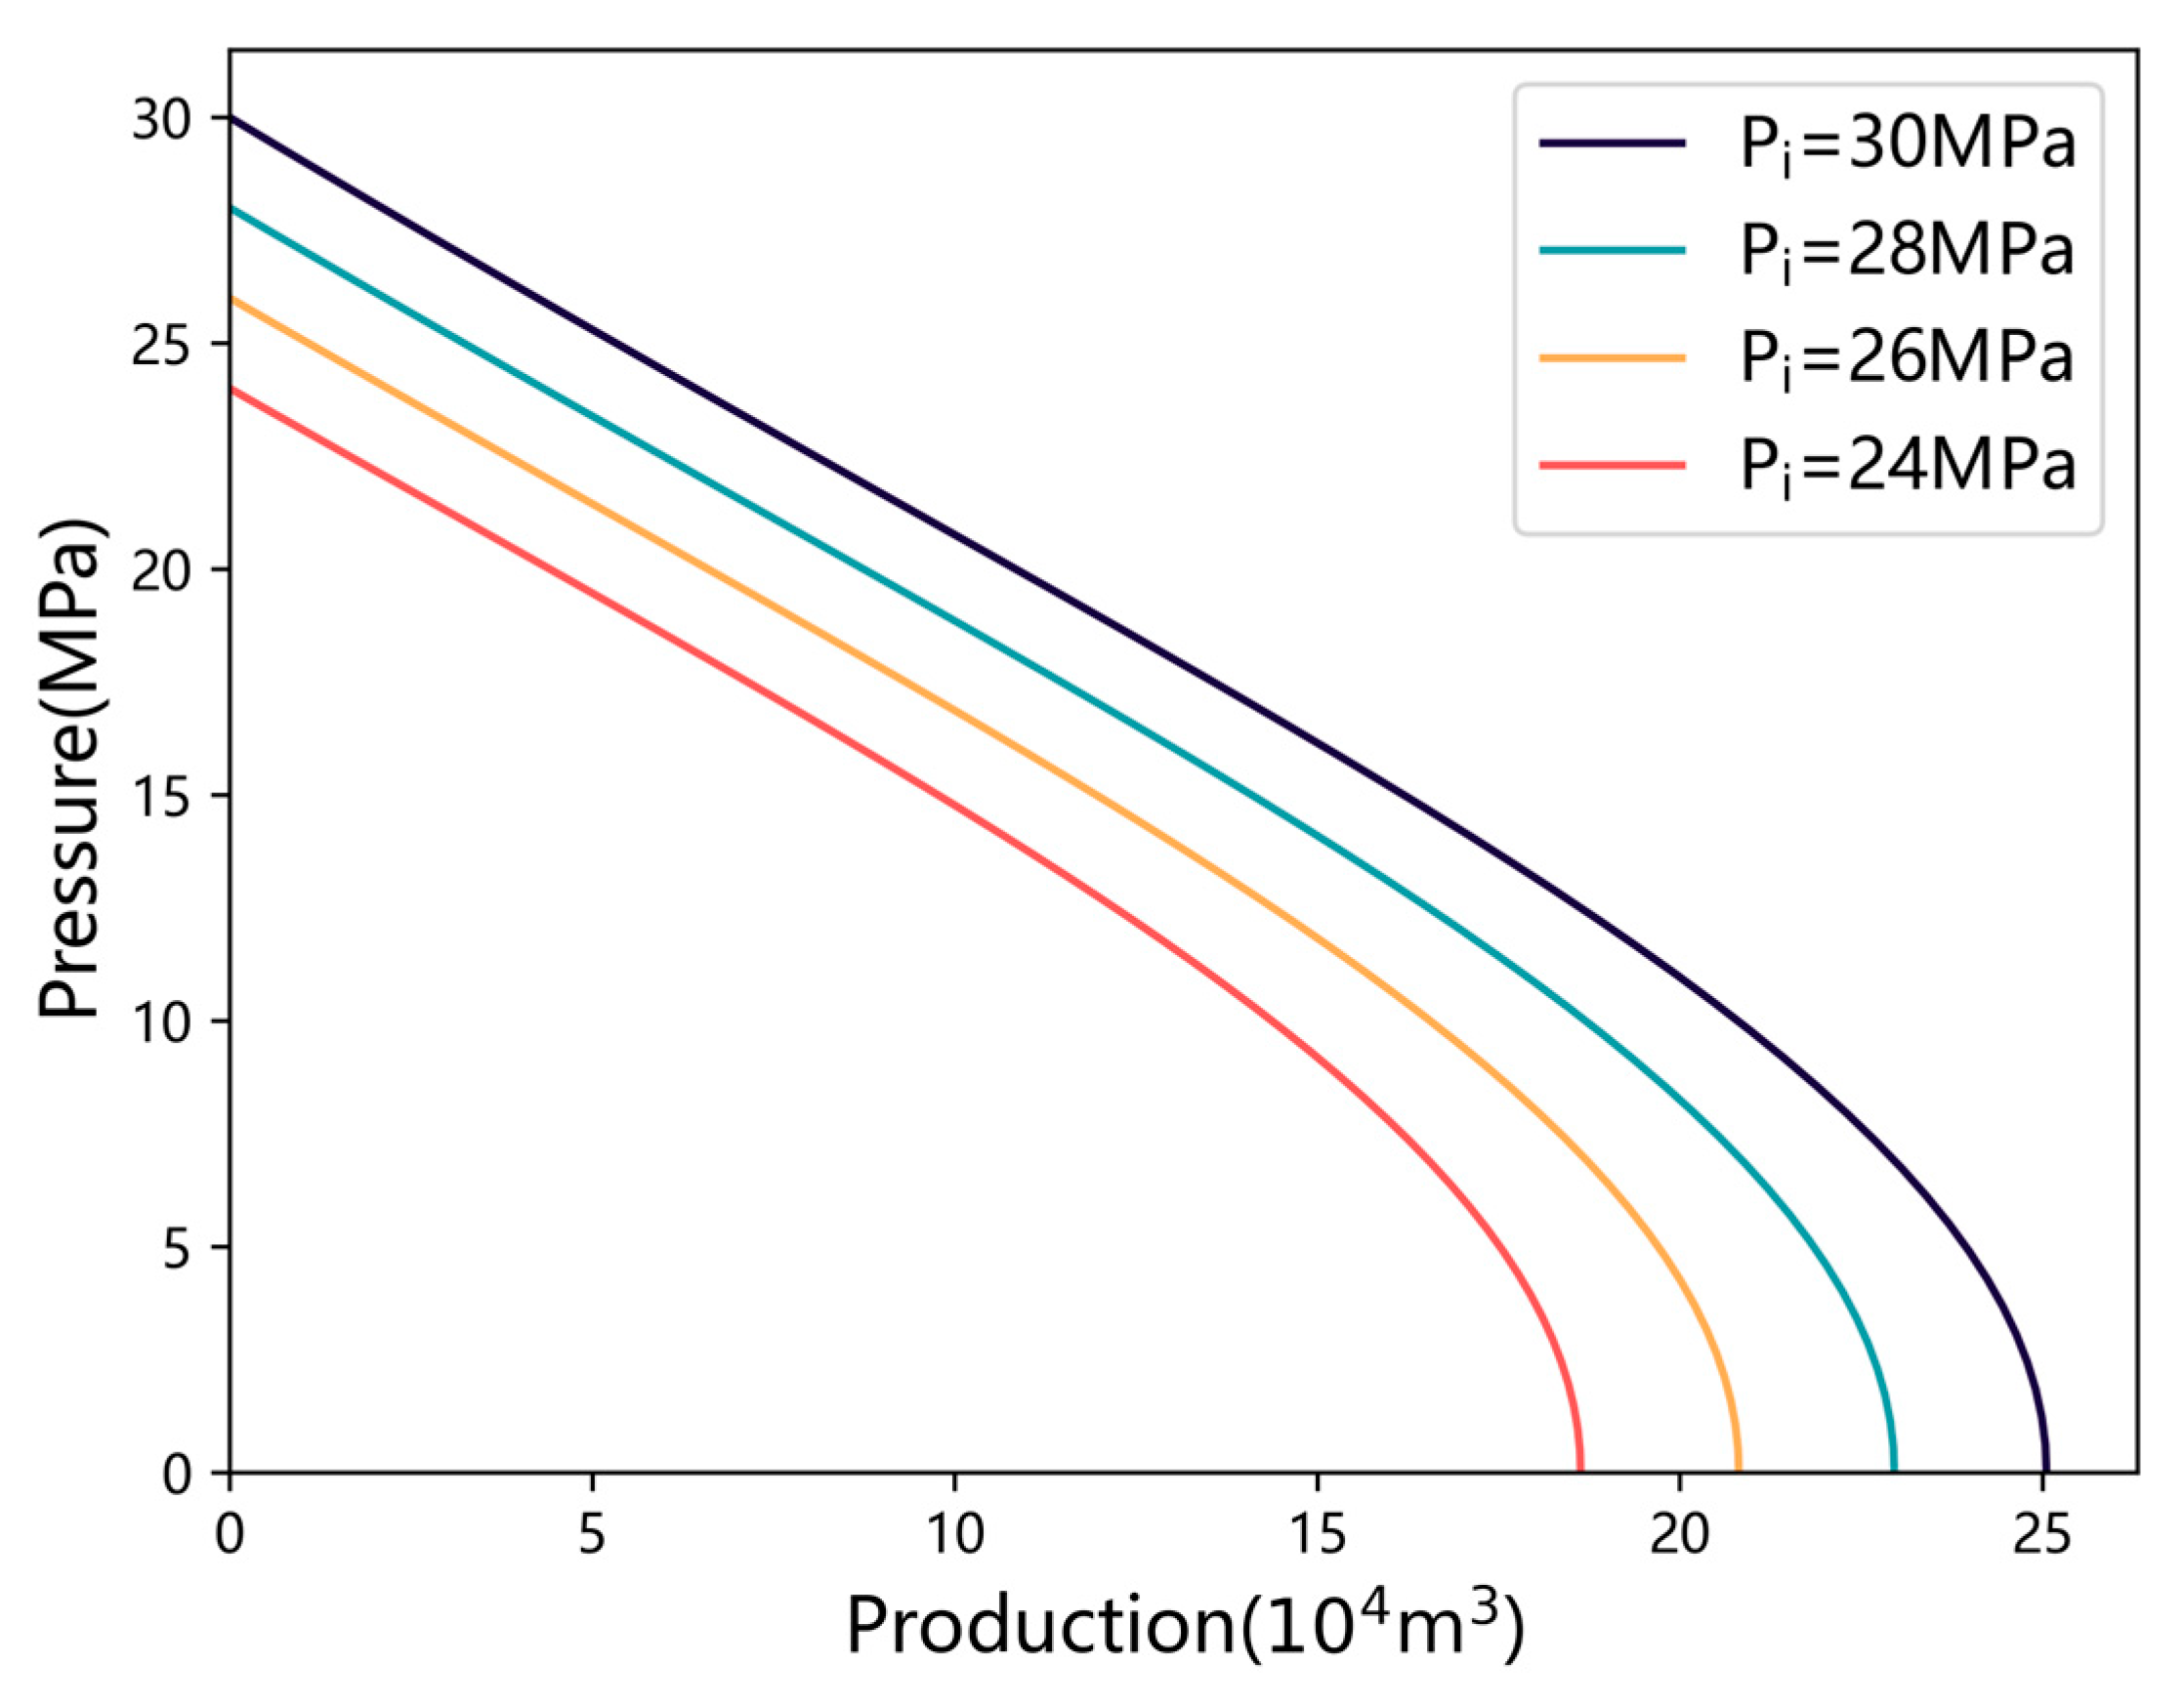
Formation pressure refers to the initial pressure in a gas reservoir or the pressure maintained during production. An increase in formation pressure results in a stronger driving force for fluid flow. A higher formation pressure enhances the force that drives gas toward the wellbore, ultimately improving production capacity. As production progresses, a decline in formation pressure leads to a gradual reduction in production. The relationship between bottomhole pressure and production capacity as the initial formation pressure changes from 24 MPa to 30 MPa is shown in Figure 7. As the initial formation pressure increases, the bottomhole pressure at the same production level becomes higher. This indicates that at higher formation pressures, the driving force for fluid in the wellbore is greater, which can support increased production. Therefore, increasing formation pressure is beneficial for improving the production capacity of gas wells, particularly when high-pressure gas is required for maintaining flow in low-permeability formations.

Figure 7.
Effect of formation pressure on the inflow performance of horizontal wells.
3.2.2. Impact of Water Saturation
Water saturation represents the proportion of the phase occupied in the formation. A high level of water saturation indicates that more liquid is retained in the reservoir, occupying pore space and reducing gas flow paths, thus increasing flow resistance. A high level of water saturation may also lead to water accumulation in the wellbore, resulting in an increase in production pressure drops. The relationship between bottomhole pressure and production capacity at water saturation values ranging from 0.1 to 0.25 is shown in Figure 8. As water saturation increases, the gas well’s productivity declines. Therefore, reduced water saturation is beneficial for the efficient production of gas wells.
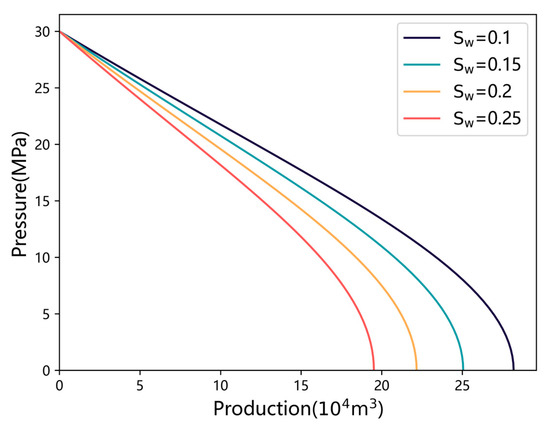
Figure 8.
Effect of water saturation on the inflow performance of horizontal wells.
3.2.3. Impact of Fracture Number
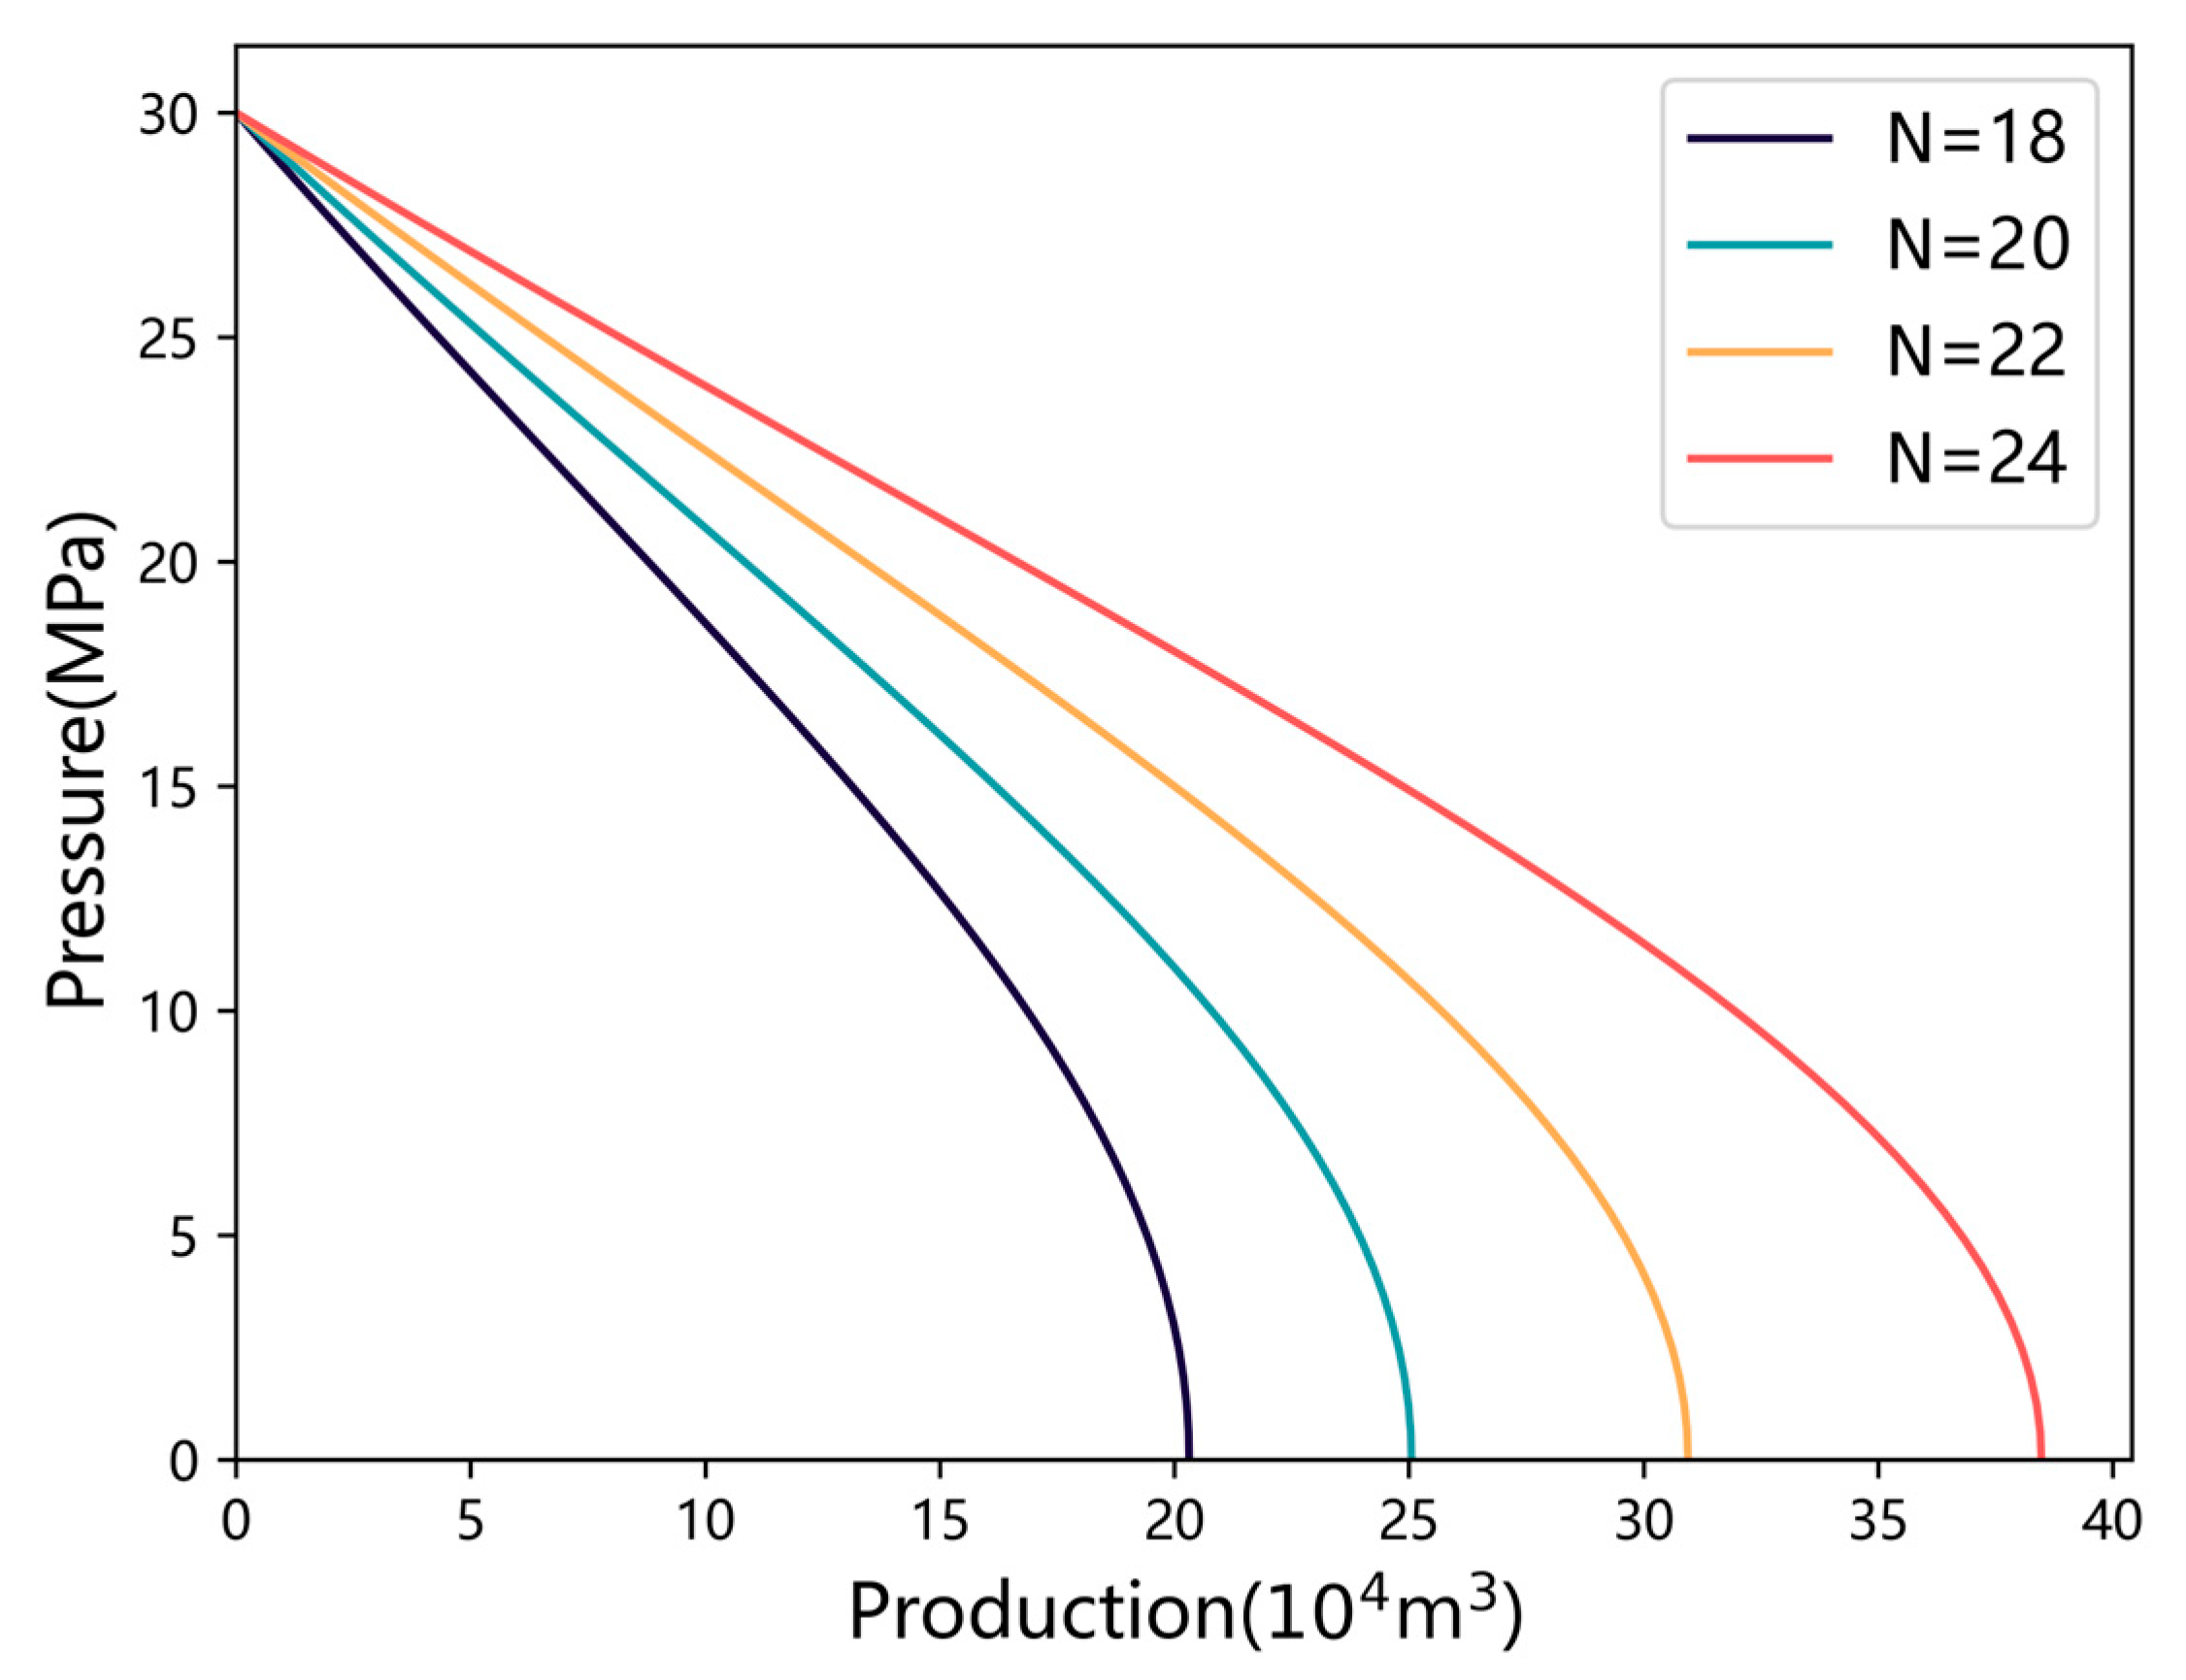
The number of fractures refers to the quantity of artificial fractures formed by fracturing in the reservoir. An increase in the number of fractures enhances the gas well’s permeability channels. More fractures mean that more gas can enter the wellbore from the reservoir, which contributes to increased productivity. The relationship between bottomhole pressure and production capacity when the number of fractures changes from 18 to 24 is shown in Figure 9. As the number of fractures increases, productivity gradually improves. However, increasing the number of fractures also raises construction costs, and an excessive number of fractures may lead to fracture interference, affecting productivity. Therefore, determining the optimal number of fractures is critical.
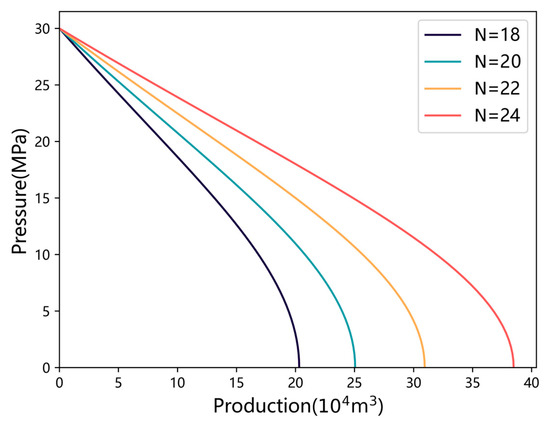
Figure 9.
Effect of fracture number on inflow performance of horizontal well.
3.2.4. Impact of Fracture Half-Length
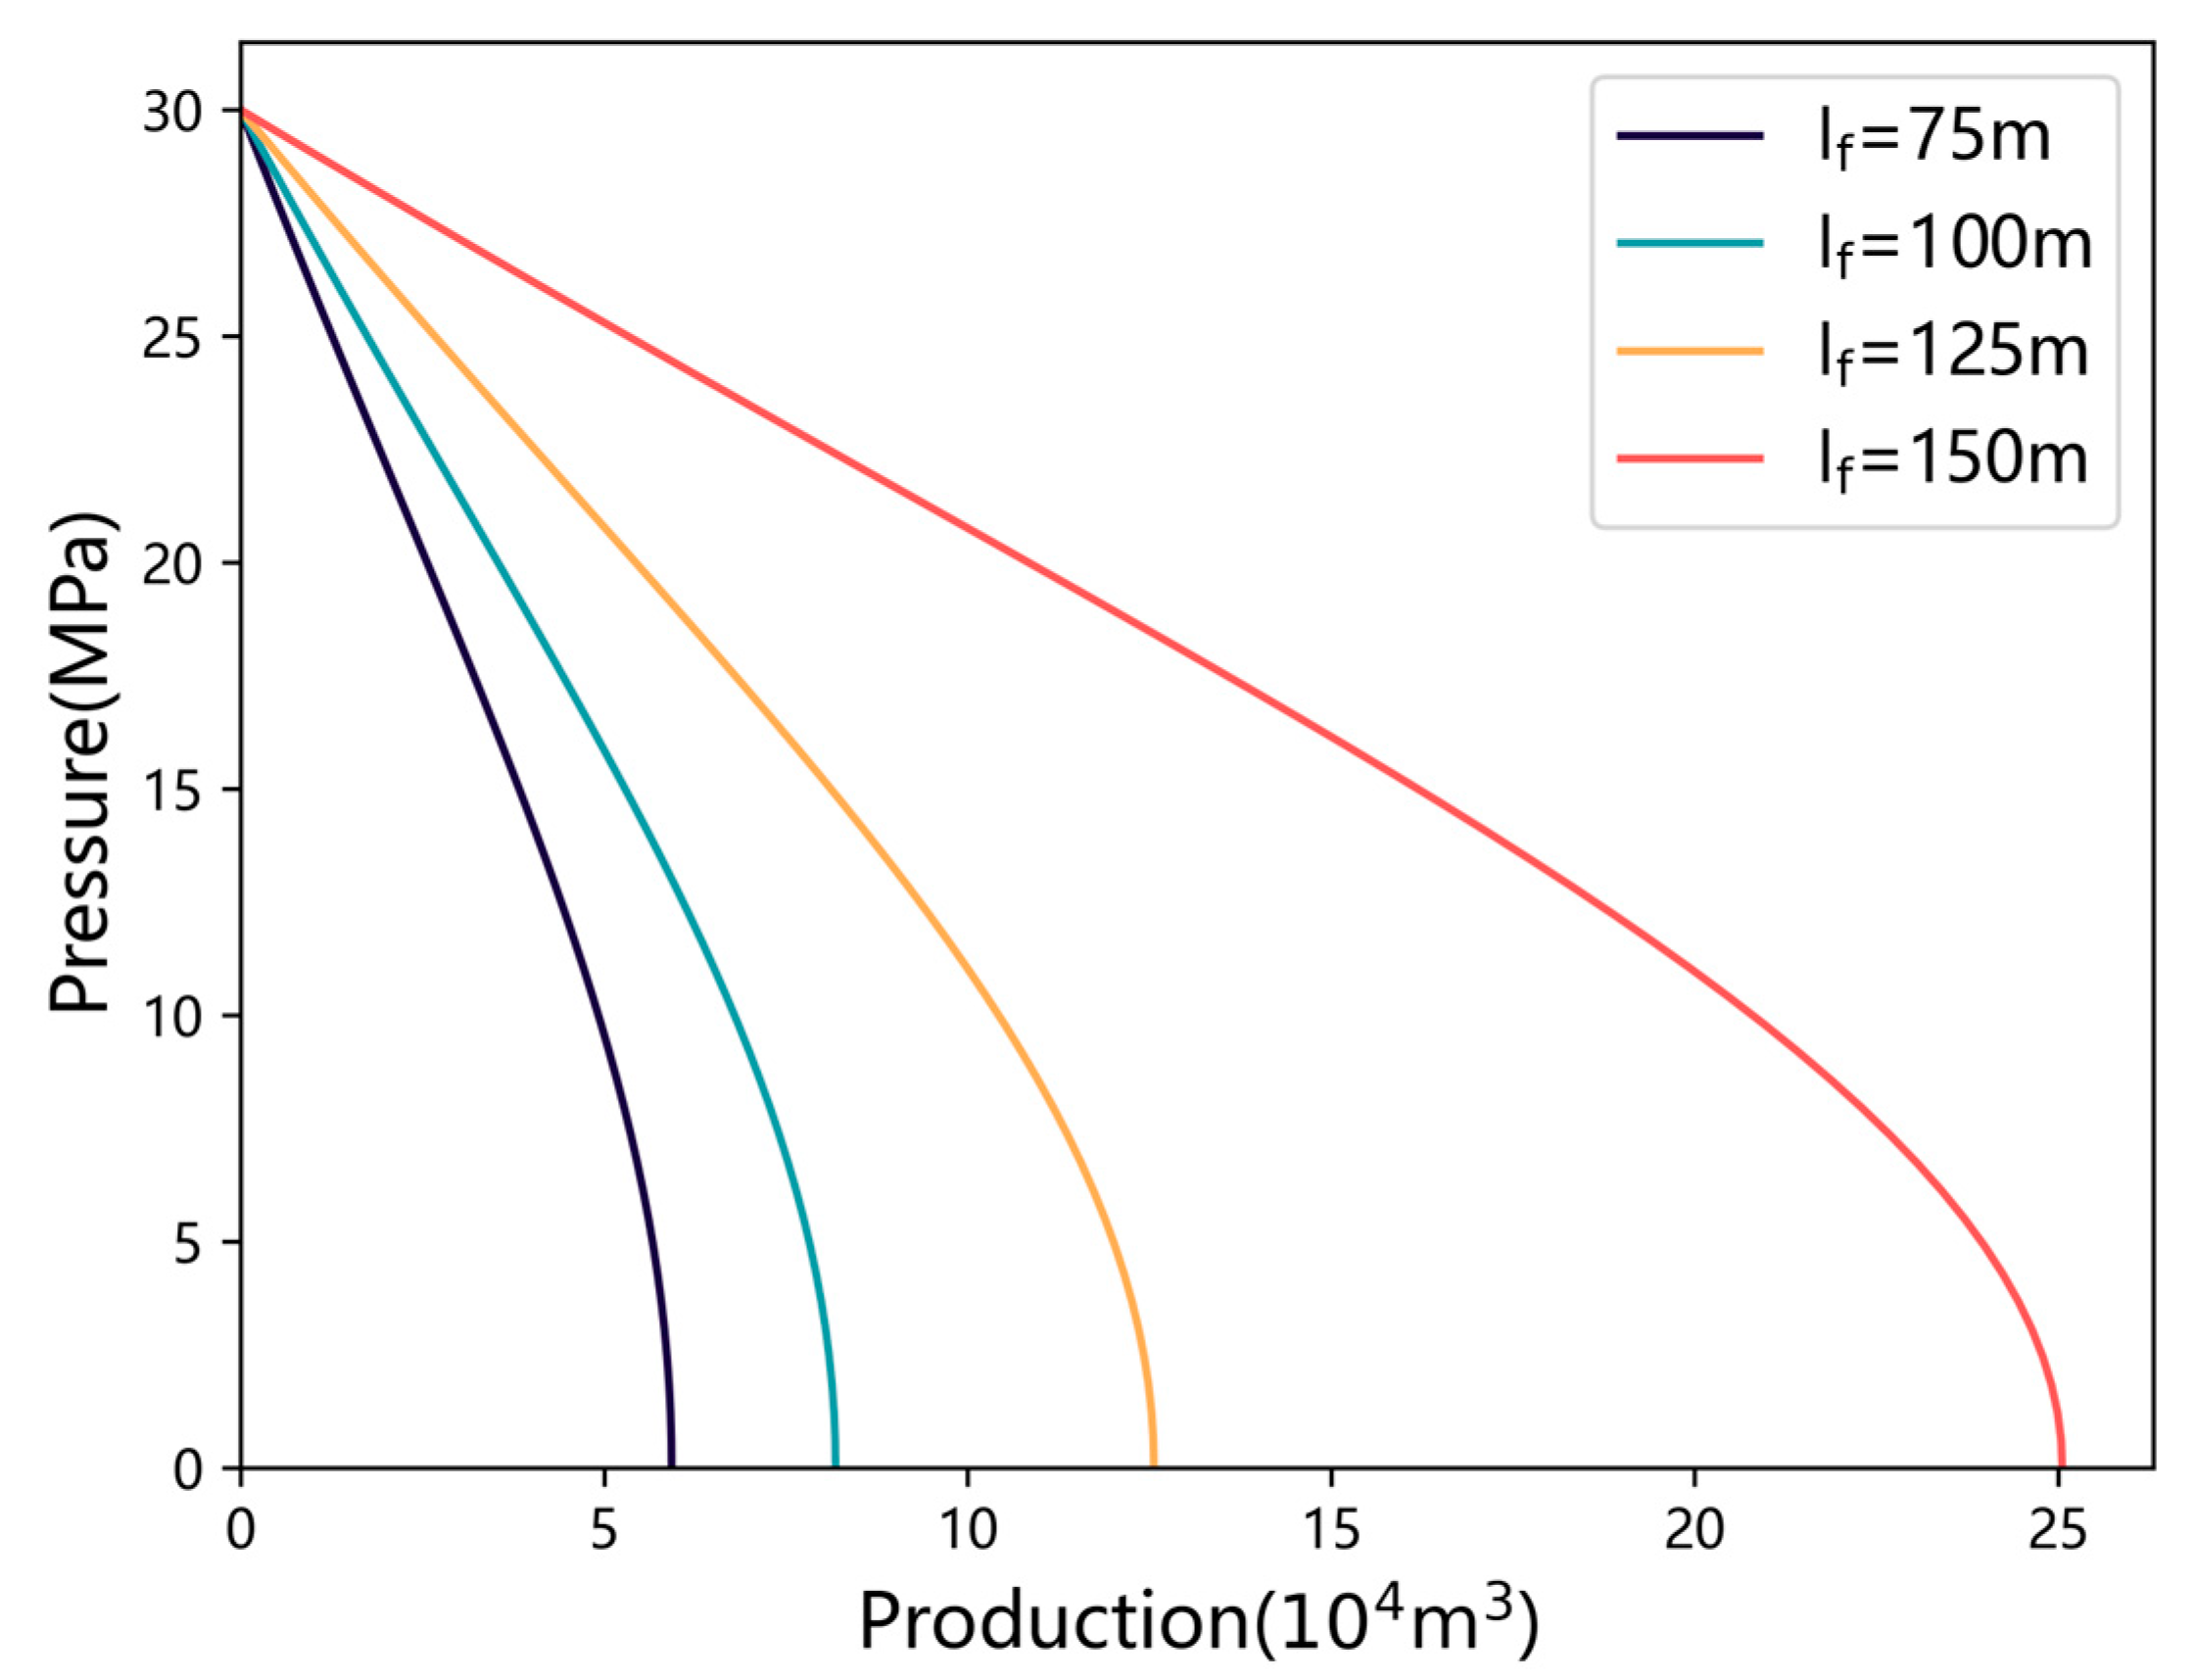
Fracture half-length refers to the length of a single-wing fracture extending from the wellbore to its endpoint. Increasing the fracture half-length can enlarge the contact area between the reservoir and the fracture, improving gas flow and thereby enhancing productivity. The extended fracture length results in a larger drainage area, which allows for greater gas flow into the wellbore. The relationship between bottomhole pressure and production capacity when the fracture half-length changes from 75 m to 150 m is shown in Figure 10. As the fracture half-length increases, productivity gradually increases. However, an excessively large fracture half-length may increase the risk of fracture closure or propagation problems, which could complicate the construction process and lead to diminishing returns. Therefore, an appropriate fracture half-length is typically selected during design to balance productivity and cost.
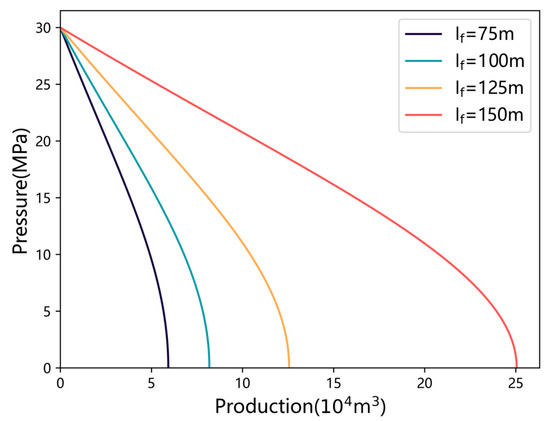
Figure 10.
Effect of fracture half-length on inflow performance of horizontal well.
3.2.5. Impact of Fracture Angle
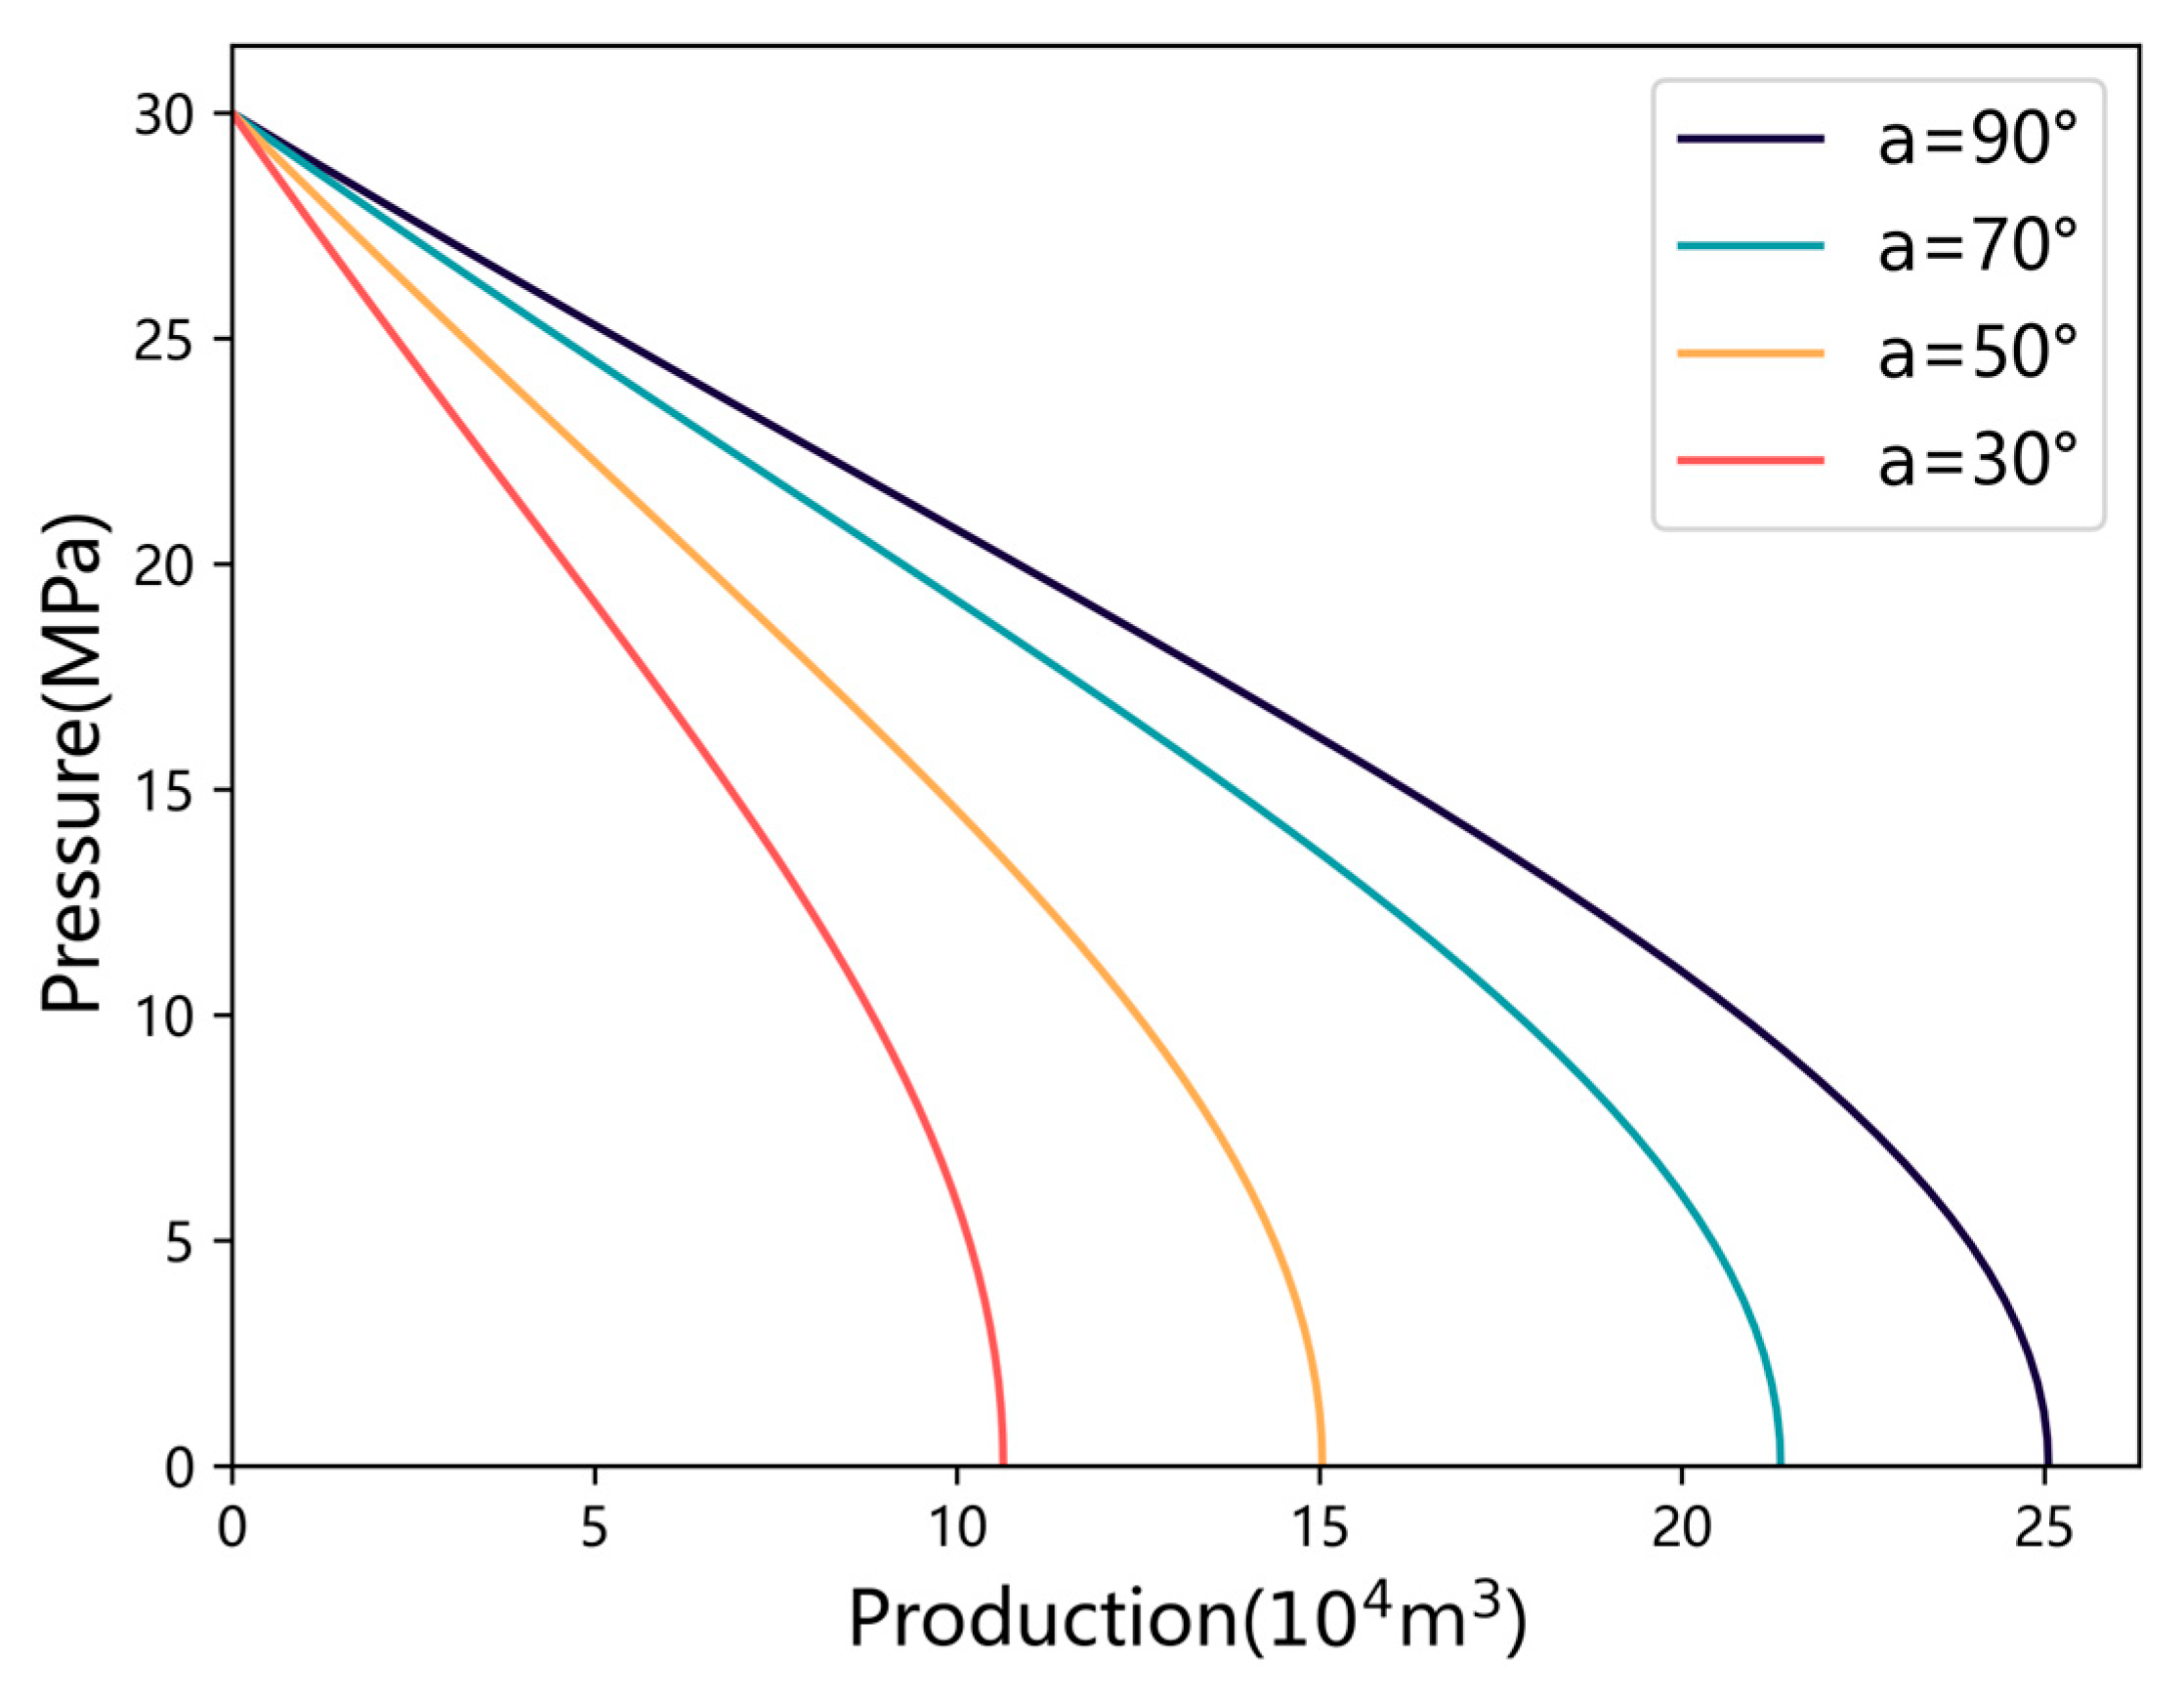
In practice, there may be a certain angle between the fracture and the horizontal wellbore, rather than being perfectly vertical. A larger fracture angle typically facilitates better connectivity to the reservoir, reduces flow resistance, and improves productivity. Conversely, a smaller angle increases the tortuosity of the flow path, thereby reducing flow efficiency. The ideal fracture angle is one that maximizes the connectivity to the gas reservoir while minimizing flow resistance. The relationship between bottomhole pressure and production capacity when the fracture angle changes from 30° to 90° is shown in Figure 11. An increase in the fracture angle generally leads to an increase in gas well productivity. Thus, it is essential to design the fractures to extend at an optimal angle relative to the wellbore to maximize production.
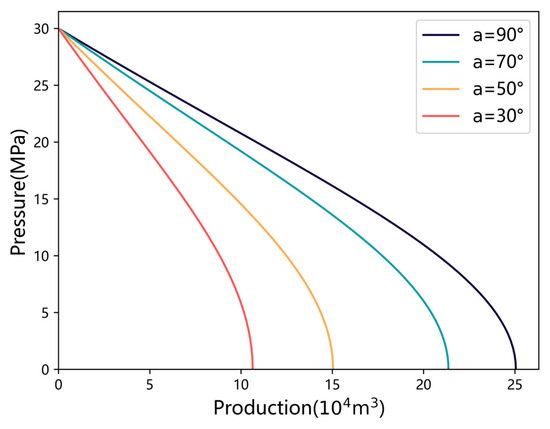
Figure 11.
Effect of fracture angle on inflow performance of horizontal well.
3.2.6. Impact of Skin Factor
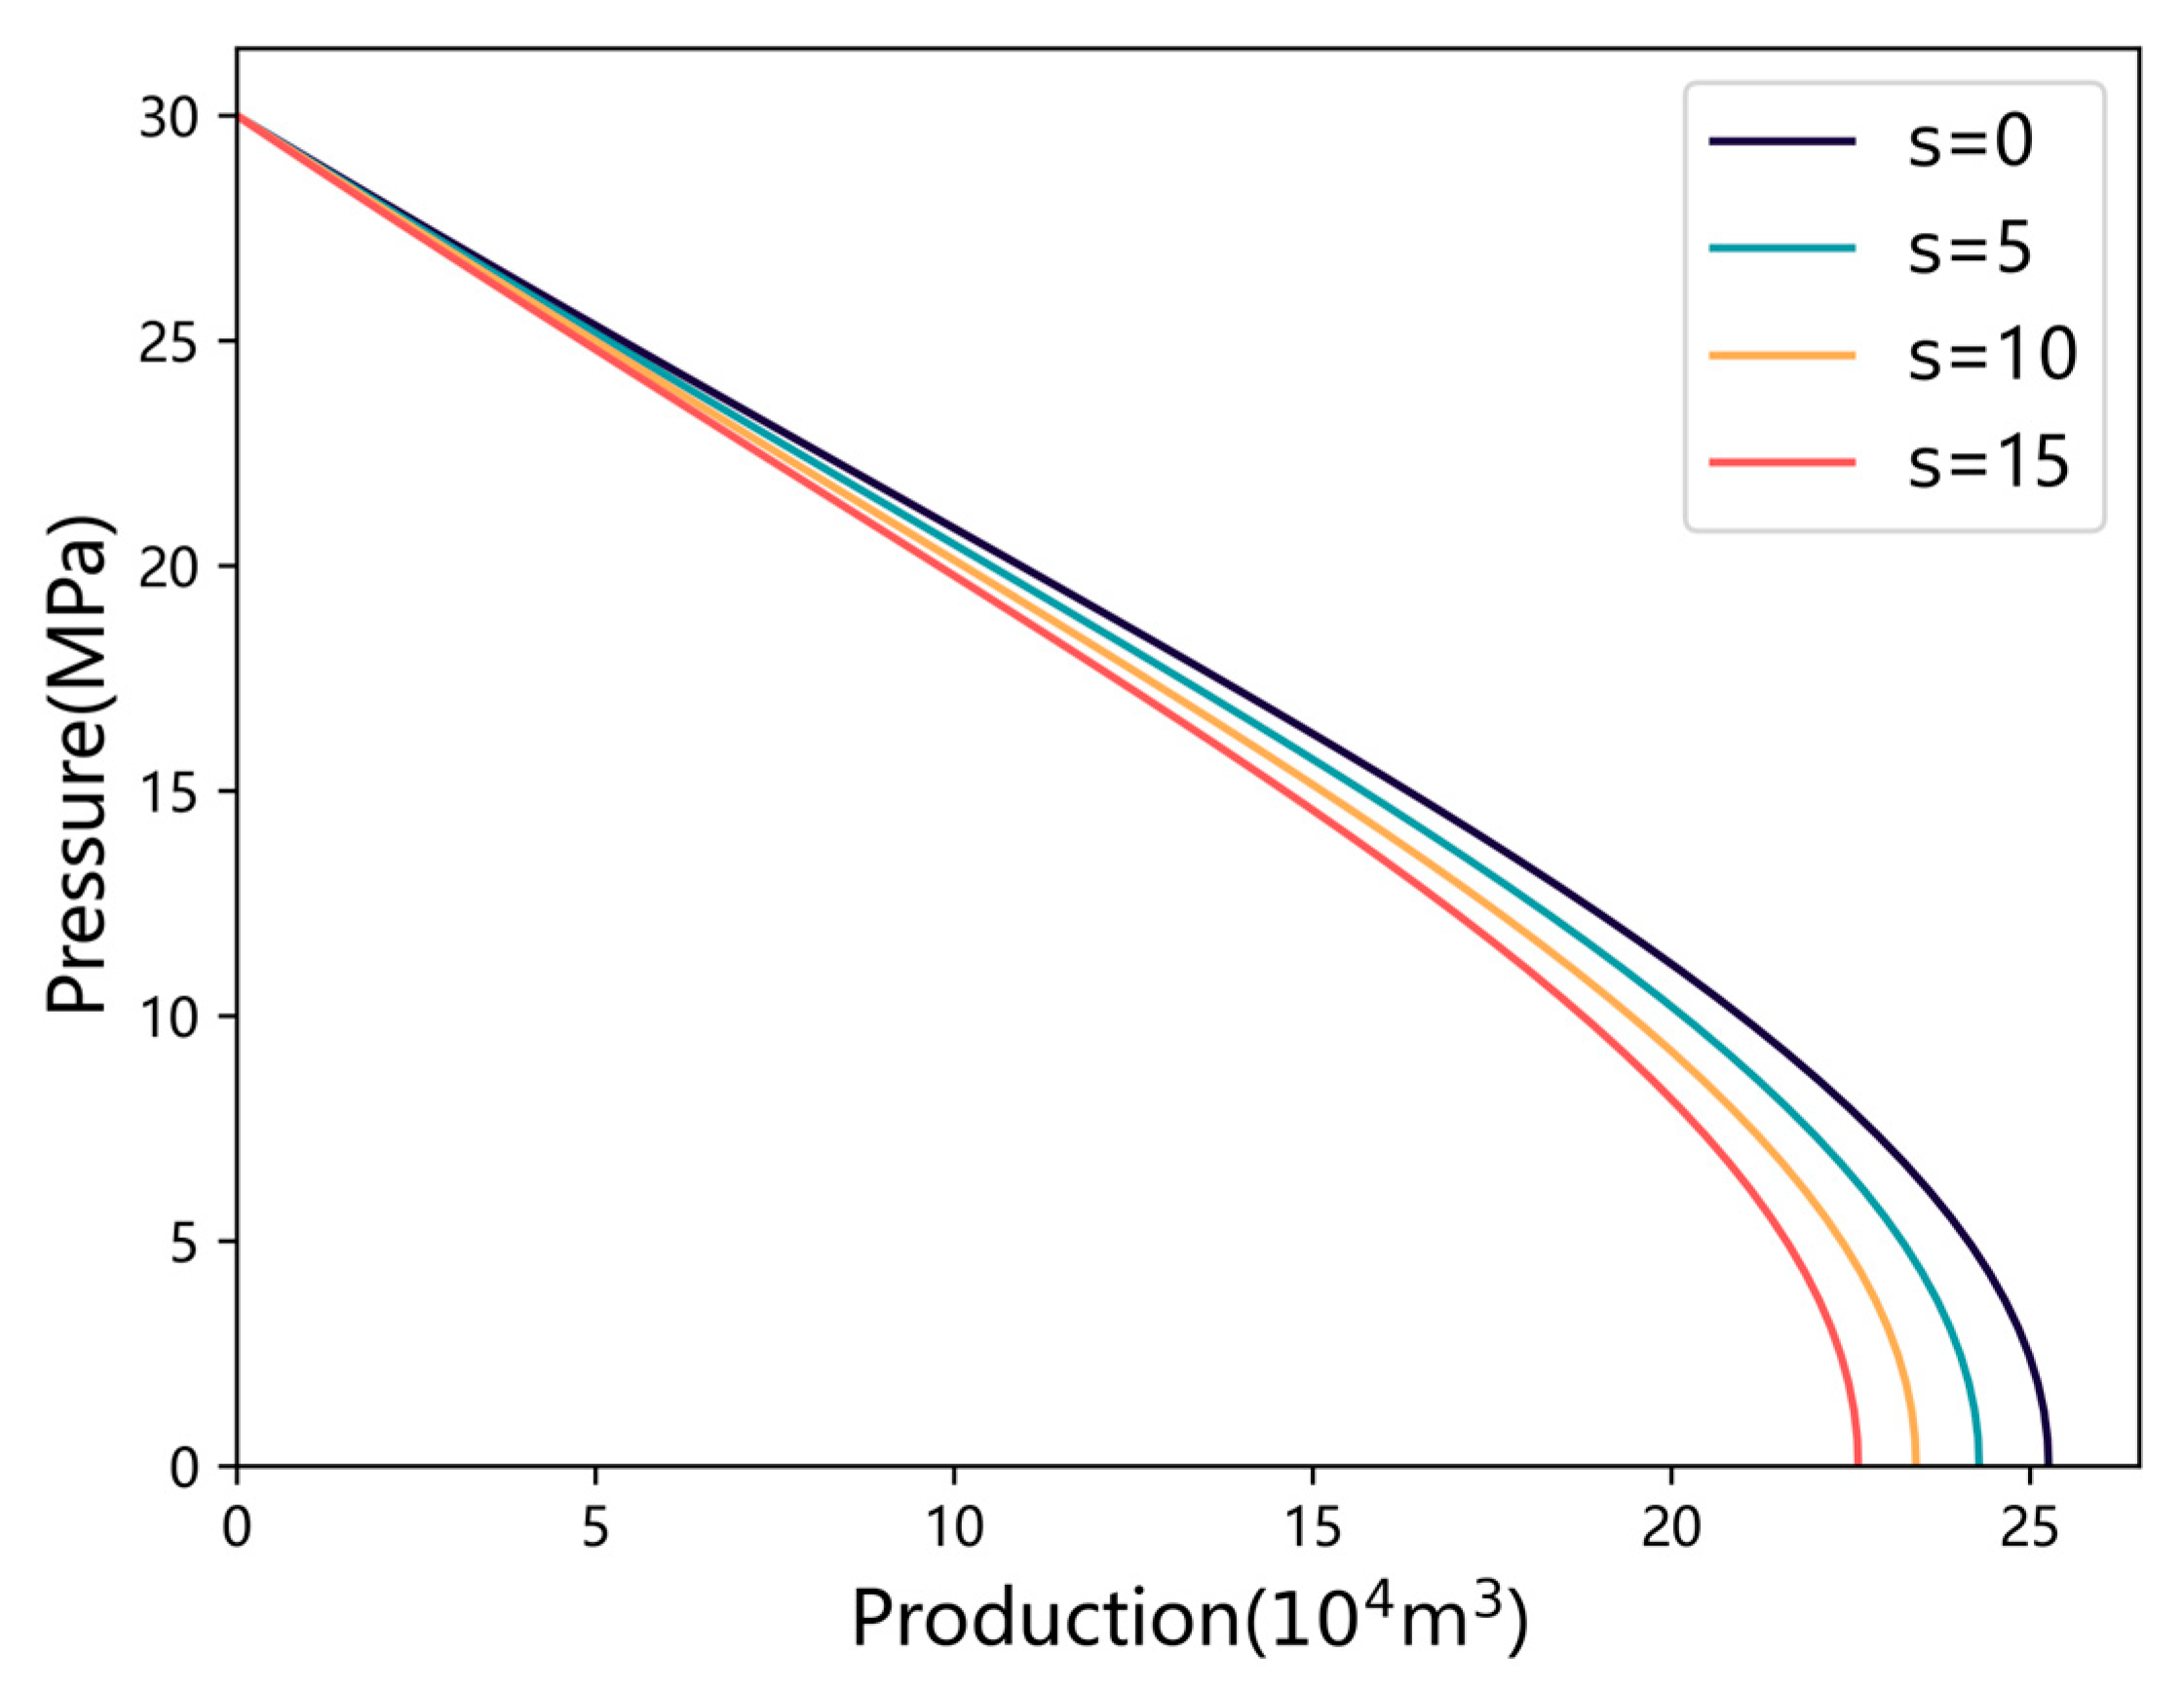
The skin factor represents the additional flow resistance near the wellbore. A higher skin factor indicates greater flow loss, while a negative skin factor suggests an increased production effect. The relationship between bottomhole pressure and production capacity when the skin factor changes from 0 to 15 is shown in Figure 12. As the skin factor increases, the flow resistance becomes higher, leading to a decrease in productivity. The skin factor typically represents near-wellbore damage or poor fracture quality, and its impact is more significant in low-permeability reservoirs. The small variation in productivity over the range of skin factor values could be attributed to the fact that the skin effect is more prominent in certain reservoir conditions, particularly when permeability is already low.
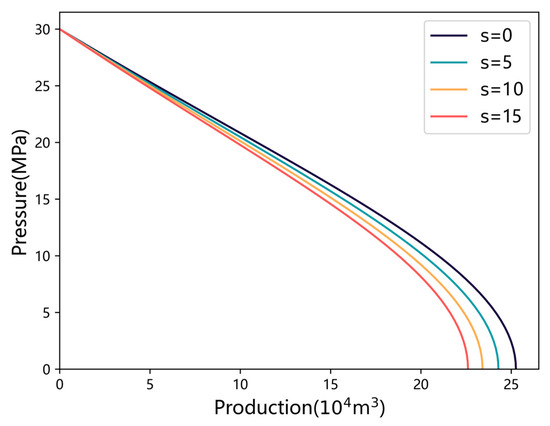
Figure 12.
Effect of skin factor on inflow performance of horizontal wells.
Through the analysis of the above parameters, it is evident that the productivity performance of gas–water two-phase flow in fractured reservoirs is influenced by multiple factors, which interact and constrain each other. A classification of the factors by their impact shows that formation pressure, fracture number, and fracture half-length have the greatest influence on productivity, while water saturation and skin factor have a more moderate effect. In practical applications, reasonably optimizing fracture design and production parameters, while balancing the impact of each factor on gas–water productivity, is key to improving the productivity of fractured horizontal wells.
4. Discussion
4.1. Interpretation of Results
The findings of this study highlight the importance of fracture interference and non-uniform fracture distribution in determining well productivity. Specifically, the higher production from the end fractures compared to the middle fractures supports the hypothesis that fractures interact with each other, and that optimizing fracture parameters, particularly at the wellbore ends, can significantly enhance production. This aligns with previous studies that suggested the importance of fracture design for maximizing well output. However, our model goes a step further by dynamically integrating the effects of gas–water co-production, making it more adaptable to changing reservoir conditions and providing a more realistic productivity prediction.
The sensitivity analysis underscores the importance of optimizing key parameters such as formation pressure, fracture number, fracture half-length, and fracture angle. As formation pressure increases, it provides a stronger driving force for gas flow. Conversely, higher water saturation and skin factors were found to reduce well productivity, which supports previous observations about the negative effects of excess water and flow resistance on gas extraction efficiency.
This work advances the current state of the knowledge by providing a comprehensive and efficient method for predicting gas–water two-phase productivity in fractured horizontal wells. Unlike traditional models that focus on single-phase flow or neglect the impact of fracture interference, this model offers more precise and actionable predictions that can improve extraction strategies and production efficiency. Therefore, it can be directly integrated into industry practices to enhance fracture design optimization and operational planning. For instance, the model’s ability to predict productivity under gas–water two-phase flow and account for fracture interference enables operators to optimize fracture parameters to maximize well performance. The sensitivity analysis provides actionable insights into the impact of key parameters on productivity. Additionally, the model’s flexibility in handling non-uniform fracture distributions and its potential for extension to multi-phase flow and transient conditions make it a valuable tool for reservoir management and production optimization in real-world scenarios.
4.2. Outlook
While the model offers substantial improvements compared to existing approaches, several areas that require further research are evident:
- Field data validation: Although the model is based on theoretical frameworks and simulated results, validating its predictions with field data is essential for assessing its practical applicability. Future studies should focus on comparing model outputs with real data to refine its accuracy.
- Extended multi-phase flow and multi-well interaction: This study primarily focuses on gas–water two-phase flow, but real-world shale reservoirs often exhibit more complex flow scenarios involving additional phases (oil, CO2) or multi-well interference. Future studies could extend the model to consider multi-phase flow and multi-well interactions.
- Dynamic fracture: The model currently assumes a static fracture network. However, fractures evolve over time due to reservoir pressure changes and stress redistribution. Future research could explore dynamic fracture growth models to simulate how fractures expand or close under production conditions, which would improve long-term productivity predictions.
- Transient flow conditions: The current model is based on steady-state flow assumptions, which may not fully capture the dynamic behavior of shale gas reservoirs under transient flow conditions. Extending the model to account for transient flow would require addressing computational challenges, such as the need for efficient numerical algorithms and high-performance computing resources to handle the increased complexity of time-dependent simulations [24]. Future work could focus on developing scalable solutions to integrate transient flow dynamics while maintaining computational efficiency.
In conclusion, while this study significantly advances the prediction of productivity in fractured horizontal wells, there are clear avenues for future refinement. Field validation, extending multi-phase flow, incorporating dynamic fracture, and addressing transient flow conditions are crucial next steps that could further enhance the model’s robustness and practical applications. These directions would contribute to the continued evolution of more accurate and efficient methods for optimizing shale gas production.
5. Conclusions
This study presents a novel fast prediction model for estimating the steady-state productivity of fractured horizontal wells in shale gas reservoirs under gas–water two-phase flow. By extending the single-phase fluid seepage theory, the model incorporates a gas–water two-phase pseudo-pressure function, accounting for fracture interference using potential theory and the superposition principle. Additionally, it integrates dynamic variations in formation pressure and water saturation, providing a more accurate prediction of productivity in fractured horizontal wells. The following key conclusions can be drawn:
- Dynamic prediction of reservoir pressure and water saturation: By applying the material balance equation and water saturation formula, the model predicts reservoir pressure and water saturation dynamically, based on cumulative gas production levels and water production. This approach offers a more realistic representation of reservoir behavior over time.
- Impact of fracture interference: The study demonstrates that end fractures tend to have higher production than middle fractures due to fracture interference. Optimizing fracture parameters, particularly at the ends, can lead to significant improvements in well productivity.
- Sensitivity analysis and parameter optimization: Sensitivity analysis reveals that increasing formation pressure, fracture number, fracture half-length, and fracture angle positively influences productivity. Conversely, higher water saturation and skin factors negatively affect well performance. These findings underline the importance of the rational optimization of fracture design and production strategies to maximize well output.
Author Contributions
Conceptualization, H.X.; methodology, S.H.; software, R.Z.; validation, M.C.; formal analysis, C.L.; investigation, Q.Z.; resources, M.C.; data curation, C.L.; writing—original draft preparation, S.H.; writing—review and editing, H.X.; visualization, R.Z.; supervision, M.C.; project administration, C.L. All authors have read and agreed to the published version of the manuscript.
Funding
This research was funded by a Key Program of National Natural Science Foundation of China, grant number 52234003 and by a Science and Technology Cooperation Project of the CNPC-SWPU Innovation Alliance, grant number 2020CX020202.
Data Availability Statement
Data are unavailable due to privacy or ethical restrictions.
Conflicts of Interest
Authors Hongsha Xiao, Man Chen, Changdi Liu and Qianwen Zhang were employed by Sichuan Changning Natural Gas Development Co., Ltd. The remaining authors declare that the research was conducted in the absence of any commercial or financial relationships that could be construed as a potential conflict of interest.
References
- Zou, C.N.; Zhao, Q.; Zhang, G.S.; Xiong, B. Energy revolution: From a fossil energy era to a new energy era. Nat. Gas Ind. B 2016, 36, 1–11. [Google Scholar] [CrossRef]
- Yang, Y.M.; Chen, Y.L.; Liu, S.Y.; Deng, B.; Xu, H.; Chen, L.Q.; Li, D.Y.; Yin, Y.Z.; Li, Y. Status, potential and prospect of shale gas exploration and development in the Sichuan Basin and its periphery. Nat. Gas Ind. 2021, 41, 42–58. [Google Scholar]
- Zhao, J.Z.; Ren, L.; Lin, C.; Lin, R.; Hu, D.; Wu, J.F.; Song, Y.; Shen, C.; Tang, D.J.; Jiang, H. A review of deep and ultra-deep shale gas fracturing in China: Status and directions. Renew. Sustain. Energy Rev. 2025, 209, 115111. [Google Scholar] [CrossRef]
- Manda, P.; Nkazi, D.B. The evaluation and sensitivity of decline curve modelling. Energies 2020, 13, 2765. [Google Scholar] [CrossRef]
- Niu, W.; Lu, J.L.; Sun, Y.P. An improved empirical model for rapid and accurate production prediction of shale gas wells. J. Pet. Sci. Eng. 2022, 208, 109800. [Google Scholar] [CrossRef]
- Karimi-Fard, M.; Durlofsky, L.J.; Aziz, K. An efficient discrete-fracture model applicable for general-purpose reservoir simulators. SPE J. 2004, 9, 227–236. [Google Scholar] [CrossRef]
- Huang, T.; Guo, X.; Chen, F.F. Modeling transient pressure behavior of a fractured well for shale gas reservoirs based on the properties of nanopores. J. Nat. Gas Sci. Eng. 2015, 23, 387–398. [Google Scholar] [CrossRef]
- Zhao, Y.L.; Huang, X.; Zhang, L.H.; Li, S.X.; Li, X.T.; Xu, H.Q. Numerical simulation of fractured horizontal wells in transitional shale gas reservoirs based on embedded discrete fracture model optimization. Nat. Gas Ind. 2023, 43, 116–126. [Google Scholar]
- He, Y.W.; He, Z.Y.; Tang, Y.; Qin, J.Z.; Song, J.J.; Wang, Y. Shale gas well production evaluation and prediction based on machine learning. Oil Drill. Prod. Technol. 2021, 43, 518–524. [Google Scholar]
- Han, S.; Che, M.G.; Su, W.; Xiao, Y.X.; Wu, Z.B.; Chen, J.Y.; Wang, L.B. Prediction method and application of single shale gas well production in Weiyuan block, Sichuan basin. Spec. Oil Gas Reserv. 2022, 29, 141–149. [Google Scholar]
- Chen, J.; Huang, H.Y.; Liu, J.C.; Zeng, B.; Yang, X.R. Production predicting technology of shale gas fracturing horizontal well in Changning area based on the GA-BP neural network model. Sci. Technol. Eng. 2020, 20, 1851–1858. [Google Scholar]
- Mohamed, F.R.; Otulana, D.; Salazar, I.A.; Han, X.; Li, F.; Dan, S.; Bennett, J.; Abubakar, K.; Barrie, K.; Yeager, B.; et al. Innovative modeling to quantify the impact of natural fractures, optimize well spacing and increase productivity in the marcellus shale. In Proceedings of the SPE Eastern Regional Meeting, Wheeling, WV, USA, 18 October 2022. [Google Scholar]
- Liu, A.; Liu, S.M.; Sang, G.J. Characterizing gas-water transport behavior in tight shale and its application on the well productivity. In Proceedings of the SPE Annual Technical Conference and Exhibition, Virtual, 19 October 2020. [Google Scholar]
- Zeng, J.; Liu, J.S.; Li, W.; Leong, Y.K.; Elsworth, D.; Guo, J.C. Shale shrinkage transition induced by the matrix-fracture equilibrium time lag: A neglected phenomenon in shale gas production. In Proceedings of the SPE/AAPG/SEG Asia Pacific Unconventional Resources Technology Conference, Virtual, 16–18 November 2021. [Google Scholar]
- Yang, Z.Z.; Chen, Q.; Li, X.G.; Feng, B.; Liu, Z.Y. A new method for calculating the productivity of the staged multi-bunch fractured horizontal well in tight gas reservoirs. Pet. Geol. Oilfield Dev. Daqing 2019, 38, 147–154. [Google Scholar]
- Hu, Z.J.; Li, S.X.; Wang, J.J.; Zhou, H.; Zhao, Y.L.; Zhang, L.H. Productivity evaluation of multi-stage fracturing horizontal wells in shale gas reservoir with complex artificial fracture occurrence. Pet. Reserv. Eval. Dev. 2023, 13, 459–466. [Google Scholar]
- Yuan, L.; Li, X.P.; Liu, J.J. Productivity calculation method of fractured horizontal wells with gas-water two-phase in low permeability gas reservoirs. Lithol. Reserv. 2016, 28, 88–94. [Google Scholar]
- He, J.X.; Jiang, R.X.; Mao, Y.; Yuan, L. Productivity calculation method for gas-water two phase fractured horizontal wells in tight gas reservoir. Lithol. Reserv. 2017, 29, 154–161. [Google Scholar]
- Xiong, W.; Zhu, Z.Q.; Gao, S.S.; Yang, F.R.; Hu, Z.M.; Liu, H.X. Material balance equation of water flooding gas reservoir considering trapped gas. Pet. Drill. Tech. 2012, 40, 93–97. [Google Scholar]
- Kong, X.Y. Advanced Mechanics of Fluid Flow, 2nd ed.; University of Science and Technology of China Press: Anhui, China, 1999; pp. 80–82. [Google Scholar]
- Yuan, L.; Li, X.P. The productivity study of gas-water two phase horizontal well in low-permeability gas reservoir. Nat. Gas Geosci. 2014, 25, 1455–1461. [Google Scholar]
- Zeng, F.H.; Guo, J.C.; Yin, J. An unsteady state computation model of fractured horizontal well coupling with reservoir. Geoscience 2011, 25, 1159–1166. [Google Scholar]
- Xu, Y.B. Research on basic theory of horizontal well hydraulic fracturing. Ph.D. Thesis, Southwest Petroleum Institute, Nanchong, China, 2004. [Google Scholar]
- Ahmadi, S.; Khormali, A. Development of an RSM-based predictive model for evaluation of corrosion efficiency of ATMP in one molar HCl for carbon steel samples. Pet. Sci. Technol. 2024, 42, 4537–4555. [Google Scholar] [CrossRef]


Disclaimer/Publisher’s Note: The statements, opinions and data contained in all publications are solely those of the individual author(s) and contributor(s) and not of MDPI and/or the editor(s). MDPI and/or the editor(s) disclaim responsibility for any injury to people or property resulting from any ideas, methods, instructions or products referred to in the content. |
© 2025 by the authors. Licensee MDPI, Basel, Switzerland. This article is an open access article distributed under the terms and conditions of the Creative Commons Attribution (CC BY) license (https://creativecommons.org/licenses/by/4.0/).