

Comprehensive Stability Analysis of Haloperidol: Insights from Advanced Chromatographic and Thermal Analysis

 , ,
, ,  , and
, and 
Abstract
1. Introduction
2. Materials and Methods
2.1. Instruments and Equipment
2.2. Materials
2.3. Methods
2.3.1. Chromatographic Conditions
2.3.2. Forced Degradation Studies
2.3.3. Analysis of Haloperidol via HPLC and Validation of the Method
2.3.4. Application of the Method to the Analysis of a Finished Product
2.3.5. Characterization of Degradation Products Using LC-MS/MS
2.3.6. Analysis of Haloperidol via TGA/DTG/DSC
3. Results and Discussion
3.1. Calibration Curve and Linearity
3.2. Chromatographic Conditions for Analysis
3.3. Forced Degradation Studies
3.4. Method Validation
3.5. Application of the Method to the Analysis of Haloperidol in a Finished Product (ISOPERIDOL) (2 mg/mL Solution)
3.6. Characterization of Degradation Products Using LC-MS/MS
3.6.1. Acidic Stress: HCl 1N
3.6.2. Basic Stress NaOH 1N
3.6.3. Photolytic Stress
3.7. Haloperidol Analysis via TGA/DTG/DSC
3.8. Comparative Analysis of the Stability of Haloperidol and the Analytical Methods
4. Discussions
Supplementary Materials
Author Contributions
Funding
Data Availability Statement
Acknowledgments
Conflicts of Interest
References
- Pushpakom, S.; Iorio, F.; Eyers, P.A.; Escott, K.J.; Hopper, S.; Wells, A.; Doig, A.; Guilliams, T.; Latimer, J.; McNamee, C. Drug Repurposing: Progress, Challenges and Recommendations. Nat. Rev. Drug Discov. 2019, 18, 41–58. [Google Scholar] [CrossRef]
- Grangeia, H.B.; Silva, C.; Simões, S.P.; Reis, M.S. Quality by Design in Pharmaceutical Manufacturing: A Systematic Review of Current Status, Challenges and Future Perspectives. Eur. J. Pharm. Biopharm. 2020, 147, 19–37. [Google Scholar] [CrossRef]
- Murugan, T.; Singh Jai, W. (Eds.) Cybersecurity and Data Science Innovations for Sustainable Development of HEICC: Healthcare, Education, Industry, Cities, and Communities; CRC Press: Boca Raton, FL, USA, 2025. [Google Scholar]
- Lang, J.; Li, L.; Quan, Y.; Tan, R.; Zhao, J.; Li, M.; Zeng, J.; Chen, S.; Wang, T.; Li, Y. LC-MS-Based Metabolomics Reveals the Mechanism of Anti-Gouty Arthritis Effect of Wuwei Shexiang Pill. Front. Pharmacol. 2023, 14, 1213602. [Google Scholar] [CrossRef]
- Kanjal, M.I.; Muneer, M.; Ullah, S.; Sabir, S.; Boudraa, R.; Amrane, A.; Mouni, L. UV Radiation-Induced Degradation of Moxifloxacin: Toxicity Evaluation and Conditions Optimization. Euro-Mediterr. J. Environ. Integr. 2025, 1–13. [Google Scholar] [CrossRef]
- Shi, S.; Li, K.; Peng, J.; Li, J.; Luo, L.; Liu, M.; Chen, Y.; Xiang, Z.; Xiong, P.; Liu, L. Chemical Characterization of Extracts of Leaves of Kadsua coccinea (Lem.) AC Sm. by UHPLC-Q-Exactive Orbitrap Mass Spectrometry and Assessment of Their Antioxidant and Anti-Inflammatory Activities. Biomed. Pharmacother. 2022, 149, 112828. [Google Scholar] [CrossRef]
- Guo, Y.; Han, Z.; Zhang, J.; Lu, Y.; Li, C.; Liu, G. Development of a High-Speed and Ultrasensitive UV/Vis-CM for Detecting Total Triterpenes in Traditional Chinese Medicine and Its Application. Heliyon 2024, 10, e32239. [Google Scholar] [CrossRef]
- Craig, D.; Reading, M. Thermal Analysis of Pharmaceuticals; CRC Press: Boca Raton, FL, USA, 2006. [Google Scholar]
- Ahuja, S.; Dong, M. Handbook of Pharmaceutical Analysis by HPLC; Elsevier: Amsterdam, The Netherlands, 2005; ISBN 0-08-045518-2. [Google Scholar]
- Missa, J.-N. Peut-on Parler de Militantisme Psychopharmacologique Chez Les Pionniers de La Psychiatrie Biologique (1952–1960)? Sud/Nord 2010, 25, 105–120. [Google Scholar] [CrossRef]
- Granger, B.; Albu, S. The Haloperidol Story. Ann. Clin. Psychiatry 2005, 17, 137–140. [Google Scholar] [CrossRef]
- Tardy, M.; Huhn, M.; Kissling, W.; Engel, R.R.; Leucht, S. Haloperidol versus Low-potency First-generation Antipsychotic Drugs for Schizophrenia. Cochrane Database Syst. Rev. 2014. [Google Scholar] [CrossRef]
- Xu, Q.A.; Madden, T.L. Analytical Methods for Therapeutic Drug Monitoring and Toxicology; John Wiley & Sons: New York, NY, USA, 2011; ISBN 0-470-92279-6. [Google Scholar]
- Européenne, P. EUROPÉENNE, Pharmacopée. 6ème Edition, Conseil d’Europe. 2008. Available online: https://www.decitre.fr/livres/pharmacopee-europeenne-supplement-6-6-9789287165084.html?srsltid=AfmBOorD91kigqt2-0ItuGvWfXxT1PTY38_EGPiUcMDgMoR5rd1a2ifx (accessed on 16 March 2025).
- Pharmacopeia, U. The United States Pharmacopeia, USP 41/The National Formulary; United States Pharmacopeial Convention: Rockville, MD, USA, 2018. [Google Scholar]
- Demoen, P.J. Properties and Analysis of Haloperidol and Its Dosage Forms. J. Pharm. Sci. 1961, 50, 350–353. [Google Scholar] [CrossRef]
- Djilali, K.; Maachi, R.; Mesbah, Z.A.; Nasrallah, N.; Touzout, N.; Tahraoui, H.; Zhang, J.; Amrane, A. Breaking Barriers in Pharmaceutical Analysis: Streamlined UV Spectrometric Quantification and Stability Profiling of Haloperidol and Methylparaben in Liquid Formulations. Anal. Biochem. 2024, 695, 115632. [Google Scholar] [CrossRef]
- Janicki, C.A.; Ko, C.Y. Haloperidol. In Analytical Profiles of Drug Substances; Elsevier: Amsterdam, The Netherlands, 1981; Volume 9, pp. 341–369. ISBN 0099-5428. [Google Scholar]
- Pharmacopoeia, B.H. The British Pharmacopoeia Commission Secretariat of the Medicines and Healthcare Products Regulatory Agency (MHRA); TSO (The Stationery Office): Edinburgh, UK, 2019. [Google Scholar]
- Boudraa, R.; Talantikite-Touati, D.; Souici, A.; Djermoune, A.; Saidani, A.; Fendi, K.; Amrane, A.; Bollinger, J.-C.; Tran, H.N.; Mouni, L. Breaking New Grounds: Solid-State Synthesis of TiO2–La2O3–CuO Nanocomposites for Degrading Brilliant Green Dye under Visible Light. J. Clean. Prod. 2024, 481, 144126. [Google Scholar] [CrossRef]
- Ouanes, S.; Kallel, M.; Trabelsi, H.; Safta, F.; Bouzouita, K. Zero-Crossing Derivative Spectrophotometry for the Determination of Haloperidol in Presence of Parabens. J. Pharm. Biomed. Anal. 1998, 17, 361–364. [Google Scholar] [CrossRef]
- Rahman, N.; Khatoon, A.; Rahman, H. Studies on the Development of Spectrophotometric Method for the Determination of Haloperidol in Pharmaceutical Preparations. Quím. Nova 2012, 35, 392–397. [Google Scholar] [CrossRef]
- Yasir, M.; Sara, U. Development and Validation of UV Spectrophotometric Method for the Estimation of Haloperidol. Br. J. Pharm. Res. 2014, 4, 1407–1415. [Google Scholar] [CrossRef]
- Sambamurty Raju, S.; Raju, P.; Ashok Babu, R.; Anjani Devi, A. Validated UV and Visible Spectrophotometric Methods for the Quantification of Haloperidol in Pharmaceutical Dosage Forms. Actapharmica 2015, 2, 107–111. [Google Scholar]
- Mennickent, S.; Pino, L.; Vega, M.; Godoy, C.G.; de Diego, M. Quantitative Determination of Haloperidol in Tablets by High Performance Thin-layer Chromatography. J. Sep. Sci. 2007, 30, 772–777. [Google Scholar] [CrossRef]
- Mennickent, S.; Pino, L.; Vega, M.; de Diego, M. Chemical Stability of Haloperidol Injection by High Performance Thin-layer Chromatography. J. Sep. Sci. 2008, 31, 201–206. [Google Scholar] [CrossRef]
- Rahman, N.; Sameen, S.; Kashif, M. Spectroscopic Study on the Interaction of Haloperidol and 2,4-Dinitrophenylhydrazine and Its Application for the Quantification in Drug Formulations. Anal. Chem. Lett. 2016, 6, 874–885. [Google Scholar] [CrossRef]
- Wate, S.; Borkar, A. Simultaneous Spectrophotometric Estimation of Haloperidol and Trihexyphenidyl in Tablets. Indian J. Pharm. Sci. 2010, 72, 265. [Google Scholar]
- Saidani, A.; Boudraa, R.; Fendi, K.; Benouadah, L.; Benabbas, A.; Djermoune, A.; Salvestrini, S.; Bollinger, J.-C.; Alayyaf, A.A.; Mouni, L. Effect of Calcination Temperature on the Photocatalytic Activity of Precipitated ZnO Nanoparticles for the Degradation of Rhodamine B Under Different Light Sources. Water 2024, 17, 32. [Google Scholar] [CrossRef]
- Zhuang, Q.; Li, X.; Lian, X.; Hu, H.; Wang, N.; Wu, J.; Miao, K.; Feng, G.; Luo, X. Catalysis Enhancement of Co3O4 through the Epitaxial Growth of Inert ZnO in Peroxymonosulfate Activation: The Catalytic Mechanism of Surface Hydroxyls in Singlet Oxygen Generation. Cryst. Growth Des. 2024, 25, 319–329. [Google Scholar] [CrossRef]
- Djilali, K.; Maachi, R.; Danish, M.; Lekmine, S.; Hadjadj, M.; Ait Mesbah, Z.; Benslama, O.; Tahraoui, H.; Ola, M.S.; Ali, A. A Novel Mobile Phase for Green Chromatographic Determination of Haloperidol: Application to Commercial Pharmaceutical Products and Forced Degradation Studies. Processes 2025, 13, 260. [Google Scholar] [CrossRef]
- Panaggio, A.; Greene, D. High Pressure Liquid Chromatographic Determination of Haloperidol Stability. Drug Dev. Ind. Pharm. 1983, 9, 485–492. [Google Scholar] [CrossRef]
- Boudraa, R.; Talantikite-Touati, D.; Djermoune, A.; Souici, A.; Kebir, M.; Merzeg, F.A.; Amrane, A.; Bollinger, J.-C.; Mouni, L. Comprehensive Characterization and Unprecedented Photocatalytic Efficacy of TiO2-CuO-La2O3 and TiO2-CuO-Bi2O3 Nanocomposites: A Novel Approach to Environmental Remediation. Mater. Sci. Eng. B 2025, 312, 117863. [Google Scholar] [CrossRef]
- Öl¸er, M.; Hakyemez, G. Investigations of Some Physicochemical Properties of Haloperidol Which May Affect Its Activity. J. Clin. Pharm. Ther. 1988, 13, 341–349. [Google Scholar] [CrossRef]
- Trabelsi, H.; Bouabdallah, S.; Bouzouita, K.; Safta, F. Determination and Degradation Study of Haloperidol by High Performance Liquid Chromatography. J. Pharm. Biomed. Anal. 2002, 29, 649–657. [Google Scholar] [CrossRef]
- Monser, L.; Trabelsi, H. A Rapid LC Method for the Determination of Haloperidol and Its Degradation Products in Pharmaceuticals Using a Porous Graphitic Carbon Column. J. Liq. Chromatogr. Relat. Technol. 2003, 26, 261–271. [Google Scholar] [CrossRef]
- Kumar, R.S.; Nalini, C. Analytical Determinations of Haloperidol and Its Combinations in Pharmaceutical Dosage Forms and Biological Matrices. J. Liq. Chromatogr. Relat. Technol. 2021, 44, 33–51. [Google Scholar] [CrossRef]
- Pawar, A.; Pandita, N. Statistically Designed, Targeted Profile UPLC Method Development for Assay and Purity of Haloperidol in Haloperidol Drug Substance and Haloperidol 1 Mg Tablets. Chromatographia 2020, 83, 725–737. [Google Scholar] [CrossRef]
- Guideline, I.H.T. Impurities in new drug substances Q3A (R2). Proceedings of the International Conference on Harmonization of Technical Requirements for Registration of Pharmaceuticals for Human Use, Geneva, Switzerland. 2006, Volume 25. Available online: https://database.ich.org/sites/default/files/Q3A%28R2%29%20Guideline.pdf (accessed on 16 March 2025).
- Sesharamsingh, B.; Kumar, J.S.; Viswanath, I.K.; Rao, G.S.; Anna, V.R. Development of Stability-Indicating HPLC Method for Quantification of Pharmacopeia Impurities of Zuclopenthixol and Characterization of Its Stress Degradation Products by LCMS/MS. Future J. Pharm. Sci. 2023, 9, 101. [Google Scholar] [CrossRef]
- Narayanam, M.; Handa, T.; Sharma, P.; Jhajra, S.; Muthe, P.K.; Dappili, P.K.; Shah, R.P.; Singh, S. Critical Practical Aspects in the Application of Liquid Chromatography–Mass Spectrometric Studies for the Characterization of Impurities and Degradation Products. J. Pharm. Biomed. Anal. 2014, 87, 191–217. [Google Scholar] [CrossRef]
- Baertschi, S.W.; Alsante, K.M.; Reed, R.A. Pharmaceutical Stress Testing: Predicting Drug Degradation; CRC Press: Boca Raton, FL, USA, 2016; ISBN 1-4398-0180-0. [Google Scholar]
- Guideline, I. Stability Testing of New Drug Substances and Products. Q1A R2 Curr. Step. 2003, 4, 1–24. [Google Scholar]
- Guideline, I.H.T. Validation of Analytical Procedures: Text and Methodology. Q2 R1 2005, 1, 5. [Google Scholar]
- Vaidya, S.J.; Sanghai, D.B. Forced Degradation Study on Valbenazine and Application of Validated Stability-Indicating HPLC Method. J. Reatt. Ther. Dev. Divers. 2023, 6, 1743–1752. [Google Scholar]
- Alladio, E.; Amante, E.; Bozzolino, C.; Seganti, F.; Salomone, A.; Vincenti, M.; Desharnais, B. Effective Validation of Chromatographic Analytical Methods: The Illustrative Case of Androgenic Steroids. Talanta 2020, 215, 120867. [Google Scholar] [CrossRef]
- Gadhavi, R.; Patel, J. Development and Validation of Stability Indicating Assay Method of Haloperidol in Oral Solution. JPSBR 2014, 4, 319–329. [Google Scholar]
- Jain, A.K.; Dubey, B.; Khare, S.; Joshi, A.; Ahirwar, M.; Jain, P. Comparison of RP-HPLC and UV Spectrophotometric Methods for Estimation of Haloperidol in Pure and Pharmaceutical Formulation. J. Drug Deliv. Ther. 2018, 8, 277–282. [Google Scholar] [CrossRef]
- Petkovska, R.; Dimitrovska, A. Use of Chemometrics for Development and Validation of an RP-HPLC Method for Simultaneous Determination of Haloperidol and Related Compounds. Acta Pharm. 2008, 58, 243–256. [Google Scholar] [CrossRef]
- Erukulla, K.K.; Renjitham, S.S. Bio-Analytical Method Development and Validation for Estimation of Zaltoprofen in Human Plasma by Reverse Phase-HPLC Method. Curr. Pharm. Anal. 2021, 17, 774–781. [Google Scholar] [CrossRef]
- Babu, S.K.; Rao, M.V.; Babu, S.P.; Chakka, M. Chemometric Assisted Development and Validation of a Stability-Indicating Lc Method for Determination of Related Substances in Haloperidol Decanoate Injection. Indian J. Pharm. Educ. Res. 2021, 55, 904–915. [Google Scholar] [CrossRef]
- Djilali, K.; Maachi, R.; Tahraoui, H.; Mesbah, Z.A.; Amrane, A. Advancing Thermal Stability Analysis of Haloperidol: Integrative Approaches and Optimization Strategies for Enhanced Pharmaceutical Formulations. J. Mol. Struct. 2024, 1315, 138870. [Google Scholar] [CrossRef]
- Fernandes, F.; Dias-Teixeira, M.; Delerue-Matos, C.; Grosso, C. Critical Review of Lipid-Based Nanoparticles as Carriers of Neuroprotective Drugs and Extracts. Nanomaterials 2021, 11, 563. [Google Scholar] [CrossRef]
- Alam, P.; Shakeel, F.; Alshehri, S.; Alhaiti, A.; Alqarni, M.H.; Foudah, A.I.; Aljarba, T.M. Analysis of the Greenness to Determine Risperidone in Commercial Products Using a Green Stability-Indicating HPTLC Method. Arab. J. Chem. 2024, 17, 105693. [Google Scholar] [CrossRef]
- Soradech, S.; Kengkwasingh, P.; Williams, A.C.; Khutoryanskiy, V.V. Synthesis and Evaluation of Poly (3-Hydroxypropyl Ethylene-Imine) and Its Blends with Chitosan Forming Novel Elastic Films for Delivery of Haloperidol. Pharmaceutics 2022, 14, 2671. [Google Scholar] [CrossRef]
- Alhamhoom, Y.; Kumaraswamy, T.; Kumar, A.; Nanjappa, S.H.; Prakash, S.S.; Rahamathulla, M.; Thajudeen, K.Y.; Ahmed, M.M.; Shivanandappa, T.B. Formulation and Evaluation of pH-Modulated Amorphous Solid Dispersion-Based Orodispersible Tablets of Cefdinir. Pharmaceutics 2024, 16, 866. [Google Scholar] [CrossRef]
- Goud, E.S.; Reddy, V.K.; Krishnadevaraya, S. Development and validation of a reverse-phase liquid chromatographic method for assay and related substances of haloperidol for 50 mg/mL and 100 mg/mL. Int. J. Pharm. Sci. 2013, 5, 389–396. [Google Scholar]
- Xu, X.; Stewart, J. HPLC analysis of haloperidol and its related compound in the drug substance and a tablet dosage form using a non-porous silica octadecylsilane column. J. Liq. Chromatogr. Relat. Technol. 1999, 22, 1857–1866. [Google Scholar] [CrossRef]
- Ali, I.; Aboul-Enein, H.Y. Fast Determination of Haloperidol in Pharmaceutical Preparations Using HPLC with a Monolithic Silica Column. J. Liq. Chromatogr. Relat. Technol. 2005, 28, 3169–3179. [Google Scholar] [CrossRef]
- Driouich, R.; Trabelsi, H.; Bouzouita, K.A. Stability—Indicating assay for haloperidol syrup by high-performance liquid chromatography. Chromatographia 2001, 53, 629–634. [Google Scholar] [CrossRef]
- Raggi, M.; Casamenti, G.; Mandrioli, R.; Sabbioni, C.; Volterra, V. A rapid LC method for the identification and determination of CNS drugs in pharmaceutical formulations. J. Pharm. Biomed. Anal. 2000, 23, 161–167. [Google Scholar] [CrossRef] [PubMed]


| Forced Degradation Conditions | Percentage Degradation (%) | Degraded Concentration (µg/mL) |
|---|---|---|
| 0.1 N HCl, 60 °C 7 days | 16 | 3.2 |
| 1.0 N HCl, 60 °C, 7 days | 25 | 5 |
| 0.1 N NaOH, 60 °C, 7 days | 16 | 3.2 |
| 1.0 N NaOH, 60 °C, 7 days | 17 | 3.4 |
| H2O2 0.3%, 25 °C, 7 days | 0.00 | 0.00 |
| H2O2 0.3%, 60 °C, 7 days | 0.00 | 0.00 |
| H2O2 3.0%, 25 °C, 7 days | 0.00 | 0.00 |
| H2O2 3.0%, 60 °C, 7 days | 0.00 | 0.00 |
| Haloperidol powder, 60 °C, 15 days | 0.00 | 0.00 |
| Haloperidol powder, 80 °C, 15 days | 0.00 | 0.00 |
| Haloperidol solution, 60 °C, 15 days | 10.00 | 2.00 |
| Haloperidol solution, 80 °C, 15 days | 17.00 | 3.40 |
| Haloperidol powder, UV light, 48 h | 0.00 | 0.00 |
| Haloperidol solution, UV light, 48 h | 13 | 2.6 |
| Name | Molecular Formula | Structural Form and Chemical Name | Molecular Weight (g/mol) |
|---|---|---|---|
| Haloperidol | C21H23ClFNO2 | 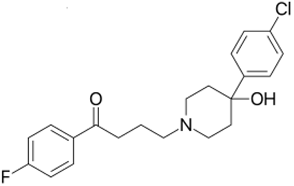 | 376 |
| Degradation Product I | C21H25Cl2FNO2 | 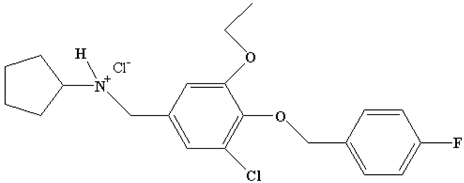 | 411.5 |
| Degradation Product II | C26H32ClFN2O3 |  | 476 |
| Degradation Product III | C26H33Cl2FN2O3 |  | 511.5 |
| Degradation Product IV | C21H23Cl FNO3 | 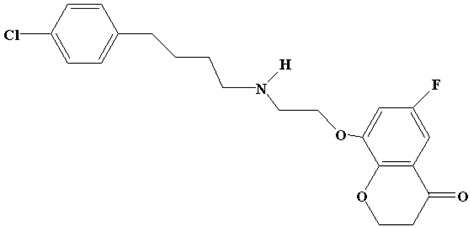 | 392 |
| Methodology Used | Stationary Phase | Mobile Phase | λ (nm) | Retention Time (min) | LOD | LOQ | Pharmaceutical Form | Strengths | Limitations | Reference |
|---|---|---|---|---|---|---|---|---|---|---|
| HPLC, UV-Vis, spectrofluorimetry | Various columns | Various solvents | Variable | Variable | Variable | Variable | Solid and liquid forms | Covers multiple analytical techniques | Limited stability studies | [37] |
| HPLC | C18 (250 × 4.6 mm, 5 µm) | Methanol/tetrabutyl ammonium sulfate (55:45) | 254 nm | 7 | 0.90 µg/mL | 2.75 µg/mL | Oral solution | Good sensitivity | Longer retention time | [47] |
| HPLC | ODS-A (150 × 4.6 mm, 3 µm) | TBA sulfate/acetonitrile/isopropanol (gradient) | 230 nm | 37.9 | 0.137 µg/mL | 0.458 µg/mL | Injection | Highly sensitive | Very long analysis time | [57] |
| HPLC | ODS (33 × 4.6 mm, 1.5 µm) | Phosphate buffer/TEA/acetonitrile (77:23:10) | 220 nm | 1.3 | 1 ng/mL | --- | Tablet | Ultra-fast, high sensitivity | LOQ has not been determined | [58] |
| HPLC | RP-18 (25 cm × 4.6 mm) | Phosphate buffer/acetonitrile/tetrahydrofuran/TEA (63:34:3:0.1) | 246 nm | 9.3 | 15 ng/mL | 50 ng/mL | Tablet | High accuracy | Longer analysis time | [35] |
| HPLC | C18 (250 × 4.6 mm, 5 µm) | Methanol/acetonitrile (50:50) | 244 nm | 2.23 | 0.40 µg/mL | 1.20 µg/mL | Tablet | Good sensitivity | Stability not studied | [48] |
| HPLC | Monolithic silica (100 × 4.6 mm) | Phosphate buffer/acetonitrile (70:30) | 230 nm | 4.26 | 1 ng/mL | 3 ng/mL | Injection | Very sensitive | High column cost | [59] |
| HPLC | Carbon (100 × 4.6 mm, 7 µm) | Tetrahydrofuran/water/trichloroacetic acid (55:45) | 254 nm | 4.25 | 0.1 µg/mL | --- | Tablet | Good separation | LOQ has not been determined | [36] |
| HPLC | XDB C18 (50 × 4.6 mm, 1.8 µm) | Organic phase/phosphate buffer/acetonitrile (gradient) | 230 nm | 3.77 | 1.16 µg/mL | 3.86 µg/mL | --- | Good sensitivity | More complex method | [49] |
| HPLC | CN (30 cm × 3.9 mm) | Tetrahydrofuran/water/phosphoric acid (40:60) | 254 nm | 5.4 | --- | --- | --- | Standard method | LOD and LOQ not specified | [32] |
| HPLC | C18 (250 × 4.6 mm, 5 µm) | Methanol/phosphate buffer/TEA (50:50:0.2) | 254 nm | --- | --- | --- | Solution | Good accuracy | Incomplete information | [60] |
| HPLC | C8 (150 × 4.6 mm, 5 µm) | Acetonitrile/tetramethylammonium perchlorate (pH 2.8) | 230 nm | 6.4 | --- | --- | Solution | Good separation | LOD and LOQ not specified | [61] |
| HPLC (green chromatography) | C18 (250 × 4.6 mm, 5 µm) | Methanol/phosphate buffer (pH 9.8) (90:10) | 248 nm | <4 | 0.40 µg/mL | 1.20 µg/mL | Solution and powder | Eco-friendly, validated fast method | Lacks impurity characterization | [31] |
| HPLC, LC-MS/MS, TGA/DSC/DTA | C18 (250 × 4.6 mm, 5 µm) | Methanol/phosphate buffer (pH 9.8) (90:10) | 248 nm | 4.2 | 1 ng/mL | 3 ng/mL | All forms | Comprehensive stability study | Needs large-scale validation | In this study |
| HPLC, LC-MS/MS, TGA/DSC/DTA | C18 (250 × 4.6 mm, 5 µm) | Methanol/phosphate buffer (pH 9.8) (90:10) | 248 nm | 4.2 | 1 ng/mL | 3 ng/mL | All forms | Comprehensive stability study | Needs large-scale validation | In this study |
Disclaimer/Publisher’s Note: The statements, opinions and data contained in all publications are solely those of the individual author(s) and contributor(s) and not of MDPI and/or the editor(s). MDPI and/or the editor(s) disclaim responsibility for any injury to people or property resulting from any ideas, methods, instructions or products referred to in the content. |
© 2025 by the authors. Licensee MDPI, Basel, Switzerland. This article is an open access article distributed under the terms and conditions of the Creative Commons Attribution (CC BY) license (https://creativecommons.org/licenses/by/4.0/).
Share and Cite
Djilali, K.; Maachi, R.; Boutoumi, H.; Lekmine, S.; Ait Mesbah, Z.; Attia, S.M.; Nasrallah, N.; Bouallouche, R.; Zhang, J.; Tahraoui, H.; et al. Comprehensive Stability Analysis of Haloperidol: Insights from Advanced Chromatographic and Thermal Analysis. Processes 2025, 13, 904. https://doi.org/10.3390/pr13030904
Djilali K, Maachi R, Boutoumi H, Lekmine S, Ait Mesbah Z, Attia SM, Nasrallah N, Bouallouche R, Zhang J, Tahraoui H, et al. Comprehensive Stability Analysis of Haloperidol: Insights from Advanced Chromatographic and Thermal Analysis. Processes. 2025; 13(3):904. https://doi.org/10.3390/pr13030904
Chicago/Turabian StyleDjilali, Khadidja, Rachida Maachi, Hocine Boutoumi, Sabrina Lekmine, Zohra Ait Mesbah, Sabry M. Attia, Noureddine Nasrallah, Rachida Bouallouche, Jie Zhang, Hichem Tahraoui, and et al. 2025. "Comprehensive Stability Analysis of Haloperidol: Insights from Advanced Chromatographic and Thermal Analysis" Processes 13, no. 3: 904. https://doi.org/10.3390/pr13030904
APA StyleDjilali, K., Maachi, R., Boutoumi, H., Lekmine, S., Ait Mesbah, Z., Attia, S. M., Nasrallah, N., Bouallouche, R., Zhang, J., Tahraoui, H., & Amrane, A. (2025). Comprehensive Stability Analysis of Haloperidol: Insights from Advanced Chromatographic and Thermal Analysis. Processes, 13(3), 904. https://doi.org/10.3390/pr13030904