Abstract
In this paper, the geometric effect on flow structure and mixing performance of two miscible fluids (deionized water and glycerol) in a planetary centrifugal mixer (PCM) during the spin-up is numerically evaluated, using the OpenFOAM interMixingFoam solver. Six different aspect ratios, specifically 0.5, 1, 1.25, 1.5, 2, and 2.5, are considered. The flow structure in each geometric configuration is illustrated by the liquid interface and vorticity isosurface represented by the Q criterion, while the mixing performance is evaluated in terms of a mixing index . As the aspect ratio increases from small to large, first increases and then decreases. The peak at the end of spin-up reaches 0.196 for the aspect ratio of 1.25, rather than the other five aspect ratios in our study. The mechanism analysis shows that under an aspect ratio of 1.25, the vortex structure is most violently dissipated, the interface collapse degree is the largest, and the low-velocity region volume is the smallest, which enhances the chaotic convection mixing.
1. Introduction
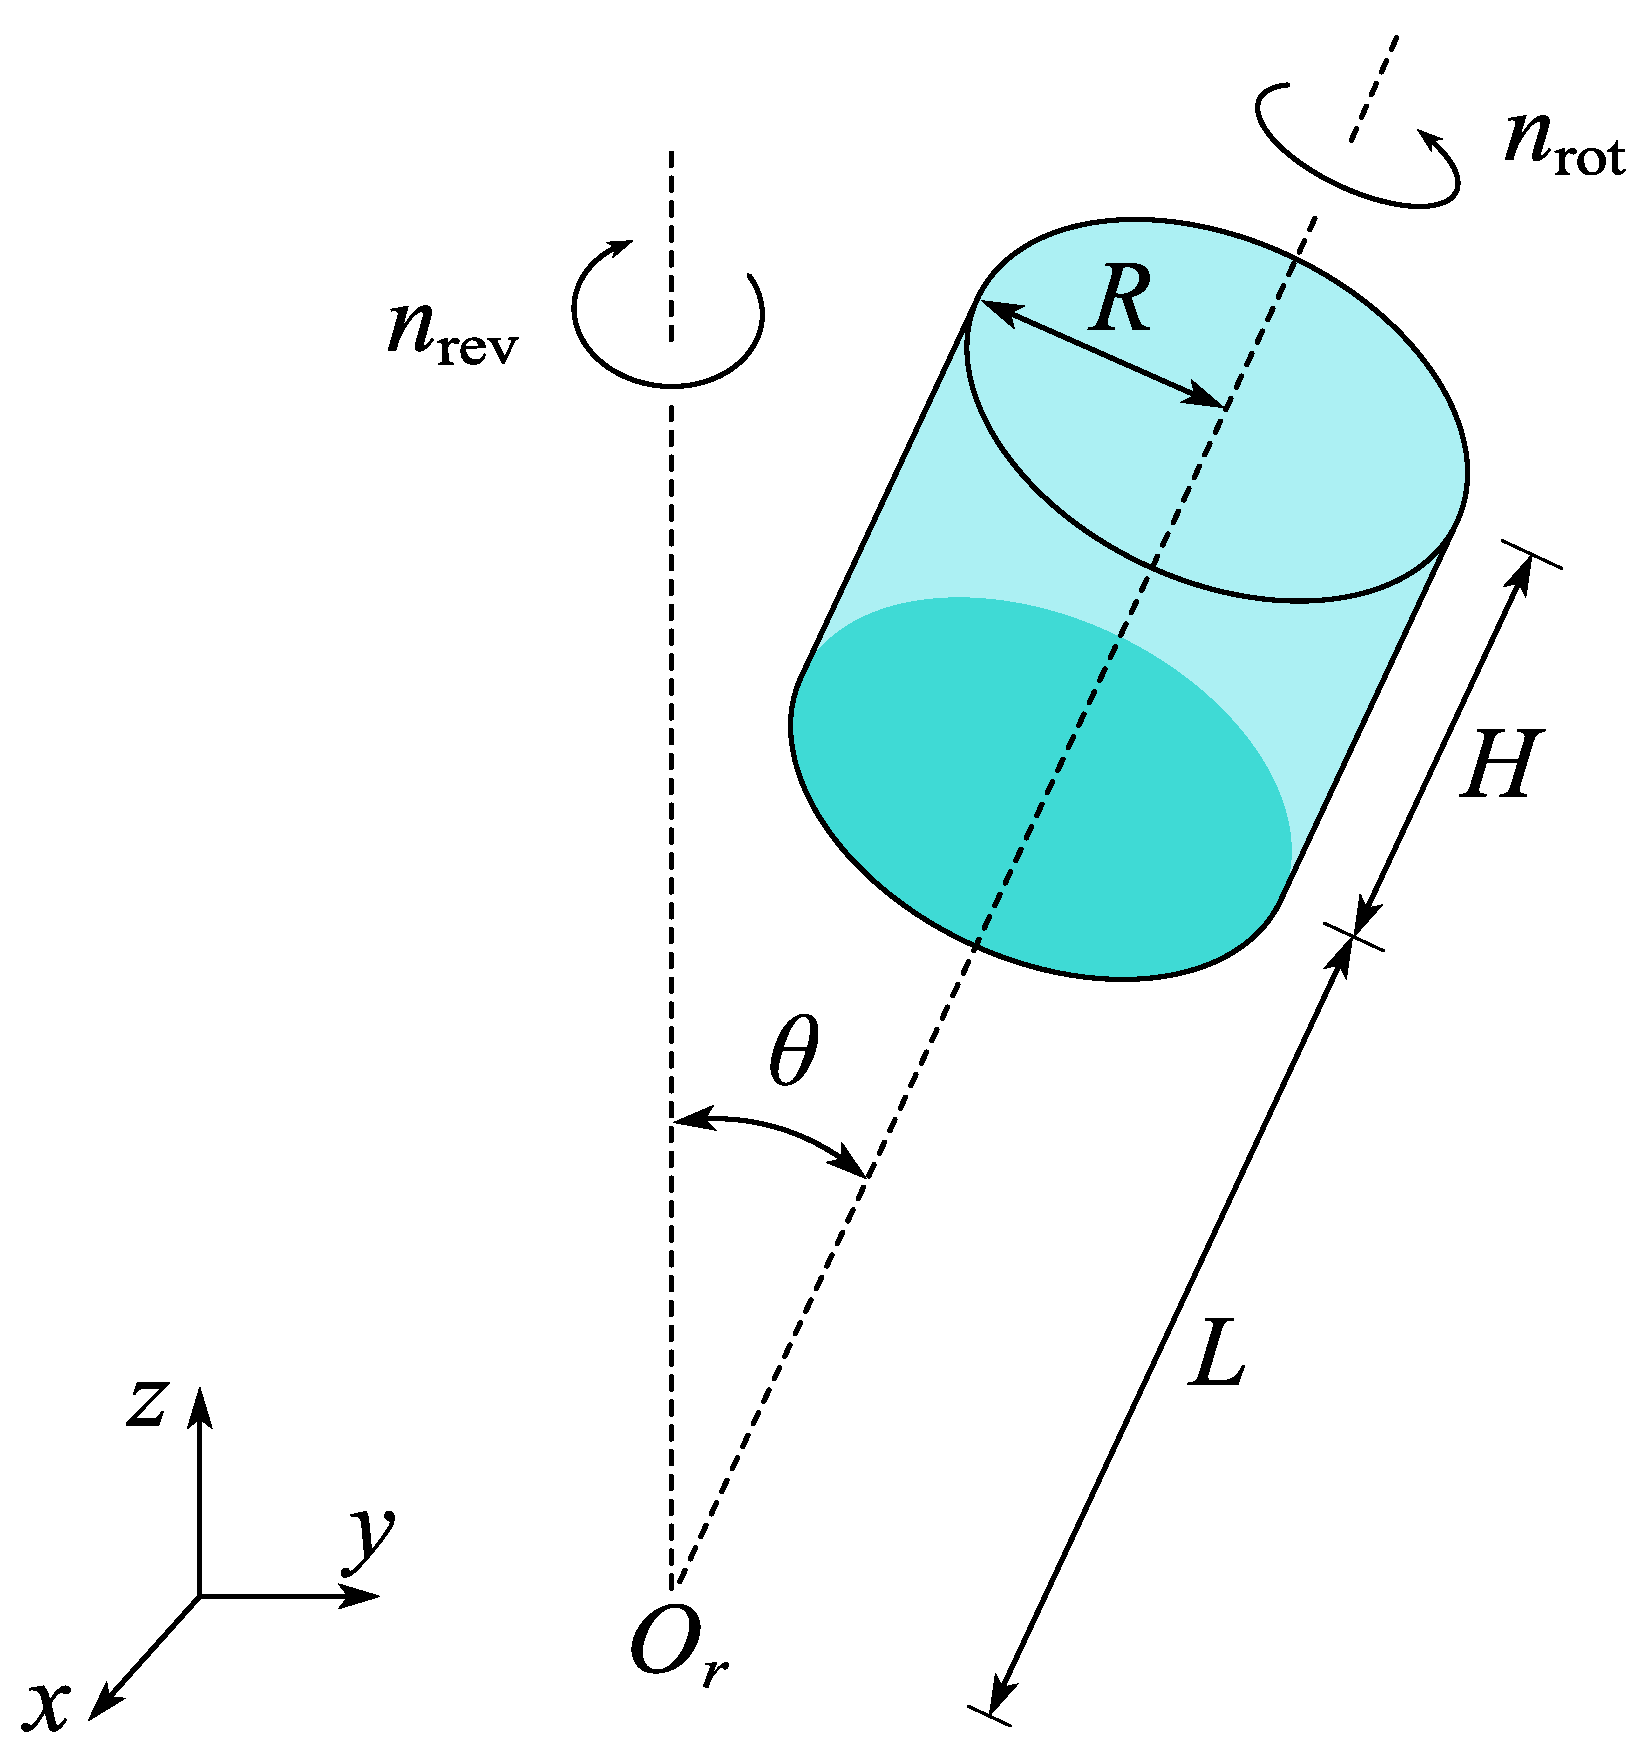
Liquid mixers are widely applied in the fields of energy, pharmaceuticals, etc. The mixing performance affects not only the occurrence but also the efficiency of the reactions within the mixer container. In the last decade, a new type of blade-free mixer, namely the planetary centrifugal mixer (PCM), was developed to enhance the mass transfer of materials through the multi-scale vortex flow field induced by a rotating cylinder [1,2]. Compared to the traditional stirred reactor, the PCM reactor has no stirring slurry inside the container to avoid the unnecessary damage and pollution induced by the stirring shear, permitting a wide range of applications, especially in the processes of sensitive material mixing [3,4]. The schematic of a typical PCM system is shown in Figure 1. The mixer cylinder simultaneously rotates around its geometric axis and revolves around the axis inclined onto the rotation axis with an angle of nutation angle [5,6].

Figure 1.
Schematic representation of a planetary centrifugal mixer.
Chergui et al. [7] conducted a numerical study of the flow dynamics behavior of a PCM in a rotating reference system. The analysis focuses on the rotation from a solid to a more complex 3D flow structure. Characterization parameters studied were focused on particle trajectories, velocity profiles, and streamlines. Experimental results show that the flow usually rotates around a single point in different specific planes. The vortex structures are in the form of spirals, whose size, shape, and axis of rotation depend on the Poincaré number, (, where is the rotation speed, and is the revolution speed). In addition, the structure of the flow changes significantly at a certain .
Shen et al. [8] first used a sliding grid technique with the volume of fluid (VOF) method to investigate the relationship between oxygen transfer rate, turbulence intensity, volumetric power consumption, and shear and related operating parameters in a two-phase air–water flow inside a PCM. The study used polarization intensity to evaluate the mixing efficiency. Their results show that the mixing performance of a PCM with opposite rotation and revolution directions is better compared to the PCM with the same rotation and revolution directions. Further, they [9] simulated the macroscopic and microscopic mixing properties of the two miscible liquids in the PCM and verified the accuracy of the numerical simulation model by particle image velocimetry (PIV) experiments.
Yamagata et al. [5] numerically investigated the flow structures and mixing performance of a PCM with a fixed rotation speed of 60 rpm and various revolution speeds. An Eulerian–Lagrangian method was employed to evaluate the mixing performance. Particle trajectories were tracked, and a mixing index based on the particle number density was calculated. The results show that rotation and revolution generate vortical flows with inclined axes. The flow structure becomes more complex as the precession rate increases. The mixing performance is maximized at a precession rate of around 0.5 and a moderate precession rate enhances mixing, while an excessive one reduces it due to the formation of a low-speed region.
Wang Gang et al. [10] undertook a numerical study on the relationship between material properties, such as viscosity and density, and mixing performance in the PCM, specifically, they studied the trajectory of the mass point, the low-velocity region, and the distribution of the discrete particles in the PCM. They proposed that fluid viscosity and density affect the mixing effect of PCM mainly by influencing the flow field structure, and that the increase in fluid viscosity leads to the increase in the viscous resistance of the fluid, which inhibits the spiral vortex, while the increase in density amplifies centrifugal and Coriolis forces, thereby strengthening the spiral vortices by enhancing fluid momentum transfer.
The above studies show that the operating condition and liquid properties influence the mixing performances. However, most studies have focused on the mixing dynamics of a PCM system within a long-term performance under a certain operation condition, e.g., both Yamagata [4] and Chergui’s [7] studies were carried out in cylinders of a single geometry, with aspect ratios of 2 and 0.75, respectively. The transient characteristics of the fluid mixing during the spin-up period in PCM have few reports. The spin-up period is the acceleration process of the liquid when the cylinder container undergoes a speed change (rotation or revolution). When the cylinder takes an acceleration time to reach a rotating speed from rest, the bulk fluid inside the cylinder may lag with the container motion and take a longer time, called the spin-up time T, to reach the new stable rotational state. The spin-up usually refers to the response capability of the bulk fluid to adapt to a change in the container motion [11,12,13,14]. The mixing dynamics during the PCM spin-up remain unclear, especially under different aspect ratios, due to the complex and transient flow field inside the container.
The spin-up of single-phase fluid was pioneered by Greenspan and Howard in 1963 [15]. They indicated that for the cases within a small Rossby number (), where is the change in the angular rotation speed of the container during the spin-up process and is the angular rotation speed of the container at the end of the spin-up), the spin-up time T is derived as , where the is the kinematic viscosity of the fluid-filled in the cylinder with a diameter of D.
Kaiser et al. [11] analyzed the formation and propagation of vortices within the boundary layer during spin-up and spin-down in a rotating cylinder through experiments and numerical simulations. The vortex dissipation was accelerated by the Gortler vortex due to the sidewall instability, revealing the effects of the initial and boundary conditions on the vortex behavior.
Hewitt [12] focused on the spin-up process of a two-layer, stably density-stratified fluid in a rotating container with an axisymmetric sloping base and cylindrical walls. The work bridges theoretical predictions and laboratory experiments, offering insights into stratified rotating flows in variable-depth geometries but without researching miscible fluids.
Several important points should be noted as follows. Processing mixing systems of two miscible fluids are ubiquitous in process engineering. The spin-up time T for low-viscosity materials is relatively long, as the mixing performance during this period should not neglected. The transient characteristics of fluid mixing during the spin-up period in PCM have received little attention. The spin-up period is a critical stage as it represents the acceleration process of the liquid when the cylinder container changes speed. The effect of aspect ratio on the flow structure and mixing performance during the spin-up process lacks in-depth research.
In this study, we use a large eddy simulation (LES) method of a wall-adaptive local eddy-viscosity (WALE) model with the OpenFOAM interMixingFoam solver to systemically analyze the aspect ratio’s effect on the interface structures, vortex, and concentration fields’ deformation during the spin-up of a PCM. This study may provide some in-depth understanding of the mixing phenomena, especially during the spin-up, giving a useful reference for the optimization design of the mixer under different scenarios.
2. Materials and Methodologies
2.1. Experiment Setup
To validate our adopted numerical scheme in this study, the experiments were conducted in our self-designed PCM system, which was established in the State Key Laboratory of NBC Protection for Civilians, as shown in Figure 2. Our PCM system briefly consists of a cylinder container, a water jacket, a three-axis gyro-platform, an Nd:YAG laser (LWPIV-Max, Laserwave, Beijing, China), a signal synchronizer (9081N0201, Dantec Dynamics, Copenhagen, Denmark), several optical lenses, and one CMOS camera (VCXU-23M, Baumer, Frauenfeld, Switzerland). The platform allows for real-time in-situ PIV for the visualization of the flow field inside the cylinder [6,16,17].
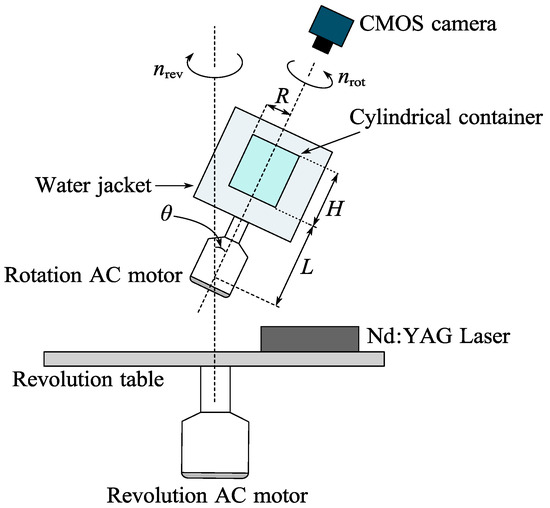
Figure 2.
The schematics of PCM flow test experimental system.
Firstly, the optically transparent cylindrical container made of acrylic was completely pre-filled with working fluids at rest. Then, the container was driven by an AC servo motor (MSMD022GIU, Panasonic, Osaka, Japan) to control the angular rotation speed () in the cylindrical container axis, while the angular revolution speed () was controlled by the second DC motor (MSMD022GIU, Panasonic, Osaka, Japan) around a different axis inclined at an angle (, named nutation angle) from the rotation axis using the third AC servo motor (Minas A6, Panasonic, Osaka, Japan). Those three AC motors were mounted at a three-axis gyro platform (Mode, Beihang University, Beijing, China), where the operations of rotation, revolution, and precession angle were managed and monitored through the digital control panel, respectively.
The cylindrical container involved in the validation had an aspect ratio of 1 (both the height H and diameter D were ). The deionized water and glycerol were pre-filled at an equal volume at a room temperature of 20 °C, where the glycerol and water were set on the top and bottom half of the cylinder, respectively. The cylinder operated at a rotation speed of , a revolution speed of , a nutation angle of 10°, and an acceleration time of , while the rotation and revolution directions were opposite to enhance the flow mixing process. The basic physical properties of deionized water and glycerol at 20 °C are listed in Table 1 [18,19].

Table 1.
Physical parameters of the two substances (20 °C).
The PIV measurement domain in this study was a circular region with a diameter of 53 mm (corresponding to the central cross-section of the cylinder). In this study, polyamide seeding particles (PSPs) with a mean diameter of and density of 1030 were employed as tracer particles. The average seeding particle concentration in the flow field was maintained at 150 mg/L, with 15–20 particles per interrogation window (64 × 64 pixels). The particle displacements between consecutive frames were strictly limited to ≤10 pixels with a double-frame image acquisition mode. The inter-frame time interval was 900 and the CMOS camera exposure time was set to 200 . The processing and analysis of the PIV images were conducted using Dynamic Studio 7.6.77 software (Dantec Dynamics, Copenhagen, Denmark). Particle correlation and velocity vector generation were achieved using an adaptive cross-correlation algorithm.
2.2. Numerical Methodologies
The primary objective of this study is to numerically evaluate the geometric effect on flow structure and mixing performance in the planetary centrifugal mixer (PCM) during the spin-up. Since a cylinder container possesses two primary geometric parameters of cylinder height H and diameter D, then different aspect ratio values () for several different containers were studied, while the diameter was kept as for all containers through the study. The container with the same geometry as in the experiment is denoted as the baseline model, Model B. Another five different values, 0.5, 1.25, 1.5, 2, and 2.5, namely Models A and C–F, were then designed in this study.
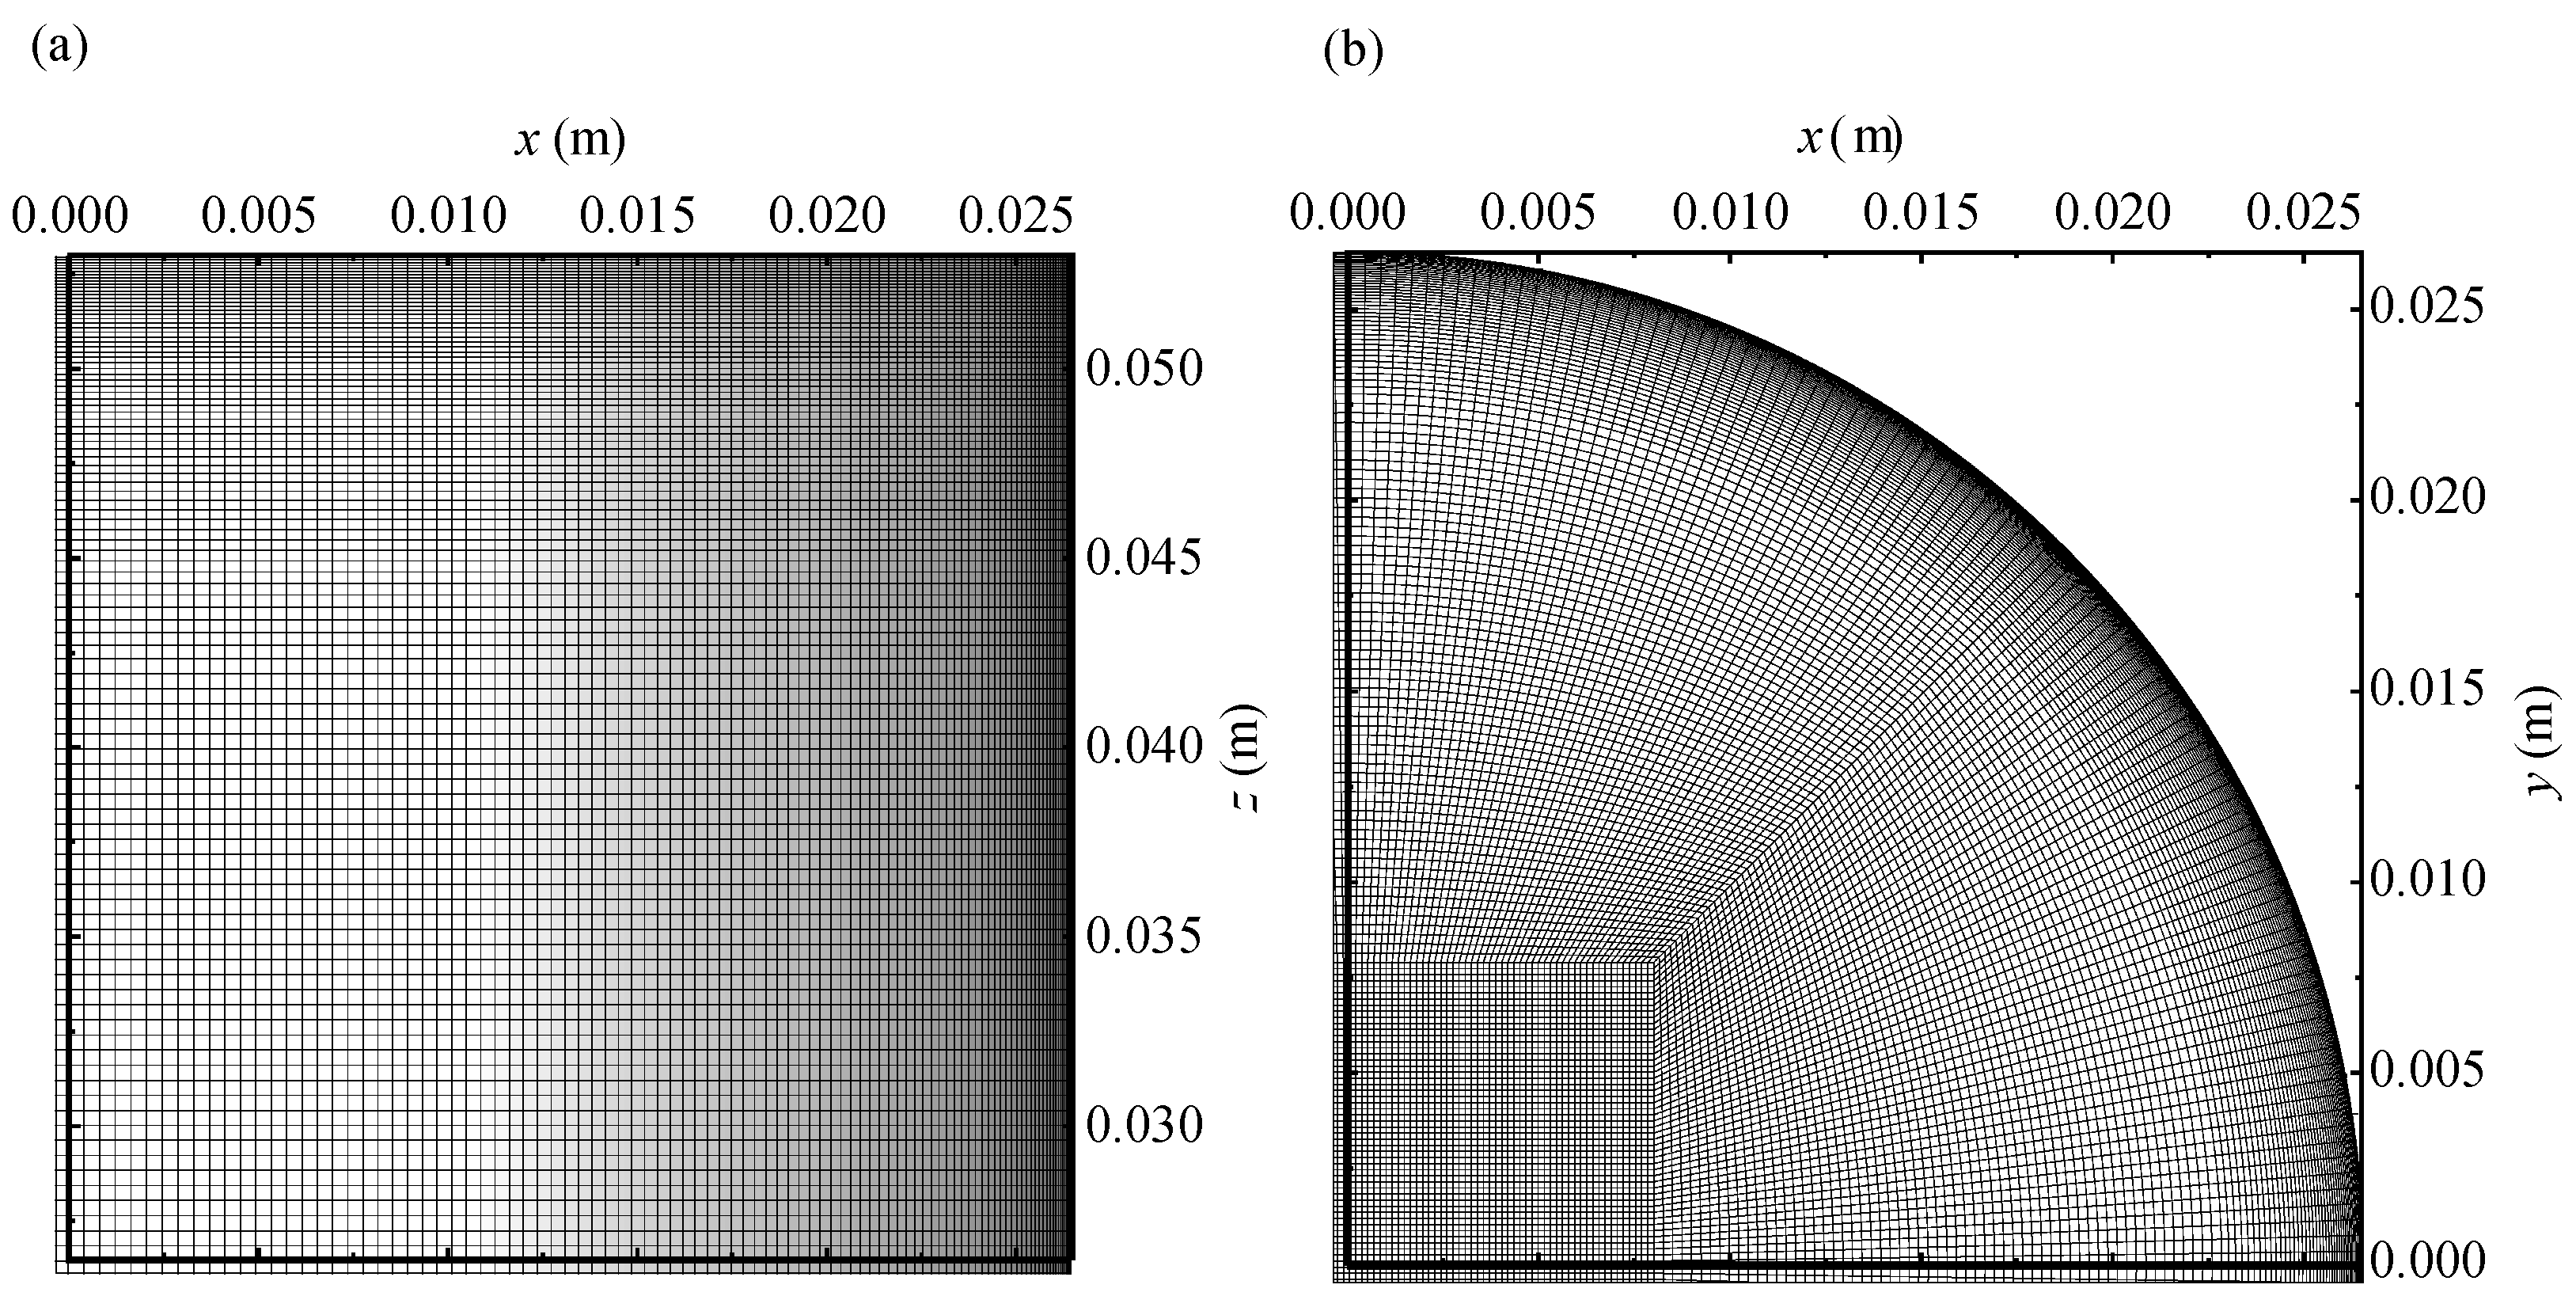
Using the blockMesh utility in OpenFOAM [20], an O-grid strategy was adopted for the cylinder container in our study [21,22], where the local mesh was contracted at the cylindrical wall vicinity. The final computational domain of Model B is shown in Figure 3, within a total number of grids and 30 boundary layers (see mesh independence test section).
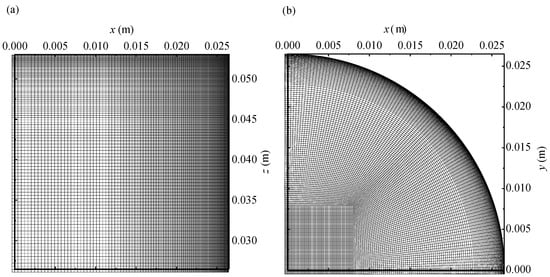
Figure 3.
The O-grid mesh topology of the cylinder with (Model B). (a) Oblique view. (b) Top view.
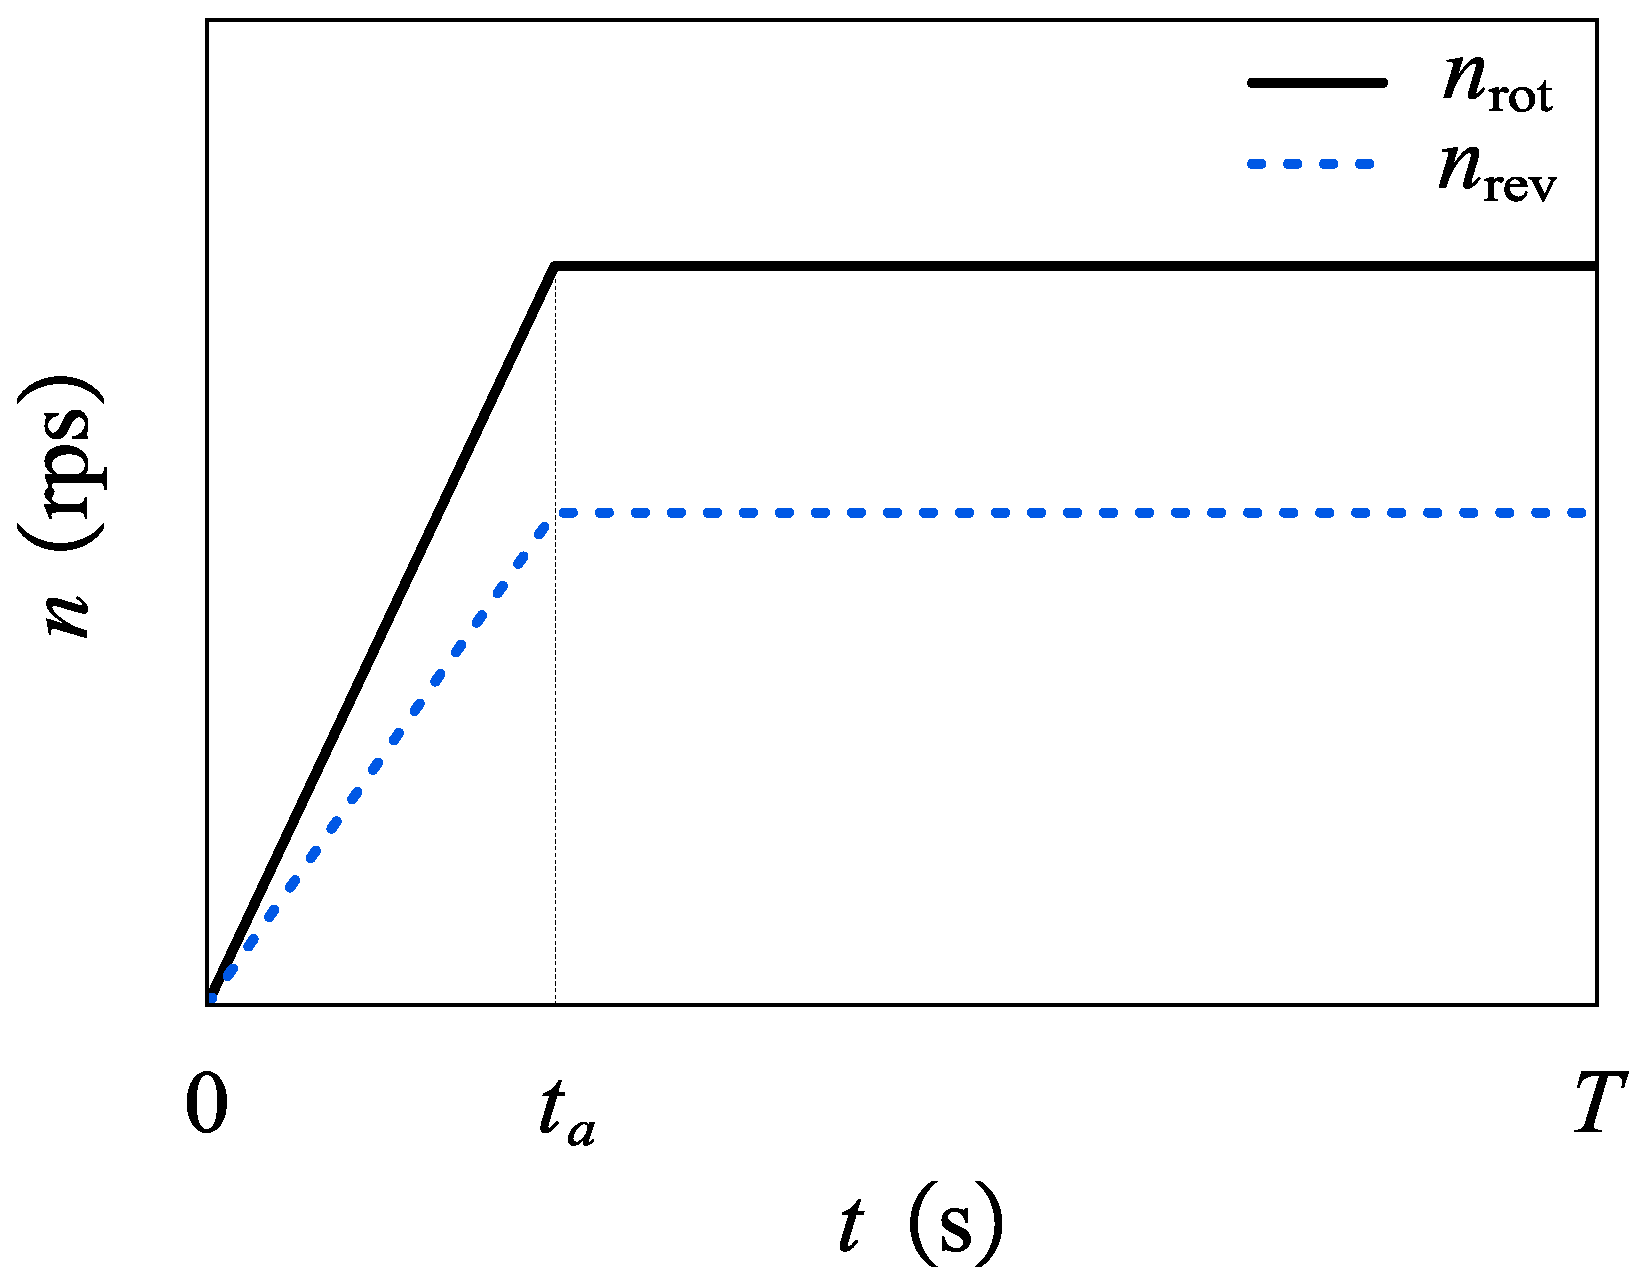
As in the experiment, both the rotational and revolutionary motion of the cylinder are accelerated from rest to the desired speed (i.e., and ) in a prescribed acceleration time , as shown in Figure 4. Again, in this study, the rotation speed , revolution speed , nutation angle , and acceleration time , were set as , , and , respectively. The rotation and revolution directions were still opposite then. All the cylinder walls were set as the solid no-slip type in our simulation. The working fluids in the simulation were the same as in the experiment; then, the glycerol and water were set on the top and bottom half of the cylinder, respectively. The diffusion coefficient between the two fluids was set as [23]. In total, six numerical cases (Models A–F) are summarized as follows.
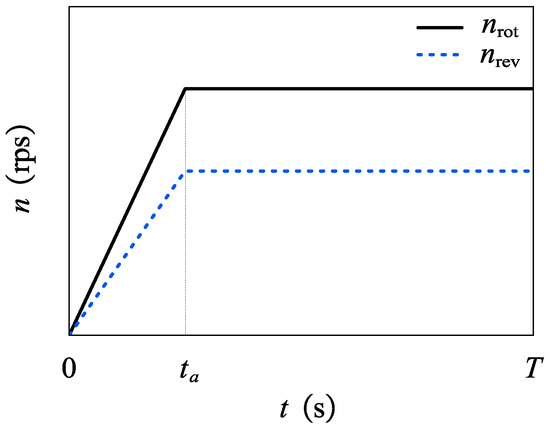
Figure 4.
The schematic temporal profile of the rotation/revolution speed of PCM.
The interMixingFoam solver in OpenFOAM was adopted to compute the aforementioned miscible fluids [20], where the dynamic mesh technology was applied to our PCM system. Hemmingsen et al. [24] conducted both LES and URANS (unsteady Reynolds-Averaged Navier–Stokes) simulations to predict the flow reversal process of a vortex breakdown region in a cylinder. Their results suggest that the LES of the WALE model better captures the complex vortex structure under different working conditions. Therefore, the LES method within a WALE SGS (subgrid-scale) model, was adopted in our study. The working fluids in our simulation are considered incompressible, and the continuity and momentum equations are as follows [25].
where and are the filtered velocity and pressure of mixture flow, is Levi–Civita symbol, is the resultant angular speed, and and are the density and viscosity of the mixture. Furthermore, presents the volume fraction of a single phase, and the subscripts w and g denote water and glycerol. The centrifugal force term is usually incorporated into the filtered pressure . Therefore, it is not explicitly written. The SGS stress of in terms of the WALE model, computes the eddy viscosity from the traceless symmetric part of the square of the resolved velocity gradient tensor , as follows [26]:
where and are the eddy viscosity and the rate-of-strain tensor induced by the large scale deformation, respectively. Furthermore, the terms of and can be obtained as follows:
where the mixing length of the sub-grid scale can be modeled as
where is the model constant with a default value of , K is the Von Karmen constant with an adopted value of 0.41, the terms of d and V are the nearest distance to the vicinity wall, and the volume of the local computational cell, respectively.
The turbulent kinetic energy dissipation rate quantifies the rate at which turbulent kinetic energy is converted into thermal energy per unit mass of fluid per unit time due to viscous effects. In turbulent flows, energy is continuously transferred from large-scale eddies to small-scale eddies through the energy cascade process, with the latter eventually dissipating energy into heat via viscous action. The magnitude of reflects the intensity of this energy dissipation mechanism. In large eddy simulation (LES), large-scale vortical structures are directly resolved, while the influence of small-scale motions is approximated using SGS models [27]. The SGS dissipation rate is defined as follows:
Furthermore, the two-fluid interface is rendered by the volume-of-fluid (VOF) method [28], in which the Equation (1) is expressed as follows:
where the relative velocity , is expressed as
where denotes the compression coefficient for the interface [29,30].
In the simulation, the adaptive step approach is utilized within an initial calculation time step of and 20 iterations to ensure a maximum Courant number of 1 for numerical stability. The residuals for the solved velocity and pressure field are both set as . Furthermore, the mesh independence test is performed for the Model B () under the aforementioned operation condition, in which the rotation speed , revolution speed , nutation angle , and acceleration time , are , , , and , respectively.
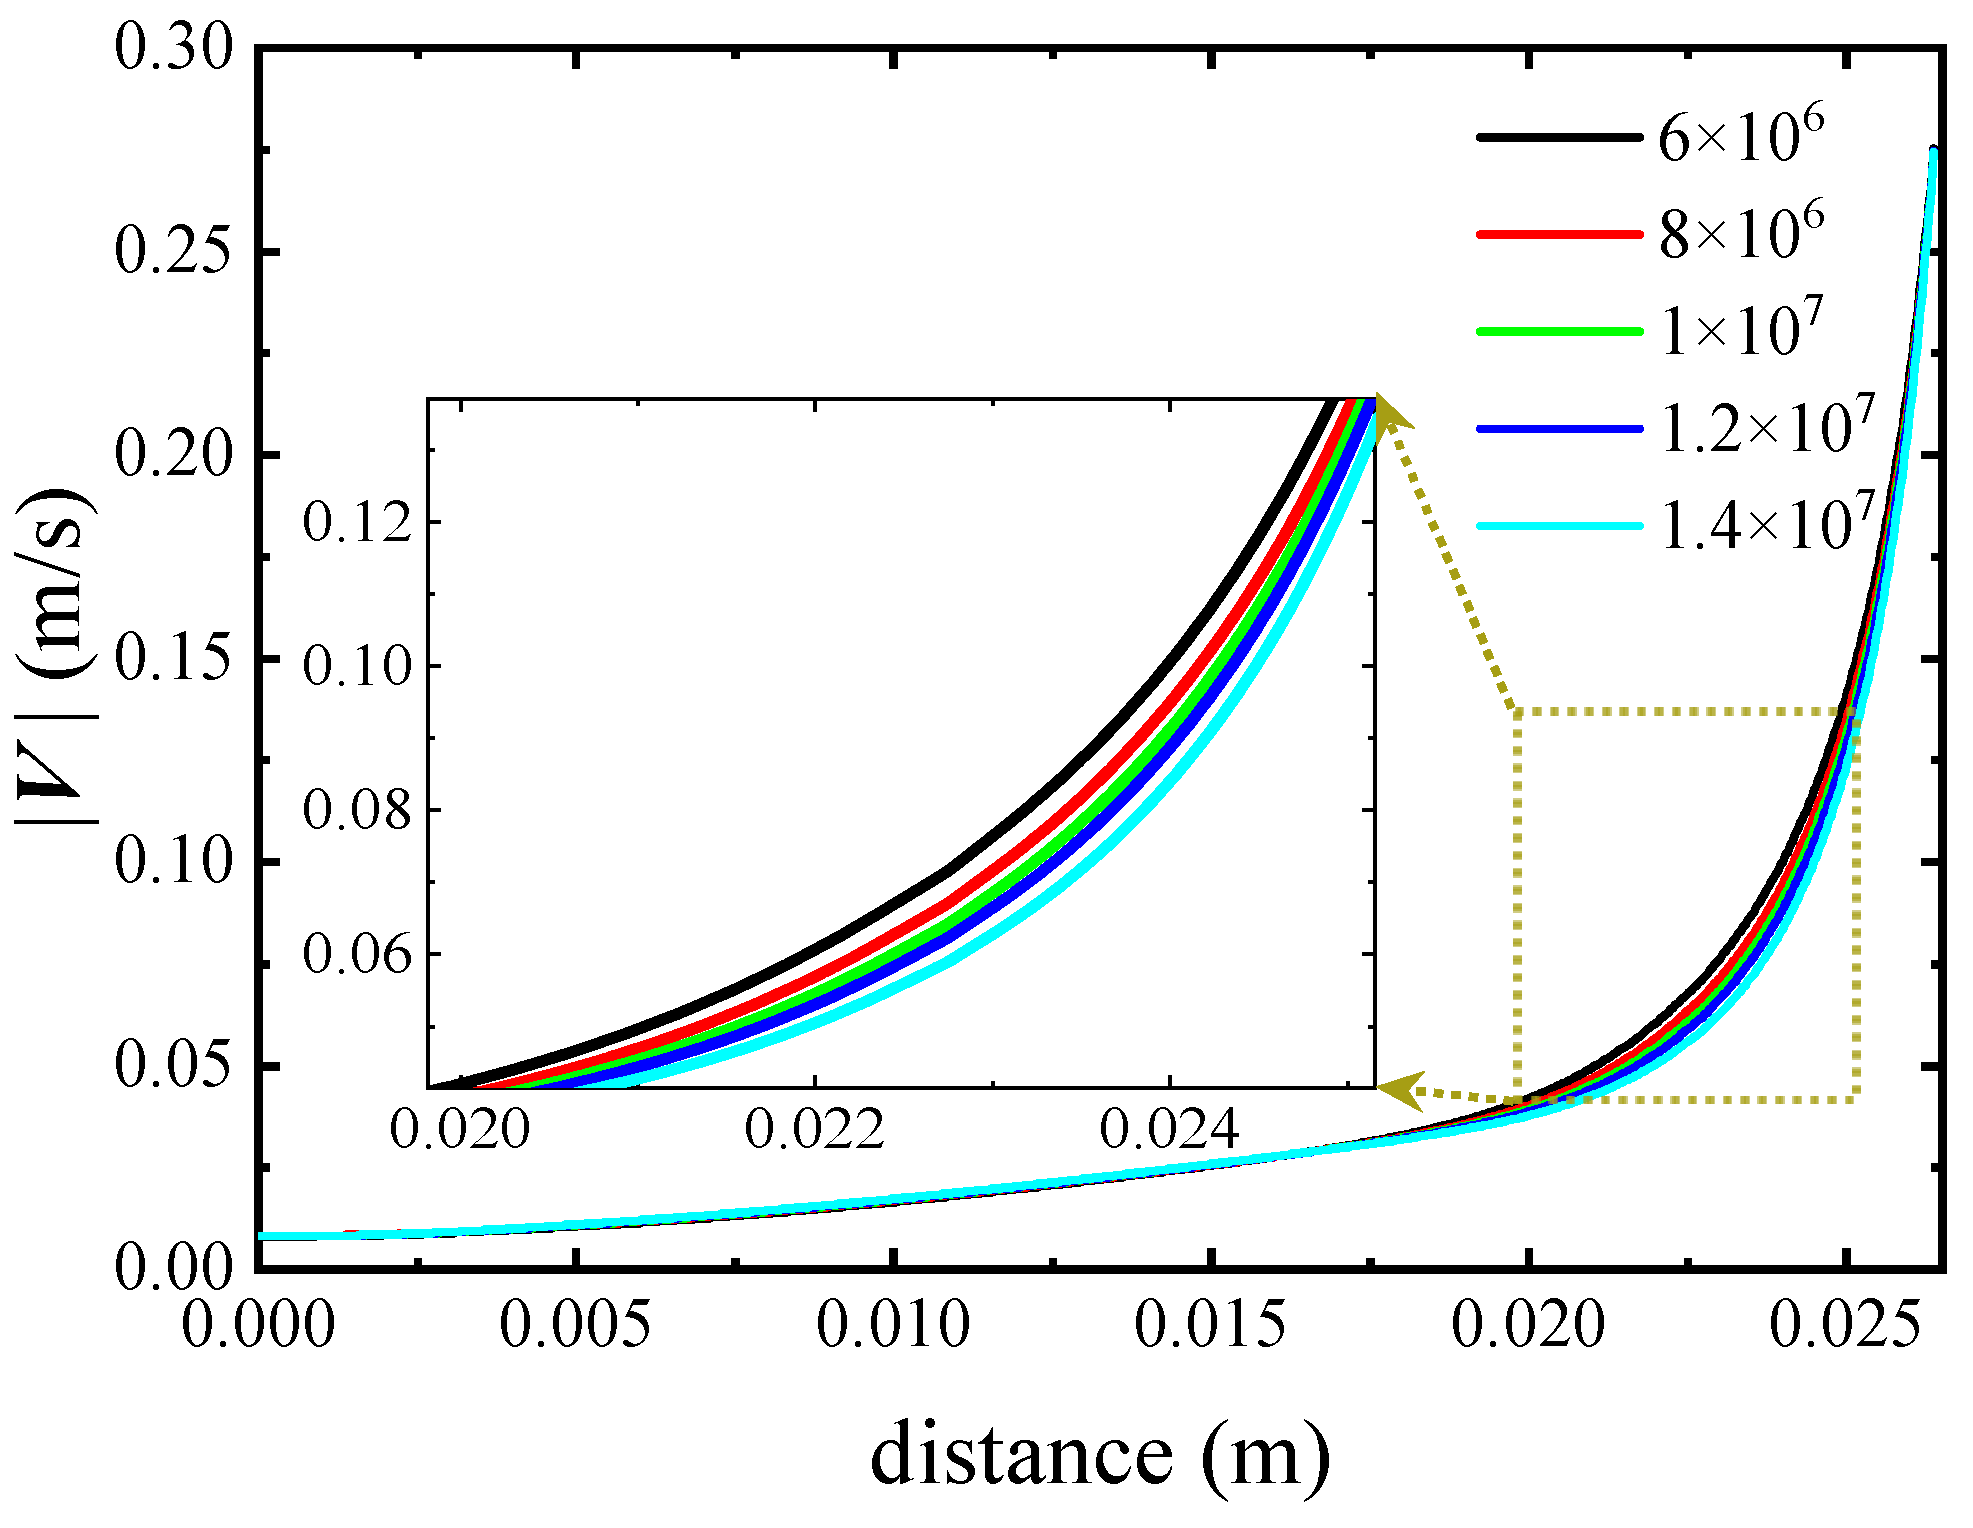
Five different mesh levels, from a coarse one ( grids in total) to a fine one ( grids in total), were evaluated with the velocity magnitude at 1000 monitor points along the radius of the central cross-section (height of ) of the cylinder at the time of (see Figure 5). The average deviation of for the grid with cells was 0.198% compared to the grid with cells, and the average deviation for the grid with cells was 0.221%. Taking both computational cost and simulation accuracy into consideration, the grid resolution of was ultimately selected for the cylindrical geometry with [31].
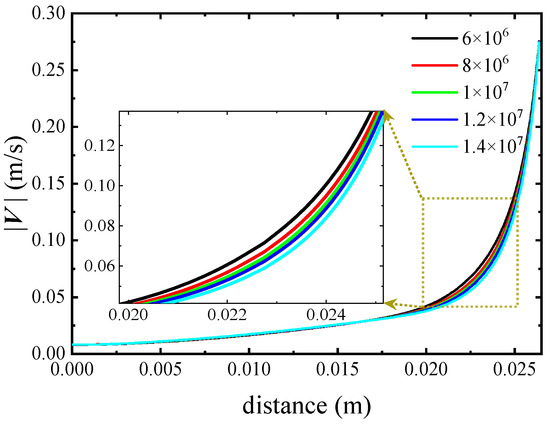
Figure 5.
Velocity magnitude distribution on the radius in the cross-section of the cylinders with different meshes.
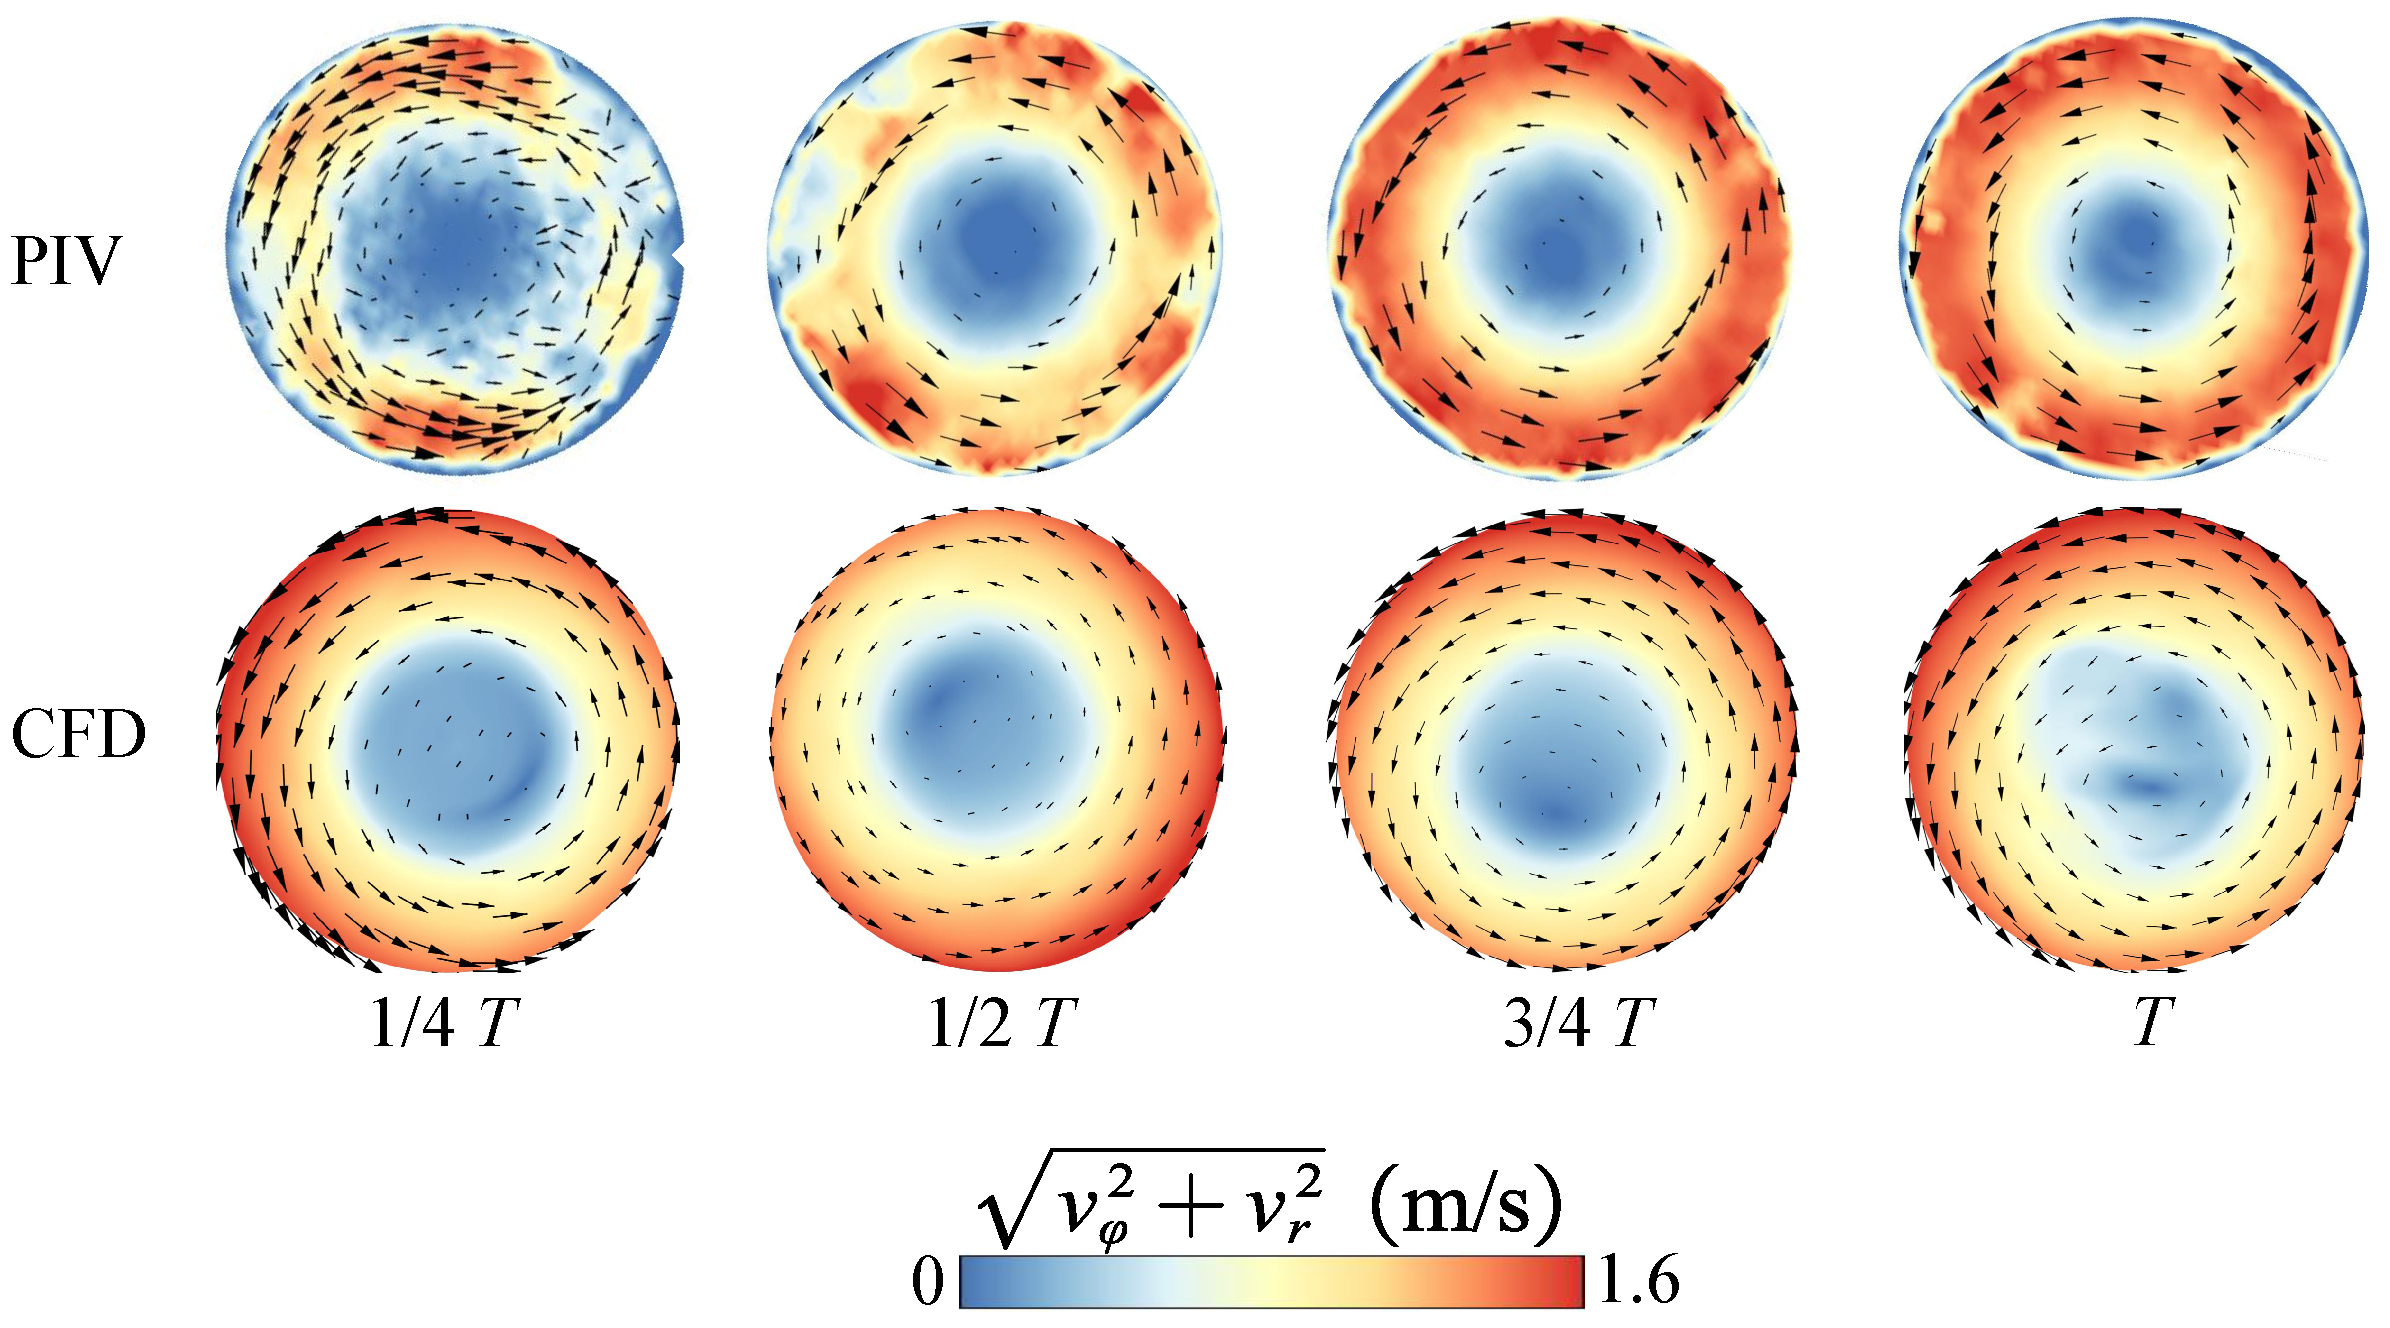
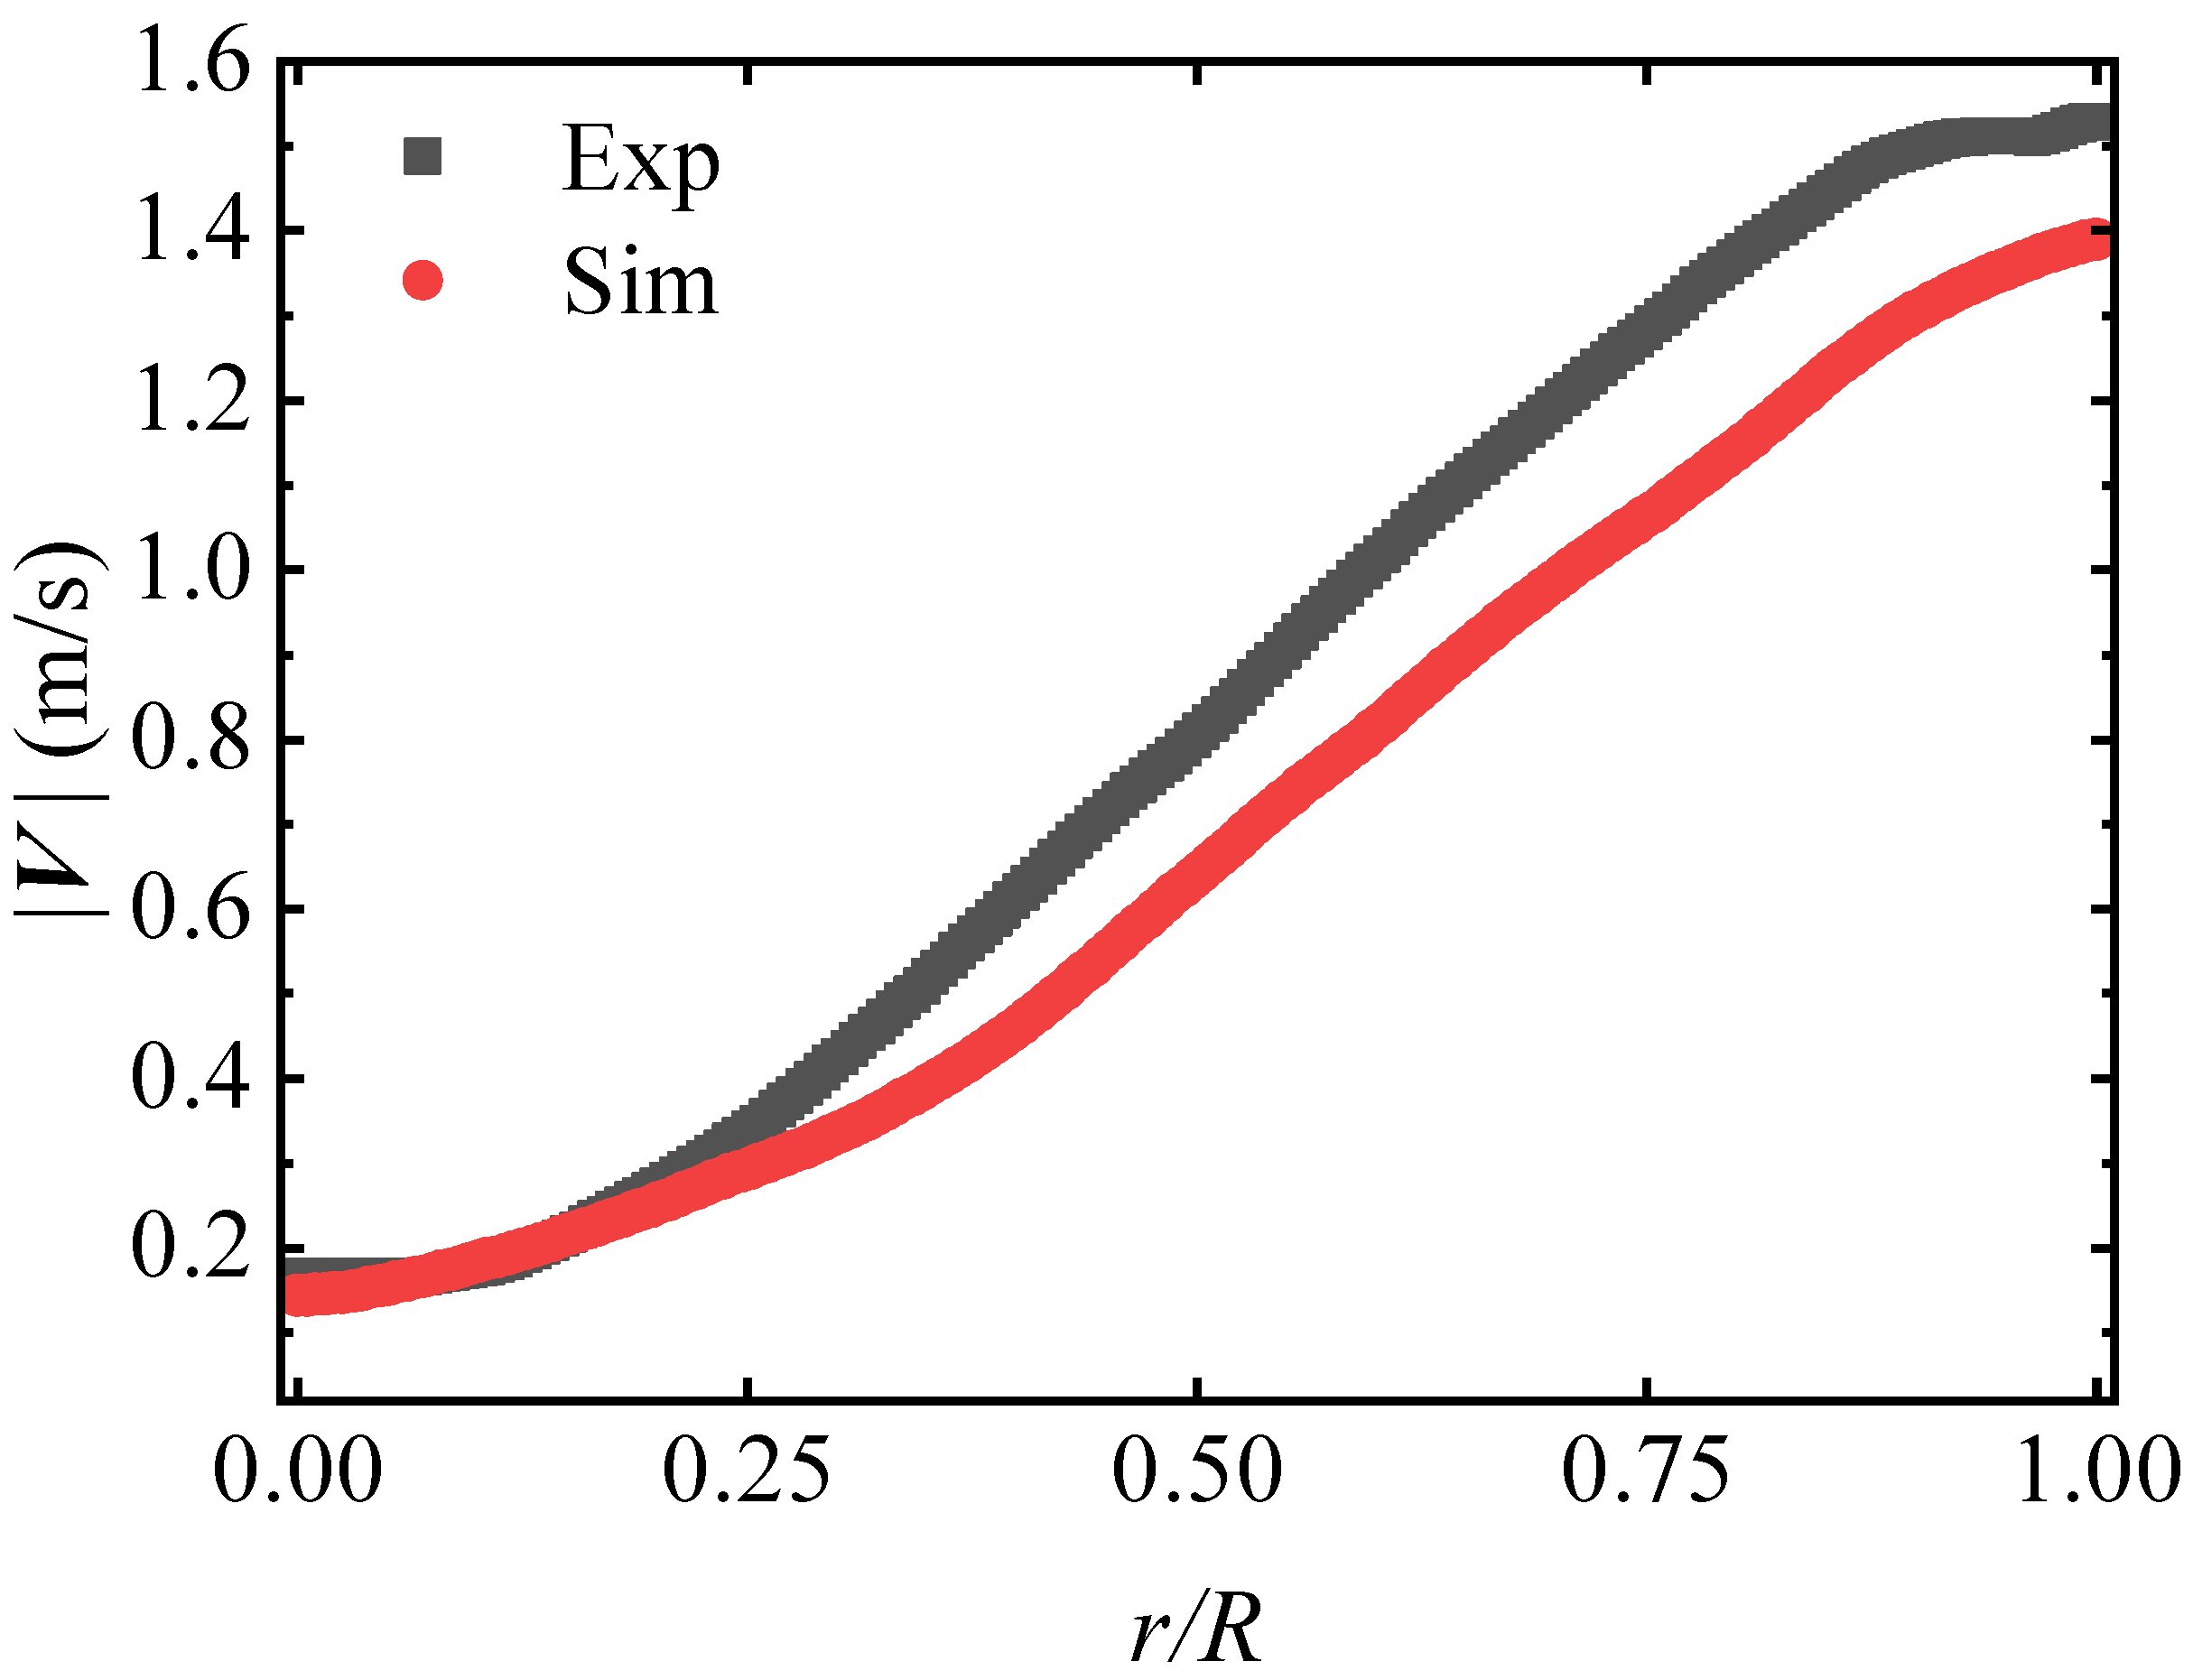
Simulation case Model B′ had almost identical conditions to Model B in Table 2, except that the glycerol was set at the bottom half of the cylinder and water was in the upper half. Corresponding experimental studies were conducted under the same operating conditions. The numerical result of Model B′ was then validated with the experimental result. As shown in Figure 6, the velocity vectors at the central cross-section (height of ) were compared at four different instants between the experiment PIV snapshot and numerical visualization. It is noted that the term of T is the spin-up time T of the mixture inside the cylinder, as aforementioned. Figure 7 shows the comparison of the average magnitude of velocity between experiment and numerical case Model B′ on the radius of the cross-section of the cylinder at . The results indicate that our simulation result is in relatively acceptable agreement with the experiment, with an average relative error of , a correlation coefficient of 0.995, and mean absolute error of 0.133 m/s. In the central cross-section PIV experiment, the tracer particles at the edge of the cross-section with axial velocity may be out of focus between adjacent frames, so there is a low-velocity area at the edge of the velocity contours of the PIV experiment, which is the error area.
Table 2.
Simulation cases.
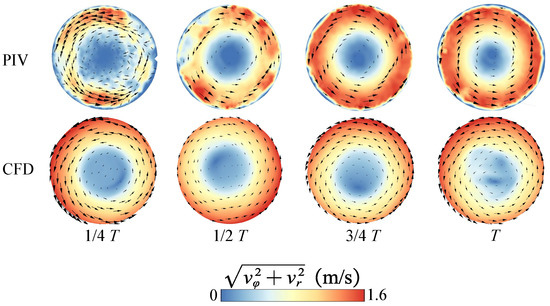
Figure 6.
Contours of the magnitude of velocity on the cross-section of the cylinder between the experiment and Model B′.

Figure 7.
Comparison of the between experiment and numerical case Model B′ on the radius of the cross-section of the cylinder.
Additionally, the numerical validation was conducted by implementing our adopted numerical method into Weidman’s work [32]. The results solved by our numerical method agree excellently with the literature results (for more details, see Appendix A), which further confirms that the LES of the WALE model is suitable in mixing flow simulations.
3. Results and Discussion
3.1. Interface Evolution
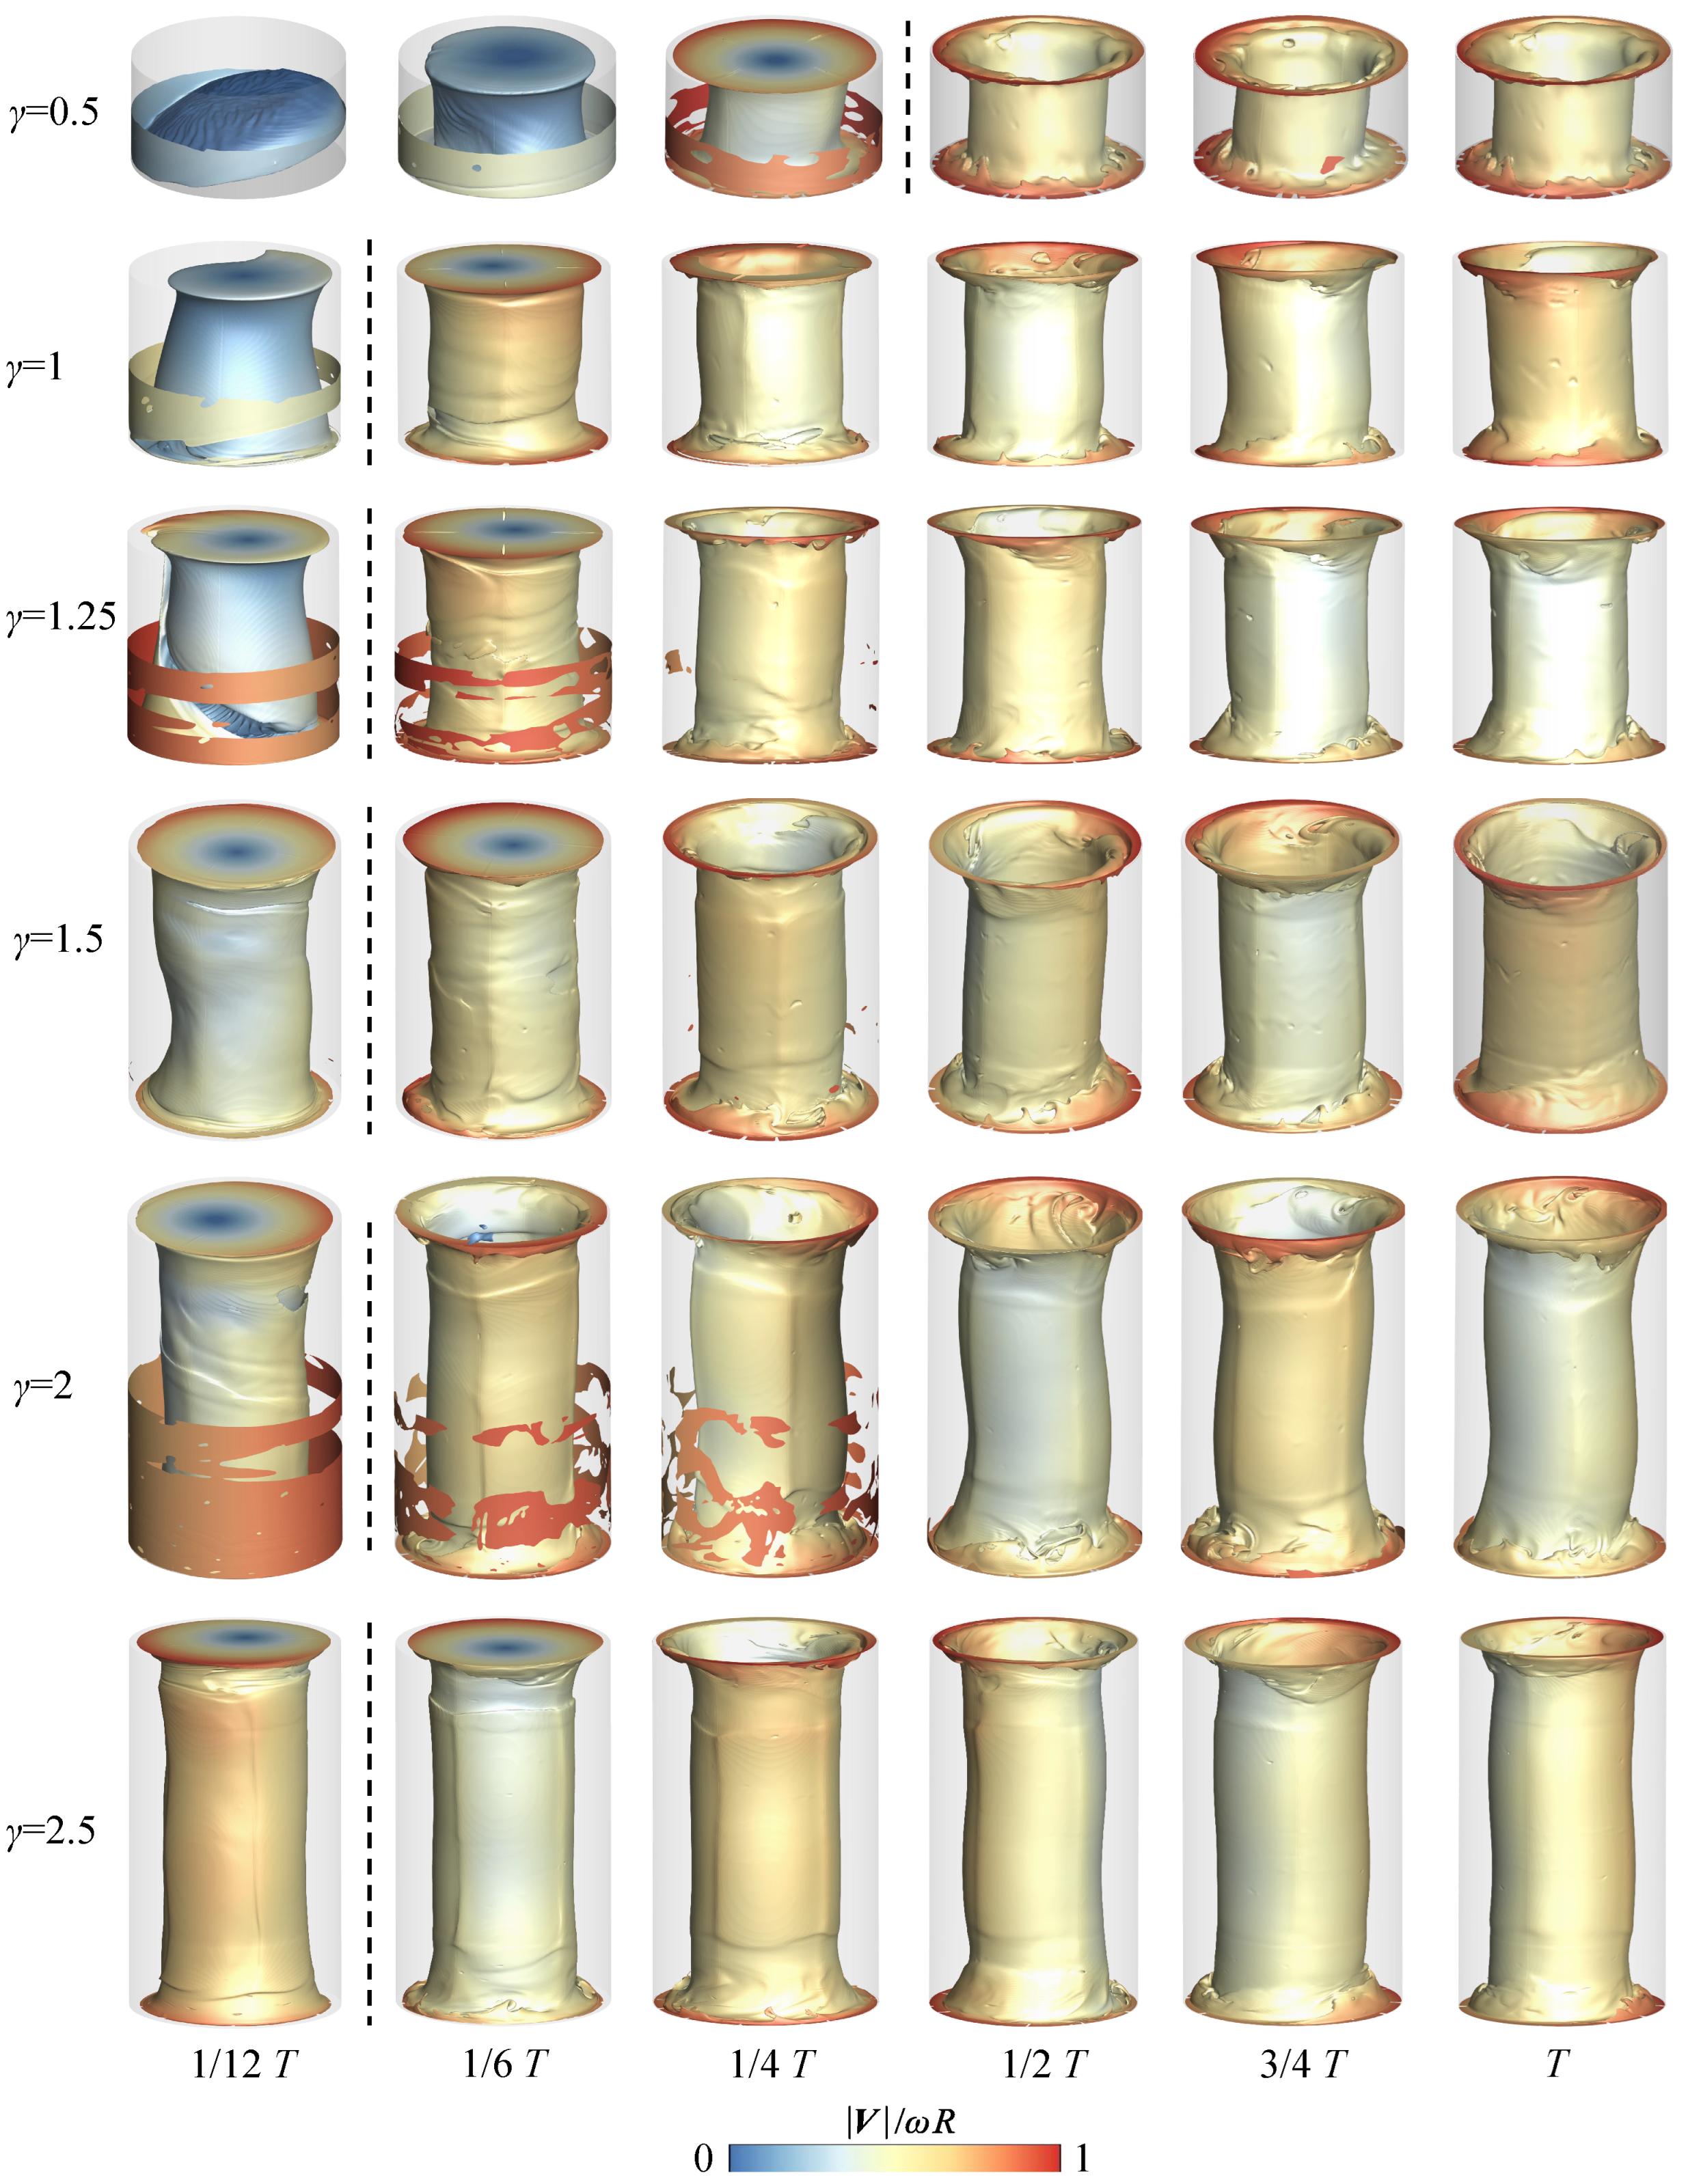
The flow structure is first presented as the contour of dimensionless velocity magnitude (i.e., , is the resultant angle speed of the cylinder) on the isosurface of the volume fraction of . As shown in Figure 8, the evolution of the interface during the whole spin-up time duration (T) is illustrated within six instantaneous snapshots for all six cases of Models A–F. In addition, a dashed line inside the snapshot intervals for each case denotes the acceleration time of , showing the phase difference between the container acceleration time () and the bulk flow spin-up time (T).
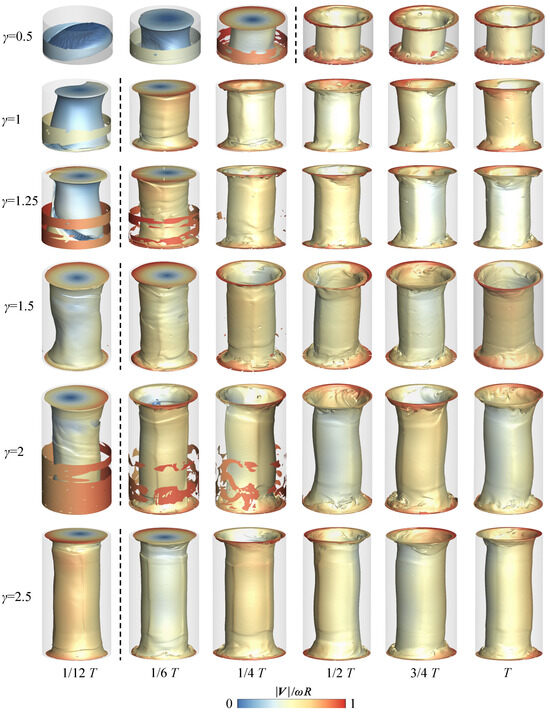
Figure 8.
Contours of magnitude of velocity on isosurfaces of different at different times.
In Figure 8, it is generally observed that the interface dynamically evolves, which is primarily dominated by two effects: (i) the density difference drives the upper heavy phase (glycerol) downward and the bottom light phase (water) upward; (ii) the resultant motion of rotation and revolution drives glycerol to move outside and water to move inside the cylinder container convectively. The interface gradually deforms in time, indicating the interphase’s relative movement, accelerating the inter-phase convection. Finally, the isosurfaces form a nearly cylinder-like structure inside the cylinder.
In the early stage of spin-up (e.g., ), as increases, the interface is prone to form a cylinder-like structure. After the cylinder-like structure forms (), the cylinder-like structure shrinks in time for the cases of (Models A–C), in which the case of the model has the largest contraction in the volume of the cylinder-like structure. The shrinking of the interface implies that the mixing is developing further towards the center of the bulk flow, mainly in the radial direction. In contrast, for the cases in the range of (Models D–F), the cylinder-like structure twists in time rather than shrinking. The formation and evolution of the interfaces indicate the degree of effective mixing and its subsequent progression. In summary, the model relatively has a better mixing performance than the other five models.
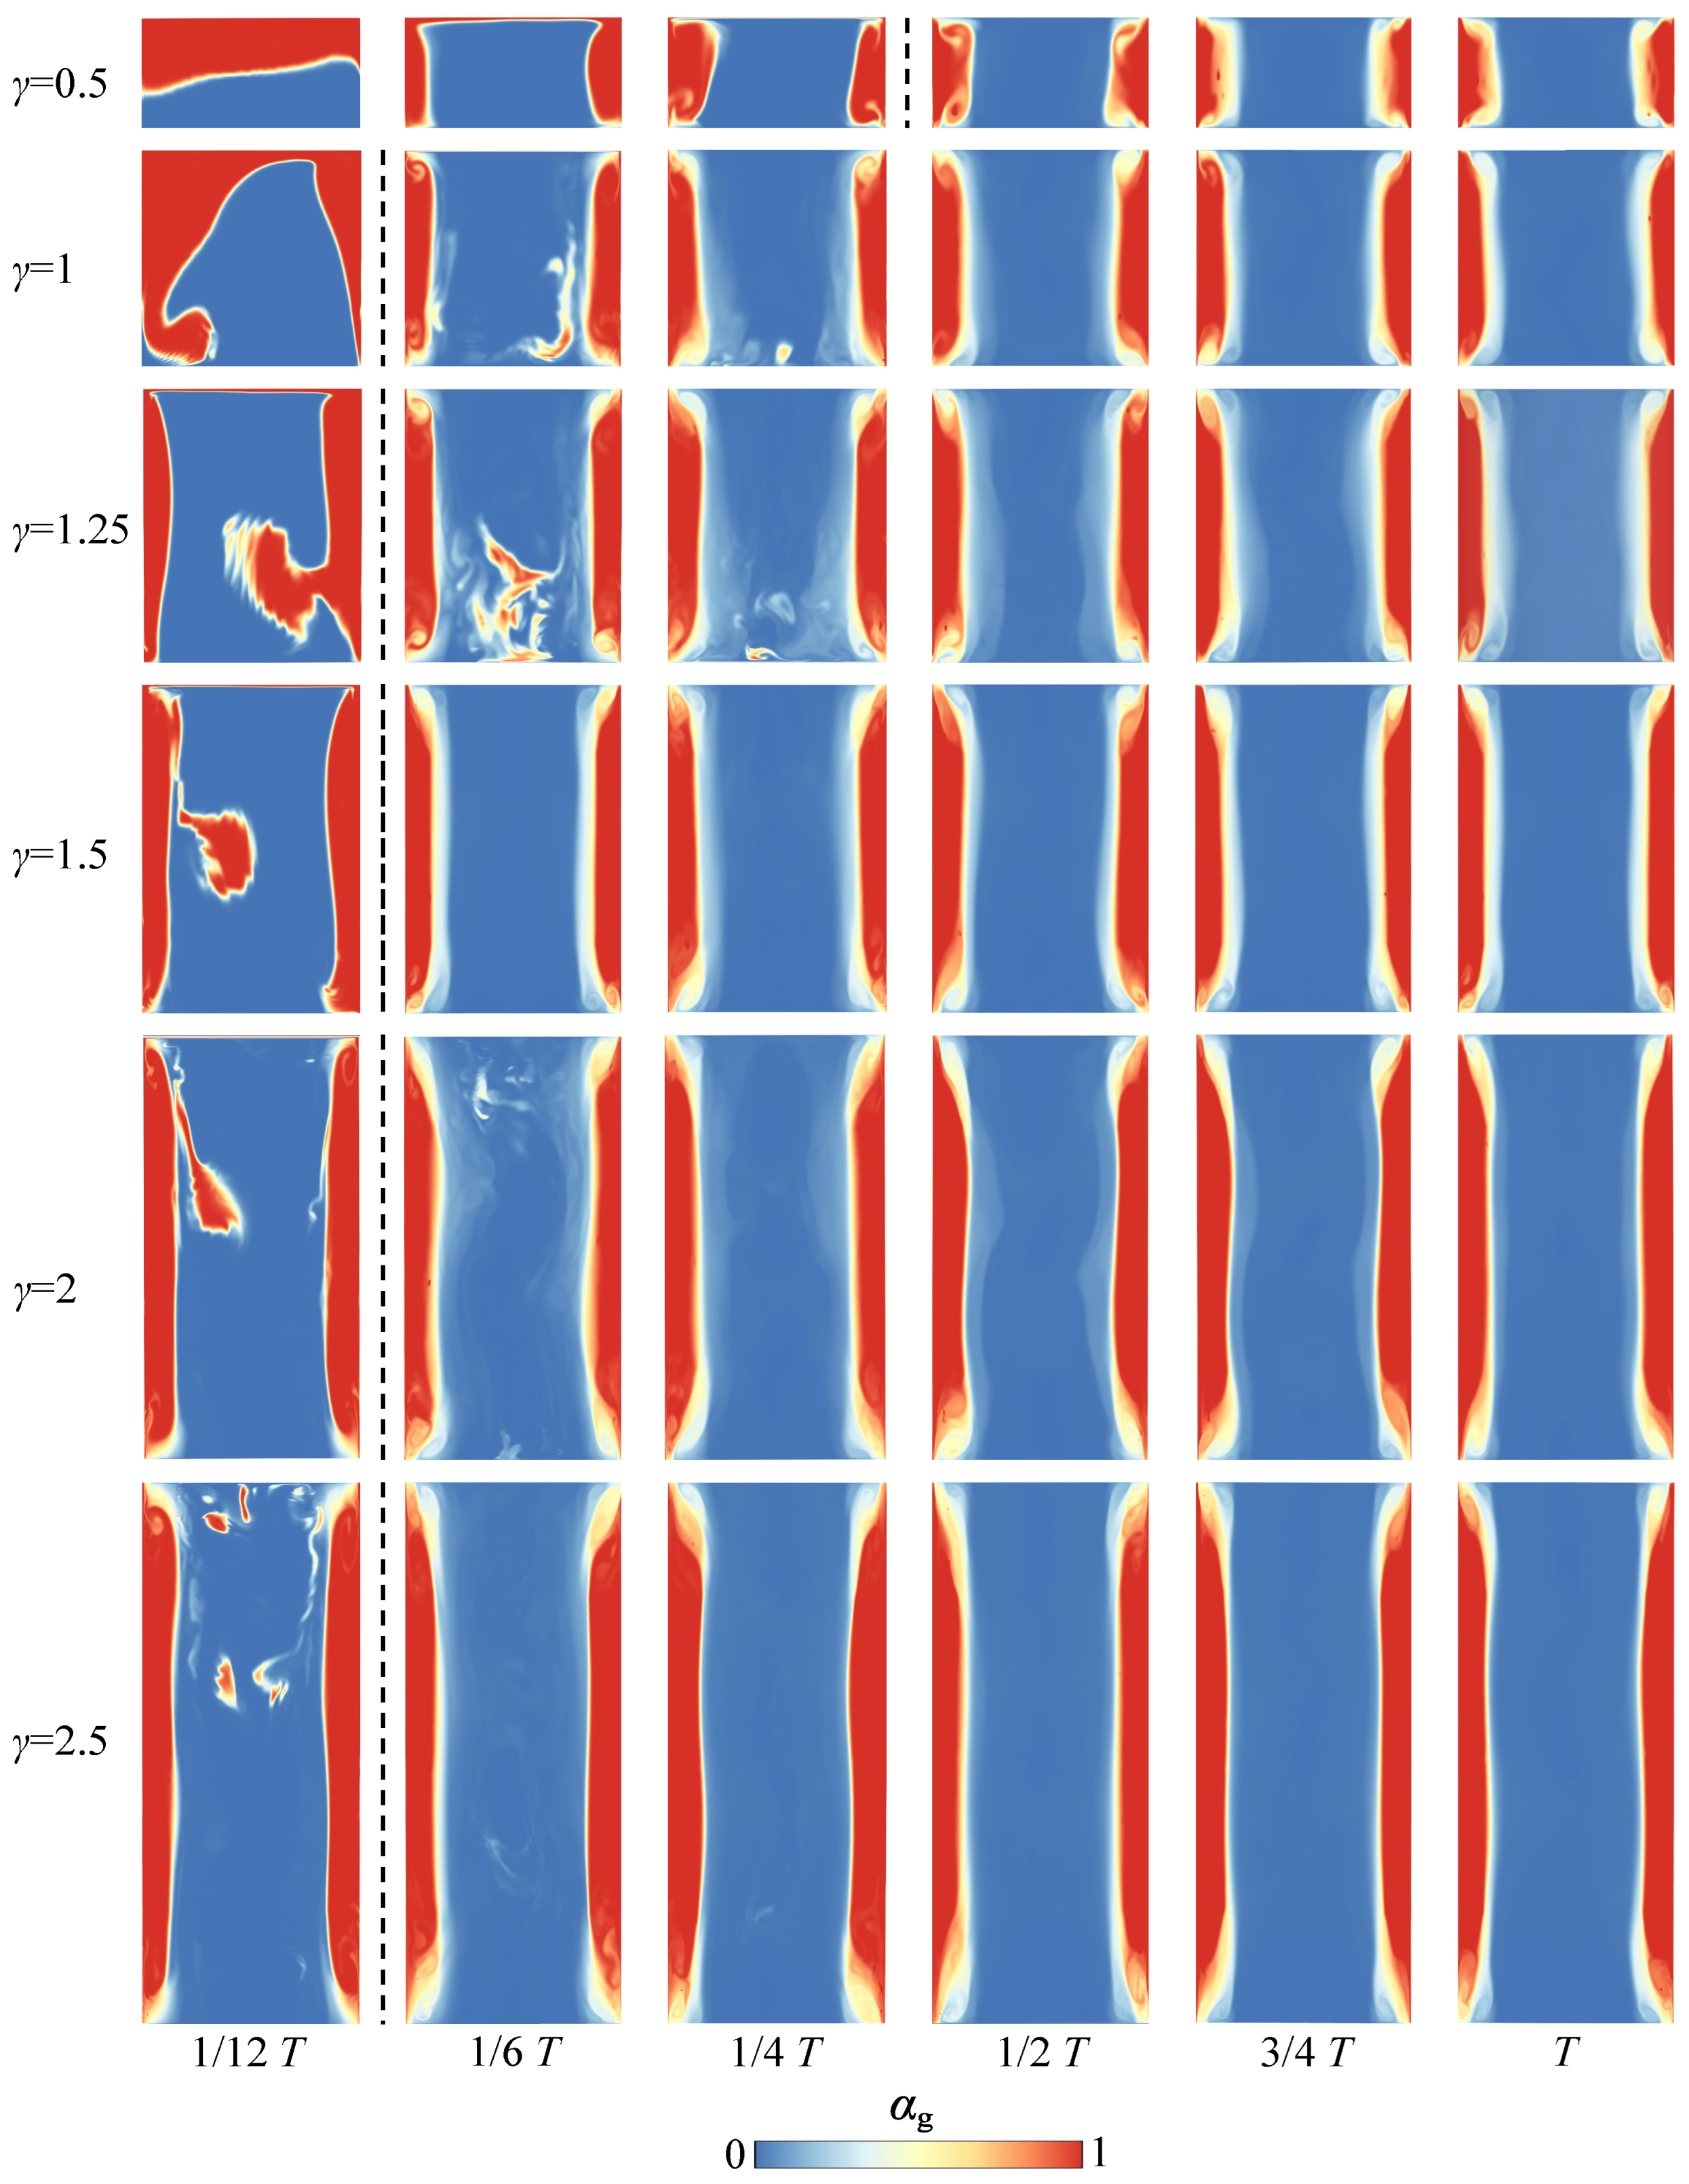
To better understand the interface evolution within different , we extracted the contours of volume fraction on the central cross-section accordingly, as shown in Figure 9. In each case, the red- and blue-colored regions represent the glycerol and water, respectively, indicating the non-mixing region. Meanwhile, yellow-colored regions represent the instant effective mixing region. In general, it was observed that the width of the mixing region gradually increased in time as the spin-up process went from to T. At ; the width of the mixing region increased first and then decreased with the increase of . The width of the mixing region achieved a peak value at and had the smallest size at . The observations in Figure 9, are consistent with Figure 8. Again, the results show that Model C has a relatively better mixing performance than the other five models.
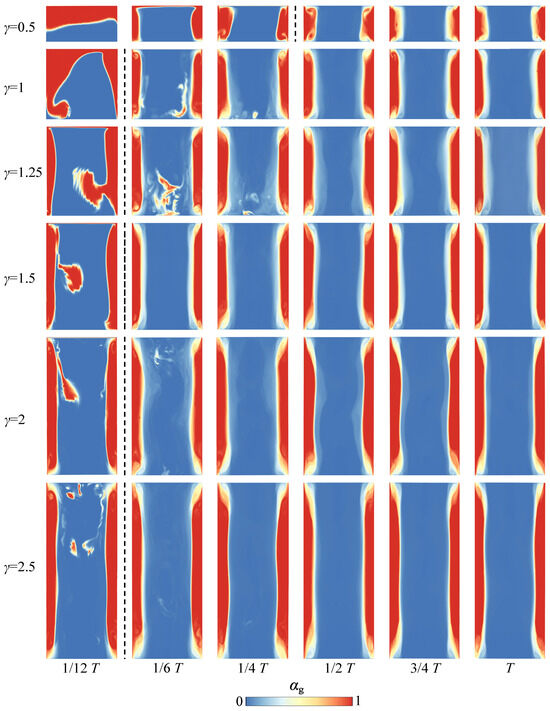
Figure 9.
Contours of versus t of different at different instants.
3.2. Vortex Development
In a mixing system, vortex formation and development play a key role in the mixing performance [33]. In a spin-up cylinder, the vortex makes the fluid produce a strong circular motion, breaking the original state of the fluid to promote the heat and mass transfer of fluid elements at multiple scales [34]. In this work, the vortex structure is present by the Q-criterion,
where is the vortex tensor, S is the shear rate tensor, is the square of the Frobenius paradigm of the matrix [35], and it is generally accepted that the region of characterizes the vortex-producing region, and the magnitude of the Q measures the vortex strength [36,37].
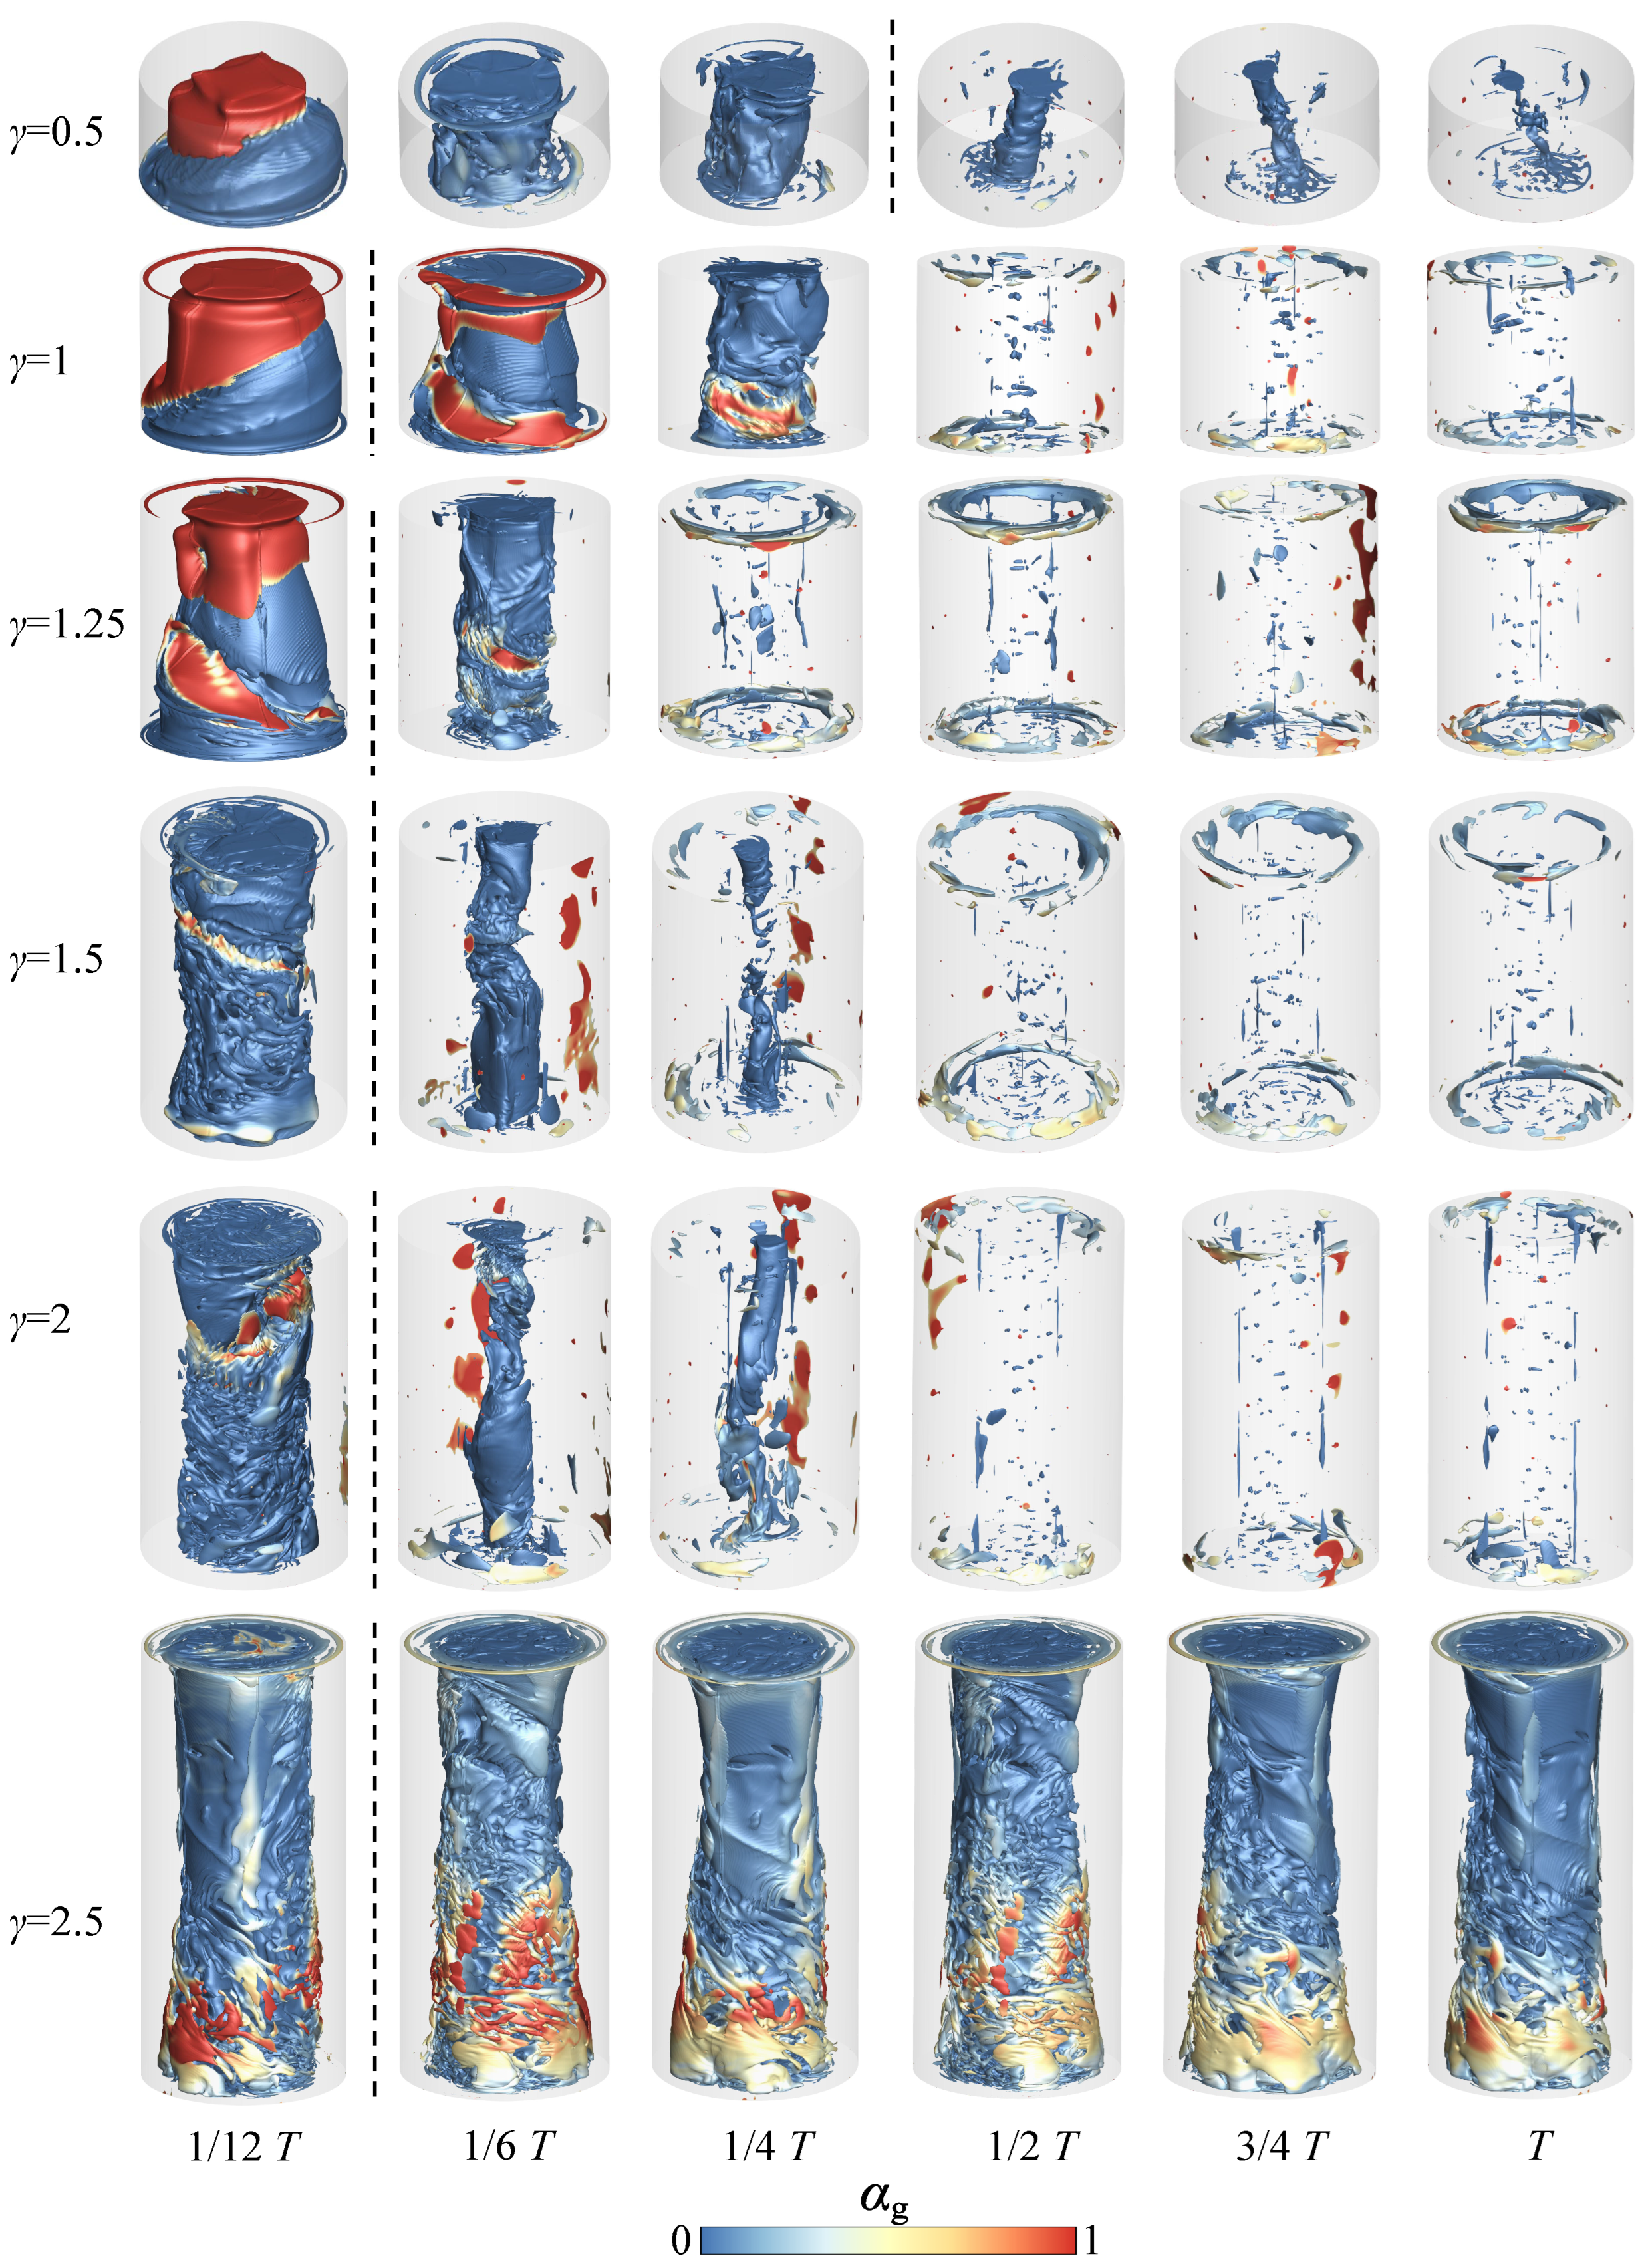
Figure 10 shows the time variation in isosurfaces for different , colored by value. As the cylinder rotates, a large velocity gradient is generated between the fluid attaching to the cylinder wall and the bulk fluid, promoting vortex generation. On the other hand, due to differences in viscosity and density, the volumetric size at the upper half (glycerol phase) is smaller than the bottom half (water phase).
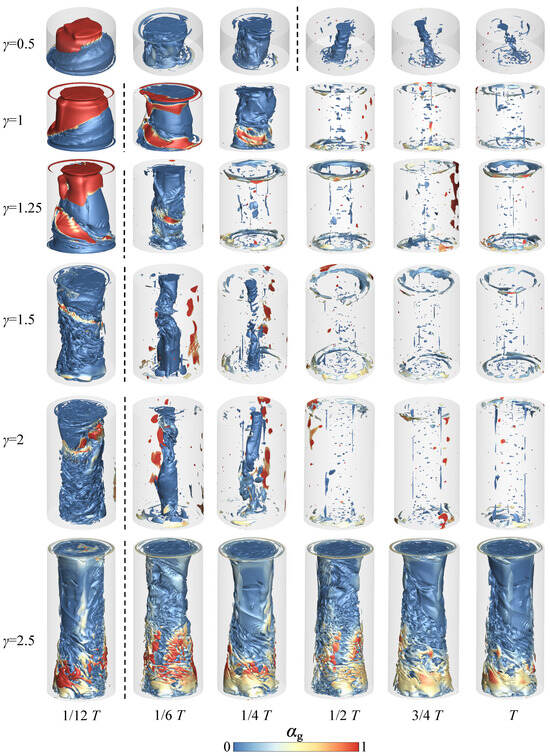
Figure 10.
Contours of volume fractions of glycerol on the surfaces at different times.
In Figure 10, the vortex structure also contracts further towards the center of the cylinder as the spin-up process develops in time, as seen for Models A–F. It was observed that the vortex structure of Model () broke into smaller fragments faster than other models. Although the other cases followed a similar evolutionary process, Model C had a greater degree of accumulation in time and introduced better mixing performance. At , the vortex structure of Model F () occupied the largest portion of volume inside the cylinder, while Model C had the smallest vortex size. In total, the cases with small or big values (e.g., Models A and F) had slow vortex development and dissipation, suppressing the mixing performance inside the container.
The turbulent dissipation rate was computed via Equation (8) and is tabulated in Table 3. It is demonstrated that the turbulent dissipation rate exhibits a strong correlation with the mixing performance [38,39]. The models with a higher average turbulent kinetic energy dissipation rate generally demonstrated better mixing performance. Smaller-scale eddies suggest a more efficient dissipation of turbulent kinetic energy, thereby enhancing mixing efficiency. Furthermore, the continuous generation and fragmentation of vortical structures induces chaotic flow conditions, which amplifies the interfacial contact area between the two phases. The stochastic motion of fluid particles further augments the homogenization process.
Table 3.
Parameters at T.
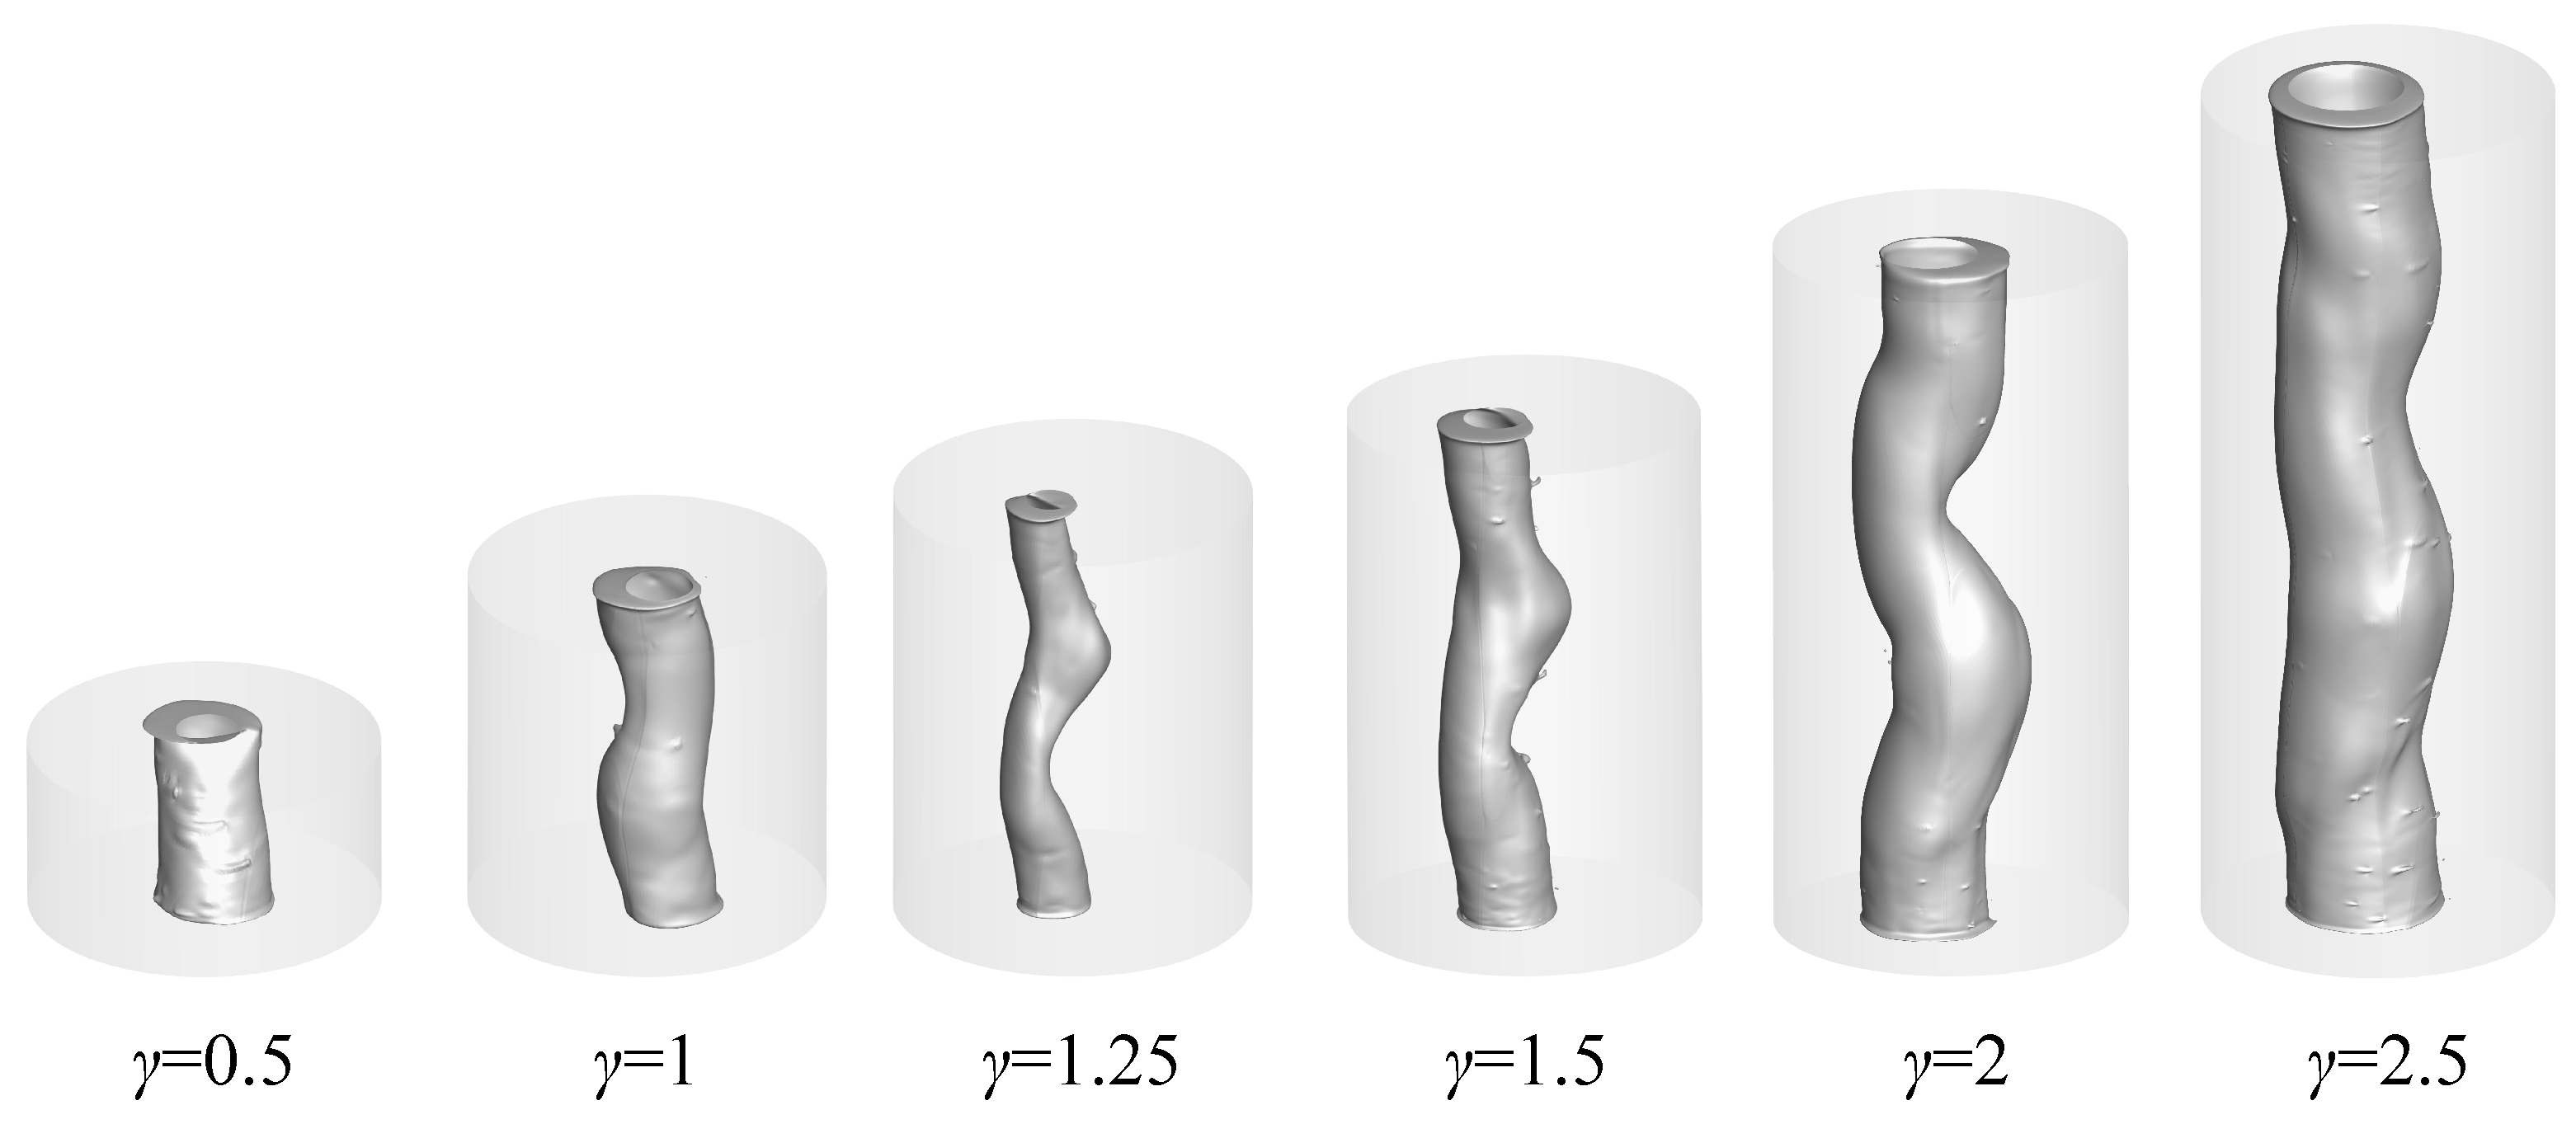
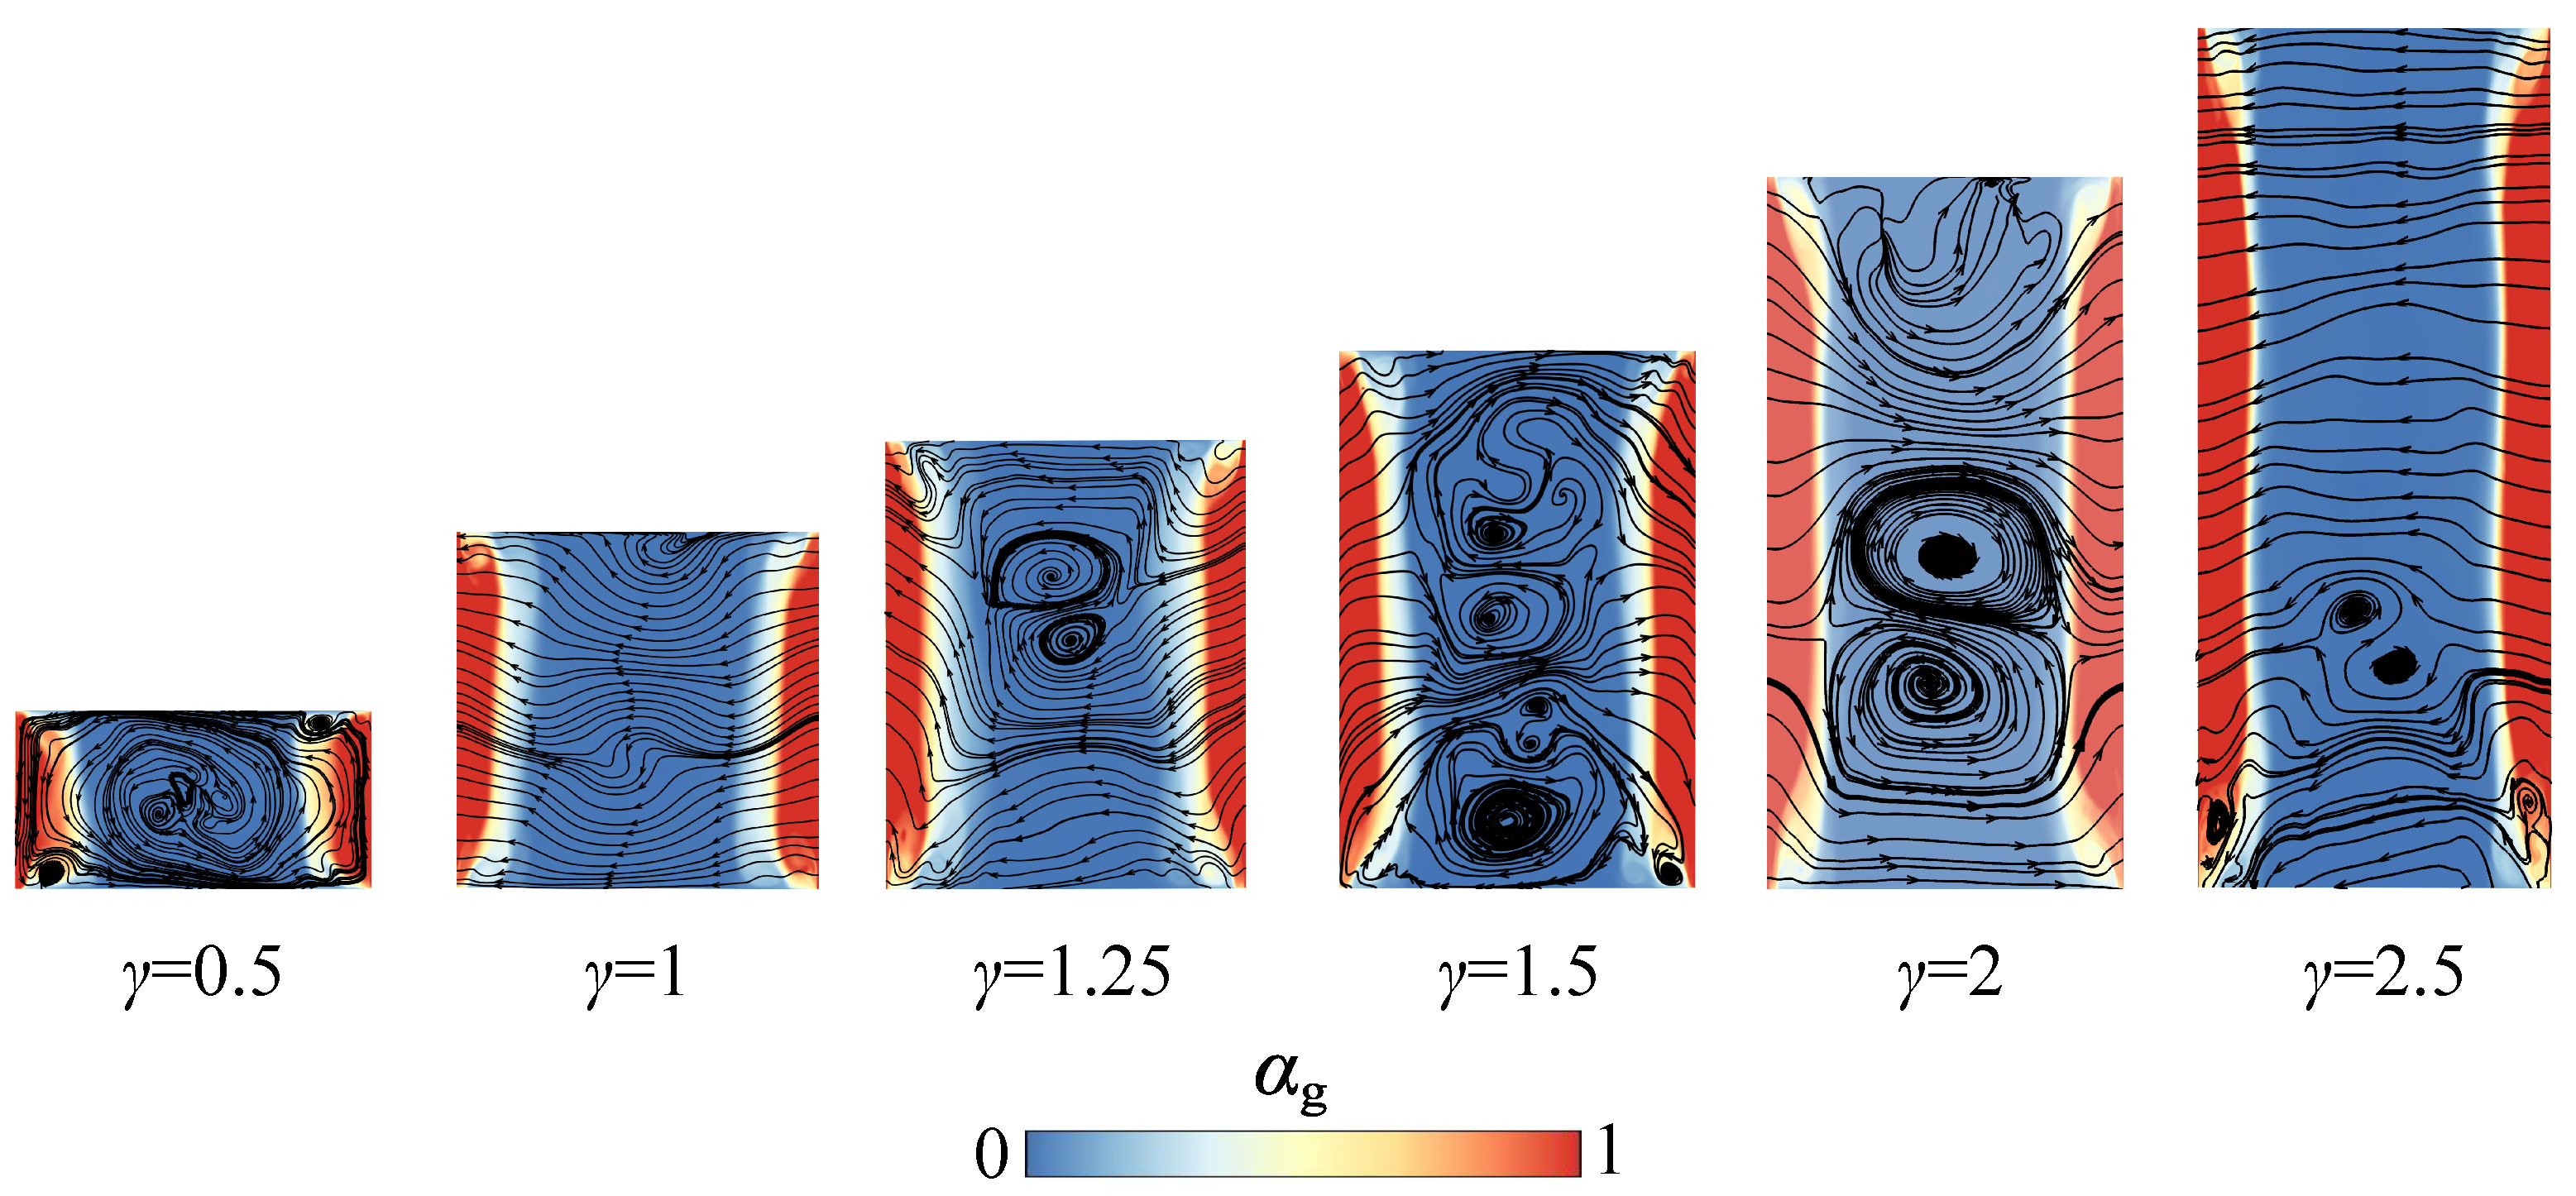
Furthermore, we defined a low-velocity region () to better understand the vortex evolution and mixing performance [5,10]. As shown in Figure 11, the isosurface of at time of is illustrated for Models A–F. Combined with Figure 8, Figure 11 shows that the low-velocity region is always in the center region (water phase mainly) of the cylinder, limiting the mixing of the two phases. As the value increases from 0.5 to 1.25, the low-velocity region undergoes obvious tilting and twisting. Figure 12 shows the streamlines and dimensionless velocity contours of the central longitudinal section of the cylinders in Modes A–F at T. It is obvious that several strong spiral vortexes form in the central area of the cylinder. At the same time, the volumetric portion of the low-velocity region decreases, and chaotic convection region increases to promote the mixing performance. With the increase in from 1.25 to 2.5, the degree of distortion in the low-velocity region is gradually weakened, and the mixing performance is subsequently reduced.
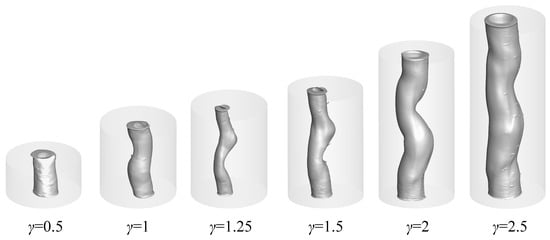
Figure 11.
Low-velocity isosurface () at .
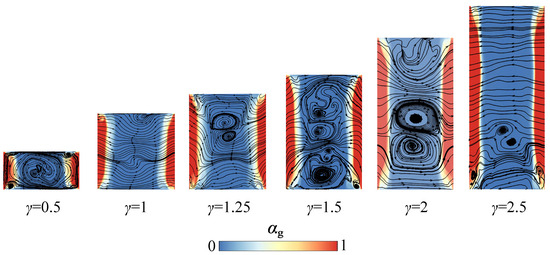
Figure 12.
Streamline in central longitudinal section of cylinders at .
3.3. Mixing Performance
In this study, the mixing performance was evaluated by a standard deviation approach, namely mixing index , and is expressed as follows [9,40,41]:
where is the volumetric fraction of glycerol at each cell in the field, N is the number of statistical cells in the cylinder, and is the expected volumetric fraction of glycerol, which is 0.5 in our study.
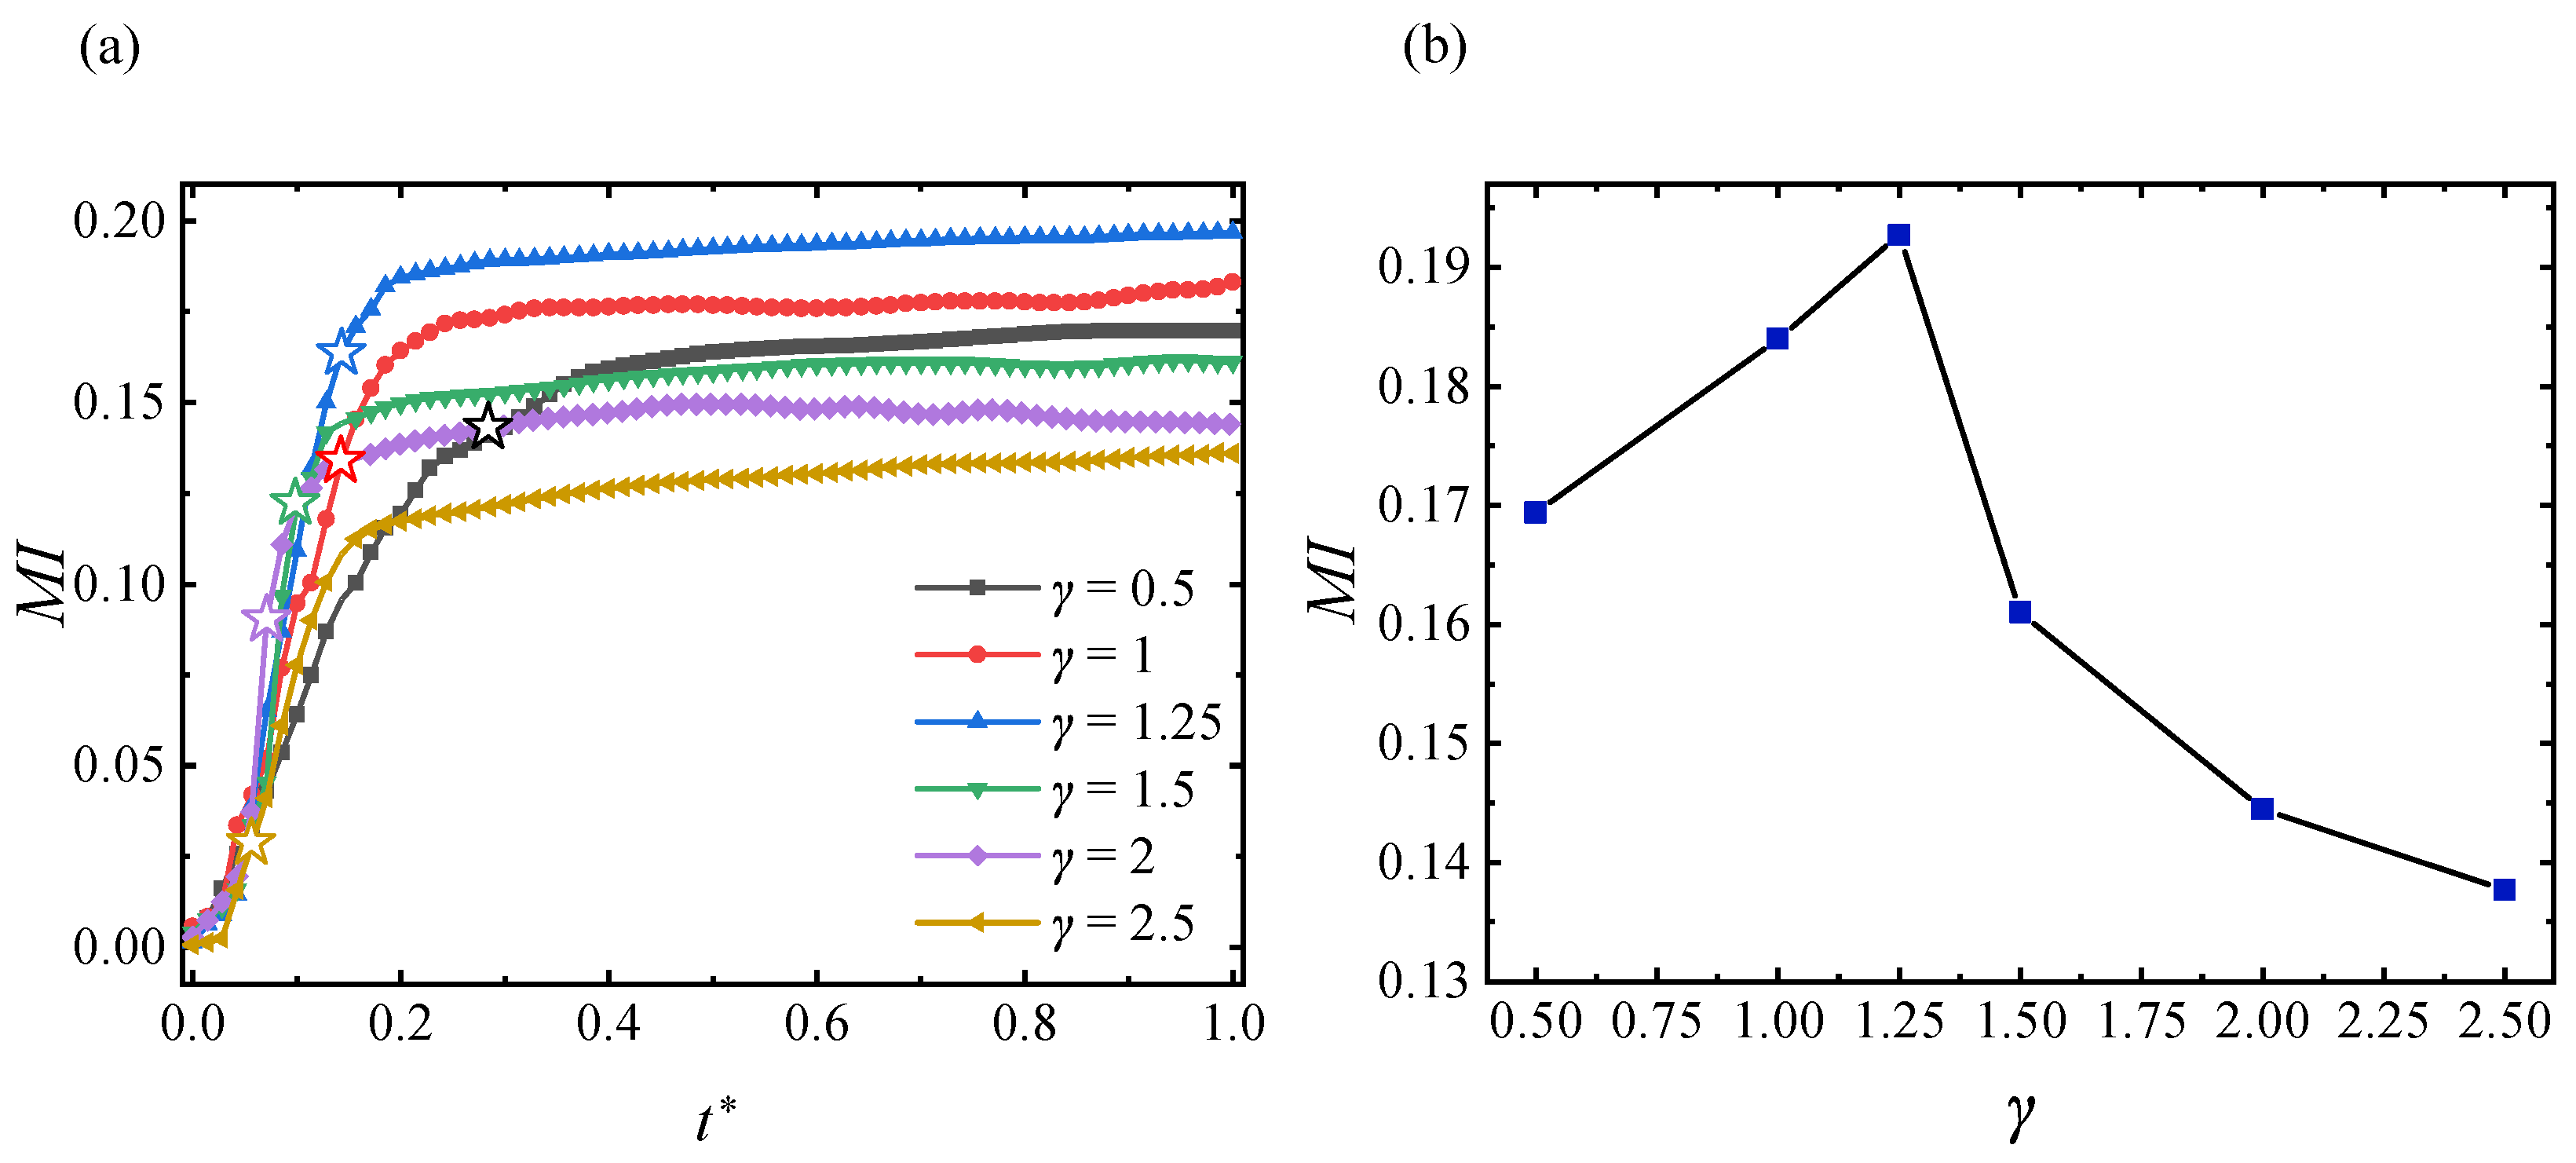
The time variation in the mixing index for different cylinders during the spin-up processes is shown in Figure 13a, where and the hollow star on every curve represent the moments. The results show that the mixing index increases rapidly in the range of for Models A–F. After , the continues to increase as the cylinder rotation reaches a steady speed , proving the phase lag between container acceleration time and bulk flow spin-up period T, as we emphasized in the aforementioned sections. Figure 13b shows a comparison of after the spin-up process for all cases. In the range of , the increases with the increase in the aspect ratio, within a peak value of 0.196 at . In contrast, in range of the decreases with the increasing aspect ratio, . In total, Model C again shows a better mixing performance than the other five models.
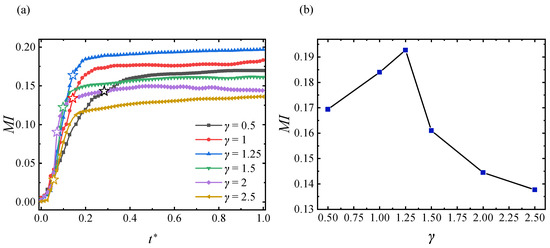
Figure 13.
(a) The profile of different (b); the at of different .
4. Conclusions
Unlike most prior studies that focused on steady-state mixing, our work addresses the transient spin-up phase of two fluids. The transient spin-up phase, which is the period when the fluids experience a change in rotational speed during the start of the mixing process, is critical for understanding how the fluids respond to rotational acceleration in terms of flow patterns, mixing efficiency, and energy dissipation. Specifically, this study investigates the geometric effect of aspect ratio () on the mixing performance of two miscible fluids (water and glycerol) in a planetary centrifugal mixer (PCM) during the spin-up process. Using numerical simulations with OpenFOAM’s interMixingFoam solver and large eddy simulation (LES), the interface structures, vortex deformation, and concentration fields in cylinders were analyzed with aspect ratios ranging from 0.5 to 2.5. Some key findings and conclusions are as follows:
- The configurations with smaller aspect ratios (e.g., ) or larger ones (e.g., ) relatively suppress the vortex development and mixing efficiency.
- The mixing performance reaches a peak value at , with a of 0.196 at the end of spin-up. This geometric configuration introduces intense vortex fragmentation, obvious interface shrinking, small low-velocity regions, and strong chaotic convection.
- The correlation between vortex dissipation, interface collapse, and low-velocity regions was elucidated. At , intense vortex fragmentation and minimal low-velocity regions promote interfacial stretching, enhancing turbulent energy dissipation (average ).
This study concludes that Model C () had the best mixing performance among our six designed aspect ratios, providing critical insight for the more effective control of mixing performance and guiding the design of PCMs in actual engineering production. This geometric design is especially applicable in scenarios where the rapid and efficient mixing of miscible fluids with viscosity or density contrasts is required, such as in the fields of pharmaceuticals, polymer synthesis, and food processing. By implementing this geometry, manufacturers can enhance chaotic convection and minimize low-velocity regions, consequently improving energy efficiency and product uniformity. However, for larger PCMs, scaling future work should validate this by coupling our numerical framework with scale-up experiments, as inertial and viscous forces may introduce secondary effects in industrial-sized systems. Furthermore, the in-depth mechanism of the turbulent kinetic energy dissipation rate and mixing effect during the interface instability stage in the spin-up process will be elaborated in another paper.
Author Contributions
Conceptualization, L.L.; methodology, X.L.; software, L.Q.; validation, L.Q., X.L. and H.H.; formal analysis, H.H. and X.Y.; investigation, L.Q., H.H. and X.Y.; resources, L.Q. and J.L.; data curation, X.Y. and Y.Z.; writing—original draft preparation, L.Q. and H.H.; writing—review and editing, J.L. and Y.Z.; visualization, Y.Z. and X.Y.; supervision, L.L. and J.L.; project administration, L.L. and J.L. All authors have read and agreed to the published version of the manuscript.
Funding
This research was partially funded by the China Postdoctoral Science Foundation (2022M711766).
Data Availability Statement
The data that support the findings of this study are available from the corresponding authors upon reasonable request.
Conflicts of Interest
The authors declare no conflict of interest.
Appendix A. Numerical Validation with Literature
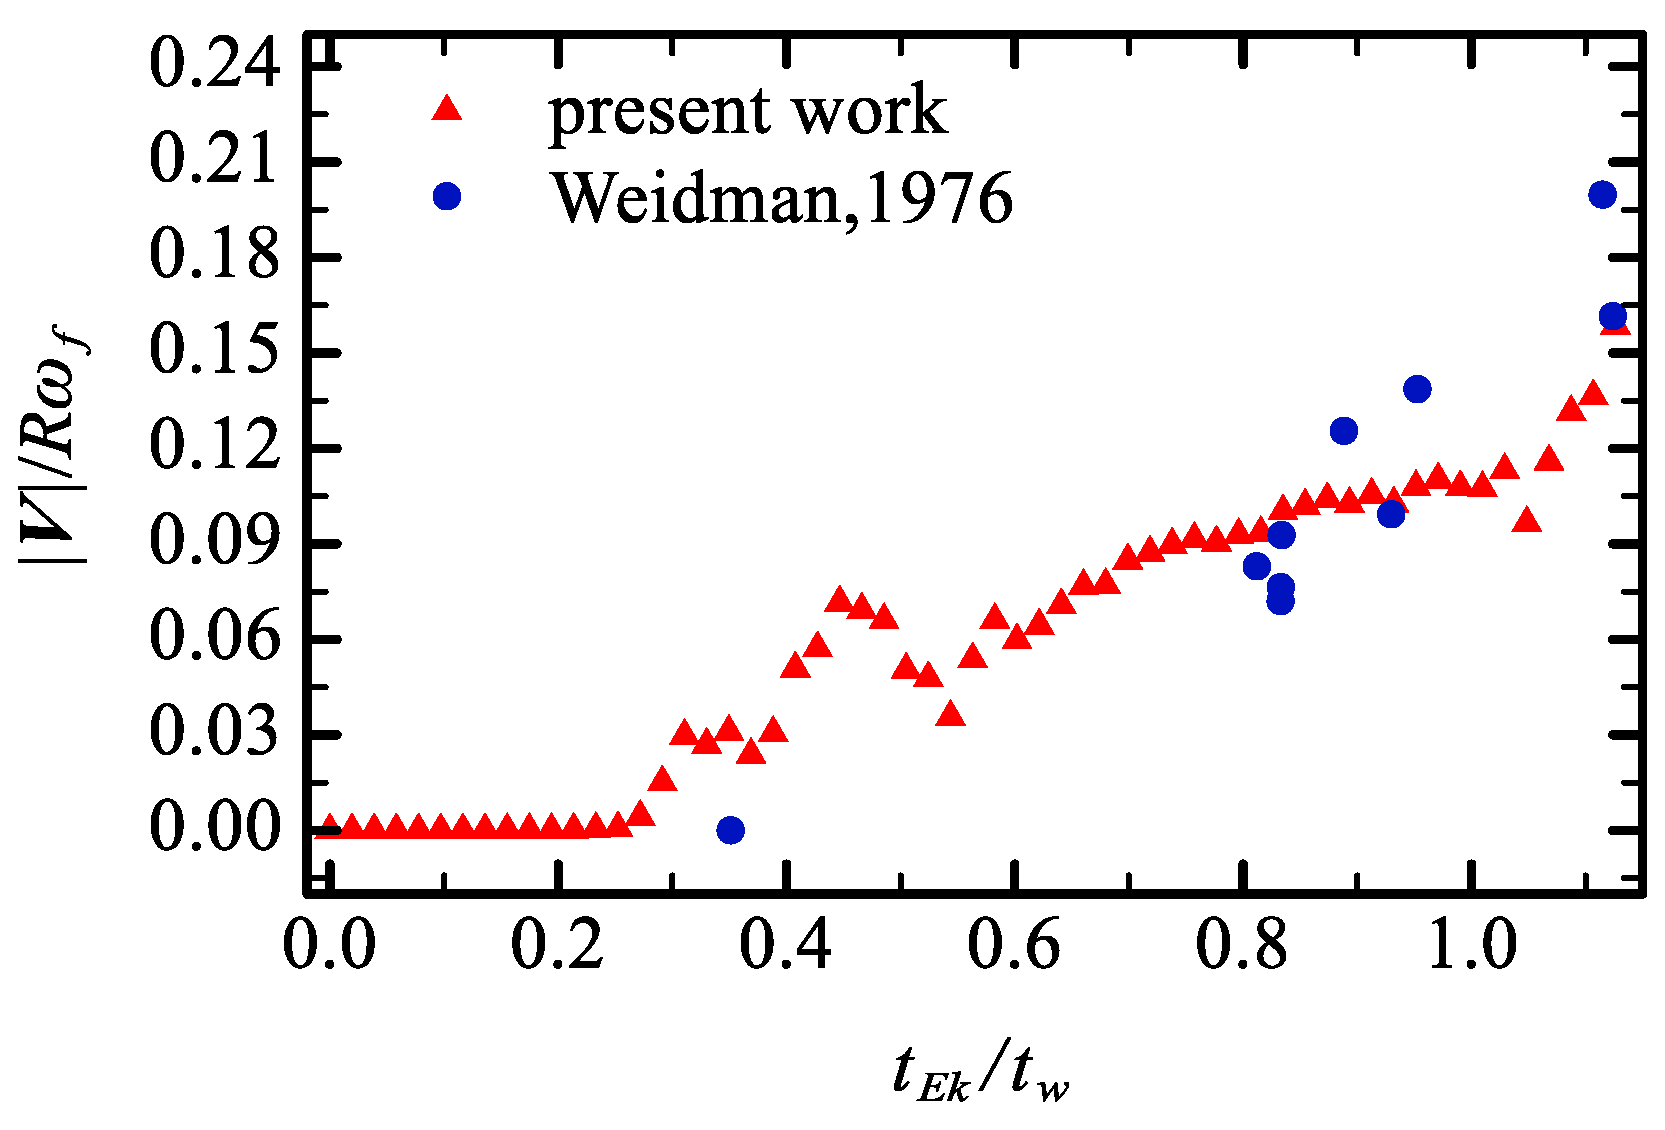
The following parameters were calculated by dimensionless numbers in the Weidman’s experiment [32], the angular acceleration of the rotation is , the acceleration time is , the fluid density , dynamic viscosity . The cylindrical geometry is characterized by a radius of m and aspect ratio , with the computational mesh generated following the methodology described in Section 2.2. Definition , , Ekman start time , with rotate from rest. The fluid velocity magnitude was monitored at . An excellent agreement between the our simulation results and Weidman’s results is observed, as shown in Figure A1, proving the rationality of numerical methodologies adopted in our current study.

Figure A1.
Comparison of profile with Widman’s work [32].
Figure A1.
Comparison of profile with Widman’s work [32].
References
- Son, K.J. A numerical study of the influence of rheology of cohesive particles on blade-free planetary mixing. Korea-Aust. Rheol. J. 2018, 30, 199–209. [Google Scholar] [CrossRef]
- Son, K.J. A numerical study of the influence of operating conditions of a blade-free planetary mixer on blending of cohesive powders. Korea-Aust. Rheol. J. 2019, 31, 15–23. [Google Scholar] [CrossRef]
- Peerhossaini, H. Effects of turbulent mixing and orbitally shaking on cell growth and biomass production in active fluids. Am. J. Biomed. Sci. Res. 2022, 15, 396–404. [Google Scholar] [CrossRef]
- Yamagata, T.; Sugisawa, H.; Fujisawa, N. Experimental study on laminar mixing in planetary mixer. Exp. Fluids 2021, 62, 28. [Google Scholar] [CrossRef]
- Yamagata, T.; Fujisawa, N. Effect of rotation and revolution on performance of blade-free planetary mixer. J. Flow Cont. Meas. Vis. 2019, 7, 1–10. [Google Scholar] [CrossRef]
- Weheliye, W.; Ducci, A.; Weheliye, W.; Yianneskis, M.; Ducci, A. PIV measurements in a shaken cylindrical bioreactor. In Proceedings of the 16th International Symposium on Applications of Laser Techniques to Fluid Mechanics, Lisbon, Portugal, 9–12 July 2012; pp. 9–12. [Google Scholar]
- Chergui, N.; Lateb, M.; Lacroix, É.; Dufresne, L. CFD study of flow dynamics in a blade free planetary mixer (BFPM)—A qualitative flow study. Chem. Eng. Res. Des. 2015, 102, 100–115. [Google Scholar] [CrossRef]
- Shen, B.; Zhan, X.; He, Y.; Sun, Z.; Long, J.; Yang, Y.; Li, X. Computational fluid dynamic analysis of mass transfer and hydrodynamics in a planetary centrifugal bioreactor. Korean J. Chem. Eng. 2021, 38, 1358–1369. [Google Scholar] [CrossRef]
- Shen, B.; Zhan, X.; Sun, Z.; He, Y.; Long, J.; Li, X. Piv experiments and CFD simulations of liquid-liquid mixing in a planetary centrifugal mixer (PCM). Chem. Eng. Sci. 2022, 259, 117764. [Google Scholar] [CrossRef]
- Wang, G.; Liu, C.; Li, X.; Lou, J.; Li, J. Numerical study on influence of material characteristics on mixing performance of planetary centrifugal mixer. J. Mech. Electr. Eng 2022, 39, 627–633. [Google Scholar]
- Kaiser, F.; Wahl, T.; Gatti, D.; Rival, D.E.; Kriegseis, J. Vorticity propagation for spin-up and spin-down in a rotating tank. In Proceedings of the 18th International Symposium on the Application of Laser and Imaging Techniques to Fluid Mechanics, Lisbon, Portugal, 4–7 July 2016. [Google Scholar]
- Hewitt, R.E.; Foster, M.R.; Davies, P.A. Spin-up of a two-layer rotating stratified fluid in a variable-depth container. J. Fluid Mech. 2001, 438, 379–407. [Google Scholar] [CrossRef]
- Benton, E.R. Vorticity dynamics in spin-up from rest. Phys. Fluids 1979, 22, 1250–1251. [Google Scholar] [CrossRef]
- Park, J.S.; Hyun, J.M. Review on open-problems of spin-up flow of an incompressible fluid. J. Mech. Sci. Technol. 2008, 22, 780–787. [Google Scholar] [CrossRef]
- Greenspan, H.P.; Howard, L.N. On a time-dependent motion of a rotating fluid. J. Fluid Mech. 1963, 17, 385–404. [Google Scholar] [CrossRef]
- Meunier, P.; Hourigan, K. Mixing in a vortex breakdown flow. J. Fluid Mech. 2013, 731, 195–222. [Google Scholar] [CrossRef]
- Eloy, C.; Gal, P.L.; Dizés, S.L. Elliptic and triangular instabilities in rotating cylinders. J. Fluid Mech. 2003, 476, 357–388. [Google Scholar] [CrossRef]
- Ferreira, A.G.; Egas, A.P.; Fonseca, I.M.; Costa, A.C.; Abreu, D.C.; Lobo, L.Q. The viscosity of glycerol. J. Chem. Thermodyn. 2017, 113, 162–182. [Google Scholar] [CrossRef]
- Takamura, K.; Fischer, H.; Morrow, N.R. Physical properties of aqueous glycerol solutions. J. Petrol. Sci. Eng. 2012, 98–99, 50–60. [Google Scholar] [CrossRef]
- OpenCFD Limited. OpenFOAM The Open Source CFD Toolbox Tutorial Guide; OpenCFD Limited: Bracknell, UK, 2024; pp. 16–40. [Google Scholar]
- Manninen, M.; Taivassalo, V.; Energy, V.; Kallio, S. On the Mixture Model for Multiphase Flow; Altion Teknillinen Tutkimuskeskus: Espoo, Finland, 1996; pp. 16–48. [Google Scholar]
- Hernandez-Perez, V.; Abdulkadir, M.; Azzopardi, B.J. Grid generation issues in the cfd modelling of two-phase flow in a pipe. J. Comput. Multiph. Flows 2011, 3, 13–26. [Google Scholar] [CrossRef]
- Nishijima, Y.; Oster, G. Diffusion in Glycerol-Water Mixture. Bull. Chem. Soc. Jpn. 1960, 33, 1649–1651. [Google Scholar] [CrossRef]
- Hemmingsen, C.S.; Ingvorsen, K.M.; Mayer, S.; Walther, J.H. LES And URANS simulations of the swirling flow in a dynamic model of a uniflow-scavenged cylinder. Int. J. Heat Fluid Flow 2016, 62, 213–223. [Google Scholar] [CrossRef]
- Markatos, N.C. The mathematical modelling of turbulent flows. Appl. Math. Model. 1986, 10, 190–220. [Google Scholar] [CrossRef]
- Nicoud, F.; Ducros, F. Subgrid-scale stress modelling based on the square of the velocity gradient tensor. Flow Turbul. Combust. 1999, 62, 183–200. [Google Scholar] [CrossRef]
- Rashkovan, A.; Amar, S.D.; Bieder, U.; Ziskind, G. Analysis of polygonal vortex flows in a cylinder with a rotating bottom. Appl. Sci. 2021, 11, 1348. [Google Scholar] [CrossRef]
- Hirt, C.W.; Nichols, B.D. Volume of fluid (VOF) method for the dynamics of free boundaries. J. Comput. Phys. 1981, 39, 201–225. [Google Scholar] [CrossRef]
- Shang, Z.; Emerson, D.R.; Gu, X. Numerical investigations of cavitation around a high speed submarine using OpenFOAM with les. Int. J. Comput. Methods 2012, 9, 1250040. [Google Scholar] [CrossRef]
- Shang, Z. Numerical investigations of supercavitation around blunt bodies of submarine shape. Appl. Math. Model. 2013, 37, 8836–8845. [Google Scholar] [CrossRef]
- Naumov, I.V.; Sharifullin, B.R.; Tsoy, M.A.; Shtern, V.N. Dual vortex breakdown in a two-fluid confined flow. Phys. Fluids 2020, 32, 061706. [Google Scholar] [CrossRef]
- Weidman, P.D. On the spin-up and spin-down of a rotating fluid. Part 2. Measurements and stability. J. Fluid Mech. 1976, 77, 709–735. [Google Scholar] [CrossRef]
- Eisenga, A.H.; Verzicco, R.; Heijst, G.J.V. Dynamics of a vortex ring moving perpendicularly to the axis of a rotating fluid. J. Fluid Mech. 1998, 354, 69–100. [Google Scholar] [CrossRef]
- Pacheco, J.R.; Verzicco, R. Formation of columnar baroclinic vortices in thermally stratified nonlinear spin-up. J. Fluid Mech. 2012, 702, 265–285. [Google Scholar] [CrossRef]
- Han, H.; Geng, D.; Qian, Z.; Ren, Z.; Zuo, Z.; Liu, S. On cavitation caused by tip clearance of a flat-plate hydrofoil. Phys. Fluids 2024, 36, 113345. [Google Scholar] [CrossRef]
- Zhan, J.M.; Li, Y.T.; Wai, W.H.O.; Hu, W.Q. Comparison between the q criterion and rortex in the application of an in-stream structure. Phys. Fluids 2019, 31, 121701. [Google Scholar] [CrossRef]
- Yu, Y.; Shrestha, P.; Alvarez, O.; Nottage, C.; Liu, C. Investigation of correlation between vorticity, Q, λci, λ2, Δ and liutex. Comput. Fluids 2021, 225, 104977. [Google Scholar] [CrossRef]
- Ijichi, T.; St. Laurent, L.; Polzin, K.L. How Variable Is Mixing Efficiency in the Abyss? Geophys. Res. Lett. 2020, 47, e2019GL086813. [Google Scholar] [CrossRef]
- Klema, M.R.; Venayagamoorthy, S.K. Mixing rates in stably stratified flows with respect to the turbulent froude number and turbulent scales. Environ. Fluid Mech. 2023, 23, 1037–1049. [Google Scholar] [CrossRef]
- Qin, L.; Lu, X.; Li, L.; Han, H.; Yan, X.; Chen, S.; Wang, H.; Ma, W. Optimization of G1 micromixer structure in two-fluid mixing based on CFD and response surface methodology. Processes 2024, 12, 122. [Google Scholar] [CrossRef]
- Samancoğlu, U.E.; Koşar, A.; Cetkin, E. Optimization of y-shaped micro-mixers with a mixing chamber for increased mixing efficiency and decreased pressure drop. Asme J. Heat Mass Transf. 2024, 146, 043201. [Google Scholar] [CrossRef]

Disclaimer/Publisher’s Note: The statements, opinions and data contained in all publications are solely those of the individual author(s) and contributor(s) and not of MDPI and/or the editor(s). MDPI and/or the editor(s) disclaim responsibility for any injury to people or property resulting from any ideas, methods, instructions or products referred to in the content. |
© 2025 by the authors. Licensee MDPI, Basel, Switzerland. This article is an open access article distributed under the terms and conditions of the Creative Commons Attribution (CC BY) license (https://creativecommons.org/licenses/by/4.0/).