1. Introduction
Power cables, serving as the medium for electrical energy transmission, are widely utilized in power systems due to advantages such as compact footprint, high operational reliability, and excellent safety performance. According to the 2022 National Power Reliability Annual Report [
1], the total length of cable lines nationwide in 2022 reached 7088 km, with an urban cableization rate of 47.54% and an insulation rate of 71.03% for overhead lines. In some core urban areas, these rates exceed 90% (e.g., Beijing, Shanghai, Shenzhen, and Xiamen). As they are the lifeline of distribution networks, the reliability of power cables is crucial for ensuring urban electricity safety. Cable failures can lead to power supply interruptions, disrupting normal electricity usage, or even cause severe consequences such as fires or electric shock incidents, posing significant threats to personnel safety. Due to challenges in ensuring the quality and installation standards of distribution network cables, harsh operating conditions, and the fact that a majority of cables are entering the latter stages of their lifecycle, the failure rate of cables has been increasing rather than decreasing. This trend severely impacts the reliability of medium- and low-voltage distribution networks [
2]. Therefore, it is imperative to take preventive measures and implement early-stage fault characteristic monitoring for power cables.
During operation, faults in power cables can easily lead to insulation defects, which distort the internal electric field and result in partial discharge (PD) phenomena [
3]. PD is often used as a criterion for assessing whether a cable is experiencing early-stage faults. Partial discharge detection is an important means of active monitoring and defense in modern distribution networks. Through these detection methods, a modern distribution system can actively perceive the status of equipment, detect potential problems in advance, and take measures to deal with them, thus demonstrating its “initiative”. This initiative helps to improve the reliability and safety of the power grid and reduce the impact of equipment failures on the operation of the power grid. Existing PD detection methods are primarily categorized into offline and online monitoring. Offline detection is conducted when the equipment is powered down, which limits its practical application [
4]. In contrast, online detection evaluates the insulation performance of the power system without interrupting power supply. Due to its advantages in intelligence, real-time capability, and reliability, online detection has found widespread application [
5]. Traditional online detection methods include pulse current analysis, ultra-high-frequency (UHF) detection, and ultrasonic detection [
6]. Among these, UHF can capture extremely weak PD signals, which are then processed and represented graphically to facilitate the identification of PD fault types. Examples include Phase-Resolved Partial Discharge (PRPD) patterns [
7] and Phase-Resolved Pulse Sequence Analysis (PRPS) patterns [
8]. These graphical representations are crucial for detecting and diagnosing early-stage insulation issues in power equipment. Based on the principles of traditional PRPD pattern construction, Bi [
9] constructed three types of PRPD maps based on the traditional signal construction principles, namely the n-φ and q-φ two-dimensional spectra and the n-q-φ three-dimensional spectrum. Through systematic characterization of discharge patterns, this approach enabled the effective identification and classification of different discharge types. However, other traditional pattern recognition methods, such as threshold-based detection techniques, often fail to effectively handle complex partial discharge signals. Statistical analysis methods (e.g., Gaussian distribution fitting) and signal processing techniques (e.g., wavelet transform) typically rely on manual feature extraction, which may lead to misdiagnosis or missed detection, particularly in cases involving small sample sizes and significant noise interference [
10]. Consequently, traditional methods struggle to provide high accuracy and robustness in diagnosis and are also hindered by low efficiency, difficulties in feature extraction, and limited generalization ability.
With recent developments in deep learning technology, neural networks, particularly Convolutional Neural Networks (CNNs) and Recurrent Neural Networks (RNNs), have been widely applied in PD pattern recognition. X Peng et al. [
11] used CNN to perform pattern recognition on 3500 PD signals, showing that its recognition accuracy outperforms traditional support vector machines and backpropagation neural networks. MT Nguyen [
12], in 2018, applied Long Short-Term Memory (LSTM) networks for PD pattern diagnosis in gas-insulated switchgear, and the proposed model was able to capture important time-based features to improve classification accuracy. Lv F [
13] proposed a PD recognition method based on Generative Adversarial Networks (GANs) and CNNs, which can generate more stable and highly similar samples for training. Z Fei [
14] proposed an optimized Backpropagation Neural Network for partial discharge fault pattern recognition in switchgear. Z Li [
15] and Q Zheng [
16] both applied PD recognition algorithms based on CNN and LSTM, enhancing recognition performance by introducing attention mechanisms and dual-channel inputs, respectively. Beyond these two deep learning models, Google introduced the self-attention mechanism into the Transformer model. Unlike CNNs, which can only capture local features, Transformers can model dependencies across all positions in the input sequence. Additionally, the dynamic adjustment of attention weights enables the extraction of key information from images, making Transformers highly flexible and effective in pattern recognition tasks. As a result, Transformers have become a research hotspot and are now applied across various domains. C Liu [
17] combined CNNs with Swin Transformers to achieve real-time monitoring, precise localization, and severity classification. MA Alohali et al. [
18] proposed a method combining Swin Transformers, genetic algorithms, and random forests to improve the classification performance of cervical cancer cells in Pap images. However, research in the application of Transformer models in PD pattern recognition remains relatively limited, with only a few notable contributions. Notably, Y Zhang [
19] applied Transformer models in classifying atypical partial discharge pulse signal maps, achieving promising results, while Y Deng [
20] and S Zheng [
21] both referenced the Transformer architecture in their models to enhance the ability to capture key features in partial discharge spectra.
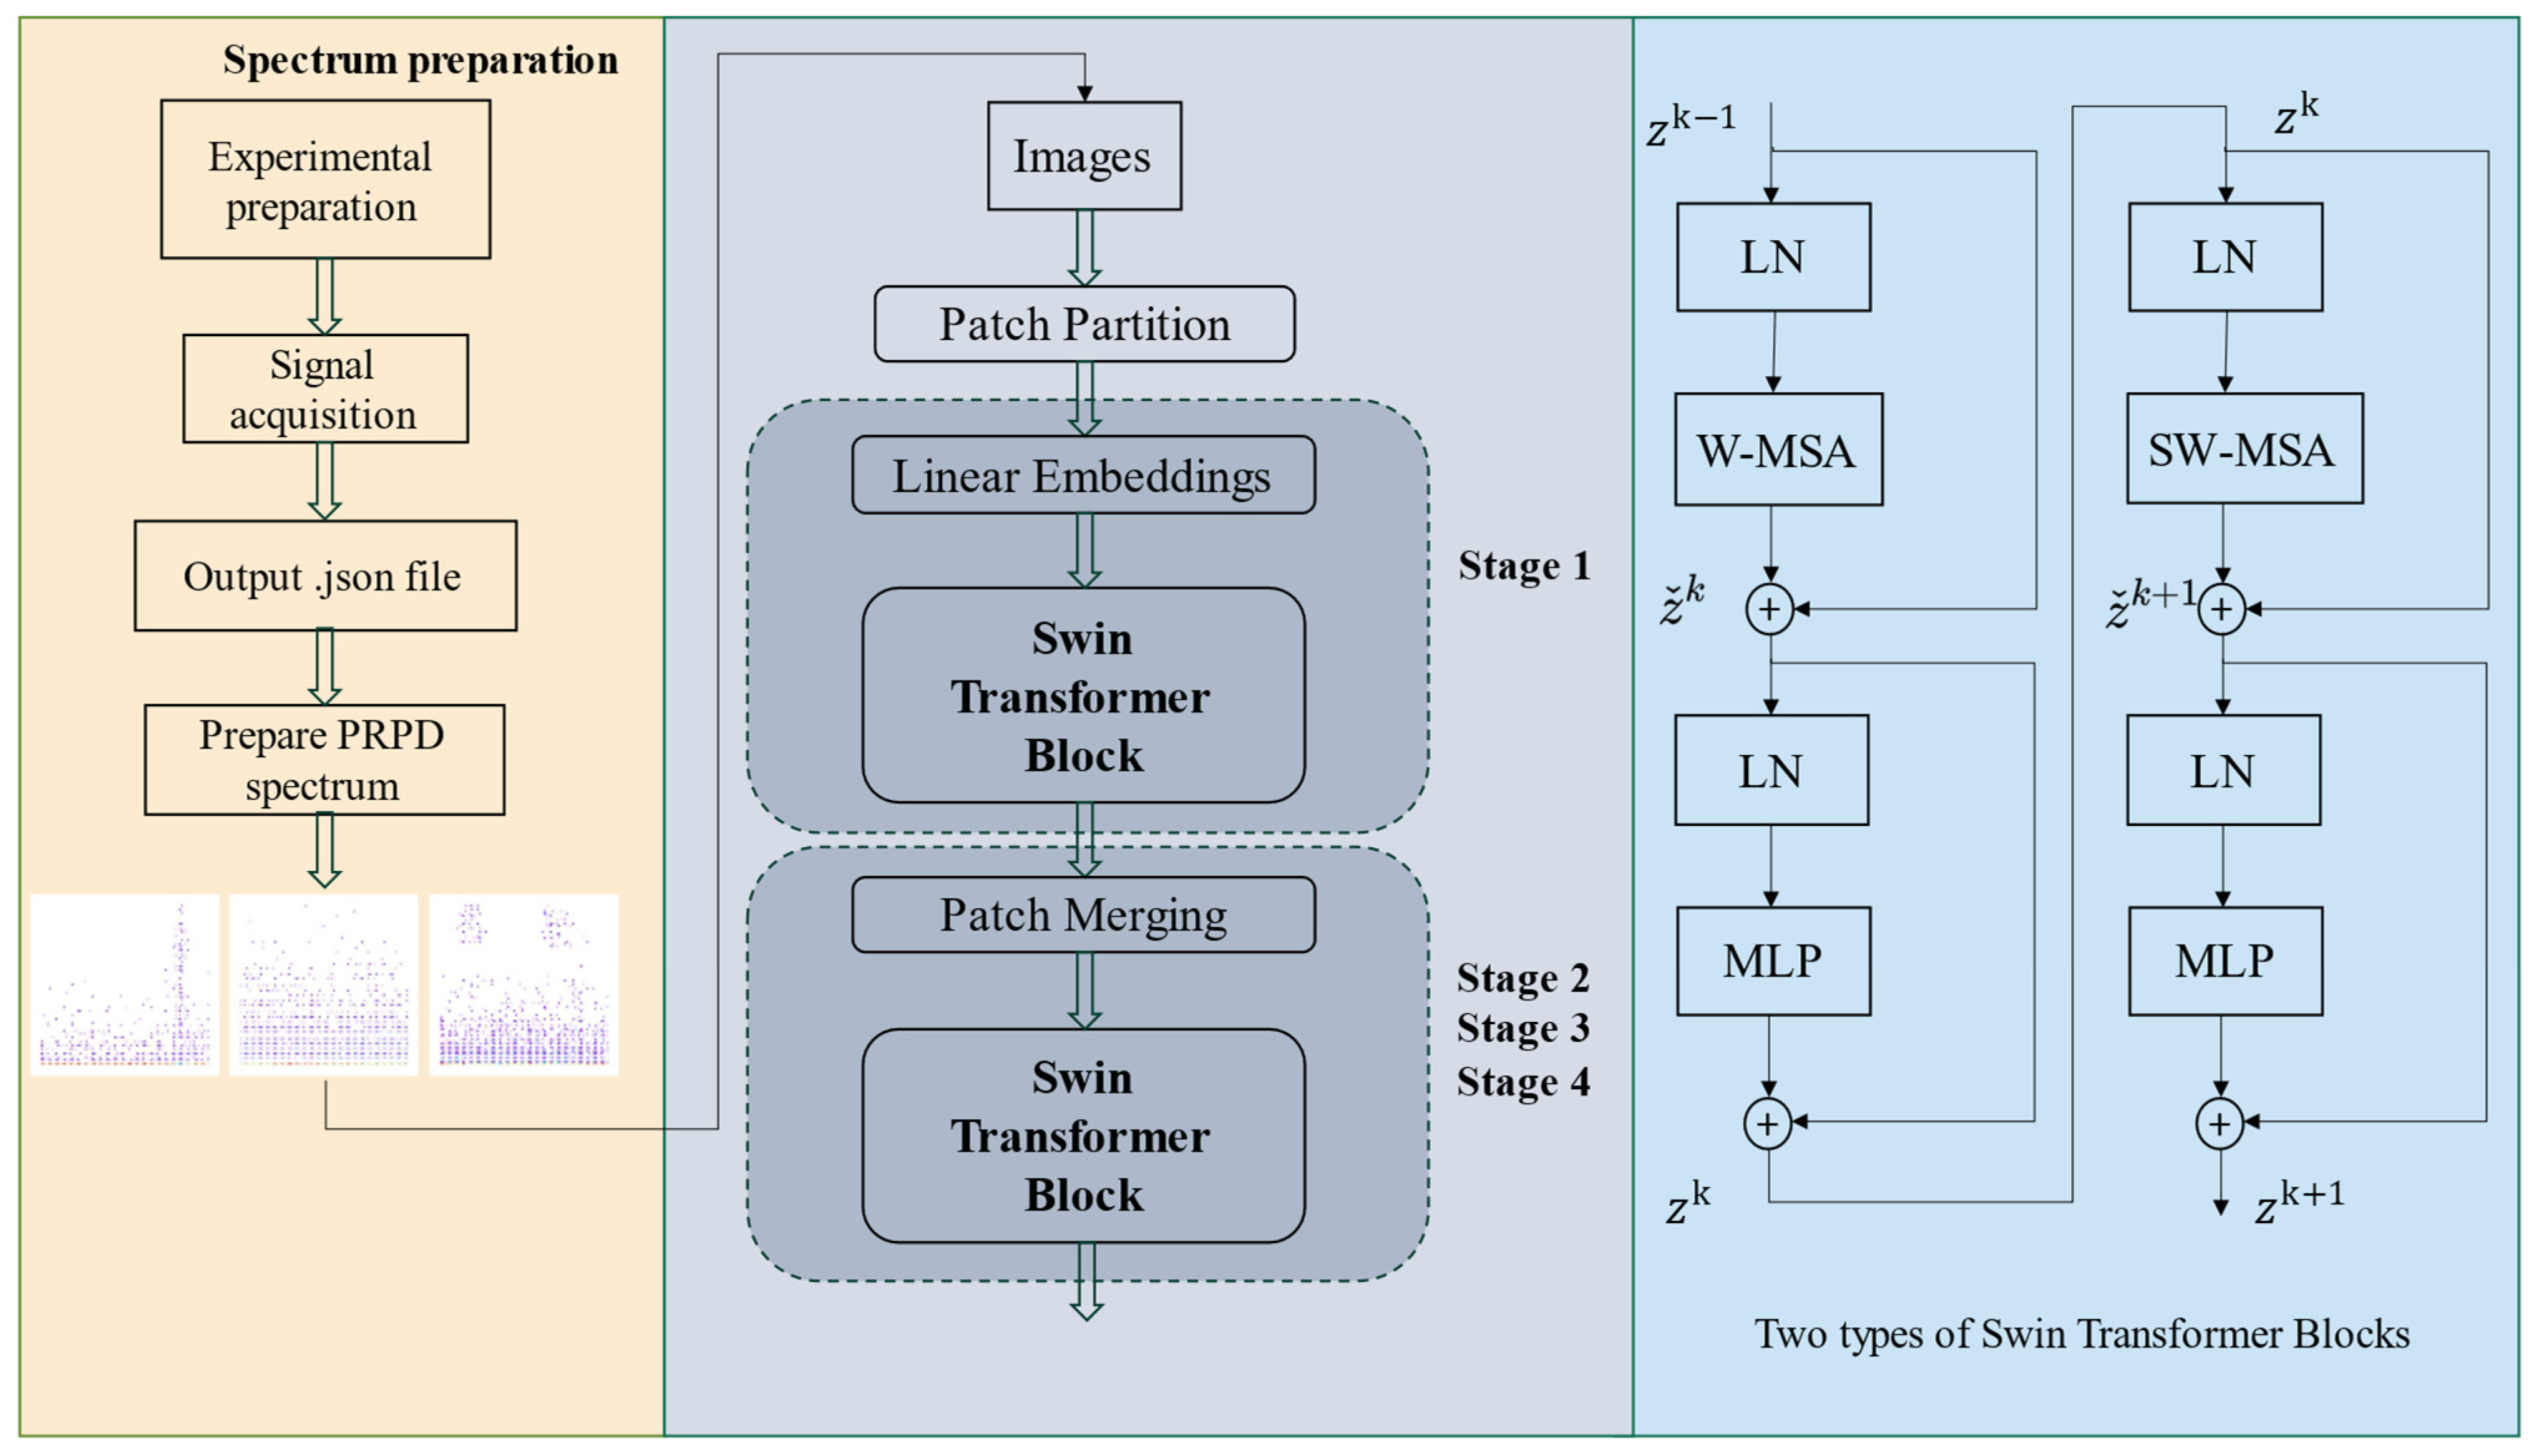
The PRPD map has been widely adopted in current online monitoring systems for partial discharge. However, most of the existing literature uses the n-q-φ three-dimensional spectrum as input for partial discharge pattern recognition, which fails to clearly capture the characteristics of different discharge modes, thus impacting recognition accuracy. Additionally, when using traditional Convolutional Neural Networks (CNNs) for fault type recognition, only local features of the image are captured, which hampers the extraction of key information, especially in small-sample classification, where performance is suboptimal. The recently emerging Swin Transformer model can capture the positional dependencies between windows through window partitioning and shifting, facilitating extensive information interaction. However, research on partial discharge pattern recognition using Swin Transformers is still limited, with Jiawei Li [
22] being the only one to apply a Swin Transformer architecture based on temporal models, providing a new approach for GIS insulation fault identification. In response to the above, this paper establishes an integrated experimental platform for PD pattern recognition in power cable systems. Four different types of discharge-defective models are constructed and tested through this dedicated high-voltage platform, generating a dataset of phase-resolved partial discharge (PRPD) spectra. Based on the obtained 2D PRPD maps, an improved Swin Transformer model with a cosine annealing decreasing learning rate is then employed for pattern recognition and classification of the generated maps.
The rest of this paper is organized as follows:
Section 2 describes the established experimental platform and the process of generating PRPD maps in the laboratory.
Section 3 proposes the specific steps of using a Swin Transformer framework with an adaptive learning rate for partial discharge fault classification. The effectiveness of the proposed Swin Transformer network model for PD defect patten detection is verified in
Section 4, and the conclusions are drawn in
Section 5.
2. Experimental Platform for PD Fault Diagnosis
2.1. Partial Discharge Test Platform and Data Acquisition
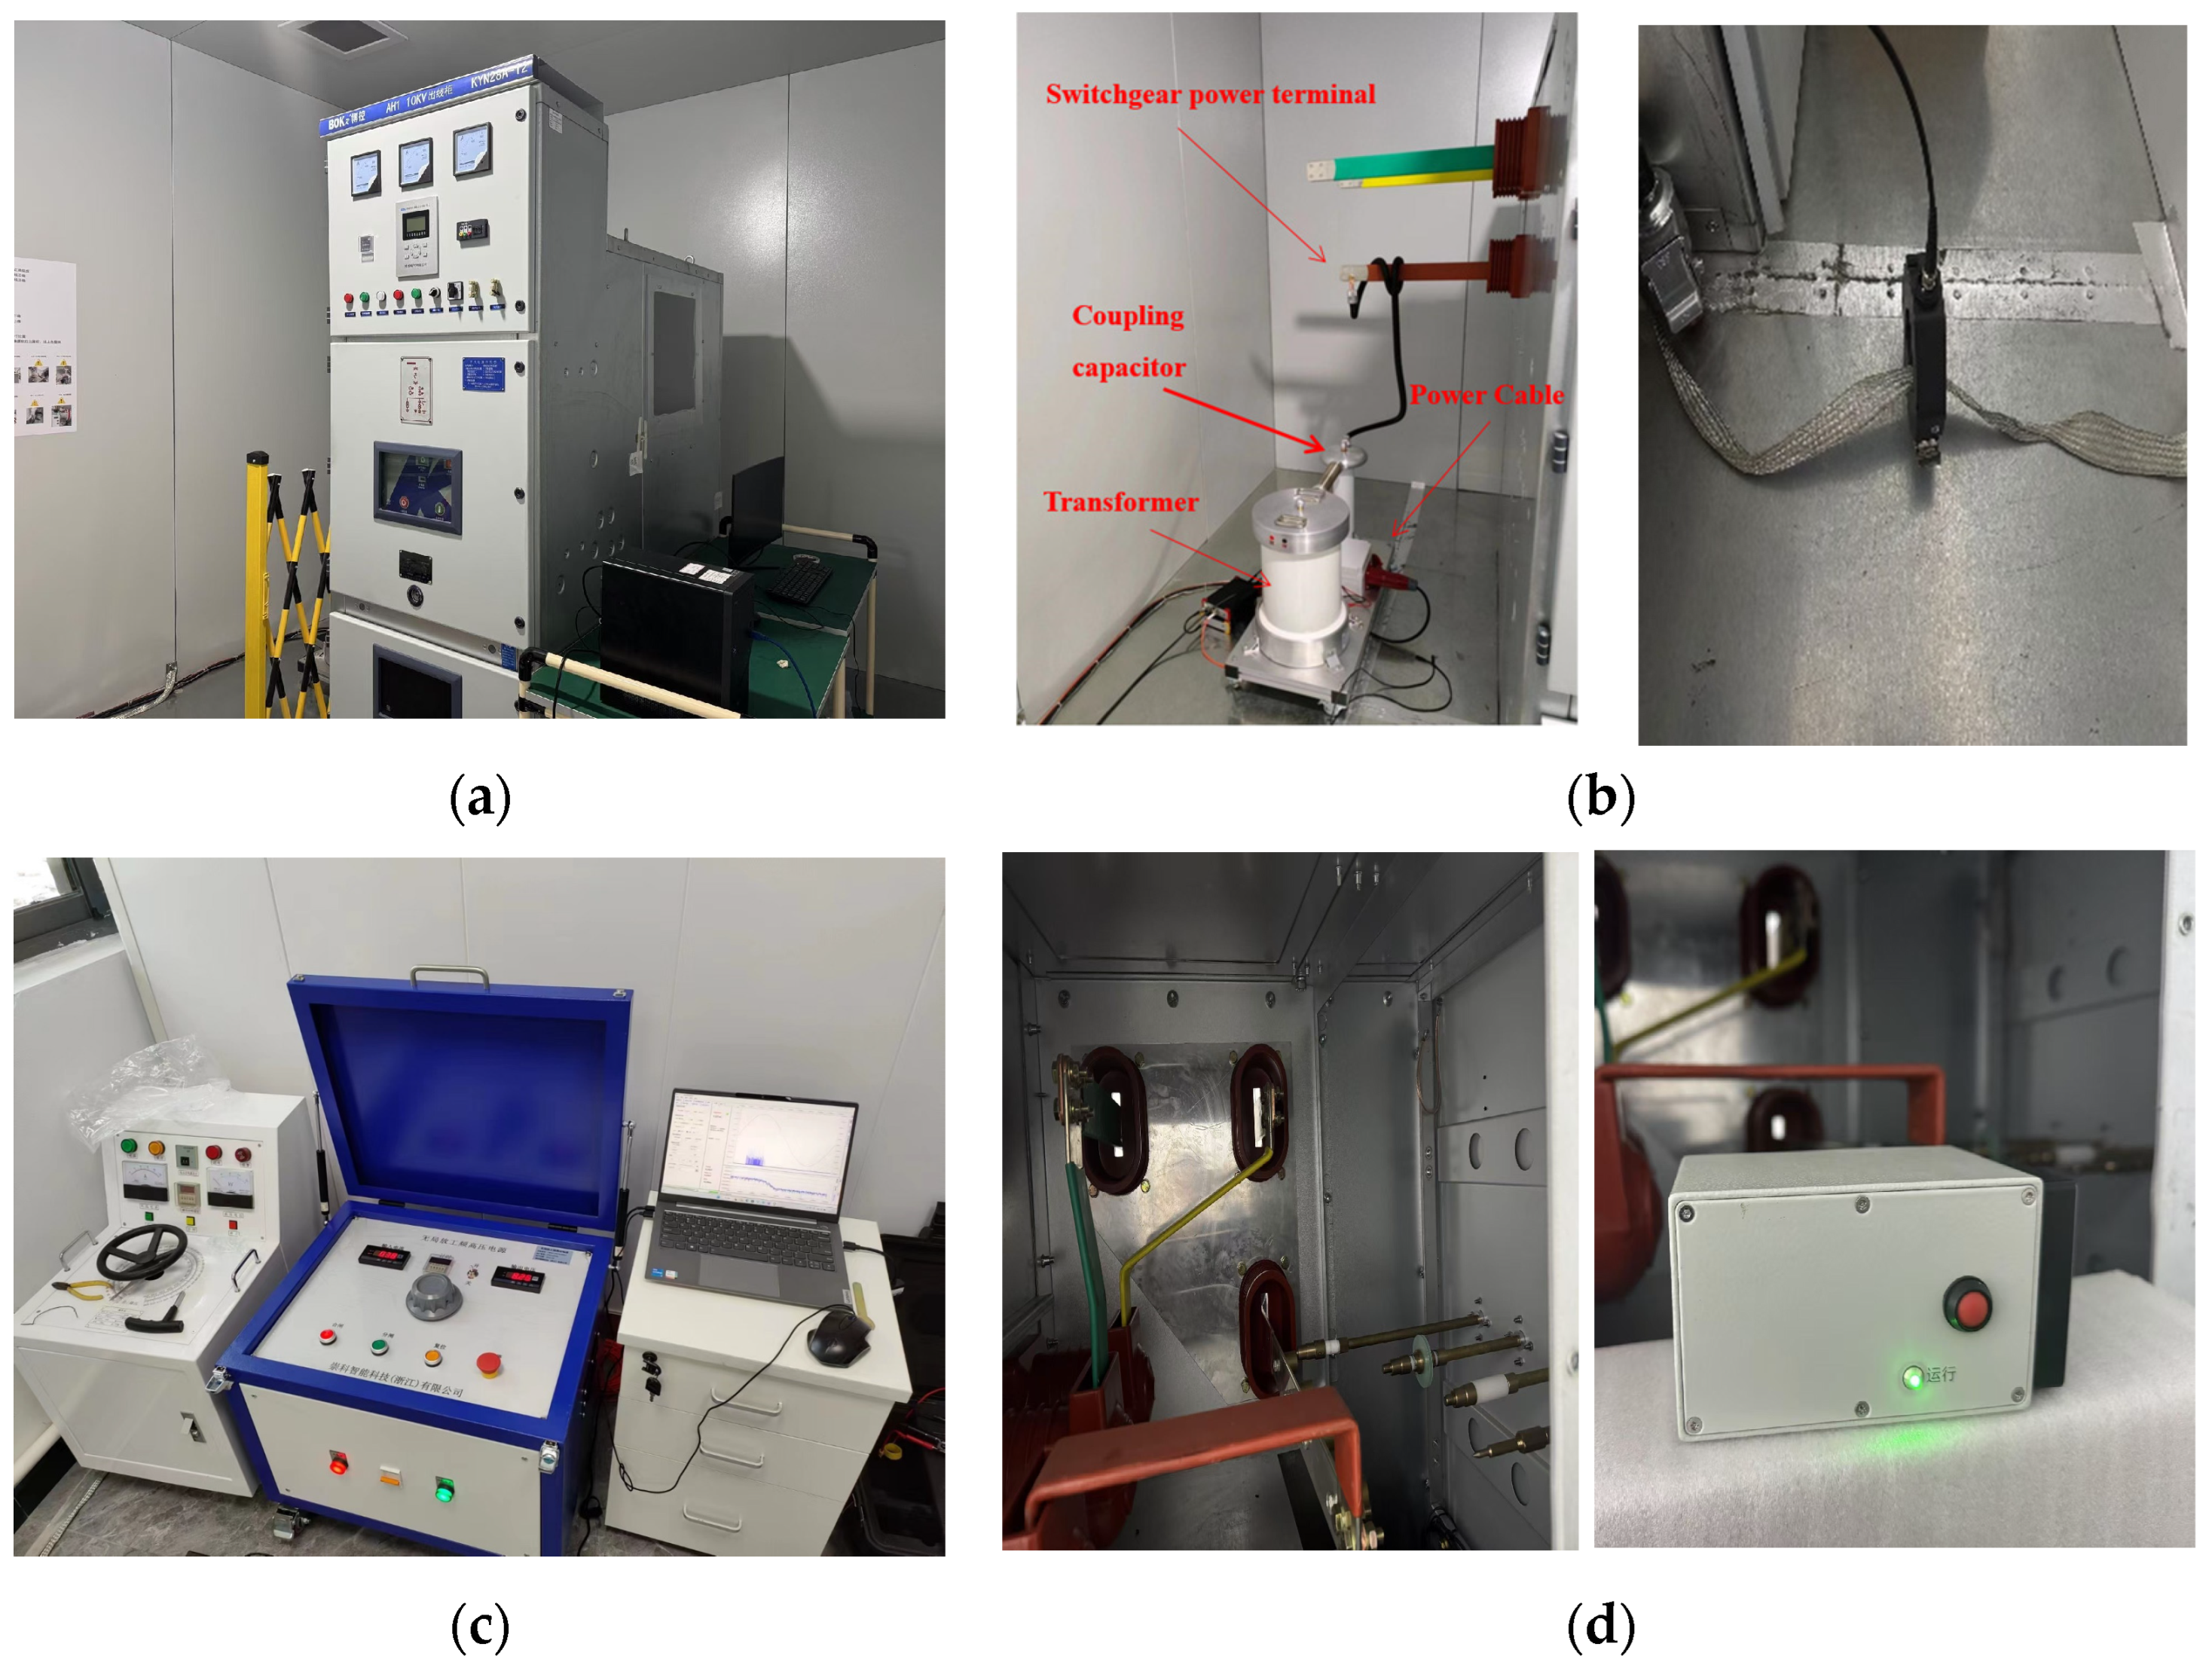
The partial discharge experimental platform, as illustrated in
Figure 1, is designed to simulate and capture ultra-high-frequency (UHF) signal data under various defect conditions. The platform comprises four main components: (1) a control console, (2) a high-voltage transformer, (3) a high-frequency current transformer (HFCT, Model SH-JF-60, Shanghai Jufeng Electric Automation Co., Ltd., Shanghai, China), and (4) UHF signal acquisition equipment.
The HFCT, featuring a 60 mm aperture and a BNC output interface, operates within a frequency range of 0.3 MHz to 100 MHz with a sensitivity of 0.1 pC. Installed on the grounding wire, this configuration enables effective detection of UHF signals generated by partial discharges within the cable. For signal acquisition, a UHF sensor with a 300 MHz to 1500 MHz frequency band and 10 pC sensitivity is employed to perform critical down-sampling operations. Regarding the down-sampling process, it serves two essential purposes: (1) effectively filtering out high-frequency noise through sampling rate reduction, and (2) enhancing the signal-to-noise ratio (SNR) for improved subsequent processing of partial discharge characteristics. This preprocessing step significantly facilitates the extraction of critical discharge features while maintaining the integrity of essential signal components.
In this experiment, four defect models are designed to simulate cable faults: corona discharge, void discharge, floating discharge, and surface discharge. Additionally, a control group without partial discharge is included for comparison. Corona discharge occurs when the electric field intensity at the electrode tip exceeds the dielectric breakdown strength, leading to air molecule ionization. Floating discharge and void discharge arise from electric field distortion caused by suspended metal particles or bubble movement between electrodes. Surface discharge occurs when the tangential electric field at cable ends or rough surfaces surpasses the tangential breakdown voltage of the dielectric. The four defect models constructed for the experiment are depicted in
Figure 2.
During the experiment, the control console applies voltage to the platform, which is adjusted by the power supply to output approximately 10 kV, 50 Hz alternating current. The HFCT detects and collects the data, which are saved and exported in .json file format. Each file contains multiple data entries, with each entry comprising 50 power frequency cycles. Within each cycle, 60 points are uniformly sampled, resulting in a phase window count of 60 and a phase resolution of 6°.
2.2. PRPD Map Drawing
The Phase-Resolved Partial Discharge (PRPD) analysis method is a well-established and widely used approach in the processing of partial discharge signal data [
23]. PRPD is an important tool for describing partial discharge activities. This method represents the interrelationships among three key parameters—discharge frequency n, discharge quantity
q, and discharge phase
ϕ—over multiple power frequency cycles on a two-dimensional map, allowing for an intuitive observation of the occurrence of the entire discharge event within each phase window. Given that PRPD maps exhibit significantly different characteristics for various types of partial discharge, using PRPD maps as the basis for partial discharge pattern recognition is an important means of identifying early cable faults.
The steps to generate PRPD maps from ultra-high-frequency partial discharge signals are as follows:
Assume that the data in a single data entry are from T cycles, and each cycle contains M phase windows.
(1) Generate a multi-cycle signal matrix: When processing a data entry from the .json file, the collected data points are filled into a matrix grid of size T × M, denoted as matrix A. In this matrix, the i-th row represents the signal collected during the i-th cycle, and the j-th column represents the signal in the j-th phase window. The value represents the discharge amount in the i-th cycle and j-th phase window (unit: dB).
(2) Amplitude differentiation processing: Search for the maximum and minimum values in matrix A, denoted as and . Then, generate a new grid matrix B where the length of the grid is equal to the number of phase windows, and the width is set to 100, with the upper and lower bounds of the width defined as and .
(3) Statistical features: Starting from j = 1, count the frequency of elements in column j of matrix A that fall into the j-th column of matrix B, and fill in the grid of matrix B until all phase windows are covered.
(4) Map representation: The length and width of matrix B are taken as the x and y axes, respectively, and the frequency within each grid is represented by color. This results in the PRPD map for this data entry.
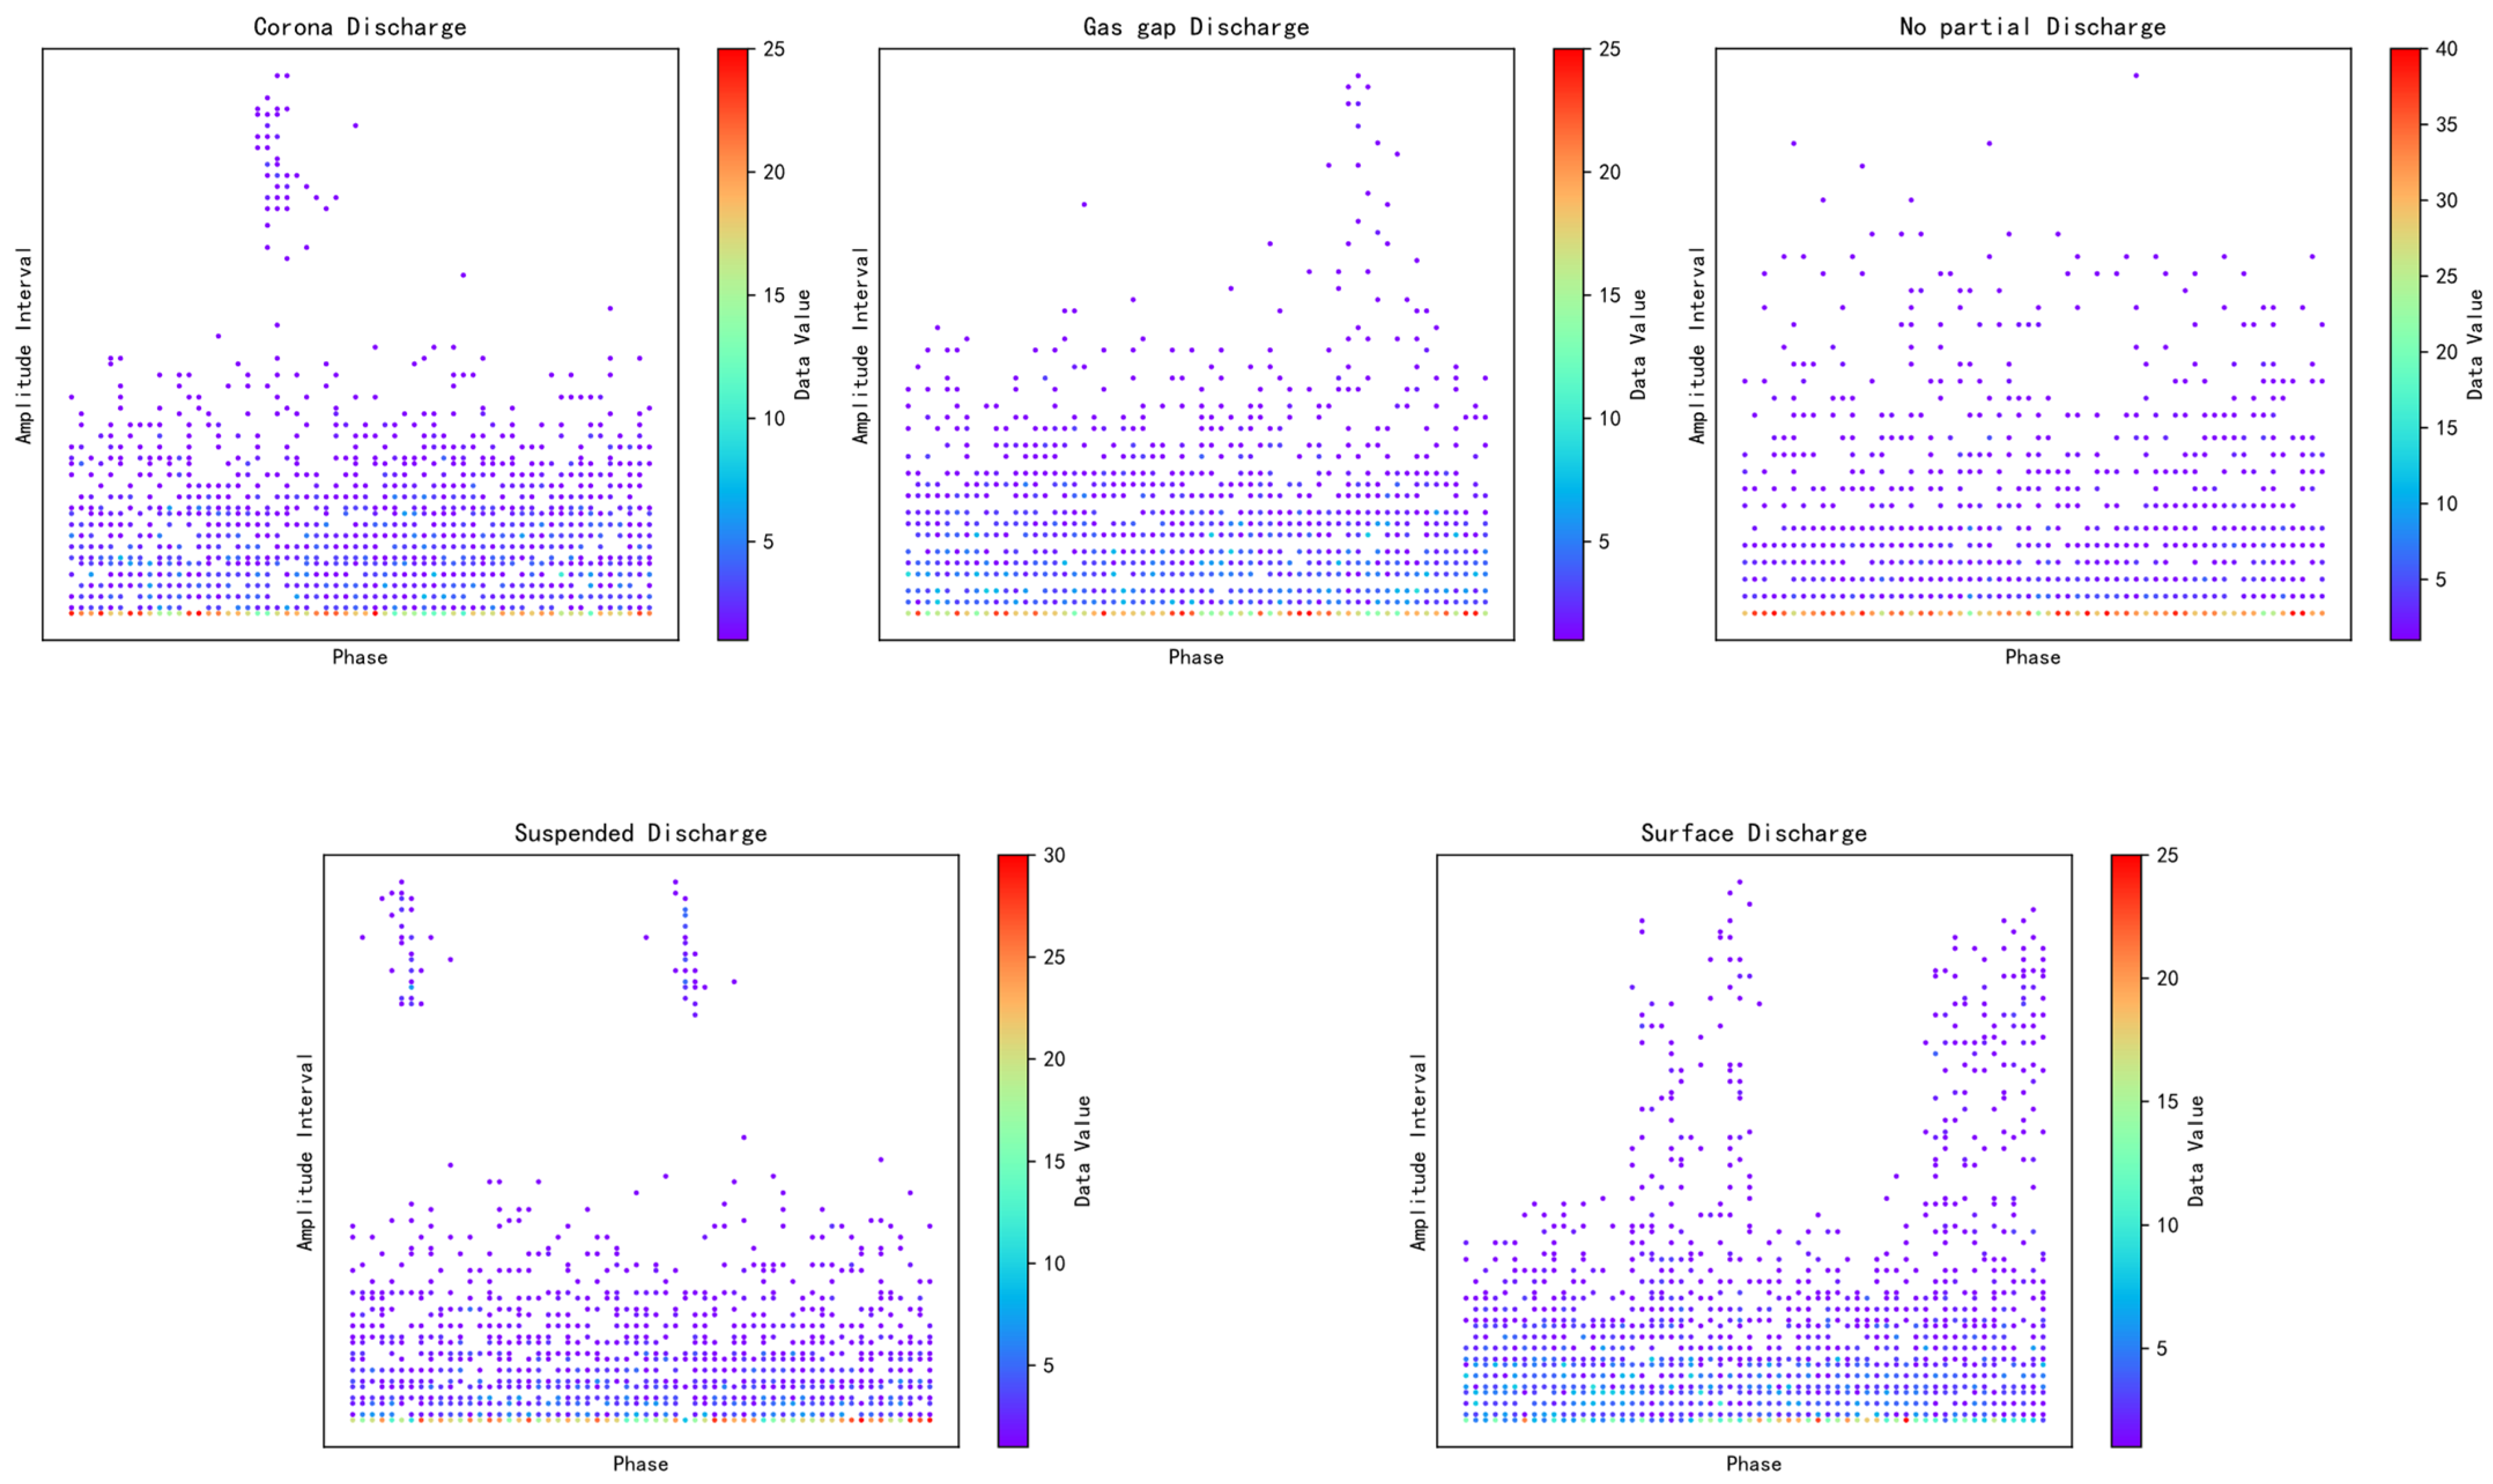
The PRPD maps of four typical partial discharge (PD) defects and the no-PD condition, generated following the above steps, are shown in
Figure 3. The resolution of the maps is 515 × 389, with the horizontal and vertical axes representing the phase of a single cycle and the normalized amplitude range, respectively. All acquired signals are converted into PRPD maps, and the number of maps for each type is recorded. In total, 1426 PRPD maps are obtained in this experiment, with the distribution of each type listed in
Table 1.
4. Experimental Results and Analysis
In this section, experiments for PD pattern recognition are conducted based on the Swin Transformer-based model introduced in
Section 3. In these experiments, those PRPD maps obtained by the platform designed in
Section 2 are used as the dataset. The dataset is split into training and testing sets in a 4:1 ratio. The proposed Swin Transformer neural network with an adaptive learning rate is then trained on the dataset to achieve recognition results of PD types. In order to compare the PD recognition performances of the proposed approach, the original tiny version of Swin Transformer is also implemented in the same environment. Additionally, as the two classical deeper Convolutional Neural Networks, Vgg [
26] developed by the Visual Geometry Group at Oxford University and ResNet [
27], short for Residual Network, proposed by K He and others, are also implemented to show the comparative performances of the proposed approach.
4.1. Experiment Settings
The proposed model is implemented in the PyCharm integrated development environment on the hardware of an Intel(R) Core (TM) i7-12700K processor, running on a 64-bit Windows 11 operating system. Here, both the original tiny version of the Swin Transformer model (denoted as Swin Transformer I) and the proposed Swin Transformer model with an adaptive learning rate (denoted as Swin Transformer II) as well as other implemented models such as Vgg16, ResNet16, ResNet50, and ResNet152 are built using programming environment of Python 3.6.13 within the PyTorch 1.2.0 framework. The considered Swin Transformer models are implemented based on the pre-trained weights from the original paper [
27]. To ensure the integrity, efficiency, and convergence of the learning process, other hyperparameters of these two networks are set as follows based on empirical experiments.
Swin Transformer I: The training epoch is set to 200; the batch size is 32; the learning rate is set to 1 × 10⁻⁴; the activation function in the network structure is ReLU; the Adam optimizer is used; and the loss function is Cross Entropy.
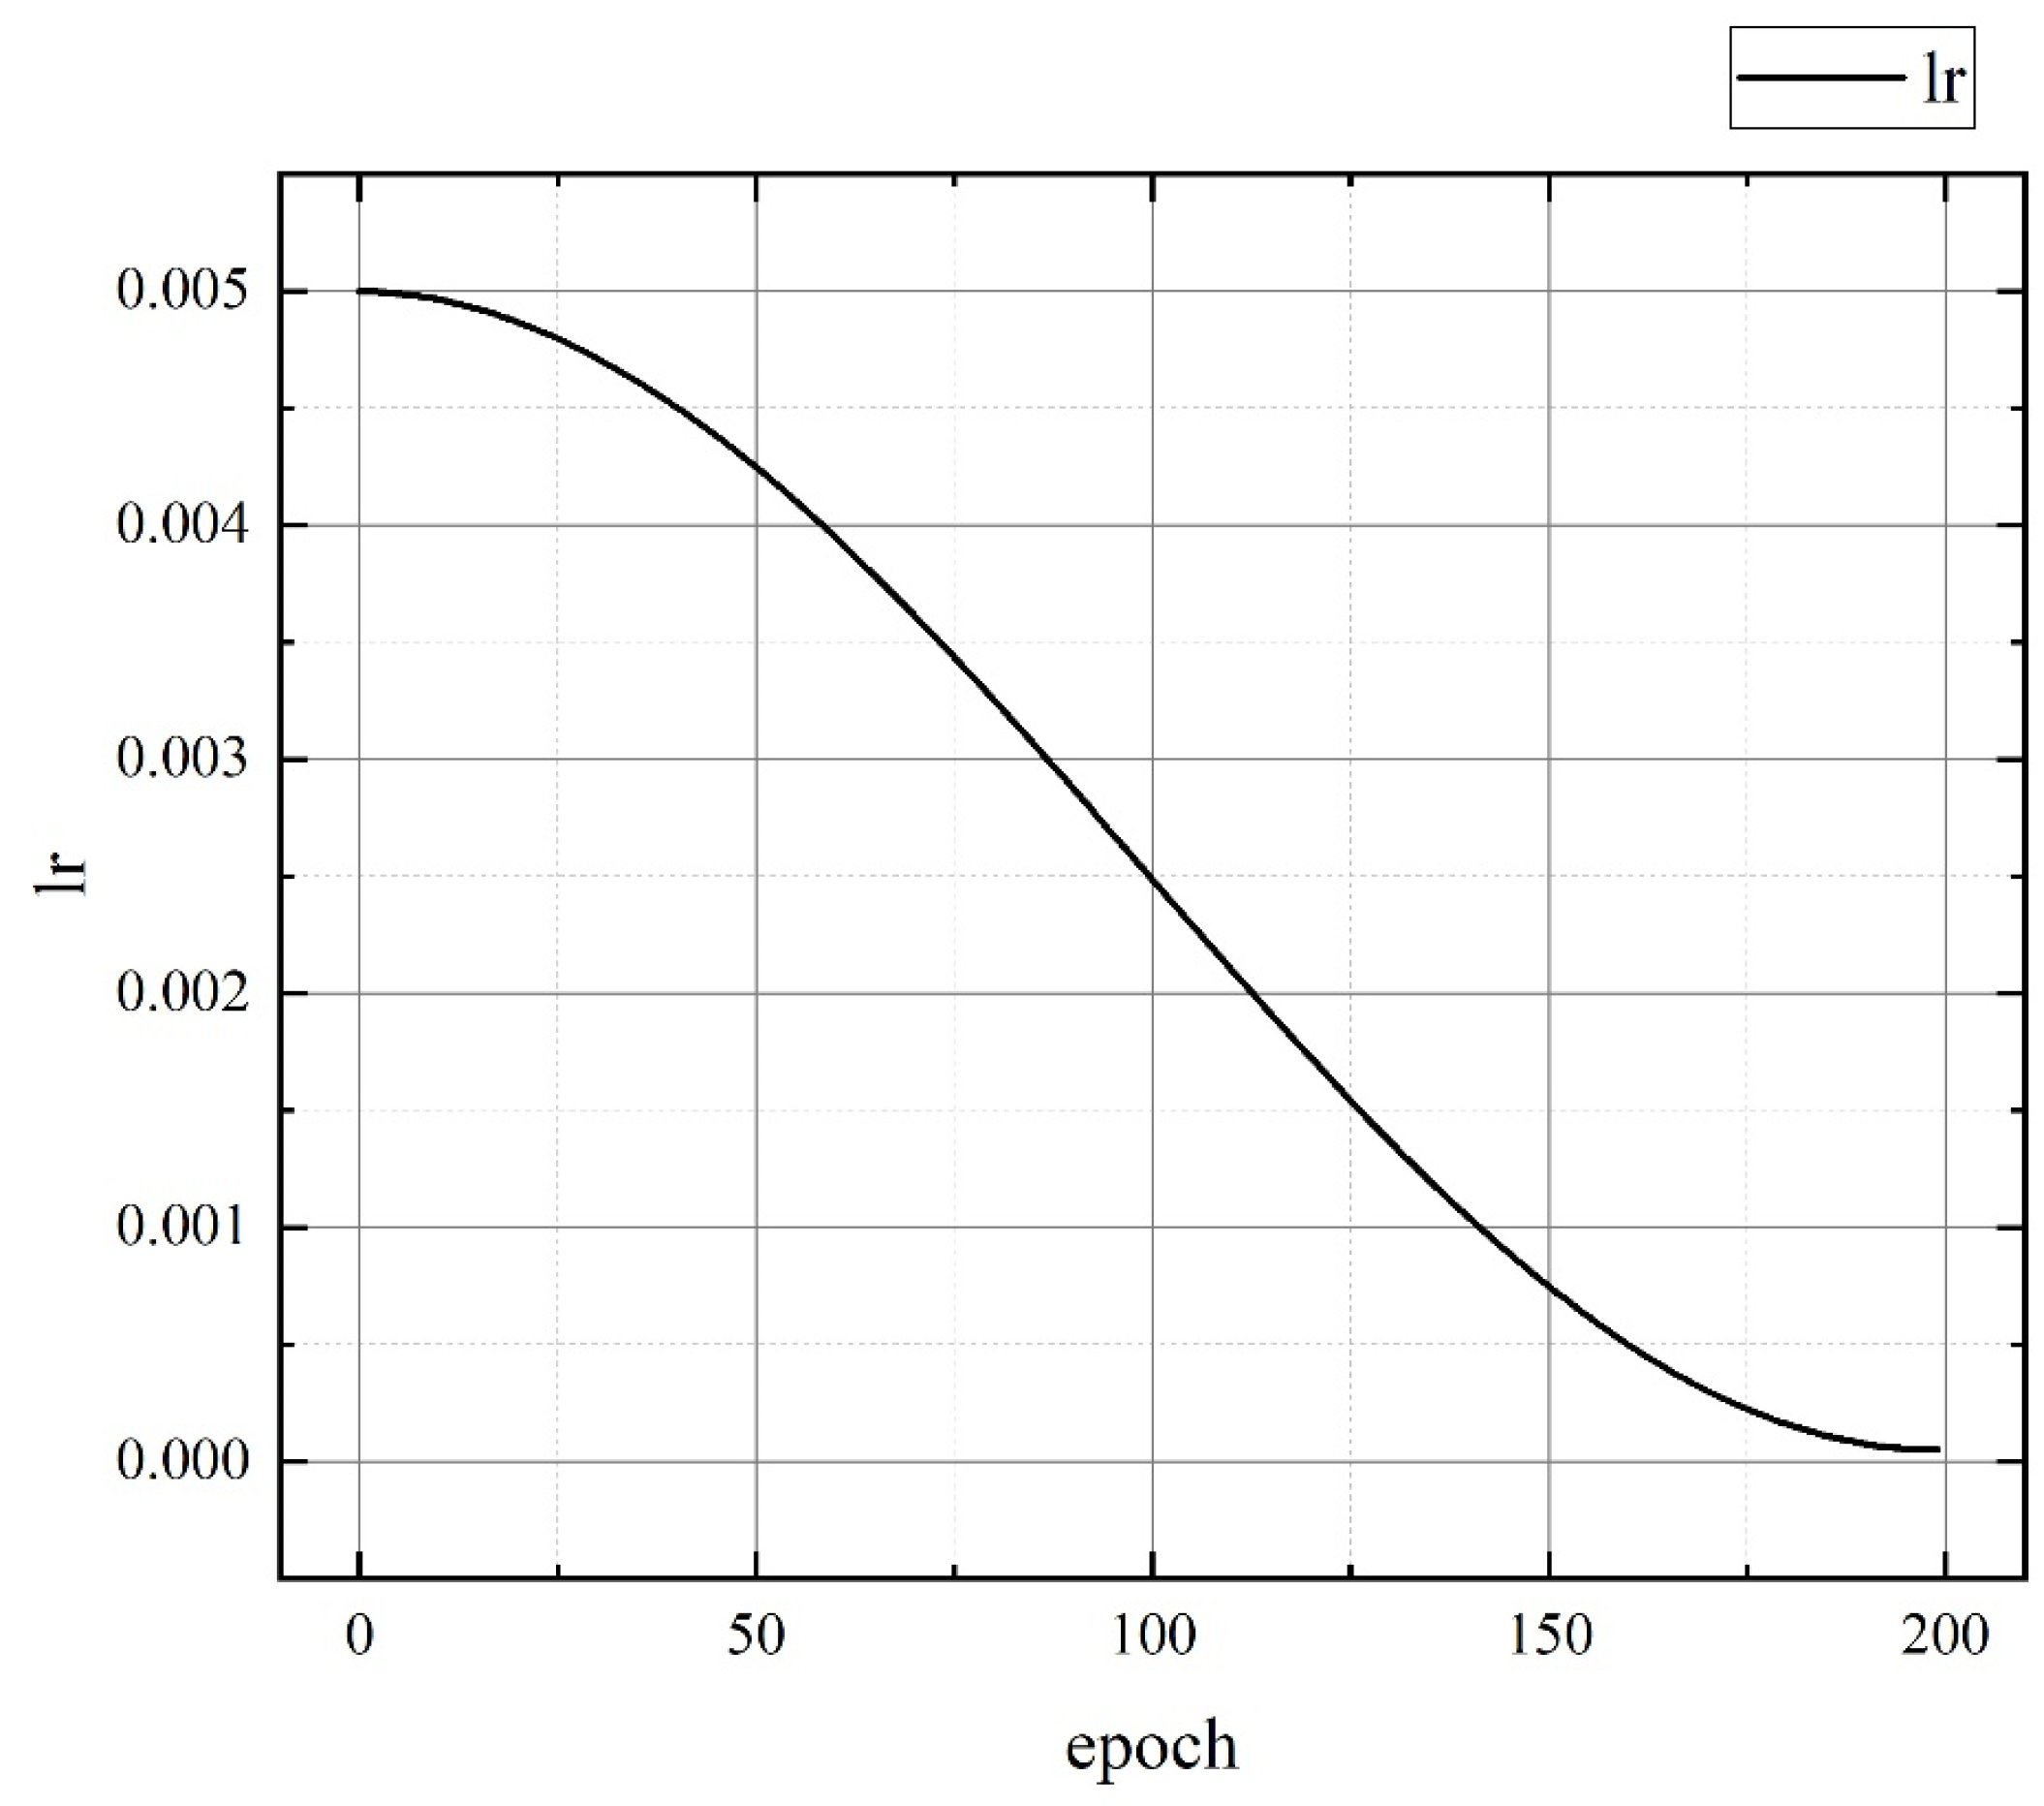
Swin Transformer II: To ensure comparability before and after the improvement in the learning rate, the initial learning rate and minimum learning rate are set to 5 × 10
−4 and 5 × 10
−5, respectively, and attenuated according to cosine annealing, as illustrated by
Figure 6. All other parameters take the same values as those of the above Swin Transformer I.
4.2. Evaluation Metrics
FLOPs (Floating-Point Operations) refer to the total number of floating-point operations and can be used to measure the complexity of deep learning models. Generally speaking, the larger the computational workload of a model, the more computational resources it requires, which may lead to slower convergence. Moreover, an increase in parameters also increases the risk of model overfitting. However, if the model’s computational workload is too small, detection accuracy will decrease. Therefore, it is essential to choose an appropriate training model based on different application scenarios.
In classification tasks, the development of the Vgg16 model and residual network model has reached a high level of maturity. The computational power consumption of the Swin Transformer model, Vgg16, and three residual network models is shown in
Table 2. It should be noted here that the proposed Swin Transformer II has the same FLOPs as the original tiny Swin Transformer. It is clearly found from
Table 2 that among the residual network family, ResNet18 has the smallest computational workload, with only 1.81 G. ResNet50 and Swin Transformer have moderate computational costs, while ResNet152 and Vgg16 are large, with computational costs exceeding 10 G.
4.3. Analysis of Experimental Results
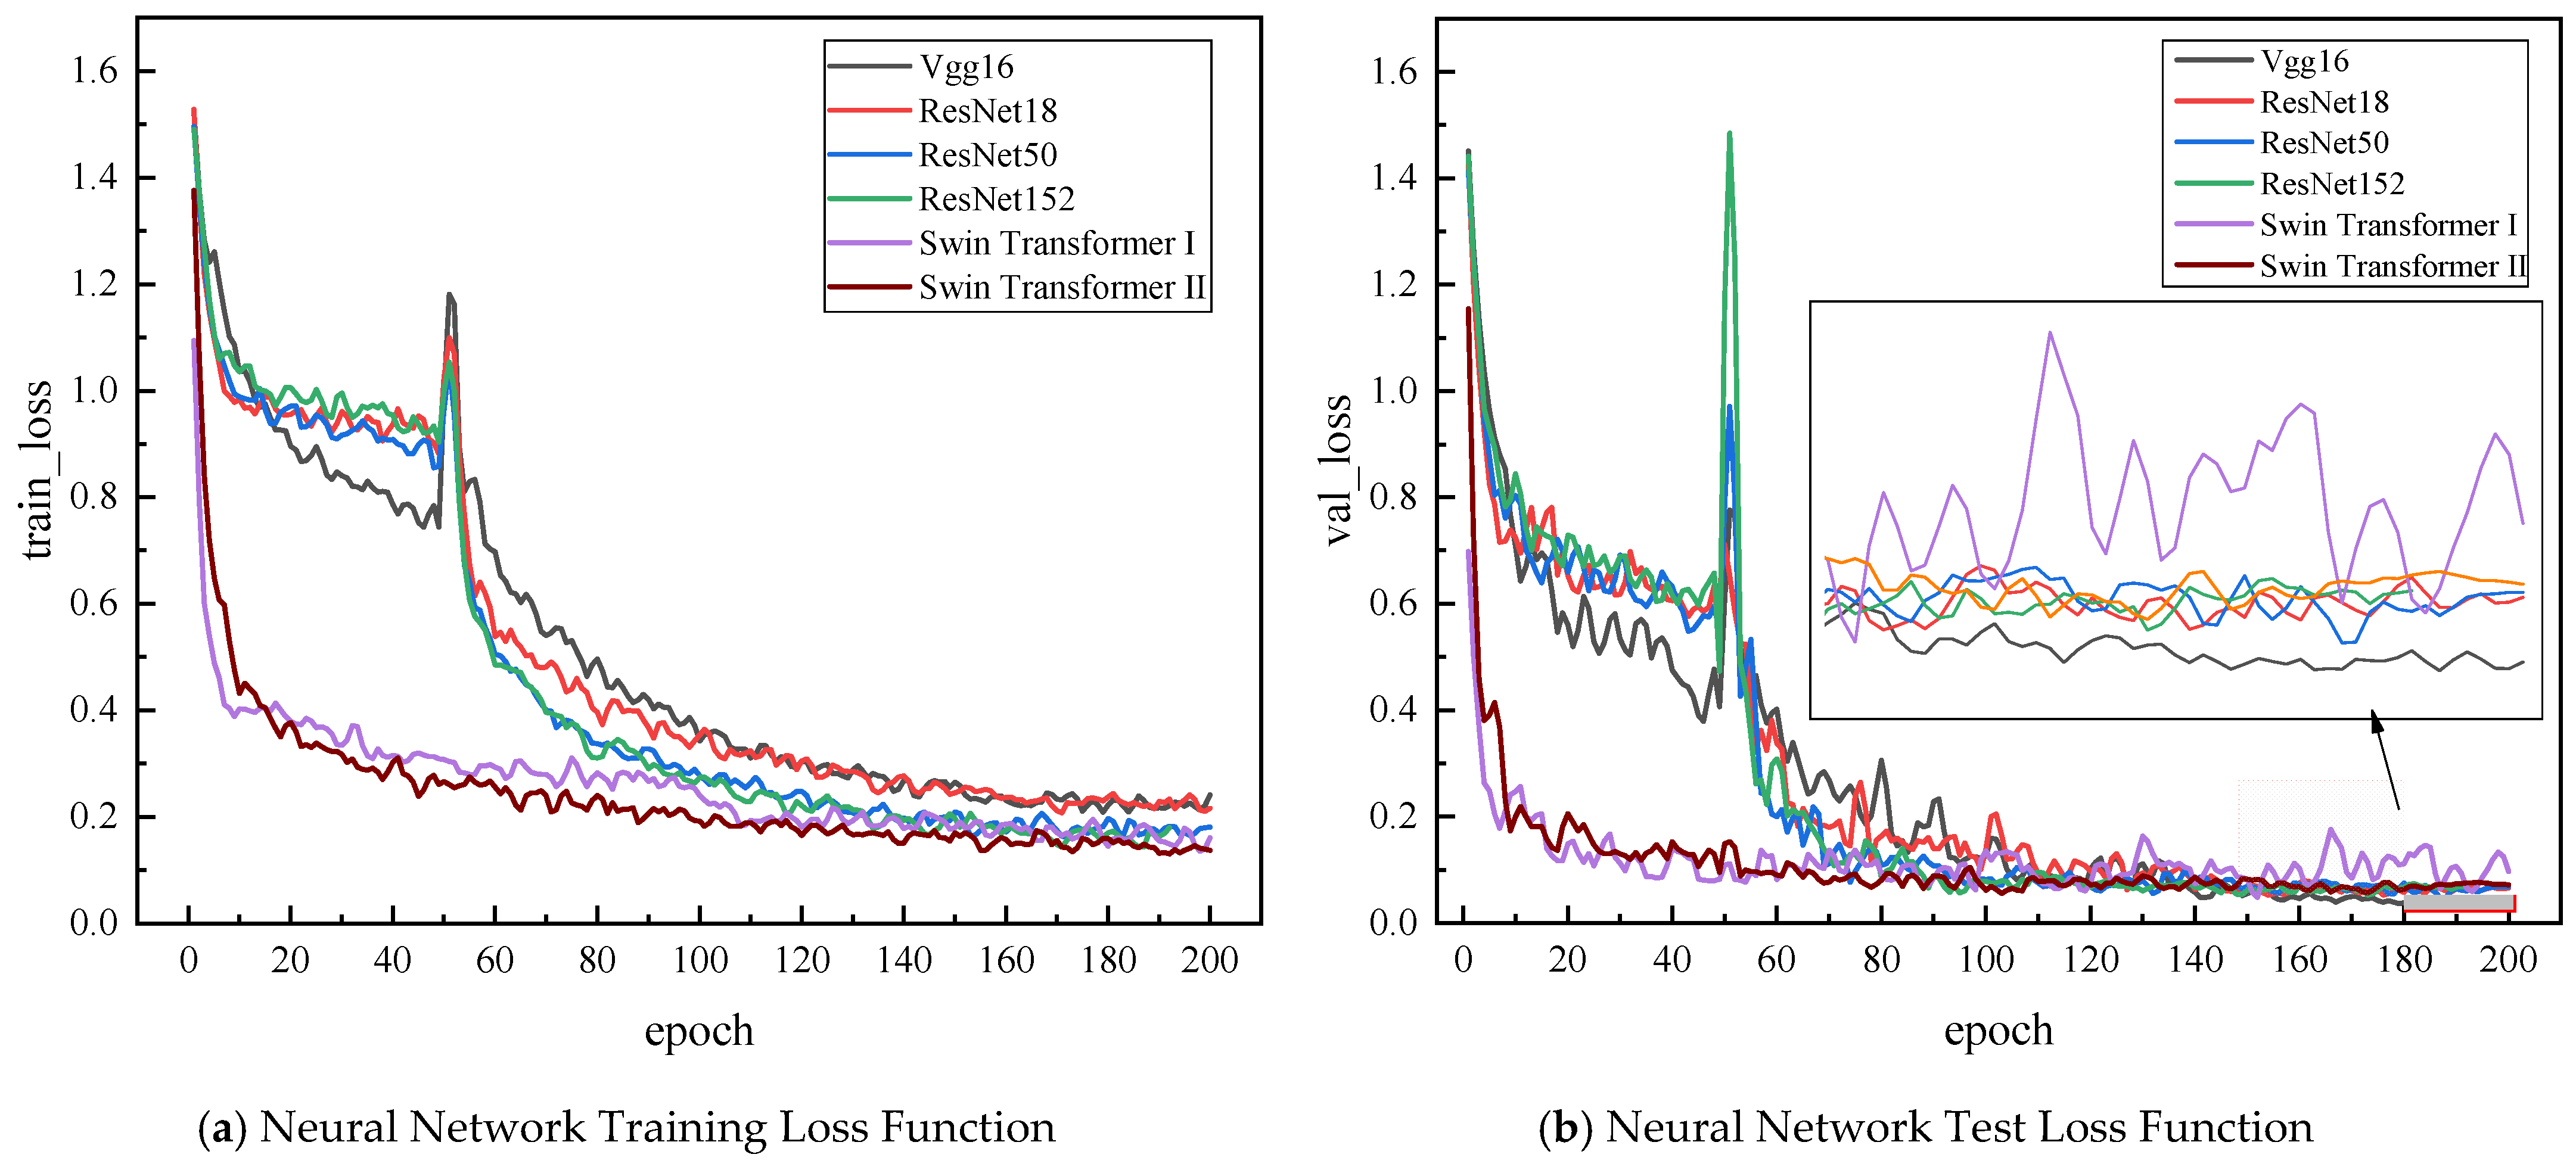
In this section, the proposed Swin Transformer model, along with other considered neural network models, is used for partial discharge fault mode recognition. First, we compare their differences in terms of loss function decrease speed.
Figure 7 shows the relationship between the loss function and the number of iterations during the training process. It is clearly seen from this figure that both Swin Transformer models demonstrate the advantages of a small initial value and a fast decrease in the loss function in the early stages of training. The initial loss values for Swin Transformer I and II are 1.10 and 1.39, respectively, and they quickly converge to 0.4 at epoch 20. In contrast, other neural network models start with an initial loss around 1.50. Additionally, it is quite clearly seen from
Figure 7 that the proposed Swin Transformer II has a faster decrease compared to the original Swin Transformer I and surpasses the original model at epoch 15. During the mid-training phase, both Swin Transformer models continue to decrease steadily, while other classical neural networks show significant fluctuations before gradually decreasing at a faster rate, indicating that these models only begin to learn the features of the samples around epoch 50. In the later stages of training, the neural network models gradually converge. Due to the size constraints of the network models, the final test set loss for Swin Transformer I and II, as well as the residual models, is lower than that of Vgg16. Furthermore, the comparison shows that the Swin Transformer II proposed in this paper, due to its learning rate decay property, avoids the post-training loss oscillation seen in the original Swin Transformer I.
Then, the partial discharge classification accuracy curves of different neural network models are illustrated in
Figure 8. It is easily found from this figure that the two Swin Transformer models, during the early stages of training, exhibit a rapid increase in pattern recognition accuracy, reaching 85% and 94.68% at epoch 20, respectively. At the end of the training, the proposed Swin Transformer II achieves a recognition accuracy of 97.52%, second only to the 98.19% accuracy of the ResNet50 residual network. Additionally, as the network depth increases (e.g., ResNet152, Vgg16), the recognition accuracy of Convolutional Neural Networks (CNNs) tends to decrease. This may be due to the relatively small dataset in this experiment, where a lightweight network is sufficient to fit the data well. This suggests that simply increasing the number of layers in a neural network does not always improve recognition accuracy, while it sacrifices computational efficiency. Therefore, choosing the proposed Swin Transformer II as the neural network for partial discharge pattern recognition training has the advantages of fast convergence and relatively high accuracy.
Table 3 shows the recognition accuracy and training time of various neural network models for each type of PRPD map at epoch 200. It can be seen from the table that the Vgg16 model, which has the largest network size, achieves the best recognition performance at the end of training, but this comes at the cost of computational efficiency, with a training time of 17.5 h. In addition, the ResNet18 model achieves 100% accuracy in recognizing corona discharge and surface discharge. However, due to the limited number of gas gap discharge samples, the shallow network is unable to effectively learn the map features, resulting in a recognition accuracy of only 81.82%. The ResNet50 model, with a training time of 4.25 h, performs similarly to the ResNet18 model, while the deeper ResNet152 model, with a training time of 16.25 h, offers no significant improvement in recognition accuracy. The original Swin Transformer I, compared to the ResNet50 model of similar size, shows good performance in most types, with a slight decrease in the recognition accuracy of gas gap discharge and no partial discharge, with a training time of 4.36 h. Notably, the Swin Transformer II proposed in this paper, with a training time of 4.81 h, shows a significant improvement in recognition performance over the original model, with a 6.89% increase in gas gap discharge recognition accuracy, indicating that the learning rate adaptation in the Swin Transformer model offers a great advantage in small-sample classification tasks.
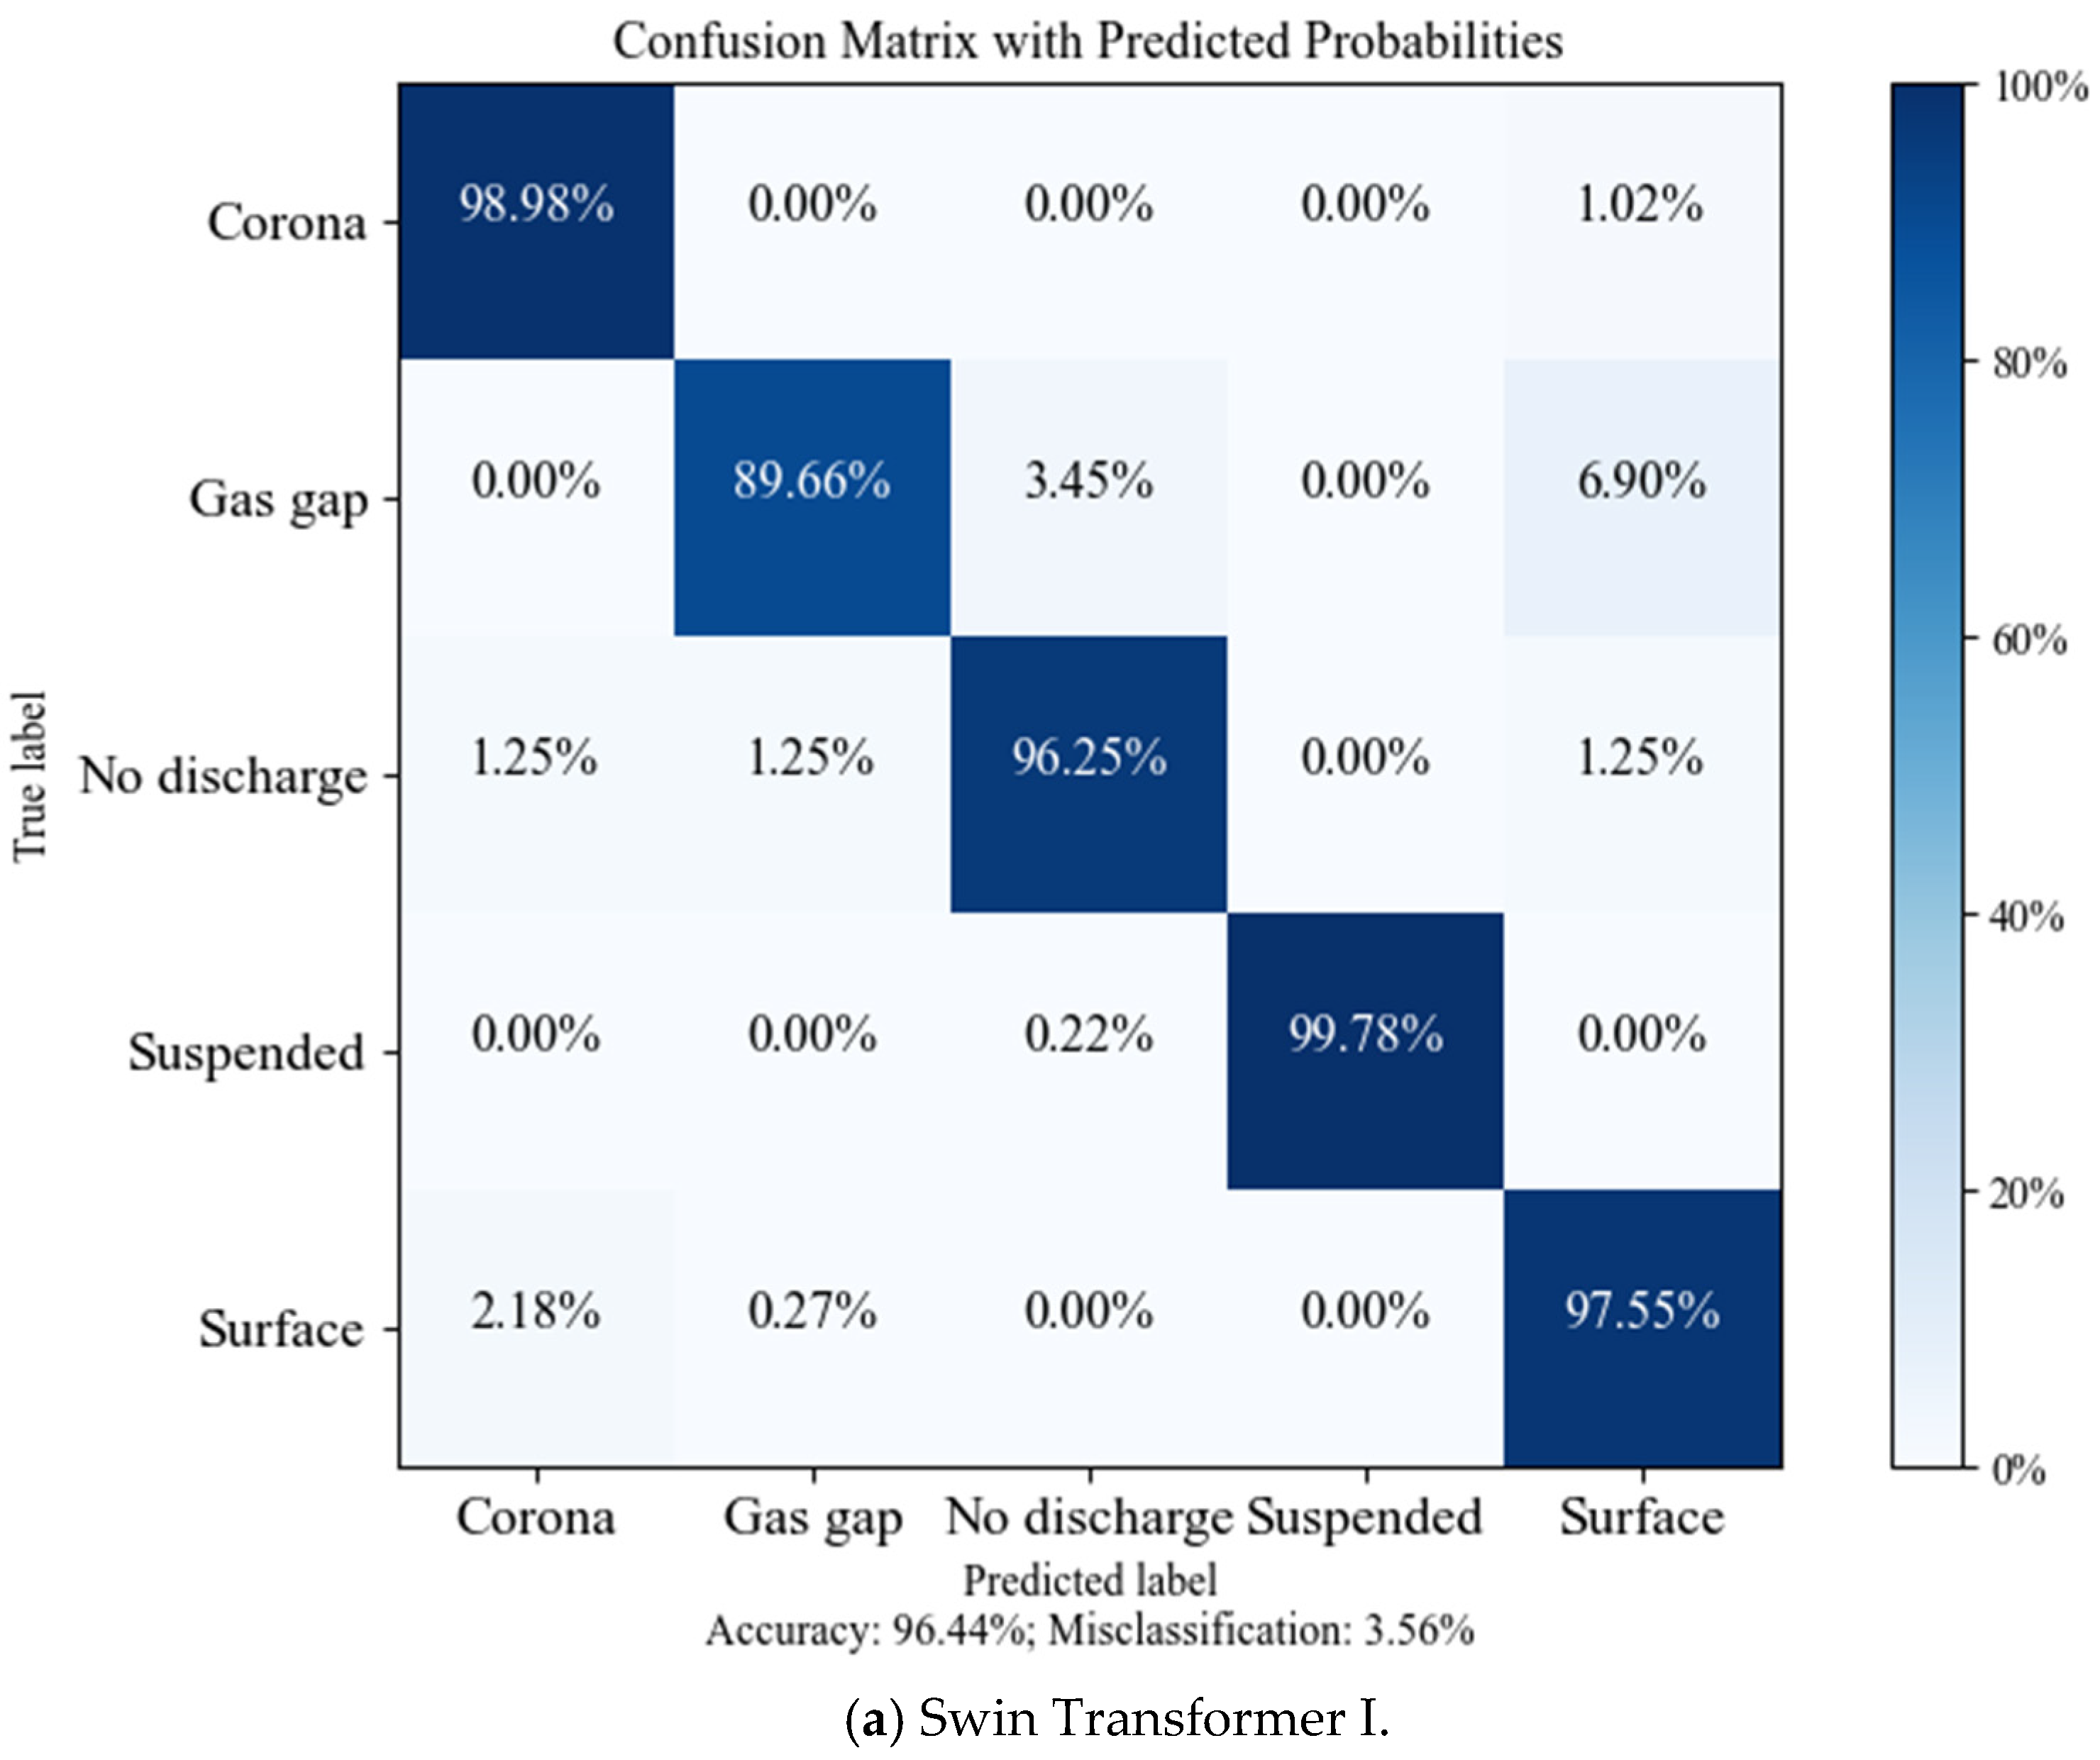
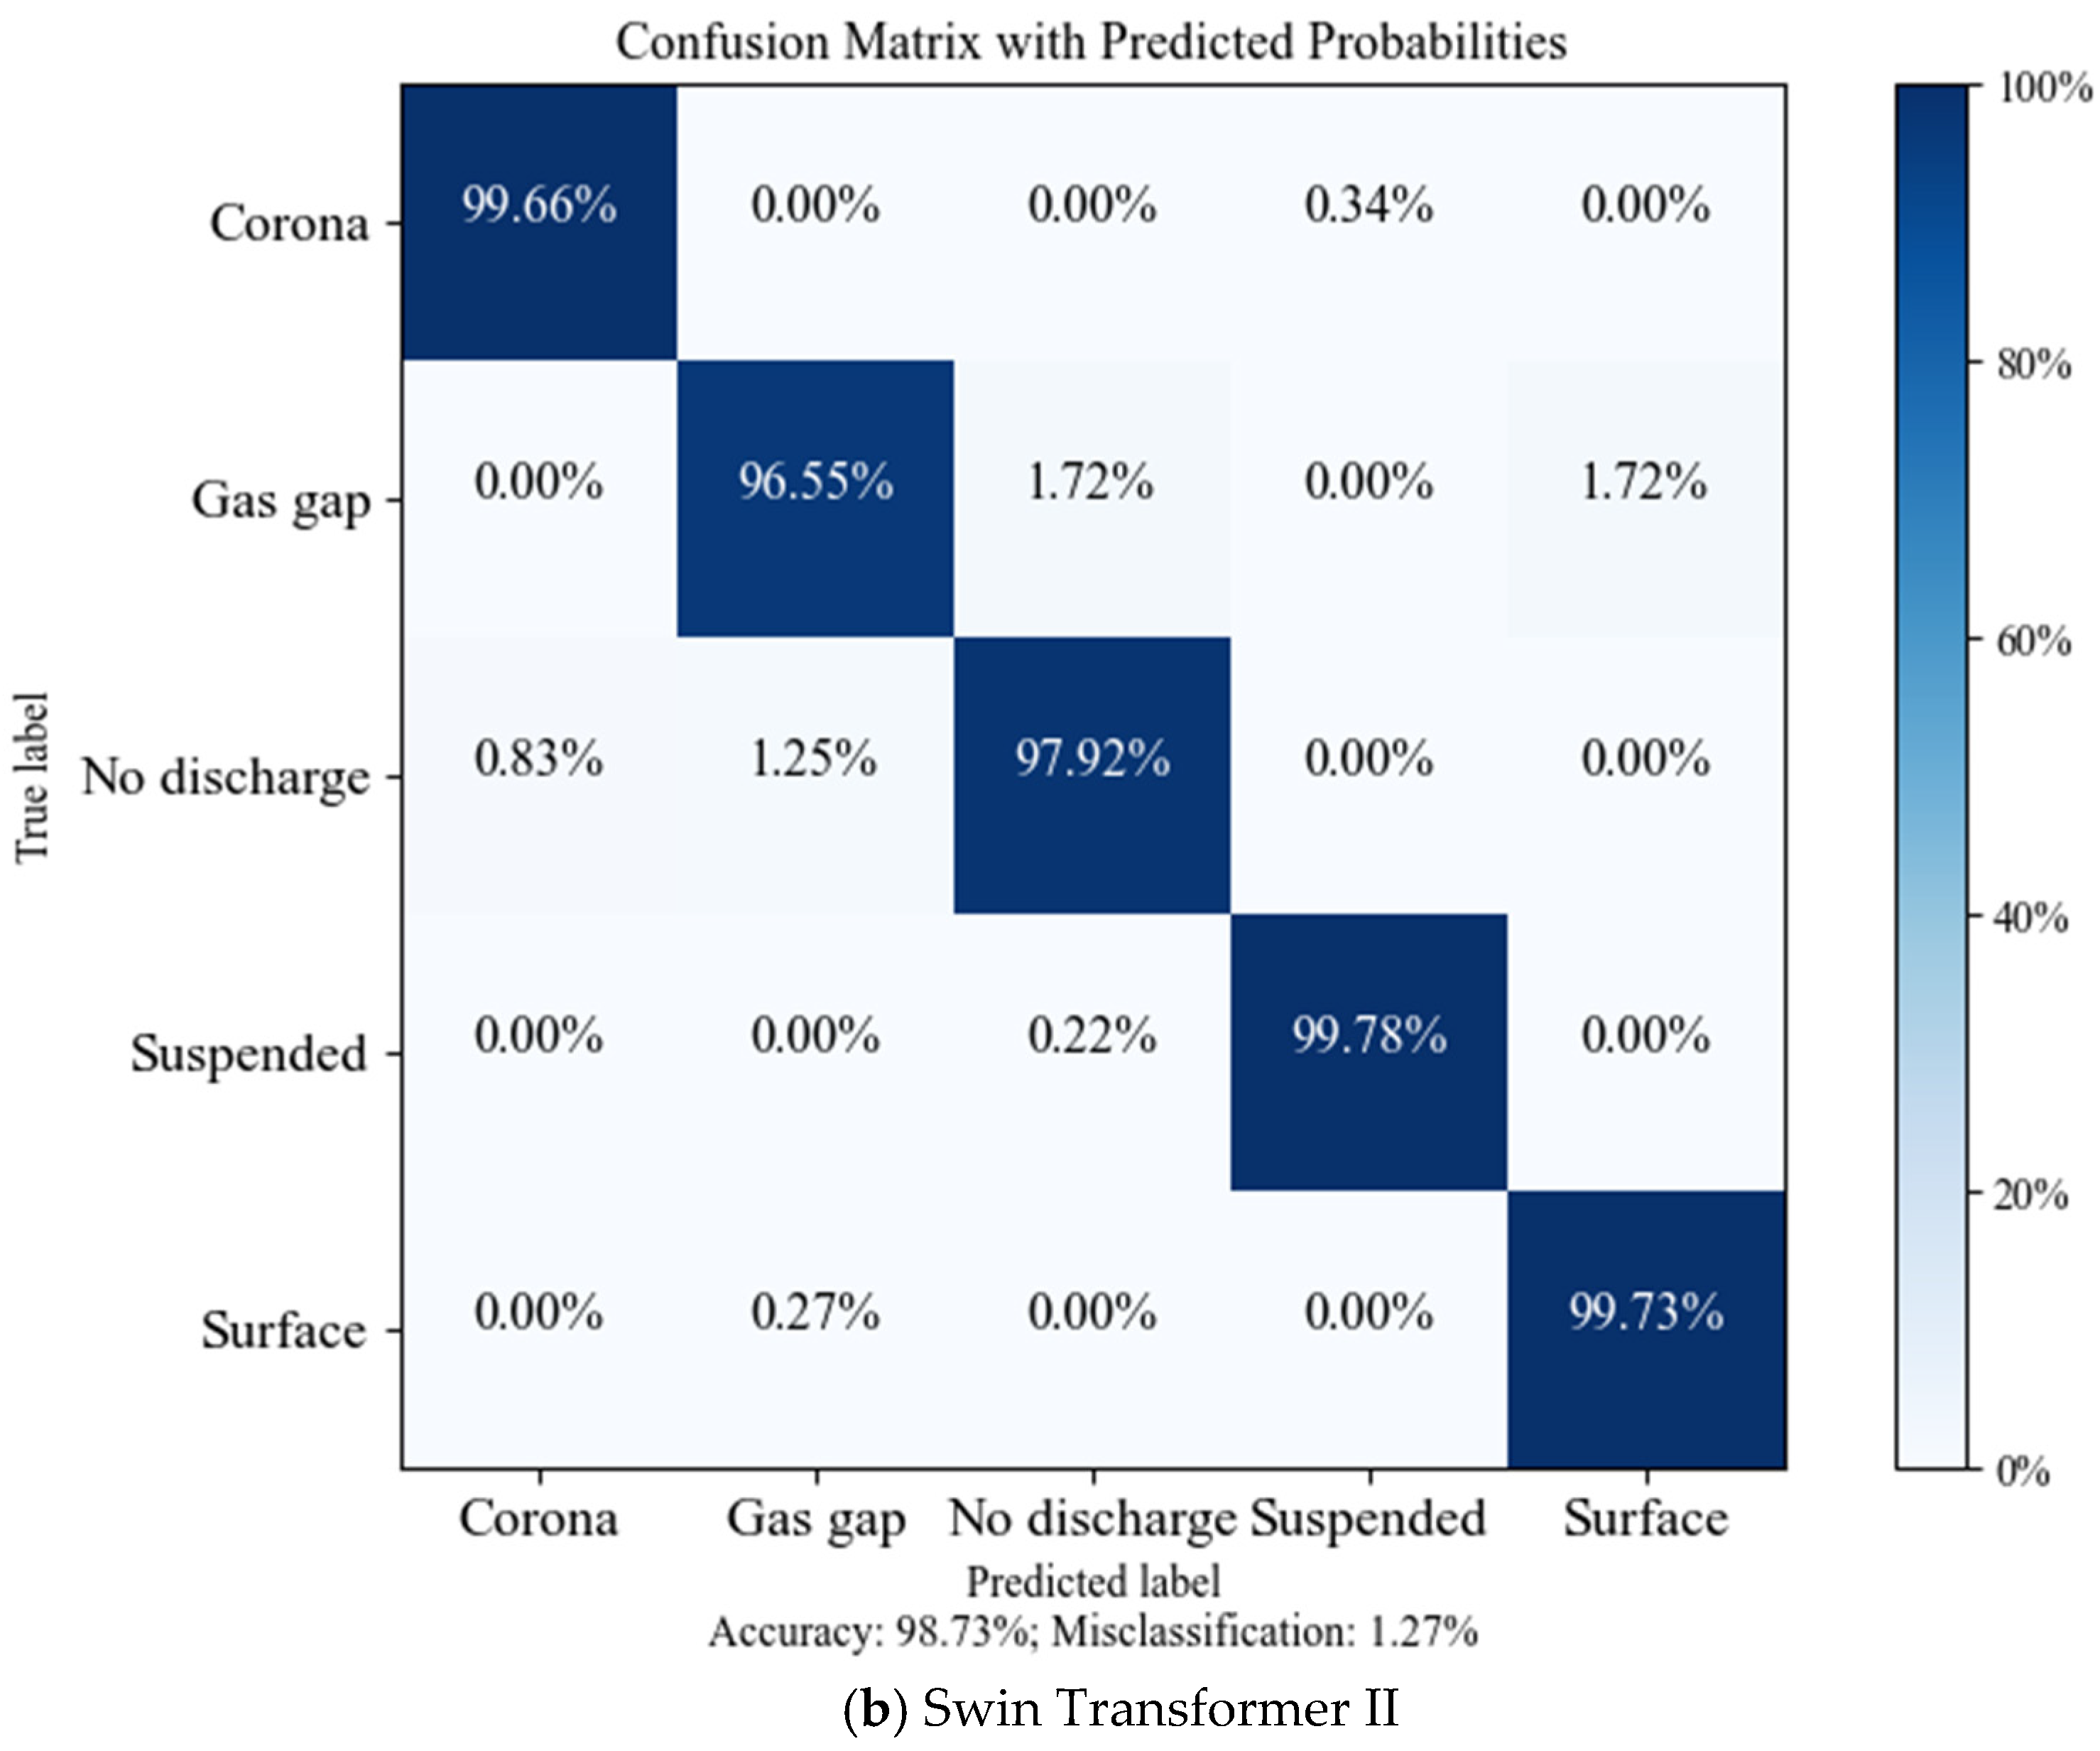
The confusion matrix for partial discharge map classification at epoch 200 for the two Swin Transformer models is shown in
Figure 9. It can be seen from this figure that in Swin Transformer I, 1.02% of the maps, which are actually corona discharge, are misclassified as surface discharge, while 2.18% of surface discharge maps are misclassified as corona discharge. This indicates that Swin Transformer I does not fully learn the features of maps with strong similarities. Similarly, surface discharge and no partial discharge cause significant interference in the identification of gas gap discharge. By introducing learning rate adaptation in Swin Transformer II, key features from various partial discharge maps are effectively captured, reducing the error rate. For example, in the proposed model, when identifying gas gap discharge, only 1.72% are misclassified as no partial discharge or surface discharge. It can be observed that the improvements in feature extraction in Swin Transformer II led to varying degrees of improvement in the recognition rates for all discharge types, except for floating discharge.
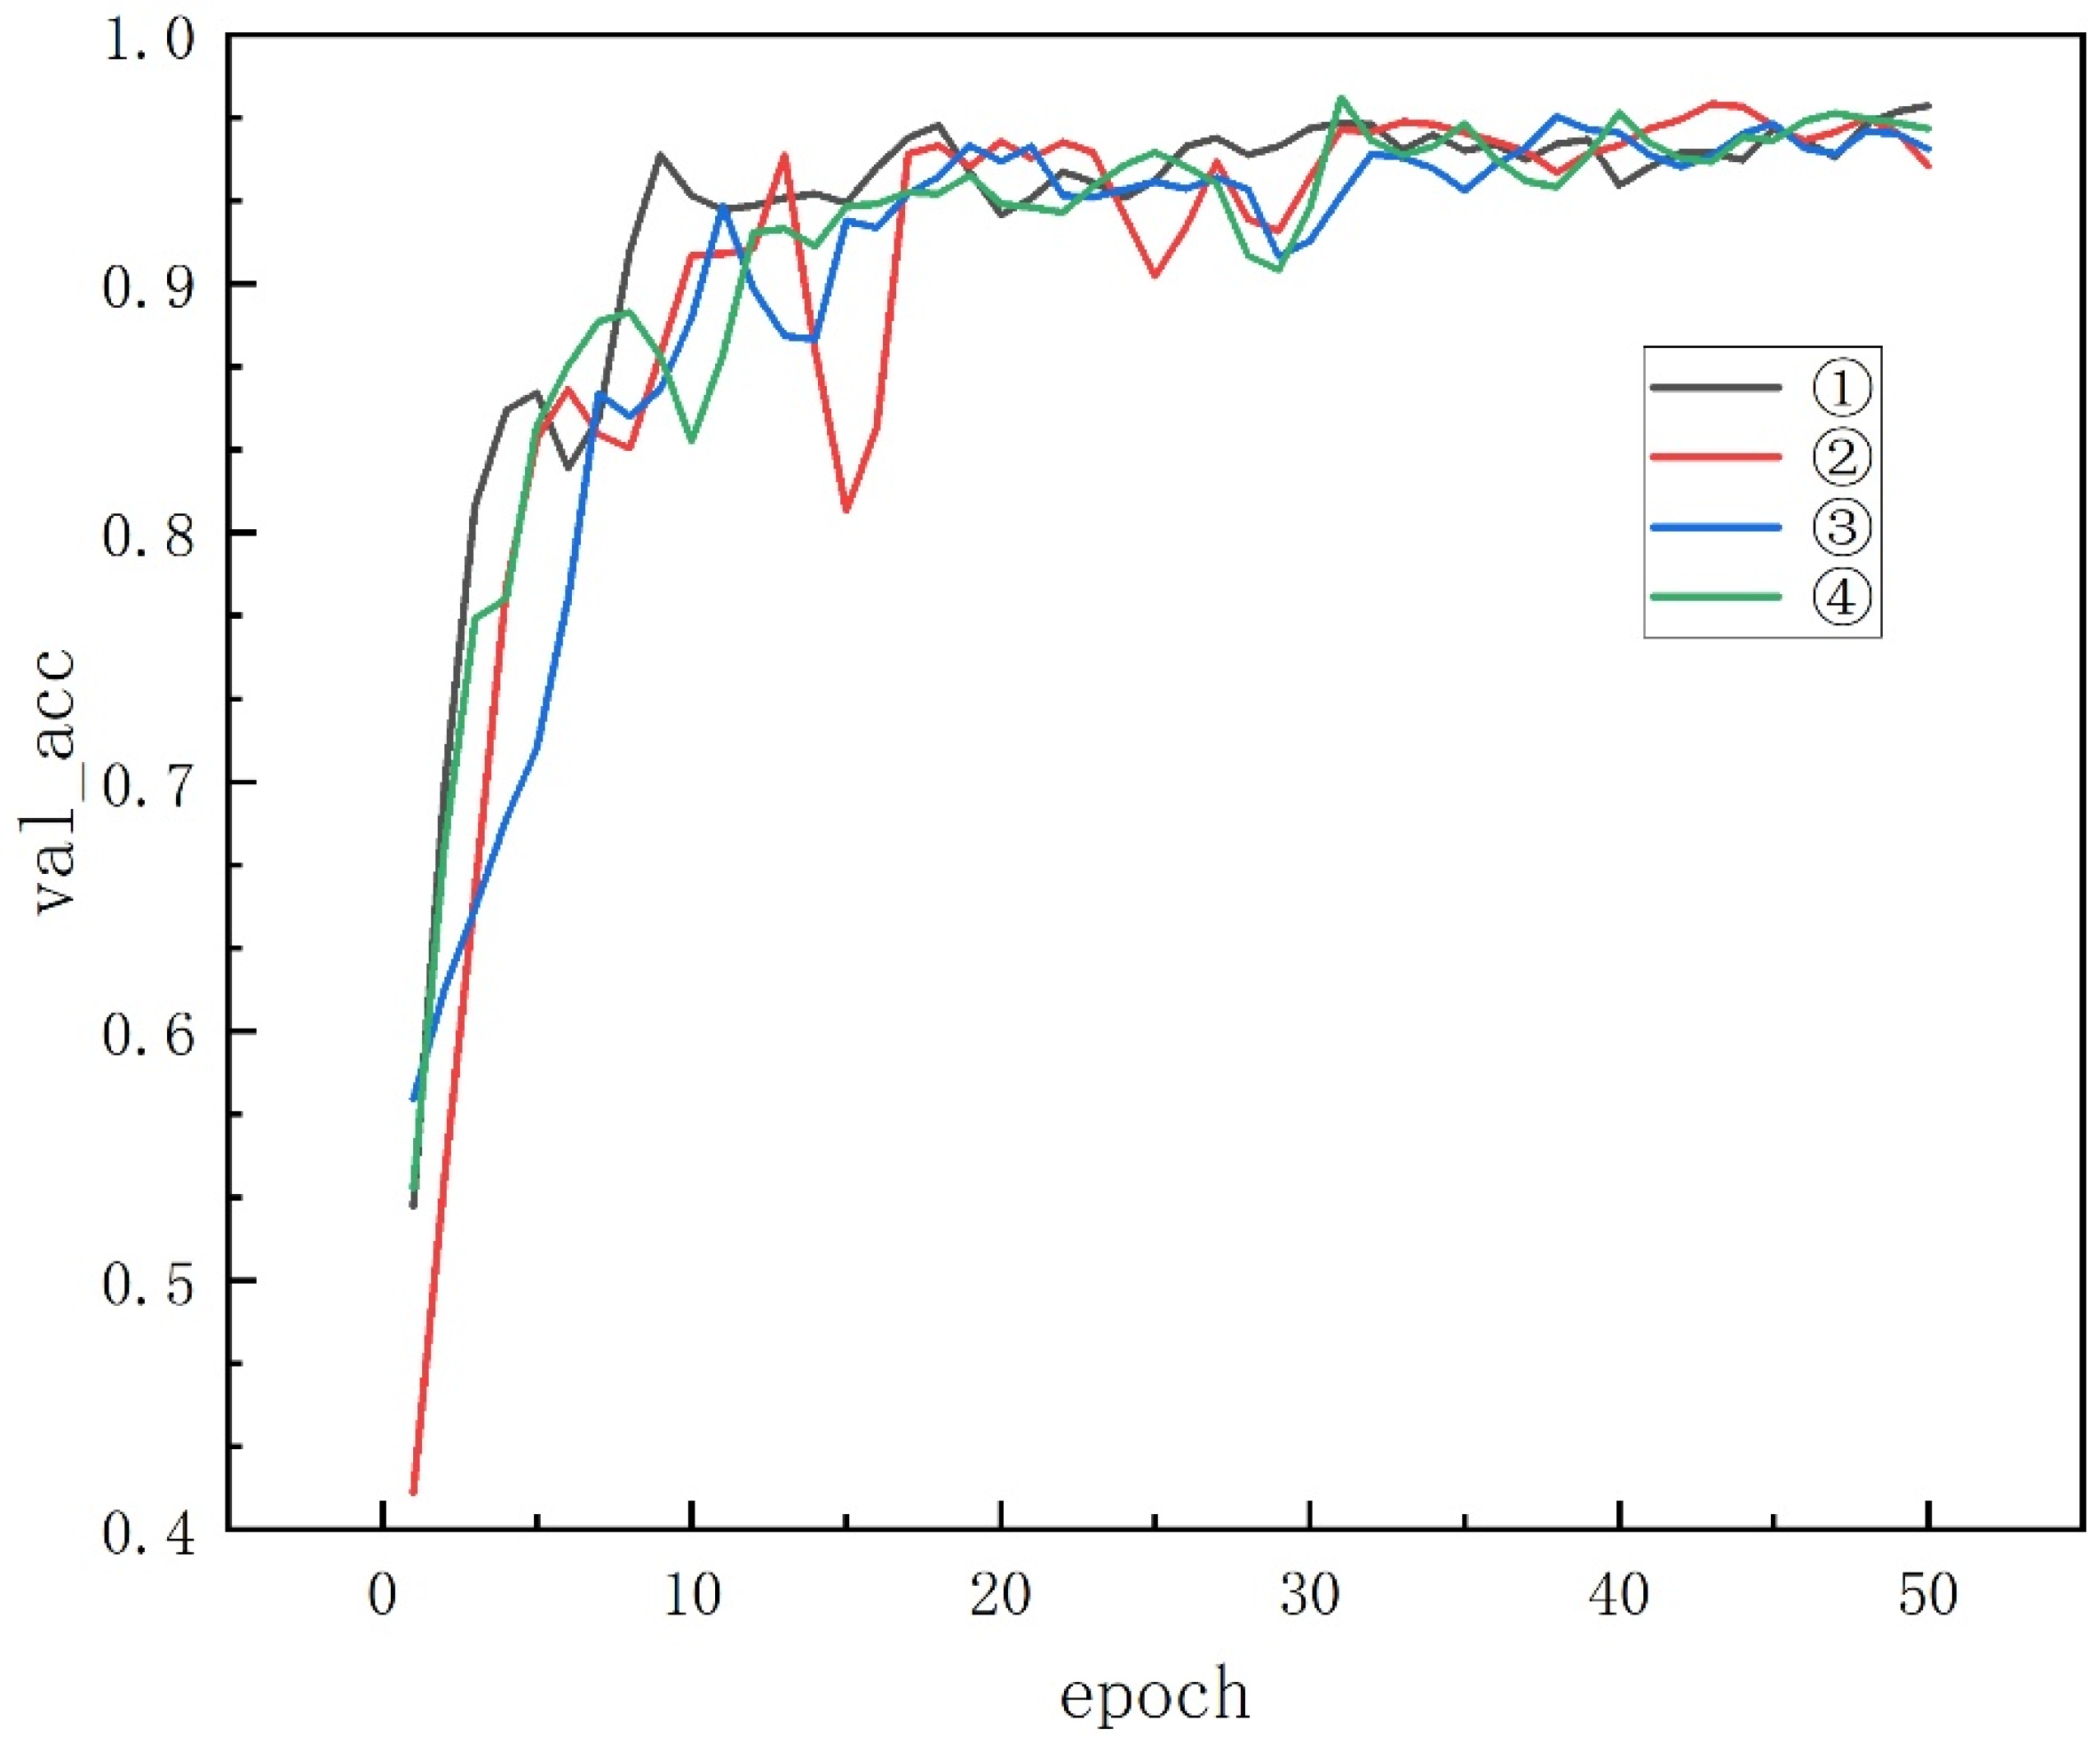
To verify the reliability of the experiments and the stability of the proposed model, three additional sets of repeated experiments are conducted based on the original dataset using Swin Transformer II. Given that the proposed Swin Transformer II exhibits excellent convergence in the early stages of training for pattern recognition, the training data from only the first 50 epochs are selected to save time and computational resources.
Figure 10 presents the accuracy curve of the test set over these 50 epochs.
As shown in
Figure 10, the test accuracy of the proposed Swin Transformer II model demonstrates a significant upward trend during the first 50 epochs, indicating that the model can rapidly learn data features and gradually adapt to the task requirements in the early training phase. More importantly, repeated experiments allow for a comprehensive evaluation of the model’s stability. In this study, three sets of repeated experiments were conducted for the proposed Swin Transformer model. By comparing the accuracy curves of the test set across different experiment groups, it was observed that despite some numerical fluctuations, the overall trend remained consistent. The maximum range occurred at the 15th epoch, reaching 0.241135, which is attributed to the normal variations in feature extraction during the early training phase. However, the fluctuations gradually stabilized after 20 epochs, and by the 50th epoch, the range of test accuracy across the four experiments had been reduced to only 0.010638, demonstrating the model’s high stability and reproducibility under different experimental conditions.
5. Conclusions
This study establishes an experimental platform and presents a Swin Transformer-based approach for partial discharge (PD) pattern recognition, leveraging phase-resolved partial discharge (PRPD) maps to enhance feature extraction and classification accuracy. Through systematic experimental validation, we demonstrate the superiority of our model in convergence speed, classification performance, and robustness, particularly in small-sample scenarios.
Our findings highlight several key insights:
(1) The Swin Transformer-based models exhibit significantly faster loss convergence in the early training stages compared to conventional neural networks. The proposed adaptive learning rate further mitigates post-training loss oscillation, leading to more stable optimization.
(2) In terms of classification accuracy, our optimized Swin Transformer model with an adaptive learning rate reaches 97.52% at epoch 200, demonstrating competitive performance against deeper residual networks while maintaining computational efficiency. Notably, it improves gas gap discharge recognition accuracy by 6.89% over the baseline model, underscoring its effectiveness in small-sample learning.
(3) While deeper Convolutional Neural Networks, such as ResNet152 and Vgg16, achieve high final classification accuracy, their performance gains come at the cost of increased computational complexity. Our findings suggest that lightweight models, such as the Swin Transformer, can achieve comparable accuracy with significantly lower computational demands, making them more practical for real-time PD diagnostics.
These results establish that the proposed Swin Transformer architecture is a viable alternative to traditional deep learning models for high-precision PD diagnosis. The demonstrated improvements in convergence speed, classification robustness, and small-sample adaptability offer a scalable and efficient solution for predictive maintenance in smart grids. Future research should explore model generalization under diverse noise conditions and investigate real-time deployment strategies to further enhance its applicability in industrial settings.


