Article

Design and Optimization of Stem Mustard Cutting Device Based on Response Surface Methodology (RSM)

1
Chongqing Academy of Agricultural Sciences, Jiulongpo District, Chongqing 401329, China
2
School of Intelligent Manufacturing Engineering, Chongqing University of Arts and Sciences, Chongqing 404100, China
*
Author to whom correspondence should be addressed.
Processes 2025, 13(3), 845; https://doi.org/10.3390/pr13030845
Submission received: 19 December 2024 / Revised: 9 March 2025 / Accepted: 11 March 2025 / Published: 13 March 2025

Abstract

:
The high damage rate of mechanical cutting and low harvesting efficiency of stem mustard is a major constraint to the sustainable development of its industry. In this study, a reciprocating cutter device tailored for stem mustard was designed for stem mustard under special growing conditions in southwest China. A reciprocating cutter model was developed based on ANSYS/LS-DYNA. Parameters considered include cutting height (X1), angle of incision (X2), forward speed (X3) and single run displacement (X4). Cutting force (F) and cutting power (P) were identified as evaluation metrics. A multifactor quadratic regression model was developed for the orthogonal combinatorial testing procedure using the Box–Behnken design methodology. Cutting force and cutting power obtained by applied derivation of regression equations were 41.4 N and 36.756 W, respectively. Response surface methodology and analysis of variance (ANOVA) were used to determine the optimum operating parameters of the cutting tools used for machining, which were determined to be X1 = 1.45 mm, X2 = 12°, X3 = 0.5 m/s and X4 = 93 mm. The maximum cutting success rate of 94% and the minimum damage rate of 6% on stemmed mustard under the optimum combination of cutting parameters were verified through several field trials. The results of this study provide valuable technical insights into the optimal design of harvesting equipment for stem and leaf mustard to improve the success rate and reduce the damage rate.

1. Introduction

Brassica juncea, commonly known as stem mustard, serves as the primary raw material for the production of preserved mustard (Brassica juncea var. tumida Tsen). This variety is predominantly cultivated in the Fuling region of Chongqing, where it occupies approximately 8.58 × 10⁴ hectare, representing about fifty percent of the total national cultivation area. Chongqing is situated in a region characterized by hilly and mountainous terrain, where the harvesting of stem mustard is predominantly conducted through manual labor. This method is associated with low harvesting efficiency and elevated costs [1].
In recent years, numerous scientific investigations have been undertaken regarding mechanical devices designed for the harvesting of stem mustard. These studies have focused on integrating the physical characteristics of stem mustard with the soil properties of their cultivation environments [2,3]. Xue et al. have conducted an investigation into the physico-mechanical properties of stem mustard, focusing on various parameters including shape characteristics, pulling force, and root shear force [4]. Furthermore, several researchers have undertaken investigations into various cutting techniques. Zheng et al. implemented a support slip-cutting mechanism, which was generated by the equal-slip-cutting angle type fixed knife and the high-speed rotating movable knife of the crushing knife roller, to process the head stem of stem mustard. They conducted a stress analysis and calibrated the excitation frequency in their study [5]. Utilizing the principles of drag reduction through slip-cutting and self-excited vibration, Zhou et al. developed a slip-cutting self-excited vibration deep pine device. Testing results indicated a drag reduction of 7.79% to 8.81% when compared to the conventional curved deep pine shovel across various speeds [6]. In a separate study, Yuan et al. created an innovative root cutting shovel specifically for spinach harvesting, which incorporates both root cutting and aggregation functionalities, and they formulated a force model to facilitate parameter optimization [7]. Kang et al. utilized a custom-built reciprocating branch cutting test apparatus to examine the shear mechanical properties of apple branches. Their findings indicated a linear relationship between the cutting force and the diameter of the branches [8]. In addition to investigations into cutting techniques, numerous researchers have focused on harvesting equipment specifically for stem mustard crops. Zhang et al. developed a harvester for stem mustard that incorporates a flexible clamping mechanism, achieving a cutting success rate of 89.5% and a damage rate of 10.8% [9]. Jin et al. developed a walk-behind self-propelled combine harvester specifically for stem mustard. This machine incorporates discs equipped with leaf-cutting and defoliation mechanisms that effectively sever the roots and stems. As a result, the cleanliness rate of the harvested stem mustard can reach as high as 90.04% [10]. Du et al. conducted an investigation involving a cutting test on kale roots and stems, revealing that both the clamping method and cutting speed significantly influenced the cutting force. Furthermore, the study established a linear relationship between cutting force and crude fiber content [11,12]. Wang et al. developed a single disc top-cutting apparatus specifically for the harvesting of carrots, achieving a damage rate of 0.53% when the device operated under optimal conditions [13]. Additionally, a spinach harvester featuring a circular saw blade cutter is employed to sever the spinach roots, effectively detaching them from the vegetable leaves, while simultaneously conveying the edible spinach leaves via a conveyor belt [14]. Shepardson et al. primarily concentrated on the research and development of the fundamental components of the kale harvester, which encompasses the plucking device, gripping and lifting apparatus, cutting mechanism, and additional elements [15]. In a similar vein, Didamony et al. engineered a cabbage harvester featuring a sliding cutter disc specifically designed to achieve accurate root cutting of cabbage while minimizing damage [16]. Furthermore, Yasmeen et al. devised a two-row carrot harvester that markedly enhances the efficiency of carrot harvesting through its digging and picking mechanisms [17]. These research findings offer valuable insights into the design and development of harvesting equipment for stem mustard. While most studies concentrate on relatively flat terrains, where operational challenges are significantly reduced, there remains a paucity of research on mechanical harvesting systems specifically tailored for hilly and mountainous regions.
During the harvesting of stem mustard in hilly and mountainous areas, the cutting process represents the most critical step and a key factor influencing the overall success rate of the operation. To address this challenge, this paper proposes an innovative reciprocating cutting device specifically designed for this purpose. Through comprehensive simulation analysis, the device has been optimized to achieve superior cutting performance, with the aim of enhancing the harvest success rate and reducing damage to stem mustard in hilly and mountainous regions.

2. Materials and Methods

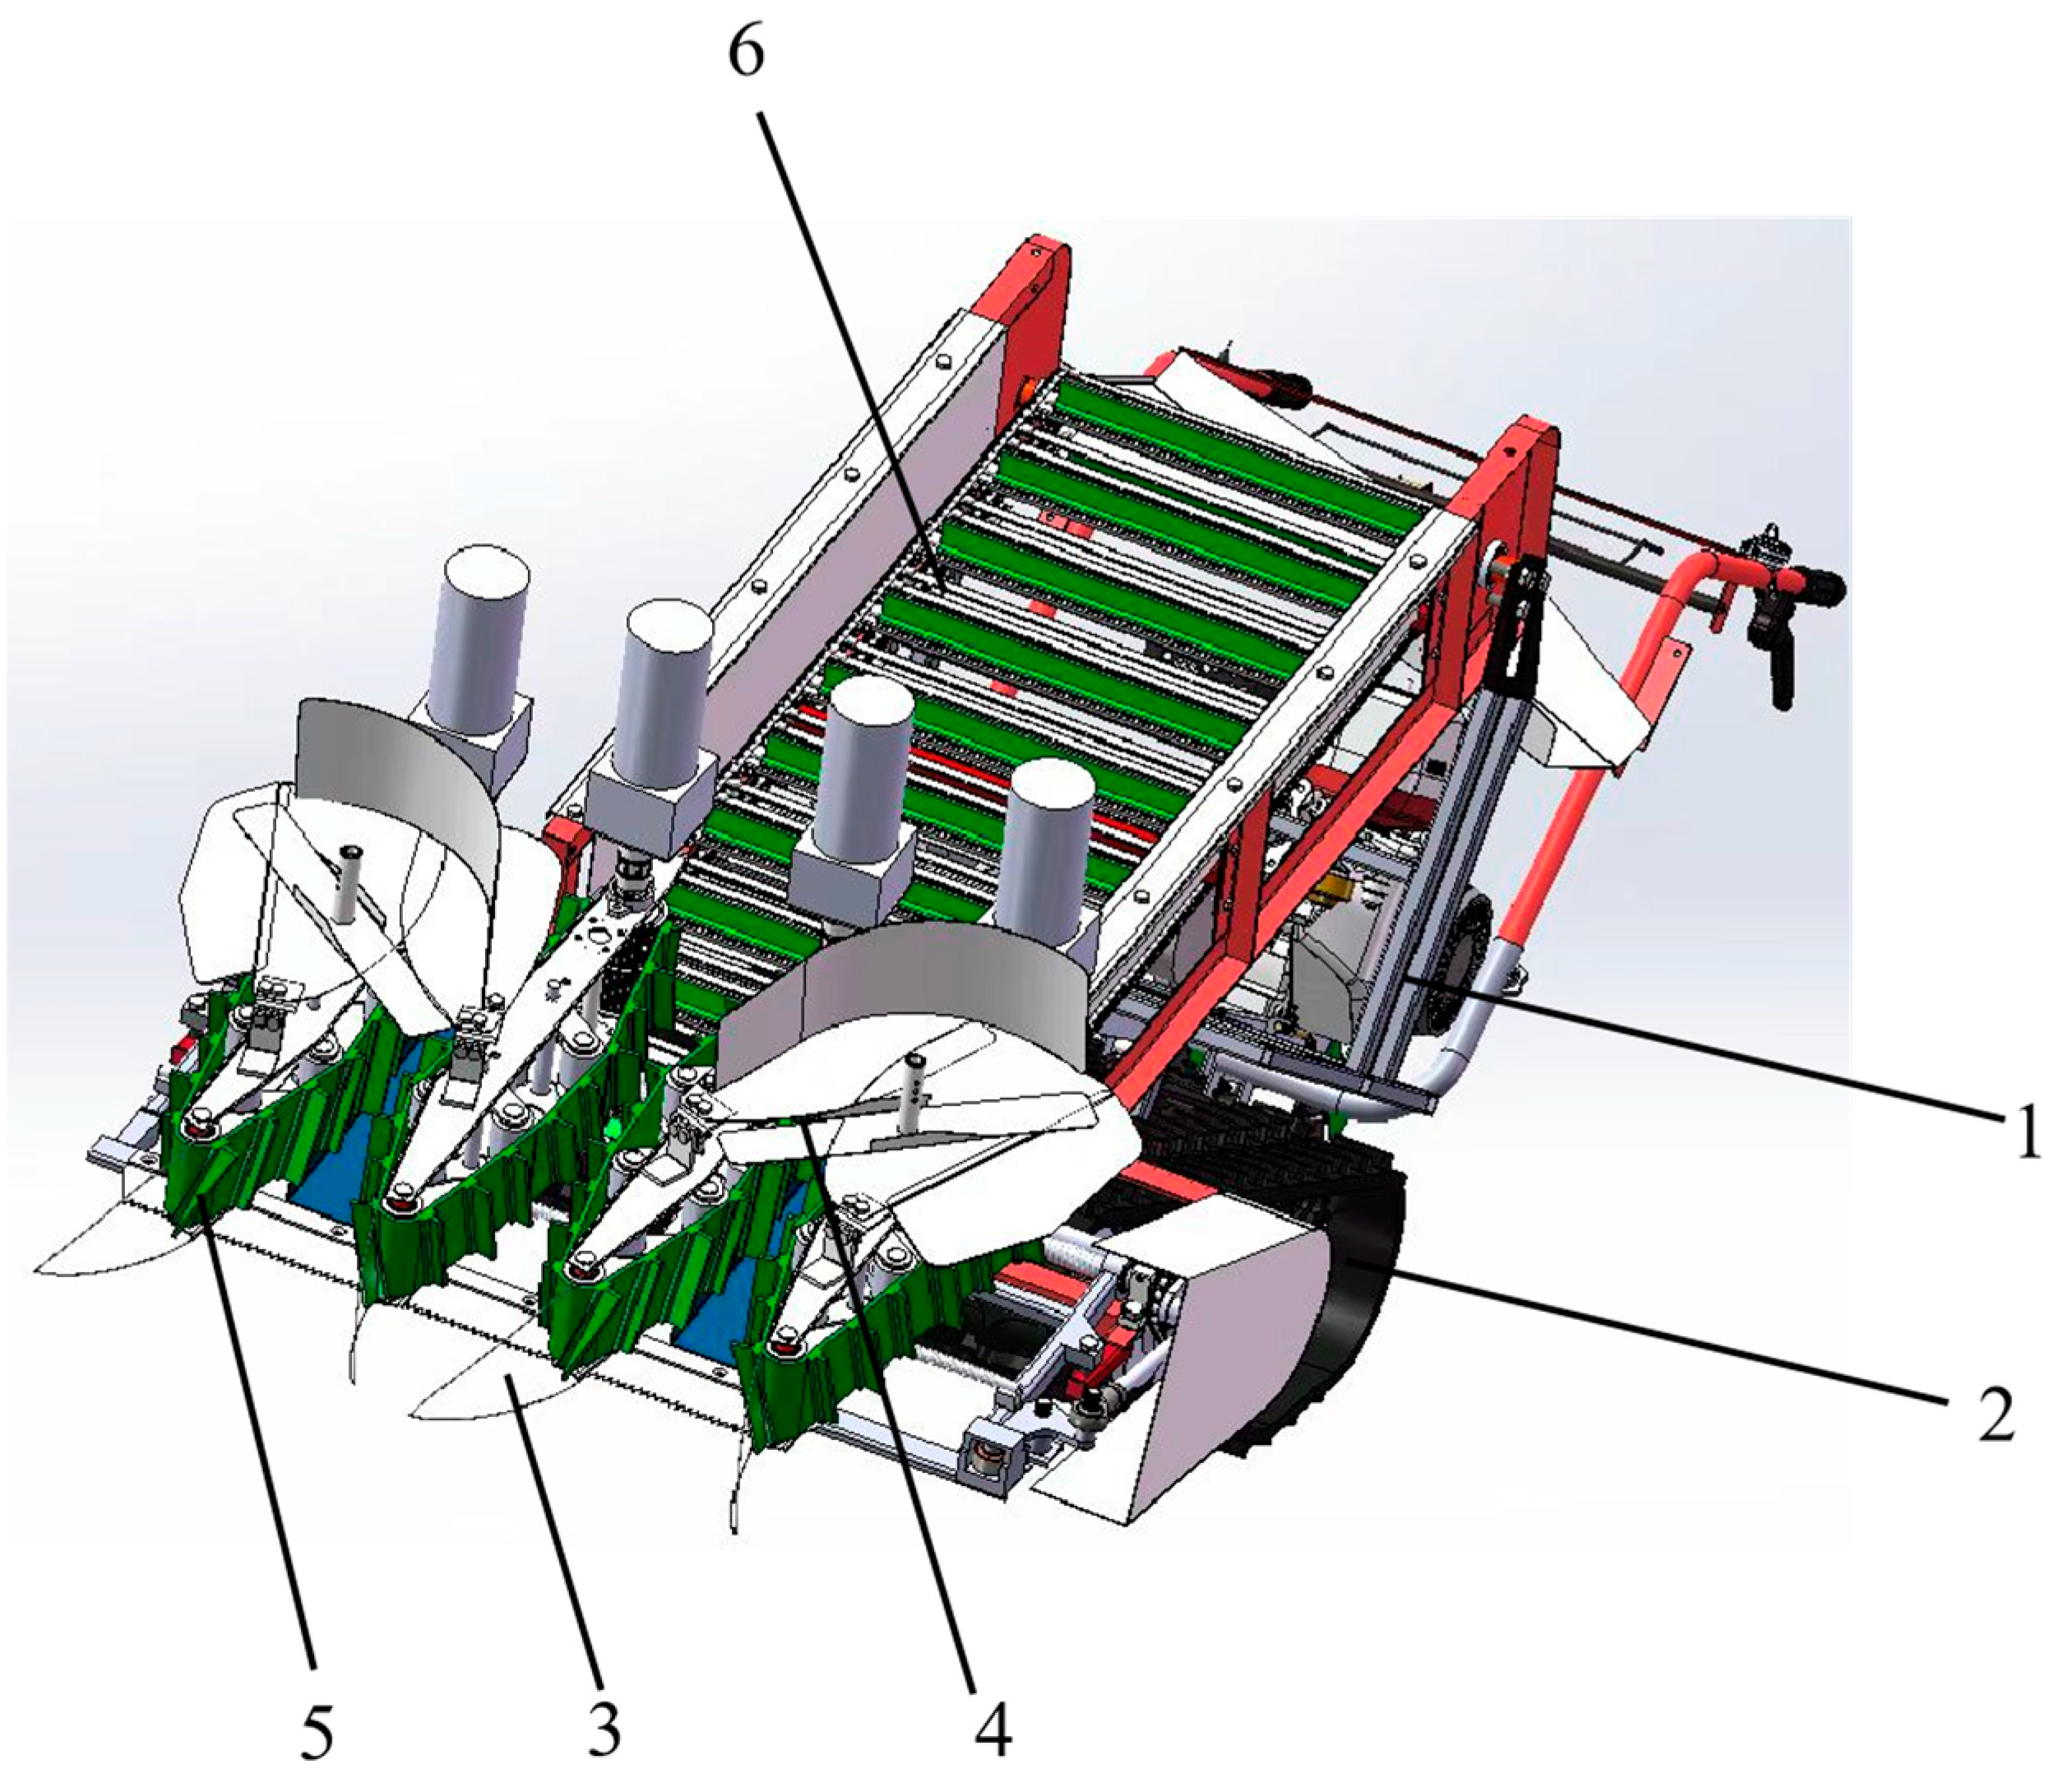
2.1. Machine Structure

The stem mustard harvester is a double-clamping harvester designed for efficient crop collection. It comprises several key components, including the frame, traveling mechanism, vegetable leaf cutting assembly, root–stem dividing device and flexible conveying system. This harvester is capable of performing multiple operations simultaneously, such as root cutting, de-leafing, and conveying of stem mustard, thereby streamlining the harvesting process. The detailed structure of the harvester is illustrated in Figure 1.

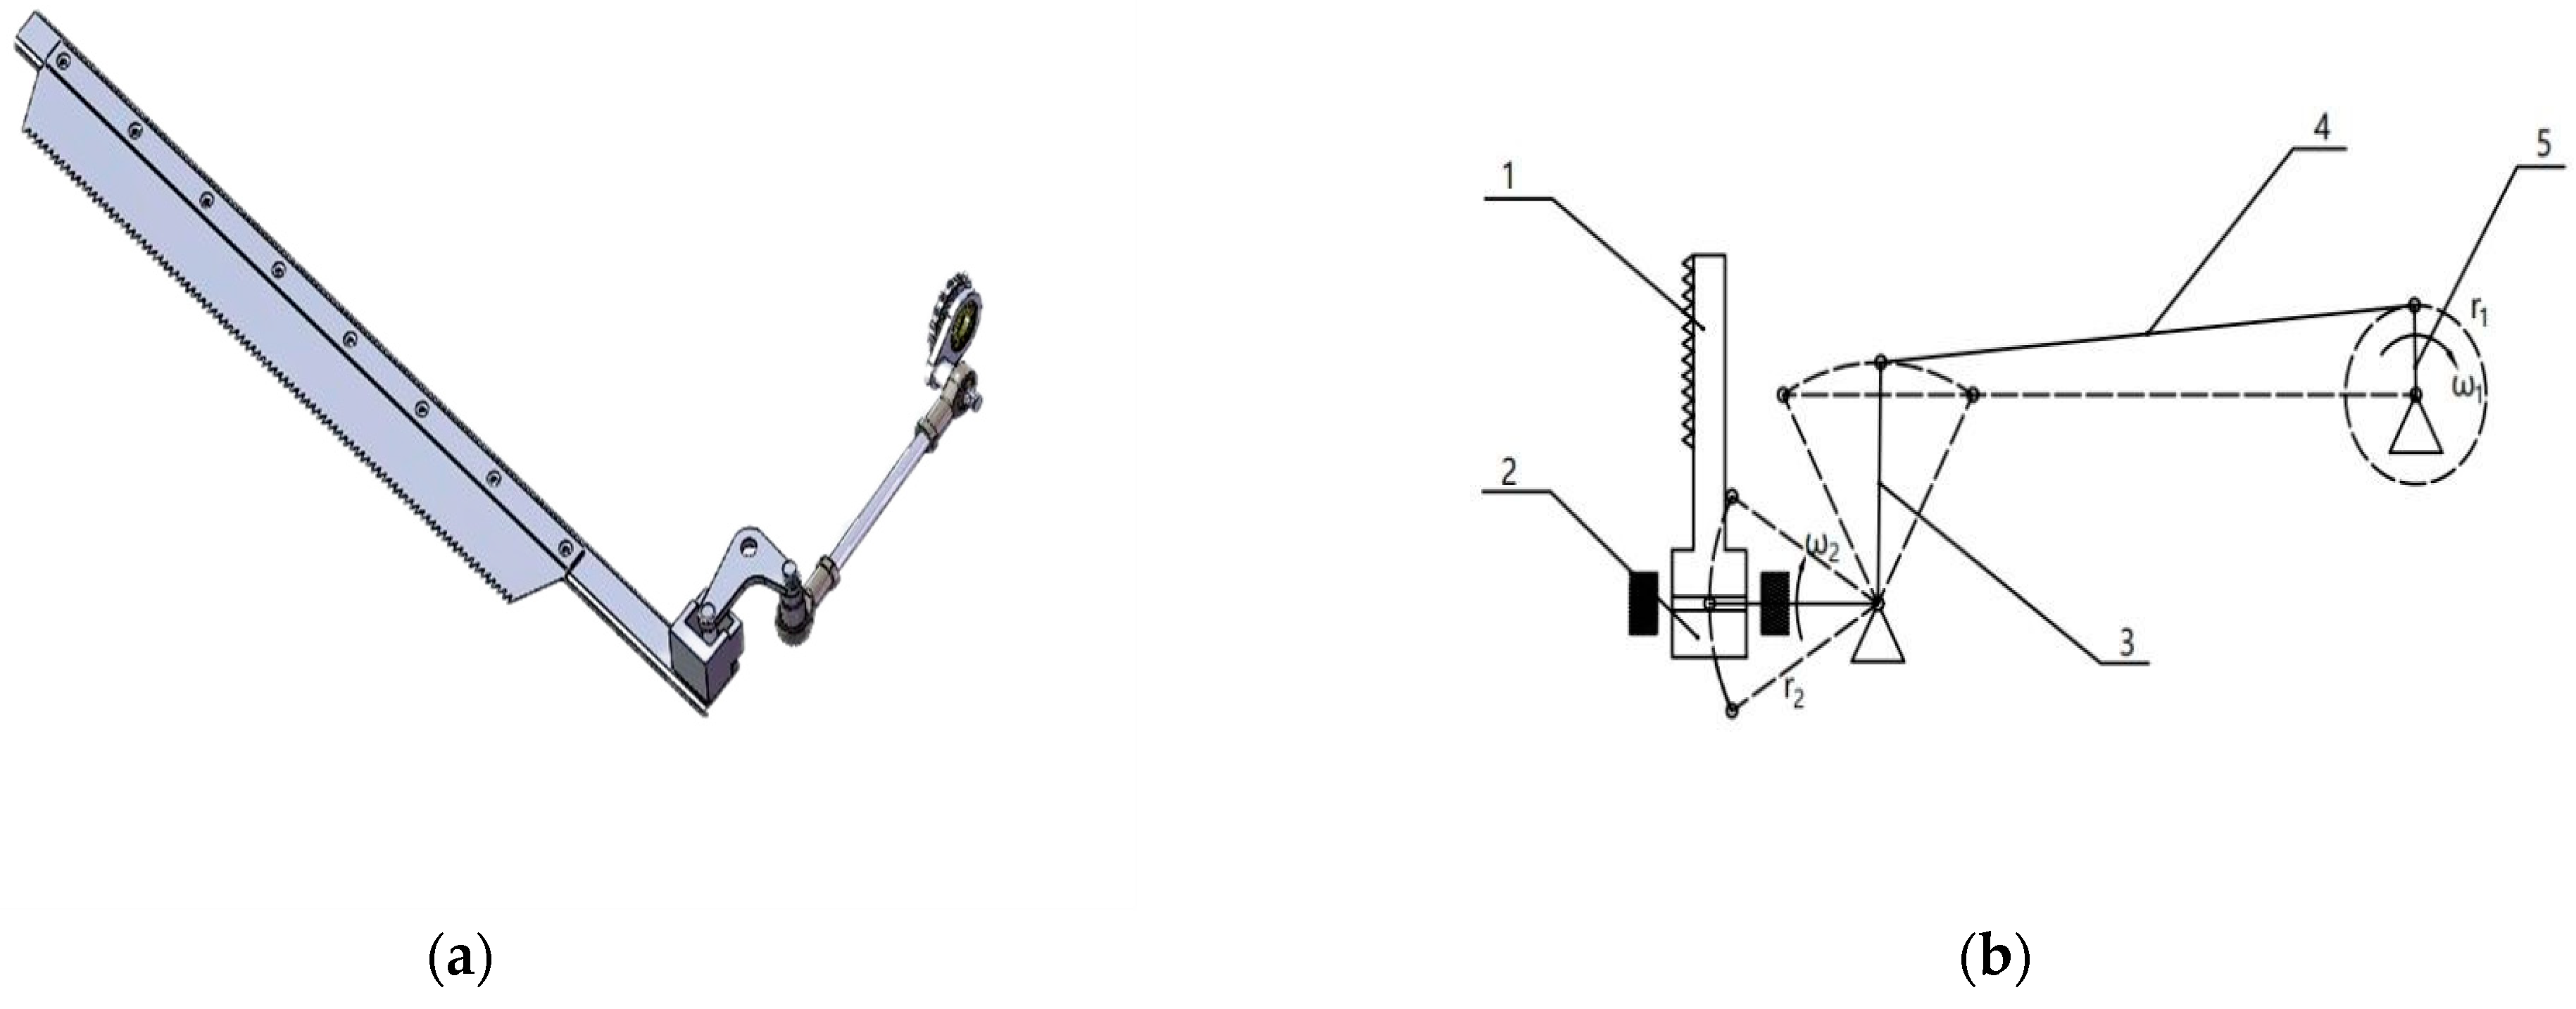
2.2. Design of Cutting Mechanism for Stem Mustard

In the harvesting process of stem mustard, it is essential to consider the limited distance between the stem tumor region and the soil surface. To prevent any potential harm to the stem tumor, the cutting operation must be executed with precision, requiring the cutter to penetrate the soil to a significant depth. Considering the varied and intricate cultivation conditions of stem mustard in Southwest China, this study opted for the implementation of an unsupported reciprocating cutting mechanism, the structural schematic of which is illustrated in Figure 2. The unsupported reciprocating cutting mechanism is primarily composed of essential components, including the cutter assembly, the knife seat support structure, the transmission rocker, the linkage mechanism, and the eccentric sprocket transmission device.
The reciprocating cutting mechanism facilitates the cutting process through the alternating forward and reverse motion of the cutting tool. Within this system, the eccentric linkage rotates, driving the cutting tool to perform a reciprocating cutting motion. The cutting performance is influenced by three key parameters: the feed rate of the cutting tool, its operational speed, and the displacement of a single lateral stroke. Under identical feed rates and operational speeds, increased displacement of a single lateral stroke results in a lower damage rate for the harvested target. The interplay between the motions of each component is described as follows:
r 1 × π ω 1 = r 2 × α ω 2
α = 2 a r c s i n ( h 2 r 2 )
ω 2 = 2 r 2 π r 1 a r c s i n ( h 2 r 2 ) ω 1
where, r 1 is eccentric rod length, mm; ω 1 is eccentric rod angular velocity, rad/s; r 2 is crank length, mm; ω 2 refer to crank angular velocity, rad/s; α refer to crank angle, rad; h is single run displacement of cutter, mm.

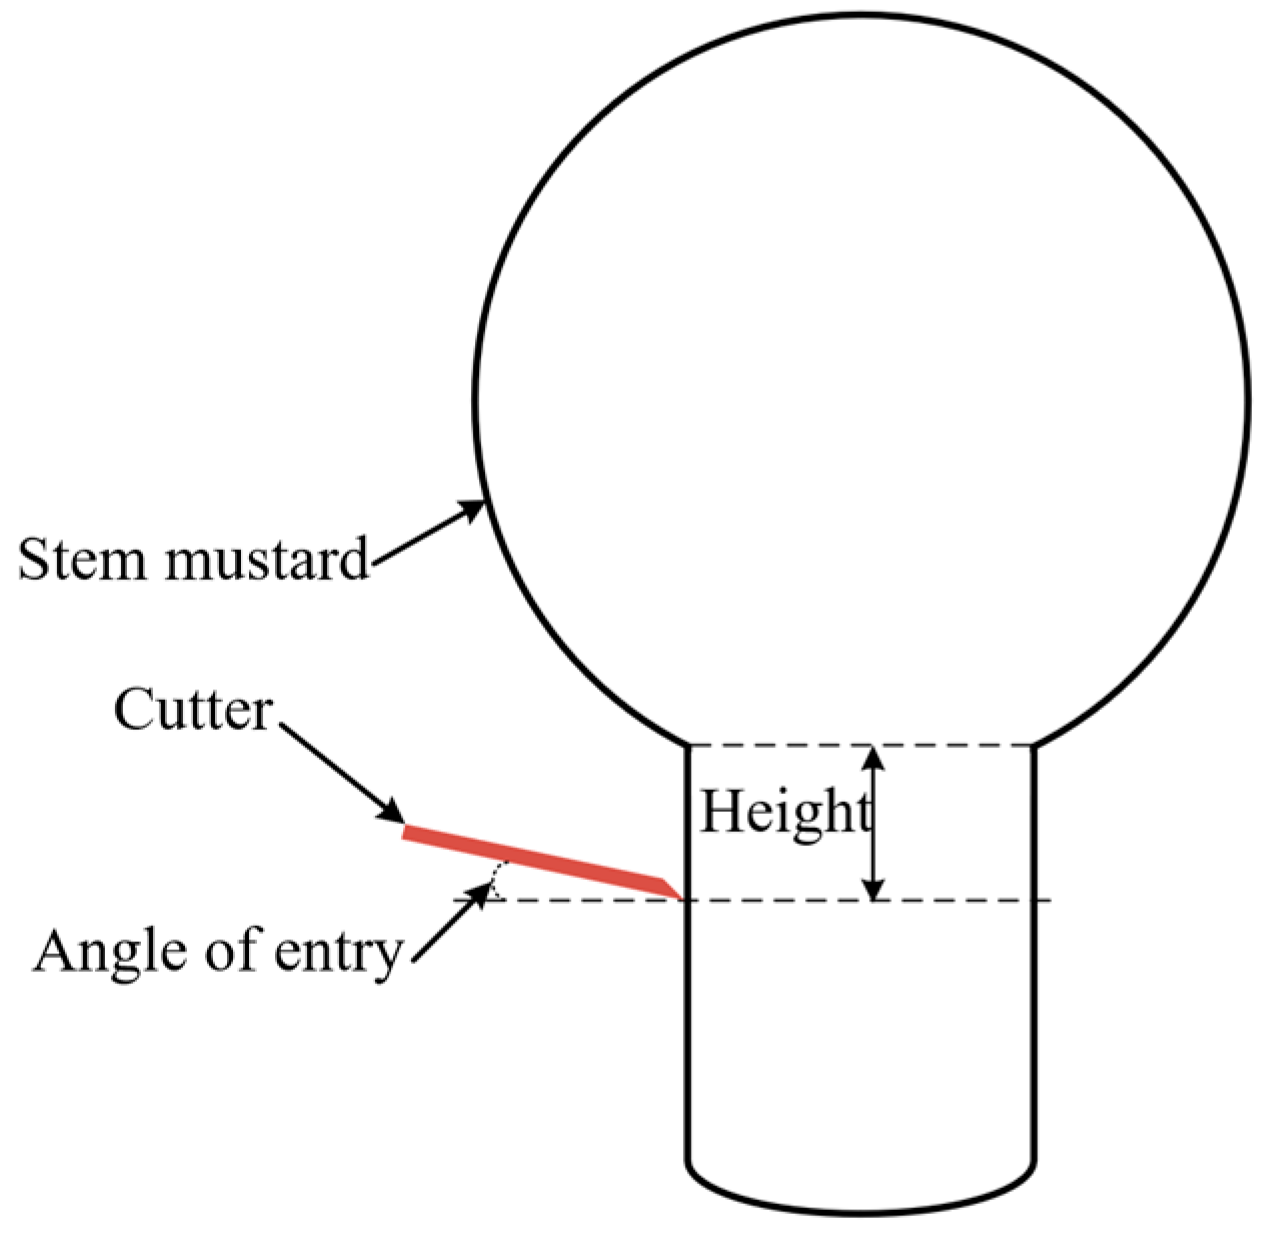
2.3. Cutter Modelling and Analysis

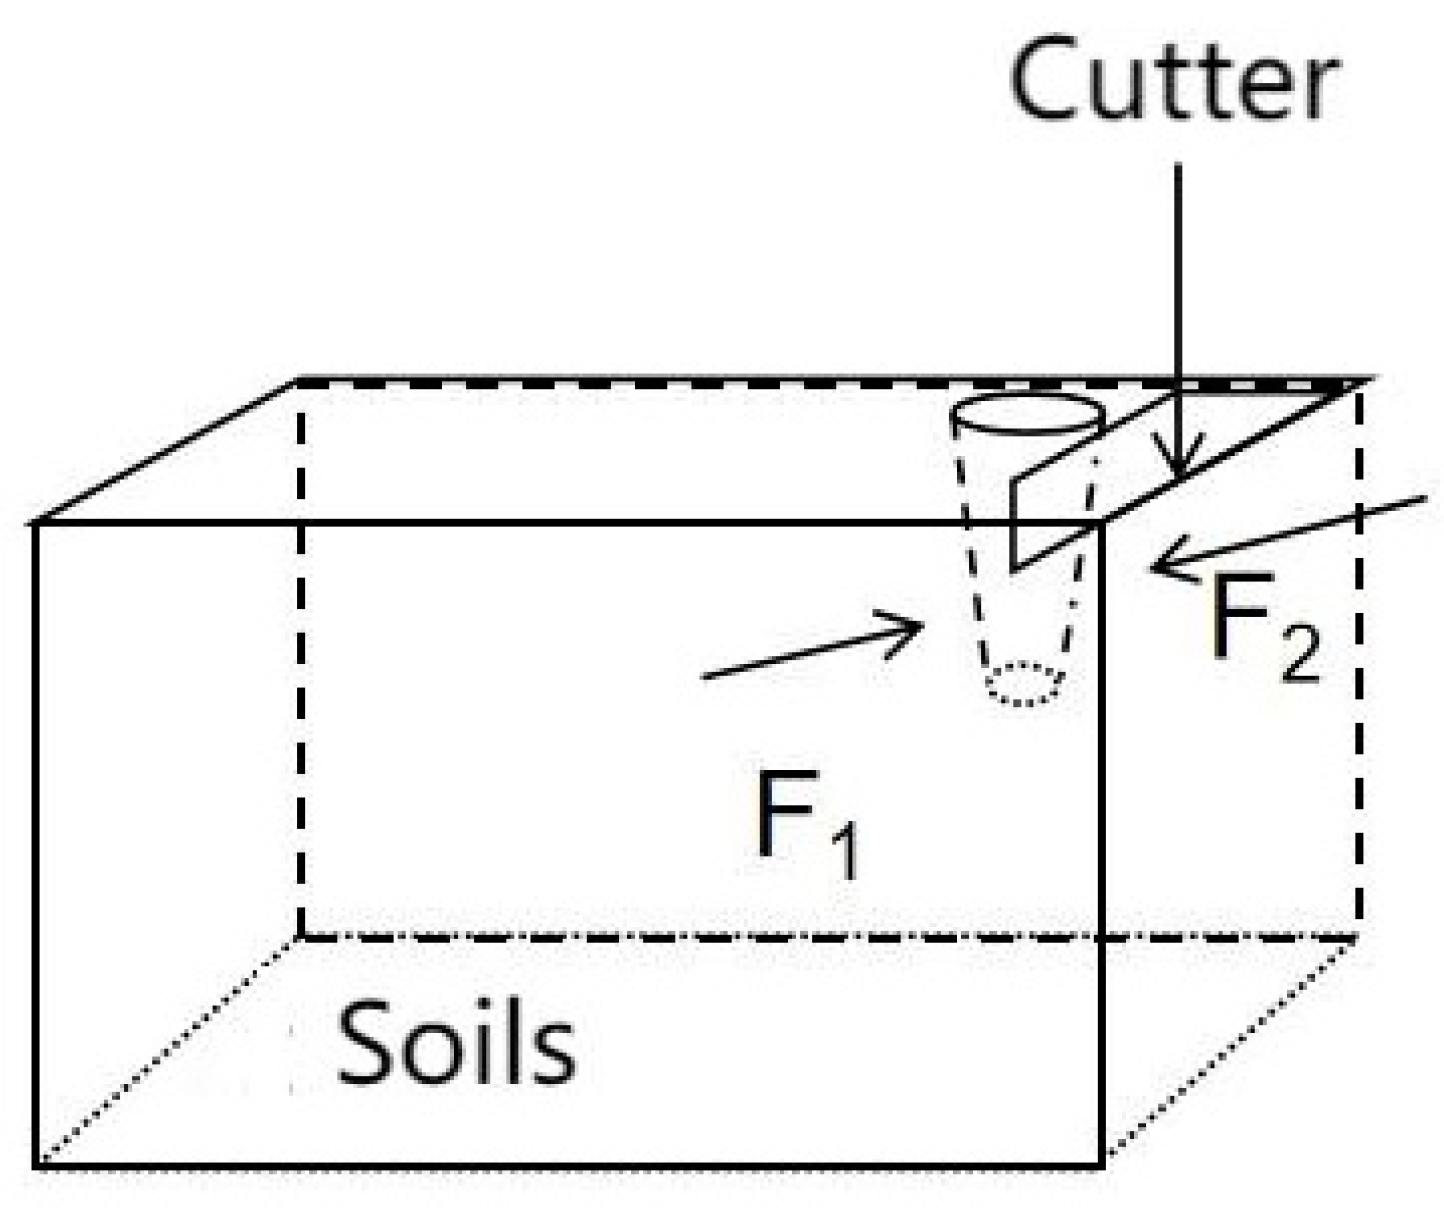
2.3.1. Cutter Cutting Force Analysis

The reciprocating cutting mechanism employed in the process of cutting stem mustard is illustrated in Figure 3. In this scenario, the shortened stem of the mustard plant is positioned vertically, while the cutter engages with the stem at an angle α relative to the ground. As the cutting force is applied, the shortened stem is displaced by a slight angle in the direction of the cutter’s movement. In the course of the cutting operation, the soil forces acting on the truncated stem become considerable, primarily comprising diagonal upward force F1 and diagonal downward force F2, both aligned with the direction of cutting. The combined effect of F1 and F2 generates a wrapping influence on the truncated stem, which serves to inhibit any tipping or fracturing of the stem in response to substantial cutting forces.

2.3.2. Finite Element Modelling

(1)
Cutter and soils
The cutter developed in this research was modeled utilizing an isotropic elastic material, with the specific parameters of this model established within the pre-processing engineering materials library of the workbench. The modeling process incorporates several critical material parameters, including density, Poisson’s ratio, and modulus of elasticity, all of which play a crucial role in influencing the mechanical properties and performance of the cutter during the cutting operation. Furthermore, to enhance the accuracy of the simulation of the cutter’s movement in the actual cutting scenario, it is essential to define the friction coefficients between the cutter and both the soil and the stem mustard.
Soil is a multifaceted substance, exhibiting variability in its characteristics across different geographical regions. Even when the composition remains consistent, variations in factors such as water content, density, and other parameters can result in significant differences in mechanical properties. Consequently, soil is frequently regarded as a non-linear, non-homogeneous, and anisotropic material. When utilizing soil-specific materials such as MAT147 (MAT_FHWA_SOIL), it is evident that these materials exhibit a more comprehensive range of characteristics—such as density, bulk modulus, shear modulus, water content, and cohesion—compared to other materials. The selection of MAT147 facilitates a more accurate simulation of the variations in soil behavior during movement. The soil failure criterion is established on the yield surface defined by the Mohr–Coulomb principle, which serves as the yield criterion. The selected material, MAT_147 (MAT_FHWA_SOIL), represents a modification of the Mohr–Coulomb model, incorporating the Drucker–Prager correction factor (Ahyp) into its modified yield criterion. The revised formula is presented as follows:
σ y = p s i n φ + J 2 K θ + A h y p 2 s i n 2 φ + C c o s p = 0
where, p refers to stresses, n; φ is angle of internal friction, rad; K(θ) refers to (math.) partial plane angle function; J2 is second invariant of the stress tensor, (N2); C is cohesive force, N; Ahyp is a correction factor.
(2)
Stem mustard
Stem mustard primarily comprises stem tumors and abbreviated stems. The physical characteristics of stem mustard are derived from a literature review concerning the orthogonal anisotropic material model selected for material definition. The material associated with the shortened stems is characterized as a non-linear, non-homogeneous, anisotropic elastic material. Consequently, the model for the shortened stem material is chosen from the linear-elastic anisotropic orthotropic material model (MAT_ORTHOTROPIC_ELASTIC), which is deemed suitable for simulating the cutting process.
(3)
Material properties
Based on the current state of stem mustard cultivation in Southwest China, and in conjunction with the modeling principles of the aforementioned components, the attribute parameters for the cutter, soil, and stem mustard have been established as presented in Table 1.

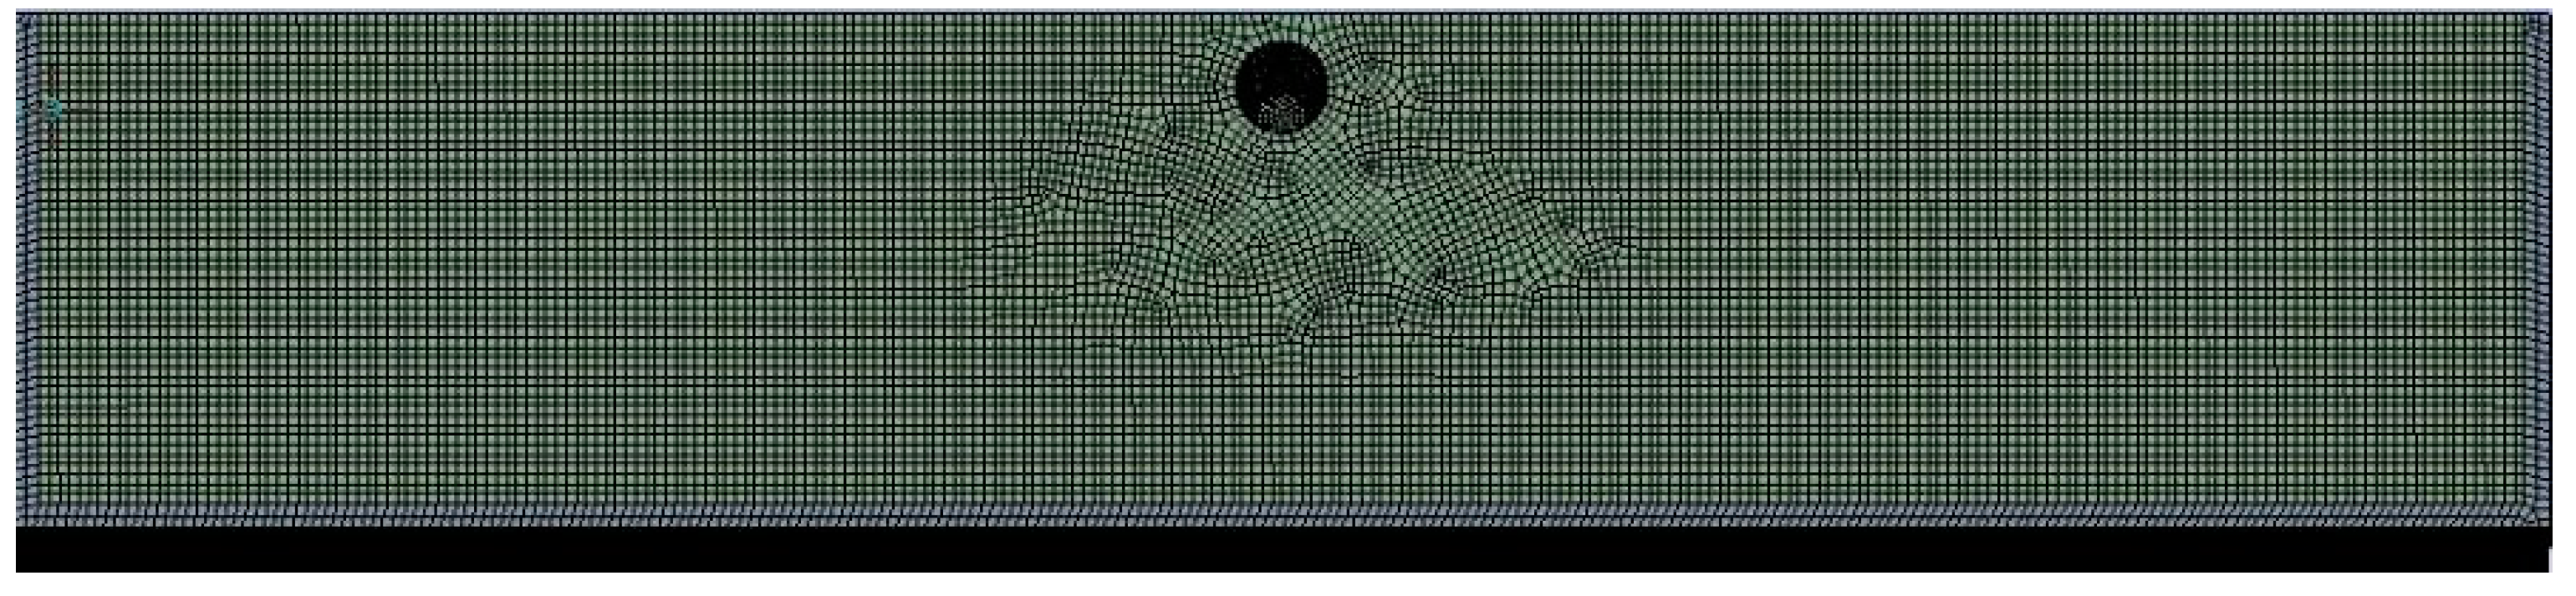
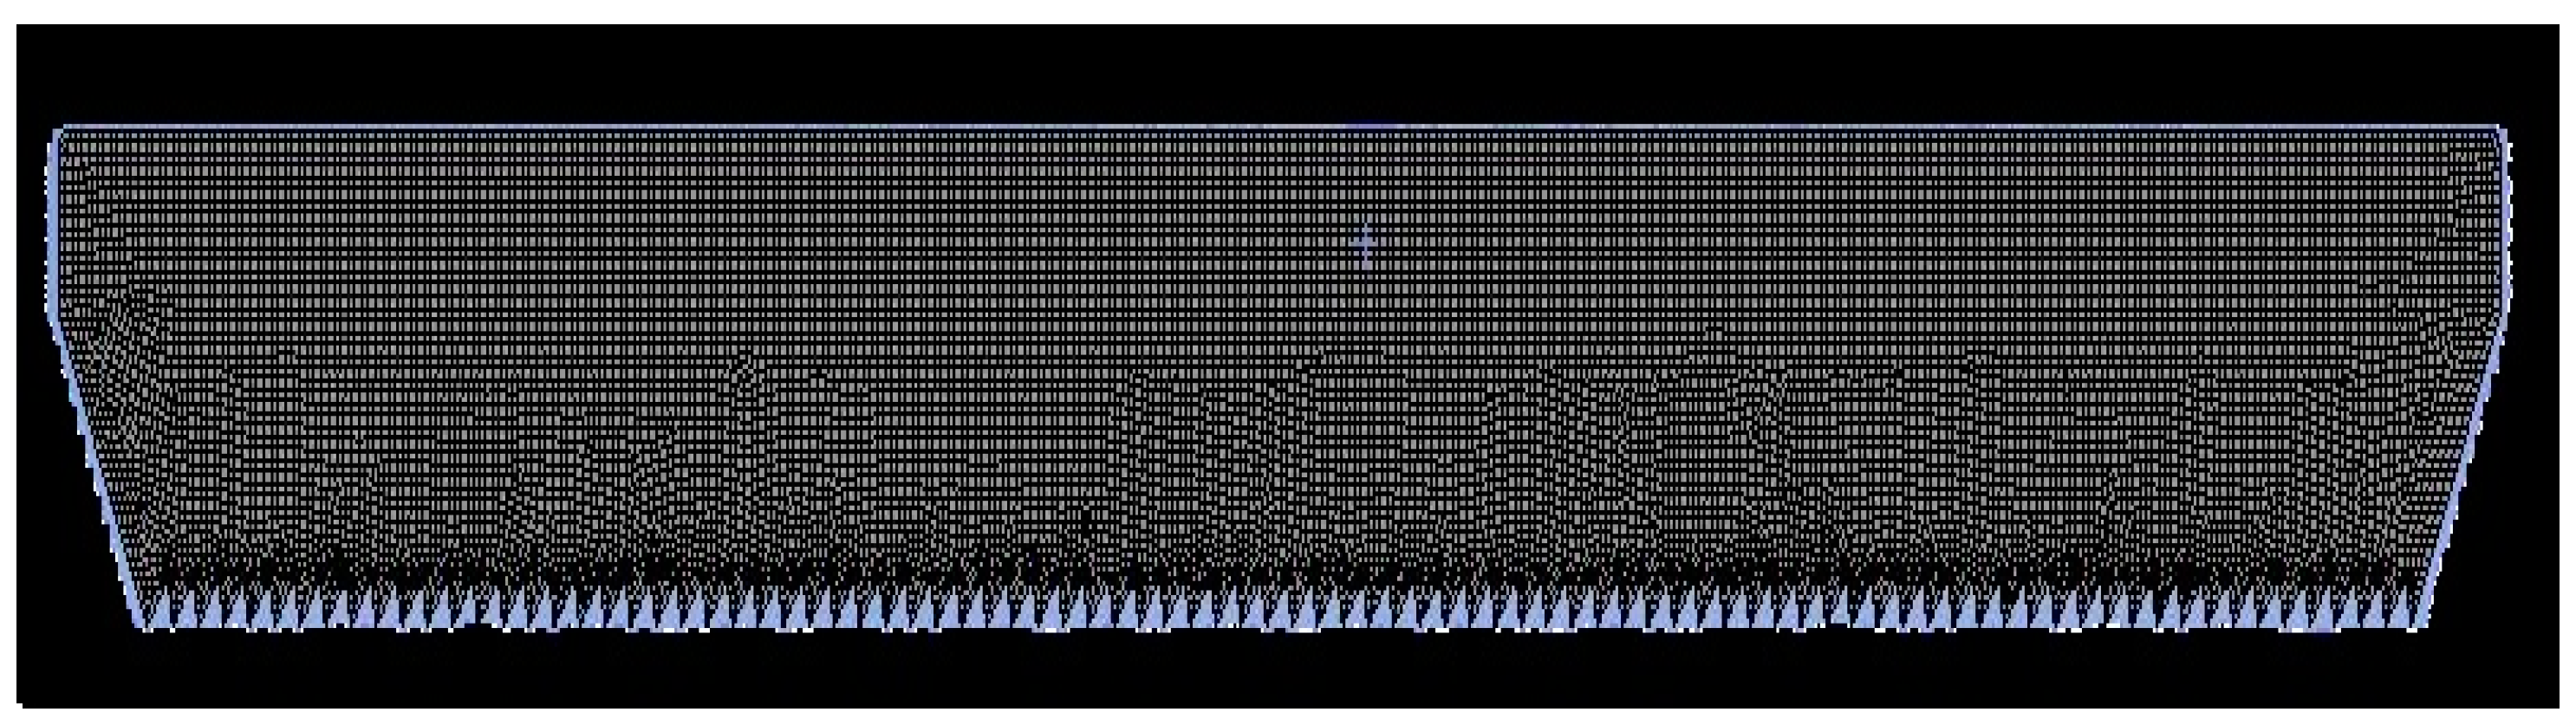
2.3.3. Model Meshing

The process of cutting mustard stems is frequently influenced by a range of external variables, including the morphology of the stem and the operational frequency of the cutting implement. To enhance the simulation of the cutting dynamics as performed by the actual cutter on mustard stems, the aforementioned model has been streamlined, and the following assumptions regarding external conditions have been established:
(1)
The geometry of the truncated stem exhibits a larger diameter at the upper section and a reduced diameter at the lower section, while the configuration of the lower portion is more intricate. During the cutting process, the interface between the truncated stem and the stem tumor constitutes the cutting region. Consequently, the model representing this cutting region can be approximated as a cylindrical shape, thereby enhancing meshing efficiency.
(2)
The single run displacement of the cutter remains unaffected by external variables.
(3)
There is an absence of elastic deformation in the cutter, as well as a lack of misalignment during its movement.
(4)
The soil composition is unaffected by external influences, exhibiting no contaminants, and each segment of the soil possesses uniform characteristics.
To facilitate the modeling process, the soil model has been segmented into two components using SolidWorks (v2023) software. The first component consists of an outer soil structure shaped in a U form, measuring 210 mm × 1020 mm × 50 mm. The second component is an inner soil structure, which is rectangular in shape, with dimensions of 200 mm × 1000 mm × 50 mm. This configuration is illustrated in Figure 4 below.
The model can be conceptualized as a round table and a sphere, based on the previously mentioned simplified conditions pertaining to the shortening of stems and stem tumors. The dimensions of the model are determined in accordance with the experimental parameters, without accounting for the irregular effects associated with the shortened stems and the surfaces of the sphere. To enhance the accuracy of the simulation, the mesh size for the shortening stem has been established at 1 mm, while the cycloid size is set at 2 mm, as illustrated in Figure 5 below.
The cutter serves as the primary instrument in the cutting process, particularly when it comes to the interaction between the cutting tool and the soil, as well as the shortening of stems. The design of the tool and the parameters governing its movement significantly influence the efficiency of the cutting performance. In accordance with the research design pertaining to the reciprocating cutter, a hexahedral dominant mesh type has been established to facilitate accurate resolution of the mesh division. The specified mesh size is 2 mm, as illustrated in Figure 6 below.

2.4. Cutting Impact Factors and Evaluation Indicators

Based on the observed cutting performance characteristics, several key factors influencing cutting quality have been identified, including the cutting height of the cutting tool (X1), entry angle (X2), feed rate (X3) and single run displacement of the cutter (X4); a simplified diagram of the cutting process is shown in Figure 7. Cutting power and cutting force were used as evaluation metrics for the experiment. The Box–Behnken design (BBD) was employed, and the coding of the control factor levels was conducted using a quadratic regression-based orthogonal design, as shown in Table 2.

3. Results

3.1. Analysis of the Results of the Single Factor Cutting Experiment

In preliminary testing, our team’s harvesting equipment utilized the following operational parameters: forward speed of 0.5 m/s, cutting height of 1 mm, tool entry angle of 10° and single run displacement of cutter speed of 1.8 m/s, achieving satisfactory results. When the reciprocating cutting tool maintains a movement speed of 1.8 m/s, its single run displacement is 90 mm. Consequently, in the single-factor cutting experiment, the tool’s forward speed was set to 0.5 m/s, the single run displacement was set to 90 mm, the cutting height was maintained at 1 mm, and the entry angle was determined to be 10 degrees.

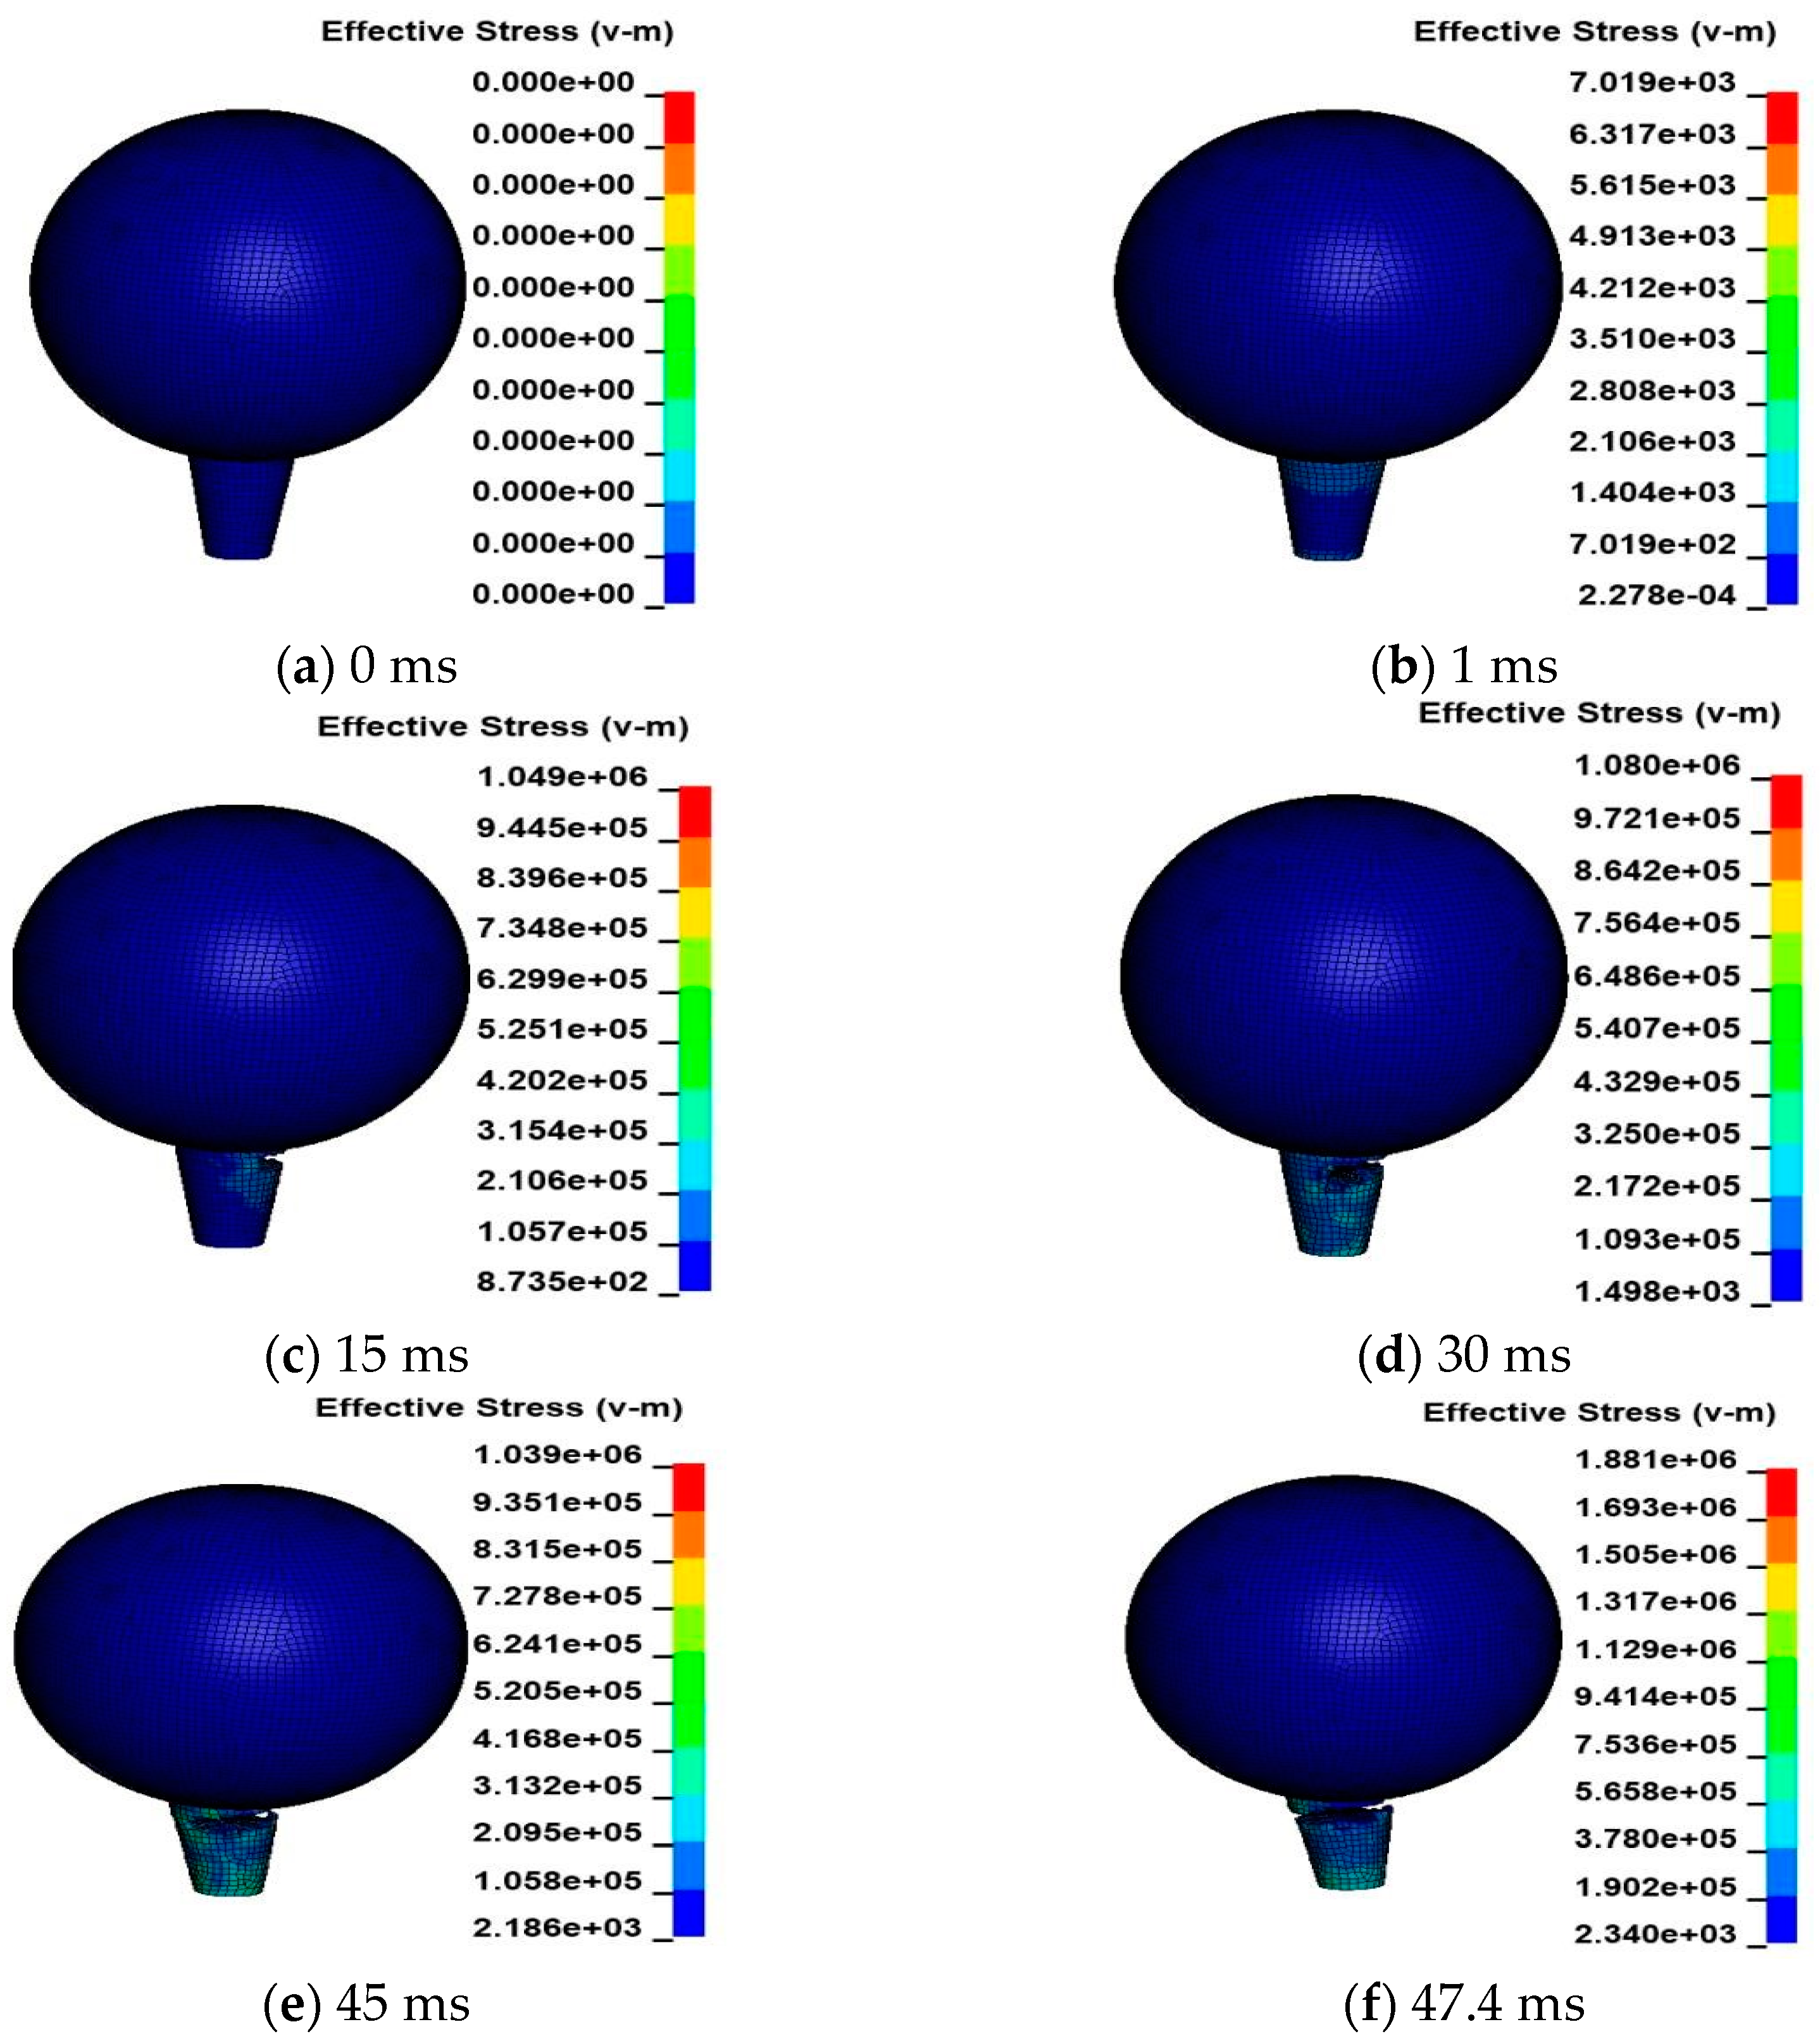
3.1.1. Simulation Analysis of the Cutting Process

The analysis of the cutting process was conducted at various time intervals, as illustrated in Figure 8, utilizing the LS-Prepost animation of soil cutting and Brussels sprouts. The simulation results indicate that as the cutting time increases, the visibility of stem breakage becomes more pronounced. At a cutting time of 0 ms, the soil remained distanced from the shortened stem. At 1 ms, the cutter made contact with the shortened stem, and as the cutting time continued to progress, the cutter progressively penetrated the shortened stem. Each incision results in a minor deformation of the stem, which is promptly reverted to its original position owing to its inherent internal energy. Nevertheless, during the cutting procedure, the influence of gravity on the mustard stem causes the head to descend. The stem, which has been shortened, was severed at a velocity of 47.4 ms; however, it did not exhibit any deflection due to the stabilizing effect of the soil. It is worth noting that during the actual cutting process, the quality of the harvested products may be affected by various complex environmental factors, such as the evenness and hardness of the soil. Therefore, in the subsequent field trials, even if a certain harvesting success rate is achieved, there will still be damage rates to varying degrees.

3.1.2. Analysis of Power Consumption

The cutting force, cutting power, and energy consumption profiles of the cutting process, as derived from LS-Prepost (Ansys v2023), are illustrated in Figure 9. As depicted in Figure 9a, the cutting force curve indicates that the contact area attains its peak at 44.1 ms, coinciding with a maximum cutting force of 44.6 N. Furthermore, the power curve illustrated in Figure 9b is derived from the energy consumption curve, exhibiting a maximum power output of 39.395 W.

3.2. Results and Analyses of Multifactorial Regression Cutting Experiments

The experimental results derived from a single factor do not adequately represent the overall cutting quality. Consequently, to achieve a more comprehensive understanding of the tool’s cutting performance, this study selected a range of parameters for analysis. Specifically, the cutting height was varied between 0.5 mm and 1.5 mm, the angle of entry was adjusted from 5° to 15°, the forward speed was set between 0.45 m/s and 0.55 m/s, and the single run displacement was maintained within the range of 80 mm to 90 mm. Using Design-Expert software (https://www.statease.com/software/design-expert/, accessed on 18 December 2024), a 4-factor and 3-level orthogonal experiment was conducted, incorporating the factor levels specified in Table 2, resulting in a total of 29 experimental runs. The effects of these variables on cutting force and power were subsequently analyzed. The results of the cutting force and power consumption tests conducted during the cutting process were obtained through simulation experiments, as presented in Table 3.

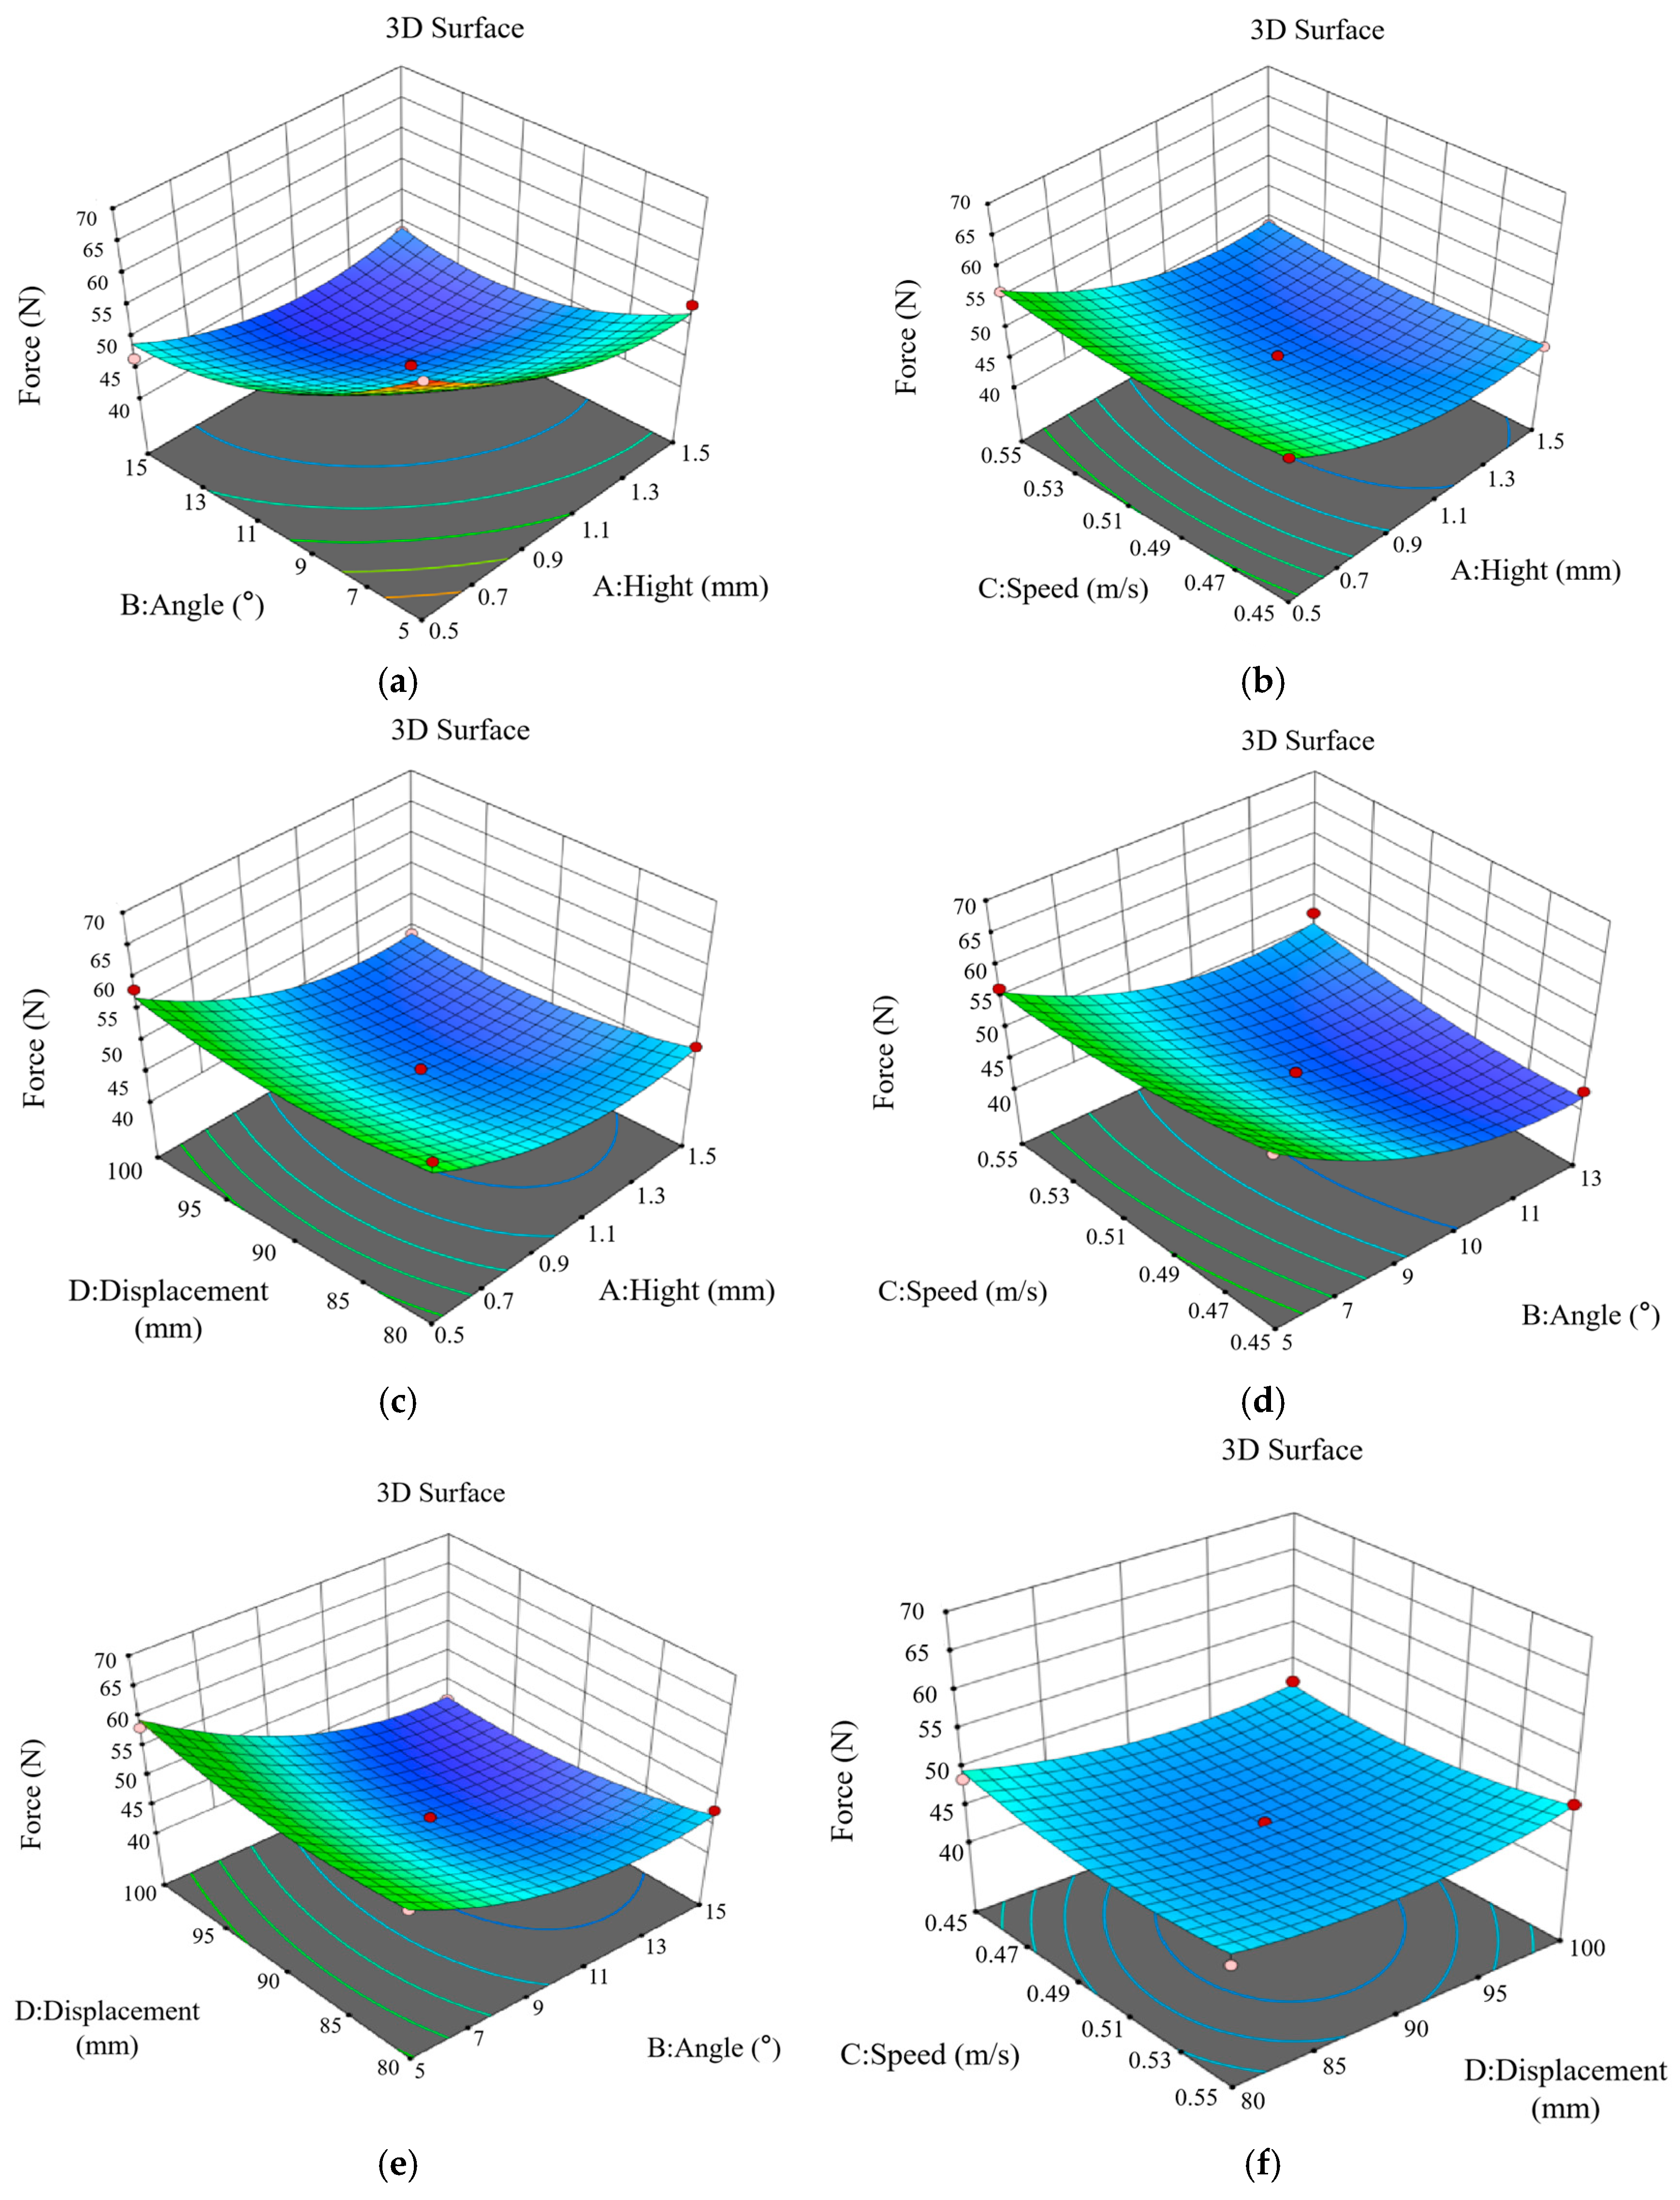
3.2.1. Analysis of Cutting Force

The experimental results were analyzed using the multivariate data approach facilitated by the Design-Expert software, leading to the derivation of regression equations for the cutting force curves as presented below:
F c = 538.16333   23.20333 x 1 6.58533 x 2 925.83333 x 3 4.51450 x 4 + 1.17 x 1 x 2 26 x 1 x 3 0.245 x 1 x 4 + 7.1 x 2 x 3 0.0385 x 2 x 4 + 2.15 x 3 x 4 + 17.77667 x 1 2 + 0.196267 x 2 2 + 687.66667 x 3 2 + 0.022317 x 4 2
The variance associated with the cutting force regression equation is presented in Table 4. The results indicate that the p-value for the cutting force model is less than 0.01 (p < 0.01), suggesting a significant linear relationship among the various groups. Conversely, the p-value for the out-of-fit term is 0.1559, which exceeds the 0.05 threshold. This finding implies that the regression model for cutting force aligns more closely with empirical observations, thereby affirming that the regression equation accurately represents the relationship between the various factors and cutting force. The influence of X1 and X2 on cutting force was found to be highly significant (p < 0.01). Additionally, the interaction terms X1X2, X2X3, and X2X4 exhibited significant coefficients with a significance level of p < 0.05. Furthermore, the secondary terms X12, X22, X32, and X42 also demonstrated significant coefficients on cutting force, with a significance level of p < 0.01. The coefficients of the predictive regression model, along with their corresponding standard errors of prediction, were derived using ANOVA, resulting in a model correlation coefficient of R2 = 0.9790. The normal probability plot illustrates the mapping of various normal distributions onto a singular standard distribution, as depicted in Figure 10. The normal probability plot indicates that the residuals conform to a normal distribution. The alignment of the points along a straight line suggests that the predictive regression model is consistent with the assumptions underlying ANOVA. Additionally, the irregular and dispersed distribution observed between the residuals and the predicted values of the equations further corroborates the model’s reliability and accuracy in the analysis.
Figure 11 presents an analysis of the impact of multifactor interactions on cutting force. As illustrated in Figure 11a, at a cutter forward speed of 0.5 m/s and single run displacement of 90 mm, while maintaining a constant cutting height, the cutting force exhibits a decreasing trend followed by an increase as the angle of the incoming soil varies. Furthermore, when maintaining a constant entry angle, the cutting force exhibits a decreasing trend followed by an increase as the cutting height varies. The minimum cutting force occurs at a cutting height ranging from 0.9 to 1.3 mm, with the entry angle set at 15°. Figure 11b illustrates that at an entry angle of 10° and single run displacement of 90 mm, the interaction between forward speed and cutting height reveals that the cutting force reaches a minimum value within the cutting height range of 0.9 to 1.3 mm. Furthermore, it is evident that variations in forward speed have a negligible impact on this cutting force. Figure 11c illustrates the interaction effects of single run displacement and cutting height at a 10° angle of entry and a forward speed of 0.5 m/s, which exhibit similarities to those presented in Figure 11b. Additionally, Figure 11d depicts the interaction between forward speed and angle of entry, specifically at a cutting height of 1 mm and single run displacement of 90 mm. The analysis indicates that the cutting force exhibits a decreasing trend followed by an increase as the entry angle varies. Specifically, within the entry angle range of 5° to 11°, the cutting force demonstrates minor fluctuations with a general decreasing trend as the forward speed is maintained. Conversely, from an entry angle of 11° to 15°, the cutting force shows slight variations but trends upward with increasing forward speed. Notably, at an entry angle of 15° and a forward speed of 0.45 m/s, the cutting force reaches its minimum value. The interaction effects of single run displacement and angle of entry, as illustrated in Figure 11e, indicate that at a specific single run displacement, the cutting force diminishes as the angle of entry increases. Within the range of 5° to 13°, the cutting force exhibits a slight decrease followed by a gradual increase in response to rising cutting frequencies. Conversely, between angles of entry of 13° and 15°, the cutting force consistently increases with the single run displacement, ultimately reaching its minimum value at an angle of entry of 15° and a single run displacement of 100 mm. Thus, the optimal conditions for minimizing cutting force occur at an angle of entry of 15° and a single run displacement of 100 mm. Figure 11f illustrates the interaction effects between single run displacement and forward speed at a cutting height of 1 mm and an entry angle of 10°. It is observed that at a specific forward speed, when the single run displacement ranges from 80 to 90 mm, the cutting force diminishes as the single run displacement increases. Conversely, within the frequency range of 90 to 100 mm, the cutting force exhibits an increase with rising single run displacement. At a specific single run displacement, it has been observed that when the forward speed ranges from 0.45 to 0.49 m/s, the cutting force diminishes as the forward speed increases. Conversely, within the forward speed range of 0.49 to 0.55 m/s, the cutting force exhibits an increase with rising forward speed. Notably, the cutting force reaches its minimum value at a single run displacement of 90 mm, specifically when the forward speed is between 0.49 and 0.51 m/s.

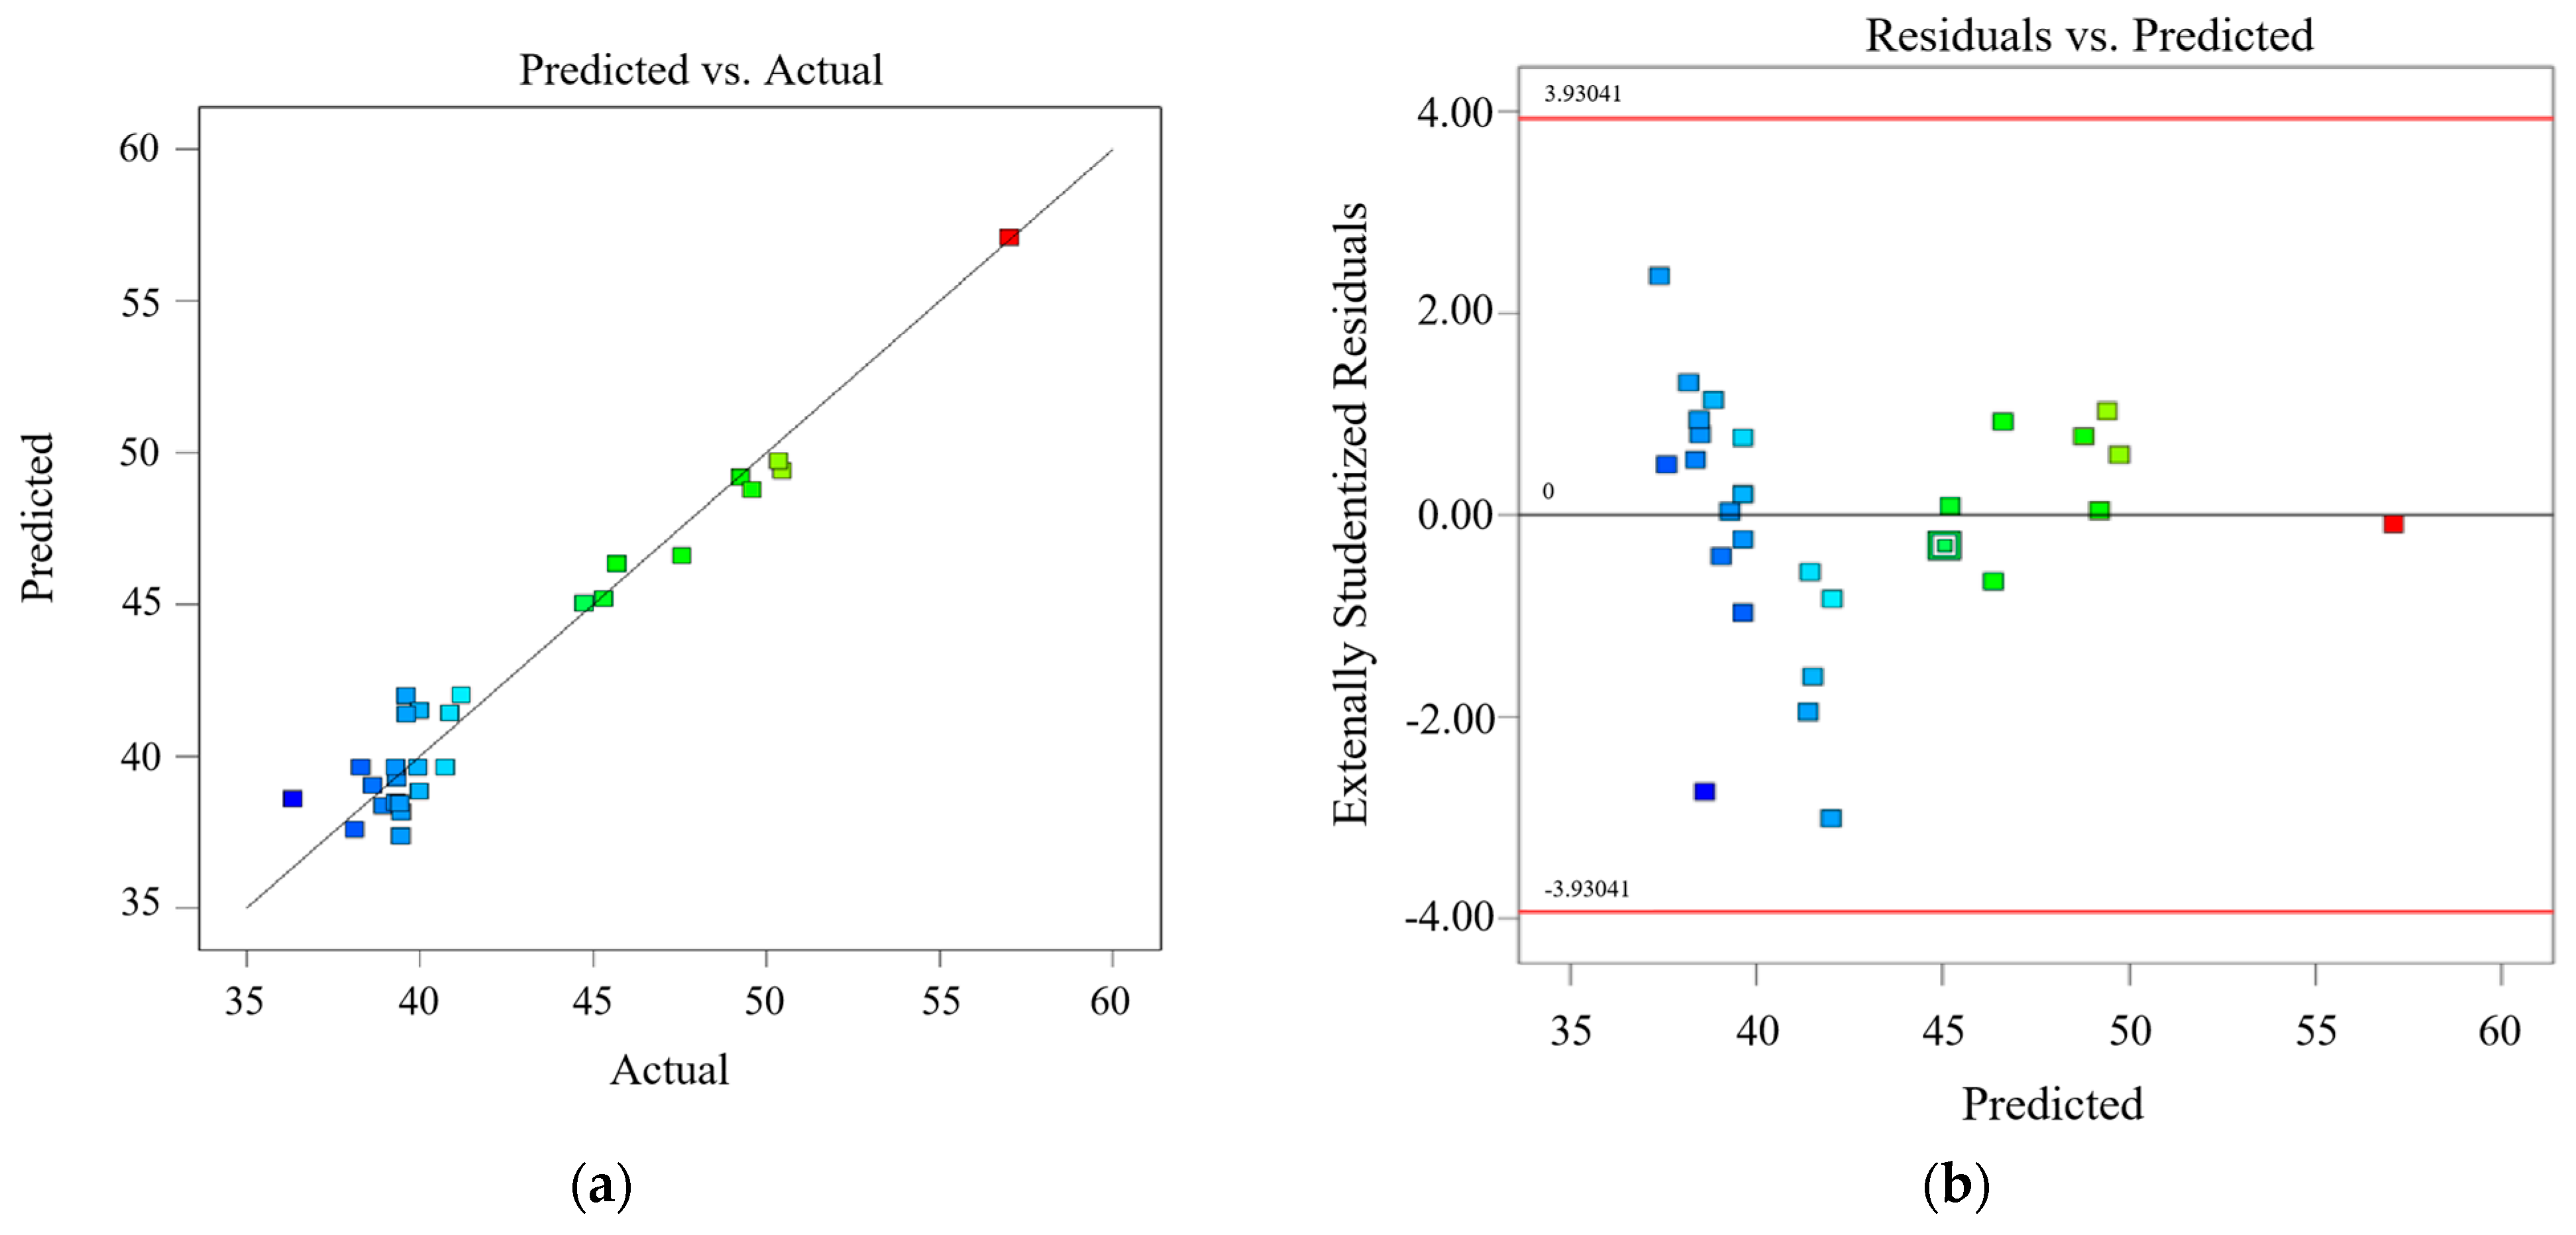
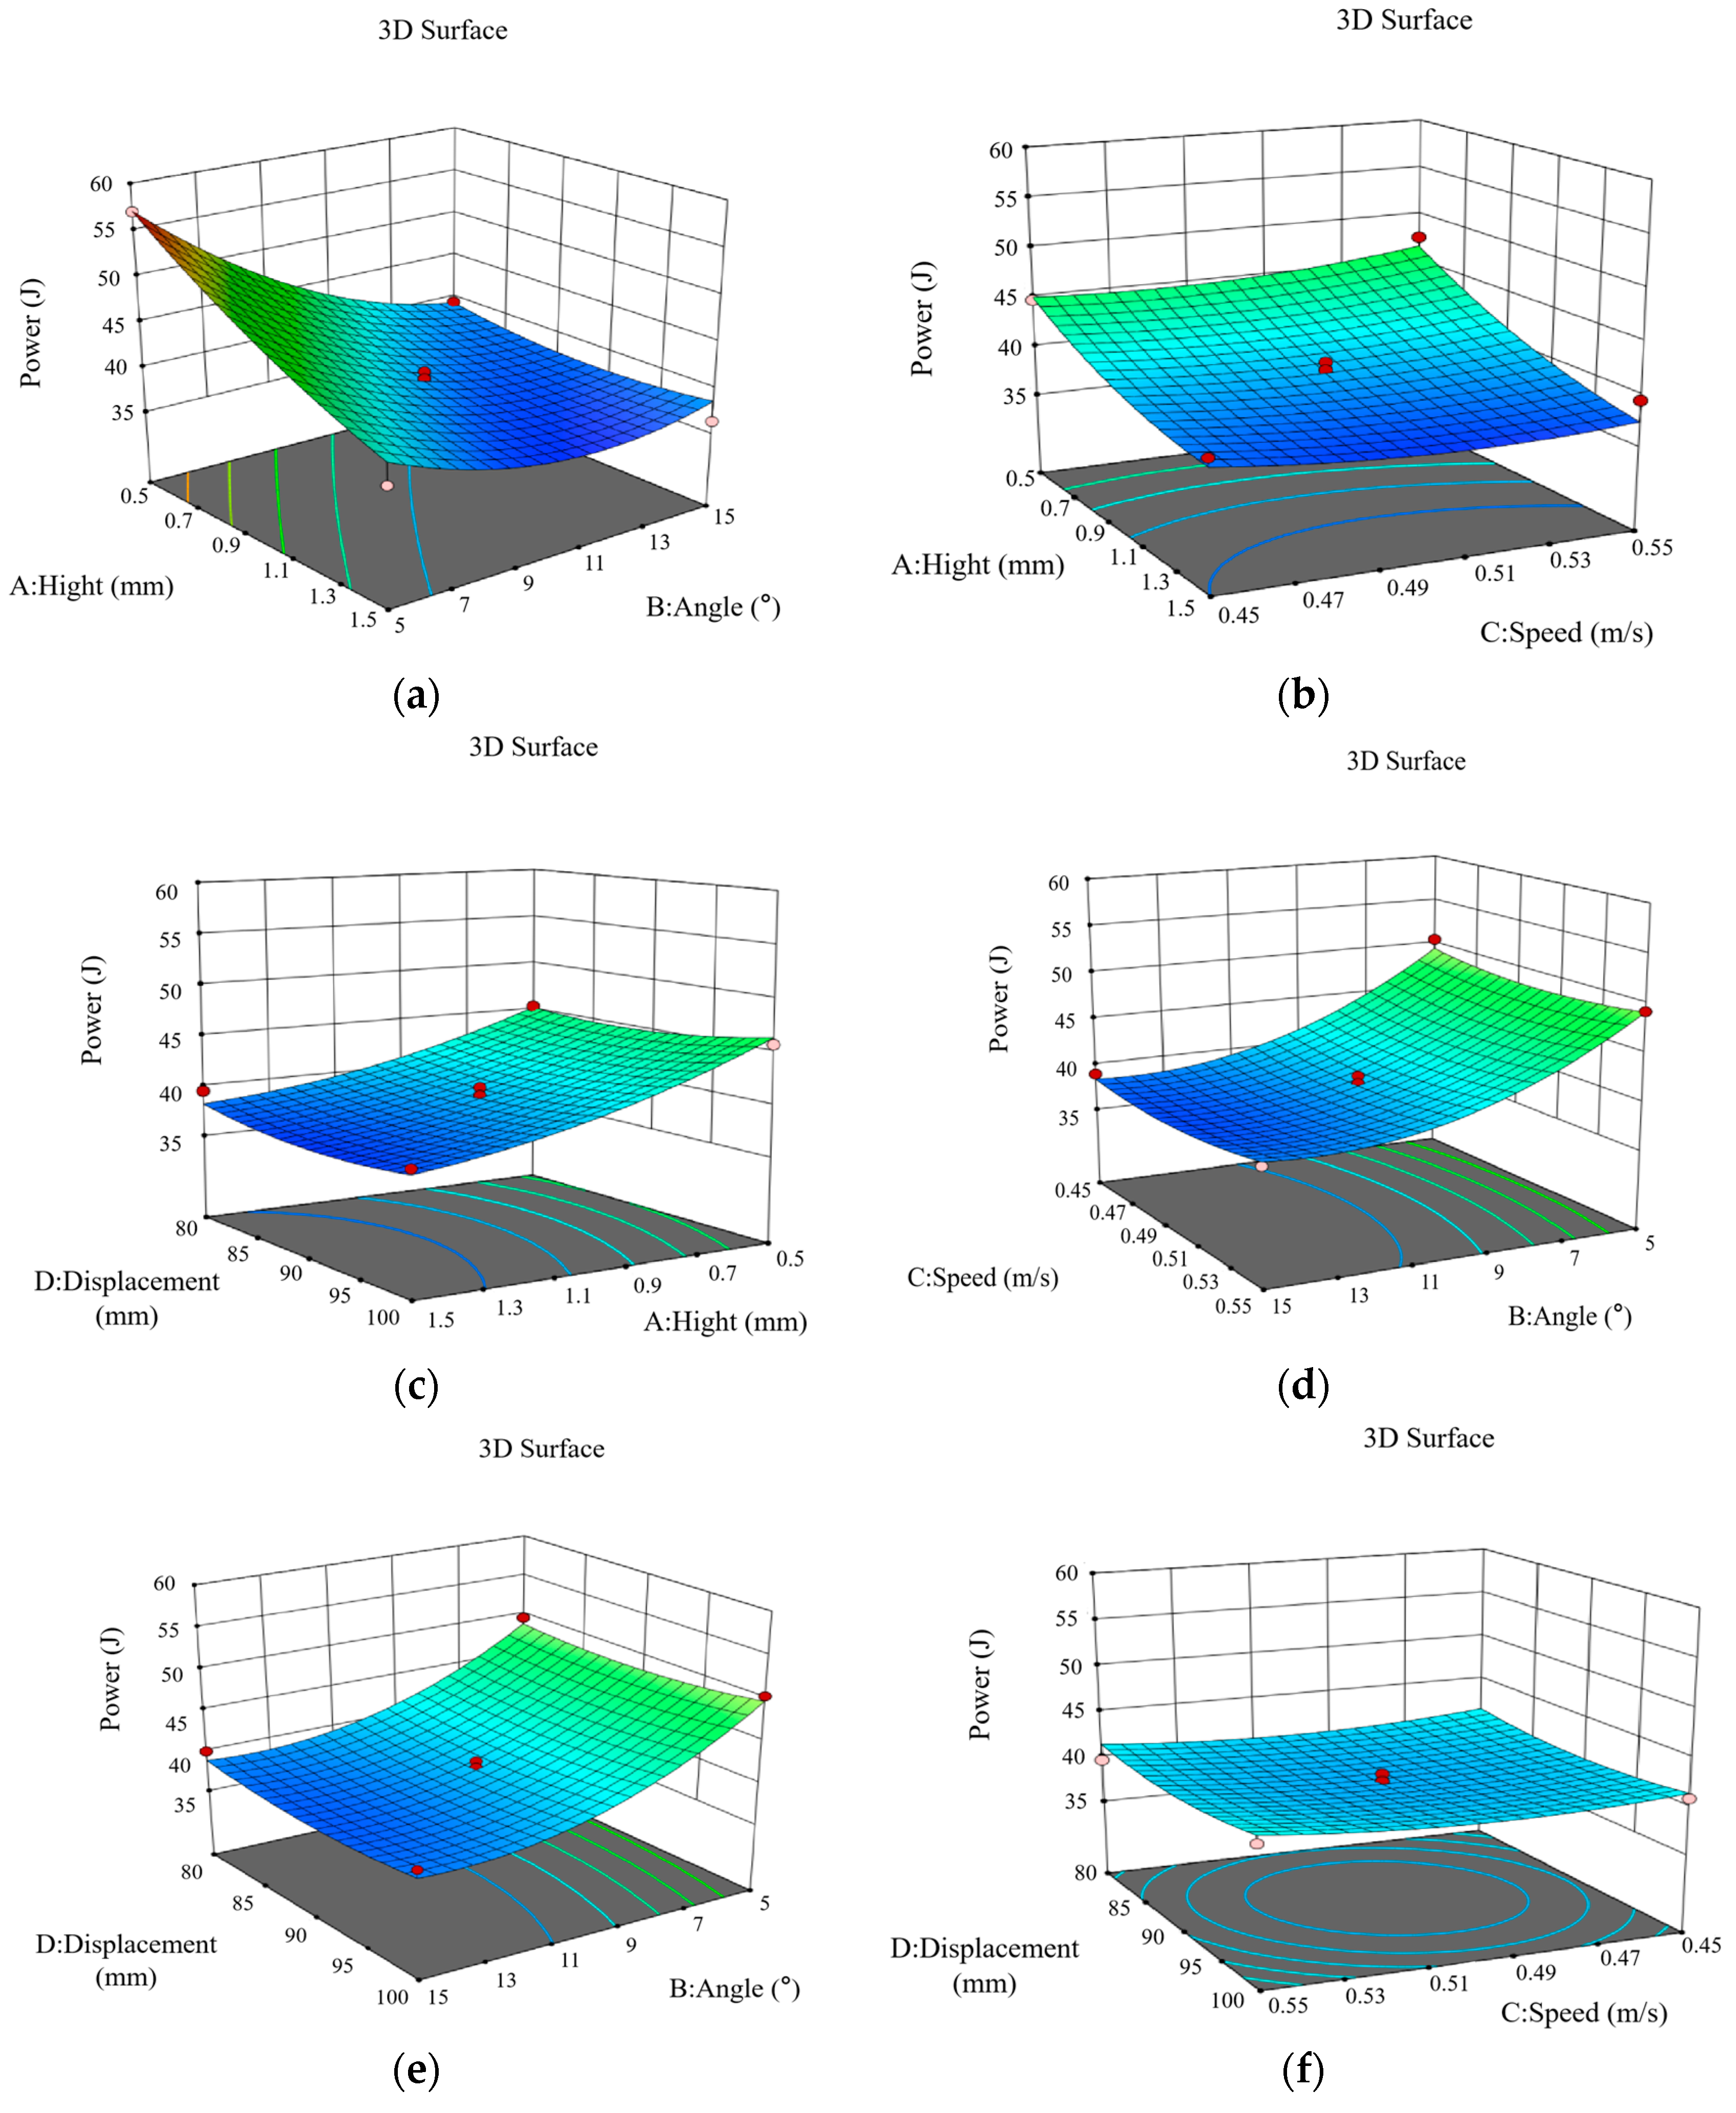
3.2.2. Analysis of Cutting Power

The experimental design software Design-Expert was used to fit the multivariate data to the experimental results to obtain the cutting power regression curve equation.
P = 258.98608   11.11967 x 1 5.03712 x 2 412.795 x 3 1.71944 x 4 + 1.44170 x 1 x 2 26.67 x 1 x 3 0.08645 x 1 x 4 + 0.886 x 2 x 3 0.006685 x 2 x 4 + 0.3555 x 3 x 4 + 4.962 x 1 2 + 0.134695 x 2 2 + 400.95 x 3 2 + 0.009495 x 4 2
The variance associated with the cutting power regression equation is presented in Table 5. As indicated in this table, the cutting power model demonstrates a high level of statistical significance (p < 0.01) across the various groups, implying a robust linear relationship among them. The misfit term, with a p-value greater than 0.05, suggests that the regression model relating cutting power to the actual data demonstrates a satisfactory fit, indicating that the regression equation accurately represents the relationship between the variables and cutting power. The primary terms, X1 and X2, exhibit a high level of significance with p-values less than 0.01, while the interaction term X1X2 is also significant with a p-value below 0.05. Furthermore, the quadratic term X22 has a p-value of 0.01, indicating a significant effect. The assessment of the coefficients within the predictive regression model, along with the estimation of its standard error, can be analyzed through Analysis of Variance (ANOVA). In this context, the model’s correlation coefficient is reported as R2 = 0.9510. Figure 12 presents a normal probability plot, which illustrates that the residuals conform to a normal distribution. The proximity of the plotted points to a straight line suggests that the predictive regression model aligns well with the assumptions of ANOVA. Additionally, the irregular and dispersed distribution observed between the residuals and the predicted values of the equations further substantiates the model’s reliability and accuracy in the analysis.
Figure 13 illustrates the interaction effect of two variables on the cutting power per unit area. Specifically, Figure 13a depicts the interaction between cutting height and angle of entry at a forward speed of 0.5 m/s and a single run displacement of 90 mm. It is observed that, while maintaining a constant angle of entry, the cutting power diminishes as the cutting height increases. This decrease is more pronounced within the angle of entry range of 5 to 9°, whereas the change is less significant within the range of 9 to 15°. The cutting power exhibits a decline as the angle of entry increases within the range of 0.5 to 0.9 mm at a constant cutting height. When the cutting height is maintained constant between 0.9 and 1.5 mm, the cutting power decreases with an increase in the angle of entry from 5° to 11°, but conversely, it increases as the angle of entry rises from 11° to 15°. Notably, the minimum cutting power occurs at a cutting height of 1.5 mm and an angle of entry between 9° and 11°. Figure 13b illustrates the relationship between the entry angle of 10°, single run displacement of 90 mm, cutting height, and forward speed. It is observed that, at a constant forward speed, the cutting power diminishes as the cutting height increases. Conversely, when the cutting height is held constant, the cutting power exhibits minimal variation; it initially decreases and subsequently increases with an increase in forward speed. The cutting power attains its minimum value at a forward speed of 0.55 m/s and a cutting height of 1.5 mm. As illustrated in Figure 13c, at an entry angle of 10°, a forward speed of 0.5 m/s, and considering the interaction effects of cutting height and single run displacement, it is observed that while the single run displacement remains constant, the cutting power decreases as the cutting height increases. Furthermore, the cutting power exhibits minimal variation with respect to changes in single run displacement. Figure 13d illustrates that at a cutting height of 1 mm and single run displacement of 90 mm, there is a discernible interaction between the angle of entry and forward speed. When the forward speed is held constant, an increase in the angle of entry results in a decrease in cutting power. Conversely, when the angle of entry is maintained constant, an increase in forward speed initially leads to a decrease in cutting power, followed by a gradual increase. Notably, at an angle of entry of 15°, the forward speed range of 0.49 to 0.51 m/s corresponds to the minimum cutting power observed. Figure 13e illustrates the interaction effect of a cutting height of 1 mm, a forward speed of 0.5 m/s, the angle of entry, and single run displacement. It is observed that when the single run displacement remains constant, the cutting power diminishes as the angle of entry increases. Conversely, when the angle of entry is held constant, the cutting power initially decreases with an increase in single run displacement, subsequently rising and exhibiting minimal variation. Notably, at an angle of entry of 15°, the cutting power reaches its minimum at cutting frequencies between 85 and 95 mm. In Figure 13f, it is observed that, at a cutting height of 1 mm and an entry angle of 10°, the cutting power remains largely unaffected by the interplay between forward speed and single run displacement.

3.2.3. Optimization of Cutting Parameters

The analysis of the multifactor response surface indicates that minimizing cutting force and cutting power should be prioritized as optimization objectives. Through the optimization analysis, the optimal cutting parameters were determined to be a cutting height of 1.437 mm, an entry angle of 11.849°, a forward speed of 0.504 m/s, and single run displacement of 92.856 mm. These optimized parameters were subsequently applied to Equations (5) and (6), resulting in an optimized cutting force of 41.4 N and a cutting power of 36.765 W. Compared with the cutting force of 44.6 N and the cutting power of 39.956 W obtained in the single-factor cutting experiment (with a cutting height of 1 mm, an entry angle of 10°, an advancing speed of 0.5 m/s, and a single cutting displacement of 90 mm), the cutting force in this result is reduced by 7.17%, and the cutting power is reduced by 6.70%. This further demonstrates the significance of these parameter optimizations. The optimized parameters were adjusted to a cutting height of 1.45 mm, an entry angle of 12°, a forward speed of 12 m/s, and single run displacement of 93 mm for the purpose of the cutting simulation, with the results presented in Table 6. As indicated in Table 6, the relative errors for the experimental validation of cutting force and cutting power are 0.24% and 3.39%, respectively. These findings suggest that the regression model demonstrates a high level of reliability.
The experimental results demonstrate that the regression model developed in this study exhibits a high degree of reliability. However, it is not without limitations. Notably, there is a relatively large relative error between the simulated cutting power and the model’s predicted results. This discrepancy arises from two primary factors. Firstly, during the modeling process, assumptions were made regarding the physical properties and cutting behavior of soil and mustard to simplify the system’s complexity. However, in real-world simulation experiments, the behavior of soil and mustard does not entirely align with these idealized assumptions, contributing significantly to the observed error. Secondly, the aforementioned simulation experiments were conducted under stable, preset conditions, including cutting height, entry angle, forward speed, and single lateral movement displacement. In contrast, the actual cutting process is inherently unsteady. The tool frequently encounters a complex stress state in the area where it interacts with the mustard, leading to dynamic changes in the cutting process and, consequently, larger deviations in the results. To address these issues, future research should focus on optimizing the constructed model and refining the characteristics of soil and mustard. These enhancements will improve the model’s prediction accuracy and stability, thereby providing more reliable insights into cutting performance.

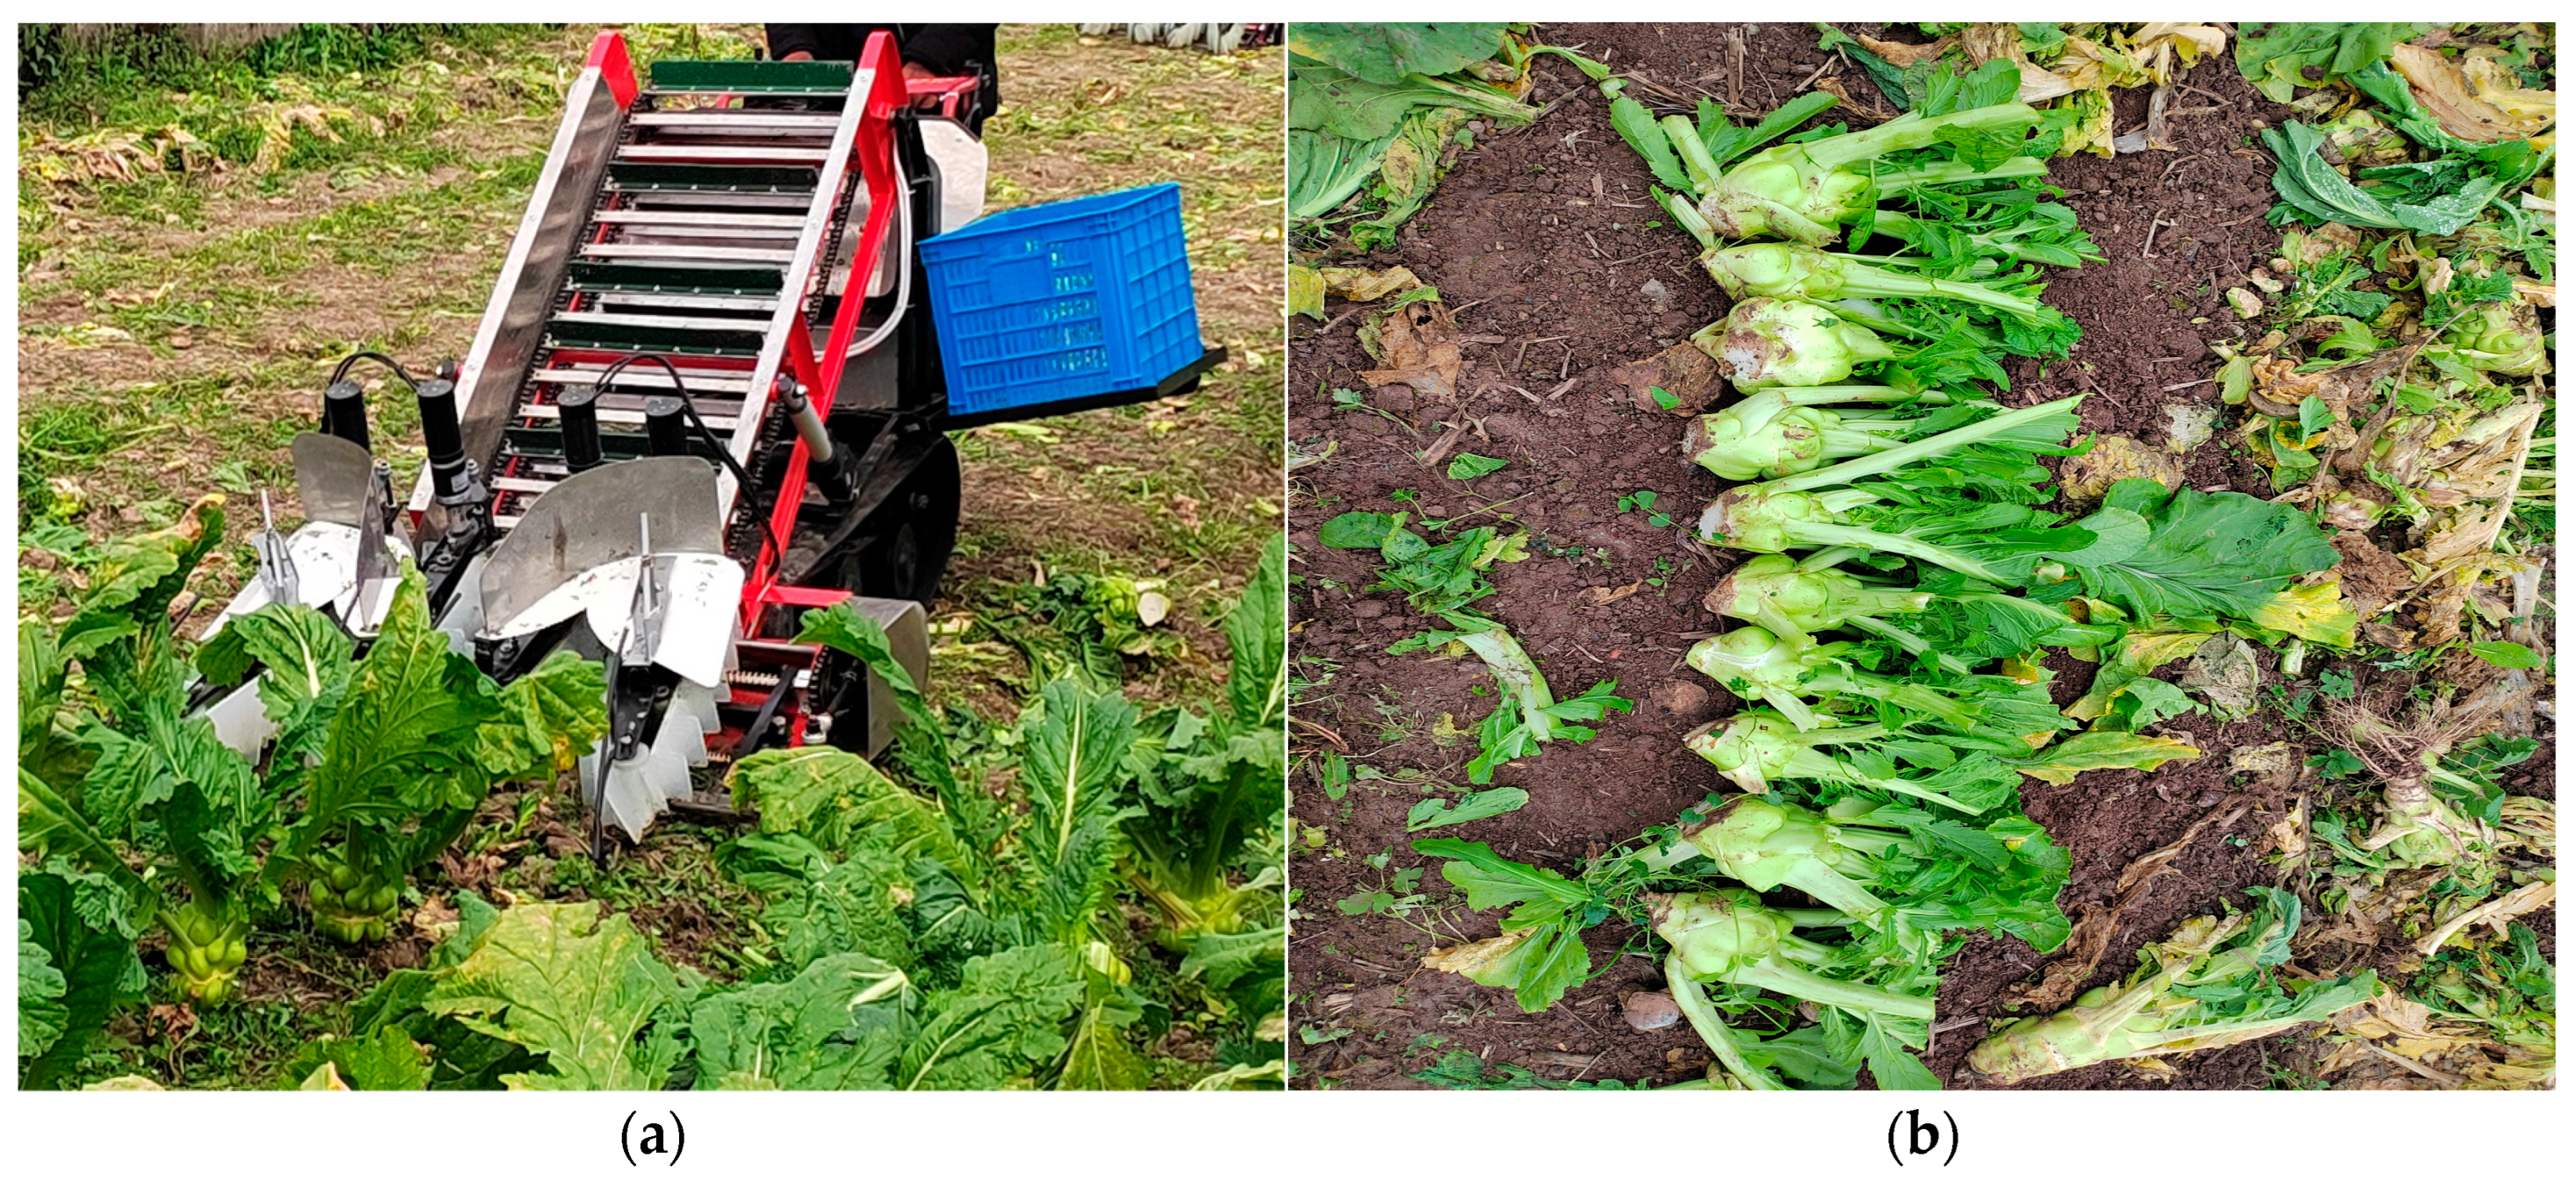
3.3. Experimental Verification

In the present study, the cutting requirements for the stem mustard involve severing the entire plant while maintaining a flat cut [18]. In order to ensure the stability and consistency of these parameters, the forward speed is adjusted by the chassis control system of the equipment, while the cutting height, the entry angle and the transverse displacement of the tool are adjusted by the motor through the transmission. In addition, an electric motor is used in this equipment to provide the driving force for the cutting device, with a motor power of 0.2 kW. A trial production was subsequently conducted. The schematic and physical representations of the equipment are illustrated in Figure 14a and Figure 14b, respectively. A hand-held harvester designed for stem mustard was employed to conduct cutting experiments at the experimental field of the Chongqing Academy of Agricultural Sciences. The operational parameters for the cutting process included a height of 1.45 mm, an entry angle of 12° and a forward speed of 0.5 m/s. Five replicated tests were conducted, and the outcomes are presented in Table 7.
Based on the cutting test results obtained from the field experience, when the unsupported reciprocating cutting mechanism is combined with the aforementioned operating parameters, the overall performance of the tested equipment is relatively advanced, with a maximum cutting success rate of 94% and a minimum damage rate of 6%. However, these two indicators did not appear in the same experimental group. The main reason for this result is the impact of complex terrain conditions and crop growth characteristics on the cutting effect. Specifically, in the second group of experiments, the equipment harvested stem mustard with the lowest damage rate, only 6%. Observations during the experiment found that this result was mainly due to the tool almost penetrating into the soil during the cutting process, thereby maintaining the quality of the cut. However, due to the greater unevenness of the ground, the cutting success rate was slightly lower than other groups. A similar phenomenon also occurred in the fifth group of experiments. In the third experiment, due to the irregular terrain, the stem mustard in this group grew more tilted, and this had a certain impact on the cutting success rate and damage rate, but it still remained within a reasonable range. In the fourth group of experiments, the equipment achieved the highest cutting success rate of 94%, and, at this time, the damage rate was only 8%. A similarly high cutting success rate was also presented in the first experimental group, but in this group, due to insufficient penetration of the tool into the soil, it led to more damage in the harvested products. This result indicates that combining the aforementioned optimized parameters with the unsupported reciprocating cutting mechanism can effectively optimize the cutting operation effect of the equipment. However, the impact of terrain complexity and crop growth characteristics on cutting success rate and damage rate still needs further optimization. Future research can focus on improving the flexibility of the chassis to enhance the equipment’s adaptability to complex terrain, thereby further improving the stability and efficiency of the cutting operation.

4. Conclusions

The conclusions derived from this work are as follows:
(1)
The reciprocating cutter model was developed using ANSYS/LS-DYNA (https://lsdyna.ansys.com/, accessed on 18 December 2024), with the cutting height (X1), angle of entry (X2), forward speed (X3), and single run displacement (X4) of the cutter applied to stem mustard identified as the key influencing parameters. An analysis was conducted to assess the effects of these factors on F and p, and regression equations were formulated to account for the interactions among the multiple factors. The cutting force (F) and cutting power (p) were obtained by applied derivation of regression equations were 41.4 N and 37.755 W.
(2)
The multifactor quadratic regression orthogonal combination testing framework was established utilizing the Box–Behnken design methodology. The software Design-Expert was employed to conduct analysis of variance and response surface analysis on the outcomes of the simulation tests, leading to the identification of optimal operational parameters for the cutting tool used on stem mustard, specifically: X1 = 1.45 mm, X2 = 12°, X3 = 0.5 m/s and X4 = 93 mm. Furthermore, an analysis of multiple sets of field experiments utilizing these optimal cutting parameter combinations revealed that the reciprocating cutting device achieved a success rate of 94% and a damage rate of only 6% during the cutting operations of stem mustard.

Author Contributions

Conceptualization, S.S. and Y.P.; methodology, S.S. and L.Z.; software, S.S. and Y.W.; validation, S.S., W.L., B.L. and Y.P.; formal analysis, S.S., B.L. and W.S.; investigation, S.S., Z.Z. and W.L.; resources, W.S. and W.L.; data curation, S.S., L.Z., Y.W., B.L., Z.Z. and Y.P.; writing—original draft preparation, S.S., L.Z., B.L., Z.Z. and Y.P.; writing—review and editing, S.S., L.Z., Y.W., W.S. and W.L.; visualization, S.S., L.Z., Y.W., W.S., W.L. and Y.P.; supervision, S.S., L.Z., Y.W. and Y.P.; project administration, S.S. and Y.P. All authors have read and agreed to the published version of the manuscript.

Funding

This research was funded by Key Project of Chongqing Technology Innovation and Application Development Special Project, grant number: cstc2021jscx-gksbX0013 and the APC was also funded by the project.

Data Availability Statement

The original contributions presented in the study are included in the article, further inquiries can be directed to the corresponding author.

Acknowledgments

The authors would like to thank to the editors and reviewers for their valuable and constructive comments.

Conflicts of Interest

The authors declare that we have no known competing financial interests or personal relationships that could have appeared to influence the work reported in this paper.

References

  1. Xue, X.L.; Zheng, H.; Ye, Y.X. Design and test of a fixed-blade sliding-cutting type squash harvester. Chin. J. Agric. Mech. Chem. 2023, 44, 48–55. [Google Scholar]
  2. Xiang, W.; Sun, Y.H.; Liu, F.Y.; Li, M.; Xie, S.; Ke, C.; Haung, Y. Development of sliding cutter for shortened stalk of green vegetable. Trans. Chin. Soc. Agric. Eng. 2023, 39, 266–275. [Google Scholar]
  3. Wang, L.B.; Ye, J.; Yang, S. Design and test of plucking and conveying mechanism of squash harvester. Agric. Mech. Res. 2018, 40, 138–141+246. [Google Scholar]
  4. Xue, Y.P.; Chen, J.J.; Ye, J. Research on physical and mechanical properties of stem mustards. J. Southwest Univ. 2017, 39, 147–152. [Google Scholar]
  5. Zheng, Z.Q.; He, J.; Li, H.W. Design and test of movable and static knife-supported slip-cutting straw crushing device. J. Agric. Mach. 2016, 47, 108–116. [Google Scholar]
  6. Zhou, H.; Zhang, W.L.; Yang, Q.J. Design and test of slip-cutting type self-excited vibration dampening deep pine device. J. Agric. Mach. 2019, 50, 71–78. [Google Scholar]
  7. Yuan, J.; Li, J.G.; Zou, L.L. Optimisation design and test of spinach harvester root cutting shovel based on discrete elements. J. Agric. Mach. 2020, 51, 85–98. [Google Scholar]
  8. Kang, F.; Tong, S.Y.; Zhang, H.S. Analysis and test of reciprocating cutting and pruning parameters of apple branches. J. Agric. Eng. 2020, 36, 9–16. [Google Scholar]
  9. Zhang, T.; Li, Y.; Song, S. Design and test of a flexible clamping based stem mustards harvester. J. Agric. Mach. 2020, 51, 162–169+190. [Google Scholar]
  10. Jin, Y.; Xiao, H.R.; Song, Z.Y. Design and test of walk-behind self-propelled stem mustards combine harvester. Chin. J. Agric. Mech. Chem. 2020, 41, 45–50. [Google Scholar]
  11. Du, D.D.; Fei, G.Q.; Wang, J.; Huang, J.; You, X. Design and test of self-propelled kale harvester. J. Agric. Eng. 2015, 31, 16–23. [Google Scholar]
  12. Du, D.D.; Wang, J.; Qiu, S.S. Experimental study on optimisation of cutting site and method of kale root and stem. J. Agric. Eng. 2014, 30, 34–40. [Google Scholar]
  13. Wang, J.W.; Guan, R.; Gao, P.X. Design and test of single disc top cutting device for carrot combine harvester. J. Agric. Mach. 2020, 51, 73–81. [Google Scholar]
  14. Urschel, W.E. Spinach Harvesting Machine. U.S. Patent 2,210,273, 29 April 1941. [Google Scholar]
  15. Shepardson, E.; Markwardt, E.; Millier, W. Mechanical harvesting of fruits and vegetables. New York’s Food Life Sci. Bull. 1970, 5, 2–12. [Google Scholar]
  16. Didamony, M.I.E.; Shal, A.M.E. Fabrication and Evaluation of a Cabbage Harvester Prototype. Agriculture 2020, 10, 631. [Google Scholar] [CrossRef]
  17. Yasmeen, Z.; Ashraf, M.; Ahmad, S.; Ahmad, M.; Sabir, I. Development and economic evaluation of carrot harvester cum trimmer. J. Agric. Res. 2023, 61, 65–76. [Google Scholar] [CrossRef]
  18. Li, K.; Ye, J.; Yue, G. Design and Experimental study on cutting device of vegetable head harvester. Agric. Mech. Res. 2019, 140–144. [Google Scholar] [CrossRef]
Figure 1. Structure diagram of stem mustard: 1. Frame; 2. Traveling mechanism; 3. Root–stem cutting device; 4. Leaf removal device; 5. Clamping and conveying device; 6. Conveyor system.
Processes 13 00845 g001
Figure 2. Schematic structure of unsupported reciprocating cutting mechanism: (a) Structure of reciprocating cutting mechanism; (b) Motion diagram of compound cutting mechanism: 1. Cutter; 2. Cutting tool base; 3. Crank; 4. Rod; 5. Eccentric connecting rods.
Processes 13 00845 g002
Figure 3. Soil stress on shortened stems.
Processes 13 00845 g003
Figure 4. Soil stress on shortened stems.
Processes 13 00845 g004
Figure 5. Soil stress on shortened stems.
Processes 13 00845 g005
Figure 6. Soil stress on shortened stems.
Processes 13 00845 g006
Figure 7. Simplified diagram of the cutting process.
Processes 13 00845 g007
Figure 8. Cutting process simulation.
Processes 13 00845 g008
Figure 9. Simulation Result Curve. (a) Cutting force curve; (b) Cutting power curve.
Processes 13 00845 g009
Figure 10. Model prediction correlation analysis. (a) Correlation between predicted and actual values; (b) Dispersion of the residuals from the predicted values of the equations.
Processes 13 00845 g010
Figure 11. Analysis of the effect of multifactor interaction on cutting force. (a) Influence of interaction between cutting height and angle of entry on the cutting force; (b) Influence of interaction between forward speed and cutting height on the cutting force; (c) Influence of interaction between single run displacement and cutting height on the cutting force; (d) Influence of interaction between forward speed and angle of entry on the cutting force; (e) Influence of interaction between single run displacement and angle of entry on the cutting force (f) Influence of interaction between single run displacement and forward speed on the cutting force.
Processes 13 00845 g011
Figure 12. Degree of relevance of model predictions. (a) Correlation between predicted and actual values; (b) Dispersion of the residuals from the predicted values of the equations.
Processes 13 00845 g012
Figure 13. Effect of multifactor interaction on cutting force. (a) Influence of interaction between cutting height and angle of entry on the power; (b) Influence of interaction between cutting height and forward speed on the power; (c) Influence of interaction between cutting height and single run displacement on the power; (d) Influence of interaction between angle of entry and forward speed on the power; (e) Influence of interaction between angle of entry and single run displacement on the power; (f) Influence of interaction between forward speed and single run displacement on the power.
Processes 13 00845 g013
Figure 14. Experimental field harvesting trials. (a) Harvesting operations trials; (b) Stem mustard.
Processes 13 00845 g014
Table 1. Parameters of the cutter, soil and stem mustard.
Cutting PropertiesValueSoilsValueStem MustardValue
Material65 MnDensity (kg/m3)1630Density (kg/m3)976
Density (kg/m3)7850Shear modulus (MPa)7.4Young’s modulus X direction (MPa)4.1
Young’s modulus (MPa)2 × 10⁸Bulk modulus (MPa)16Young’s modulus Y direction (MPa)4.9
Poisson’s ratio0.3Water content3.5%Young’s modulus Z direction (MPa)3.1
Friction coefficient0.2Cohesion1.53 × 104Poisson’s ratio XY0.38
Friction angle (rad)0.5759Poisson’s ratio YZ0.031
Poisson’s ratio XZ0.028
Shear modulus XY (MPa)3.59
Shear modulus YZ (MPa)4.09
Shear modulus XZ (MPa)2.4
Table 2. Experimental factor level.
FactorCodingHorizontal Coding
−101
Hight (mm)X10.511.5
Angle of entry (°)X251015
Forward speed (m/s)X30.450.50.55
Single run displacement of cutter (mm)X48090100
Table 3. Experimental design and results.
No.SSSignificance
Cutting HeightAngle of EntryForward SpeedSingle Run DisplacementCutting ForceCutting Power
11.550.59053.639.593
20.5100.559056.347.549
31150.459043.138.935
41100.59044.639.935
50.5100.459055.344.733
61.5100.459045.239.297
71100.558046.239.604
80.5100.58057.345.299
91100.59044.738.294
10150.559056.649.253
111100.458048.639.988
121150.559047.338.626
13150.58056.949.577
140.550.58068.757.008
15150.510058.450.349
161100.59044.639.297
170.5150.59046.739.33
181.5150.59043.336.332
191100.451004740.86
201.5100.58047.439.457
211100.59044.640.725
221.5100.559043.639.446
230.5100.510058.445.679
241150.58047.639.98
251100.5510048.941.187
261100.59042.639.944
271.5100.510043.638.108
28150.459059.550.448
291150.510041.439.415
Table 4. Cutting force analysis of variance.
SourceSum of Squares
(SS)
Degrees of Freedom
(DF)
Mean Square
(MS)
F-Valuep-ValueSignificance
Model1275.741491.1246.61<0.0001significance
X13631363185.67<0.0001
X2592.211592.21302.91<0.0001
X30.003310.00330.00170.9676
X43.3113.311.690.2144
X1X234.22134.2217.50.0009
X1X31.6911.690.86440.3683
X1X46163.070.1016
X2X312.6112.66.450.0236
X2X414.82114.827.580.0115
X3X44.6214.622.360.1464
X12128.111128.1165.53<0.0001
X22156.161156.1679.88<0.0001
X3219.7119.79.810.0074
X4232.30132.3016.520.0012
Residual27.37141.96
Lack of Fit24.08102.412.930.1559not significance
Pure Error3.2940.8220
Cor Total1303.1128
Table 5. Cutting force analysis of variance.
SourceSSDFMSF-Valuep-ValueSignificance
Model656.531446.8919.42<0.0001significance
X1-hight186.951186.9577.43<0.0001
X2-angle337.191337.19139.66<0.0001
X3-speed0.164310.16430.06800.7980
X4-frequency0.238910.23890.09890.7578
X1X251.96151.9621.520.0004
X1X31.7811.780.73650.4052
X1X40.747410.74740.30950.5867
X2X30.196210.19620.08130.7797
X2X40.446910.44690.18510.6736
X3X40.126410.12640.05230.8223
X129.9819.984.130.0614
X2273.55173.5530.46<0.0001
X326.5216.522.700.1226
X425.8515.852.420.1419
Residual33.80142.41
Lack of Fit30.51103.053.710.1008not significance
Pure Error3.2940.8215
Cor Total690.3328
Table 6. Comparison of theoretical optimized values and simulation verification test results.
ItemEvaluation Indicators
Cutting Force (N)Cutting Power (W)
Theoretical optimization value41.436.756
Simulation value41.538.046
Relative error (%)0.243.39
Table 7. Results of field trials.
Experimental GroupNumber
of Stem Mustards
Cutting Success RateCutting Damage Rate
15092%12%
25088%6%
35080%10%
45094%8%
55086%8%
Disclaimer/Publisher’s Note: The statements, opinions and data contained in all publications are solely those of the individual author(s) and contributor(s) and not of MDPI and/or the editor(s). MDPI and/or the editor(s) disclaim responsibility for any injury to people or property resulting from any ideas, methods, instructions or products referred to in the content.

