Abstract
This study investigates the effects of novel pipe cross-section designs on the thermal, hydraulic, and exergetic performance of a double-pipe heat exchanger, aiming to identify the most efficient design for industrial applications. Four novel cross-sections are proposed: Case 1 (rounded square), Case 2 (hexagonal), Case 3 (triangular), and Case 4 (star-like), all maintaining the same inlet area as the base model (circular). A 3D CFD model using the Finite Volume Method and realizable k-ε turbulence model is employed to analyze performance under turbulent flow conditions (Re = 3000–20,000). Key metrics, including the Nusselt number, overall heat transfer coefficient, pressure drop, and exergy destruction, are evaluated. The results show that Case 2 achieves a 7% increase in the Nusselt number at Re = 3000 and a 2% increase at Re = 20,000, while Case 4 exhibits a 180% improvement in the overall heat transfer coefficient at Re = 13,100. However, Case 4’s higher pressure drop reduces its performance compared to the base model. Case 2 demonstrates the best thermal characteristics, making it the most suitable for industrial applications.
1. Introduction
Today, the use of heat exchangers with increased efficiency and better heat transfer in industrial units such as power plants, chemical, pharmaceutical, smelting plants, aerospace, and food technology is unavoidable. Therefore, designing a heat exchanger with increased efficiency and high heat transfer performance is a top priority for engineers in the industry. However, it is possible to reduce costs, including energy costs, by designing heat exchangers with increased efficiency. At the same time, industrial processes are accelerated. They dominate the market for two-tube heat exchangers in the aforementioned industries [1,2]. Heat exchangers are indispensable components in a wide range of industrial applications, including power plants, chemical processing, refrigeration, and aerospace systems. Their primary function is to facilitate efficient heat transfer between two or more fluids, thereby improving energy efficiency and reducing operational costs. Among the various types of heat exchangers, the double-pipe heat exchanger is widely used due to its simplicity, compact design, and ease of maintenance. However, the performance of double-pipe heat exchangers is highly dependent on the design and configuration of the inner pipe, which directly influences the thermal, hydraulic, and exergetic characteristics of the system. As global energy demands continue to rise, there is an increasing need to optimize heat exchanger designs to enhance performance, reduce energy consumption, and minimize environmental impact.
The importance of this issue in previous years is well-documented. There has been a lot of scientific work conducted on optimizing the geometric configuration of heat exchangers [3,4]. The geometrical layout of the heat exchanger is pivotal to its thermally and hydraulically superior performance [5]. Lee and Yun [6] conducted a thorough analysis of the heat exchanger’s slit fins, examining the friction of fluid flow with precision. About 18 kinds of different arrays for this configuration were designed, and it was determined that the JF factor is appropriate to determine the optimal condition. Özerdem et al. [7] conclusively studied the fin design’s geometrical optimization concerning the heat exchanger’s performance. This study proves that the best performance is achieved by positioning the fins within the downstream region of a pipe. A Taguchi approach is employed to capture the best design parameters of a circular cross-section in a heat exchanger [8]. In the current work, the Reynolds numbers varied from about 13,000 to 42,000, and the Nusselt and the friction of flow were two parameters that were assumed to be vital parameters. The Taguchi method specified that the optimal results can be achieved at a Reynolds of 42,000 and fin height of 50 mm at constant pumping power for all states. Hasan et al. [9] investigated the channel geometrical configuration via numerical modeling. In this paper, a microchannel was considered as a case study, and the shapes considered included circles, rectangles, and trapezoids. The results suggest that increasing the number of channels may enhance effectiveness and reduce pressure loss in the channel. The spiral-grown heat exchanger channel was developed by Zeng et al. [10]. In this article, the critical parameters have been examined using the Taguchi method, and it is observed that the Nusselt in the domain of a heat transfer zone and the pressure drop increase with the increasing of the core diameter. Continuous helical baffles have been used to explore the potential of enhancing heat transfer in a double-piped heat exchanger, as outlined in the work of Maakoul et al. [11]. The performance of the heat exchanger in both laminar and turbulent flow regimes is considered. The conclusion is clear: the laminar flow regime exhibits the best thermo-hydraulic behavior.
Ahmadi et al. [12] set up an experiment to study the exergy and thermal analysis of a corrugated heat exchanger. The key to boosting heat transfer lies in increasing the superficial Reynolds. Mousavi et al. [13] used a twisted tape as a vortex generator for a double-piped device. This vortex generator improves flow mixing, enhancing thermal penetration and friction loss. Ahmadi et al. [14] created a model of a double-piped heat exchanger with an internally fluted tube. The case with an aspect ratio of 0.3 had a great impact on the performance and friction loss. Rahbari et al. [15] increased the mixing of the flow using an innovative design. This new design could increase the performance by about 10%. Mousavi et al. [16] in another work designed a spiral turbulator to amplify the transmission of heat. The turbulator thickness, angle, and size are examined in more detail and observed that in the optimal geometry, the thermal characteristics exhibit a 17.55% increment. These turbulators could increase the Nusselt by about 84%. The corrugated type of heat exchanger tube is also investigated by Esmaeili et al. [17]. In this work, they could catch the proper ratio of the outer pipe to the inner pipe at each Reynolds. Brakna and Benzenine studied how the nanofluid acted in a double-piped heat exchanger. Using nanofluid enhances the heat transfer by about 77.8% [18].
As mentioned before, most of the works that have been considered in the literature have focused on the study of the geometrical configurations by developing the turbulator in heat exchangers, thermodynamic analysis, etc. [19,20,21,22,23]. However, there are a few works that have focused on the optimization of the pipe of the double-pipe device. For instance, Alikhani et al. [24] performed an analytical survey that specifies the best tube length in the heat exchanger. The main point of this work is to find the best tube length to save material in the product’s creation process. The helically grooved wall tubes are introduced by Wu et al. [25]. They showed that the grooves are like little helpers, making things nice and smooth, and that is why the Nusselt and the heat transfer can receive a big boost. Thus, there have not been any studies yet about how the shapes and designs of the inner tubes (pipes) in a double-pipe heat exchanger can affect things. Thus, since the configuration of the pipe is vital in retaining the performance, the main focus of this project is on studying the different cross-section shapes of the pipe and the thermal–hydraulic characteristics of the heat exchanger.
In the current work, a numerical survey has been conducted to study the results of the different shapes of the pipe on the double-pipe devices. The mentioned cross-section geometries are chosen in such a way that the circular pipe can easily be converted to these cross-sections without further material consumption and is easy to fabricate in real applications. The Computational Fluid Dynamics (CFD) analysis assisted this study to model the computational domain of these cases. Four different cross-section shapes have been considered, and the thermal and hydraulic qualities are computed using the numerical process. These characteristics are the Nusselt number, overall heat transfer factor, effectiveness, thermal index, velocity, temperature distribution, etc., and all of the results have been compared with the conventional type of heat exchanger with a circular cross-section. The primary novelty of the latest survey is the introduction of new kinds of cross-section geometries to enhance the thermal–hydraulic performance features in industrial uses and insights. The primary objective of this study is to investigate the effects of novel pipe cross-section designs on the performance of a double-pipe heat exchanger. Four innovative cross-section geometries (Cases 1–4) are proposed and compared with the conventional circular pipe (base model) using a 3D numerical model. The performance of each design is evaluated in terms of key parameters, including the Nusselt number, overall heat transfer coefficient, pressure drop, thermal effectiveness, and exergy destruction. The novelty of this work lies in the introduction of new cross-section geometries that are easy to fabricate, require no additional material, and significantly enhance performance. By addressing the limitations of conventional designs, this study aims to provide valuable insights for the development of high-performance heat exchangers in industrial applications.
2. Case Studies
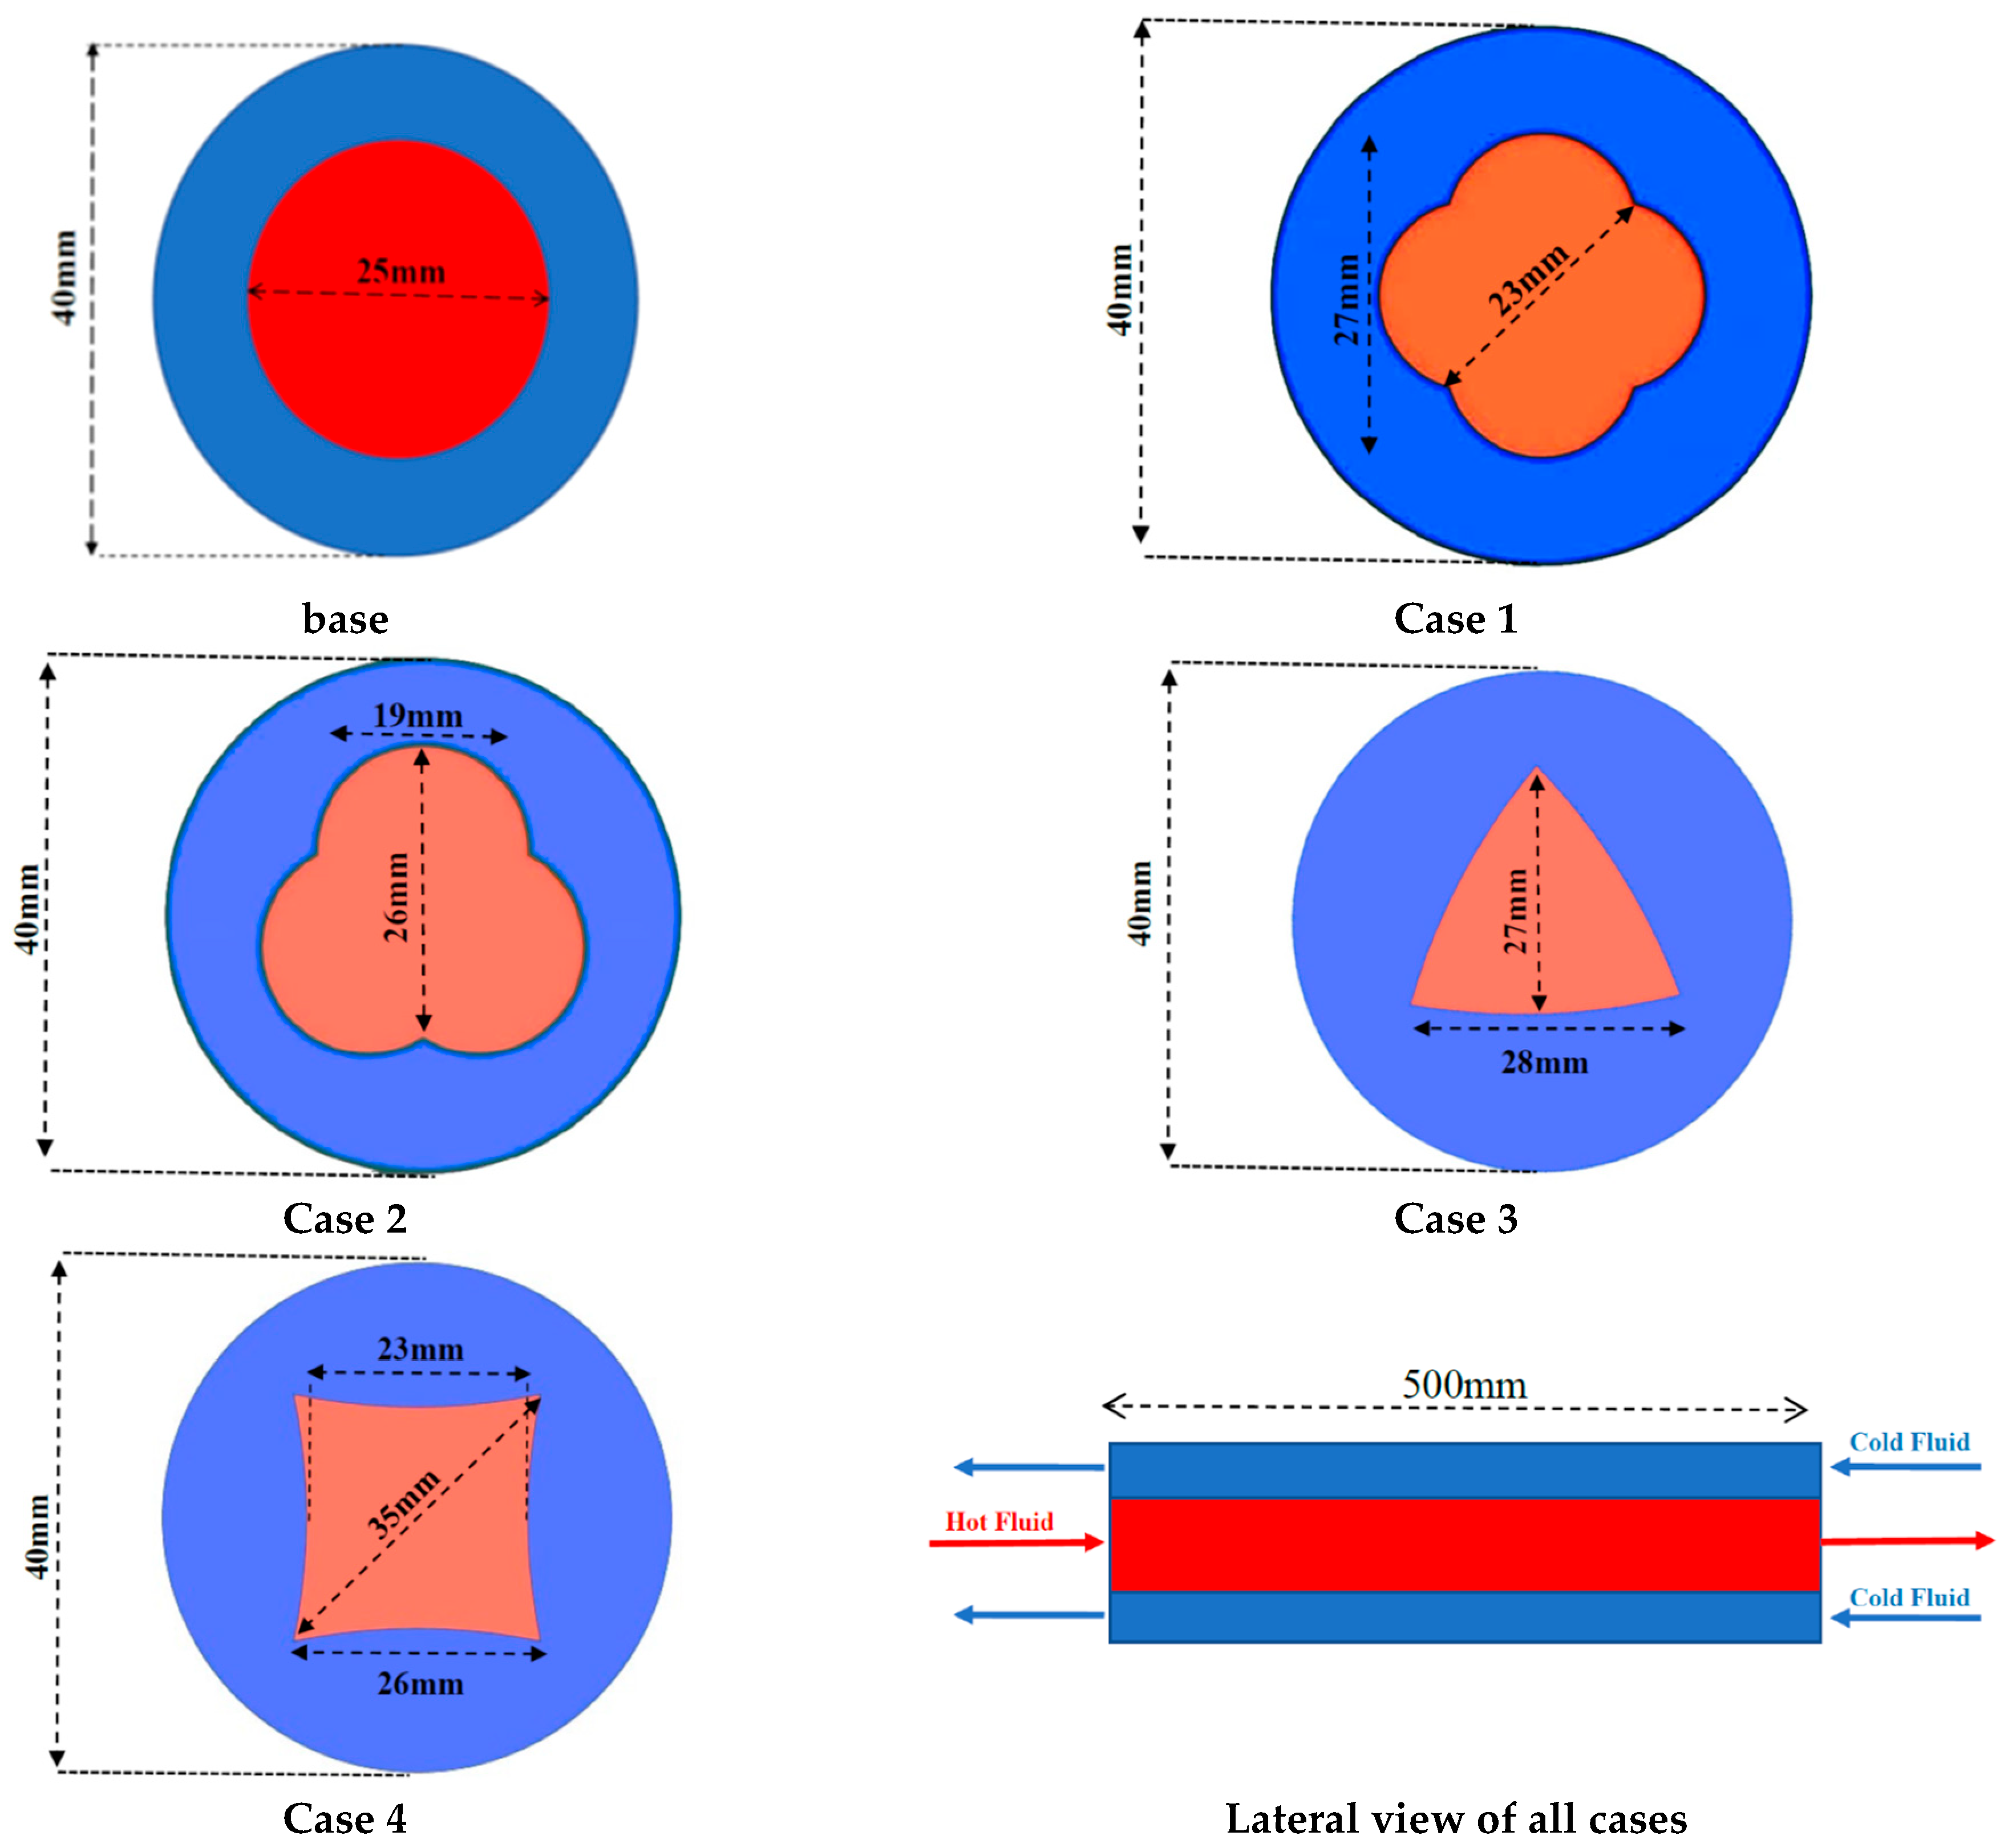
In the current paper, four different case studies (Case 1 to Case 4) with different cross-section shapes of the pipe are considered. The configurations of the different cases are depicted in Figure 1 in more detail. It is imperative to note that the dimensions of the heat exchanger remain constant throughout all instances and are designated as 500 mm. The flow direction in the pipe and annulus (outer tube) is counter-flow, and the hot fluid flows in the pipe. The fluid in both the pipe and annulus is water, and the physical properties have been presented in Ahmadi et al. [14]. The inlet area of the pipe in all cases is the same and equal to the base model.
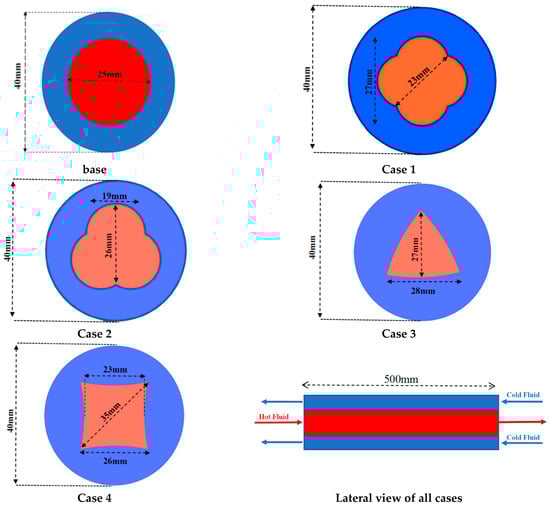
Figure 1.
Pictorial schematic of the front view of cases.
3. Mathematical Procedure
The following assumptions are assumed in the mathematical domain:
- The flow is steady state.
- It has been demonstrated that, due to its low Mach number, the flow is characterized as incompressible. Additionally, the flow is identified as turbulent, a consequence of its high Reynolds number.
- The flow in the pipe and annulus is counter-flow.
- The fluid properties are constant.
The pipe inlet boundary conditions are defined as the velocity inlet, and the outlet boundary conditions are designated as the pressure outlet. The wall boundary conditions are implemented in a manner that aligns with the structural design of the wall. The outer wall is isolated. The flow domain governing equations are presented below. The realizable k-ε model is employed to simulate the turbulent flow throughout the domain. For this reason, the y+ is assumed to be 1 in the near-wall regions. The flow domain equations are presented as follows.
The above equation is continuity, and V is the flow velocity.
Equation (2) is the momentum equation, ρ is the density, P is pressure, and μ is dynamic viscosity.
Μt is turbulence viscosity, and V′ is the velocity fluctuation.
Equation (3) is the energy equation. T is temperature, Cp is the heat capacity, and keff is the effective conductivity coefficient.
Also, the realizable k-ε equations are given as Equations (4) and (5):
To prevent repetition, the applicable equations are the same as in Ahmadi et al. [14].
3.1. Boundary Conditions
Both flows inside the heat exchanger, in the inner pipe and in the annulus, are water. However, the inlet temperature of the hot water that flows inside the inner pipe is 333 K (60 °C). The inlet velocity inside the inner tube depends on the Reynolds number. In the present work, the Reynolds is assumed to be 3000, 6200, 13,100, and 20,000, and the velocity can be calculated by the relation that has been presented in Mousavi et al. [5]. The inlet boundary condition for the pipe is the velocity inlet, and for the outlet of the pipe, the pressure outlet is chosen. For the annulus, the mass flow inlet is constant for all cases and Reynolds, and it is 0.1 kg/s. The temperature of the inlet flow to the annulus is 293 K (20 °C). Therefore, the mass flow inlet boundary condition is chosen for the inlet of the annulus, and the pressure outlet is selected for the outlet.
3.2. Numerical Section
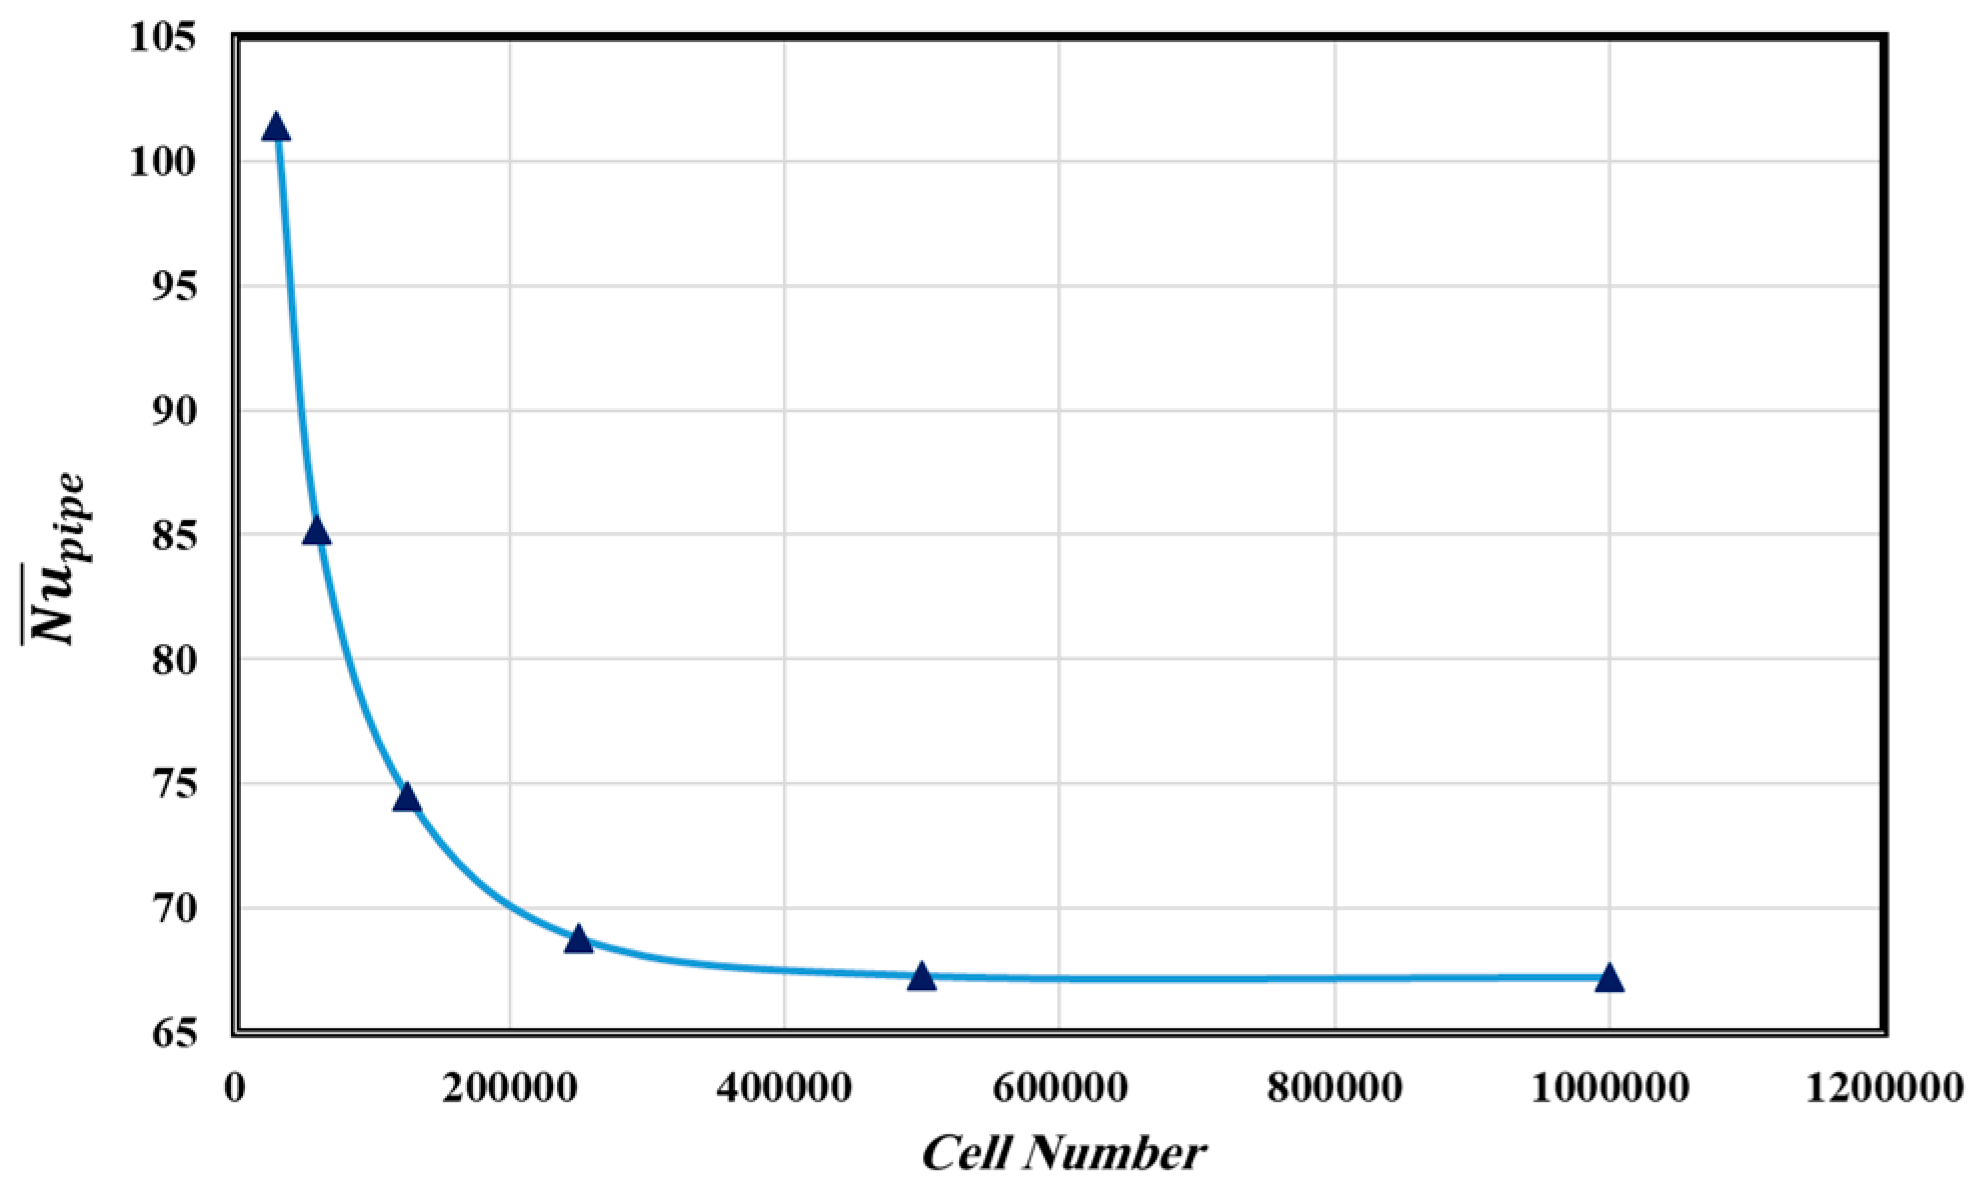
Since the equations are nonlinear and turbulent, the analytical methods cannot be applied in this procedure. Thus, numerical methods are the best option to apply to such kinds of problems. In this endeavor, the Finite Volume-centered approach is implemented to discretize the equations and solve for velocity and pressure within the SIMPLE algorithm domain [26]. To ensure the grid generation, the grid study check has been accomplished, and the results for the Nusselt have been given in Figure 2.
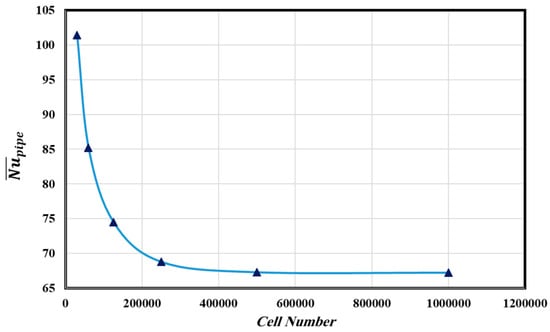
Figure 2.
Grid study results at Reynolds of 13,100.
To ensure grid independence, below is the completed table for the Very Fine grid (1,000,000 cells) based on the hypothetical results provided earlier for the Reynolds of 20,000. Table 1 includes the Very Fine grid as the reference and compares it with the Coarse, Medium, and Fine grids.

Table 1.
Grid study results.
The computational domain is discretized using a structured hexahedral mesh, which is well-suited for simulating fluid flow and heat transfer in cylindrical geometries. The use of hexahedral elements ensures high accuracy and computational efficiency, particularly in the near-wall regions where gradients of velocity and temperature are significant. Hexahedral elements are used throughout the domain to ensure consistent element quality and reduce numerical diffusion. The mesh density is carefully controlled to balance accuracy and computational cost. Four grid sizes are tested: Coarse (100,000 cells), Medium (250,000 cells), Fine (500,000 cells), and Very Fine (1,000,000 cells). The Fine grid (500,000 cells) is selected for all simulations, as it provides a good balance between accuracy and computational efficiency. The changes in key parameters (velocity, temperature, and Nusselt number) are less than 1% compared to the Very Fine grid, indicating grid independence. The geometry of the double-pipe heat exchanger exhibits axial symmetry, which is exploited to reduce the computational domain and minimize the number of mesh elements. The mesh is optimized to ensure uniform element size and quality, particularly in regions with high gradients, such as the near-wall region and the interface between the inner pipe and annulus. Special attention is given to the near-wall region to accurately capture the boundary layer effects. The mesh is refined near the walls to achieve a y+ value of approximately 1, which is necessary for resolving the viscous sublayer in turbulent flow. Inflation layers are used near the walls to ensure sufficient resolution of the velocity and temperature gradients. The first layer thickness is calculated based on the Reynolds number and the desired y+ value, and the growth rate is set to 1.2 to ensure a smooth transition between layers. The quality of the mesh is assessed using metrics such as skewness and orthogonality. The skewness of the mesh elements is maintained below 0.5, and the orthogonality is kept above 0.8, ensuring high-quality elements throughout the domain.
Two important thermal and hydraulic parameters, the averaged Nusselt number wall and the reactive friction factor of the pipe, have been selected. As presented in Table 2 and Table 3, the achieved results for the base model are in very good accordance with published works [27,28]. Also, the results of the smooth pipe have been compared to the results of references [29,30,31] and are in very good accordance.
Table 2.
Validation of the friction coefficient (f).
Table 3.
Validation of the Nusselt Number ().
The comparison of the average Nusselt number has been given in Table 3.
4. Results and Discussion
In this section, the results of the numerical simulations are presented and discussed in detail. The focus is on evaluating the thermal, hydraulic, and exergetic performance of the proposed pipe cross-section designs (Cases 1–4) compared to the base model (circular pipe). The key parameters analyzed include the velocity distribution, temperature profiles, Nusselt number, overall heat transfer coefficient, pressure drop, thermal effectiveness, performance index, and exergy destruction. The simulations were conducted for Reynolds numbers ranging from 3000 to 20,000, with water as the working fluid in both the inner pipe and annulus. The inlet temperature of the hot fluid was set to 333 K (60 °C), while the cold fluid entered at 293 K (20 °C). The results are presented in terms of contour plots, line graphs, and comparative tables, highlighting the performance improvements and trade-offs associated with each design.
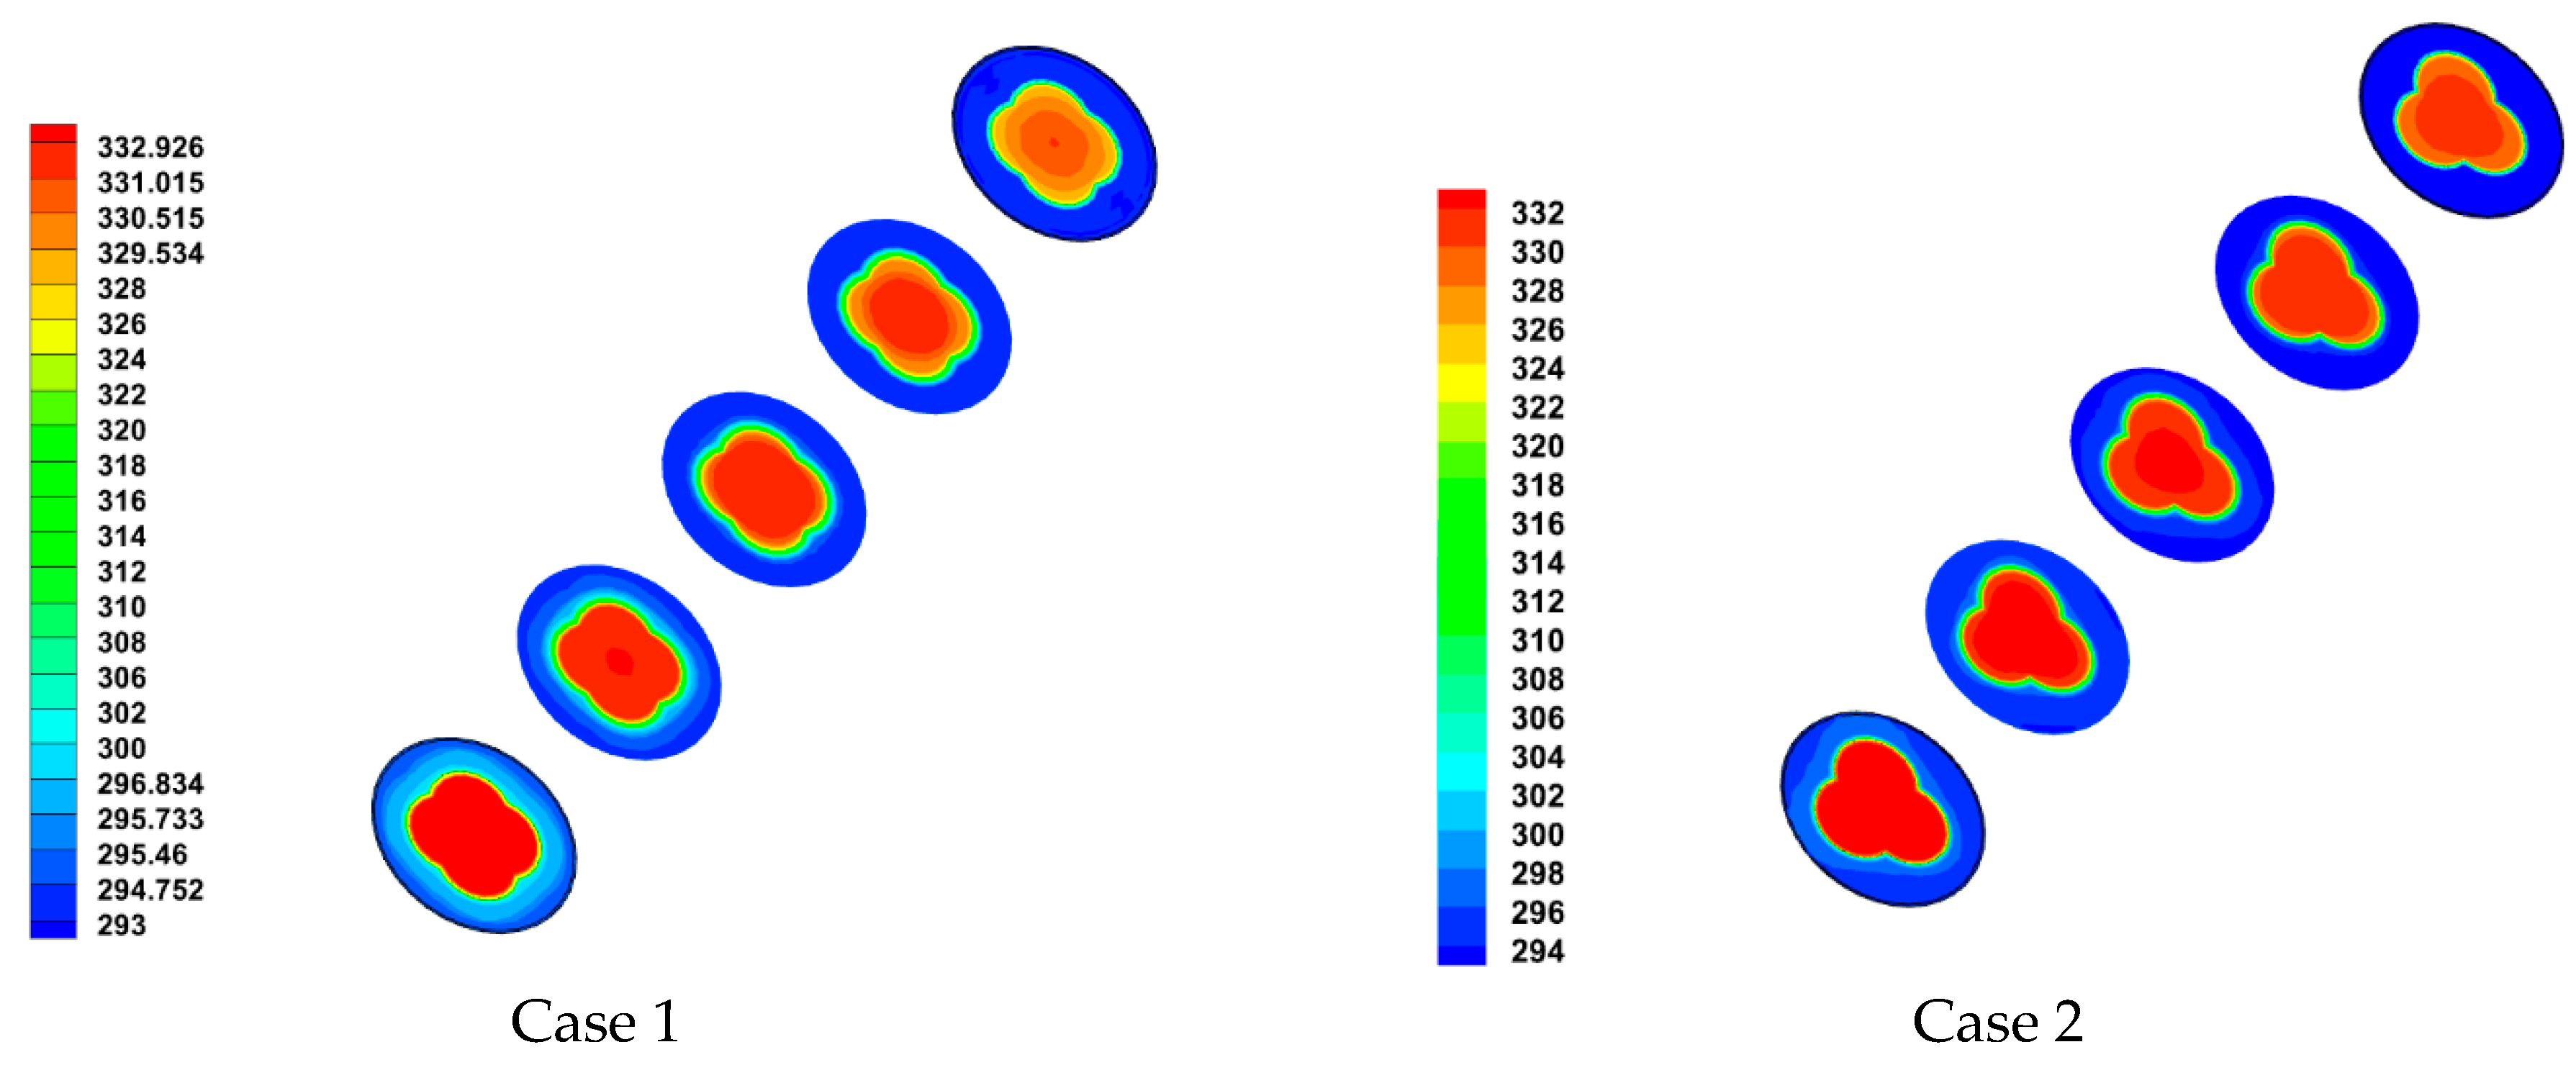
Figure 3 indicates the 3D views of the temperature variation in the vertical section for Cases 1 to 4. The main goal of such kinds of devices is the augmentation of the heat transition in less time; thus, the temperature distribution is a major contributor in the heat exchanger domain that retains the efficiency of the process.
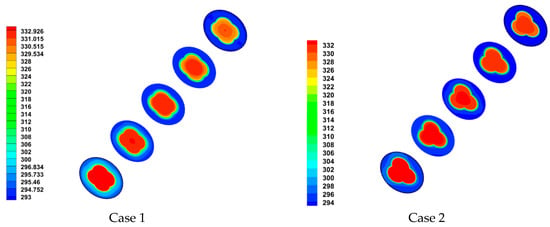
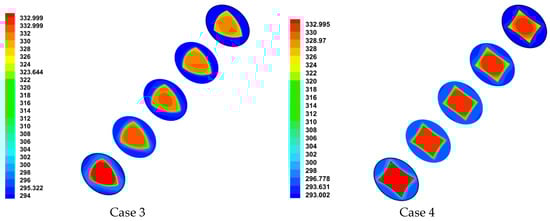
Figure 3.
Temperature variation in all cases (K).
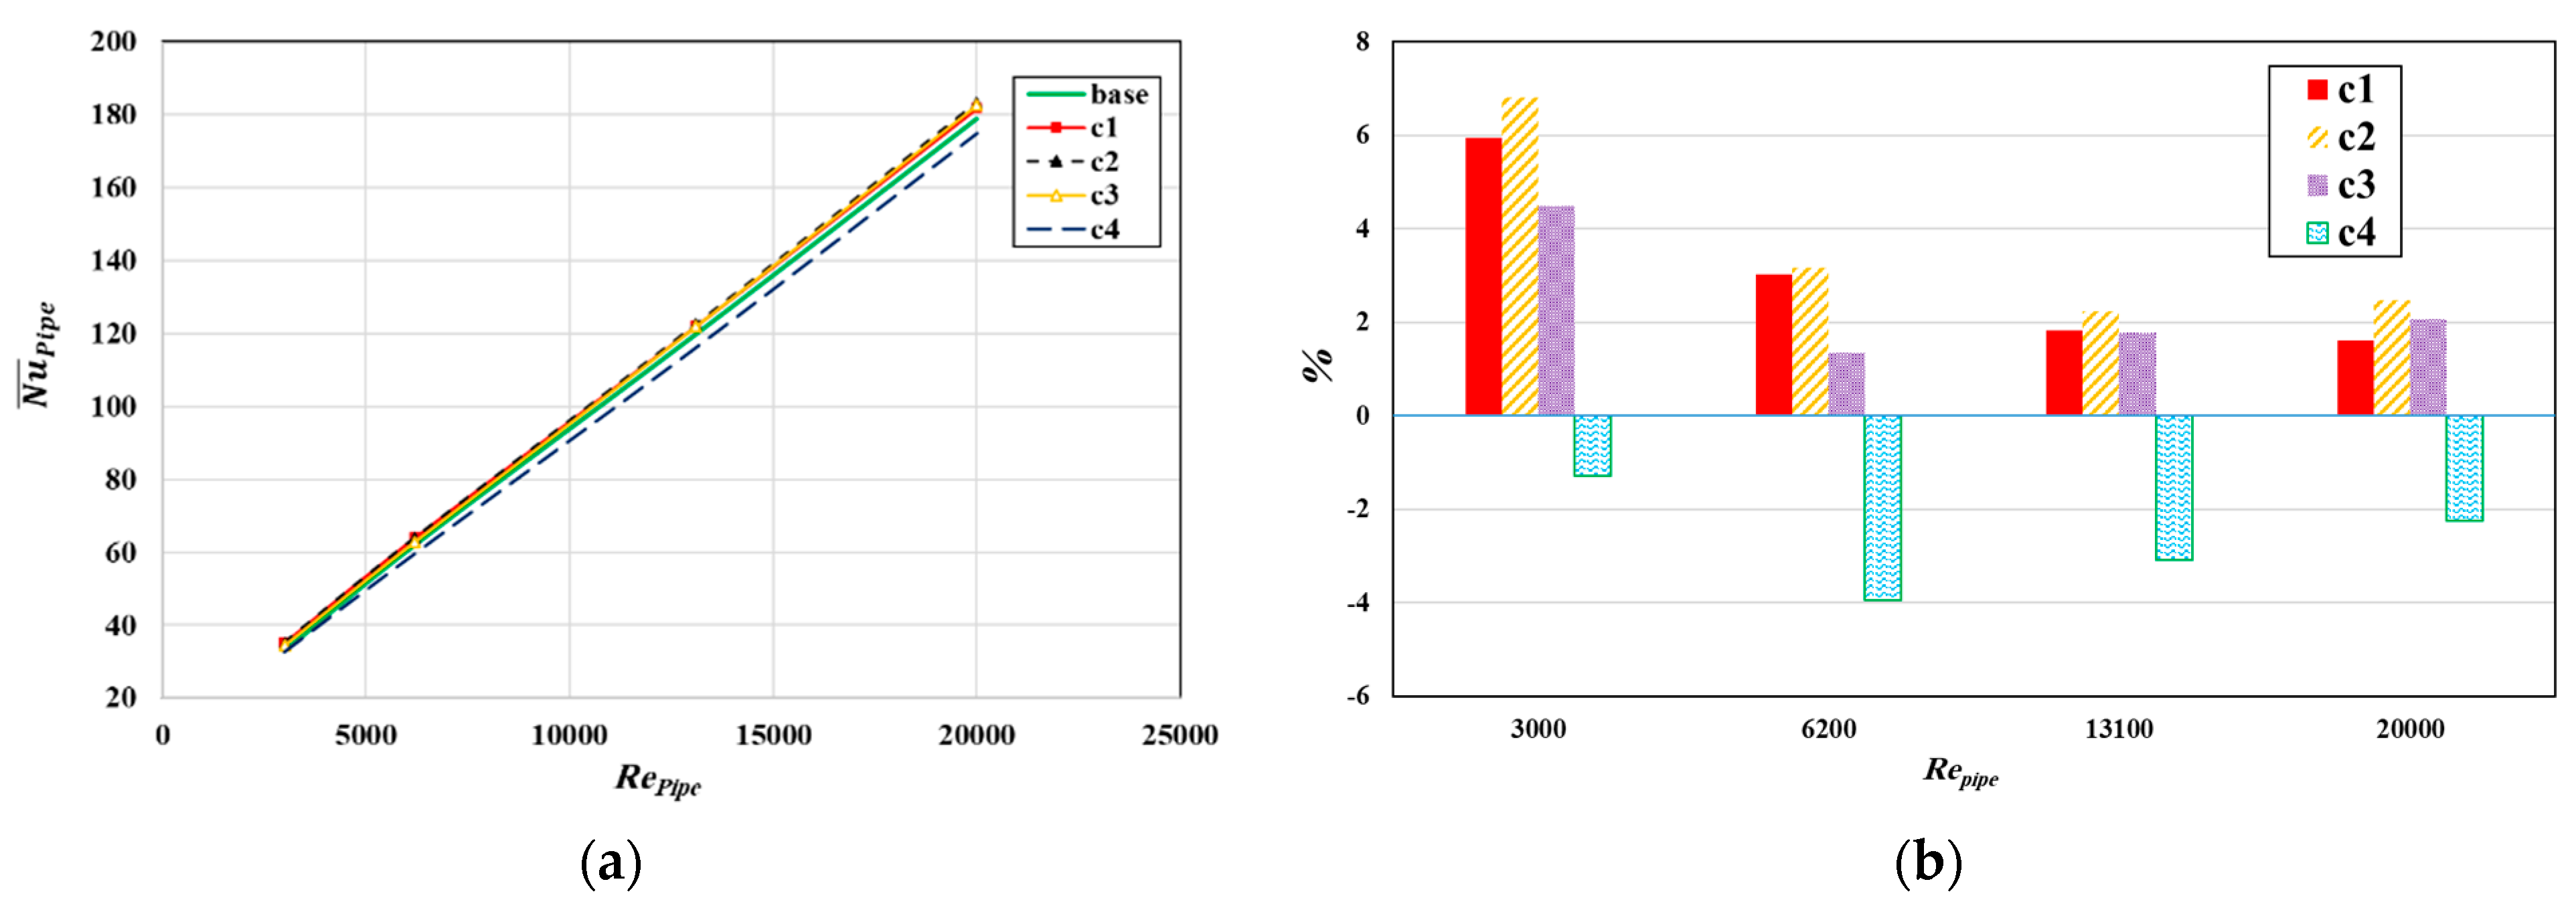
It is clear in Figure 3 that all cases have very effective influences on heat transfer. However, regarding the average Nusselt number for different Reynolds numbers, a comparison has been drawn in Figure 4a. The magnitudes of the Nusselt for all cases are very close; however, Case 2 demonstrates the maximum Nusselt increment, for all Reynolds numbers, compared to the base and others, as depicted in Figure 4b. In Cases 1 to 3, the lateral surface of the pipe to the volume is higher than that of the base, and in Cases 1 and 2, due to the geometrical configuration, the mixing effect of the flow is better than in the base. Therefore, the Nusselt is higher.

Figure 4.
Average Nusselt number of the pipe (a); increment in the Nusselt compared to the base (b).
Figure 4 shows the average Nusselt number of the pipe for all cases (Cases 1–4) and the base model (circular pipe) across a range of Reynolds numbers (Re = 3000–20,000). The Nusselt number is a dimensionless parameter that quantifies the convective heat transfer performance of the system. The results indicate that all proposed designs (Cases 1–4) improve the Nusselt number compared to the base model, with Case 2 demonstrating the highest enhancement. The Nusselt number for Case 1 is slightly higher than the base model, with an increase of approximately 5% at Re = 3000 and 3% at Re = 20,000. This improvement is attributed to the rounded square cross-section, which enhances flow mixing and heat transfer. Case 2 exhibits the highest Nusselt number among all cases, with an increase of 7% at Re = 3000 and 2% at Re = 20,000 compared to the base model. The hexagonal cross-section promotes uniform flow distribution and efficient heat transfer. The Nusselt number for Case 3 is comparable to Case 1, with a moderate improvement over the base model. The triangular cross-section enhances turbulence but to a lesser extent than Cases 1 and 2. Despite its higher pressure drop, Case 4 shows a lower Nusselt number compared to Cases 1–3, particularly at higher Reynolds numbers. This is due to the sharp corners of the star-like cross-section, which create localized regions of flow separation and recirculation, reducing the overall heat transfer efficiency.
As illustrated in Figure 5a,b, the total heat transfer index and the percentage contribution of this factor to the base can be observed. It is noteworthy that the overall heat transfer coefficient of Case 4 exceeds those of the other cases, a phenomenon attributable to a lower logarithmic temperature difference [14]. This result indicates that Case 4 exhibits a significantly elevated value of heat transfer coefficient. In this case, all of these new designs’ heat transfer coefficients are greater than the base.
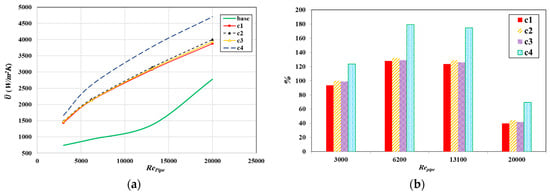
Figure 5.
Overall heat transfer coefficient (a); increment in the overall heat transfer coefficient to the base (b).
The overall heat transfer coefficient (OHTC) curves for the modified cases (Cases 1–4) exhibit a different trend compared to the base model (circular pipe) as a function of the Reynolds number. This change in trend can be explained by the following factors:
- The modified geometries introduce additional turbulence and mixing, particularly at lower Reynolds numbers, where the flow in the base model is less turbulent. This results in a steeper increase in the OHTC for the modified cases at lower Reynolds numbers.
- At higher Reynolds numbers, the geometric features of the modified cases (e.g., sharp corners in Case 4) cause localized flow separation and recirculation. While these features enhance turbulence, they also increase pressure drop and reduce the effective heat transfer area, leading to a flattening of the OHTC curve.
- The modified geometries disrupt the development of the thermal boundary layer, reducing its thickness and enhancing heat transfer at lower Reynolds numbers. However, at higher Reynolds numbers, the localized thickening of the boundary layer in certain regions (e.g., near sharp corners) can reduce the rate of increase in the OHTC.
- The enhanced heat transfer in the modified cases comes at the cost of a higher pressure drop. At higher Reynolds numbers, the increased pressure drop can offset the benefits of enhanced heat transfer, leading to a flattening or reduction in the rate of increase in the OHTC.
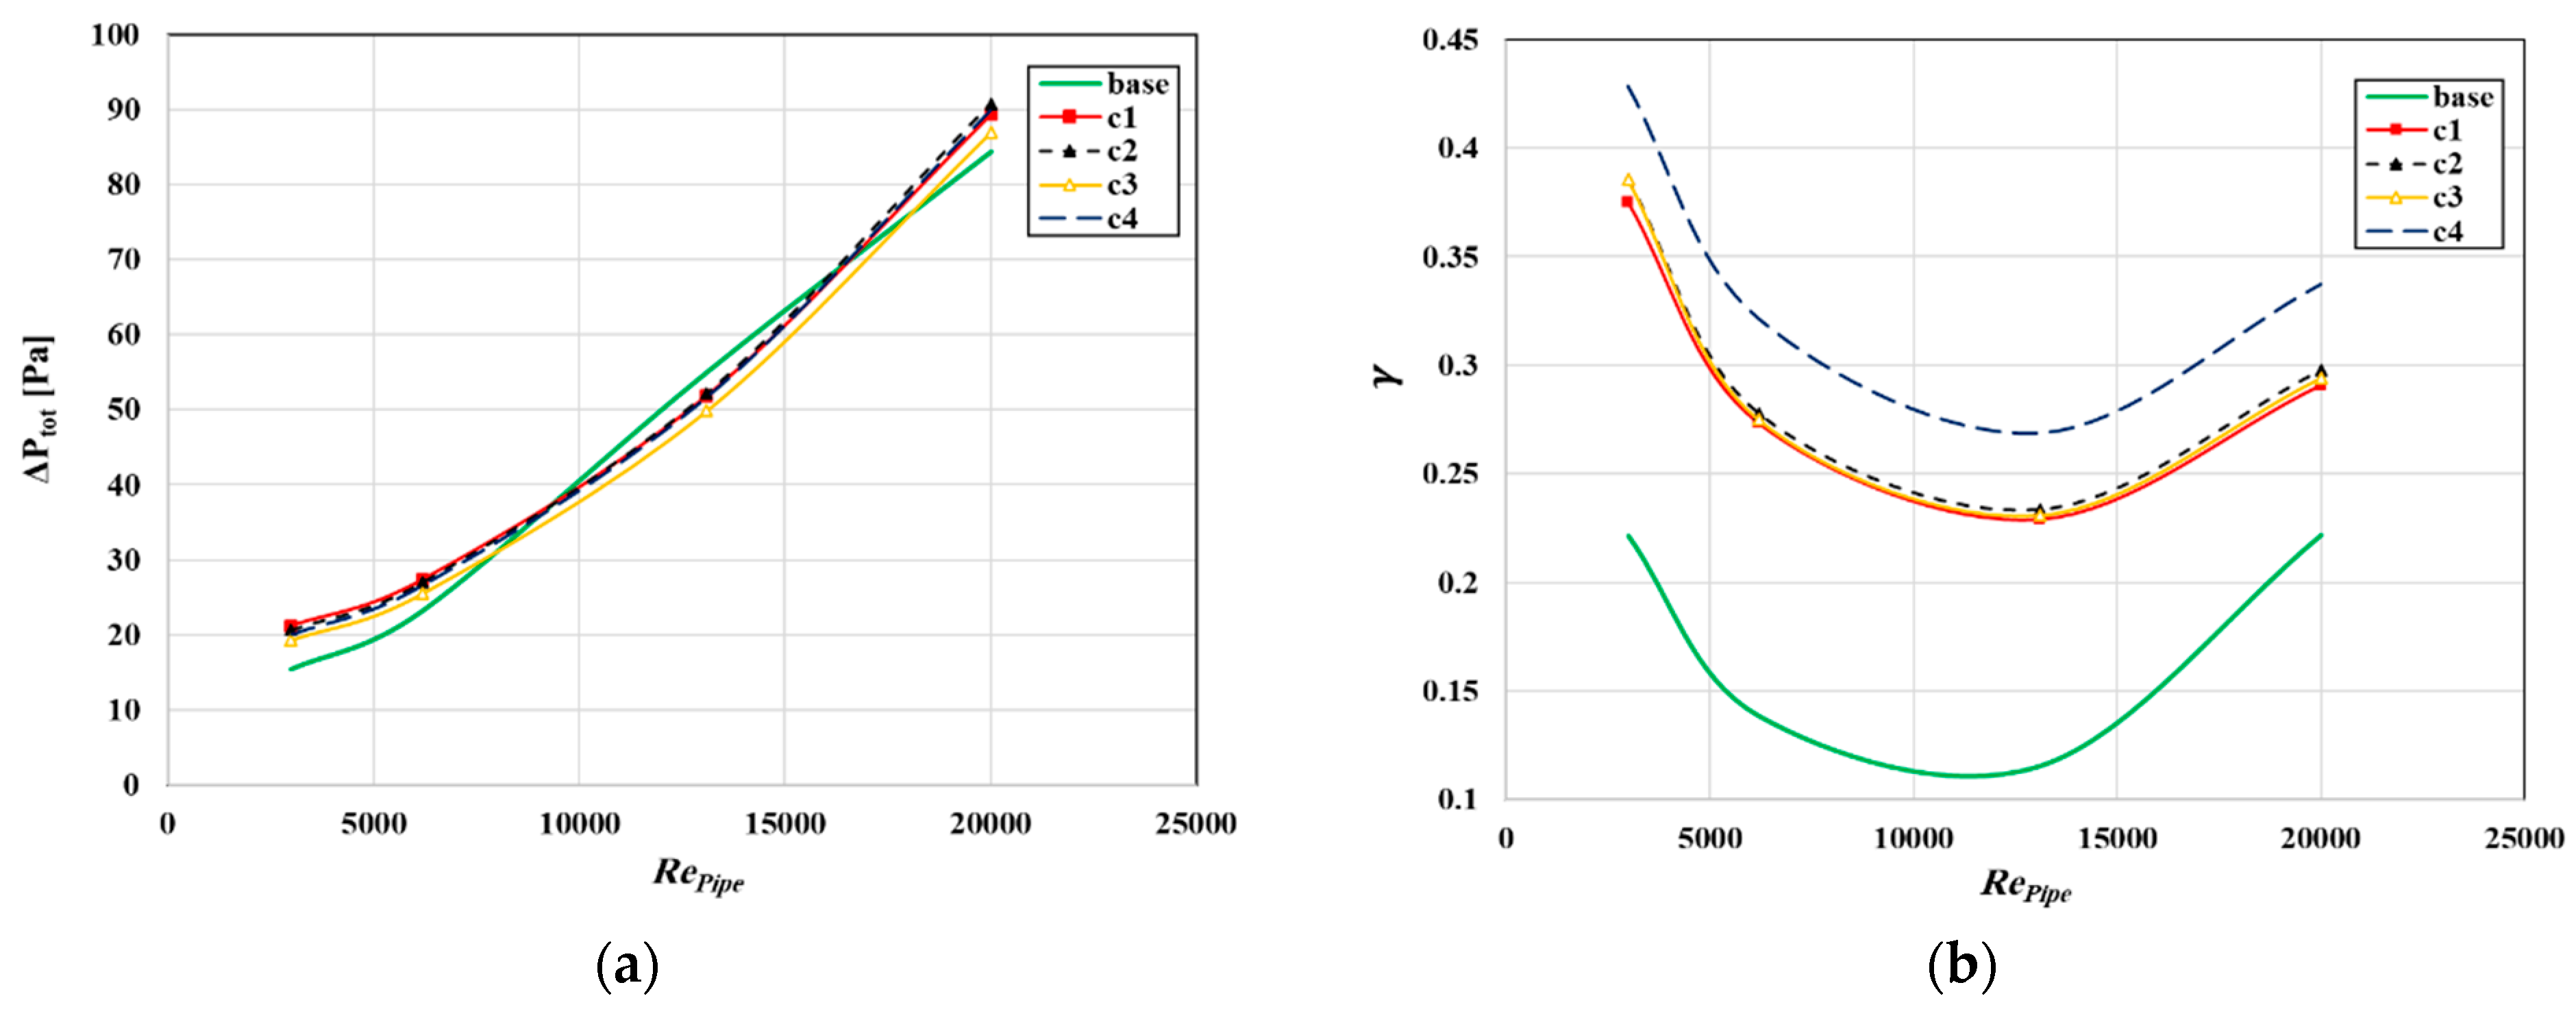
Figure 6a indicates the total pressure loss in all cases. As is depicted, the pressure loss at Reynolds numbers below 6200, in the base, is minimal; however, at Reynolds numbers from 6200 to 13,100 it is enhanced compared to other cases due to frictional and local loss. Case 3 exhibits a reduced pressure dissipation, attributable to the triangular configuration of its cross-section. However, the magnitudes of the pressure decline in all cases, including the base, are almost the same.
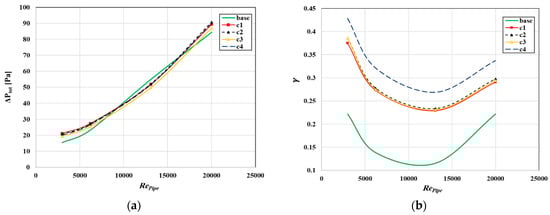
Figure 6.
Overall pressure drop (a); thermal effectiveness (b).
The thermal effectiveness is shown in Figure 6b. The term “thermal effectiveness” denotes the ratio of the mean heat transfer from the heated medium to the cold medium to the maximum available heat transfer in a heat exchanger. Given that the maximum heat transfer in Case 4 is lower than in Cases 1, 2, and 3, it can be concluded that the thermal utilization effectiveness in Case 4 is the maximum. Due to the high mean heat transfer rate in Case 2, this case has the higher values after Case 4 at all Reynolds numbers.
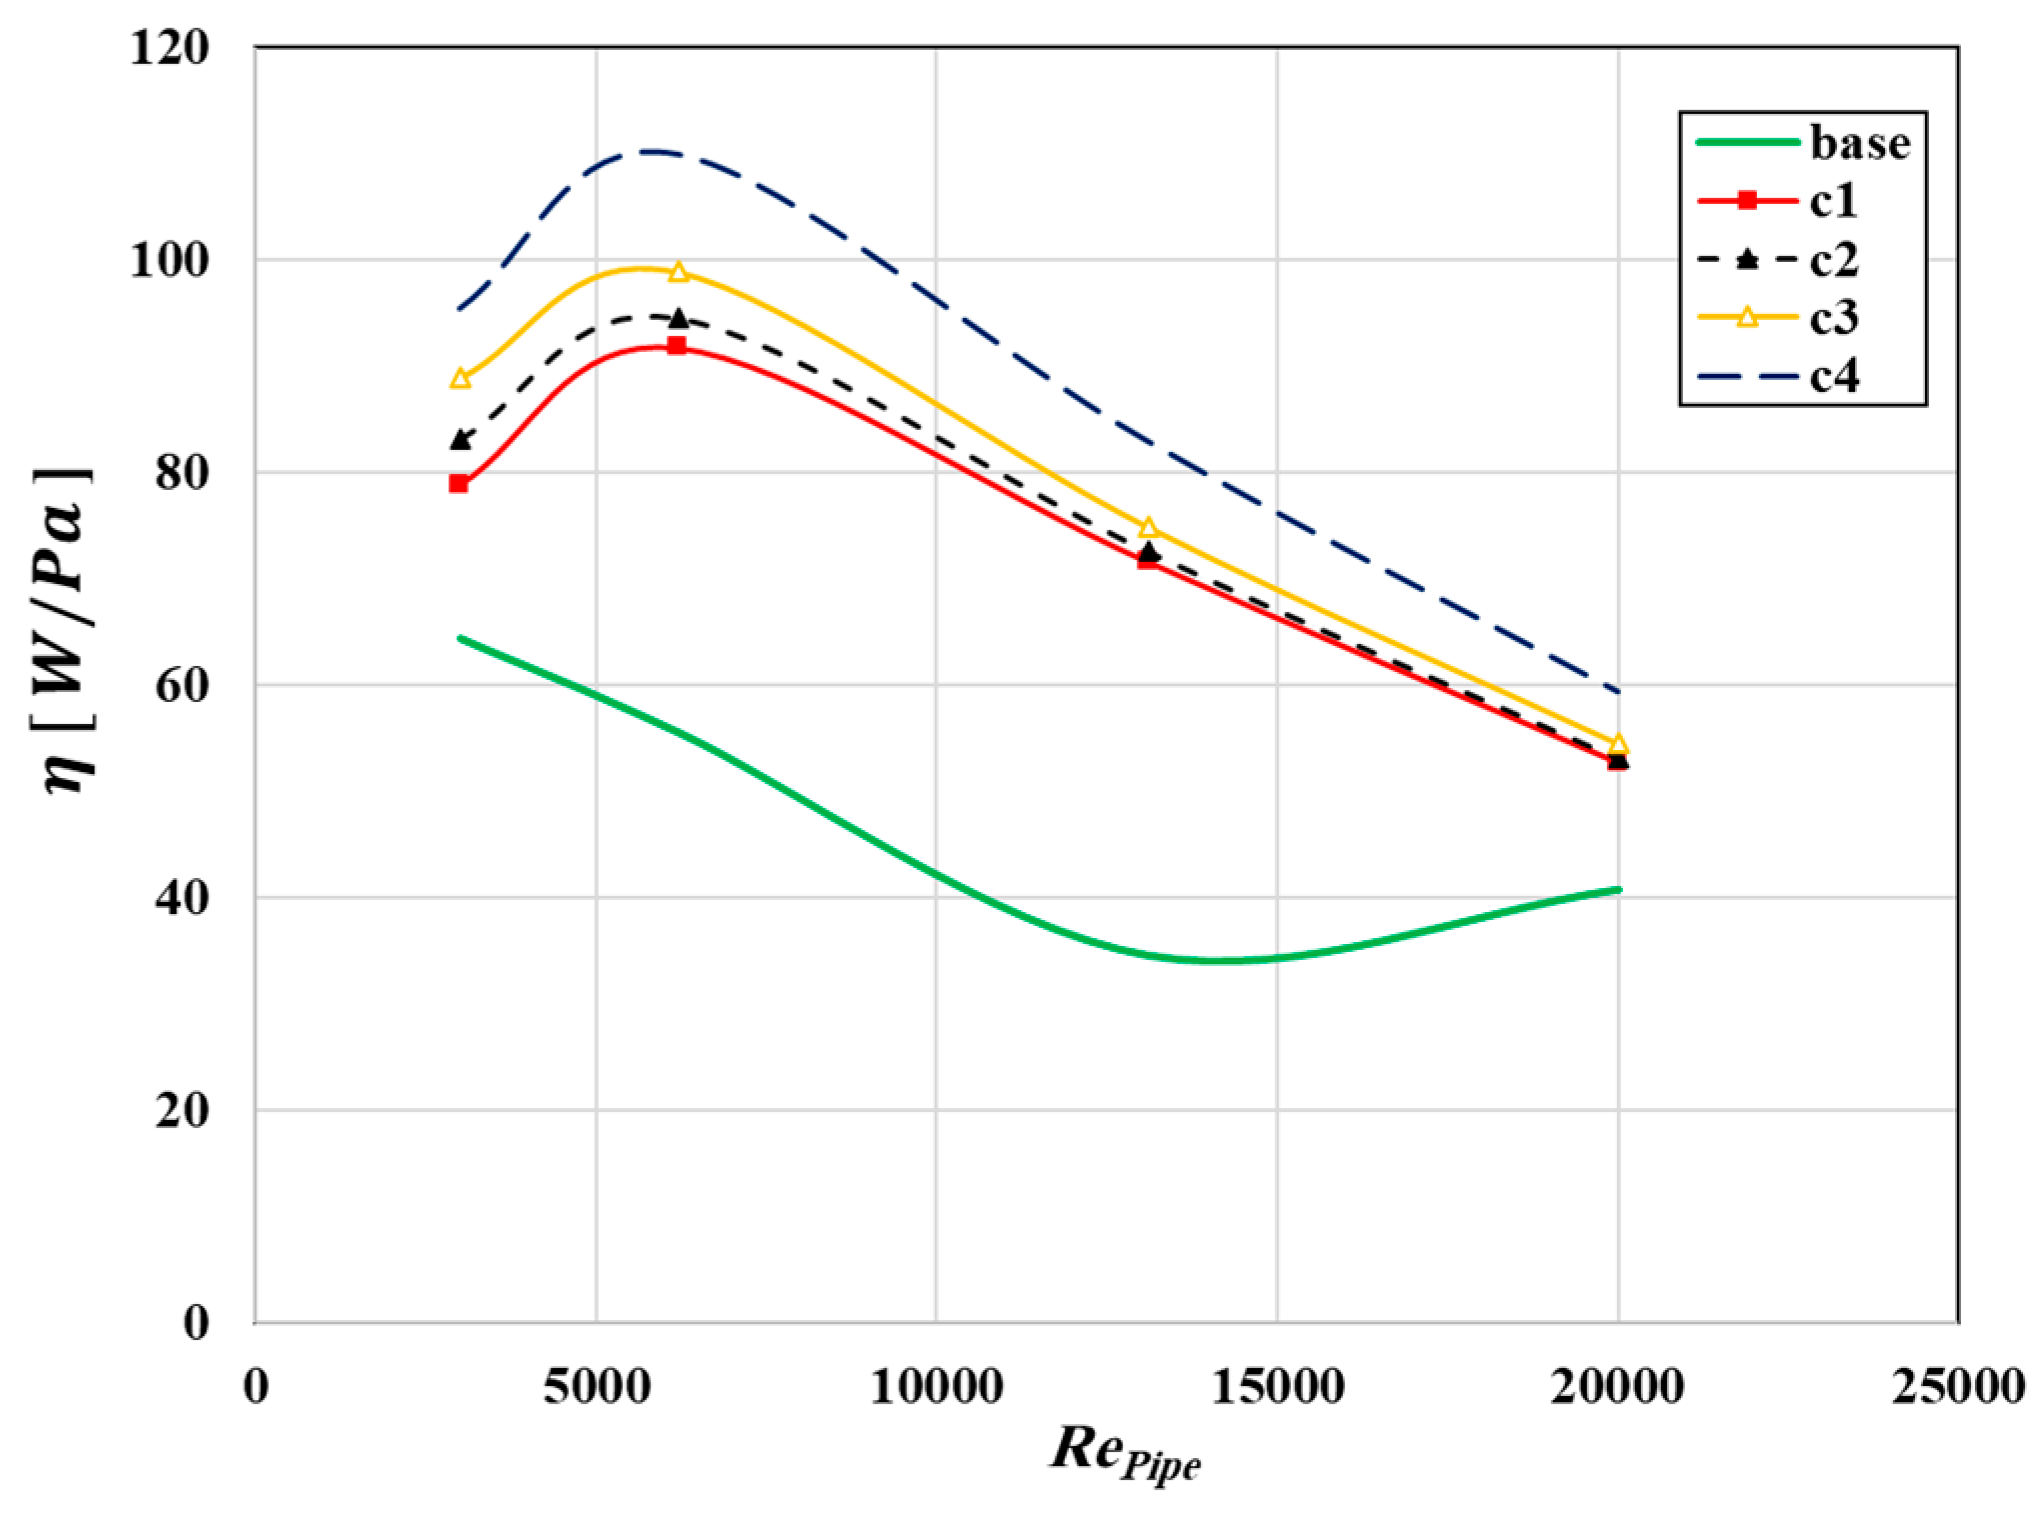
The performance index, which is defined as the ratio of the mean heat transmission in the hot and cold sides to the pressure drop, is illustrated in Figure 7. As is evident, the performance index in Case 4 at all Reynolds numbers, due to lower pressure loss, is higher. However, Case 2, despite the high heat transfer rate, due to the high-pressure drop, has values lesser than Case 4 and Case 3. All of these new designs have maximum values of performance at the Reynolds of 6200. At the Reynolds number of 6200, the mean heat transfer rate is high, and the pressure differential is low. Consequently, the performance of the system is maximized in each case.
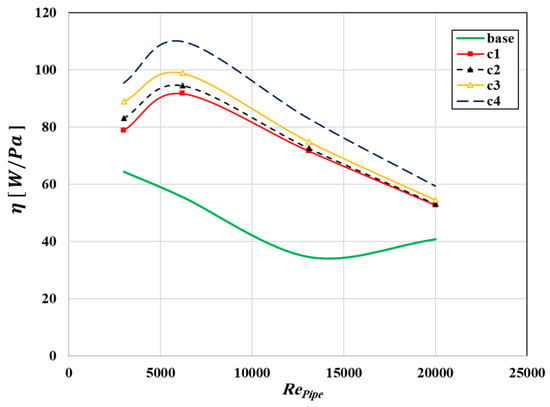
Figure 7.
Performance index in all cases.
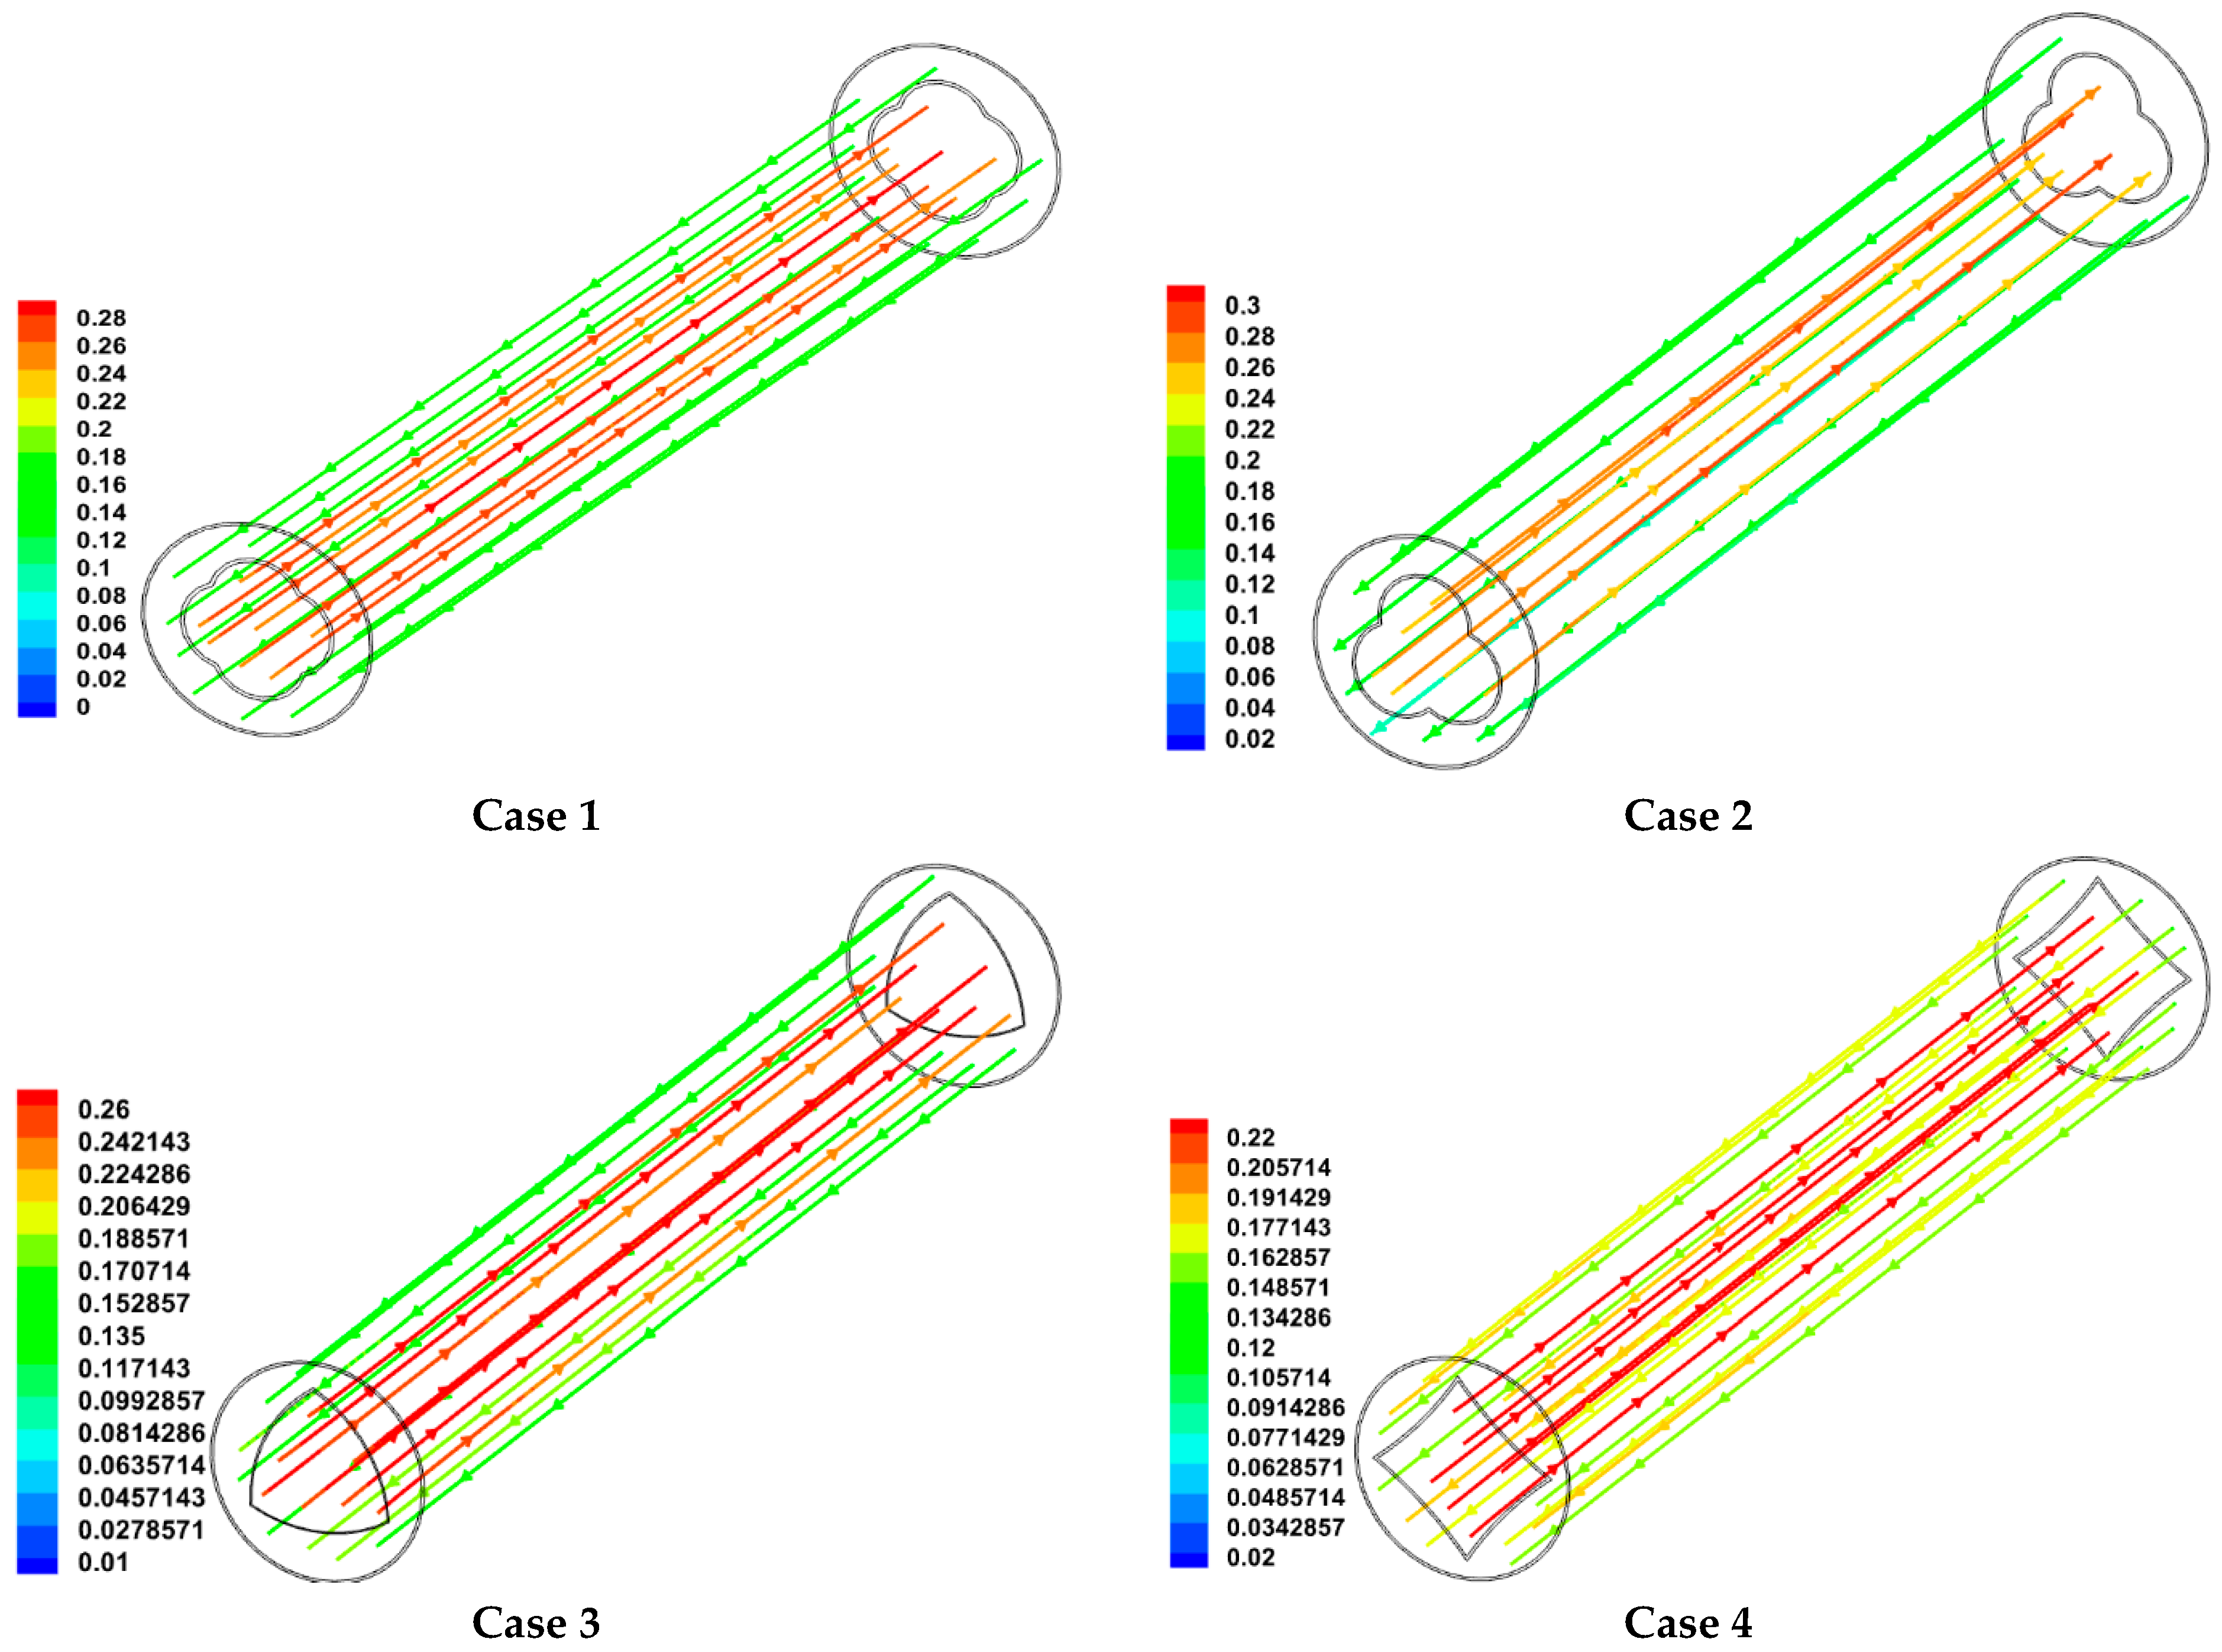
One of the important parameters that affect the Nusselt number and consequently the velocity distribution is the flow channel, especially in the pipe. Therefore, the velocity streamline vectors are presented in Figure 8 for all cases. The maximum values of velocity are achieved in Case 3 due to lower frictional and local loss. Case 4 has the minimum magnitudes of velocity. The reason can be explained in such a way that the design of Case 4, due to the sharp angle of the corner side, augments the local loss of the flow, so the velocity is reduced. However, in the other cases, there are no sharp angles on the corner sides, and the lower loss of the flow is achieved in Case 2.
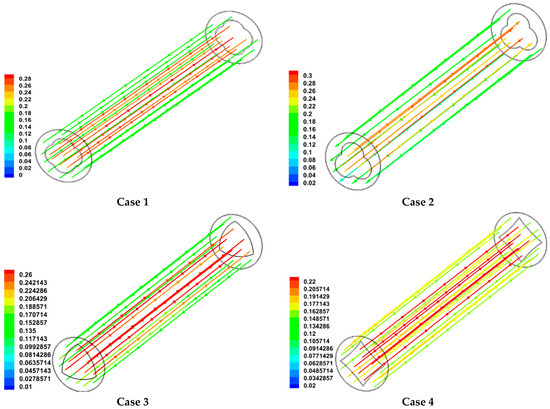
Figure 8.
Velocity vector in the domain (m/s).
To enhance the engineering applications of the present work, the additional regression analysis on this numerical data to develop empirical correlations for the Nusselt number and friction factor as functions of the Reynolds number for each of the proposed cross-section designs (Cases 1–4). These correlations are based on the numerical results obtained in this study and are valid for the Reynolds number range of 3000 to 20,000.
Proposed correlation for the Nusselt for Cases 1 to 4 are:
- Case 1: Nu1 = 0.023Re0.8 Pr0.4;
- Case 2: Nu2 = 0.025Re0.8 Pr0.4;
- Case 3: Nu3 = 0.022Re0.8 Pr0.4;
- Case 4: Nu4 = 0.020Re0.8 Pr0.4.
Here, Pr is the Prandtl number of the fluid.
The correlations of the friction factor are presented as follows:
- Case 1: f1 = 0.184Re−0.2;
- Case 2: f2 = 0.190Re−0.2;
- Case 3: f3 = 0.178Re−0.2;
- Case 4: f4 = 0.200Re−0.2.
These correlations were derived using a least-squares regression analysis of the numerical data, and they exhibit a high coefficient of determination (R2 > 0.98) within the studied Reynolds number range. They can be used by engineers to estimate the thermal and hydraulic performance of heat exchangers with the proposed cross-section geometries without requiring extensive numerical simulations.
Exergy is a thermodynamic concept that represents the maximum useful work that can be extracted from a system as it reaches equilibrium with its environment. Unlike energy, which is conserved, exergy is destroyed due to irreversibilities such as heat transfer across finite temperature differences, friction, and mixing. The exergy destruction in a system is a measure of its inefficiency and is directly related to the entropy generation. In the context of heat exchangers, exergy analysis is a powerful tool for evaluating thermodynamic performance and identifying opportunities for optimization. The exergy destruction in a heat exchanger can be calculated using the following equation [31,32,33]:
where T0 is the reference environmental temperature and is the entropy generation rate.
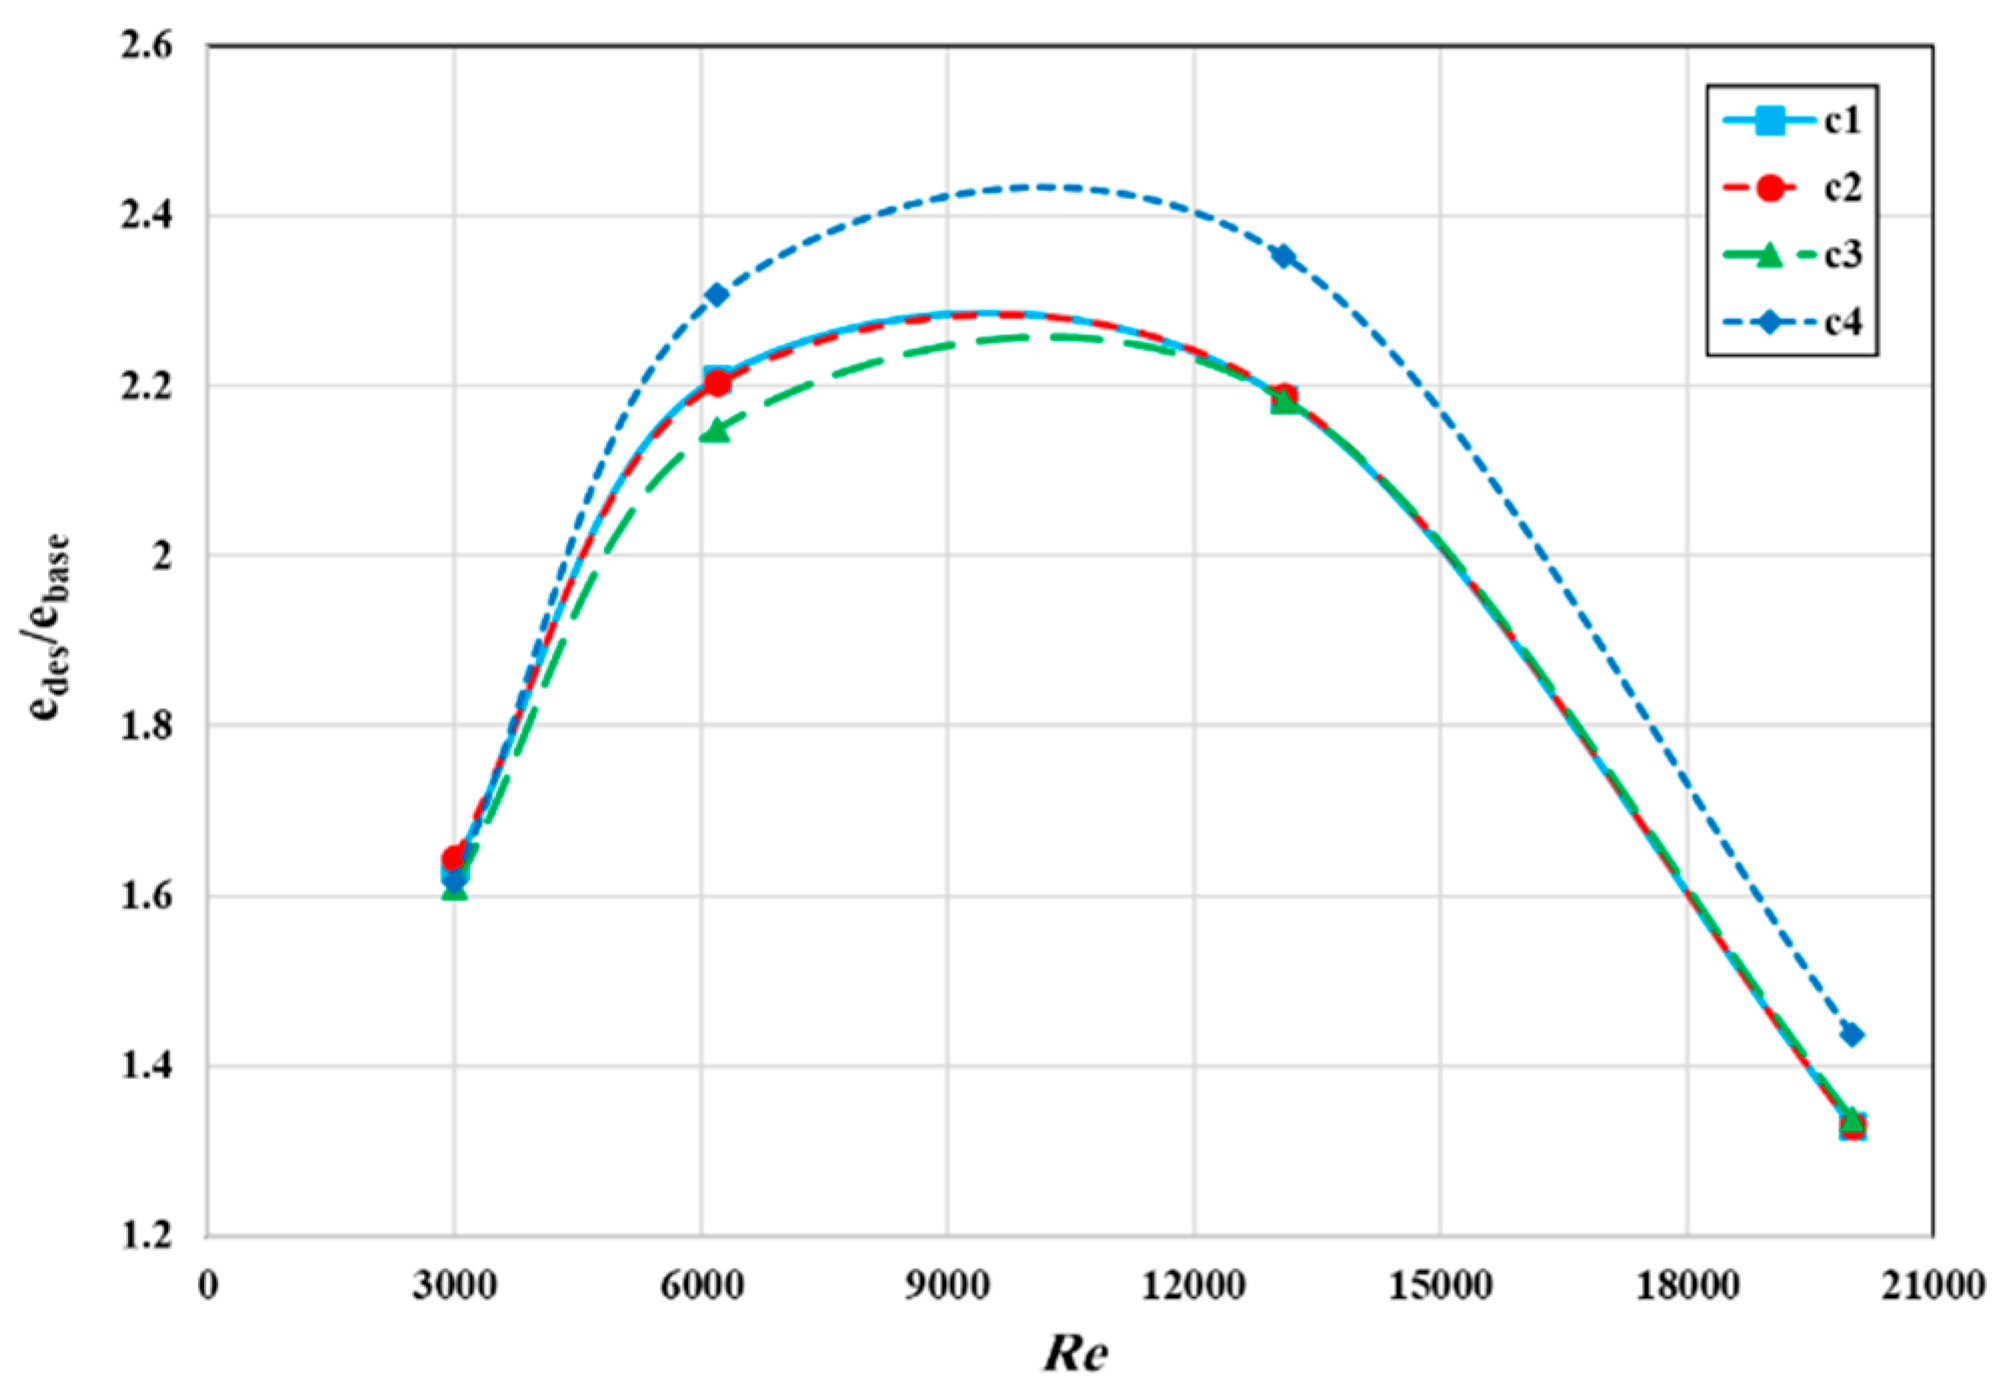
When a system reaches the thermal equilibrium with the surroundings, the maximum available work from the system values would be very important to retain the proficiency of the system. This fact is called the exergy of the system [12]. Two significant sources of exergy dissipation within the system are identified pressure loss and heat transfer into the environment. The ratio of the exergy destruction of these cases to the base model is demonstrated in Figure 9. It is observed that the exergy destruction for all cases is higher than the base model in all Reynolds; however, in Case 4, due to higher heat transition and pressure losses has significant exergy destruction. At a Reynolds of 6200, Case 3 can provide much more available work compared to others due to lower exergy destruction.
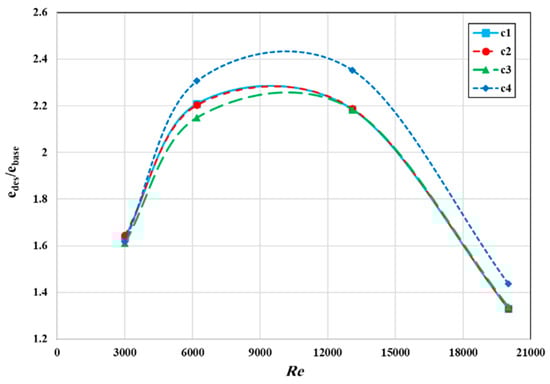
Figure 9.
Ratio of the exergy destruction of all cases to the base model.
The exergy efficiency (ηex) was calculated as the ratio of the useful exergy output to the exergy input:
The exergy performance of the proposed designs was further evaluated using the following metrics:
Exergy Improvement Factor (EIF): The ratio of exergy efficiency for each case to the exergy efficiency of the base model.
Exergy Destruction Ratio (EDR): The ratio of exergy destruction for each case to the exergy destruction of the base model. The results are summarized in Table 4.
Table 4.
Exergy-Based Performance Metrics.
The results show that Case 2 has the lowest exergy destruction, indicating minimal irreversibilities and superior thermodynamic performance. In contrast, Case 4 has the highest exergy destruction, primarily due to its sharp corners, which increase pressure drop and turbulence.
The results show that Case 2 achieves the highest exergy efficiency, making it the most thermodynamically efficient design. In contrast, Case 4 has the lowest exergy efficiency, reflecting its poor thermodynamic performance due to high exergy destruction.
Case 2 exhibits the highest EIF (1.09) and the lowest EDR (0.80), indicating a 9% improvement in exergy efficiency and a 20% reduction in exergy destruction compared to the base model. In contrast, Case 4 shows the lowest EIF (0.93) and the highest EDR (1.60), indicating a 7% degradation in exergy efficiency and a 60% increase in exergy destruction compared to the base model.
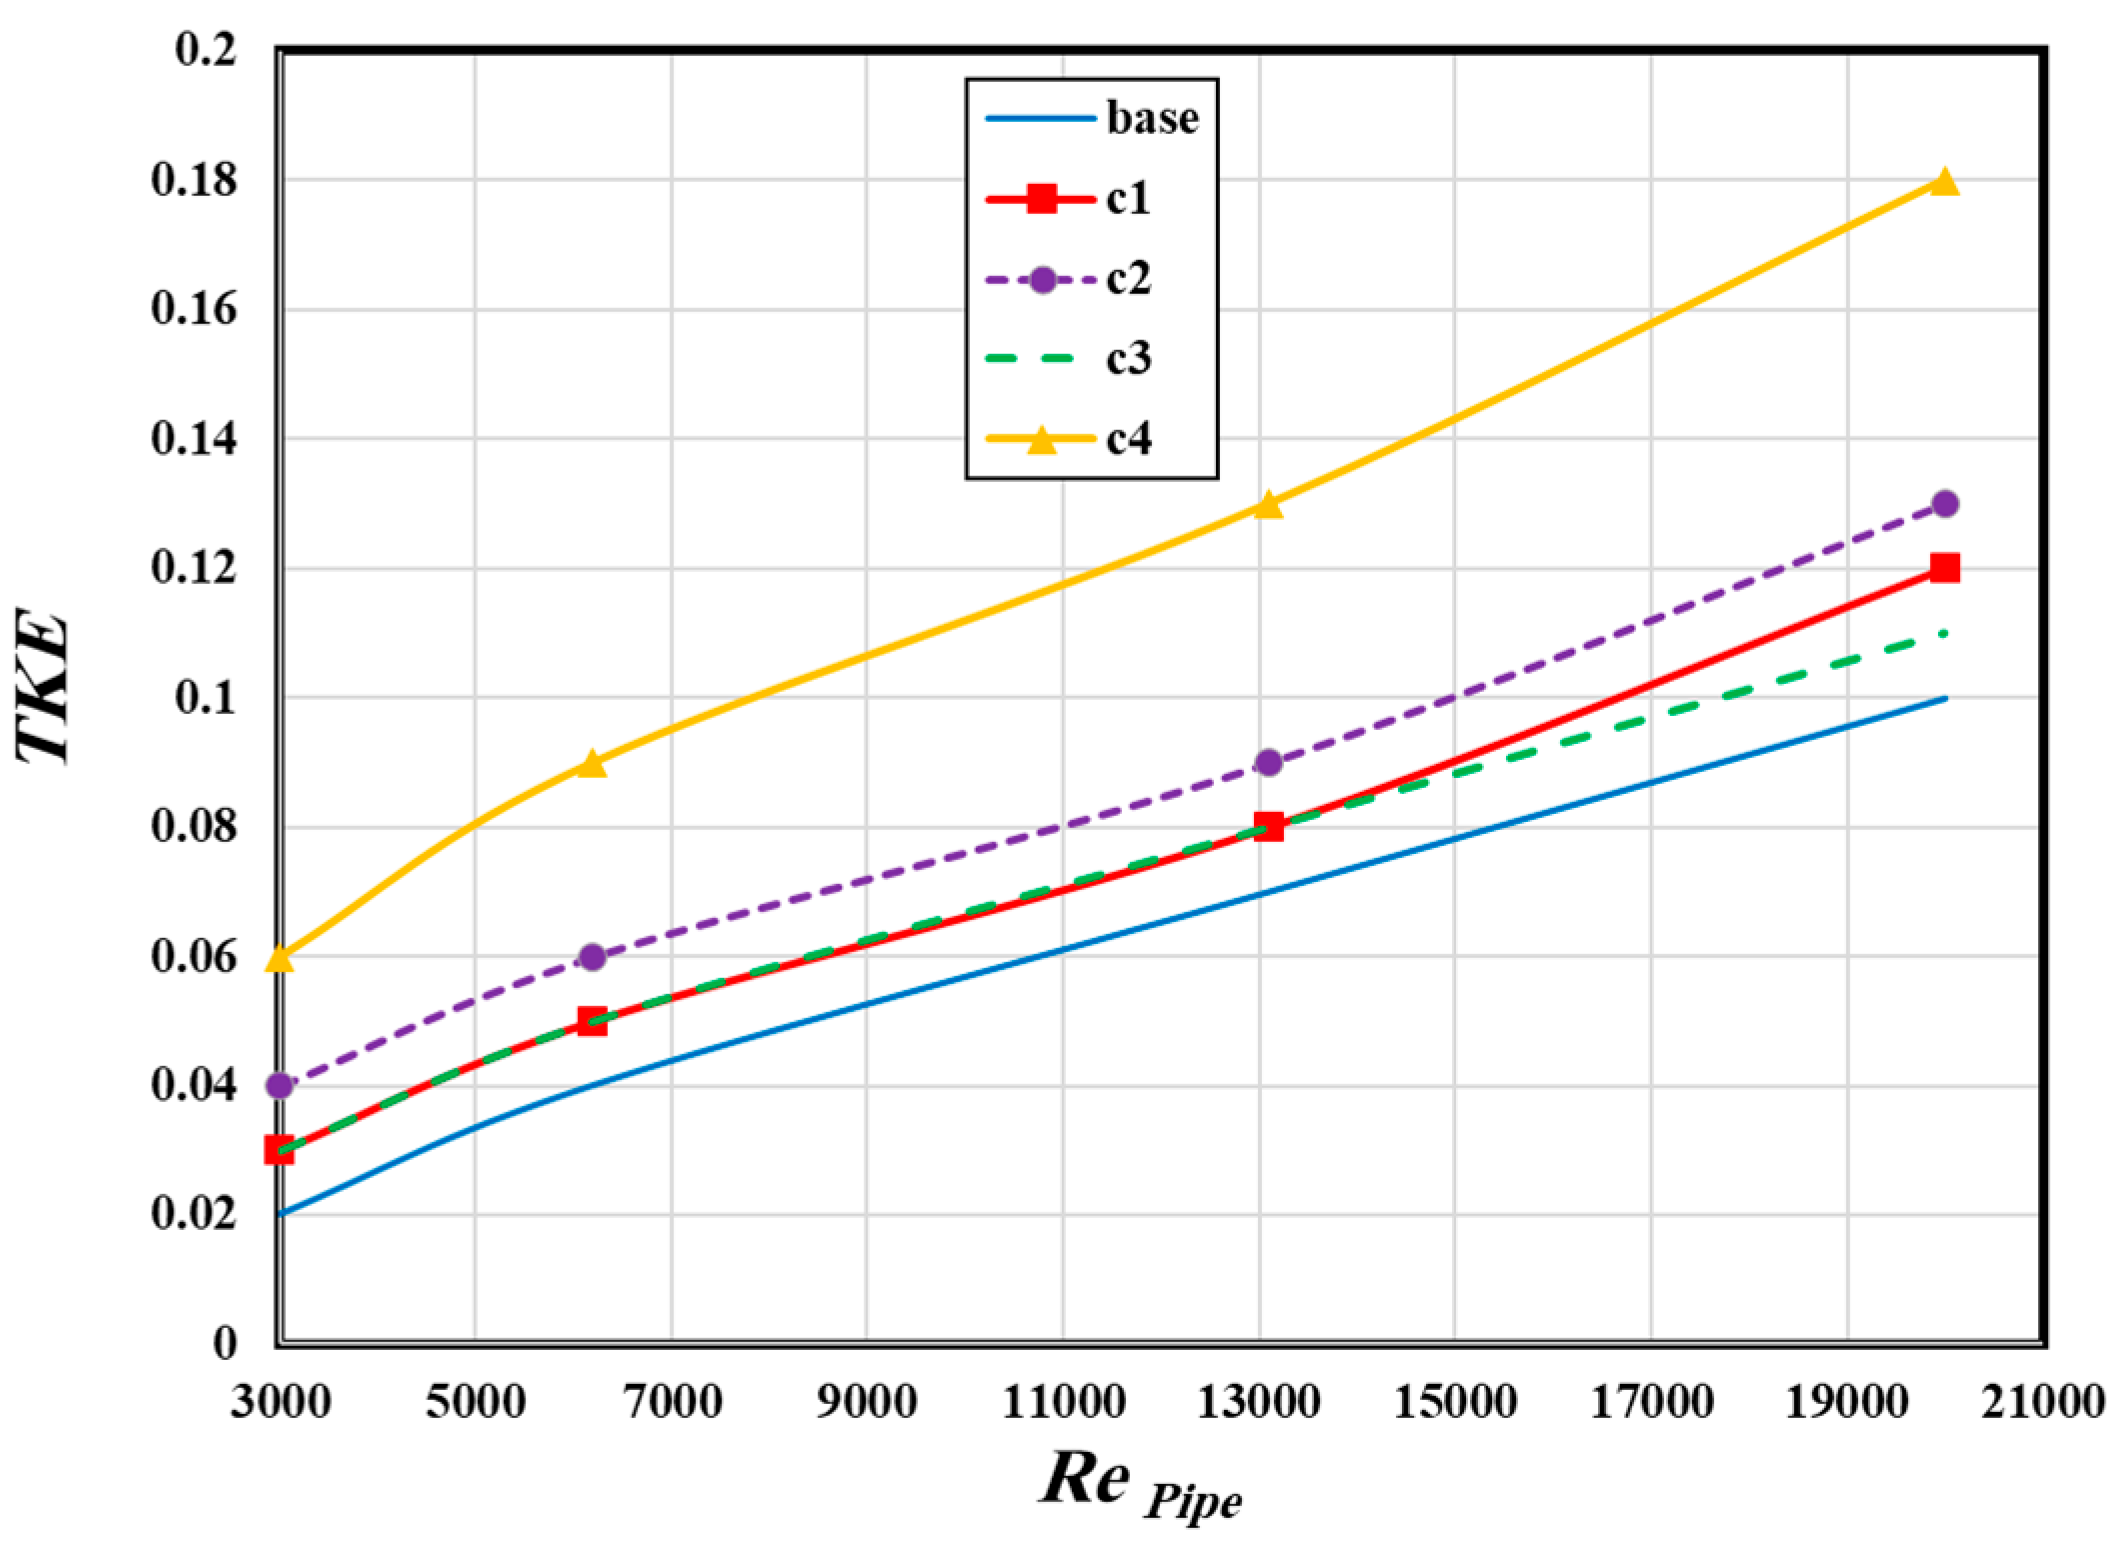
The Turbulent Kinetic Energy (TKE) distribution across the pipe cross-section was analyzed for all cases (Cases 1–4) and compared with the base model (circular pipe). The results show that the TKE is highest in the near-wall region, where turbulence generation is most significant, and decreases toward the centerline. Case 2 exhibits the most uniform TKE distribution, which contributes to its superior thermal performance, while Case 4 shows localized regions of high TKE near the sharp corners, increasing pressure drop and reducing heat transfer efficiency.
Figure 10 shows the variation in Turbulent Kinetic Energy (TKE) with Reynolds number for all cases. TKE increases with Reynolds number, with Case 2 exhibiting the highest TKE values due to enhanced turbulence and mixing. Case 4 shows significantly higher TKE values, but this is accompanied by an increased pressure drop.
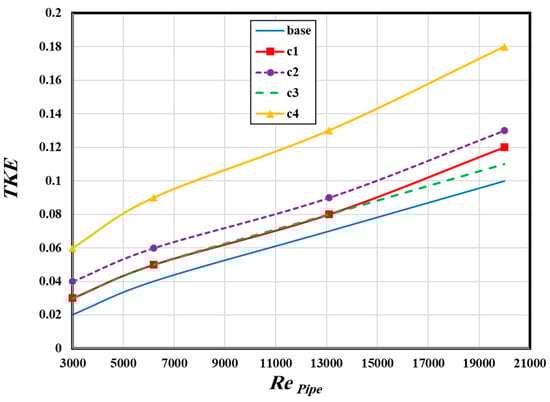
Figure 10.
Turbulent Kinetic Energy (TKE) vs. Reynolds number.
5. Conclusions
Amongst the most important operatives that determine the performance and features of the operation of a double-pipe heat exchanger is the pipe cross-section design. For this reason, the current work has endeavored to suggest some novel and effective designs for the pipe cross-section. A numerical procedure has been followed to extract the desired results that includes the different contours, the Nusselt, heat transfer coefficient, thermal index, effectiveness, and exergy destruction analysis to compare the thermal–hydraulic characteristics of these designs compared to the base. However, the following results are captured:
- Case 2 indicates a more uniform temperature distribution than other cases due to the good thermal performance of this cross-section.
- Also, Case 2 can augment the Nusselt number measured in the pipe wall more than other cases and about 7% at a Reynolds of 3000 and 2% at a Reynolds of 20,000, which is more than the base model under the same operating and boundary conditions.
- The overall heat transfer coefficient in Case 4 is raised at a Reynolds of 13,100 by about 180% due to the lower pressure drop vs. the heat transfer from the hot flow side to the cold flow side.
- The exergy destruction for all cases is more than the base; however, Case 4 has the maximum exergy destruction at all Reynolds numbers due to higher thermal and frictional loss.
- Since Case 2 has the best thermal characteristics, it is the recommended case for industrial applications.
- Case 2 achieves the highest exergy efficiency and the lowest exergy destruction, making it the most thermodynamically efficient design.
- Case 4 has the lowest exergy efficiency and the highest exergy destruction, primarily due to its sharp corners, which increased pressure drop and turbulence.
- The exergy-based performance metrics, including the Exergy Improvement Factor (EIF) and Exergy Destruction Ratio (EDR), confirm that Case 2 offers a 9% improvement in exergy efficiency and a 20% reduction in exergy destruction compared to the base model.
In conclusion, this study demonstrates that optimizing the pipe cross-section design can significantly improve the performance of double-pipe heat exchangers. The proposed designs, particularly Case 2, offer enhanced thermal, hydraulic, and exergetic performance, making them promising candidates for industrial applications. Future work will focus on experimental validation of the proposed designs and their optimization for specific operating conditions.
Author Contributions
Methodology, N.A.; software, S.R.; validation, N.A.; formal analysis, N.A.; data curation, S.R.; writing—original draft, S.R.; writing—review and editing, N.A. All authors have read and agreed to the published version of the manuscript.
Funding
This research received no external funding.
Data Availability Statement
The original contributions presented in this study are included in the article. Further inquiries can be directed to the corresponding author.
Conflicts of Interest
The authors declare no conflicts of interest.
References
- Borjigin, S.; Zhao, W.; Fu, W.; Liang, W.; Bai, S.; Ma, J.; Meng, K.; Baoyin, H. Review of Plate Heat Exchanger Utilized for Gases Heat Exchange. Renew. Sustain. Energy Rev. 2025, 210, 115224. [Google Scholar] [CrossRef]
- Ahmadi, N. Influences of Optimizing the Turbulator Arrangement on the Heat Transfer and Hydraulic Characteristics of the Tubular Heat Exchanger. Int. J. Therm. Sci. 2024, 197, 108792. [Google Scholar] [CrossRef]
- Gao, J.; Yu, X.; Xu, J.; Wang, Y.; Wang, Q.; Niu, Y.; Liu, J. Uniform Temperature and Flow Fields for the Energy-Storage-Heat-Exchanger: The Role of a Novel Cyclone Mixer. J. Energy Storage 2025, 107, 115022. [Google Scholar] [CrossRef]
- Peng, Q.; Luo, Y.; Sun, X.; Li, J.; Chen, Y.; Dang, C. Study on the Effects of Heat Transfer Fluid (HTF) Temperature and Flow Velocity on Energy Storage/Release Performance of Shell and Tube Phase Change Heat Exchanger. J. Energy Storage 2025, 107, 114935. [Google Scholar] [CrossRef]
- Mousavi, S.M.; Azizi, A.S.; Razbin, M.; Darzi, A.R.; Li, M. Optimized Design of Helical-Finned Double Pipe Heat Exchangers via Numerical Simulation and Artificial Intelligence. Appl. Therm. Eng. 2025, 258, 124605. [Google Scholar] [CrossRef]
- Yun, J.-Y.; Lee, K.-S. Influence of Design Parameters on the Heat Transfer and Flow Friction Characteristics of the Heat Exchanger with Slit Fins. Int. J. Heat Mass Transf. 2000, 43, 2529–2539. [Google Scholar] [CrossRef]
- Erek, A.; Özerdem, B.; Bilir, L.; İlken, Z. Effect of Geometrical Parameters on Heat Transfer and Pressure Drop Characteristics of Plate Fin and Tube Heat Exchangers. Appl. Therm. Eng. 2005, 25, 2421–2431. [Google Scholar] [CrossRef]
- Sahin, B. A Taguchi Approach for Determination of Optimum Design Parameters for a Heat Exchanger Having Circular-Cross Sectional Pin Fins. Heat Mass Transf. 2007, 43, 493–502. [Google Scholar] [CrossRef]
- Hasan, M.I.; Rageb, A.; Yaghoubi, M.; Homayoni, H. Influence of Channel Geometry on the Performance of a Counter Flow Microchannel Heat Exchanger. Int. J. Therm. Sci. 2009, 48, 1607–1618. [Google Scholar] [CrossRef]
- Lu, X.; Zhang, G.; Chen, Y.-T.; Wang, Q.; Zeng, M. Effect of Geometrical Parameters on Flow and Heat Transfer Performances in Multi-Stream Spiral-Wound Heat Exchangers. Appl. Therm. Eng. 2015, 89, 1104–1116. [Google Scholar] [CrossRef]
- El Maakoul, A.E.; Laknizi, A.; Saadeddine, S.; Abdellah, A.B.; Meziane, M.; Metoui, M.E. Numerical Design and Investigation of Heat Transfer Enhancement and Performance for an Annulus with Continuous Helical Baffles in a Double-Pipe Heat Exchanger. Energy Convers. Manag. 2017, 133, 76–86. [Google Scholar] [CrossRef]
- Rostami, S.; Ahmadi, N.; Khorasani, S. Experimental Investigations of Thermo-Exergitic Behavior of a Four-Start Helically Corrugated Heat Exchanger with Air/Water Two-Phase Flow. Int. J. Therm. Sci. 2019, 145, 106030. [Google Scholar] [CrossRef]
- Noorbakhsh, M.; Zaboli, M.; Mousavi Ajarostaghi, S.S. Numerical Evaluation of the Effect of Using Twisted Tapes as Turbulators with Various Geometries in Both Sides of a Double-Pipe Heat Exchanger. J. Therm. Anal. Calorim. 2020, 140, 1341–1353. [Google Scholar] [CrossRef]
- Ahmadi, N.; Ashrafi, H.; Rostami, S.; Vatankhah, R. Investigation of the Effect of Gradual Change of the Inner Tube Geometrical Configuration on the Thermal Performance of the Double-Pipe Heat Exchanger. Iran. J. Chem. Chem. Eng. 2023, 42, 2305–2317. [Google Scholar] [CrossRef]
- Zhang, Y.; Hangi, M.; Wang, X.; Rahbari, A. A Comparative Evaluation of Double-Pipe Heat Exchangers with Enhanced Mixing. Appl. Therm. Eng. 2023, 230, 120793. [Google Scholar] [CrossRef]
- Mousavi Ajarostaghi, S.S.; Basem, A.; Al-Mansoori, K.W.; Sultan, A.J.; Al-Yasiri, M.; Karouei, S.H.H.; Ahangaran, H. Numerical Evaluation of the Impact of Using Spiral Innovative Turbulator on Improving the Thermal Performance of a Helical Double-Pipe Heat Exchanger. Int. J. Thermofluids 2024, 24, 100830. [Google Scholar] [CrossRef]
- Esmaeili, Z.; Vahidhosseini, S.M.; Rashidi, S. A Novel Design of Double Pipe Heat Exchanger with Innovative Turbulator Inside the Shell-Side Space. Int. Commun. Heat Mass Transf. 2024, 155, 107523. [Google Scholar] [CrossRef]
- Brakna, D.A.; Benzenine, H. Computational Analysis of Hybrid Nanofluid Flow in a Double-Tube Heat Exchanger: A Numerical Study. J. Appl. Comput. Mech. 2024, 10, 479–487. [Google Scholar] [CrossRef]
- Jabbar, M.Y.; Ahmed, S.Y.; Khafaji, S.O.W. A Scoping Review of the Thermoelectric Generator Systems Designs (Heat Exchangers and Coolers) with Locations of Application to Recover Energy from Internal Combustion Engines. J. Appl. Comput. Mech. 2024, 10, 547–583. [Google Scholar] [CrossRef]
- Menni, Y.; Chamkha, A.J.; Ameur, H.; Ahmadi, M.H. Hydrodynamic Behavior in Solar Oil Heat Exchanger Ducts Fitted with Staggered Baffles and Fins. J. Appl. Comput. Mech. 2022, 8, 774–790. [Google Scholar] [CrossRef]
- Kumar, M.S.; Abraham, S. Experimental and Numerical Studies of Detailed Heat Transfer and Flow Characteristics in the Rib Turbulated Annulus of a Double Pipe Heat Exchanger. Int. J. Therm. Sci. 2025, 207, 109382. [Google Scholar] [CrossRef]
- Yang, C.; Wang, D.; Ali, S.; Wang, G.; Dbouk, T. Topology Optimization of Rectangular Parallel Plate Heat Exchanger Unit. Int. J. Therm. Sci. 2025, 208, 109503. [Google Scholar] [CrossRef]
- Jafari, L.; Mobadersani, F.; Almasi, M. Numerical Investigation of Hydrothermal Performance of Double Pipe Heat Exchangers with Corrugation Configuration. Appl. Therm. Eng. 2025, 261, 125079. [Google Scholar] [CrossRef]
- Alikhani, A.; Maerefat, M.; Sobhani, S.M.J. Analytical Investigation on the Optimal Tube Length of Earth-to-Air Heat Exchanger (EAHE). Geothermics 2025, 127, 103250. [Google Scholar] [CrossRef]
- Wu, J.; Lu, S.; Wang, C.; Li, J. Numerical Study on Heat Transfer Characteristics of Helically Coiled Grooved Elliptical Tube Heat Exchanger. Int. J. Heat Fluid Flow 2024, 110, 109622. [Google Scholar] [CrossRef]
- Versteeg, H.K.; Malalasekera, W. An Introduction to Computational Fluid Dynamics: The Finite Volume Method; Pearson Education: Harlow, UK, 1995. [Google Scholar]
- Petukhov, B.S. Heat Transfer and Friction in Turbulent Pipe Flow with Variable Physical Properties. In Advances in Heat Transfer; Elsevier: Amsterdam, The Netherlands, 1970; Volume 6, pp. 503–564. [Google Scholar] [CrossRef]
- Eiamsa-Ard, S.; Thianpong, C.; Eiamsa-Ard, P. Turbulent Heat Transfer Enhancement by Counter/Co-Swirling Flow in a Tube Fitted with Twin Twisted Tapes. Exp. Therm. Fluid Sci. 2010, 34, 53–62. [Google Scholar] [CrossRef]
- Saha, G.; Paul, M.C. Numerical Analysis of the Heat Transfer Behaviour of Water Based Al2O3 and TiO2 Nanofluids in a Circular Pipe under the Turbulent Flow Condition. Int. Commun. Heat Mass Transf. 2014, 56, 96–108. [Google Scholar] [CrossRef]
- Saha, G.; Paul, M.C. Investigation of the Characteristics of Nanofluids Flow and Heat Transfer in a Pipe Using a Single Phase Model. Int. Commun. Heat Mass Transf. 2018, 93, 48–59. [Google Scholar] [CrossRef]
- Bejan, A. Entropy Generation Minimization: The Method of Thermodynamic Optimization of Finite-Size Systems and Finite-Time Processes; CRC Press: Boca Raton, FL, USA, 2013. [Google Scholar]
- Ibrahim, D.; Rosen, M.A. Exergy: Energy, Environment and Sustainable Development, 2nd ed.; Elsevier: Oxford, UK, 2012. [Google Scholar]
- Kotas, T.J. The Exergy Method of Thermal Plant Analysis; Paragon Publishing: London, UK, 2012. [Google Scholar]


Disclaimer/Publisher’s Note: The statements, opinions and data contained in all publications are solely those of the individual author(s) and contributor(s) and not of MDPI and/or the editor(s). MDPI and/or the editor(s) disclaim responsibility for any injury to people or property resulting from any ideas, methods, instructions or products referred to in the content. |
© 2025 by the authors. Licensee MDPI, Basel, Switzerland. This article is an open access article distributed under the terms and conditions of the Creative Commons Attribution (CC BY) license (https://creativecommons.org/licenses/by/4.0/).