Article

Power Quality Disturbance Classification Strategy Based on Fast S-Transform and an Improved CNN-LSTM Hybrid Model

1
China Southern Power Grid Electric Power Research Institute, Guangzhou 510000, China
2
Huizhou Power Supply Bureau of Guangdong Power Grid, Huizhou 516000, China
3
College of Electrical Engineering and New Energy, China Three Gorges University, Yichang 443002, China
*
Author to whom correspondence should be addressed.
Processes 2025, 13(3), 743; https://doi.org/10.3390/pr13030743
Submission received: 13 January 2025 / Revised: 9 February 2025 / Accepted: 13 February 2025 / Published: 4 March 2025
(This article belongs to the Section Energy Systems)

Abstract

:
With the increasing complexity of power systems and the widespread application of power electronic equipment, power quality issues have become increasingly prominent, among which power quality disturbances are one of the key factors affecting the stable operation of power systems and the normal functioning of electrical equipment. Current research methods are still limited by feature extraction, insufficient model generalization ability, and strong data dependence. This paper proposes a power quality disturbance classification strategy based on the fast S-transform (FST) and an improved convolutional neural network–long short-term memory (CNN-LSTM) model to achieve accurate classification and identification of various power quality disturbances. Firstly, the FST is employed to process the power quality disturbance signals, enabling efficient analysis and feature extraction while effectively preserving the time–frequency characteristics of the signals and significantly reducing the computational burden. Secondly, to address the limitations of traditional CNN models in power quality disturbance classification, this paper introduces an improved CNN-LSTM hybrid classification model that integrates mechanism fusion. This model improves the classification performance and generalization ability for power quality disturbances by incorporating an enhanced sparrow search algorithm and learning mechanisms. Finally, the proposed strategy is experimentally validated using a large dataset of power quality disturbances. After analysis and comparison, the method proposed in this paper maintains an identification accuracy of over 97% even in strong noise environments when subjected to a single type of disturbance. Under complex conditions involving mixed disturbances of multiple types, the identification accuracy remains above 95%. Compared to existing methods, the proposed method achieves an improvement in identification accuracy by up to 3.2%. Additionally, its identification accuracy in scenarios with small data samples is significantly better than that of traditional methods, such as single CNN models and LSTM models. The experimental results demonstrate that the proposed strategy can accurately classify and identify various power quality disturbances, outperforming traditional methods in terms of classification accuracy and robustness.

1. Introduction

The main form of renewable energy integration into the power grid is distributed power generation, which boasts compact power supply facilities, convenient replacement, and environmentally friendly power supply technology. However, due to its inherent imbalance, randomness, and intermittency, the integration of renewable energy into the distribution network leads to uncertainty in the output of grid-connected power sources, thereby triggering a series of power quality issues [1]. With the continuous growth of electricity demand in modern society and the widespread popularization of power equipment, power quality issues in power grid systems have gradually become the focus of attention in academia and industry [2]. Power quality disturbances, such as voltage sags, swells, harmonics, and transient oscillations, not only affect the stable operation of power systems but also may damage sensitive equipment, further leading to losses to the national economy. Therefore, the development of efficient and accurate power quality disturbance detection and classification strategies is crucial for ensuring the safe and reliable operation of power systems [3]. By accurately identifying the types of disturbances, timely measures can be taken to prevent accidents from escalating. Through disturbance identification, early warnings can be issued and protective measures taken to prevent equipment damage or data loss. Disturbance identification technology can provide data support for smart grids, contributing to their efficient and reliable operation. Automated disturbance identification and classification can reduce the workload of manual inspections and diagnoses, lowering operation and maintenance costs and improving efficiency.
In the in-depth analysis of power quality disturbance signals, two key steps are the precise extraction of features and efficient classification. Feature extraction, as the primary step in the analysis, employs various methods, including short-time Fourier transform (STFT), wavelet transform (WT), Hilbert–Huang Transform (HHT), and S-transform. However, each method has its inherent limitations. For example, STFT has a relatively simple time–frequency resolution, which may lead to insufficiently precise feature extraction in specific scenarios [4]. WT faces difficulties in selecting the mother function, and its analysis process is susceptible to noise interference [5]. While HHT has unique advantages, it is often plagued by endpoint effects and mode mixing issues during signal processing [6]. Regarding S-transform, it can provide abundant time–frequency information, but its computation process is relatively time-consuming and consumes significant storage space, which is particularly disadvantageous in real-time monitoring applications [7]. Literature [8] explores the application of two-dimensional wavelet discrete transform in signal compression and reconstruction, proposing a novel method. This method utilizes adaptive frequency bitmap technology in the low-frequency part of the signal to optimize data compression while adopting an adaptive energy threshold strategy in the high-frequency part to ensure the retention of important information. Experimental results show that this algorithm significantly outperforms traditional one-dimensional wavelet transform in terms of the compression ratio and signal recovery degree, bringing a breakthrough in the field of signal compression. Literature [9] introduces second-generation wavelet transform into the field of power quality data compression, which not only significantly reduces data processing time compared to methods using Fourier transform alone but also achieves phased improvement in the compression ratio, representing a qualitative leap in the efficiency of power quality data processing. Literature [10] further refines the data encoding algorithm, adopting different encoding strategies for the low-frequency and high-frequency parts of the signal. The low-frequency part achieves more efficient data compression through differential encoding technology, while the high-frequency part utilizes support vector regression algorithms to ensure minimal error in signal reconstruction. This refined encoding scheme provides new ideas for power quality data compression. Currently, research on power quality data compression has formed a relatively mature research system, with most of its cores based on different signal decomposition methods. However, the data acquisition end still follows the Nyquist sampling theorem, resulting in a large amount of data collection and extended processing time, thereby increasing the cost of storage and transmission. This issue is further emphasized in the discussions of literature [11,12]. In recent years, with the advancement of the national “dual carbon” strategy, the proportion of new energy power generation has continued to rise, urbanization construction and commercial and residential electricity demand have grown continuously, and a large number of emerging power loads have been connected to the distribution network, making the connection and operation of the distribution network increasingly complex. This trend has led to exponential growth in power quality data. Traditional data processing methods based on the Nyquist sampling theorem have been unable to meet the demand for efficient analysis of power quality disturbances. Therefore, future research needs to focus more on how to achieve efficient compression and rapid processing of power quality data while ensuring data accuracy. To overcome these limitations, literature [13] proposes an innovative method, namely the fast S-transform (FST) algorithm. Compared with traditional S-transform, the FST algorithm significantly reduces time complexity, thus achieving faster computation speed. This improvement makes FST more widely and efficiently applicable in the analysis of power quality disturbance signals, providing powerful technical support for real-time monitoring and rapid response.
In recent years, with the rapid growth of data volume, deep neural networks have demonstrated significant advantages in the field of feature extraction and classification recognition, especially in dealing with complex signals. These methods provide novel solutions for effectively extracting modal features from vast amounts of data and accurately classifying and identifying potential disturbance signals. Specifically, in the literature [14], researchers successfully achieved automatic extraction of signal features by applying stacked sparse autoencoders, and then combined with a Softmax classifier, achieved precise classification of power quality disturbances. In the literature [15], researchers employed a long short-term memory network (LSTM), which excels in capturing long-term dependencies in sequential data, for the detection and classification of power quality disturbance signals. The literature [16] proposed an innovative method that introduced a lateral input fusion structure based on traditional convolutional neural networks. Through this structure, the network can more effectively fuse features from different levels, thus improving the accuracy of power quality disturbance classification. Additionally, researchers in [17] proposed an optimized fully convolutional neural network–long short-term memory network (FCN-LSTM) model. This model utilizes FCN and LSTM in parallel to process spatial and temporal features of the data, respectively, achieving comprehensive feature fusion for power quality disturbance signals. Although the aforementioned methods are trained based on convolutional neural networks to automatically acquire features from sample sets and extract signal features under noisy backgrounds, they do not employ specific strategies for handling noise or redundant information [18,19]. This approach has somewhat impacted the accuracy of disturbance classification and identification, and future research can further explore how to more effectively handle these interfering factors to improve classification and recognition performance. Reference [20] presents a method for identifying complex power quality disturbances based on rotating vectors and fuzzy transition fields. This method extracts disturbance features through rotating vectors and combines fuzzy transition fields for classification, effectively handling various complex disturbance scenarios. However, its computational complexity is relatively high, particularly when processing large-scale data, which may limit real-time performance. Additionally, the parameter settings of the fuzzy transition fields significantly impact the results, and the lack of an adaptive adjustment mechanism may lead to performance fluctuations in practical applications. Reference [21] proposes a deep fractional multi-dimensional spectral convolutional neural network fusion approach for identifying complex power quality disturbances. This method combines fractional spectral analysis and deep learning techniques to capture multi-dimensional features of disturbance signals. Reference [22] introduces a novel decomposition and detection framework for complex power quality disturbances. This framework decomposes disturbance signals into multiple subcomponents using signal decomposition techniques and combines detection algorithms to achieve high-precision identification. However, the decomposition process is sensitive to noise, which may result in false detections or missed detections. Furthermore, the complexity of the detection algorithms in the framework affects its real-time performance.

2. Feature Extraction of Power Quality Disturbance Signals

2.1. Principle of the Traditional S-Transform

Accurate disturbance detection technology is the foundation for ensuring the precision of disturbance feature extraction and high disturbance classification accuracy. Firstly, the presence of noise and weak disturbances can significantly degrade the performance of disturbance detection techniques. Secondly, excessive computational complexity can lead to reduced detection speed, which is unfavorable for practical applications in disturbance detection. Therefore, this section proposes a disturbance detection method based on an improved fast S-transform. The traditional S-transform (ST) is a typical time–frequency analysis method. For ease of understanding, the Fourier transform (FT) of a one-dimensional continuous signal (t) is defined as
X ( f ) = + x ( t ) e i 2 π f t d t
In the equation, f represents frequency, and t represents time.
The definition of the short-time Fourier transform (STFT) for a one-dimensional continuous signal (t) is
X ( τ , f ) = + x ( t ) g ( τ t ) e i 2 π f t d t
In the equation, (τt) is the window function of the STFT; τ represents the time shift factor.
According to the convolution theorem of the FT, the ST can be expressed in another form, specifically as shown in Equations (3)–(5).
S ( τ , f ) = + y ( t , f ) g ( τ t , f ) d t = x ( τ , f ) g ( τ , f )
y ( τ , f ) = x ( τ ) e i 2 π f t
g ( τ , f ) = |   f   | 2 π e τ 2 f 2 2
Assuming that (α, f) is the Fourier transform of S(τ, f) (from τ to α), we can obtain (6) from the convolution theorem:
L ( a , f ) = Y ( a , f ) G ( a , f )
In the equation, (α, f) and G(α, f) are respectively the Fourier transforms of y(τ, f) and g(τ, f).
Y ( a , f ) = + y ( τ , f ) e i 2 π a t d t = + x ( τ ) e i 2 π f t e i 2 π σ t d τ = X ( a + f )
G ( a , f ) = + g ( τ , f ) e i 2 π a t d τ = e 2 π 2 a 2 f 2
By combining Equations (6)–(8), Equation (9) can be obtained:
L ( a , f ) = X ( a + f ) e 2 π 2 a 2 f 2
Applying the inverse Fourier transform to both sides of Equation (9), Equation (10) can be obtained:
S ( τ , f ) = + X ( a + f ) e 2 π 2 a 2 f 2 e i 2 π a τ d a
As can be seen from the above analysis, the S-transform has two expression forms. Equation (3) represents its time-domain expression, while Equation (10) represents its frequency-domain expression.

2.2. Introduction to the Modified Fast S-Transform

Based on the above analysis, the implementation of the S-transform requires both FFT and inverse discrete Fourier transform calculations, and the number of complex multiplication and addition operations for each frequency point is the same as the FFT computation complexity. Performing the S-transform on an N-point discrete signal will yield N^2 S-transform values. The computational complexity of FFT for an N-point signal is O(N log2 N); therefore, the computational complexity of the S-transform for an N-point signal is O(N^2 log2 N). It can be seen that when N is too large, the computational complexity of the S-transform will be significant, affecting the detection rate. Due to the conjugate symmetry of FFT, the FFT spectrum of an N-point signal is symmetric about N/2. Therefore, after the FFT transformation, only the first half of the frequencies can be used for S-transform analysis, i.e., the range of n is [0, N/2]. In this case, the computational complexity of the S-transform for an N-point discrete signal is O((N/2 + 1)N log2 N). However, the detection speed of the S-transform is still limited by N, requiring further simplification. Additionally, due to the influence of frequency, the time resolution and frequency resolution of the S-transform cannot be improved simultaneously, which is unfavorable for disturbance detection. For amplitude disturbances, a higher time resolution is needed to detect the fundamental frequency amplitude; while for harmonics and other multi-frequency steady-state disturbances, a higher frequency resolution is required to extract the frequencies. Therefore, this paper introduces an improved fast S-transform (IFST) method. Compared with the traditional S-transform, this method involves fewer parameters and is easier to control. At the same time, the computational complexity is greatly reduced, and the detection speed is significantly improved. Observing Equation (2), it can be found that the resolution of the Gaussian window is higher than that of the general exponential window, making the Gaussian window function play an important role in the S-transform. The height and width of the Gaussian window in the S-transform depend on the frequency. At low frequencies, the frequency resolution is high, and the Gaussian window is wider; while at high frequencies, the time resolution is high, and the Gaussian window is narrower. In the field of power harmonic metering, to extract the characteristic information of harmonics, it is necessary to obtain the components, amplitudes, and the start and end times of transient occurrences of the harmonics. To acquire the time-domain and frequency-domain information of different harmonics, it is necessary to adjust the shape of the Gaussian window in the S-transform according to the actual measurement conditions, enabling it to have high time resolution in the low-frequency range for extracting the start and end times of transients and high-frequency resolution in the high-frequency range for extracting harmonic amplitudes. Therefore, the most direct and effective way to optimize the S-transform is to improve the Gaussian window in the S-transform, making its window function shape adjustable adaptively according to different harmonic signals.
First, to achieve adjustable time–frequency resolution for ST, a controllable parameter c is introduced to modify Equation (5), resulting in a new scale factor as shown in Equation (11):
σ ( f ) = 1 c   |   f   |
By substituting Equation (11) into Equations (3) and (4), we obtain the improved S-transform (IST):
I S T ( τ , f ) = + x ( t ) c   |   f   | 2 π e ( τ t ) 2 2 σ 2 e i 2 π f t d t
As can be seen from Equation (12), when c > 1, IST has higher time resolution compared to ST; when 0 < c < 1, IST has higher frequency resolution compared to ST; and when c = 1, IST degenerates to ST. Based on the implementation principle of the discrete form of ST, the discretized form of IST is shown in Equation (13):
I S T [ j T S , n N T s ] = m = 0 N 1 X [ m + n N T s ] e 2 π 2 m 2 c 2 n 2 e i 2 π m j N , n 0 I S T [ j T S , 0 ] = m = 0 N 1 X [ m N T s ] , n = 0
In the equation, n = 0, 1, 2, …, N/2; m = 0, 1, 2, …, N − 1; j = 0, 1, 2, …, N − 1. After decomposition, power quality signals may contain irrelevant or redundant features. These irrelevant feature vectors can increase model complexity, degrade classification performance, and even lead to overfitting. Therefore, effectively pruning the generated equations to eliminate irrelevant feature vectors is a crucial step. The variance threshold method can be employed to remove features with lower variance, as these features contribute less to the classification task and are suitable for initial screening. Additionally, the correlation coefficient method can be used to calculate the correlation coefficients between features and the target variable, retaining features with higher correlations. The FST method, which is mathematically based, is chosen to process power quality disturbance signals because it can efficiently perform signal analysis and feature extraction while effectively preserving the time–frequency characteristics of the signal and significantly reducing the computational burden. This mathematical method exhibits stability and reliability when processing complex signals, providing high-quality input features for subsequent AI models.

3. Hybrid Identification Model Based on Improved LSTM-CNN

3.1. Introduction of CNN Model

CNN is a type of feedforward neural network that incorporates convolutional computation and has a deep structure. In recent years, CNN has demonstrated excellent feature extraction capabilities, leading to its widespread application in areas such as image recognition and natural language processing [23]. For power quality feature signals that have undergone the fast S-transform, CNN can effectively reduce the complexity of extraction by utilizing local perception to merge extracted local power quality disturbance information into global power quality disturbance representation features. This avoids the need to perceive every single pixel point, thus reducing the complexity of feature extraction. The parameter sharing based on the same kernel further reduces the scale of CNN parameters and enhances the generalization performance of the model, enabling it to have good recognition results even for signals that have undergone transformations such as scaling, skewing, and translation. CNN primarily consists of convolutional layers, pooling layers, fully connected layers, and classification layers, and its overall mathematical model can be expressed as (14):
x o u t p u t = f s o f t max { f f c [ f p o o l i n g ( f c o n v ( x i n p u t ) ) ] }
In the equation, x i n p u t represents the transformed input feature data of power quality disturbances; x o u t p u t represents the output classification result of power quality disturbances; f c o n v represents the computation of the convolutional layer, specifically including convolutional operations and nonlinear activation; f p o o l i n g represents the pooling layer computation using a downsampling function; f f c represents the computation of the fully connected layer; f s o f t max represents the classification result output after computation by the Softmax function.

3.2. The Establishment of an LSTM-CNN Hybrid Model

Many events in daily life are related to sequences. In natural language processing and text processing, both the production of text and its content are arranged in a logical sequence; in time-series data, such as weather forecasts on mobile phones, the weather forecast for the next few days is predicted based on past weather through certain means; in speech recognition and machine translation, the order of spoken words and the order of input text are both necessary for the next step. When considering these sequence-related events, traditional neural networks cannot understand the relationship between data information and time, thus resulting in low accuracy in capturing temporal features. To address this, researchers developed recurrent neural networks (RNNs), whose specific structure is shown in the Figure 1.
Although the RNN in the diagram uses the same backpropagation algorithm as traditional neural networks for training, there are some changes from the traditional approach. Traditional neural network training only depends on the initial input values and is not related to the values calculated during the process. However, RNN training employs weight sharing, which means that it is not only related to the initial input values but also to the calculated values at each iteration. In traditional neural networks, there are no shared parameters between layers, so addition is not necessary. However, RNNs require the addition of gradients at each step.
Due to RNN’s short-term memory for information storage, the long short-term memory (LSTM) neural network was proposed. LSTM not only can store data information for a longer time and solve the issues of gradient disappearance and gradient explosion in RNNs, but it can also have a long-lasting impact on the cell state, effectively preserving information features. Figure 2 illustrates the specific structural principle.
As can be seen from Figure 2, the implementation of LSTM mainly relies on weighted calculations using formulas between various data points to complete the recognition of the LSTM network. The main formulas are shown from (15) to (19).
f t = σ   ( W f [ h t 1 , a t ] + b f )
i t = σ   ( W i [ h t 1 , a t ] + b i )
C t = tanh ( W c [ h t 1 , a t ] + b c )
O t = σ ( W o [ h t 1 , a t ] + b o )
h t = O t tanh ( C t )
In the equation: W represents the weight matrix. In the LSTM neural network model, each gate shares weights, and different gates correspond to different numerical values of the weight matrix. Specifically, Wf is the weight matrix of the forget gate, Wi is the weight matrix of the input gate, Wc is the weight matrix of the cell state, and Wo is the weight matrix of the output gate. tanh is the activation function. Both h and c are input data. ft is the forget gate’s proportional coefficient that controls the amount of information to forget, it is the proportional coefficient of the input gate that controls the amount of input information, ct is the updated state information of the cell state, and Ot is the proportional coefficient of the output gate that controls the amount of output information. σ represents the Sigmoid function.
Power quality disturbance signals are essentially a set of one-dimensional time-series signals. When using a CNN alone to process power quality disturbance signals, it can indeed extract corresponding feature signals, but it lacks consideration of the relationship between the disturbance signals and time. Therefore, based on the CNN, an LSTM neural network, which specializes in handling time-series problems, is added. The combination of the two networks improves the processing efficiency for disturbance signals. Additionally, the introduction of an attention mechanism into the combined network model allows for better extraction of key features and an increase in similarity to target information. However, when it comes to identifying and classifying the disturbances, the single-class and multi-label classification methods only output the detected disturbance types without considering the correlation between individual and combined disturbances. This increases the computational complexity and runtime of the system. Therefore, the article ultimately adopts a power quality disturbance identification model that integrates a CNN, LSTM, and an attention mechanism. The structure of the network model is shown in Figure 3.
To better understand, the output of the hidden layers may contain high-level features or patterns extracted from the input data (such as feature vectors of power quality indicators). These high-level features or patterns are crucial for distinguishing between different types of power quality disturbances. The attention weights represent the model’s focus on different parts of the input power quality data (such as voltage and current data from different time periods) when identifying different disturbance types. A higher attention weight indicates that the model relies more on that particular part of the information when making classification decisions. Weighted output involves assigning different weights to different elements of the power quality feature vector (i.e., different power quality indicators) and calculating a combined score or classification result based on these weights. These weights reflect the importance or contribution of different features in the classification task. The attention layer can help the model focus on the power quality features that have the greatest impact on classification decisions. After the convolutional operations, activation functions are applied to introduce nonlinearity. Following the convolutional layers, max pooling or average pooling is typically used to reduce the dimensionality of the feature maps, decrease computational load, and extract main features. The features extracted by the convolutional and pooling layers are flattened into one-dimensional vectors and further integrated through fully connected layers. For example, when processing sequential data with multiple time steps, the attention layer can assign different weights to each time step, emphasizing those that contain crucial information. Power quality detection typically focuses on time-series signals rather than image or spatial distribution data; hence, there is no need for spatial feature extraction. The FST is a time–frequency analysis method capable of extracting time–frequency features from signals, thereby effectively preserving the time–frequency characteristics of the signals. This implies that the method does include temporal feature extraction, as the FST is used to extract time-related features from power quality disturbance signals. Although the CNN-LSTM model is commonly used to process spatial and temporal features in image data, in this method, it primarily deals with one-dimensional time-series signals, thus mainly focusing on temporal features rather than spatial features.

3.3. Optimization of CNN Model Hyperparameters Through SSA

In the field of deep learning, CNNs are an extremely important and widely used model structure. When constructing and optimizing such networks, the selection of hyperparameters plays a crucial role. These hyperparameters include but are not limited to the learning rate, the number of iterations, the batch size, the specific size and number of convolution kernels in the two key convolutional layers, and the number of neurons in the subsequent two fully connected layers. The choice of these parameters has a direct impact on the training efficiency and final performance of the model. However, the process of manually selecting and adjusting these hyperparameters is often complex and full of uncertainty, as different combinations of parameters can lead to drastically different training results.
To overcome this uncertainty and find the optimal combination of hyperparameters, researchers have begun to explore automated and intelligent methods. Among them, swarm intelligence optimization algorithms have attracted significant attention due to their powerful search and optimization capabilities. The sparrow search algorithm (SSA) is inspired by sparrows’ foraging and anti-predator behavior. In the algorithm, the search population is divided into explorers, followers, and scouts. Explorers are responsible for discovering new food sources, followers follow the explorers to forage, and scouts monitor the environment and issue warnings when danger is detected. This division of labor enables the SSA to maintain search diversity while achieving high convergence speed and accuracy. Furthermore, the algorithm can effectively avoid falling into local optima, thereby finding the globally optimal combination of hyperparameters.
In this paper, we employ the sparrow search algorithm to optimize multiple hyperparameters in CNN networks. To further enhance the performance of the algorithm, the initial population’s positions are initialized using chaos theory. Traditional SSA typically initializes the population randomly, which, while simple, can lead to uneven population distribution, affecting the algorithm’s convergence speed and accuracy. To address this issue, we introduce the Logistic map, a typical chaotic mapping method. The Logistic map possesses high ergodicity, complexity, and unpredictability, enabling it to generate a uniformly distributed initial population, significantly improving the algorithm’s global search capability. In our experiments, we set the sparrow population size to 15, with 25% of the population serving as explorers. Through multiple iterations and optimizations, we ultimately identified an optimal combination of hyperparameters, as shown in Table 1. These parameters enable the CNN network to demonstrate higher efficiency and better performance during the training process.

4. Case Study

4.1. Effectiveness Verification of Single-Type Disturbance Identification

To demonstrate the effectiveness and feasibility of the proposed method in this paper, simulations were performed using MATLAB software. Five types of power quality disturbances were considered, namely voltage swells, voltage sags, voltage interruptions, transient impulses, and transient oscillations. The normal voltage waveform is sinusoidal, as shown in Equation (20). The mathematical models of each disturbance are presented in Equations (21)–(25). Using the random data generation functions in MATLAB, a large dataset was constructed. For each operating condition, 1000 data samples were randomly generated, with 600 samples used as the training set and the remaining 400 samples serving as the testing set. For the CNN-LSTM model, due to its complex network structure and numerous parameters, high-performance CPUs or GPUs are usually required to accelerate computations. For real-time or near-real-time applications, servers or embedded systems equipped with high-performance computing devices can be used to ensure low-latency processing. In this paper, the relevant models were implemented using MATLAB R2024B software installed on a desktop computer, with the computational configuration being an Intel(R) Core(TM) i5-9500 CPU @ 3.00 GHz and 8 GB of RAM made in the USA.
normal   voltage   y ( t ) = A sin ( w 0 t + φ )
voltage   swells   f ( t ) = [ 1 + a ( u ( t t 1 ) u ( t t 2 ) ) ] sin ( w 0 t ) 0.1 < a < 0.8 , T ( t 2 t 1 ) 9 T
voltage   sags   f ( t ) = [ 1 a ( u ( t t 1 ) u ( t t 2 ) ) ] sin ( w 0 t ) 0.1 < a < 0.9 , T ( t 2 t 1 ) 9 T
voltage   interruptions   f ( t ) = [ 1 a ( u ( t t 1 ) u ( t t 2 ) ) ] sin ( w 0 t ) 0.9 < a < 1 , T ( t 2 t 1 ) 9 T
transient   impulses   f ( t ) = a 1 sin ( w 0 t ) + a 3 sin ( 3 w 0 t ) + a 5 sin ( 5 w 0 t ) + a 7 sin ( 7 w 0 t ) 0.9 < a 1 , a 3 , a 5 , a 7 < 1 , ( a i ) 2 = 1
transient   oscillations   f ( t ) = sin ( w 0 t ) + a e ( t t 1 ) / τ ( u ( t t 1 ) u ( t t 2 ) ) sin ( w n t ) 0.1 < a < 0.8 , T ( t 2 t 1 ) 3 T , 8   ms τ 40   ms 300   Hz f n 500   Hz , 2 π f n = w n
The following Figure 4 and 
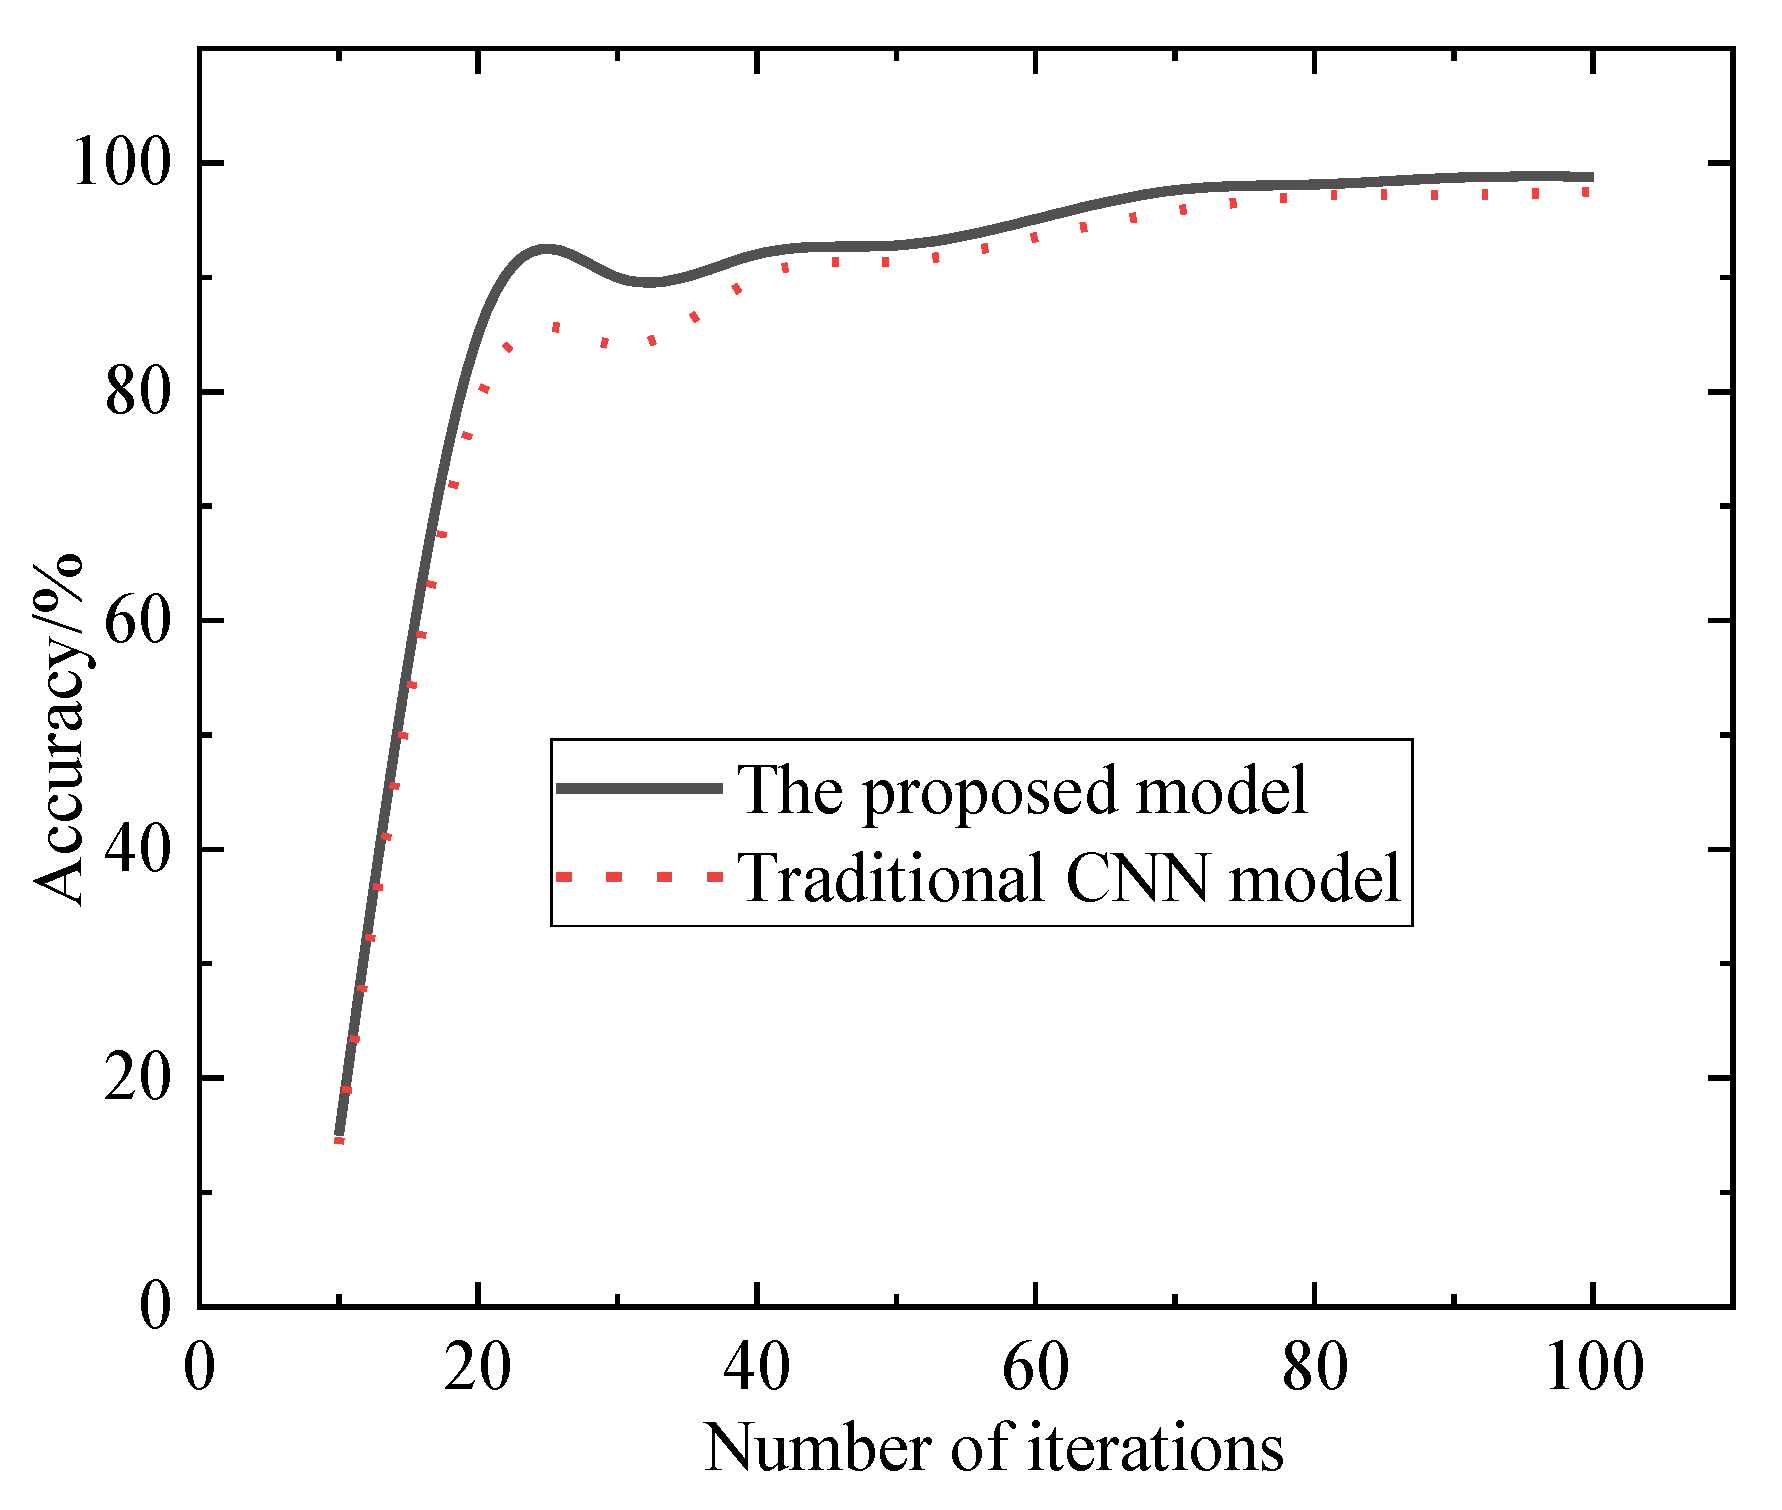
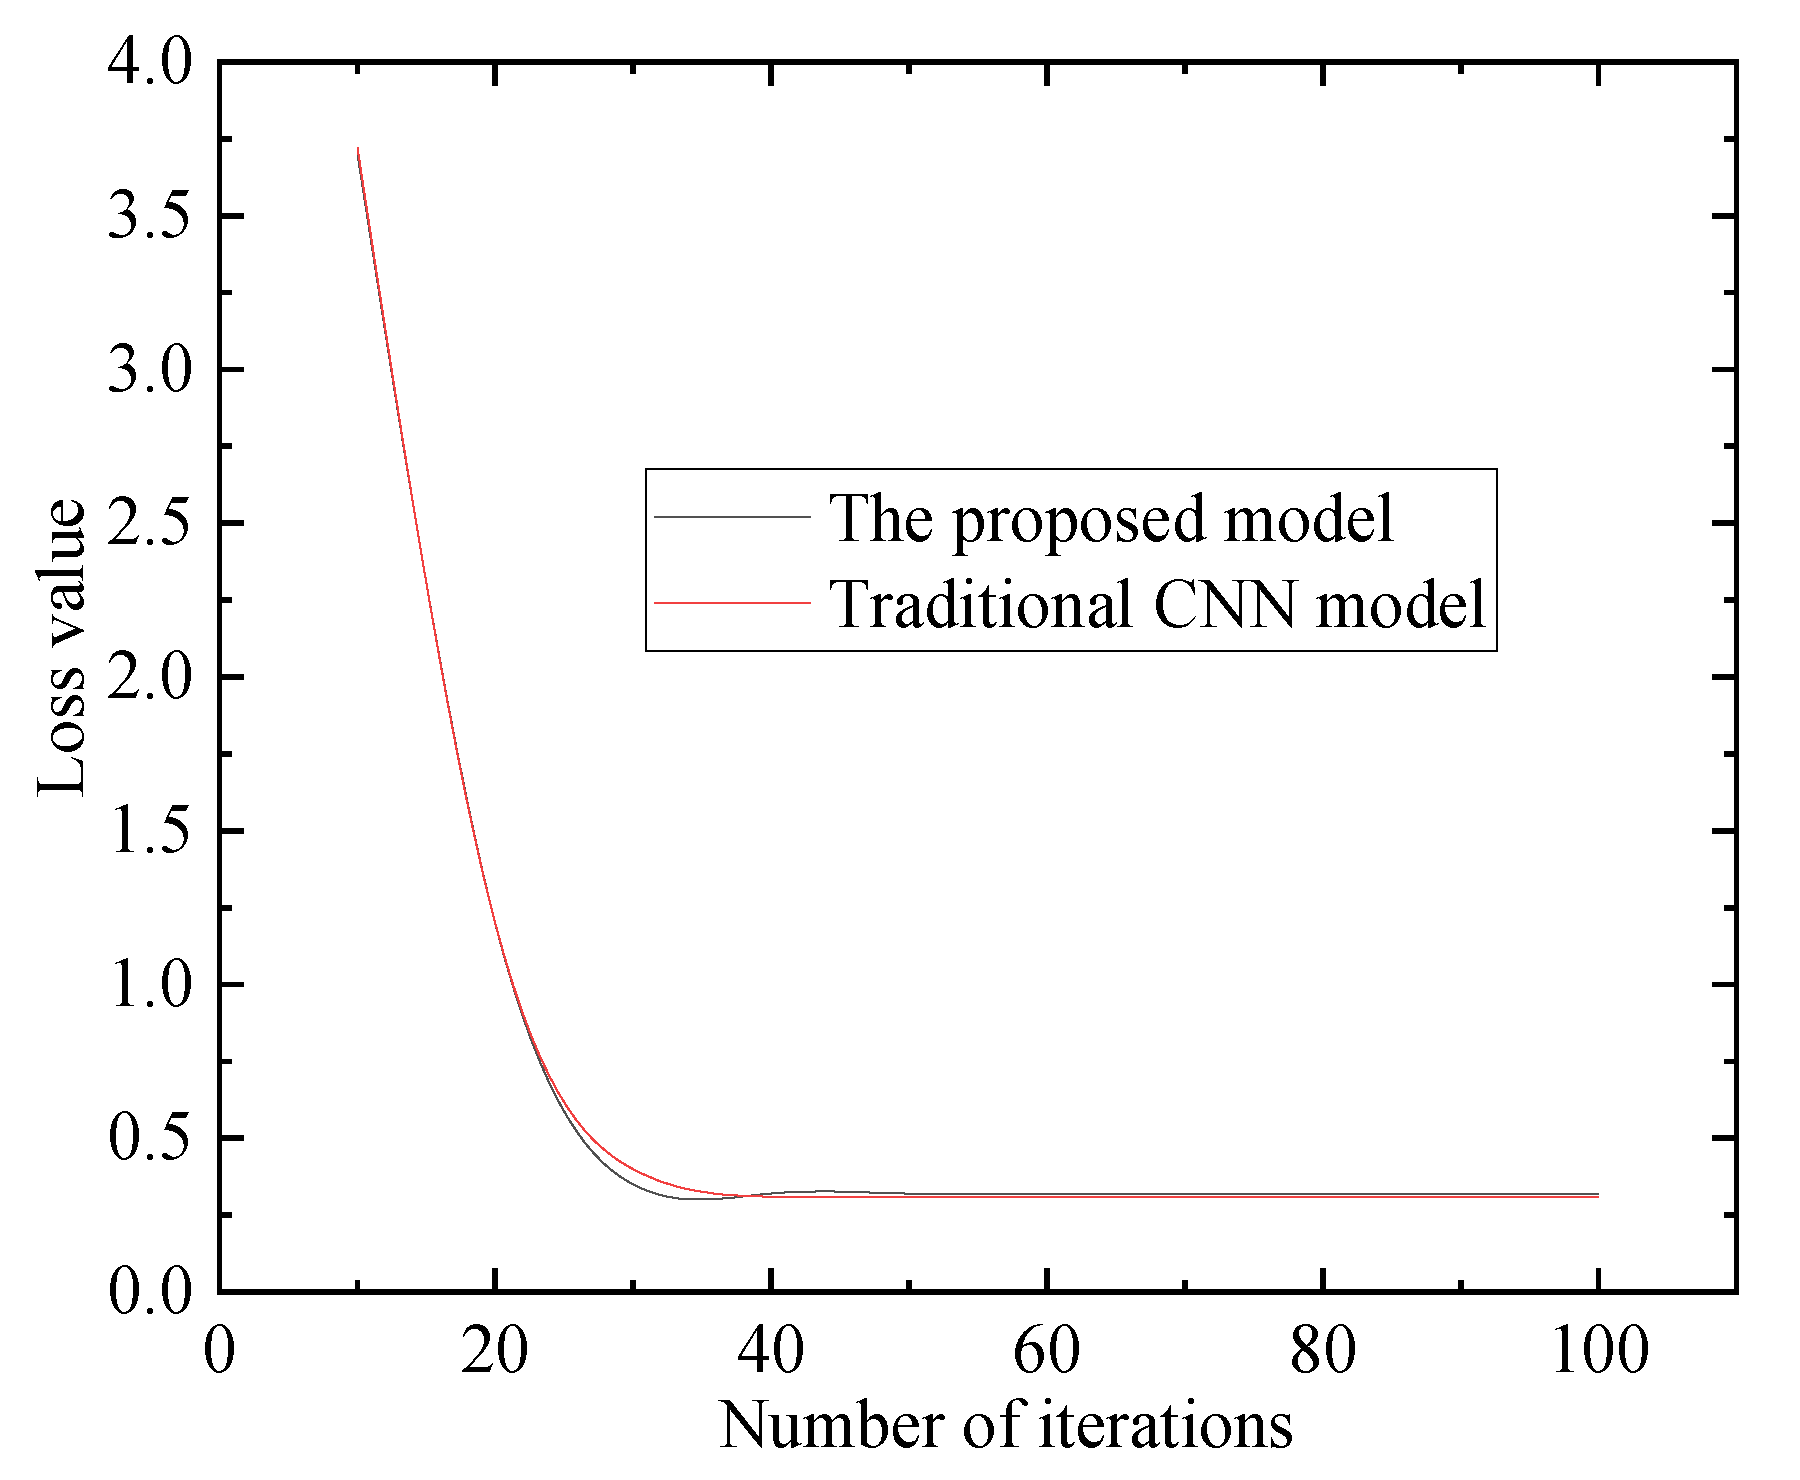
Figure 5 present a comparison of the discrimination accuracy and loss values between the proposed model in this paper and the traditional CNN model.
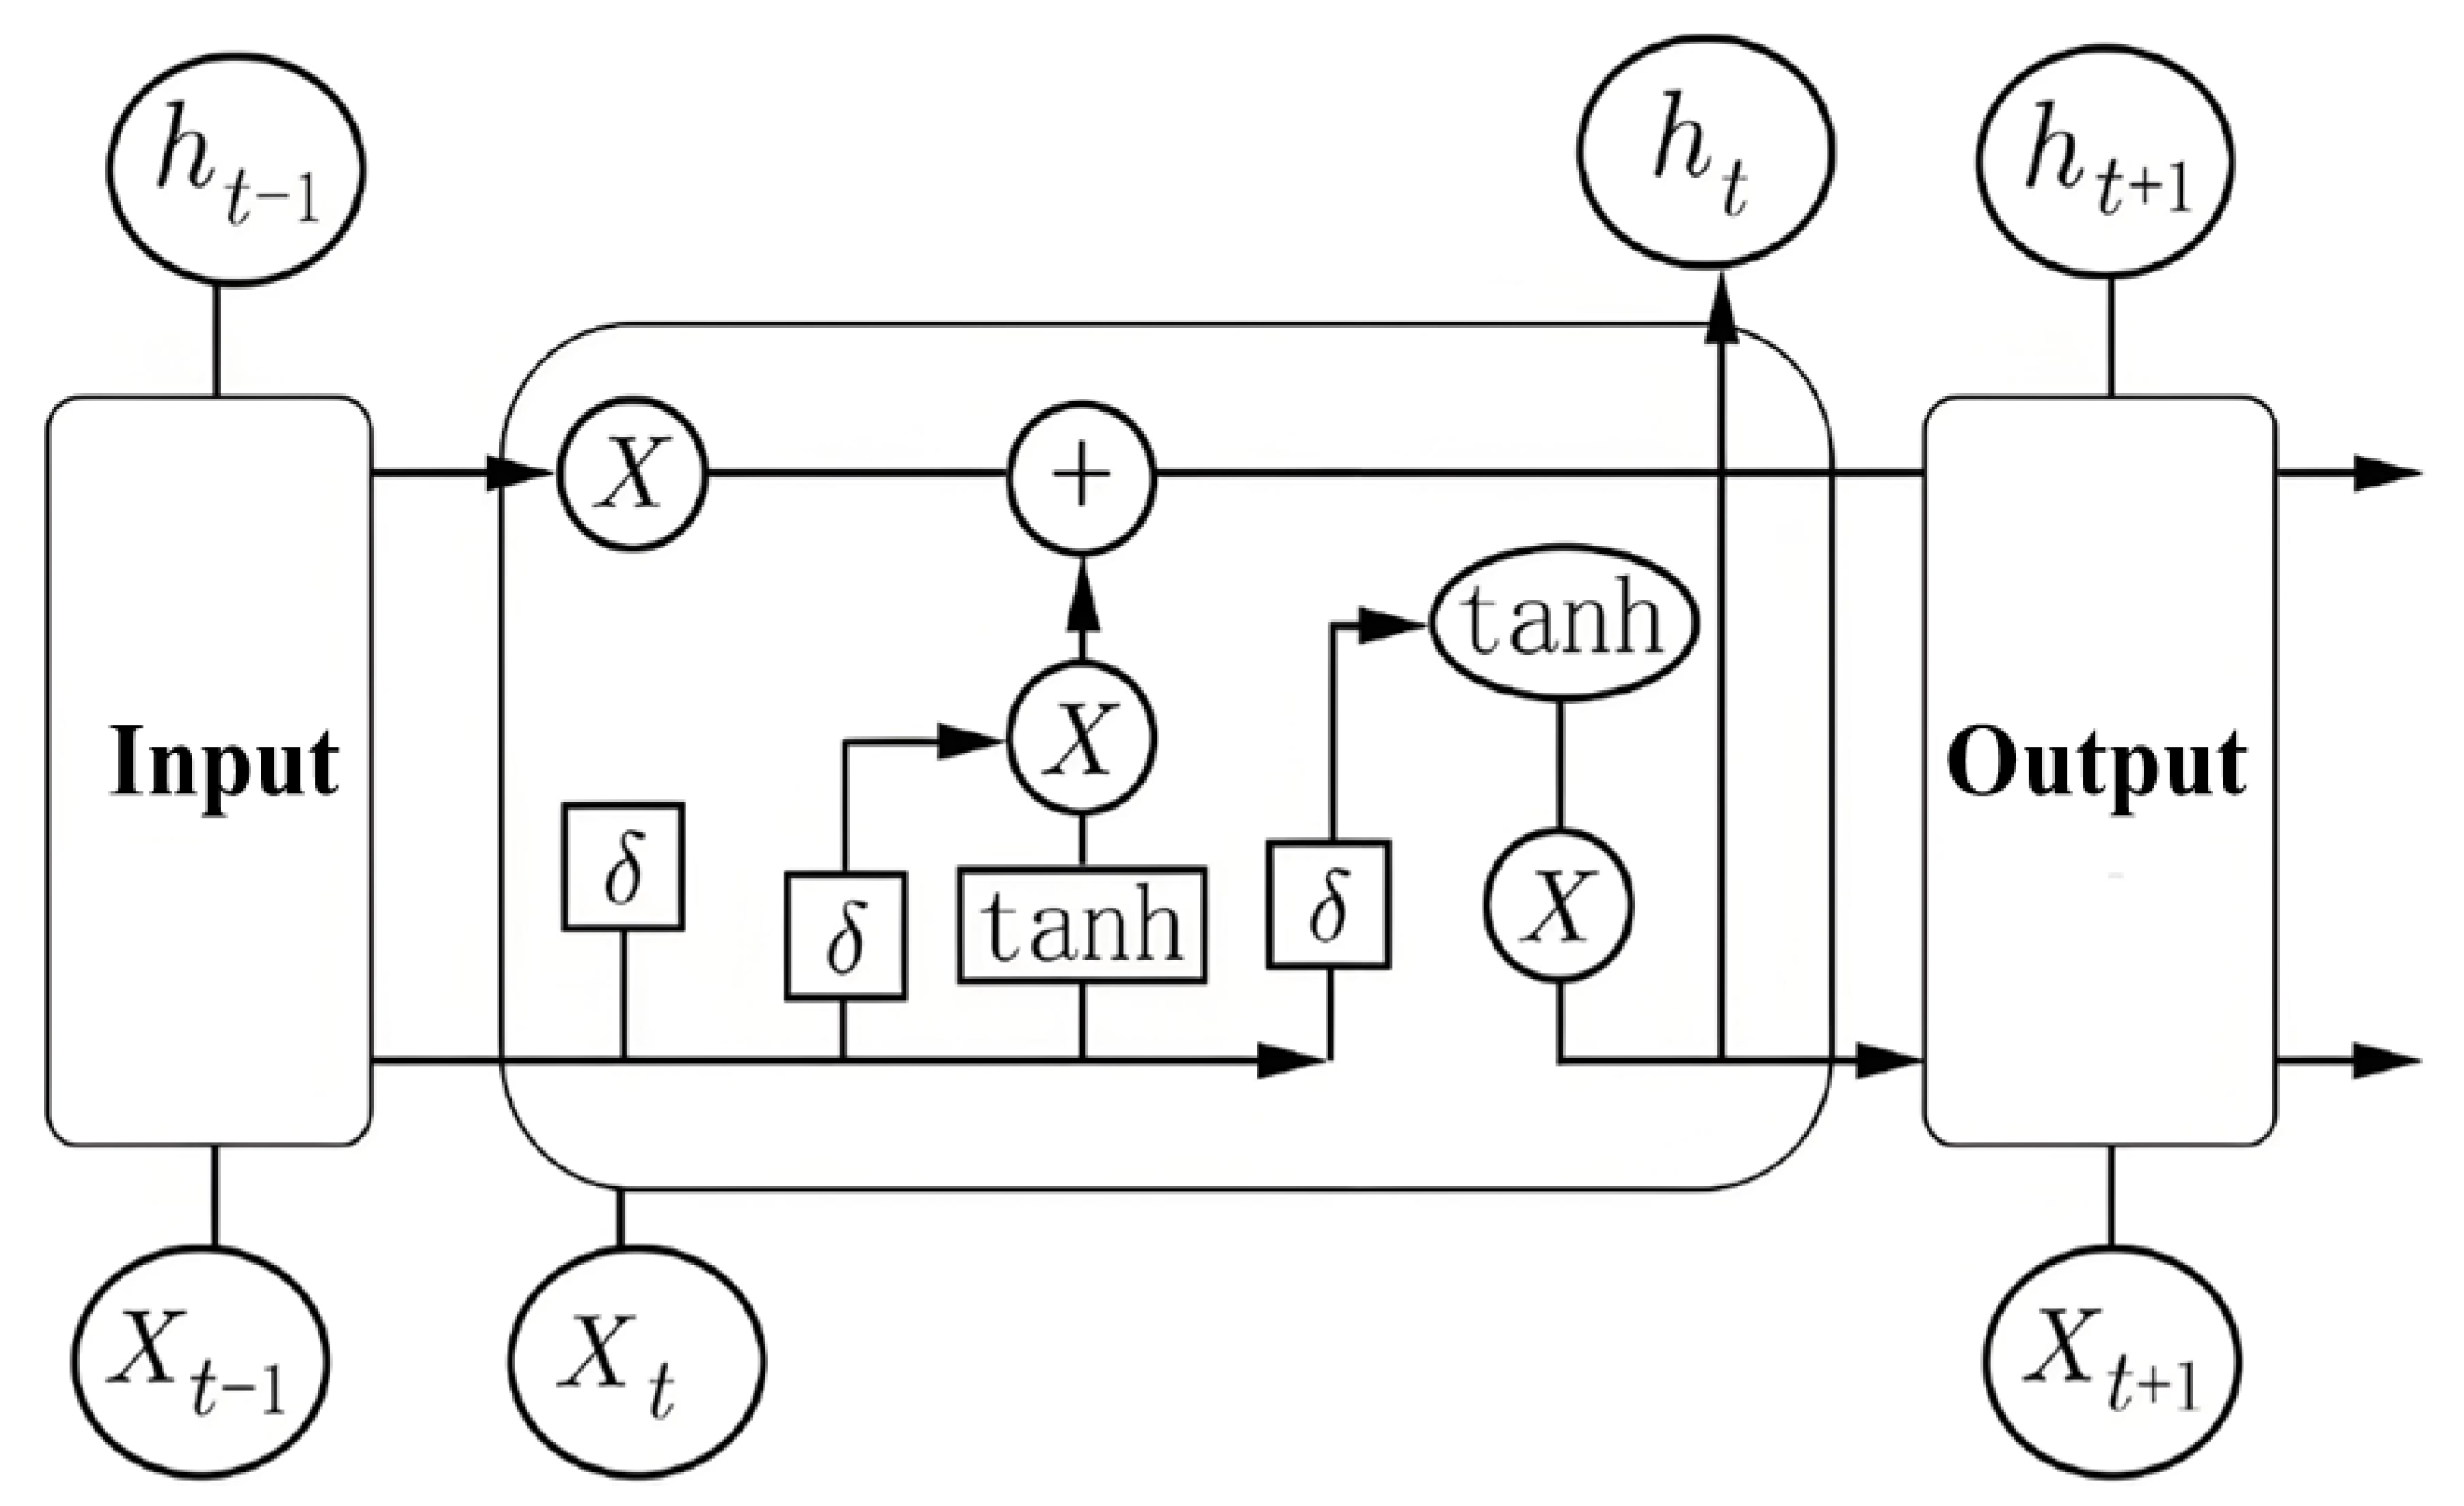
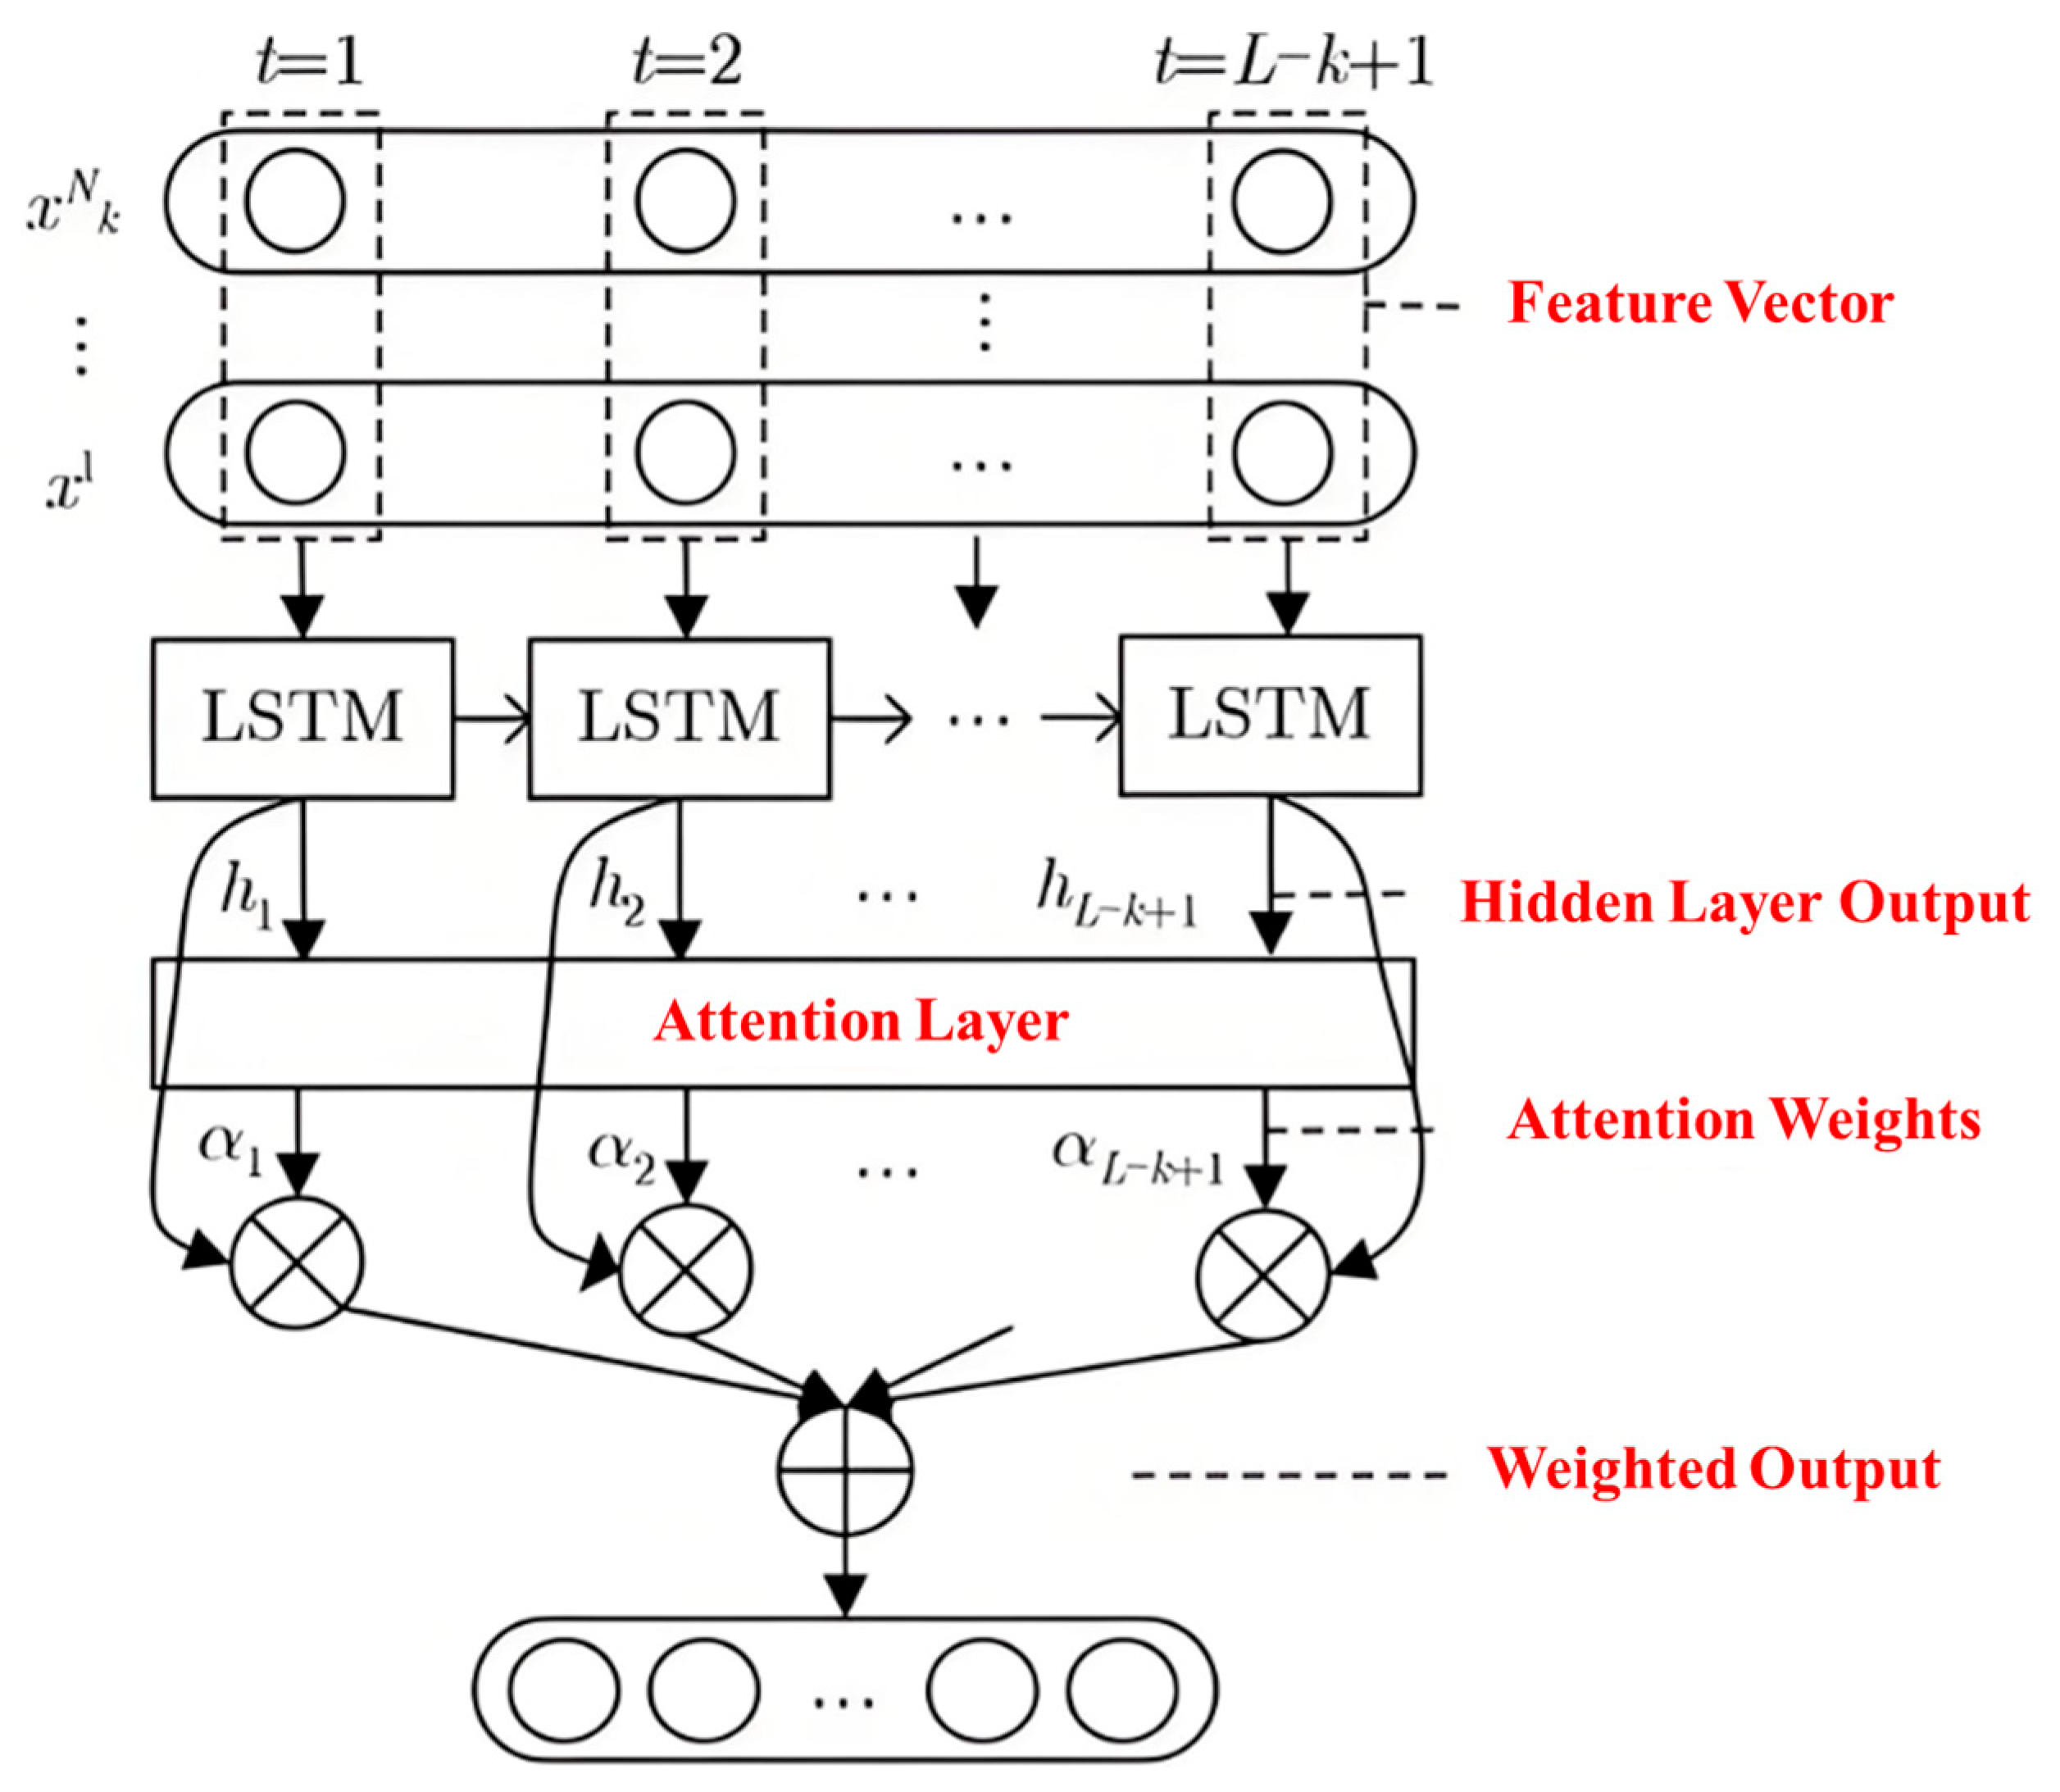
As can be observed from the figures above, the proposed method in this paper outperforms the traditional model in terms of both recognition accuracy and loss values. LSTM is a recurrent neural network model particularly suitable for processing time-series data. With its memory and learning capabilities, LSTM can capture long-term dependencies in data. In the classification of power quality disturbances, power signals often possess the characteristics of time series, and the introduction of LSTM can better handle such temporal data, thereby improving the accuracy of classification. CNN excels at capturing spatial information, i.e., local features of data. The hybrid LSTM-CNN model combines the advantages of LSTM and CNN, capable of capturing both spatial and temporal information of data. This dual-capturing ability enables the model to comprehend the characteristics of power quality disturbance signals more comprehensively, thus improving the classification accuracy.
Meanwhile, the gated mechanism of LSTM can prevent the model from overfitting during the training process, avoiding excessive fitting to the training data and losing the generalization ability for unseen data. The pooling layer of CNN also helps reduce the risk of overfitting. In the hybrid LSTM-CNN model, the combination of these two mechanisms can further enhance the robustness of the model and reduce the occurrence of overfitting. LSTM extracts temporal features from data through its unique memory mechanism, which is crucial for understanding the time-varying characteristics of power quality disturbance signals. By combining these two feature extraction capabilities, the hybrid LSTM-CNN model achieves more comprehensive feature extraction and classification of power quality disturbance signals, thereby improving the classification accuracy.
In summary, the hybrid LSTM-CNN model exhibits significant advantages in the field of power quality disturbance classification and identification, outperforming the traditional CNN model in terms of recognition accuracy and loss values. This is mainly attributed to LSTM’s ability to process time-series data, CNN’s capability to capture spatial information, their complementary roles in preventing overfitting, and their complementary strengths in feature extraction and classification.
In practical applications, power disturbance signals are often accompanied by a significant amount of noise interference. To further demonstrate the robustness of the proposed method in this paper, a comparison with some other common model methods under different noise interference conditions has been conducted. The relevant identification results are presented in Table 2 below.
Observing the table above, it can be found that the proposed LSTM-CNN hybrid model maintains high accuracy under different noise conditions. LSTM excels at processing sequential data and capturing long-term dependencies within sequences. This is particularly advantageous for data with time-series characteristics, such as power quality disturbance signals, as it can better grasp patterns in the time series. Meanwhile, CNN is adept at extracting local features from image data and capturing spatial information. In the classification of power quality disturbances, CNN can extract spatial features from the disturbance signals, while LSTM captures temporal information. The combination of the two allows for the consideration of both spatial and temporal information, thereby enhancing the model’s accuracy. In summary, the CNN-LSTM hybrid model combines the strengths of CNN and LSTM, taking into account both temporal and spatial information of the data. This enables the model to more accurately capture temporal dependencies and spatial patterns in historical data when predicting power quality disturbances, thus improving diagnostic accuracy.
To illustrate the rationality of selecting the SSA. Comparisons are made in terms of identification accuracy and optimization time, with the relevant results shown in Table 3 below.
Observing Table 3 above, it can be seen that SSA optimization achieves the highest identification accuracy while ensuring computational efficiency. Compared to Genetic Algorithm (GA) and Bayesian Optimization, the identification accuracy is improved by 3.9% and 2.8%, respectively. By simulating the foraging behavior of sparrows, SSA effectively balances exploration (searching for new areas) and exploitation (conducting fine searches in known promising areas) within the search space. This balance is crucial for hyperparameter optimization, as it allows the algorithm to conduct an extensive search for the optimal solution while also making fine adjustments near potential optimal solutions. Compared to other optimization algorithms, SSA is relatively insensitive to the setting of initial parameters. This means that SSA can exhibit good performance without the need for extensive parameter tuning, which is particularly important for rapid deployment in practical applications and reducing tuning costs. Through its unique leader–follower strategy, SSA maintains high diversity in the search space, thereby enhancing its global search capability. This is particularly advantageous for finding optimal solutions in complex, multimodal search spaces. Although computational efficiency may vary depending on problem size and algorithm implementation, SSA typically provides relatively fast convergence speeds while maintaining high search quality. This is particularly critical for hyperparameter optimization in large-scale datasets and real-time applications. SSA can flexibly adapt to various problems and constraints. In the power quality disturbance classification strategy proposed in this paper, SSA can handle the complexity and nonlinear characteristics of the CNN-LSTM model, thereby finding the optimal combination of hyperparameters suitable for specific datasets and tasks. In contrast, although GA is also a global optimization algorithm, its crossover and mutation operations may lead to a loss of diversity in the search process, causing the algorithm to fall into local optimal solutions. While Bayesian Optimization performs well in high-dimensional spaces, it relies on information from previously evaluated points to construct a surrogate model and therefore may lack sufficient exploratory capabilities in the initial stages. In the specific problem addressed in this paper, these advantages of SSA enable it to more effectively optimize the hyperparameters of the CNN-LSTM model, thereby improving the accuracy and generalization ability of power quality disturbance classification. Furthermore, by incorporating an enhanced learning mechanism, SSA can further adapt to the complexity and non-stationarity of power quality signals, maintaining stable classification performance under load fluctuations.

4.2. Effectiveness Verification of Complex Dynamic Environment

In power quality disturbance identification, the difficulty of identifying mixed disturbances of multiple types is significantly greater than that of a single type of disturbance. Single disturbances typically exhibit relatively clear and independent characteristics that are easy to identify. However, when multiple disturbances occur simultaneously, their characteristics may overlap or generate new composite features. For example, when a voltage sag occurs concurrently with harmonics, it may obscure the originally clear characteristics of the voltage sag, thereby increasing the difficulty of identification. Voltage signals in actual power systems are often affected by noise to varying degrees. For single disturbances, their characteristics can be relatively easily extracted through appropriate filtering and signal-processing techniques. However, for mixed disturbances, noise may simultaneously affect the characteristics of multiple disturbances, making feature extraction more challenging. Additionally, noise may obscure certain weak disturbance characteristics, preventing the identification system from accurately recognizing them. Most current power quality disturbance identification algorithms are based on specific mathematical models or feature extraction methods. For single disturbances, these algorithms usually achieve good identification results. However, for mixed disturbances, due to the complexity of their characteristics and the interference of noise, these algorithms may fail to accurately extract the characteristics of all disturbances, leading to a decrease in identification accuracy. In practical applications, samples of mixed disturbances are often more difficult to obtain than those of single disturbances. Therefore, during the training of identification systems, there may be a lack of sufficient samples of mixed disturbances, resulting in limited identification capabilities for mixed disturbances.
To further validate the effectiveness of the method proposed in this paper under complex disturbances, the authors increased the identification accuracy in scenarios involving complex and mixed types of disturbances, as shown in Table 4 below.
Observation of the table above reveals that the method proposed in this paper maintains a diagnostic accuracy of over 92% even under multiple types of fault disturbances. The FST is an effective signal processing tool capable of efficiently analyzing power quality disturbance signals while effectively preserving their time–frequency characteristics. This is particularly important for composite disturbances, which often contain features of multiple frequencies and times. By providing a clear time–frequency representation, FST enables more precise feature extraction, aiding the identification system in distinguishing between different types of disturbances, even when they occur simultaneously, while maintaining high identification accuracy. Traditional CNNs excel in processing image or time-series data but may have limitations when dealing with power quality disturbances with complex time dependencies. The introduction of LSTM networks partially enhances the model’s ability to process time-series data, especially its capacity to capture long-term dependencies. This hybrid CNN-LSTM model combines CNN’s spatial feature extraction capabilities with LSTM’s time-series analysis capabilities, thereby improving the identification accuracy for composite disturbances. Additionally, it cannot be overlooked that the method proposed in this paper can operate effectively even in high-noise environments. As a feature extraction tool, FST’s efficiency is not only reflected in its computational speed but also in its sensitivity to signal features and its ability to suppress noise. By extracting key time–frequency features, FST assists the model in identifying useful signal components in high-noise environments. The CNN-LSTM model integrates mechanisms, meaning that the physical mechanisms and characteristics of power quality disturbances are considered during model design and training. This integration enables the model to more specifically address power quality disturbances, enhancing its performance in complex and noisy environments.
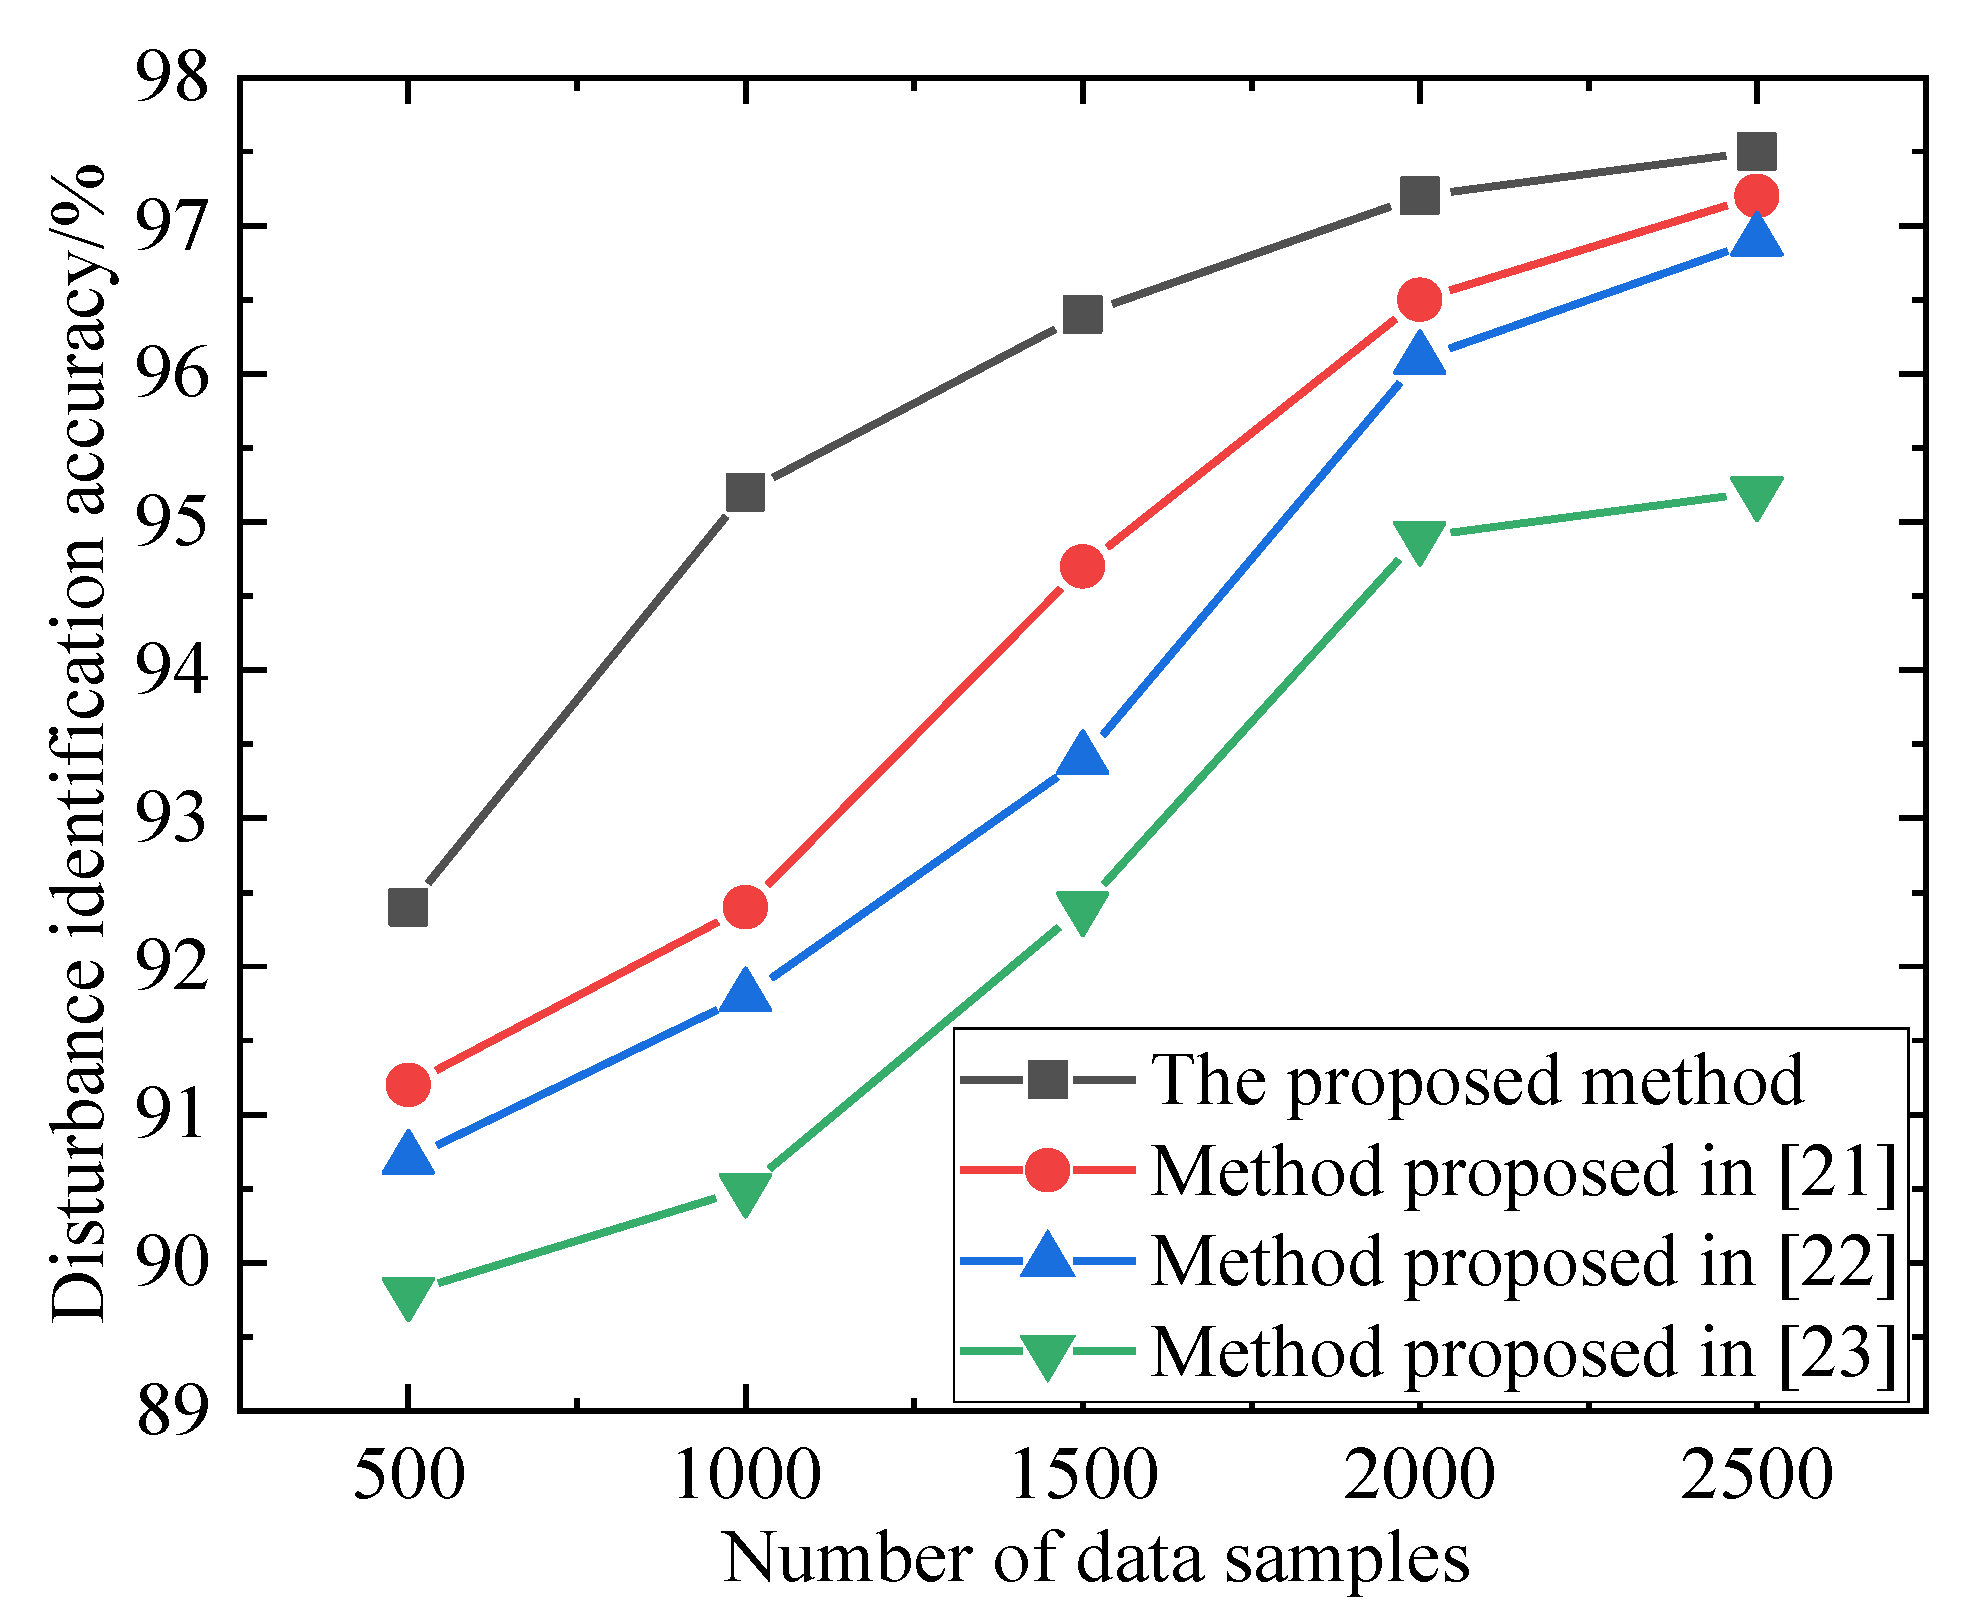
This paper further compares the identification accuracy of the current mainstream methods under different data sample sizes. Currently, methods such as the plug Hilbert transform method [20], the multi-dimensional spectral convolutional neural fusion network [21], and the weighted recursive layer aggregation (WRLA) network [22] are widely used in power quality detection and have achieved good results. This paper further tests the composite power quality disturbance diagnosis accuracy of each method under different data sample sizes, as shown in Figure 6 below. In this paper, the data values used for power quality detection all represent voltage amplitudes containing disturbance information. It should be noted that these data are collected by power grid measurement devices and power quality analyzers. Power quality analyzers are generally equipped with specialized software, USB interfaces, and wireless transmission capabilities for exporting and analyzing data. They are capable of capturing voltage and current waveforms in real time, thereby extracting disturbance information. The relevant data samples can be downloaded from the CSDN website [24].
Observing the above figure, it is not difficult to find that under the condition of small data samples, the advantages of the method proposed in this paper are more prominent, with an identification accuracy nearly 3.2% higher than that of existing methods. Meanwhile, as the number of data samples further increases, the diagnostic accuracy of various methods shows little difference. The FST adopted in this paper can efficiently analyze and extract features from power quality disturbance signals while effectively preserving the time–frequency characteristics of the signals. This is particularly important for small data samples because the limited number of samples requires the feature extraction method to capture the key information of the signals as accurately as possible, and FST excels in this aspect. Compared with other methods, the method proposed in this paper may have better adaptability when dealing with small data samples. This is because the combination of FST with CNN-LSTM can more flexibly capture and utilize key features in the signals while reducing the dependence on a large amount of training data. In the case of small data samples, complex models may be prone to overfitting due to excessive parameters, and the WRLA network may be affected by sample size limitations when processing sequential data. In contrast, the method in this paper improves adaptability to small data samples by simplifying the feature extraction process and enhancing the model’s learning ability.
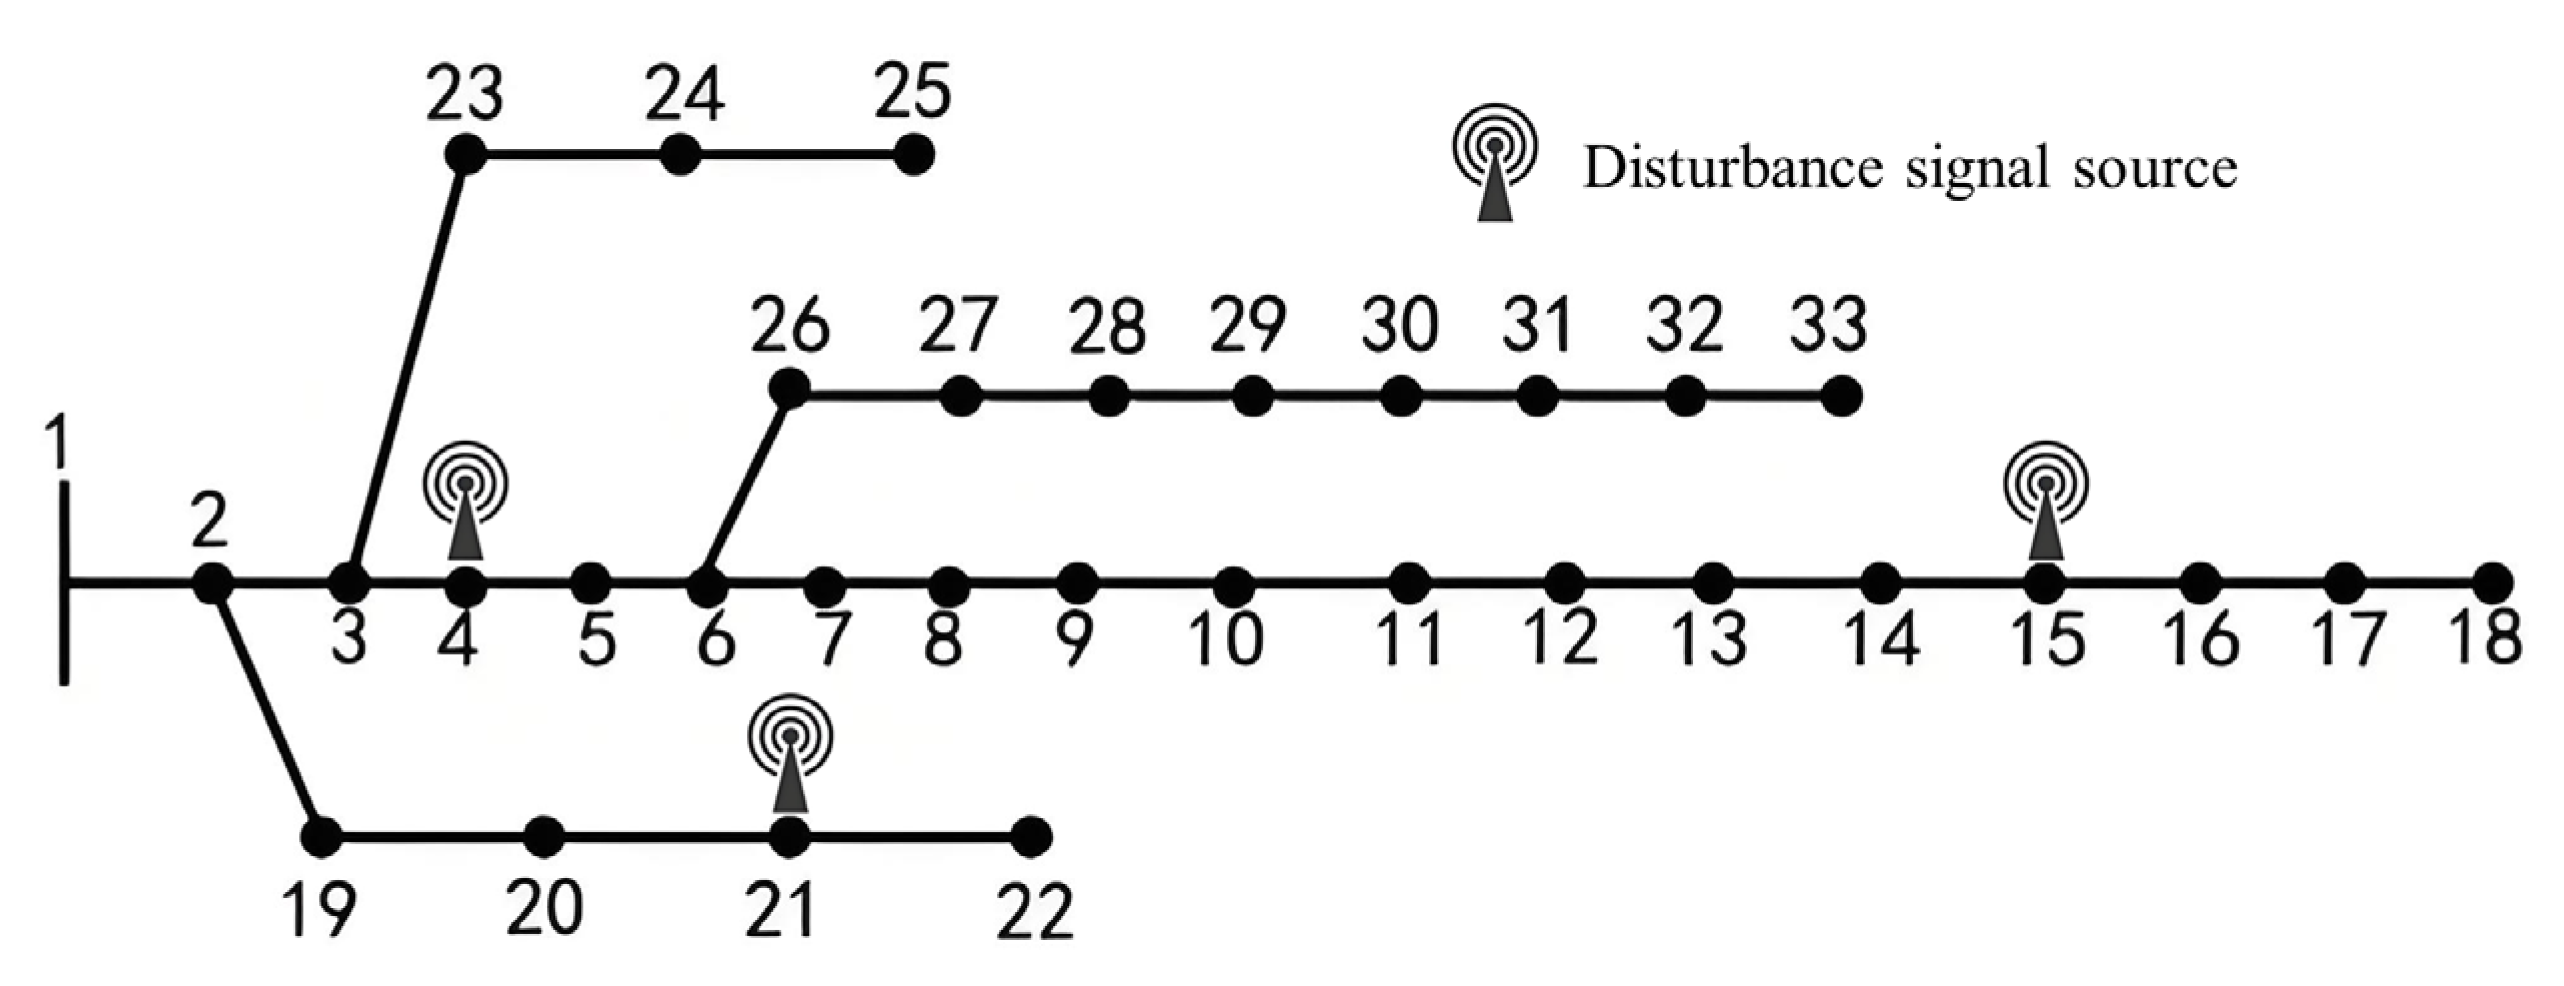
On the other hand, a time-varying dynamic power grid test environment is also used to verify the practicality of the method proposed in this paper. The modified IEEE-33-node distribution network is employed for testing, with the network structure shown in Figure 7 below. Three disturbance signal sources are installed at nodes 4, 15, and 21, respectively. Table 5 below presents the disturbance identification accuracy under different load fluctuation rates.
Observing the table above, it can be found that the method proposed in this paper still performs well under different load fluctuation rates. However, for all methods, as the load fluctuation rate increases, the accuracy of disturbance diagnosis tends to decline. This is because load fluctuations complicate the time–frequency characteristics of power quality signals, making feature extraction more difficult. The random variations in load impart non-stationarity to power quality data, which traditional methods may struggle to accurately capture. The classification accuracy of power quality disturbances can be affected by load fluctuation interference, leading to misclassification or missed classification. The plug Hilbert transform method can provide instantaneous frequency and amplitude information of signals, which is helpful for analyzing power quality disturbances. However, it has poor adaptability to load fluctuations and may fail to accurately capture the characteristics of dynamic changes. Additionally, this method has high computational complexity and is not suitable for real-time processing. The multi-dimensional spectral convolutional neural fusion network can automatically extract multi-dimensional features and has strong processing capabilities for complex signals. Through convolutional operations, it can capture local features and improve classification accuracy. However, in cases of load fluctuations, a large amount of training data may be required to optimize model parameters and avoid overfitting. The model structure is complex, and the training time is relatively long. The Weighted Recurrent Layer Aggregation Network can process sequential data and capture long-term dependencies in time series. By utilizing weighted recurrent layers, it can better exploit historical information. In situations with large load fluctuations, it may be difficult to accurately capture the dynamic changes of signals. This method demands high computational resources and is not suitable for resource-constrained environments. In contrast, the method proposed in this paper combines the advantages of CNNs in feature extraction with the capabilities of LSTMs in handling long-term dependencies in sequential data. By introducing an enhanced sparrow search algorithm and a learning mechanism, the classification performance and generalization ability of the model are further improved.
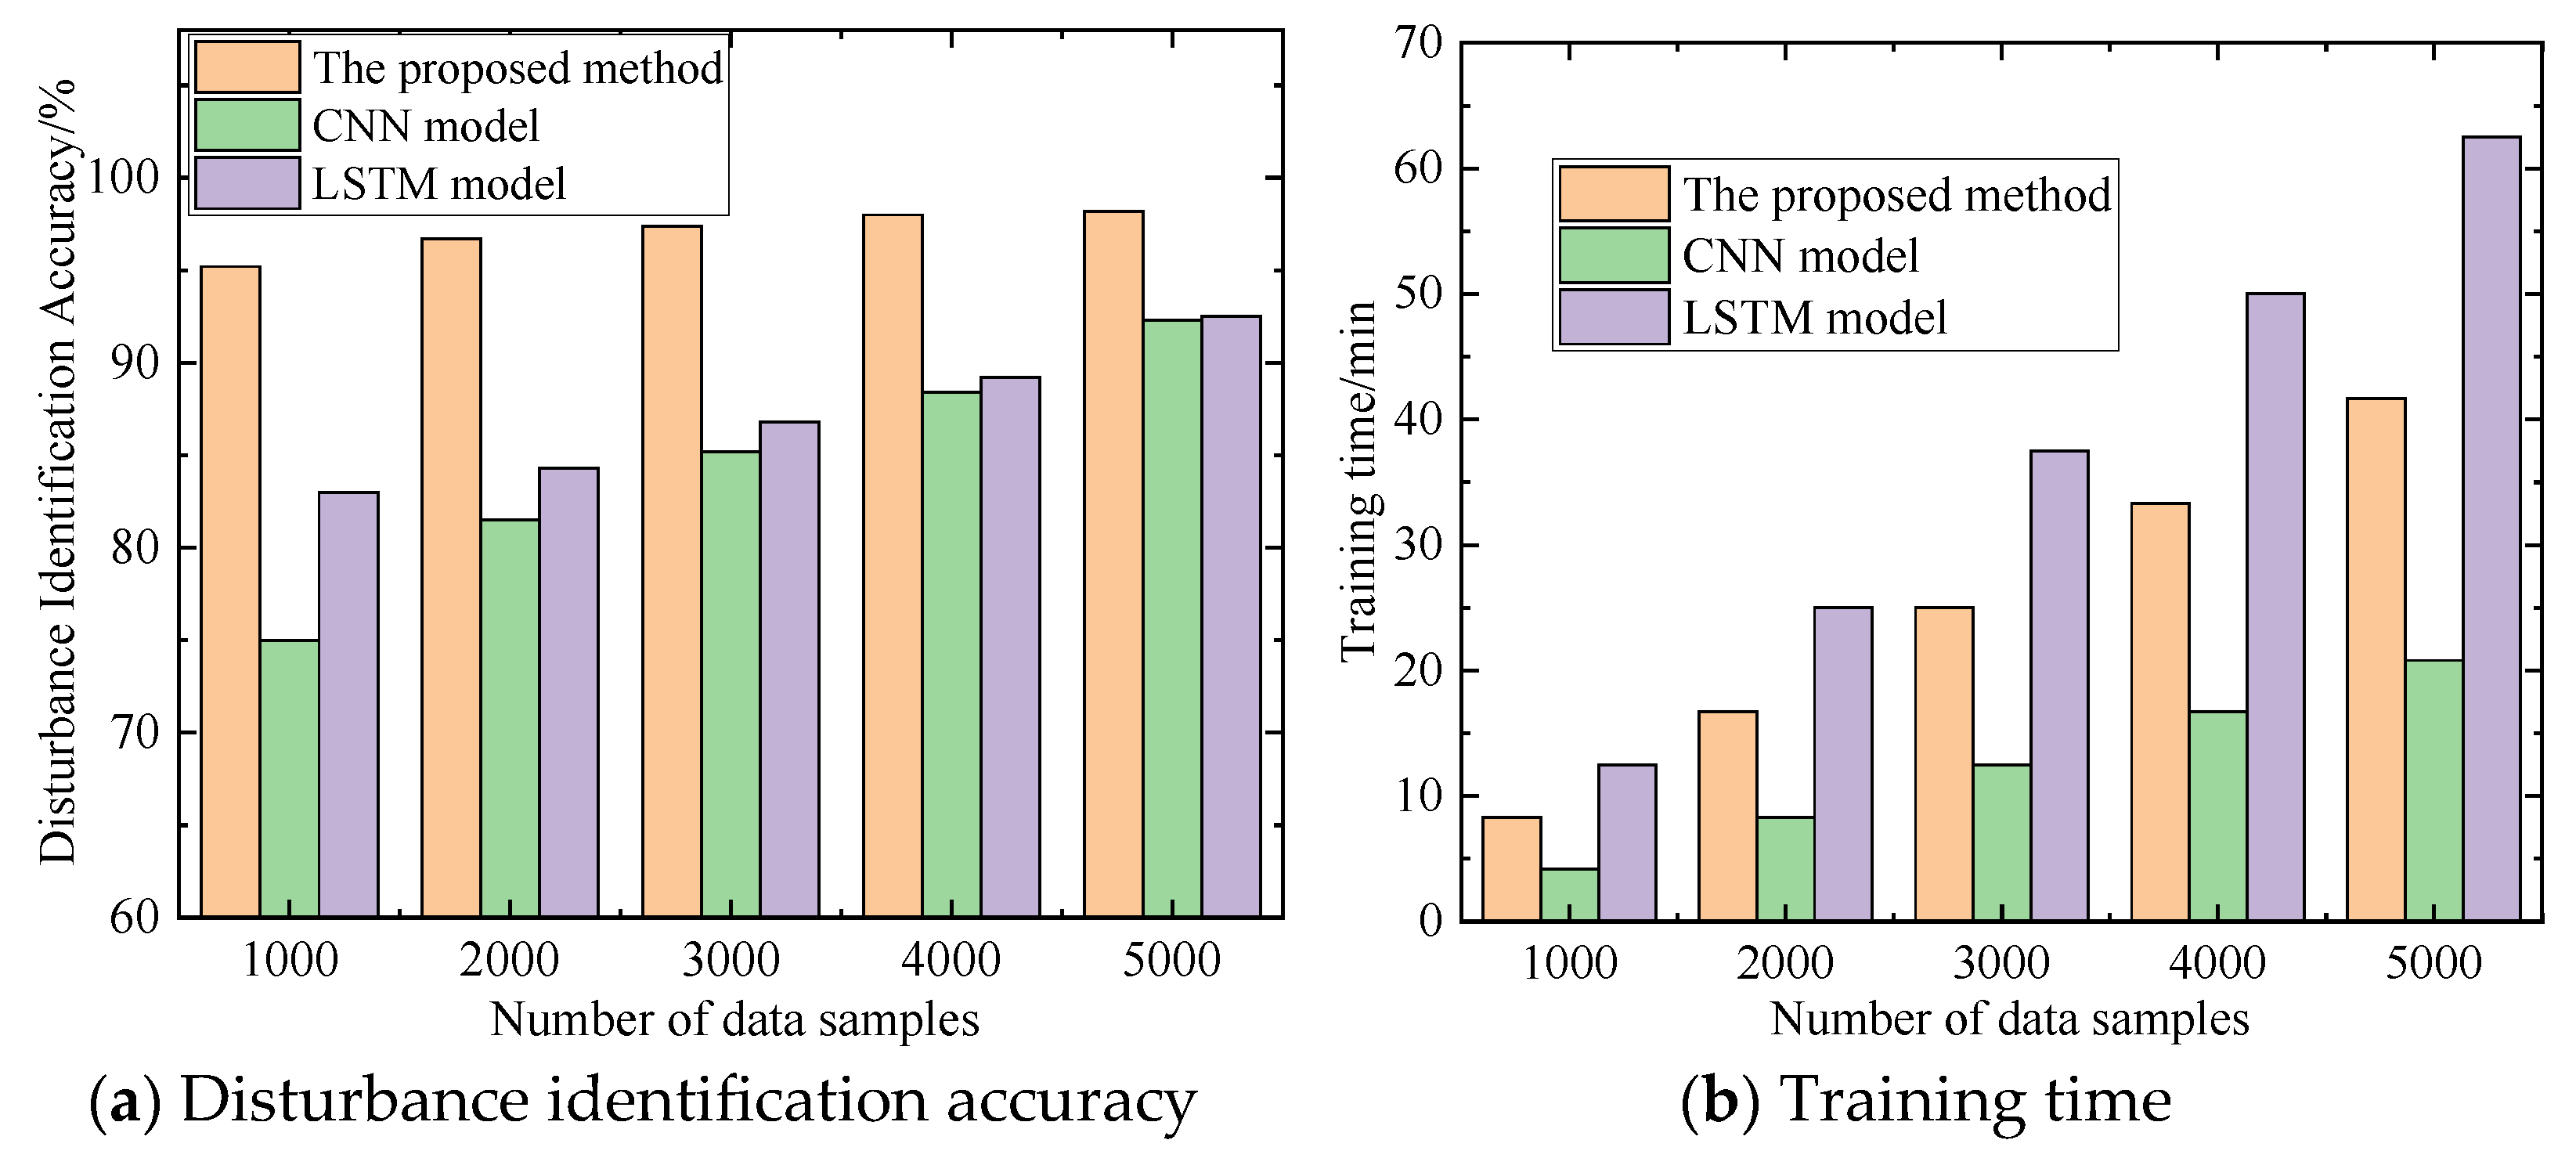
To provide a more intuitive comparison with traditional CNN and LSTM models, this paper analyzes the differences from two perspectives: identification accuracy and training time. The relevant data results are shown in Figure 8a,b below.
It should be noted here that power quality disturbance identification mainly consists of three key steps: FST processing, model training, and inference. The time consumption for FST processing and model inference is minimal, generally completed within a few seconds. Therefore, this paper mainly compares the model training time. Observing Figure 8, it can be found that the diagnostic accuracy of the method proposed in this paper is significantly better than that of traditional LSTM and CNN models. The training time increases linearly with the number of data samples. Among them, the CNN model has the shortest training time, while the LSTM model has a longer training time compared to CNN due to its higher time complexity. However, considering that model training can be done offline and only model inference and result output are required in the real-time stage, the above models can all meet the time requirements for online applications. Therefore, this paper mainly focuses on identification accuracy.
Although the power quality disturbance classification strategy based on the FST and the improved CNN-LSTM model proposed in the paper has achieved positive results in experimental validation, there are still some limitations. These limitations may stem from the size of the dataset, the complexity of the model, and the challenges of practical deployment. The complex CNN-LSTM model contains a large number of parameters, which increases the risk of overfitting. When the dataset size is insufficient to fully cover various possible disturbance scenarios, the model may learn noise or specific patterns in the dataset rather than the true disturbance characteristics. The CNN-LSTM model requires high-performance computing resources to support real-time or near-real-time processing. In practical deployment, specialized hardware (such as GPUs) may be needed to meet these requirements, which increases deployment costs. With the increasing complexity of power systems and the introduction of new types of power electronic equipment, power quality disturbances may change. Therefore, the model needs to be regularly updated to adapt to these changes, which requires continuous maintenance and updating capabilities. Lastly, it cannot be overlooked that although CNN-LSTM models perform well in classification, they are often considered “black box” models lacking interpretability. This may make it difficult to understand and trust the decision-making process of the model in practical deployment.

5. Conclusions

This paper delves into the importance of power quality disturbance classification in the context of the increasing complexity of power systems and the widespread application of power electronic equipment. In response to the potential impact of power quality disturbances on the stable operation of power systems and the normal functioning of electrical equipment, this study proposes a power quality disturbance classification strategy based on the fast S-transform and an improved convolutional neural network–long short-term memory (CNN-LSTM) model.
Firstly, this paper employs the fast S-transform to process power quality disturbance signals. This method not only effectively preserves the time–frequency characteristics of the signal but also significantly reduces the computational burden, making the analysis and feature extraction of power quality disturbance signals more efficient.
Secondly, addressing the limitations of traditional CNN models in power quality disturbance classification, this paper proposes an improved CNN-LSTM hybrid classification model with a fused mechanism. By introducing an improved sparrow search algorithm and learning mechanism, this model effectively enhances the classification performance and generalization ability of the model for power quality disturbances. This innovative approach not only overcomes the shortcomings of traditional CNN models in processing time-series data but also improves the model’s ability to recognize complex power quality disturbance signals. Following analysis and comparison, the approach introduced in this paper retains an accuracy rate exceeding 97% for disturbance identification, even in environments with significant noise, when faced with a single disturbance type. In scenarios involving intricate mixtures of various disturbance types, the identification accuracy still stands above 95%. When benchmarked against existing methodologies, the presented method demonstrates an enhancement in identification accuracy by a maximum of 3.2%.
Potential future research directions in the field of power quality disturbance identification can be summarized as follows:
(1)
With the continuous development of deep learning technology, future research can further optimize existing hybrid models such as CNN-LSTM by introducing more advanced algorithms and structures, such as Transformer, BERT, and others, to improve the accuracy and efficiency of power quality disturbance identification.
(2)
Currently, most research focuses on supervised learning, but the application of unsupervised learning and self-supervised learning in power quality disturbance identification has not been fully explored. Future research can explore how to utilize unlabeled or weakly labeled data for model training, reducing the dependence on a large amount of labeled data.

Author Contributions

Conceptualization, H.B., R.Y., W.Z., Z.Z. and H.Z.; methodology, H.B., R.Y., W.Z., Z.Z. and H.Z.; software, H.B., R.Y., W.Z., Z.Z. and H.Z.; writing—original draft preparation, H.B., R.Y., W.Z., Z.Z. and H.Z. All authors have read and agreed to the published version of the manuscript.

Funding

This research is funded by the Southern Power Grid Corporation Technology Project (No. 00000 KC23050049).

Data Availability Statement

The original contributions presented in this study are included in the article. Further inquiries can be directed to the corresponding author.

Conflicts of Interest

Author Zhenxin Zhong was employed by the company Huizhou Power Supply Bureau of Guangdong Power Grid. The remaining authors declare that the research was conducted in the absence of any commercial or financial relationships that could be construed as a potential conflict of interest.

References

  1. Tong, H.; Zeng, X.; Yu, K.; Zhou, Z. A Fault Identification Method for Animal Electric Shocks Considering Unstable Contact Situations in Low-Voltage Distribution Grids. IEEE Trans. Ind. Inform. [CrossRef]
  2. Yang, L.; Li, H.; Zhang, H.; Wu, Q.; Cao, X. Stochastic-Distributionally Robust Frequency-Constrained Optimal Planning for an Isolated Microgrid. IEEE Trans. Sustain. Energy 2024, 15, 2155–2169. [Google Scholar] [CrossRef]
  3. Khetarpal, P.; Nagpal, N.; Al-Numay, M.S.; Siano, P.; Arya, Y.; Kassarwani, N. Power Quality Disturbances Detection and Classification Based on Deep Convolution Auto-Encoder Networks. IEEE Access 2023, 11, 46026–46038. [Google Scholar] [CrossRef]
  4. Xia, Y.; Li, Z.; Xi, Y.; Wu, G.; Peng, W.; Mu, L. Accurate Fault Location Method for Multiple Faults in Transmission Networks Using Travelling Waves. IEEE Trans. Ind.Inform. 2024, 20, 8717–8728. [Google Scholar] [CrossRef]
  5. Xiao, S.; Hu, J.; Li, J. Detection and Analysis of Power Quality Based on Wavelet Transform. Electr. Power Energy 2018, 39, 181–185. [Google Scholar]
  6. Hasan, S.; Muttaqi, K.M.; Sutanto, D. Detection and Characterization of Time-Variant Nonstationary Voltage Sag Waveforms Using Segmented Hilbert-Huang Transform. IEEE Trans. Ind. Appl. 2020, 56, 4563–4574. [Google Scholar]
  7. Li, J.; Lin, H.; Liang, C.; Teng, Z.; Cheng, D. Power Quality Disturbance Detection Method Based on Dual-Resolution S-Transform and Learning Vector Quantization Neural Network. Trans. China Electrotech. Soc. 2019, 34, 3453–3463. [Google Scholar]
  8. Sun, P.; Guo, Q.; Wang, Q.; Shi, W.; Wang, Y.; Wang, X. Two-Dimensional Discrete Wavelet Transform Power Quality Data Compression Algorithm. J. Comput. Appl. 2024, 34, 4. [Google Scholar]
  9. Zhang, L.; Ding, Z.; Xia, R.; Guo, F. Power Quality Data Compression Algorithm Combining Second-Generation Wavelet and Fast Fourier Transform. South. Power Syst. Technol. 2023, 7, 5. [Google Scholar]
  10. Zheng, W.; Wu, W. Power Quality Data Compression Based on Two-Dimensional Wavelet Packet and v-SVR. Power Syst. Prot. Control. 2020, 68–74. [Google Scholar]
  11. Chen, L.; Zheng, D.; Liao, W. Compressed Sensing-Based Compression and Reconstruction Method for Power Quality Signals with Disturbances. Trans. China Electrotech. Soc. 2016, 31, 163–171. [Google Scholar]
  12. Yu, H.; Du, Y.; Ma, C. Overview of Compressed Sensing Technology for Power System Signals and Data. Chin. J. Sci. Instrum. 2017, 38, 1943–1953. [Google Scholar]
  13. Luo, Y. Research on Classification Method of Complex Power Quality Disturbance Events. Master’s Thesis, Huazhong University of Science and Technology, Wuhan, China, 2018. [Google Scholar]
  14. Qu, X.; Duan, B.; Yin, Q.; Yang, Y.; Zhong, Y. Power Quality Disturbance Classification Method Based on Sparse Autoencoder Deep Neural Network. Electr. Power Autom. Equip. 2019, 39, 157–162. [Google Scholar]
  15. Abdelsalam, A.A.; Hassanin, A.M.; Hasanien, H.M. Categorization of Power Quality Problems Using Long Short-Term Memory Networks. IET Gener. Transm. Distrib. 2021, 15, 1626–1639. [Google Scholar] [CrossRef]
  16. Wang, J.; Zhang, D. Power Quality Disturbance Classification Method Based on Convolutional Neural Network with Side Output Fusion. Electr. Power Autom. Equip. 2021, 41, 107. [Google Scholar]
  17. Gong, Z.; Zou, Y.; Jin, T. Power Quality Disturbance Classification Method Based on Parallel Optimization Model of Feature Fusion. Chin. J. Electr. Eng. 2023, 43, 1017–1027. [Google Scholar]
  18. Wang, Y.; Chen, H.; Gao, B.; Xiao, X.; Torquato, R.; Trindade, F.C. Harmonic resonance analysis in high-renewable-energy-penetrated power systems considering frequency coupling. Energy Convers. Econ. 2022, 3, 333–334. [Google Scholar] [CrossRef]
  19. Wang, Y.; Tang, J.; Si, J.; Xiao, X.; Zhou, P.; Zhao, J. Power quality enhancement in islanded microgrids via closed-loop adaptive virtual impedance control. Prot. Control. Mod. Power Syst. 2023, 8, 10. [Google Scholar] [CrossRef]
  20. Luo, Y.; Li, K.; Li, L.; Huang, J.; Zhao, C.; Xiao, X. A Novel Recognition Method for Complex Power Quality Disturbances Based on Rotation Vector and Fuzzy Transfer Field. IEEE Trans. Ind. Inform. 2024, 20, 12502–12512. [Google Scholar]
  21. He, M.; Li, J.; Mingotti, A.; Tang, Q.; Peretto, L.; Teng, Z. Deep Fractional Multidimensional Spectrum Convolutional Neural Fusion Network for Identifying Complex Power Quality Disturbance. IEEE Trans. Instrum. Meas. 2024, 73, 9005412. [Google Scholar] [CrossRef]
  22. Zhu, K.; Teng, Z.; Qiu, W.; Mingotti, A.; Tang, Q.; Yao, W. Aiming to Complex Power Quality Disturbances: A Novel Decomposition and Detection Framework. IEEE Trans. Ind. Inform. 2024, 20, 4317–4326. [Google Scholar] [CrossRef]
  23. Wu, Y.; Zhang, P.; Lu, G. Detection and Location of Aged Cable Segment in Underground Power Distribution System Using Deep Learning Approach. IEEE Trans. Ind. Inform. 2021, 17, 7379–7389. [Google Scholar] [CrossRef]
  24. Available online: https://download.csdn.net/download/LF2827417795/90356601 (accessed on 6 February 2024).
Figure 1. RNN structure diagram.
Processes 13 00743 g001
Figure 2. The structural principle diagram of LSTM.
Processes 13 00743 g002
Figure 3. The hybrid structure of LSTM-CNN.
Processes 13 00743 g003
Figure 4. Accuracy comparison between different models.
Processes 13 00743 g004
Figure 5. Loss value comparison between different models.
Processes 13 00743 g005
Figure 6. Comparison of disturbance identification accuracy among different methods [20,21,22].
Processes 13 00743 g006
Figure 7. Topology of the modified IEEE-33 node.
Processes 13 00743 g007
Figure 8. Analysis of model performance before and after improvements.
Processes 13 00743 g008
Table 1. CNN optimal hyperparameter selection results.
HyperparametersSpecific Values
Learning Rate0.0035
Number of Iterations117
Batch Size526
Number of Kernels in Convolutional Layer110
Number of Kernels in Convolutional Layer210
Number of Neurons in Fully Connected Layer1168
Number of Neurons in Fully Connected Layer2192
Table 2. Comparison of model diagnostic accuracy under different noise conditions.
ModelDiagnostic Accuracy/%
Noise: 10 dBNoise: 20 dBNoise: 30 dB
The proposed model99.298.197.6
The model proposed in ref. [6]98.696.595.5
The model proposed in ref. [11]98.196.496.2
The model proposed in ref. [14]98.397.596.9
Table 3. Comparison of performance among different optimization algorithms.
MethodPerformance
Identification Accuracy/%Optimization Time/s
SSA in this paper98.646.3
Genetic Algorithm94.759.2
Bayesian Optimization95.848.6
Table 4. Identification accuracy of the proposed method for complex disturbance types.
Complex Disturbance TypesDiagnostic Accuracy/%
Noise: 10 dBNoise: 20 dBNoise: 30 dB
voltage swells and voltage sags96.295.193.6
voltage swells and voltage interruptions95.694.593.5
voltage sags and transient impulses96.194.492.2
voltage interruptions and transient oscillations95.394.792.9
voltage sags and transient oscillations95.294.193.6
Table 5. Results of power quality disturbance diagnosis under different load fluctuation rates.
MethodDisturbance Identification Accuracy/%
Load Fluctuation Rate 5%Load Fluctuation Rate 10%Load Fluctuation Rate 15%Load Fluctuation Rate 20%
The proposed method98.497.396.294.7
Plug Hilbert transform method [20]97.296.195.394.2
Multi-dimensional spectral convolutional neural fusion network [21]96.296.195.693.6
WRLA network [22]95.794.993.791.8
Disclaimer/Publisher’s Note: The statements, opinions and data contained in all publications are solely those of the individual author(s) and contributor(s) and not of MDPI and/or the editor(s). MDPI and/or the editor(s) disclaim responsibility for any injury to people or property resulting from any ideas, methods, instructions or products referred to in the content.

