1. Introduction
To mitigate the global reliance on fossil fuels, reduce carbon emissions, and improve ecological sustainability, renewable energy sources, such as wind and solar power, have garnered significant attention. These alternatives are expected to gradually replace thermal power generation in electrical grids, emerging as primary energy suppliers. However, wind and solar energy exhibit inherent intermittency and stochastic fluctuations due to seasonal variations and diurnal cycles, potentially compromising the operational stability of power systems [
1,
2,
3]. Consequently, the increasing integration of renewable energy necessitates enhanced grid flexibility in terms of peak shaving, frequency regulation, and energy storage capabilities. Compared with other energy storage solutions, pumped storage hydropower plants demonstrate superior technological maturity, operational stability, and scalability for large-scale deployment. This positions pumped storage hydropower stations as the most viable regulating power source for novel power systems, capable of optimizing energy portfolios while ensuring grid resilience [
4,
5,
6].
The efficient and stable operation of the pump turbine, as a critical component of pumped storage power stations, is essential for ensuring the safe and effective functioning of the facility. With advancements in the hydropower sector, pumped storage power stations are increasingly evolving towards high-head and high-speed operations, resulting in frequent occurrences of cavitation phenomena affecting the units. Numerous studies have indicated that cavitation has a more significant impact on the operational conditions of pumps than on those of turbines. The cavitation performance of pump turbines under pump conditions is deemed more critical than under turbine conditions [
7,
8,
9]; consequently, it is essential to conduct in-depth research on the cavitation flow field specific to pump turbines operating in pump mode. Li et al. [
10] employed numerical simulation techniques to investigate the cavitation characteristics of pump turbine runners in high-head regions under varying flow rates and heads for both pump and turbine conditions. Zhang et al. [
9] conducted a study on the cavitation flow field and performance of pump turbine operating conditions, determining the critical cavitation bubble volume fraction; their findings indicated that varying flow rates influence the location of bubble formation at the inlet. Tao et al. [
8] conducted a study on the cavitation behavior of pump turbines under various operating conditions; the research compared the inception and critical cavitation points across different scenarios, concluding that utilizing an initial cavitation standard allows for a more timely detection of cavitation bubbles, thereby facilitating the early mitigation of cavitation phenomena.
Cavitation can also lead to adverse phenomena such as vibrations and noise within the machinery, which may result in a reduction in mechanical lifespan, a decrease in maintenance intervals, and an increase in the frequency of unit startups and shutdowns, ultimately affecting the stability of the power station. Hao et al. [
11] conducted a study on the impact of different impeller tip clearances in the cavitating flow field of mixed-flow pumps operating under pump conditions, specifically focusing on the radial forces acting on the shaft in pumped storage units. The findings indicate that when the apex gap is asymmetrical, the cavitation performance is at its lowest. In this scenario, the amplitude of the radial force increases with the intensification of cavitation and, due to the asymmetric distribution of the cavitation region, the direction of the radial force also varies as cavitation worsens. Liu et al. [
7] examined the impact of cavitation on the radial forces experienced by water pump turbines under pumping conditions. Their study revealed that the number of cavitation bubbles on the blade surfaces increased as cavitation intensified, resulting in a reduction in blade load and a decrease in the regularity of pressure fluctuations. This led to a significant alternation in radial forces, contributing to the emergence of fatigue cracks in high-stress areas of the blades. However, due to the periodic symmetrical structure of the guide vanes and the runner, the distribution of radial forces remained relatively uniform.
The unsteady flow structures induced by internal cavitation are one of the critical factors leading to adverse phenomena such as structural vibrations and noise in the unit, as well as significant performance degradation. Meng et al. [
12] investigated the dynamic characteristics of cavitation-induced vortices in centrifugal pumps based on the vorticity transport method, revealing that vortex structures form at the trailing edge of cavitation regions in flow channels during severe cavitation stages. Wu et al. [
13] employed numerical simulations to analyze two-dimensional vortex structures on cross-sections through velocity component analysis and extracted vorticity on pump blade surfaces using the new omega vortex identification method proposed by Zhang et al. [
14]. The results demonstrated that as the net positive suction head decreases, the vapor volume expands, leading to flow field disorder and localized vortex formation. These vortices detach from the blade surfaces as cavitation cavities roll up, with the vorticity transport method effectively capturing large-scale high-vorticity regions. Ruan et al. [
15] investigated the cavitation characteristics of pump turbines under various flow conditions in pump mode. The findings indicated that under low-flow conditions, intense cavitation on the suction side of the blade trailing edge induces flow separation, disrupting the flow field structure and generating large-scale flow separation and vortex structures, resulting in a significant reduction in pump turbine efficiency.
The decline in unit performance and efficiency is attributed to increased internal energy dissipation. To identify the distribution and magnitude of energy dissipation regions, Gong et al. [
16] pioneered the application of entropy production theory to flow field analysis. Li et al. [
17] utilized this theory to investigate energy loss characteristics in pump turbines operating within the hump region under pump mode. Yu et al. [
18] further explored energy dissipation in cavitating flows within micro-pumps using the entropy production method, establishing correlations among cavitation, vorticity, and entropy production. Their results revealed that during cavitation development, mass exchange between gas and liquid phases and momentum transfer between fluids contribute significantly to hydraulic losses.
Traditional methods have difficulty in capturing the dominant features of unsteady flow fields. Therefore, to effectively process complex flow field data, many reduced-order models have been proposed by researchers in recent years. The most commonly used methods are proper orthogonal decomposition (POD) [
19] and dynamic mode decomposition (DMD) [
20].
The POD (proper orthogonal decomposition) method decomposes complex flow fields into a series of spatial orthogonal modes, ranking them based on their energy content (i.e., their eigenvalues) to emphasize the dominant flow structures. Due to its ability to accurately capture coherent structures within the flow field and significantly simplify the analysis, POD has been widely applied in flow field studies. For instance, Lu et al. [
21] utilized the POD method to decompose and reconstruct the flow field in the tongue region of a centrifugal pump, establishing the relationship between pressure fluctuations and the dominant flow structures. Yang et al. [
22,
23] employed the POD method to investigate the evolution frequency of the stall region in the flow field of the guide vane when the pump operates in the hump region.
In contrast to the POD method, the DMD technique allows for the decomposition of the flow field into a series of distinct frequency modes, thereby facilitating the observation of flow structures evolving at various frequencies. Xie et al. [
24] employed the DMD method to analyze the velocity field of the cavitating flow around a hydrofoil, finding that the frequency of the second mode matched the bubble shedding frequency, while the frequencies of the third and fourth modes were harmonics of the second mode. For rotating fluid machinery, Lu et al. [
25] utilized a wavelet transform to analyze pressure fluctuation data at the inlet and outlet of a centrifugal pump and combined this with numerical simulations to decompose the internal flow field data using DMD. The results indicated the presence of complex pressure fluctuation characteristics within the centrifugal pump, dominated by different frequencies.
To date, few studies have combined two mode decomposition methods and analyzed the unsteady cavitation characteristics of the flow field in the runner and guide vanes of a pump turbine under low-flow conditions. In this study, the POD method and the DMD method are combined to study the unsteady characteristics of vortices under different cavitation conditions in the low-flow pump operation of a pump turbine. The results of the two mode decomposition methods are compared and verified to gain a deeper understanding of the unsteady characteristics of the cavitation flow field.
4. Results and Discussion
4.1. Analysis of Cavitation Characteristics
In this study, head values under different flow conditions were obtained experimentally, and corresponding numerical simulations were conducted for each test case to derive the flow–head (Q-H) curve. Due to system leakage and limitations in instrument precision, the numerical simulations could not fully replicate experimental conditions, resulting in discrepancies between the two datasets. However, as shown in
Figure 5, the relative error remained within 5%, which is acceptable and confirms the accuracy of the numerical simulations, thereby validating their use for subsequent analyses. The Q-H curve reveals that as the flow rate decreases, the head gradually increases until reaching approximately 60% of the design flow rate (0.6 Q
d), where the curve exhibits a positive slope region—the hump region. Giovanna et al. [
27] identified a strong correlation between hump characteristics and rotor–stator interactions in this region, prompting this study to focus on the cavitation flow field under the 0.6 Q
d condition for in-depth investigation.
Numerical simulations of cavitation characteristics were conducted for the conditions of 0.6 times Q
d and Q
d. The resulting cavitation characteristic curves are illustrated in
Figure 6, where the horizontal axis represents the cavitation coefficient defined in Equation (17), and the vertical axis indicates the head corresponding to the respective cavitation number.
It is evident that as the cavitation number decreases, there is little variation in the head during the initial phase until a critical point is reached (referred to as critical cavitation), at which point a noticeable decline in head begins. Subsequently, the slope of the curve increases rapidly, leading to a sharp decrease in head, significantly impacting the performance of the unit.
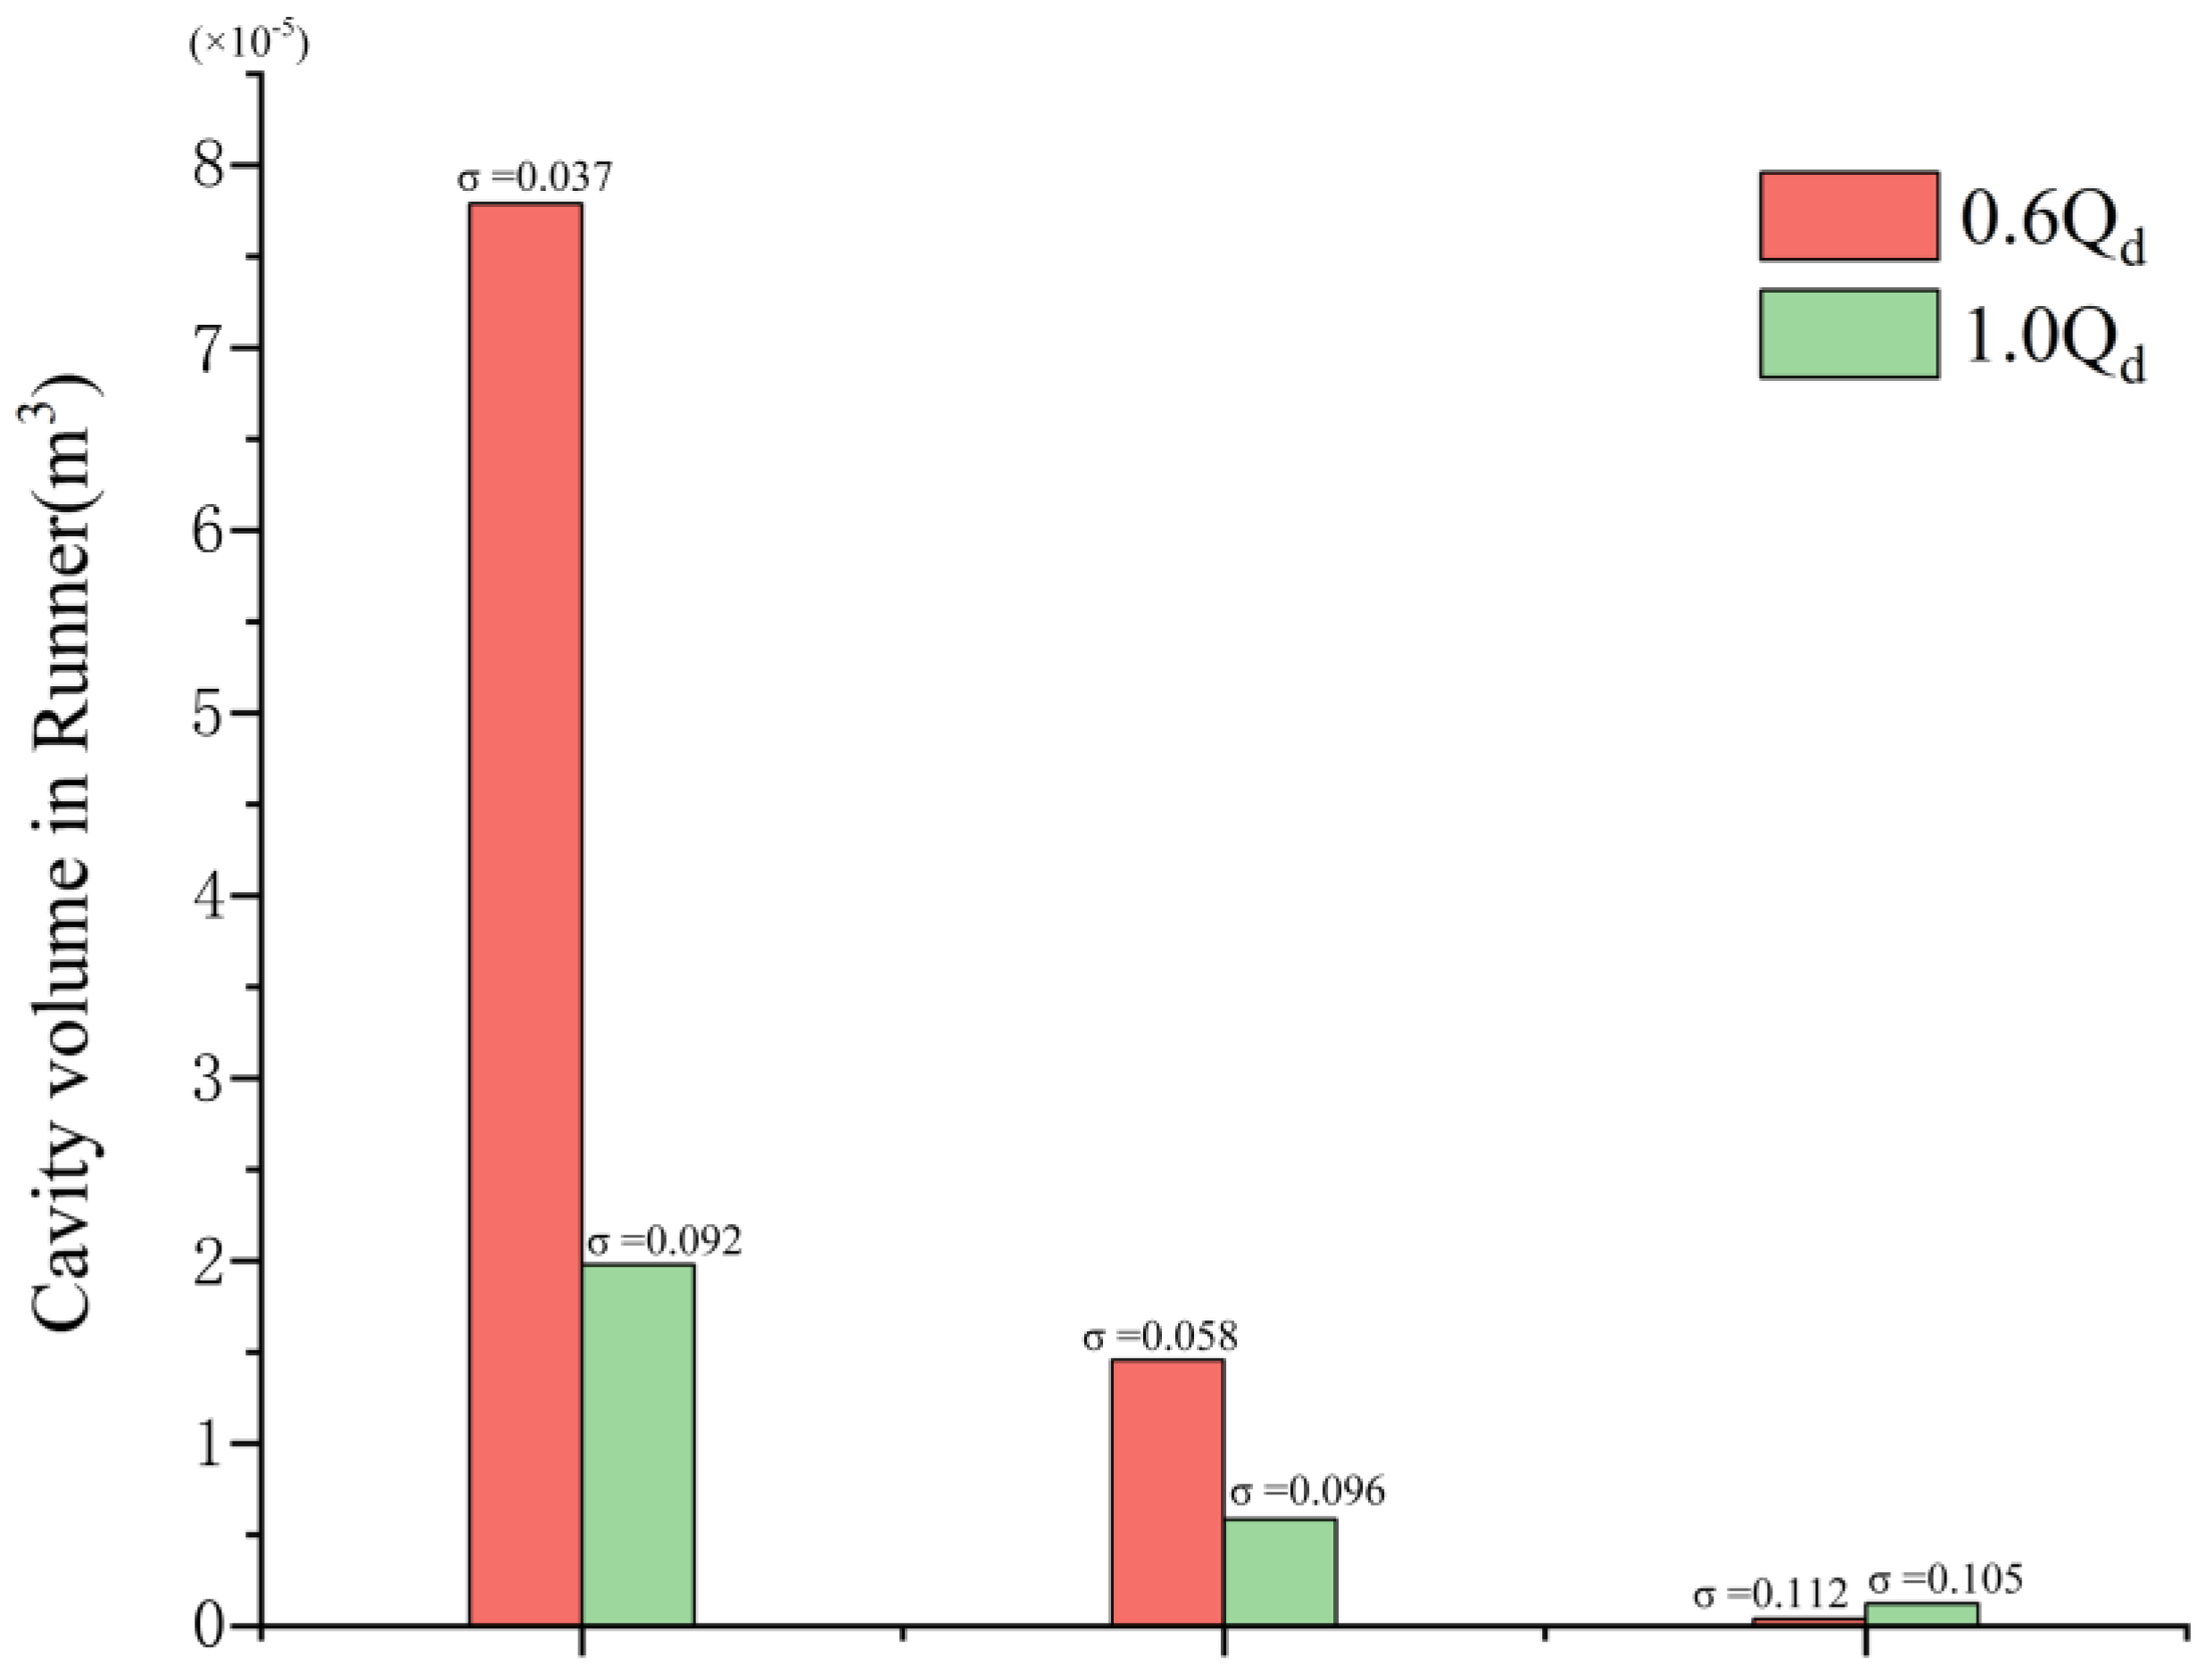
Figure 7 illustrates the total volume of cavitation bubbles in the impeller region under the conditions of 0.6 Q
d and Q
d at varying levels of cavitation.
Figure 8 depicts the iso-surface formed by the cavitation volume fraction equal to 10% under the corresponding cavitation conditions. A comparison of these two figures reveals that when the cavitation number is relatively high and bubbles are just beginning to form, the volume of the bubbles is minimal, occupying a small portion of the flow channel and causing negligible disturbance to the flow field. As the cavitation number decreases to a critical point, cavitation develops to a certain extent, resulting in bubbles occupying part of the flow channel and affecting the flow field, which leads to a reduction in head. Conversely, when cavitation is fully developed, the bubbles occupy a significant portion of the space, severely impeding the normal flow of water.
In the Qd operating condition, cavitation occurs predominantly on the pressure side, whereas in the 0.6 Qd condition, significant cavitation is observed on both the suction and pressure sides. Notably, the cavitation on the suction side is primarily concentrated near the upper cover plate, while the pressure-side cavitation is mainly found close to the hub. Additionally, due to the dynamic interference between the rotating blades and the stationary guide vanes, cavitation begins to manifest at the outlet of the rotating blades and in the no-blade region. As cavitation progresses, the volume of the vapor bubbles in the no-blade area increases, adversely affecting the flow in that region. This phenomenon leads to a sharp decline in head and a reduction in efficiency.
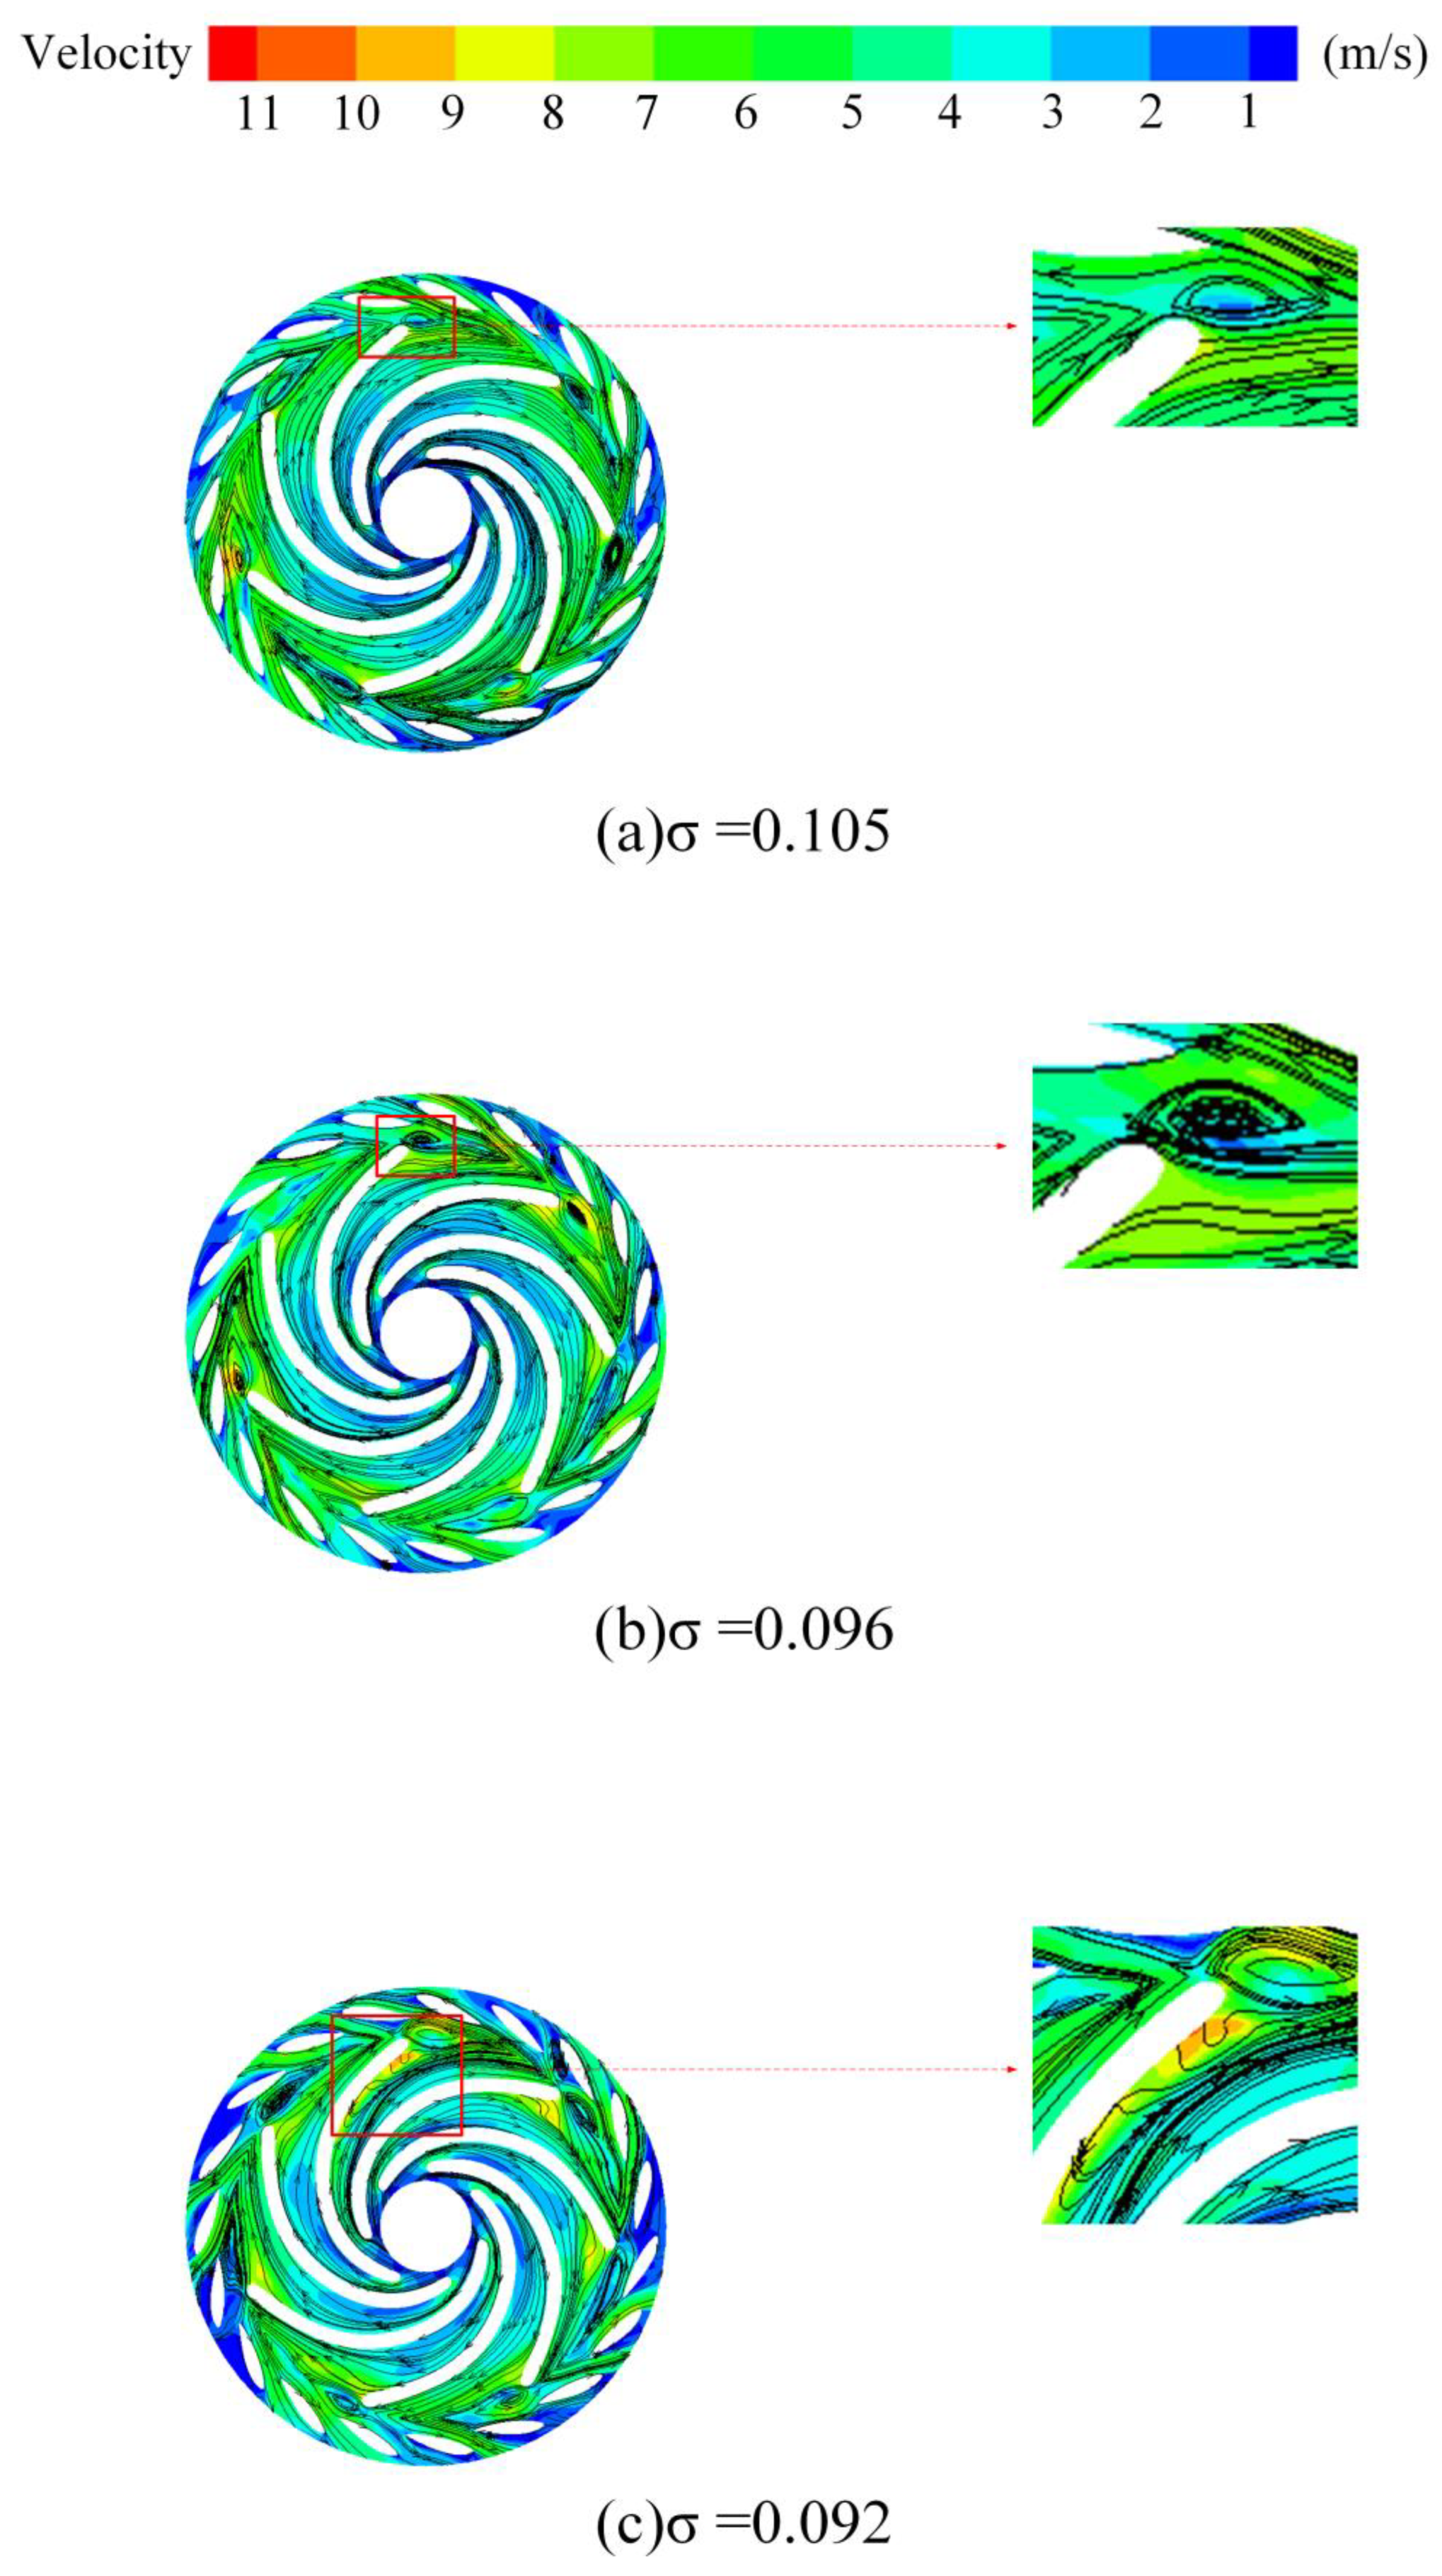
Figure 9 and
Figure 10 illustrate the velocity contours and streamlines on Plane A for different cavitation levels at 0.6 Q
d and Q
d operating conditions. The flow separation on the suction side of the blade exit and the recirculation in the variable guide vane region result in the formation of large-scale vortex structures in the blade-free zone due to internal viscous forces. Compared to the Q
d flow rate condition, the 0.6 Q
d flow rate condition exhibits more severe backflow phenomena in the guide vane region, with vortex structures of significantly larger scales. As cavitation intensifies, the vortex scale in the bladeless region expands, the flow separation on the suction side of the blade increases, and water flows backward into the runner, forming a vortex near the suction side of the blade and runner. The vortices present in both the blade-free and runner areas significantly impede the flow within the field, ultimately resulting in a decline in the performance of the unit.
4.2. Analysis of Energy Dissipation Characteristics in Cavitating Flow Fields
To facilitate a more intuitive observation of the vortices and the associated energy loss distribution in low-flow conditions, the Q criterion vortex identification method was employed to capture the vortices in the flow field of Plane A.
Figure 11 illustrates the vorticity and its corresponding entropy generation distribution, along with the average entropy generation in Plane A’s flow field. As indicated by the comparison of the average entropy generation in Plane A’s flow field shown in
Figure 11b, it is evident that with the progression of cavitation, the entropy generation increases, leading to greater energy loss.
Figure 11a presents the vortex map identified using the Q criterion, revealing that during the initial stages of cavitation, high vorticity primarily occurs in the blade exit region and the blade-free zone between the moving guide vanes. As cavitation intensifies, the scale of the high-intensity vortices in the blade-free zone increases, and the number of vortices in the impeller flow field also rises, resembling the vortex structure distribution depicted in
Figure 9, thereby accurately identifying the vortex structures. Furthermore,
Figure 11a also displays the entropy generation distribution, which upon comparison is predominantly concentrated in the vortex regions. Consequently, the cavitation vortices in the low-flow operating conditions of the pump turbine are identified as the primary cause of energy loss.
4.3. POD Analysis of Vorticity Field
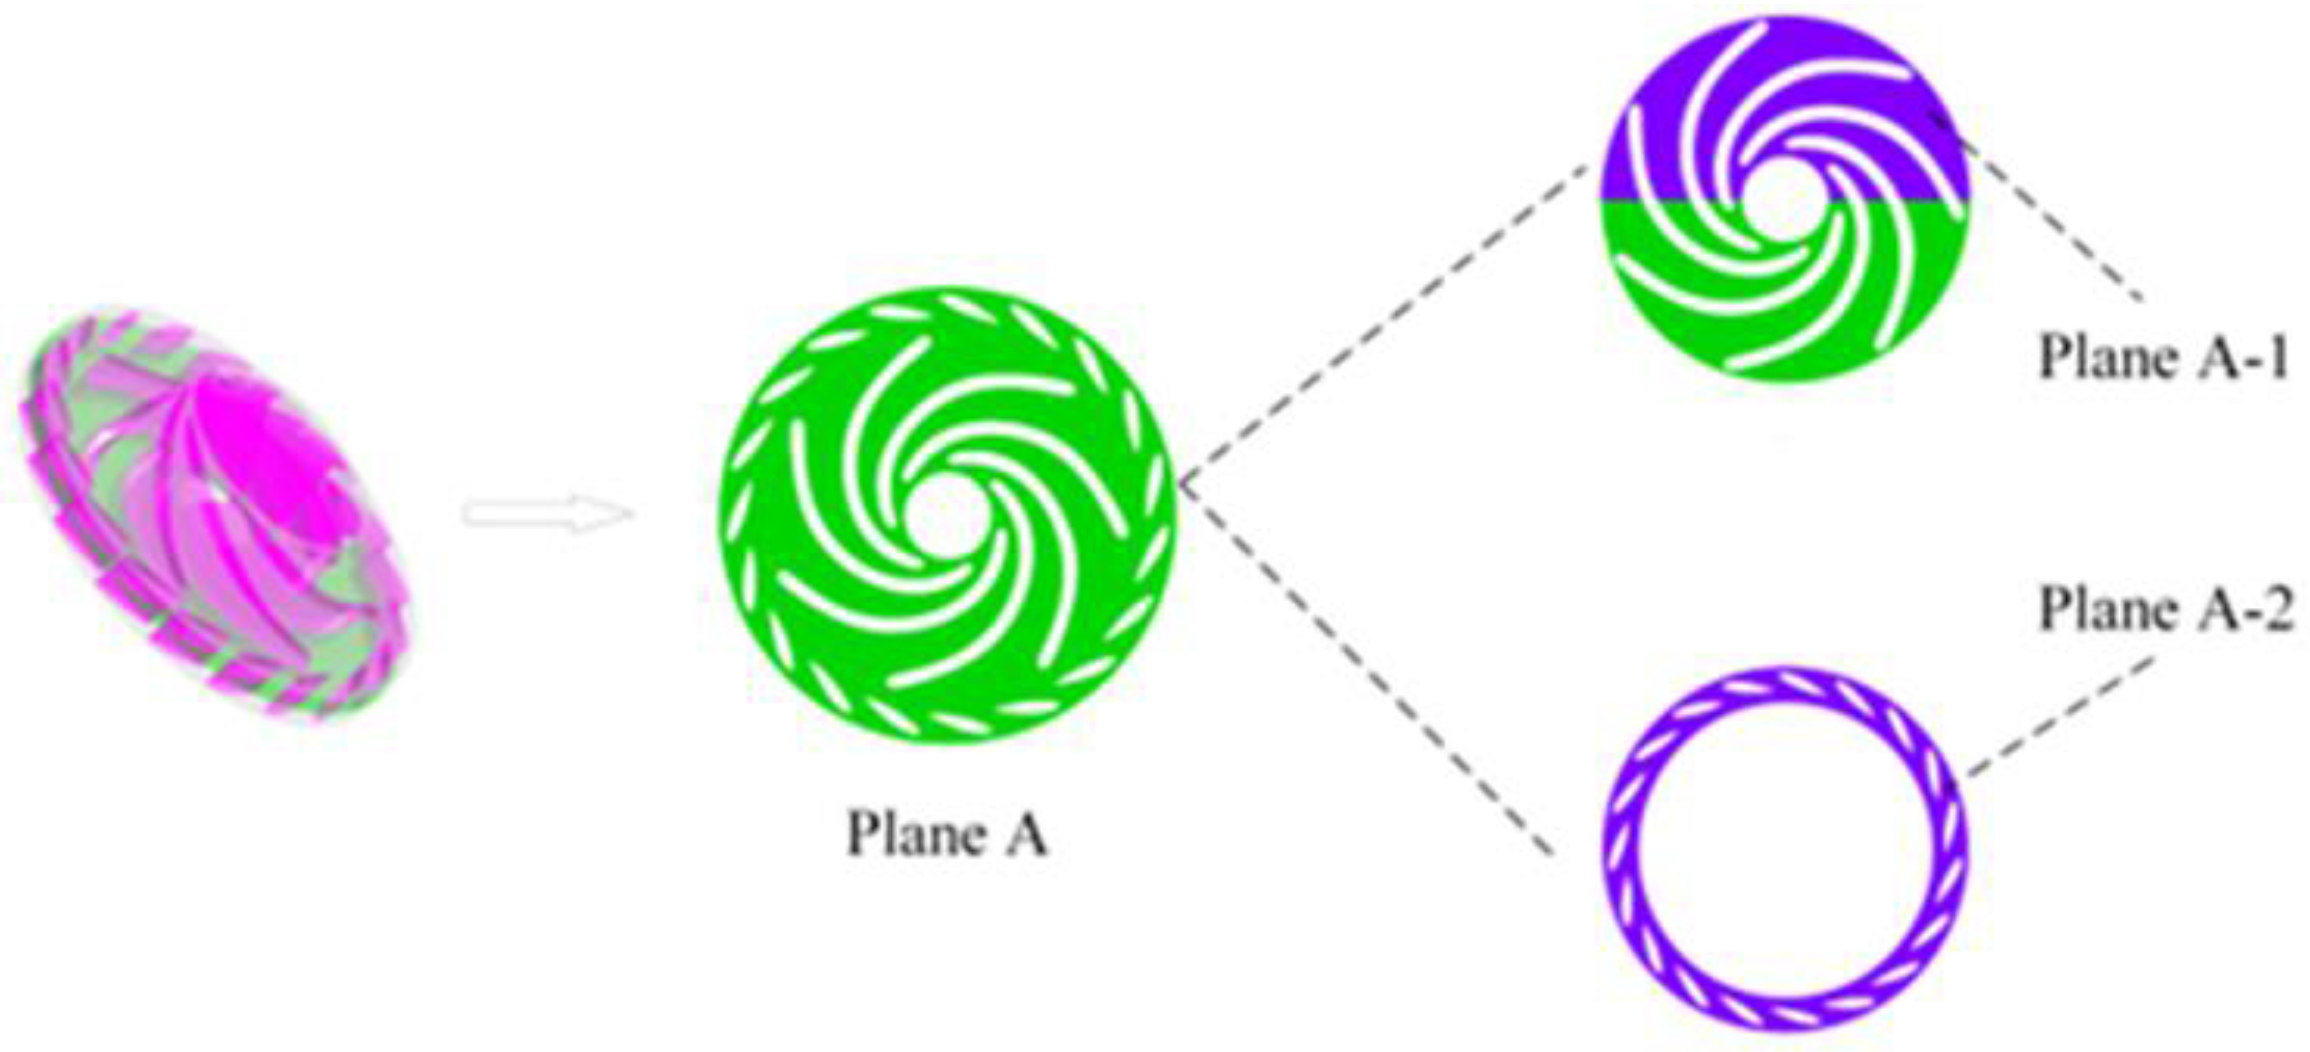
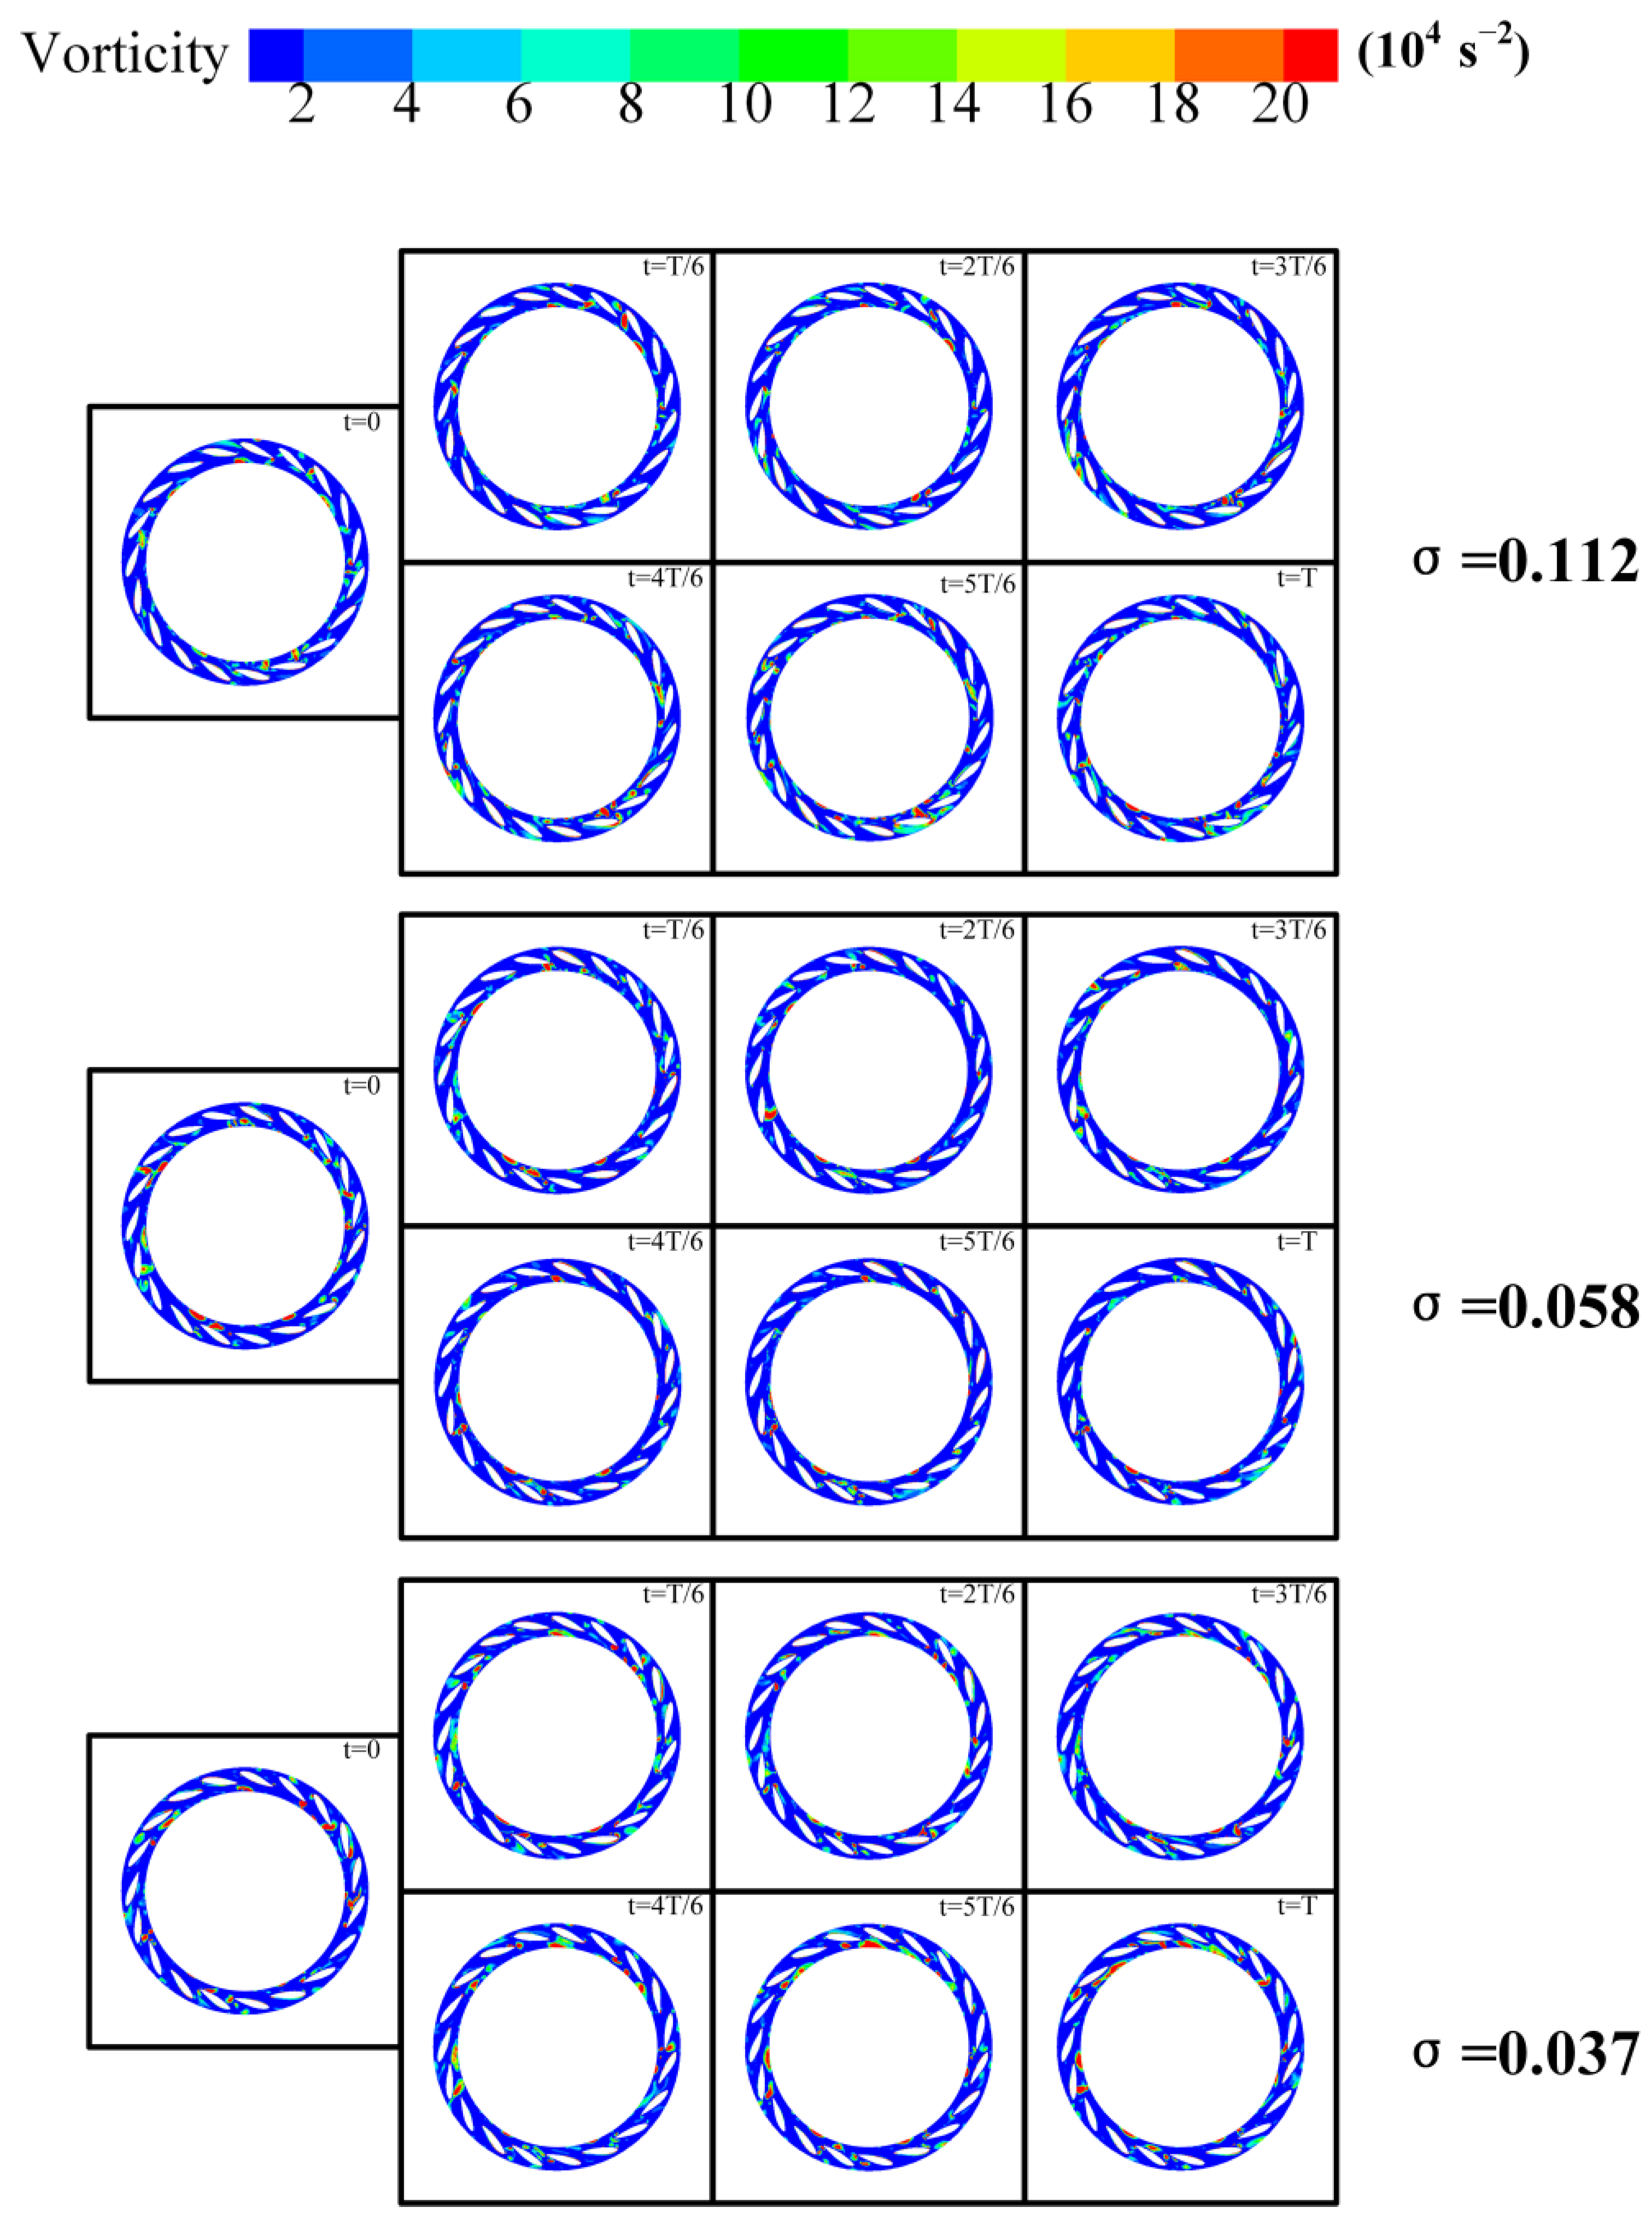
To investigate the evolution of vortices,
Figure 12 illustrates the vortex evolution of the flow field at Plane A-1 over one rotation period under various cavitation conditions. When σ is 0.112, the changes in the blade tip vortex during one cycle are minimal, indicating that this cavitation condition primarily governs the vortex distribution in the impeller region. At the impeller outlet, vortices resulting from the shedding of the blade tip are present, with an evolution period approximately equal to one rotation period T. As the cavitation coefficient decreases to σ = 0.058, Plane A-1 generates vortices with consistent evolution periods at the same location. However, due to the development of cavitation, the intensity of these vortices is significantly higher than during the initial stages of cavitation. Additionally, other flow passages exhibit vortices of varying sizes that lack a clear evolutionary pattern. With the further reduction in the cavitation coefficient to σ = 0.058, cavitation becomes fully developed, resulting in a substantial presence of vortices with unstable evolution periods throughout the entire rotation cycle at Plane A-1.
Figure 13 illustrates the evolution of vortices in the flow field of Plane A-2 over a single rotation period under various cavitation conditions. It is observed that large-scale vortices are predominantly located in the blade-free region and the trailing edge of the movable guide vanes. At the onset of cavitation, large-scale vortices are present in the blade-free area. As cavitation progresses, its influence on the flow field intensifies, leading to an expansion in vortex size in the blade-free region of Plane A-2, an increase in the number of vortex structures, and the emergence of small-scale, low-intensity vortices with varying periodicity.
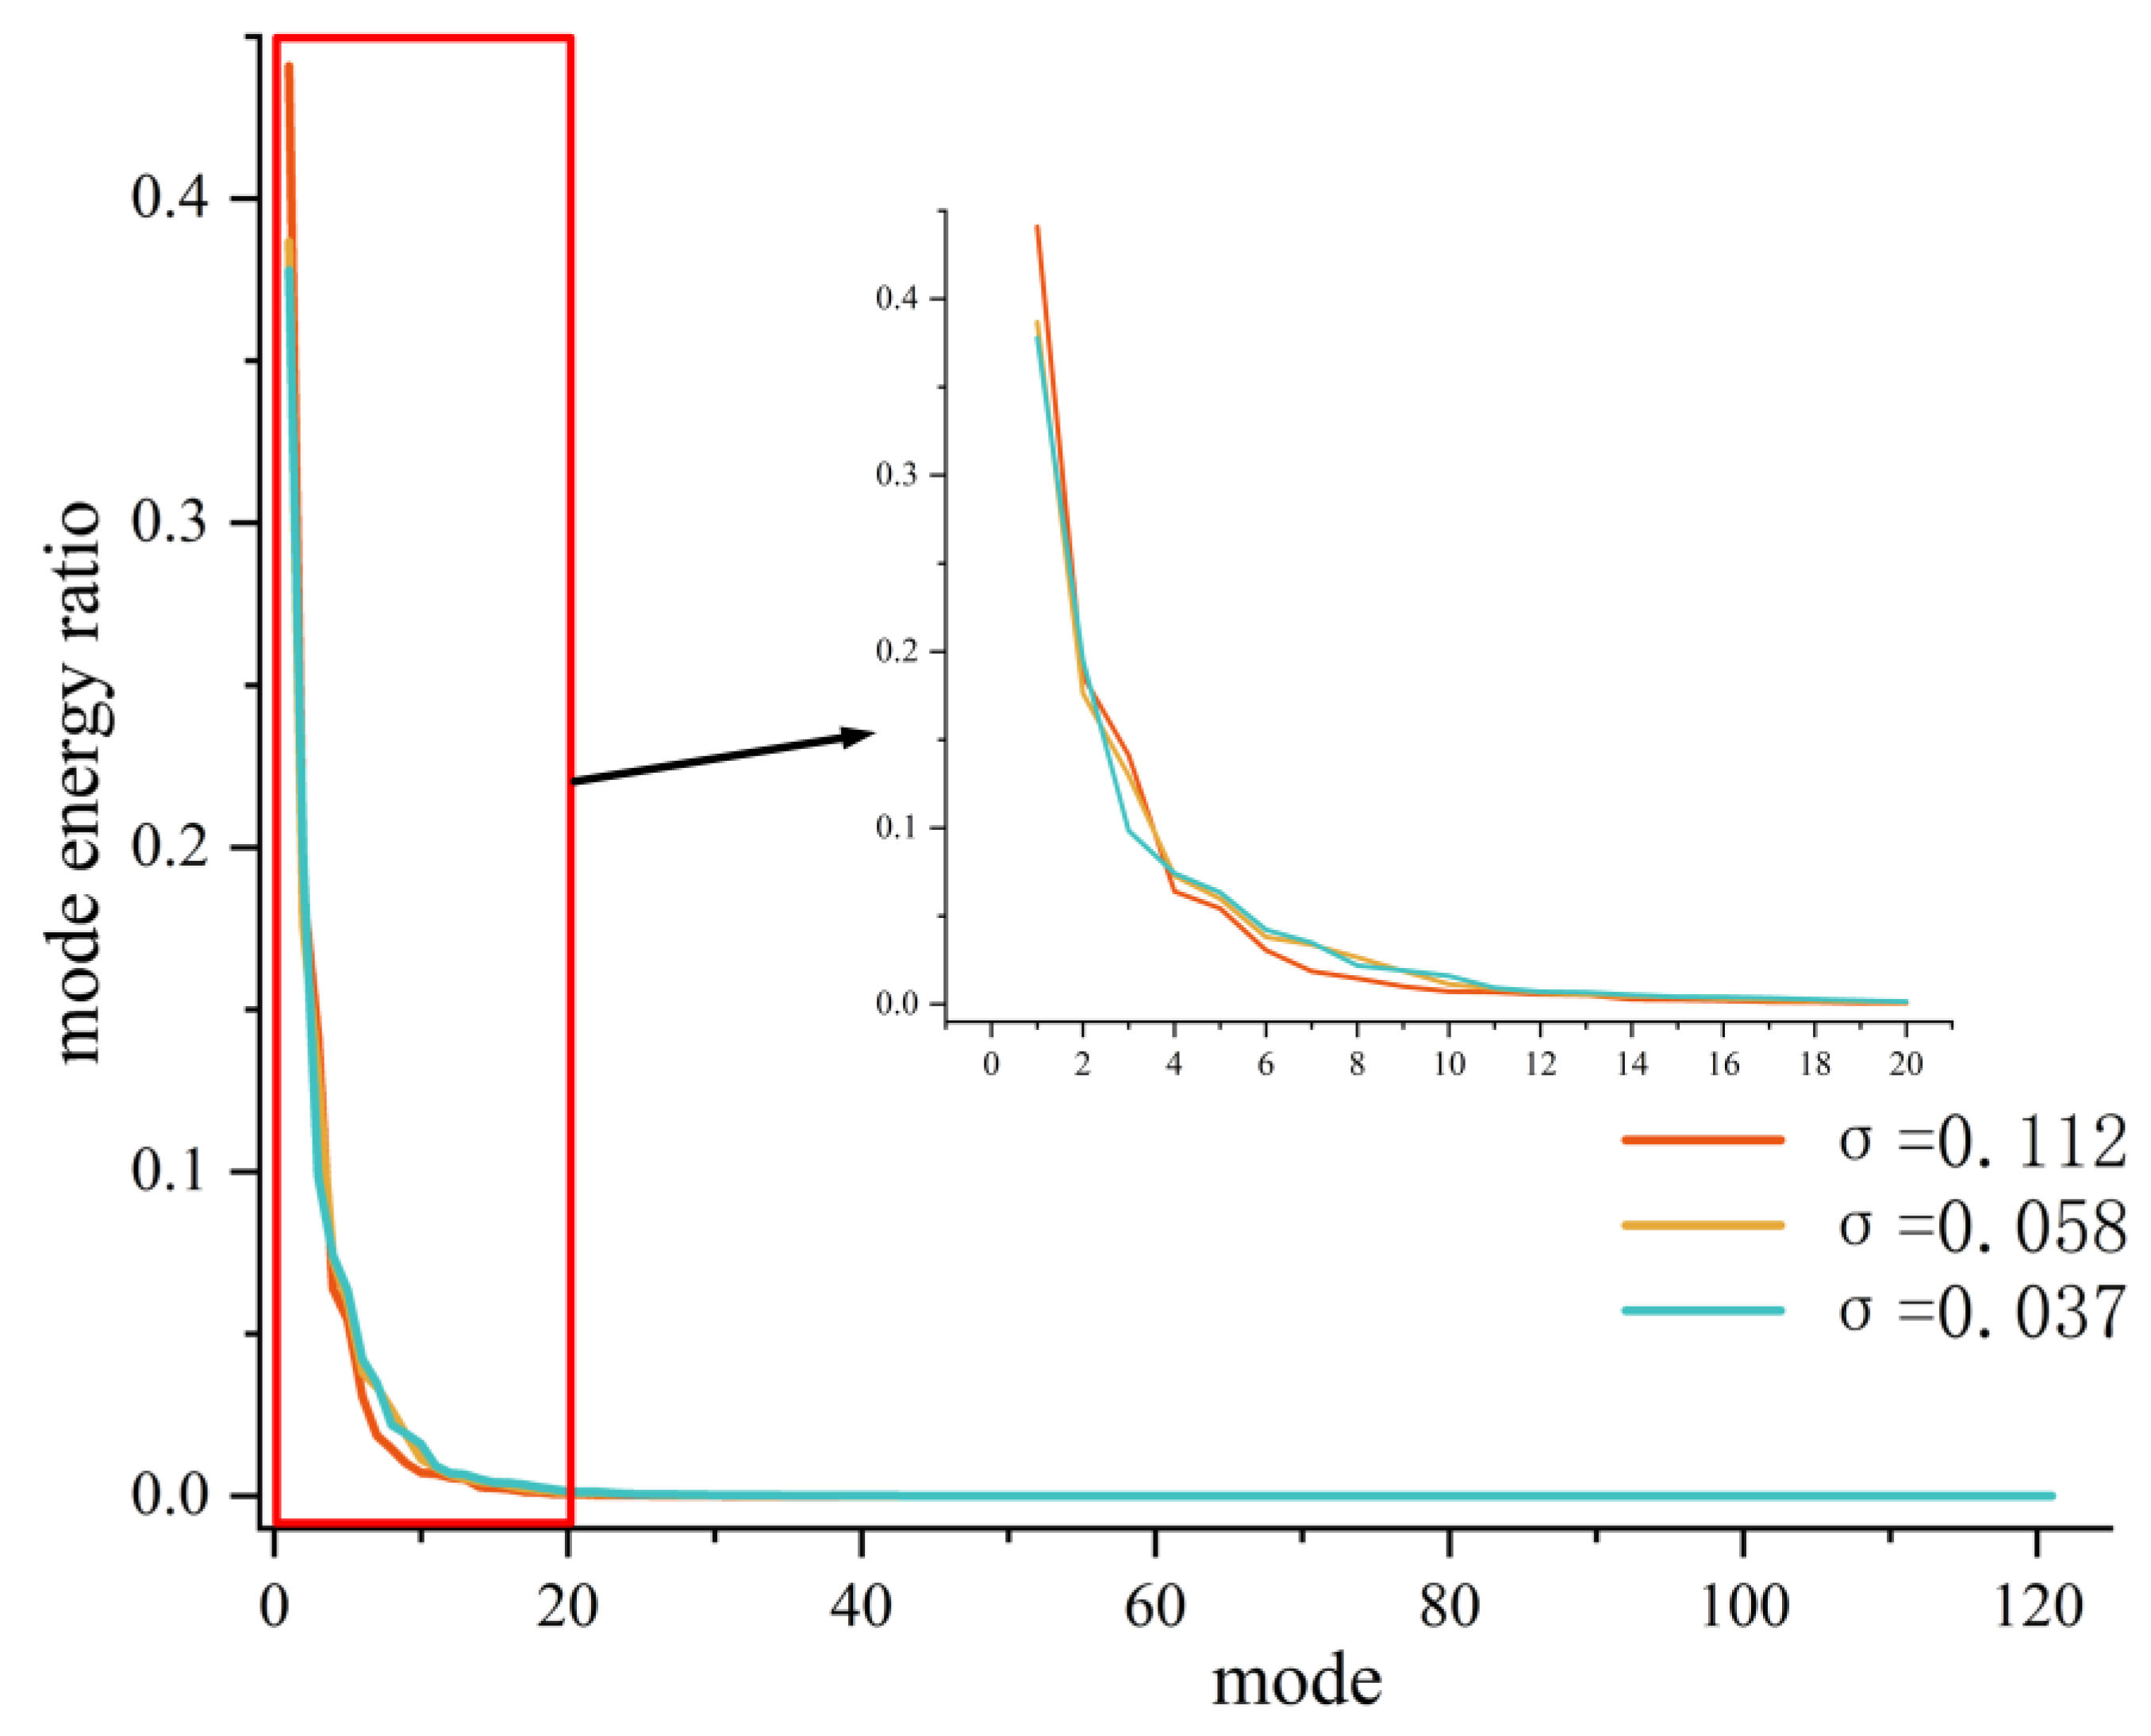
The instability of cavitation vortex structures leads to variability in the duration of vortex evolution cycles, making it challenging to observe the periodicity of these cycles. To address this, POD was employed to perform dimensionality reduction on snapshots of the vorticity field in a low-flow condition over two rotation periods. This approach allowed for the extraction of the primary coherent vortex structures on Plane A based on the energy contributions of the various mode orders.
Figure 14 illustrates the proportion of energy contained in various-order POD modes, represented as the ratio of the mode characteristic values to the sum of the eigenvalues. It is evident that the first-order mode possesses the highest energy proportion, significantly surpassing that of the second-order and higher modes, indicating that it represents the predominant coherent structures within the vorticity field. Furthermore, for modes of order greater than eight, the energy proportion falls below 1%, and this proportion decreases gradually with increasing mode order. This suggests that the corresponding mode vorticity fields are influenced by the unsteady characteristics of the flow, rendering their contributions negligible. Additionally, across different levels of cavitation, the distribution of energy proportions among the various modes remains largely consistent. Notably, the energy proportion of the first-order mode diminishes as the degree of cavitation intensifies, indicating that the progression of cavitation enhances the unsteady characteristics of the vorticity field.
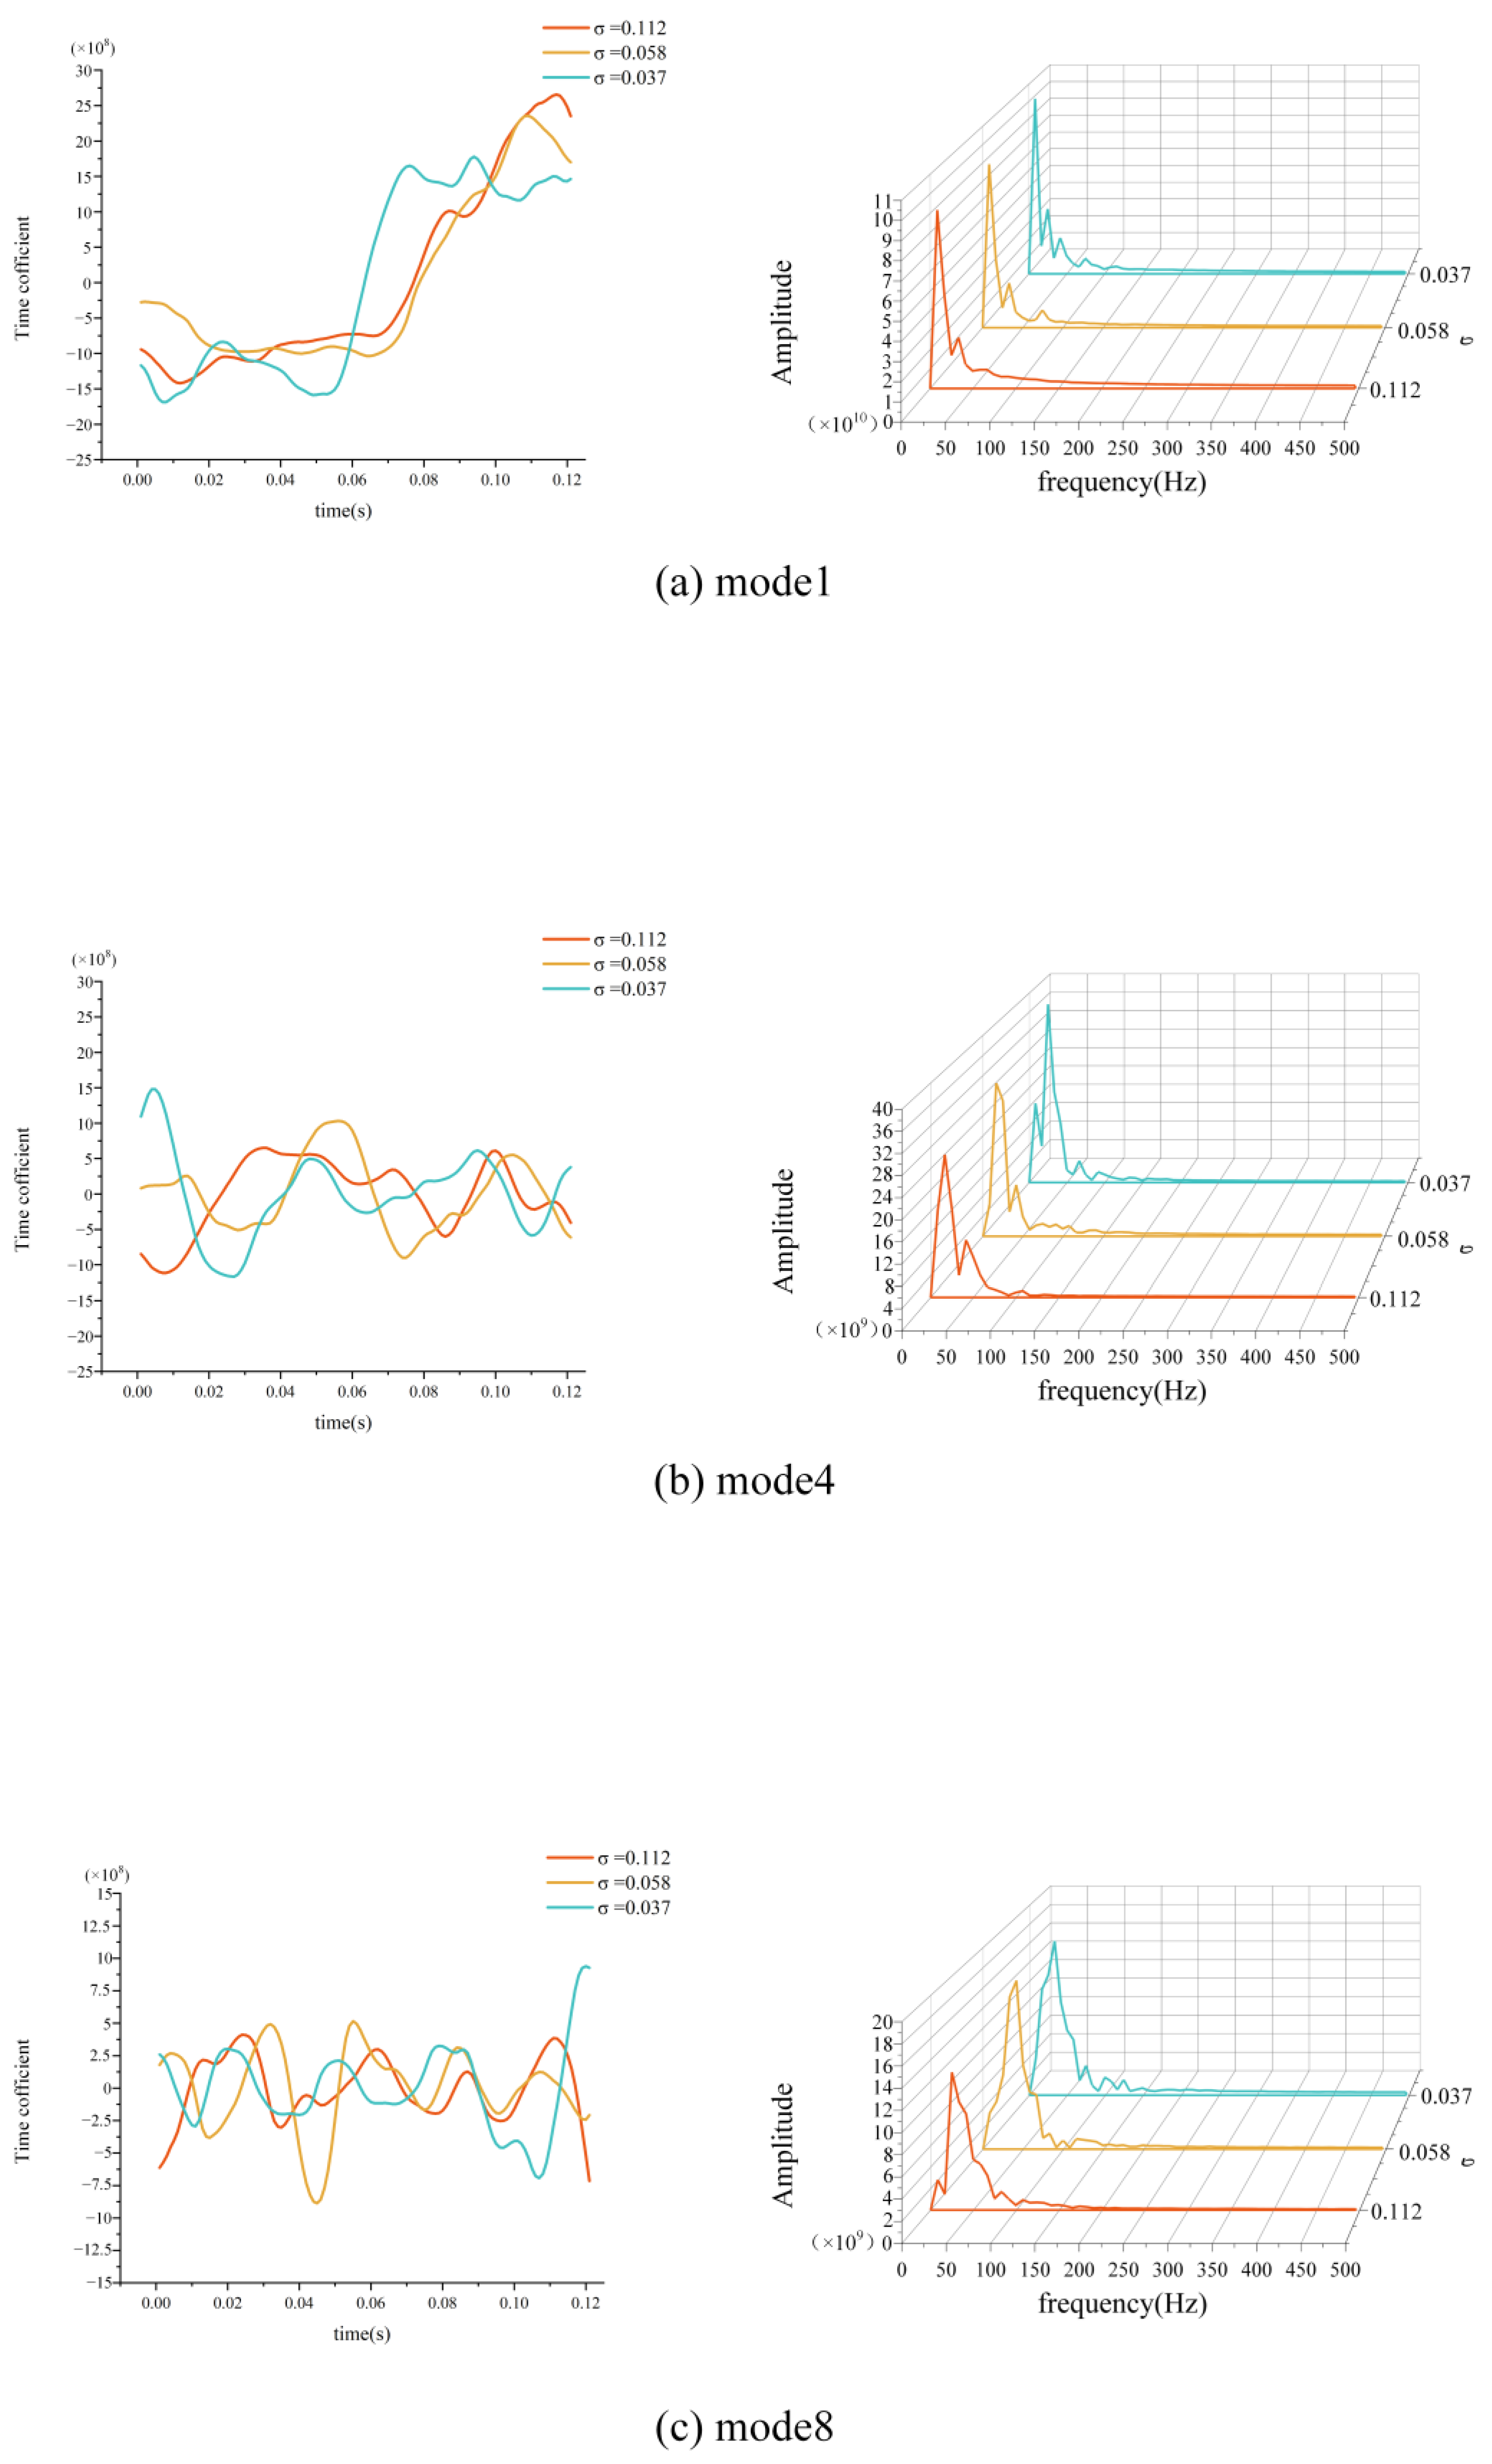
The time mode coefficients for the first, fourth, and eighth mode were subjected to a fast Fourier transform (FFT), resulting in the time evolution graphs and corresponding frequency spectra illustrated in
Figure 15a–c. In
Figure 15a, the evolution of the first-order POD mode’s time mode coefficients reveals a predominantly low frequency. This is attributed to a high energy proportion, indicating that the mode encompasses a significant amount of instability. As the instability of the cavitating flow field increases, the mode incorporates more unstable elements, leading to a chaotic evolution of the vortices. Conversely, as the mode order increases, the primary frequency in the time mode coefficients rises, while the energy proportion decreases, resulting in a reduction in the flow field information contained within the mode, thus rendering the frequency more distinct and clear.
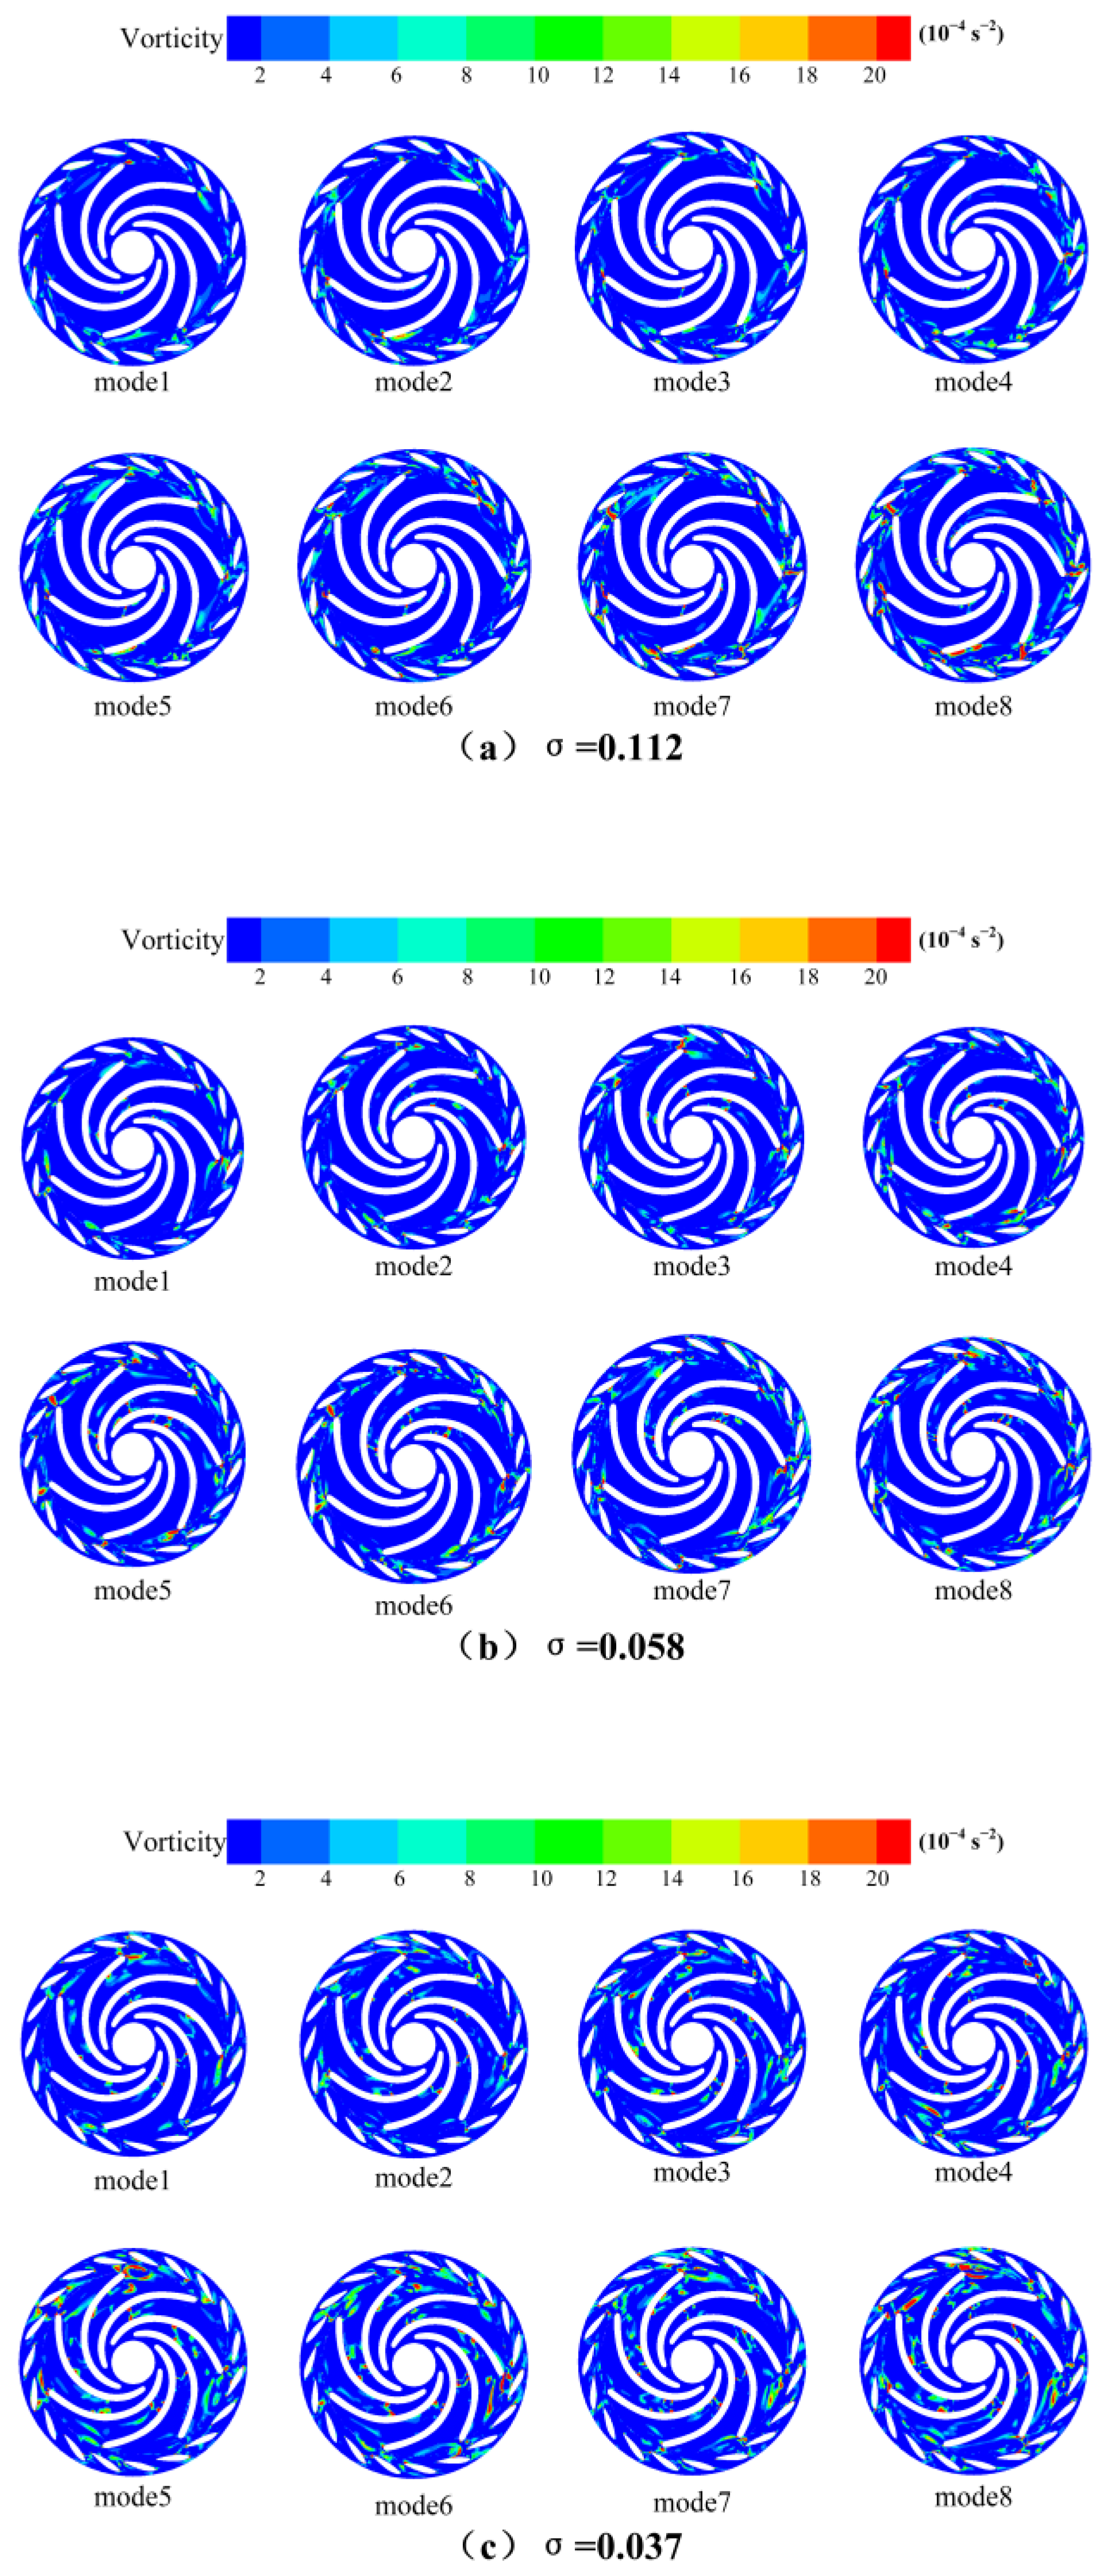
To provide a more intuitive and concrete observation of the coherent vortex structures at various cavitation levels,
Figure 16 illustrates the spatial distribution of the first eight mode shapes. When the cavitation number σ is set at 0.112, mode 1 represents the coherent vortex attached to the outlet of the impeller blades. Modes 2–6 depict the diffusion of vorticity from the blade outlet into the non-bladed region. As the mode order increases to mode 7 and mode 8, the wake vortices at the blade outlet expand, leading to dynamic interactions with the movable guide vanes. Concurrently, numerous small-scale vortices emerge in the surrounding non-bladed area, and vorticity is also generated on both the pressure and suction sides of the blades. Therefore, at a cavitation number of σ = 0.112, the wake vortices at the blade outlet are distributed across all mode orders, representing the inherent modes of the flow field. The wake vortices from the blades are identified as the primary source of energy dissipation, while the small-scale vortices in the non-bladed region predominantly appear in higher mode orders, a phenomenon attributed to the characteristics of the unsteady flow field. Although the contribution of small-scale vortices to the main flow structure is relatively minor, their high-frequency evolution significantly enhances the energy dissipation within the flow field.
As cavitation progresses, the scale of the vortices represented by mode 1 increases, leading to a greater number of vortices adhering to the blade surfaces within the rotor passage. When severe cavitation occurs, vortices that detach from the suction side of the blades are distributed across all mode orders, particularly near the rotor exit. Concurrently, smaller-scale vortices begin to transition towards lower-order modes, which possess a higher energy contribution, thereby enhancing their impact on the flow field. Consequently, with the advancement of cavitation, the vortices associated with the blade wake, as represented by the lower-order modes, increase in size and number, resulting in heightened energy losses. This phenomenon is accompanied by a reduction in the energy contribution of mode 1, while the contributions from mode 2 and higher modes to the flow field become more significant, intensifying the unsteady characteristics of the flow and accelerating energy dissipation.
4.4. DMD Analysis of Vorticity Field
The POD method primarily identifies dominant coherent structures within a flow field by arranging modes based on their energetic contributions. The modes exhibit complex frequency components, and the DMD technique is employed for dimensionality reduction and decomposition of the flow field, allowing for the extraction of coherent structures at specific characteristic frequencies. This facilitates a comparative analysis of the dynamic characteristics of evolving vortex structures across different scales.
Figure 17 illustrates the distribution of the DMD mode eigenvalues in the complex plane, where the horizontal axis represents the real part of the eigenvalues and the vertical axis represents the imaginary part. A majority of the eigenvalues cluster near the unit circle, indicating that the corresponding modes are relatively stable and represent the primary coherent structures of the vorticity field. Conversely, modes located within the unit circle are deemed unstable and do not correspond to the main vortex structures of the vorticity field. The parameters that describe the flow field information of each mode are the real parts of the spatial basis modes, with each set of conjugate eigenvalues corresponding to conjugate modes.
The mode frequencies and their corresponding correlation coefficients are illustrated in
Figure 18. The analysis was conducted by extracting mode characteristics at three specific frequencies as follows: 0 Hz, the shaft passing frequency at f
0 = 16.66 Hz, and the blade passing frequency at f
d = 116.66 Hz, based on varying wheel speeds and the number of blades.
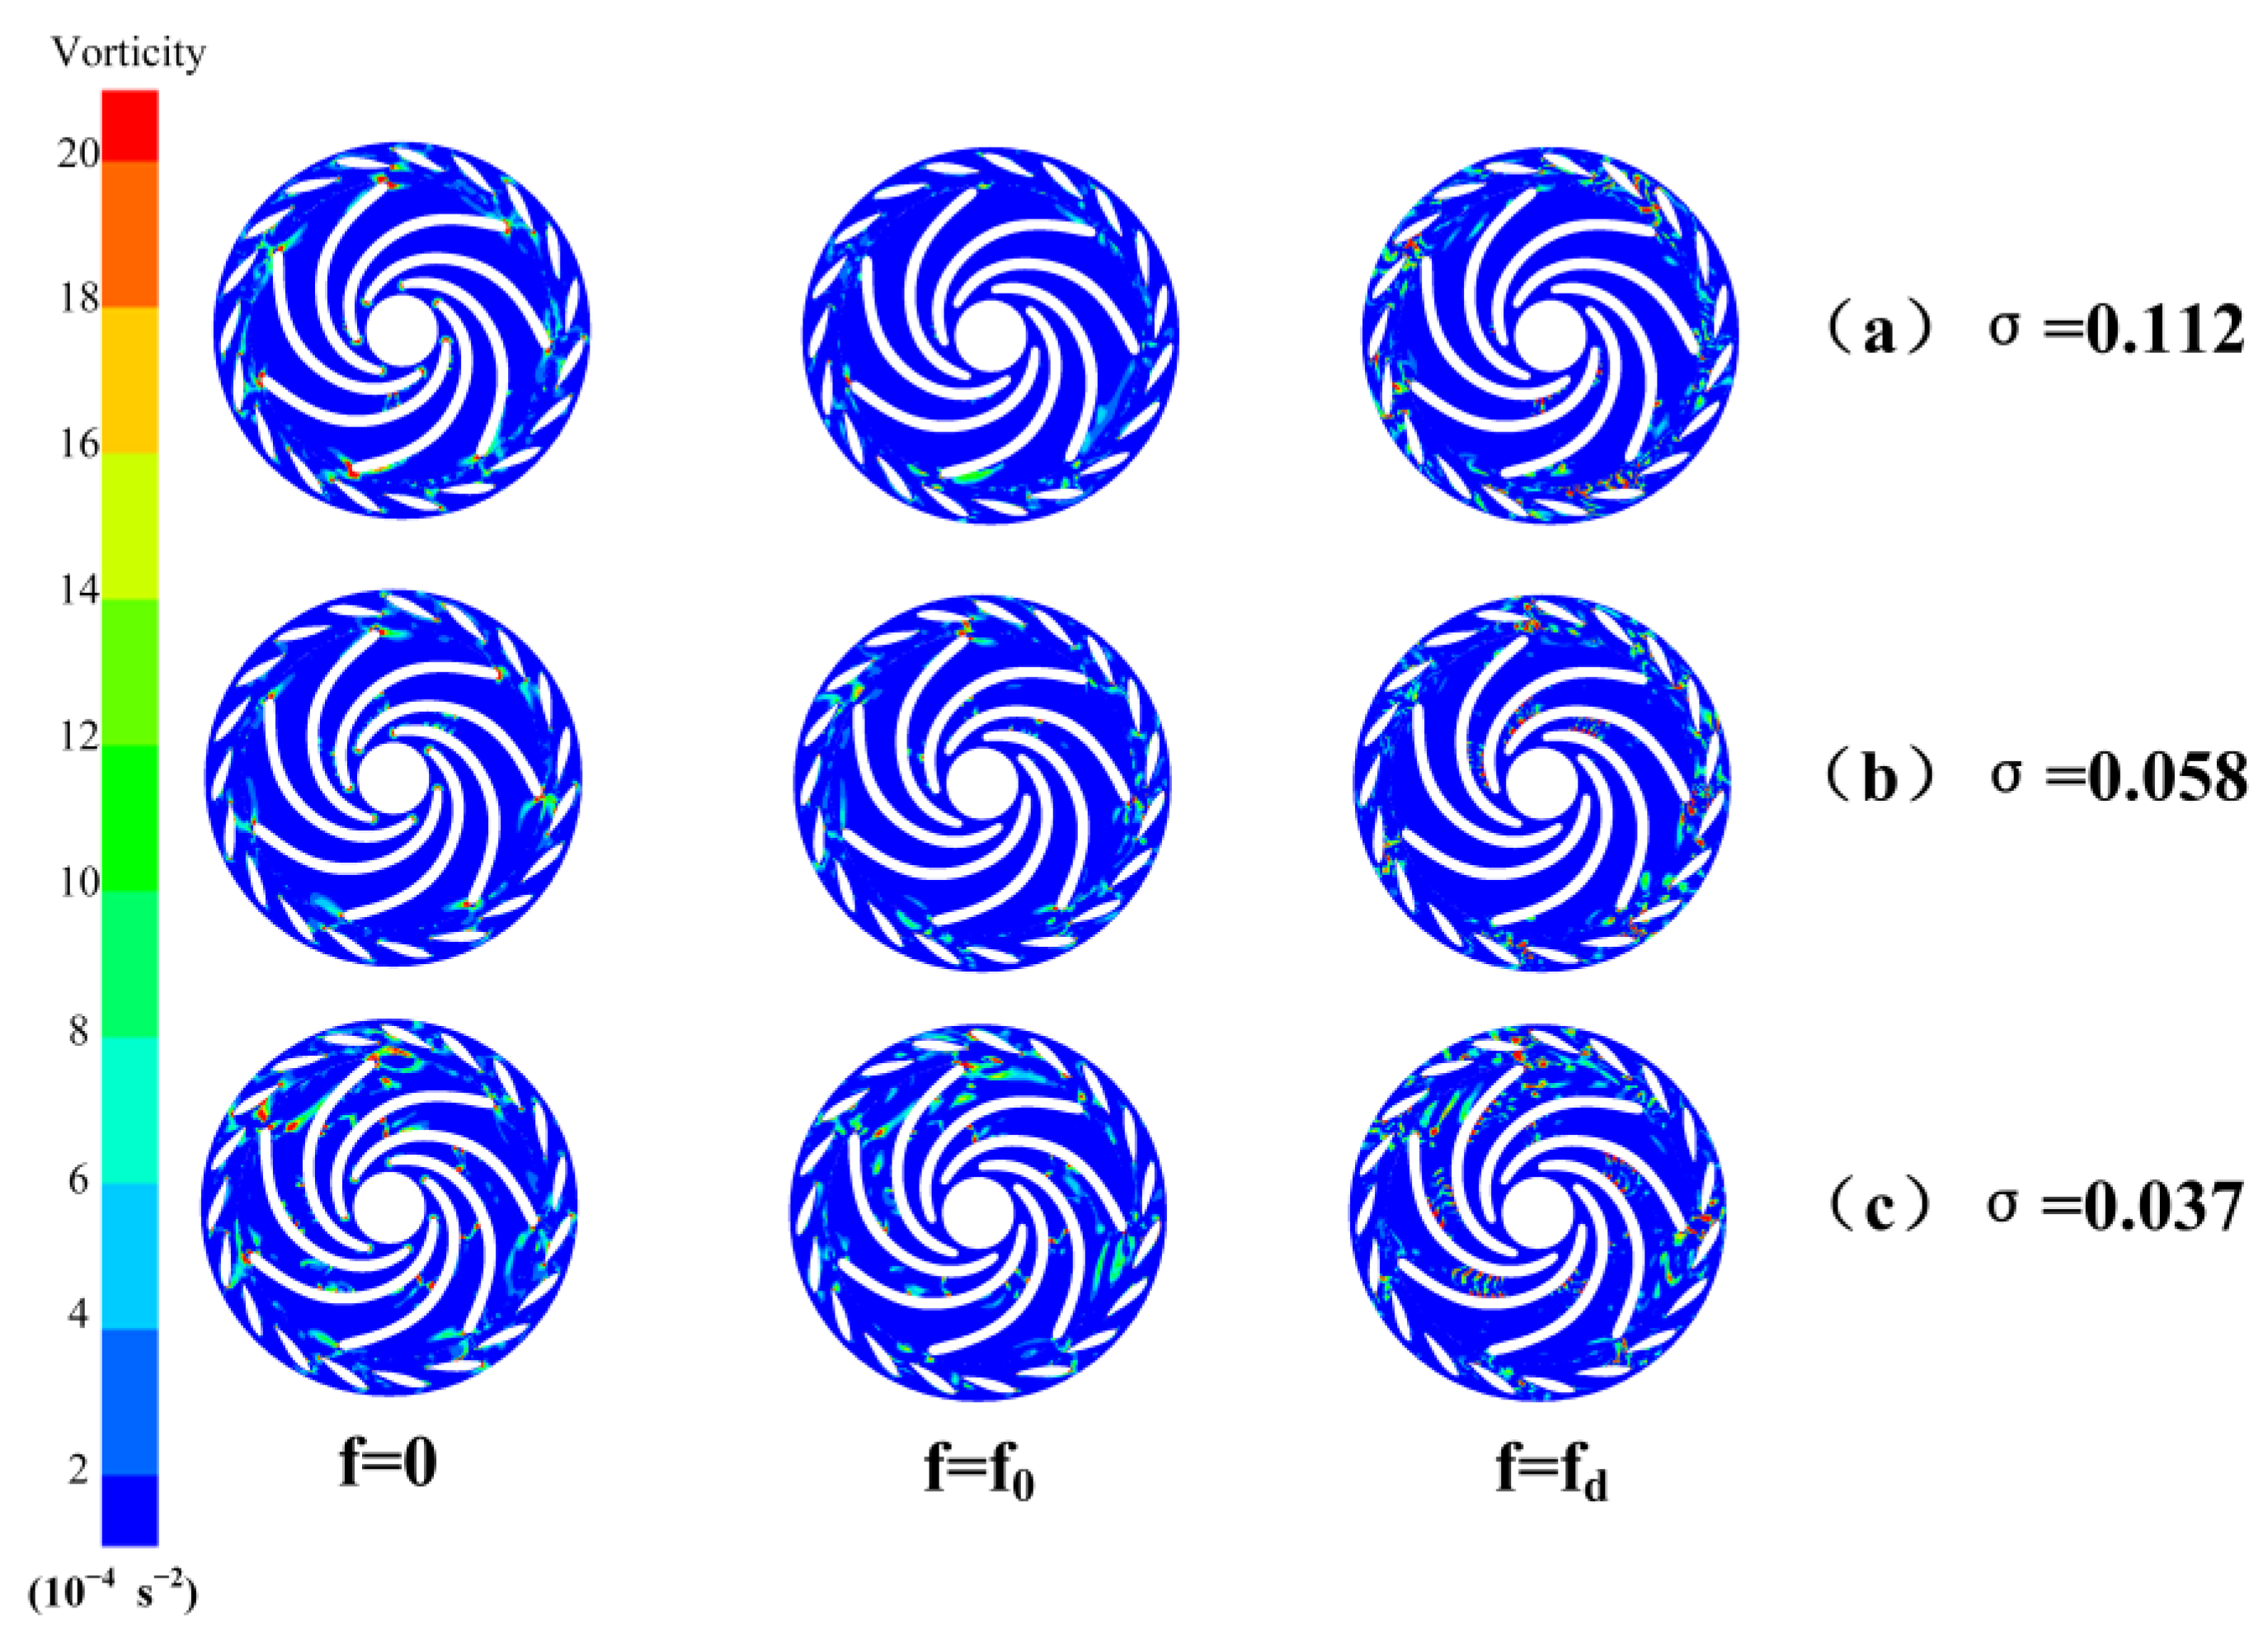
The spatial distribution and comparison of three DMD modes under various cavitation conditions are illustrated in
Figure 19. The spatial distribution of the 0 Hz frequency mode represents the dominant time-averaged flow field within the flow, highlighting the primary regions of vortex distribution. The coherent vortex locations in the f
0 and f
d frequency modes correspond to those observed in the 0 Hz frequency mode. The f
0 frequency mode predominantly showcases large-scale coherent vortices evolving at the rotational frequency of the main axis. In contrast, the f
d frequency mode depicts coherent vortices evolving at the blade passage frequency, characterized by smaller scales compared to the previous two modes. Consequently, the vortices in the cavitating flow field evolve primarily at the main axis rotational frequency, while the instability induced by cavitation also gives rise to coherent vortices evolving at higher frequencies, such as the blade passage frequency f
d. As the degree of cavitation intensifies, there is an increase in the number of small-scale vortical structures.


