Abstract
The cavitation phenomenon significantly impacts the performance of pump turbines, necessitating in-depth research on their cavitation characteristics. This study investigates the performance characteristics of a pump turbine through experimental and numerical simulation methods, with consistent results verifying the accuracy of the numerical simulations. The cavitation flow field is numerically analyzed to compare the cavitation distribution and velocity streamlines at different stages of cavitation development. The Q criterion and entropy production method are employed to identify vortex structures and energy loss regions, respectively, exploring the correlation between vortices and energy losses in the cavitation flow field under low-flow pump conditions. The results demonstrate that intensified cavitation generates more multi-scale vortices in the flow field, leading to increased entropy production and reduced energy efficiency. Proper orthogonal decomposition (POD) and dynamic mode decomposition (DMD) methods were subsequently applied to extract vorticity characteristics from transient cavitation flow fields, revealing primary energy loss regions and elucidating the evolution and distribution patterns of vortices. The POD analysis shows that low-order modes represent dominant vortex structures, while intensified cavitation increases both the quantity of vortices and their complexity in scale, distribution, and evolutionary frequency. The DMD results further indicate distinct evolutionary patterns for vortices of different scales. This research provides insights into the instability characteristics of cavitation flow fields in pump turbines under low-flow pump conditions and offers theoretical support for optimizing the design of pump turbines to expand their high-efficiency operational range.
1. Introduction
To mitigate the global reliance on fossil fuels, reduce carbon emissions, and improve ecological sustainability, renewable energy sources, such as wind and solar power, have garnered significant attention. These alternatives are expected to gradually replace thermal power generation in electrical grids, emerging as primary energy suppliers. However, wind and solar energy exhibit inherent intermittency and stochastic fluctuations due to seasonal variations and diurnal cycles, potentially compromising the operational stability of power systems [1,2,3]. Consequently, the increasing integration of renewable energy necessitates enhanced grid flexibility in terms of peak shaving, frequency regulation, and energy storage capabilities. Compared with other energy storage solutions, pumped storage hydropower plants demonstrate superior technological maturity, operational stability, and scalability for large-scale deployment. This positions pumped storage hydropower stations as the most viable regulating power source for novel power systems, capable of optimizing energy portfolios while ensuring grid resilience [4,5,6].
The efficient and stable operation of the pump turbine, as a critical component of pumped storage power stations, is essential for ensuring the safe and effective functioning of the facility. With advancements in the hydropower sector, pumped storage power stations are increasingly evolving towards high-head and high-speed operations, resulting in frequent occurrences of cavitation phenomena affecting the units. Numerous studies have indicated that cavitation has a more significant impact on the operational conditions of pumps than on those of turbines. The cavitation performance of pump turbines under pump conditions is deemed more critical than under turbine conditions [7,8,9]; consequently, it is essential to conduct in-depth research on the cavitation flow field specific to pump turbines operating in pump mode. Li et al. [10] employed numerical simulation techniques to investigate the cavitation characteristics of pump turbine runners in high-head regions under varying flow rates and heads for both pump and turbine conditions. Zhang et al. [9] conducted a study on the cavitation flow field and performance of pump turbine operating conditions, determining the critical cavitation bubble volume fraction; their findings indicated that varying flow rates influence the location of bubble formation at the inlet. Tao et al. [8] conducted a study on the cavitation behavior of pump turbines under various operating conditions; the research compared the inception and critical cavitation points across different scenarios, concluding that utilizing an initial cavitation standard allows for a more timely detection of cavitation bubbles, thereby facilitating the early mitigation of cavitation phenomena.
Cavitation can also lead to adverse phenomena such as vibrations and noise within the machinery, which may result in a reduction in mechanical lifespan, a decrease in maintenance intervals, and an increase in the frequency of unit startups and shutdowns, ultimately affecting the stability of the power station. Hao et al. [11] conducted a study on the impact of different impeller tip clearances in the cavitating flow field of mixed-flow pumps operating under pump conditions, specifically focusing on the radial forces acting on the shaft in pumped storage units. The findings indicate that when the apex gap is asymmetrical, the cavitation performance is at its lowest. In this scenario, the amplitude of the radial force increases with the intensification of cavitation and, due to the asymmetric distribution of the cavitation region, the direction of the radial force also varies as cavitation worsens. Liu et al. [7] examined the impact of cavitation on the radial forces experienced by water pump turbines under pumping conditions. Their study revealed that the number of cavitation bubbles on the blade surfaces increased as cavitation intensified, resulting in a reduction in blade load and a decrease in the regularity of pressure fluctuations. This led to a significant alternation in radial forces, contributing to the emergence of fatigue cracks in high-stress areas of the blades. However, due to the periodic symmetrical structure of the guide vanes and the runner, the distribution of radial forces remained relatively uniform.
The unsteady flow structures induced by internal cavitation are one of the critical factors leading to adverse phenomena such as structural vibrations and noise in the unit, as well as significant performance degradation. Meng et al. [12] investigated the dynamic characteristics of cavitation-induced vortices in centrifugal pumps based on the vorticity transport method, revealing that vortex structures form at the trailing edge of cavitation regions in flow channels during severe cavitation stages. Wu et al. [13] employed numerical simulations to analyze two-dimensional vortex structures on cross-sections through velocity component analysis and extracted vorticity on pump blade surfaces using the new omega vortex identification method proposed by Zhang et al. [14]. The results demonstrated that as the net positive suction head decreases, the vapor volume expands, leading to flow field disorder and localized vortex formation. These vortices detach from the blade surfaces as cavitation cavities roll up, with the vorticity transport method effectively capturing large-scale high-vorticity regions. Ruan et al. [15] investigated the cavitation characteristics of pump turbines under various flow conditions in pump mode. The findings indicated that under low-flow conditions, intense cavitation on the suction side of the blade trailing edge induces flow separation, disrupting the flow field structure and generating large-scale flow separation and vortex structures, resulting in a significant reduction in pump turbine efficiency.
The decline in unit performance and efficiency is attributed to increased internal energy dissipation. To identify the distribution and magnitude of energy dissipation regions, Gong et al. [16] pioneered the application of entropy production theory to flow field analysis. Li et al. [17] utilized this theory to investigate energy loss characteristics in pump turbines operating within the hump region under pump mode. Yu et al. [18] further explored energy dissipation in cavitating flows within micro-pumps using the entropy production method, establishing correlations among cavitation, vorticity, and entropy production. Their results revealed that during cavitation development, mass exchange between gas and liquid phases and momentum transfer between fluids contribute significantly to hydraulic losses.
Traditional methods have difficulty in capturing the dominant features of unsteady flow fields. Therefore, to effectively process complex flow field data, many reduced-order models have been proposed by researchers in recent years. The most commonly used methods are proper orthogonal decomposition (POD) [19] and dynamic mode decomposition (DMD) [20].
The POD (proper orthogonal decomposition) method decomposes complex flow fields into a series of spatial orthogonal modes, ranking them based on their energy content (i.e., their eigenvalues) to emphasize the dominant flow structures. Due to its ability to accurately capture coherent structures within the flow field and significantly simplify the analysis, POD has been widely applied in flow field studies. For instance, Lu et al. [21] utilized the POD method to decompose and reconstruct the flow field in the tongue region of a centrifugal pump, establishing the relationship between pressure fluctuations and the dominant flow structures. Yang et al. [22,23] employed the POD method to investigate the evolution frequency of the stall region in the flow field of the guide vane when the pump operates in the hump region.
In contrast to the POD method, the DMD technique allows for the decomposition of the flow field into a series of distinct frequency modes, thereby facilitating the observation of flow structures evolving at various frequencies. Xie et al. [24] employed the DMD method to analyze the velocity field of the cavitating flow around a hydrofoil, finding that the frequency of the second mode matched the bubble shedding frequency, while the frequencies of the third and fourth modes were harmonics of the second mode. For rotating fluid machinery, Lu et al. [25] utilized a wavelet transform to analyze pressure fluctuation data at the inlet and outlet of a centrifugal pump and combined this with numerical simulations to decompose the internal flow field data using DMD. The results indicated the presence of complex pressure fluctuation characteristics within the centrifugal pump, dominated by different frequencies.
To date, few studies have combined two mode decomposition methods and analyzed the unsteady cavitation characteristics of the flow field in the runner and guide vanes of a pump turbine under low-flow conditions. In this study, the POD method and the DMD method are combined to study the unsteady characteristics of vortices under different cavitation conditions in the low-flow pump operation of a pump turbine. The results of the two mode decomposition methods are compared and verified to gain a deeper understanding of the unsteady characteristics of the cavitation flow field.
2. Research Object
2.1. Pump Turbine Parameters
This study focuses on a model of a pump turbine, as illustrated in Figure 1a. The unit primarily consists of several flow components, including the volute, fixed guide vanes, movable guide vanes, a runner, and a draft tube. A schematic representation of the meridional flow surface is provided in Figure 1b. Specific parameters of the unit, such as the runner speed, design flow rate, and design head, are detailed in Table 1.
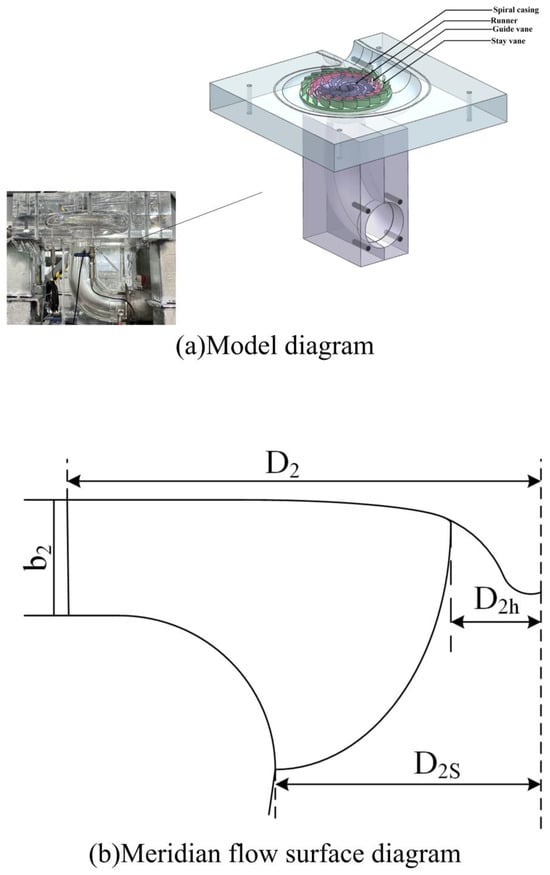
Figure 1.
Model pump turbine structure diagram.

Table 1.
Model parameter.
2.2. Experimental Method
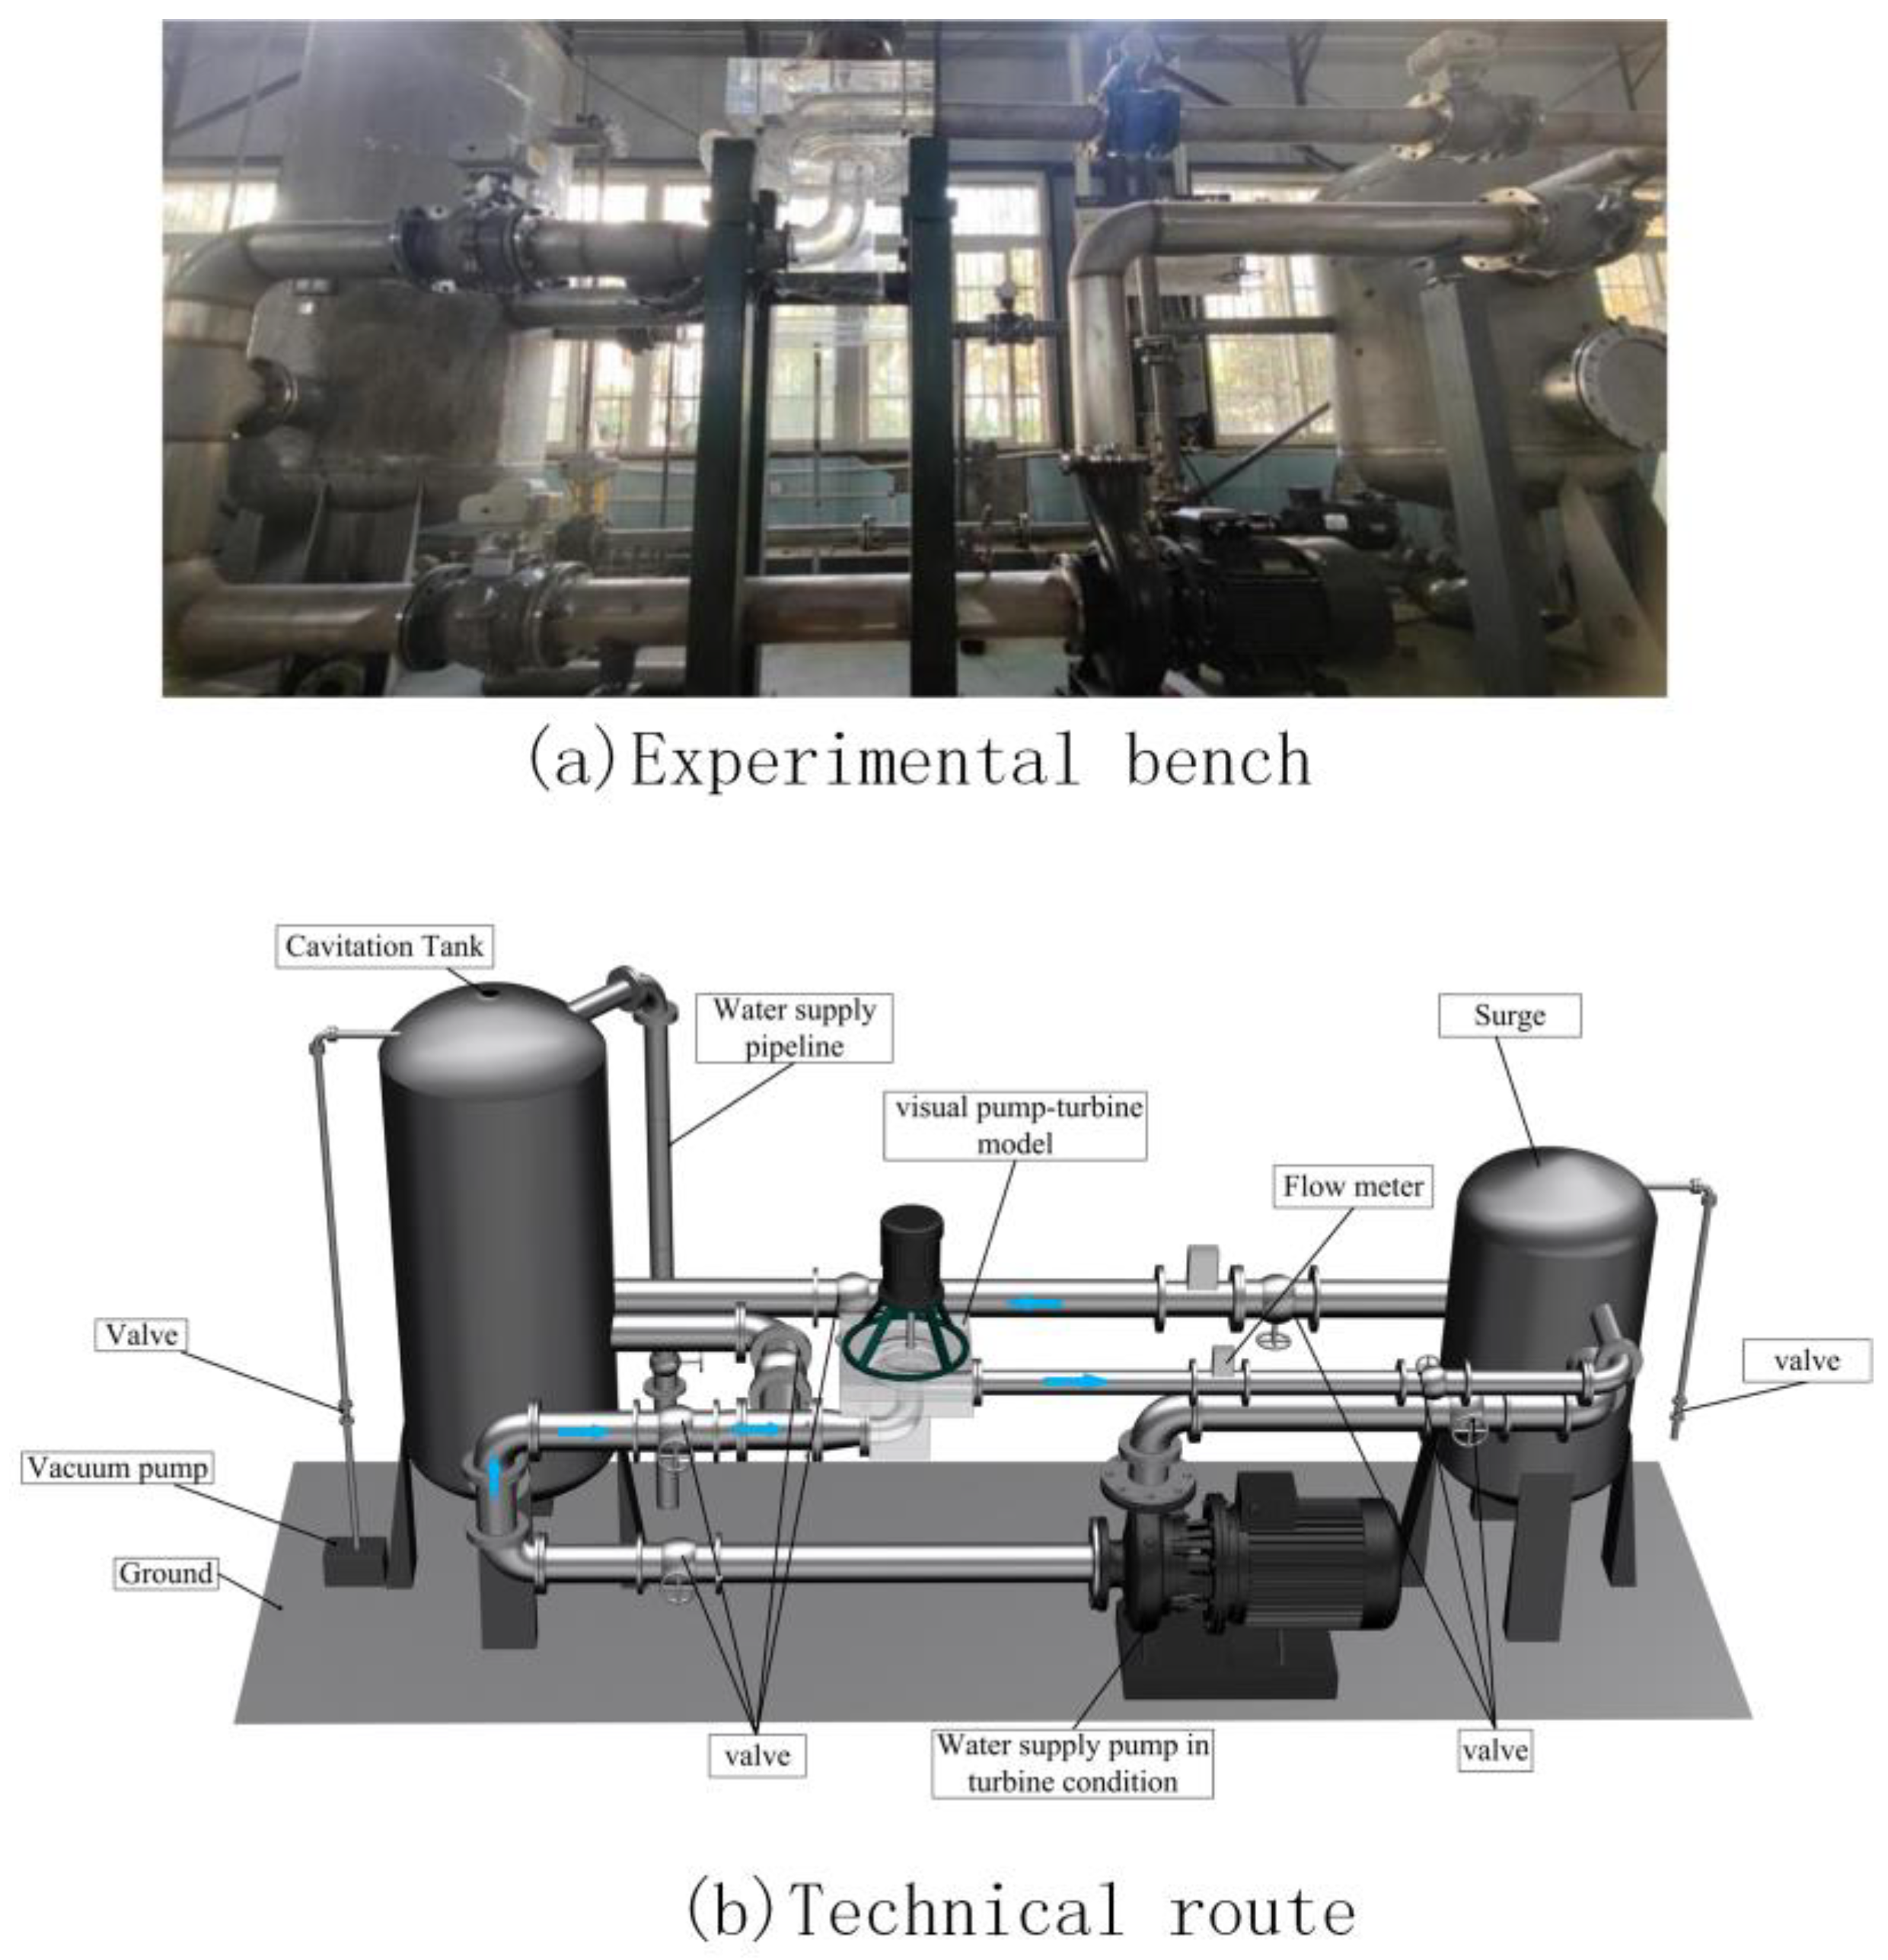
The experiment was conducted on a closed-loop water pump turbine test rig, as illustrated in Figure 2. The experimental setup included force sensors, data acquisition instruments, and solenoid valves. Pressure gauges were installed at the inlet and outlet of the water pump turbine unit to measure pressure, allowing for the calculation of the pressure differential across the pump turbine. Additionally, a flow meter was utilized to determine the flow rate within the system.
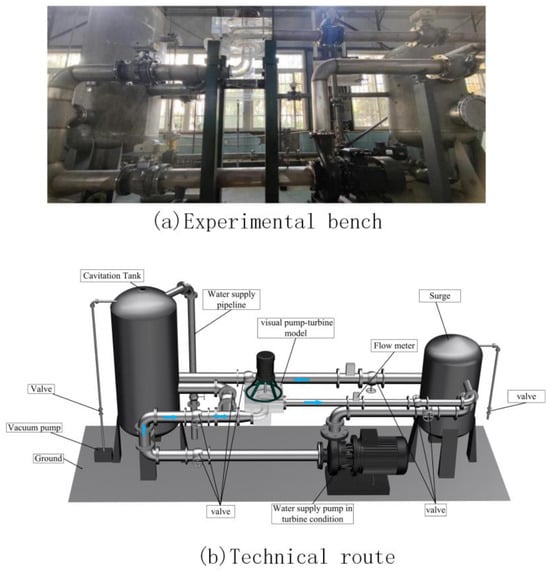
Figure 2.
Experimental technology roadmap.
The specific experimental procedure is described as follows: (1) close the valves on the inlet and outlet pipelines of the water supply pump while simultaneously opening the valves on the inlet and outlet pipelines under pump operation, as well as the return water valve. (2) Verify the opening and closing status of the relevant valves during the experiment and ensure that the system is sealed. (3) Fill the left-side cavitation tank with water to a level that submerges the turbine runner; then, activate the motor. Next, fill the right-side pressure tank with water. Once the right-side pressure tank is full, close its valve. (4) Release any air trapped in the system through the valve of the left-side cavitation tank and adjust the valve on the return water line to its maximum opening. (5) Collect data from the flow meter and pressure gauge. (6) Gradually reduce the valve opening. (7) After the flow meter data stabilizes, repeat steps (5) and (6) until all data have been collected.
3. Numerical Simulation Methods
3.1. Numerical Simulation Setup
Numerical simulation of the flow field was conducted using the ANSYS Fluent 2020 R2 computational software. Figure 3 illustrates the computational domain and the grid schematic, which consists of five flow components, namely the volute, fixed guide vanes, movable guide vanes, a runner, and a tailwater pipe. The computational domain was pre-processed for grid generation using commercial software. Hexahedral mesh elements were employed for the fixed guide vanes, movable guide vanes, and tailwater pipe, while tetrahedral mesh elements were utilized for the volute and runner, as depicted in Figure 3a. To minimize computational resource expenditure while ensuring the accuracy of the results, the independence of the grid was verified by examining the head rise. As shown in Figure 3b, the increase in the head rise of the pump turbine diminishes progressively with an increase in the number of grid elements.
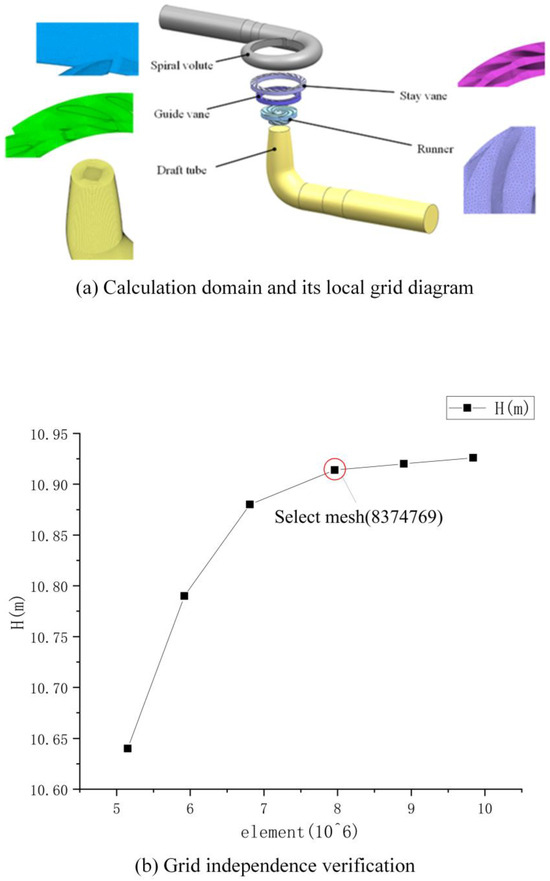
Figure 3.
Calculation model and grid diagram.
Considering the costs associated with simulation and the required computational accuracy, this study selects a grid count of 8,374,769 for the calculations. Table 2 presents the types and quantities of grid cells for each flow region.
Table 2.
Number and type of grid.
In the ANSYS Fluent 2020 R2, the rotor region is designated as a rotating area based on multiple reference frames (MRFs), while the remaining regions are classified as stationary. The inlet of the tailwater pipe is configured as a total pressure inlet, the volute outlet is set as a flow outlet, and the wall surfaces are defined as non-slip boundaries. The governing equations consist of the continuity equation, the energy conservation equation, and the momentum conservation equation. The calculations employ the RNG k-ε turbulence model, the mixture multiphase flow model, and the Schnerr–Sauer cavitation model, which is based on the Rayleigh–Plesset bubble dynamics equation. The fluid medium is specified as water and water vapor, with the saturation vapor pressure of water set at Pv = 3540 Pa and the ambient pressure at 0 Pa. A convergence criterion of a residual less than 10−5 is established. The mid-plane flow surface between the rotor and the movable guide vanes is captured as Plane A, as illustrated in Figure 4. The time step is set to one step for every 3° of rotation, totaling 120 steps for one complete rotation with a time increment of 0.0005 s. Starting from the last step of the transient calculation at the 10th rotation of the rotor, a sequence of 121 data sets, spaced by two time steps, is utilized for subsequent flow field analysis.
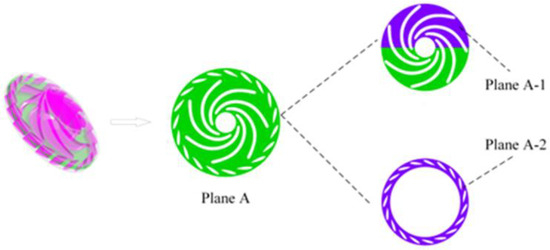
Figure 4.
Calculation plane.
3.2. Snapshot POD Method
When the number of grid nodes and elements significantly exceeds the number of sampling instances, the classic POD method can become excessively resource-intensive and time-consuming. Consequently, this study employs the snapshot POD approach proposed by Sirovich [26]. The underlying principle is as follows: a set of snapshots is formed by selecting flow field data from M grid elements at N instantaneous moments within a specified flow duration, and the time-averaged data for each grid element during this period are extracted.
By applying Equation (3) to remove the time-averaged data corresponding to each grid cell from the original flow field at each instant, the resulting data reflect the fluctuations within the flow field:
The covariance matrix is derived from the matrix formed by the fluctuating data of the flow field, followed by the calculation of the eigenvalues and corresponding eigenvectors of the covariance matrix:
The corresponding spatial basis modes and temporal mode coefficients of the POD can be derived from Equations (6) and (7):
The temporal average mode, in conjunction with a set of base modes, can reconstruct the flow field at any given moment using different order modes, as expressed in Equation (8):
3.3. DMD Method
The principle of DMD, as proposed by Schmid [20], is outlined as follows: the computational results are organized in chronological order, forming a set of snapshot matrices, as represented in Equation (9):
Let represent the i-th snapshot and N denote the total number of snapshots. It is assumed that there exists a linear mapping from the snapshot matrix to the matrix , expressed as follows:
Consequently, all subsequent snapshots can be represented using the matrix A and the vector x1, as indicated in Equation (11).
Matrix A can be defined as follows:
The matrix represents the pseudoinverse of the matrix , while the eigenvalues and eigenvectors of matrix A serve as the eigenvalues and modes in the context of DMD.
The singular value decomposition of matrix X yields matrices , , and , as indicated in Equation (13). By retaining the first r rows and r columns of these matrices, new matrices , , and are obtained. Subsequently, is computed using Equation (14).
The eigenvalues and eigenvectors of matrix are denoted as and , respectively, and the corresponding DMD modes can be derived using Equation (15):
The logarithm of the eigenvalues, when considered in relation to the time step size, has its imaginary and real components corresponding to the magnitudes of the frequencies and the growth/decay rates of the various modes in DMD.
4. Results and Discussion
4.1. Analysis of Cavitation Characteristics
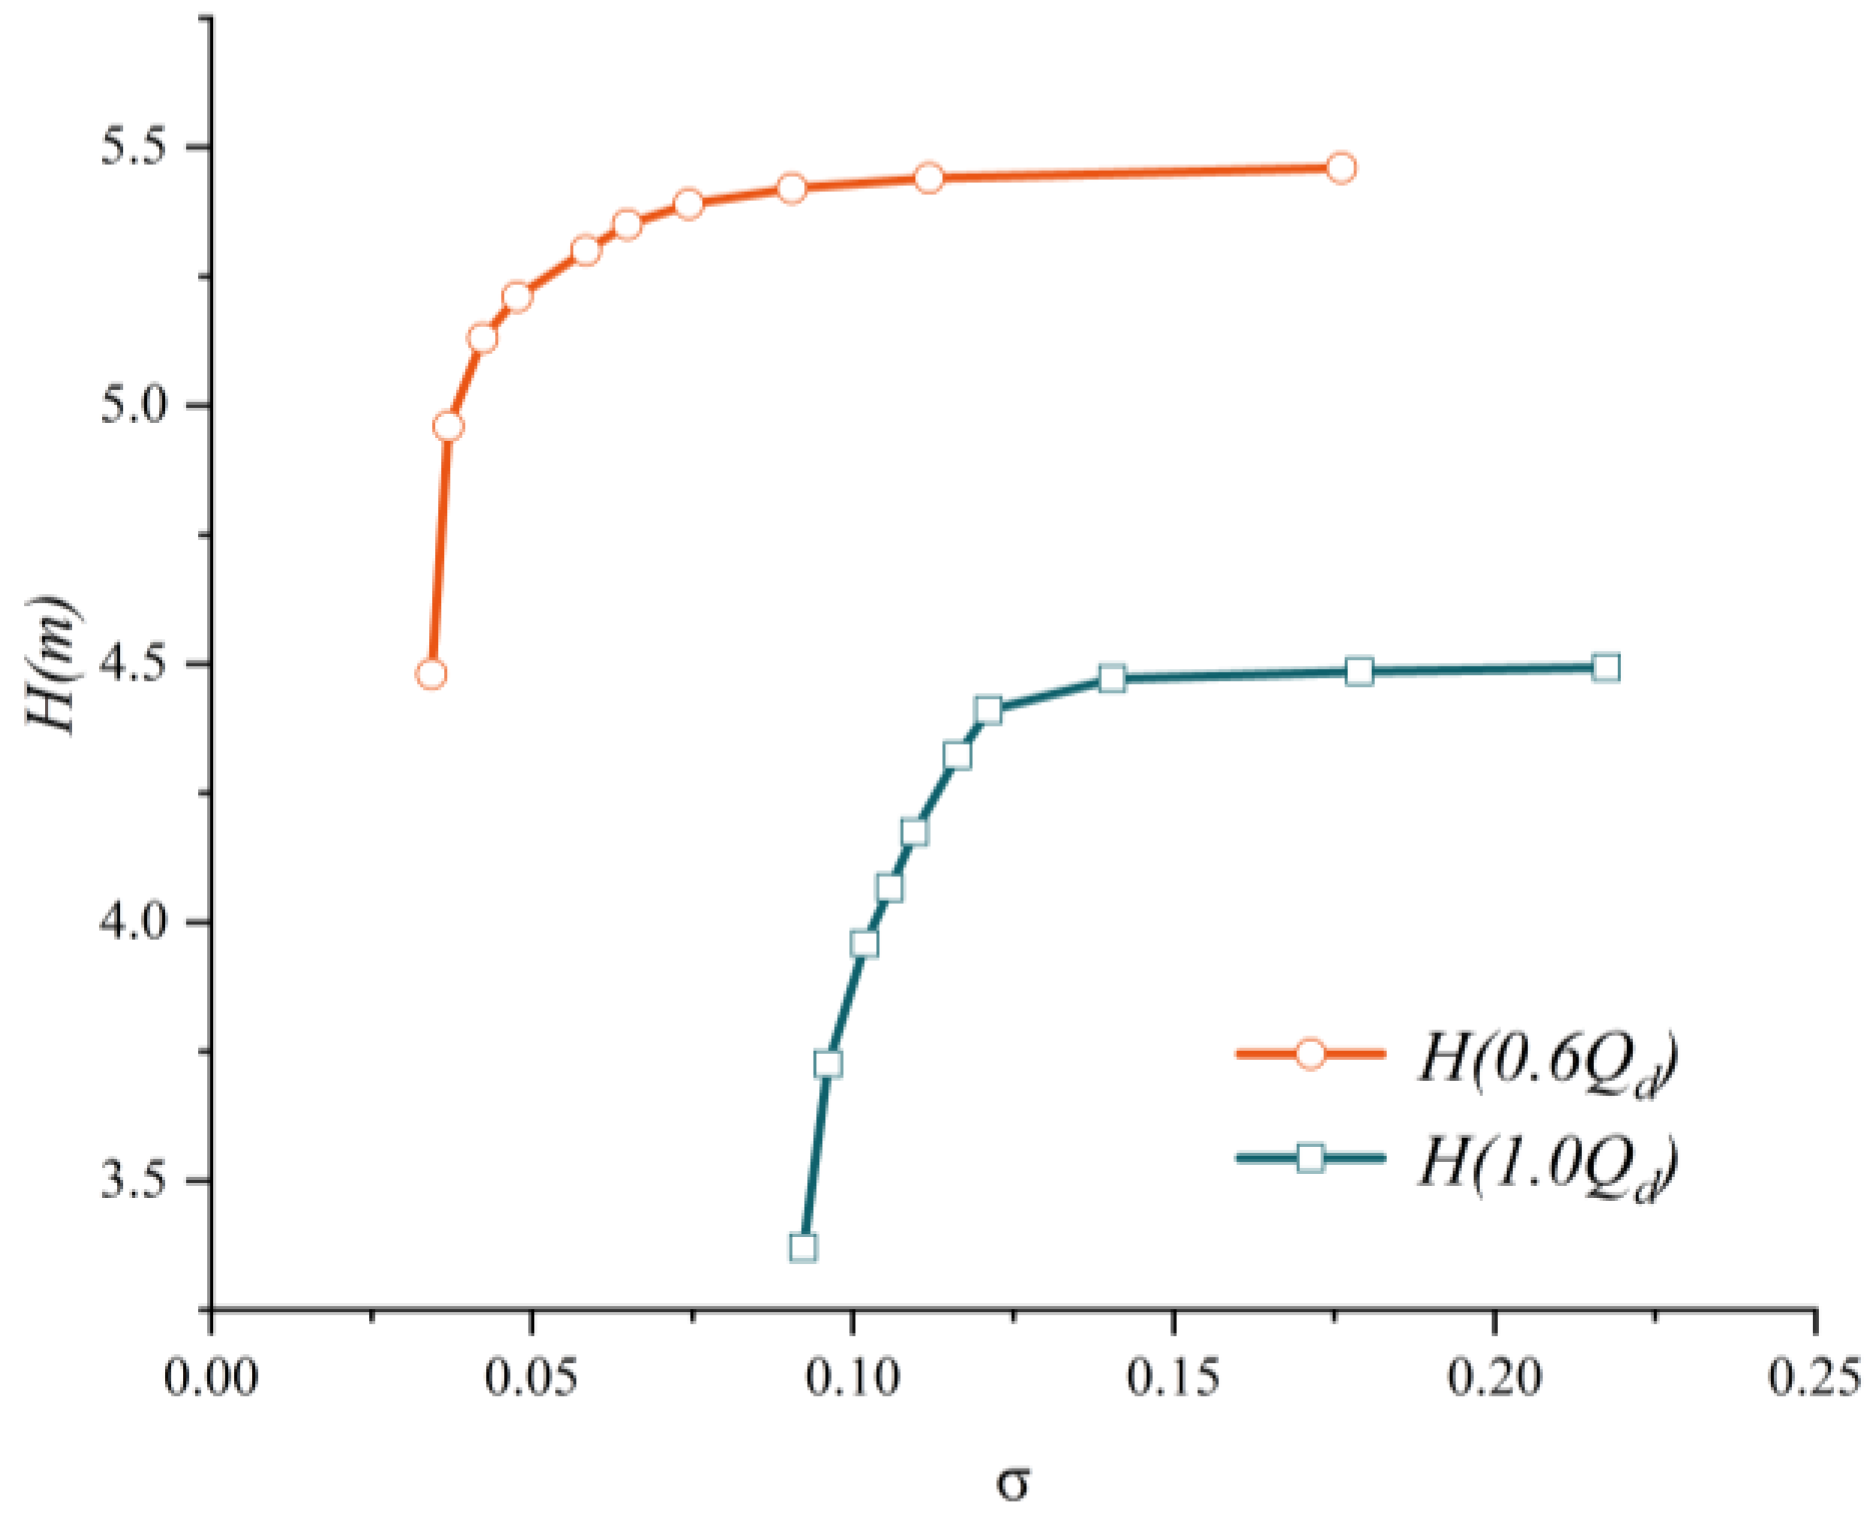
In this study, head values under different flow conditions were obtained experimentally, and corresponding numerical simulations were conducted for each test case to derive the flow–head (Q-H) curve. Due to system leakage and limitations in instrument precision, the numerical simulations could not fully replicate experimental conditions, resulting in discrepancies between the two datasets. However, as shown in Figure 5, the relative error remained within 5%, which is acceptable and confirms the accuracy of the numerical simulations, thereby validating their use for subsequent analyses. The Q-H curve reveals that as the flow rate decreases, the head gradually increases until reaching approximately 60% of the design flow rate (0.6 Qd), where the curve exhibits a positive slope region—the hump region. Giovanna et al. [27] identified a strong correlation between hump characteristics and rotor–stator interactions in this region, prompting this study to focus on the cavitation flow field under the 0.6 Qd condition for in-depth investigation.
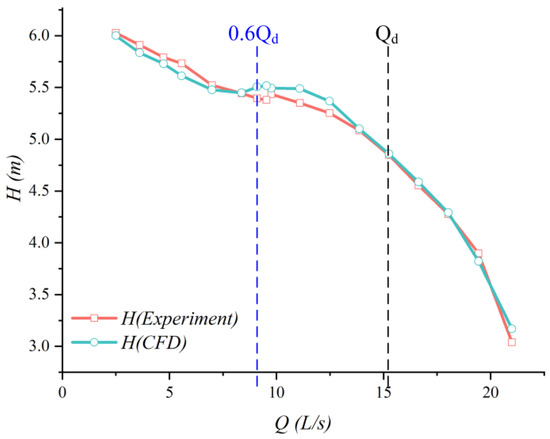
Figure 5.
Q-H.
Numerical simulations of cavitation characteristics were conducted for the conditions of 0.6 times Qd and Qd. The resulting cavitation characteristic curves are illustrated in Figure 6, where the horizontal axis represents the cavitation coefficient defined in Equation (17), and the vertical axis indicates the head corresponding to the respective cavitation number.

Figure 6.
σ-H.
It is evident that as the cavitation number decreases, there is little variation in the head during the initial phase until a critical point is reached (referred to as critical cavitation), at which point a noticeable decline in head begins. Subsequently, the slope of the curve increases rapidly, leading to a sharp decrease in head, significantly impacting the performance of the unit.
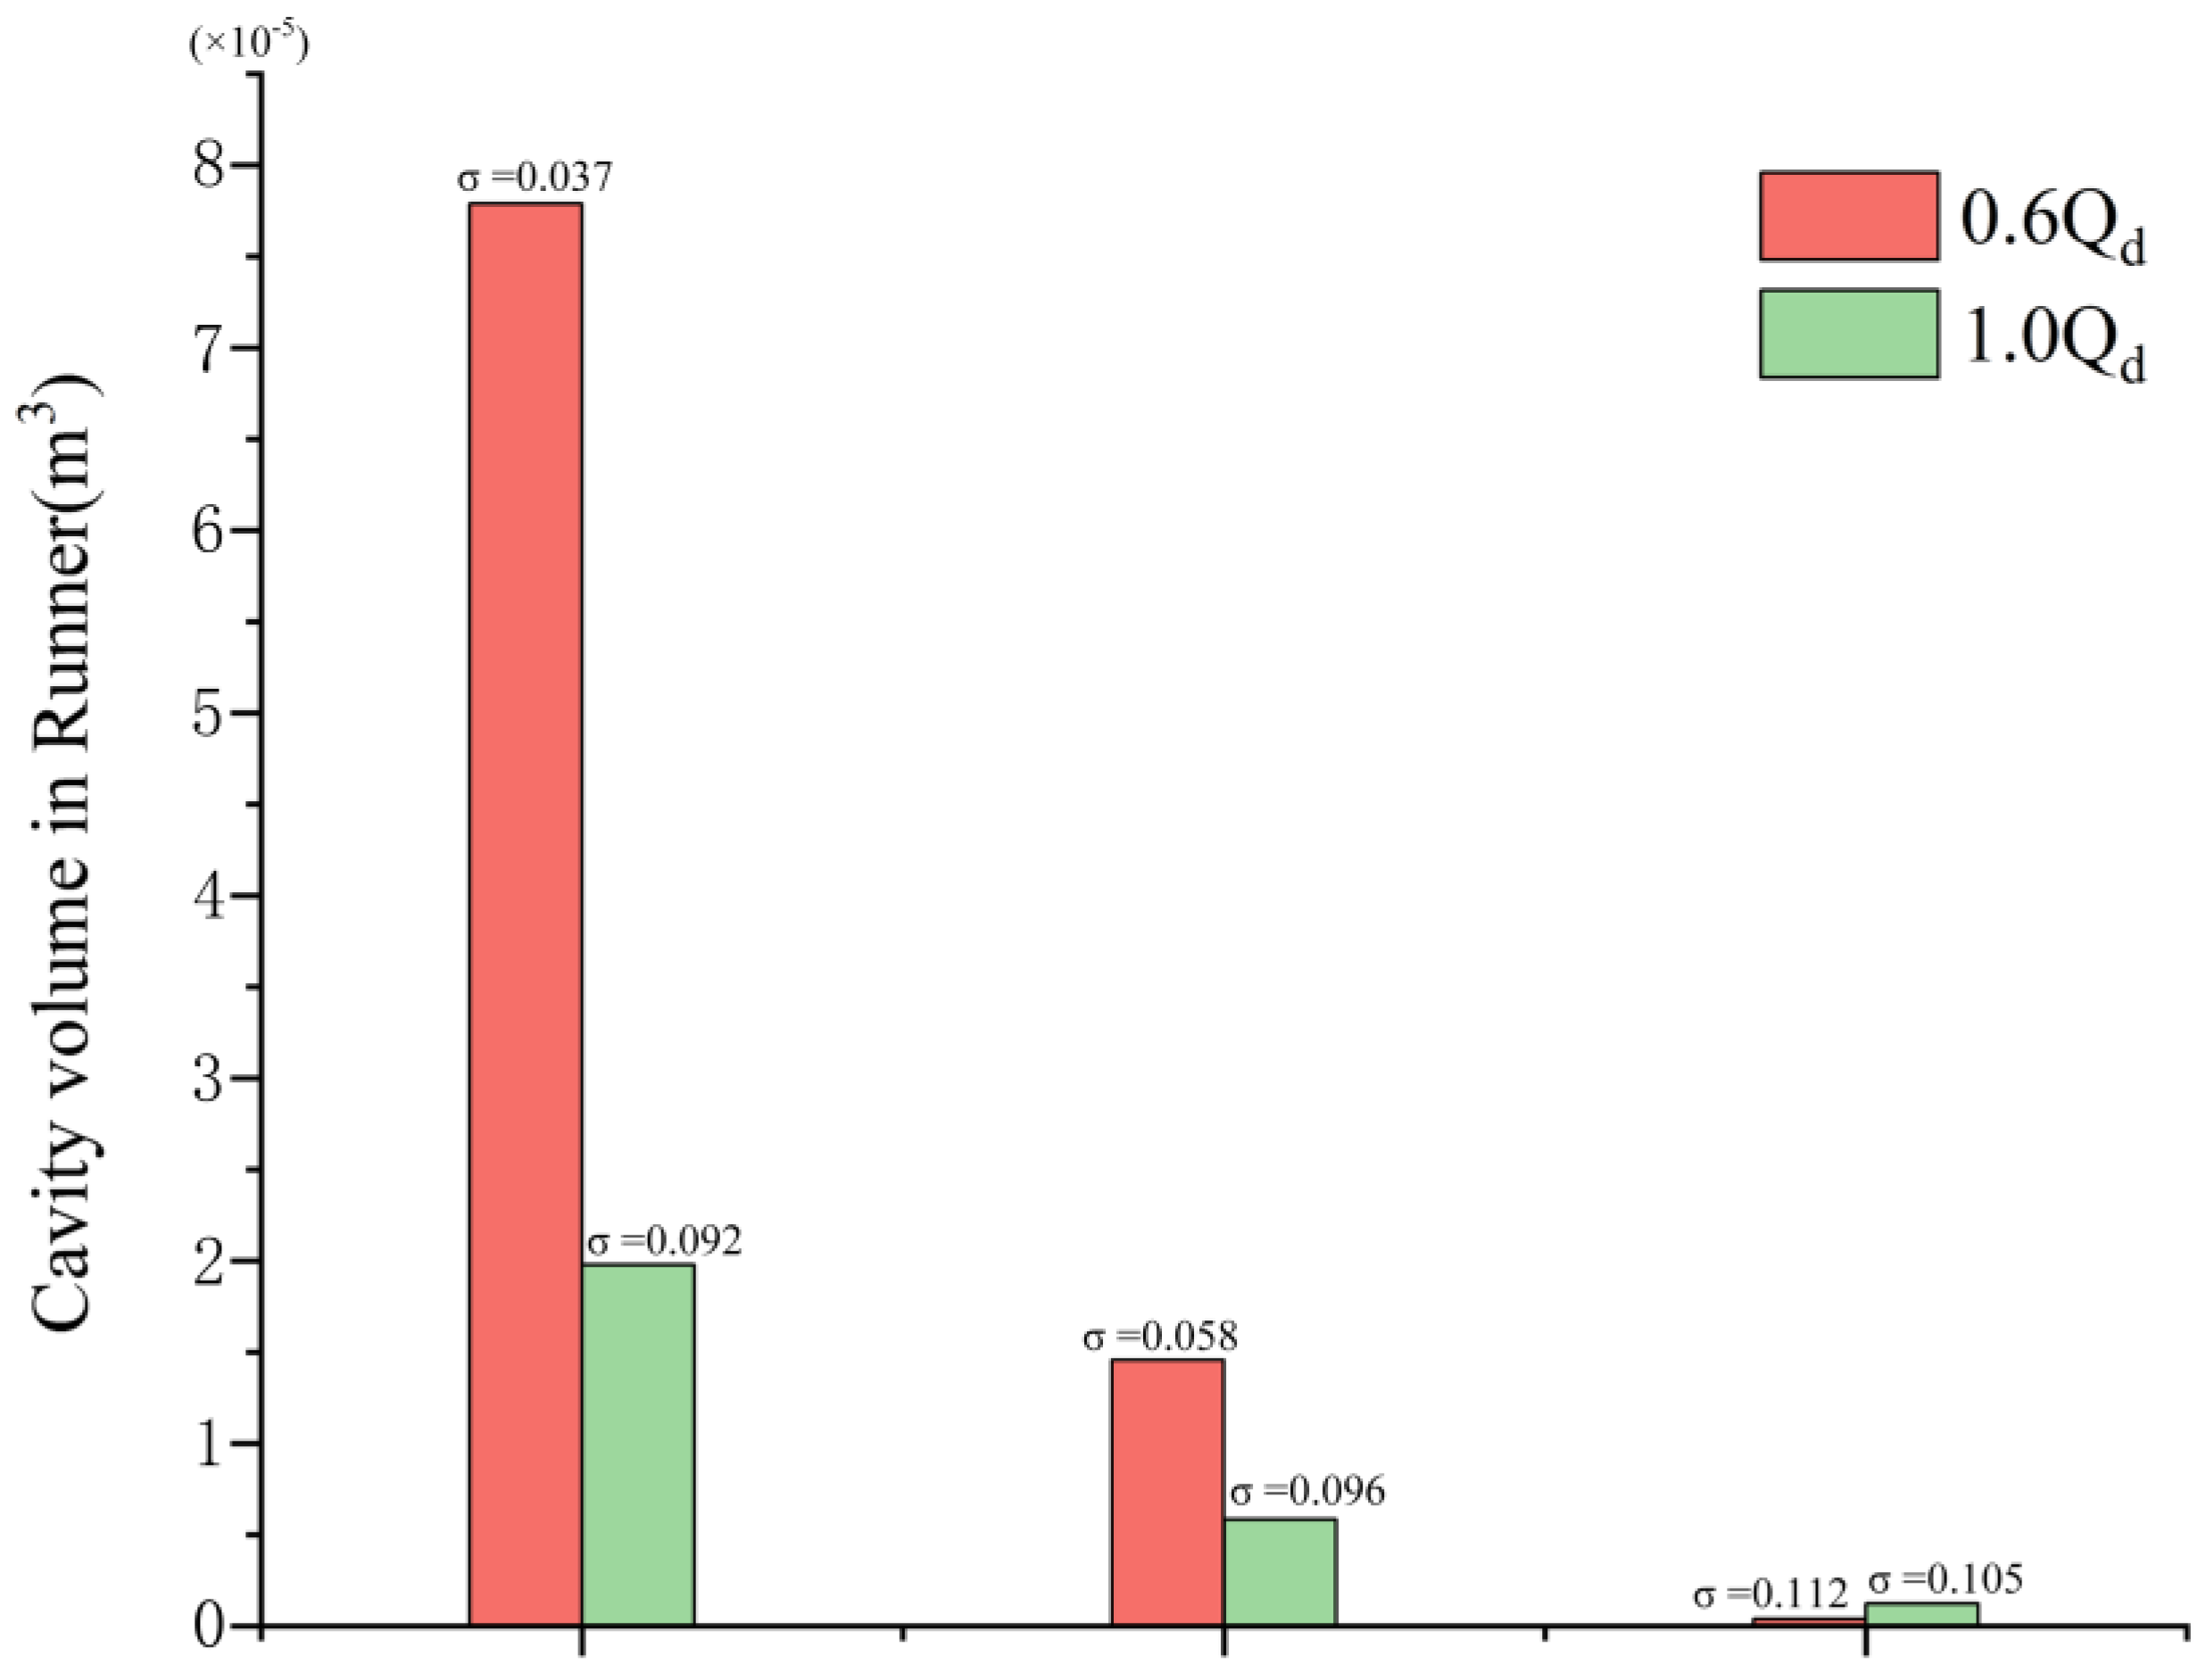
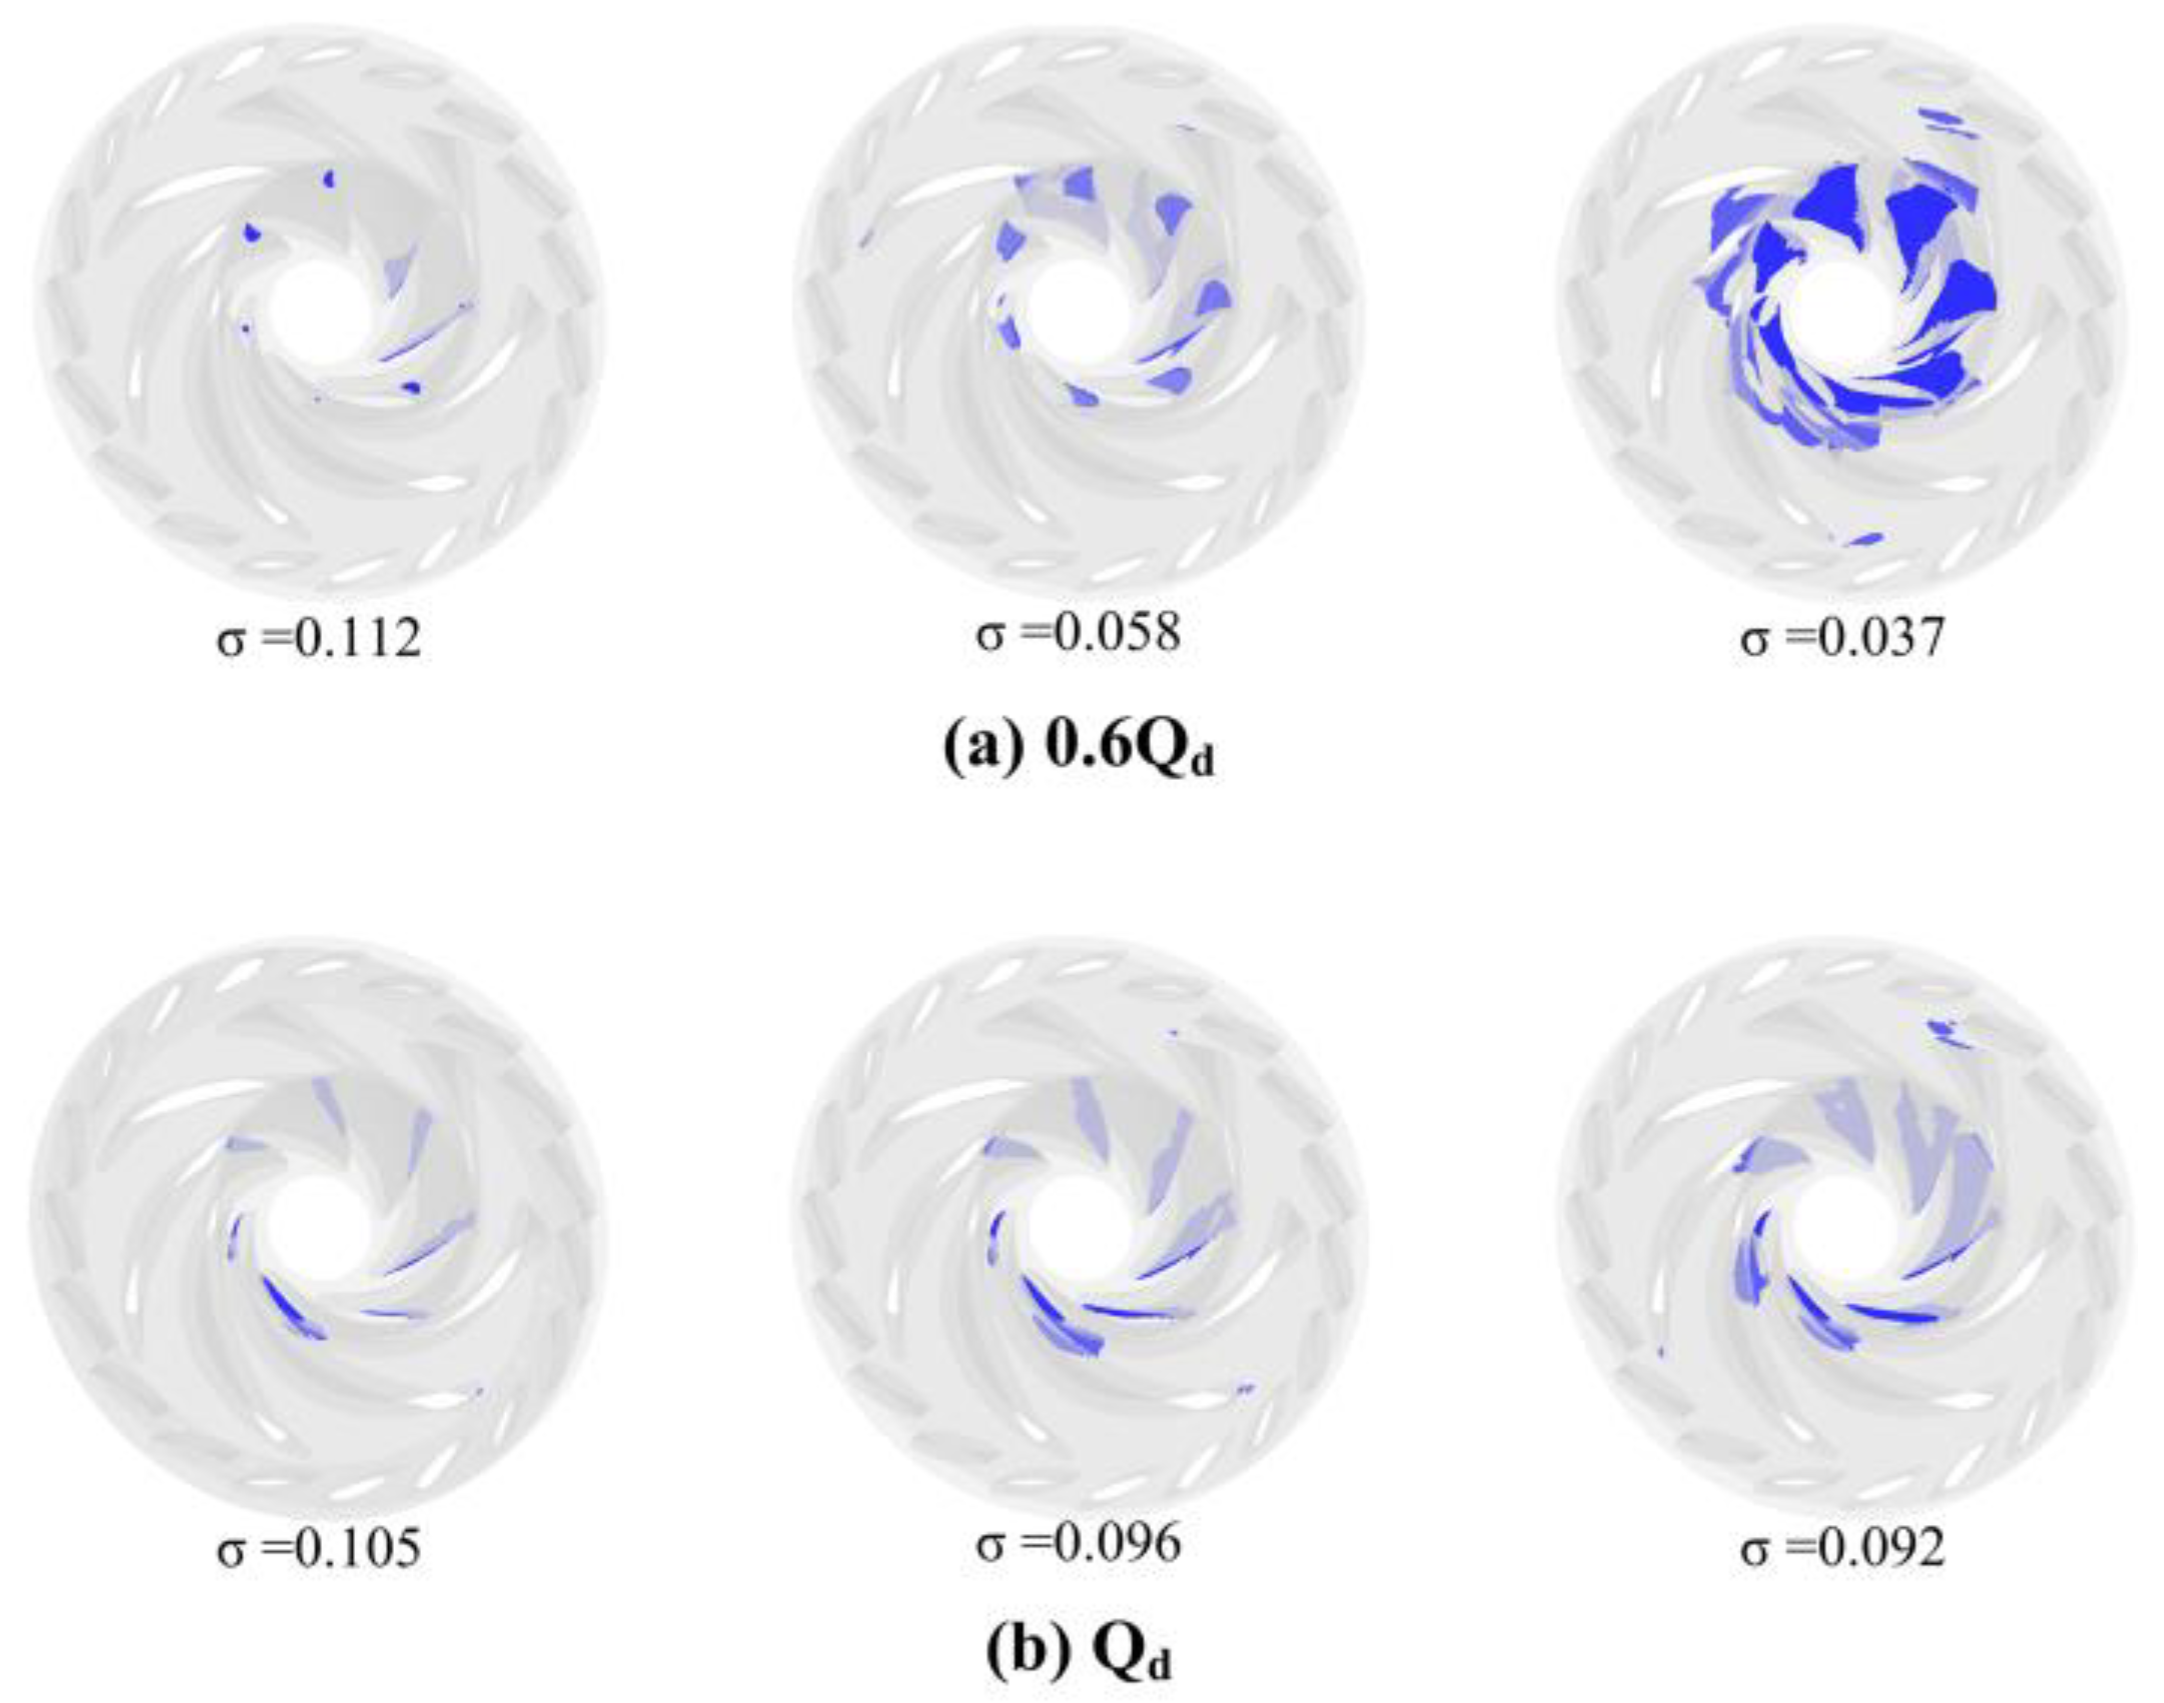
Figure 7 illustrates the total volume of cavitation bubbles in the impeller region under the conditions of 0.6 Qd and Qd at varying levels of cavitation. Figure 8 depicts the iso-surface formed by the cavitation volume fraction equal to 10% under the corresponding cavitation conditions. A comparison of these two figures reveals that when the cavitation number is relatively high and bubbles are just beginning to form, the volume of the bubbles is minimal, occupying a small portion of the flow channel and causing negligible disturbance to the flow field. As the cavitation number decreases to a critical point, cavitation develops to a certain extent, resulting in bubbles occupying part of the flow channel and affecting the flow field, which leads to a reduction in head. Conversely, when cavitation is fully developed, the bubbles occupy a significant portion of the space, severely impeding the normal flow of water.

Figure 7.
The total volume of the vapor.

Figure 8.
The vapor iso-surface of 10% vapor fraction.
In the Qd operating condition, cavitation occurs predominantly on the pressure side, whereas in the 0.6 Qd condition, significant cavitation is observed on both the suction and pressure sides. Notably, the cavitation on the suction side is primarily concentrated near the upper cover plate, while the pressure-side cavitation is mainly found close to the hub. Additionally, due to the dynamic interference between the rotating blades and the stationary guide vanes, cavitation begins to manifest at the outlet of the rotating blades and in the no-blade region. As cavitation progresses, the volume of the vapor bubbles in the no-blade area increases, adversely affecting the flow in that region. This phenomenon leads to a sharp decline in head and a reduction in efficiency.
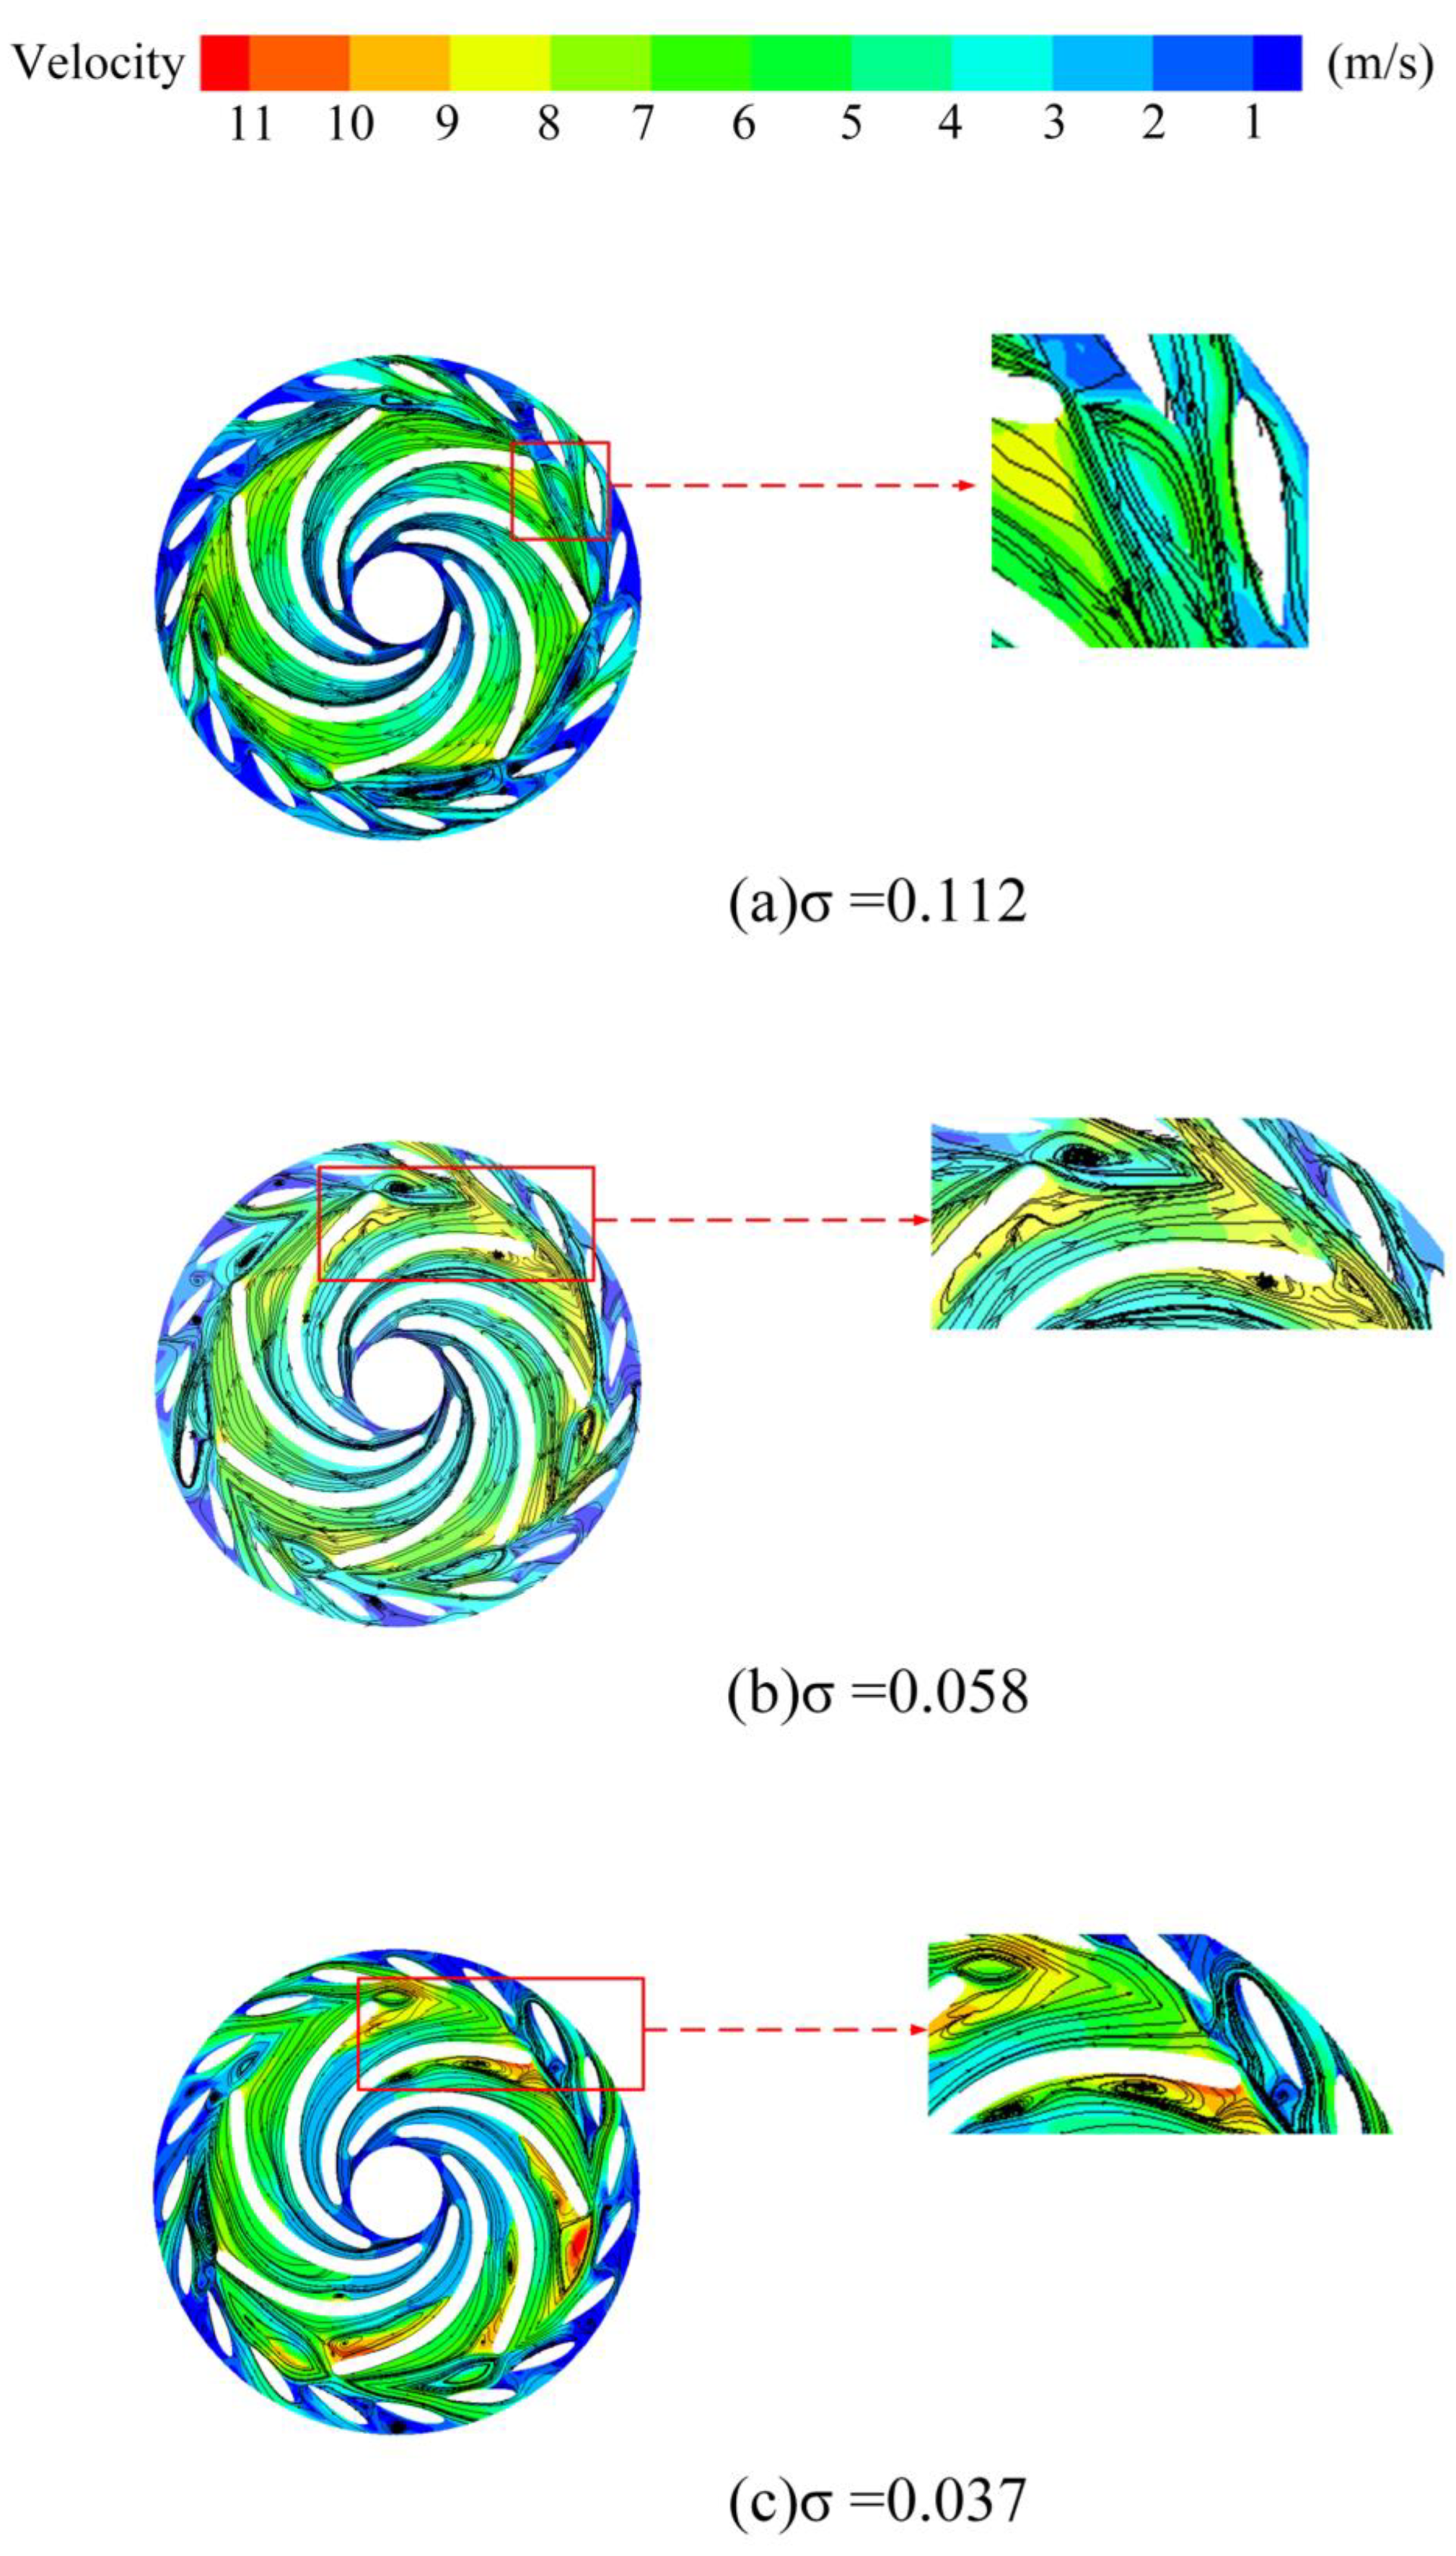
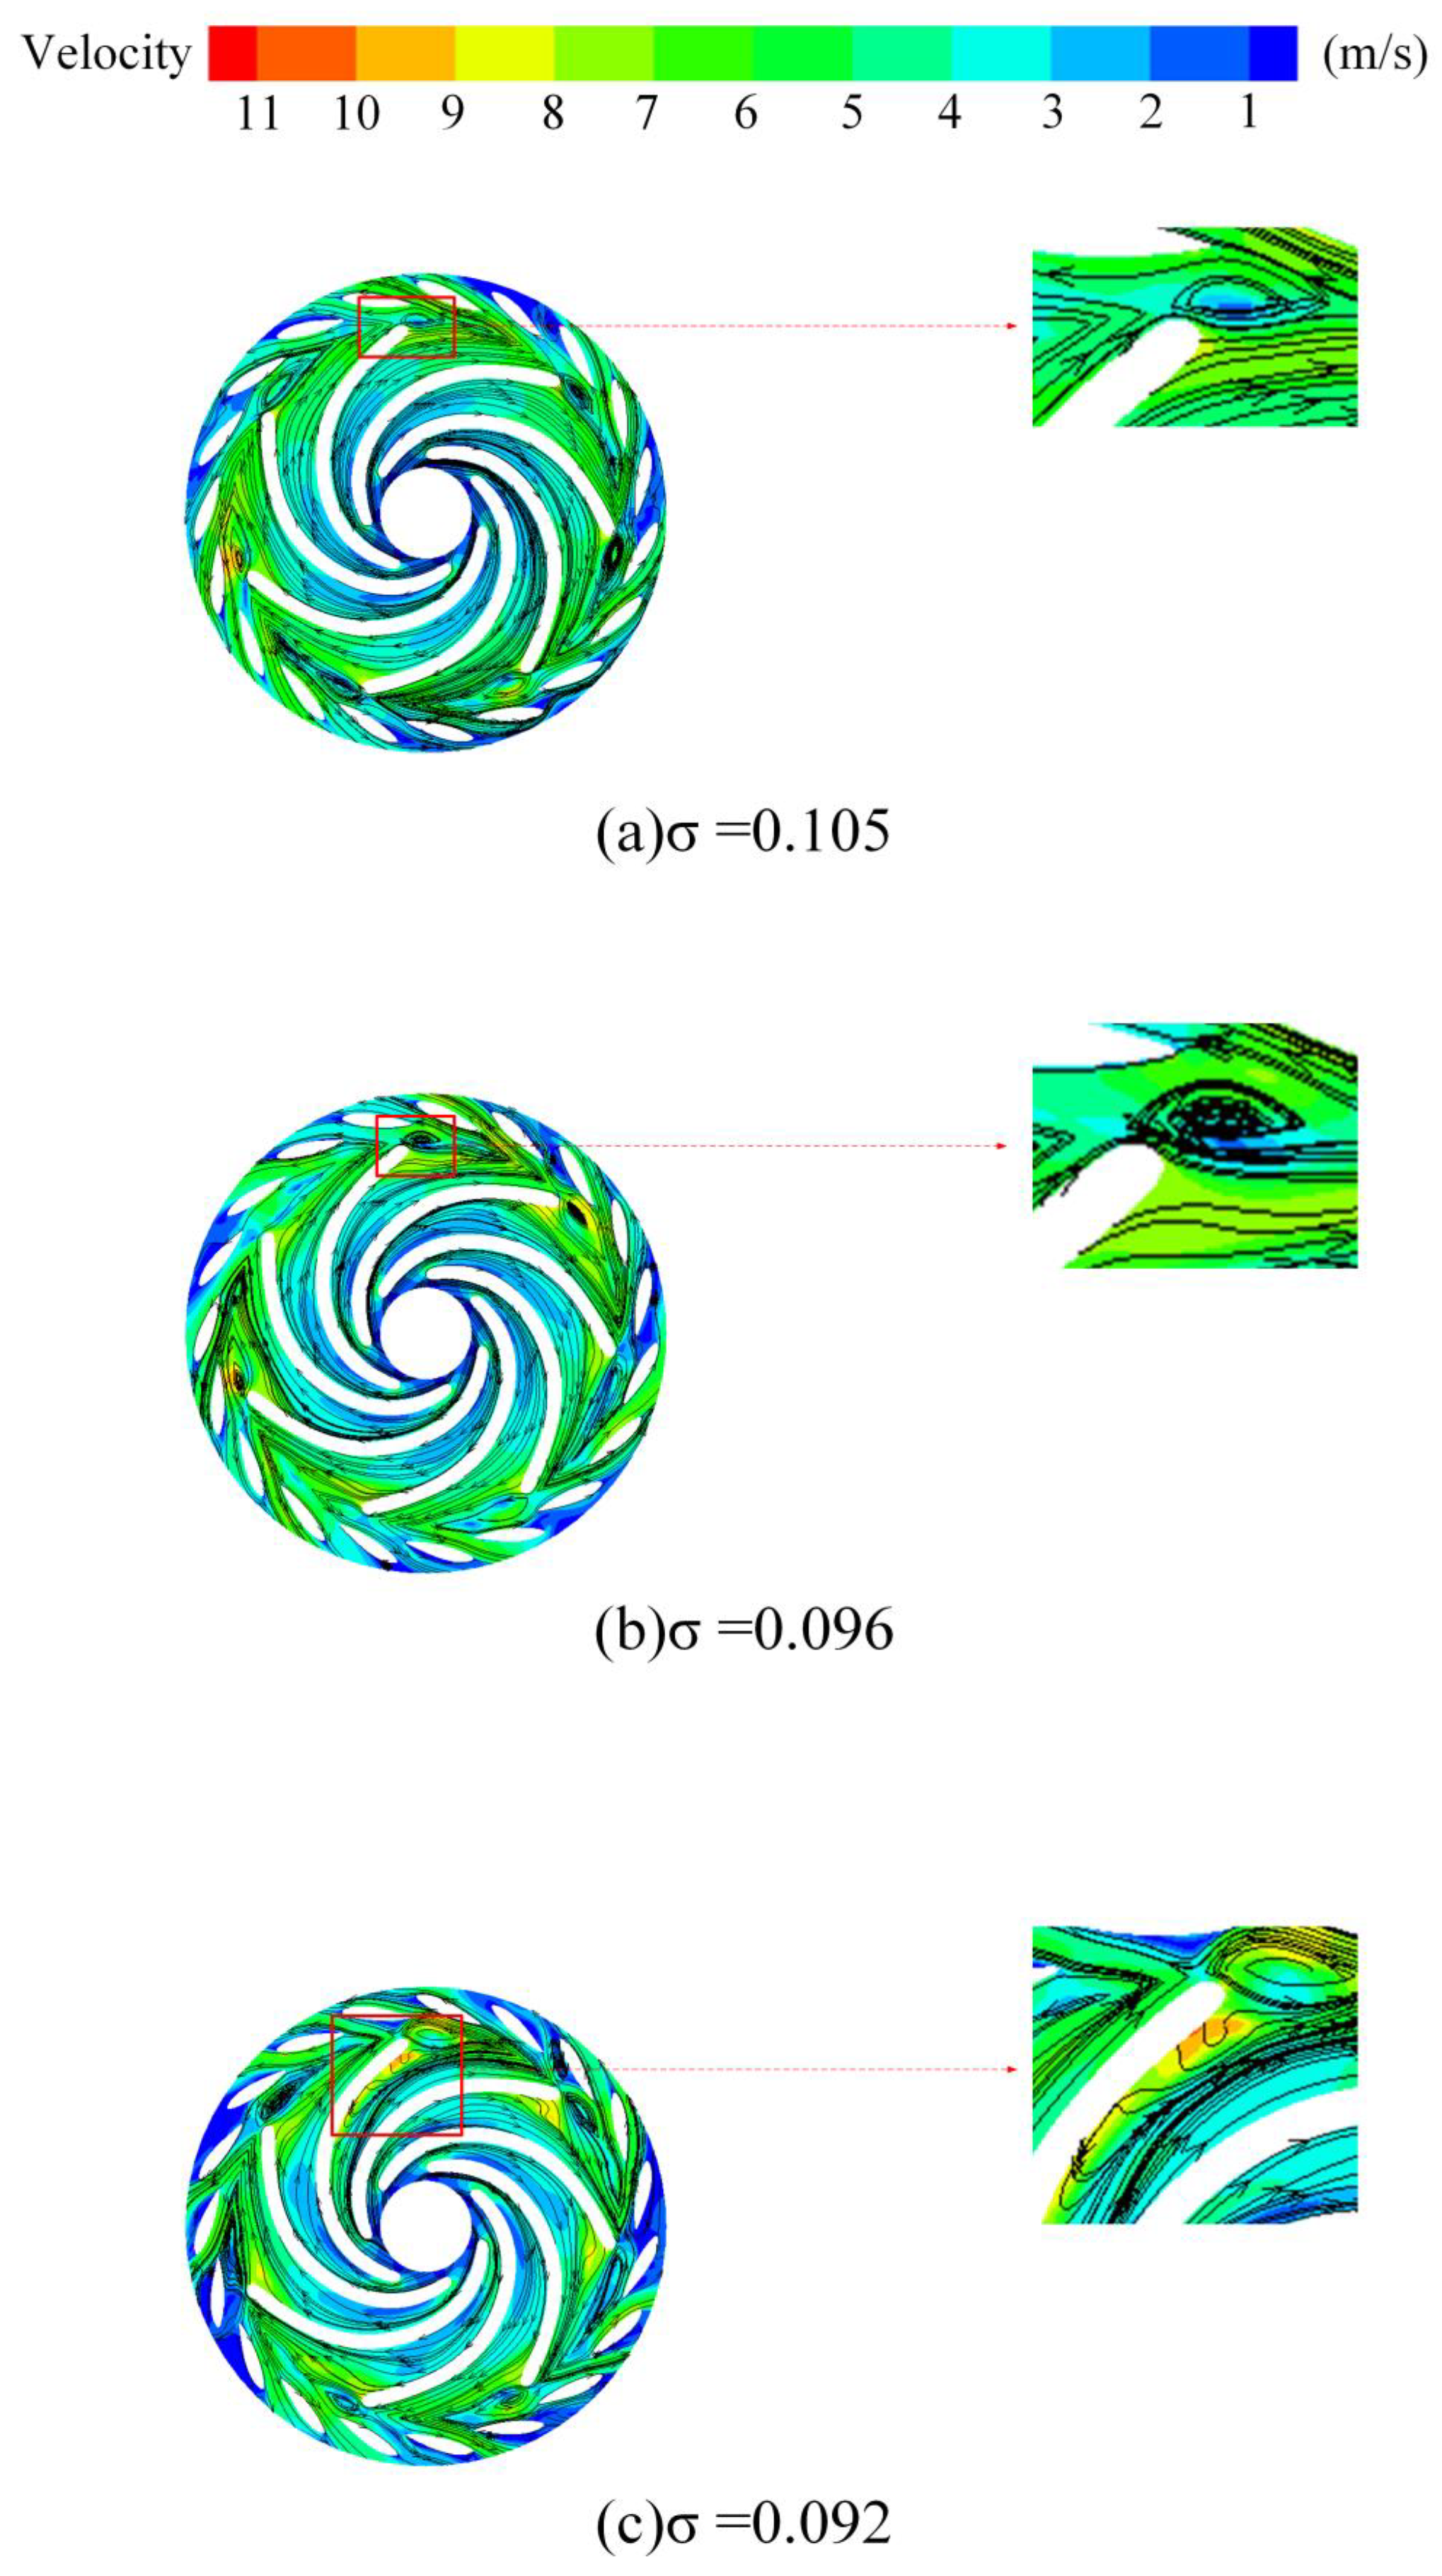
Figure 9 and Figure 10 illustrate the velocity contours and streamlines on Plane A for different cavitation levels at 0.6 Qd and Qd operating conditions. The flow separation on the suction side of the blade exit and the recirculation in the variable guide vane region result in the formation of large-scale vortex structures in the blade-free zone due to internal viscous forces. Compared to the Qd flow rate condition, the 0.6 Qd flow rate condition exhibits more severe backflow phenomena in the guide vane region, with vortex structures of significantly larger scales. As cavitation intensifies, the vortex scale in the bladeless region expands, the flow separation on the suction side of the blade increases, and water flows backward into the runner, forming a vortex near the suction side of the blade and runner. The vortices present in both the blade-free and runner areas significantly impede the flow within the field, ultimately resulting in a decline in the performance of the unit.

Figure 9.
Velocity streamline of cavitation flow field at 0.6 Qd.

Figure 10.
Velocity streamline of cavitation flow field at Qd.
4.2. Analysis of Energy Dissipation Characteristics in Cavitating Flow Fields
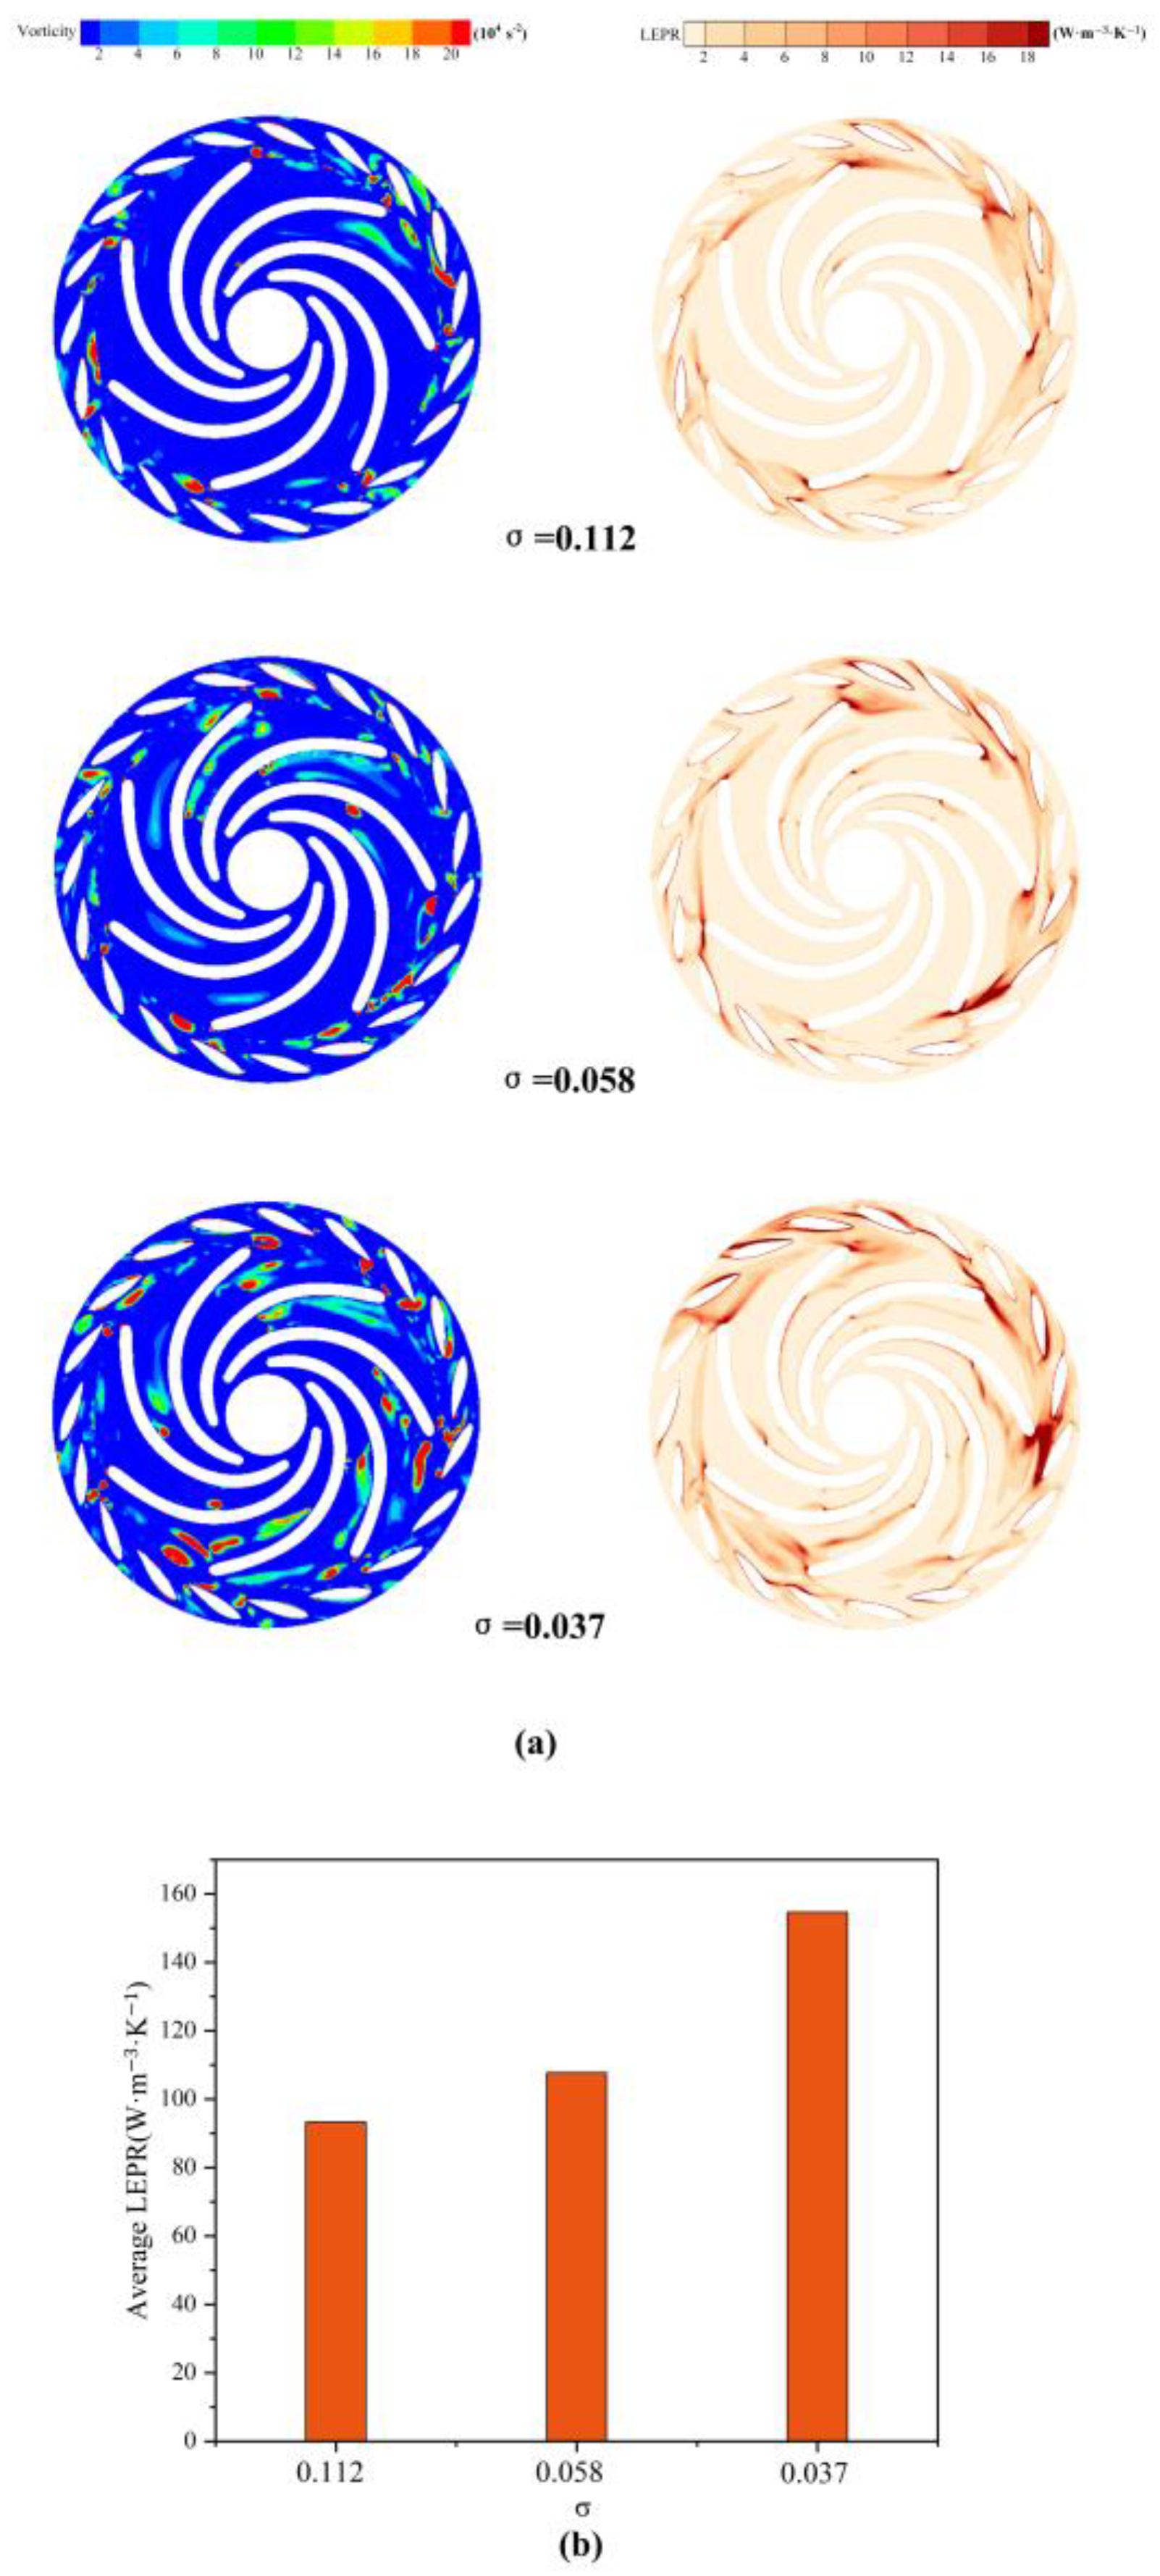
To facilitate a more intuitive observation of the vortices and the associated energy loss distribution in low-flow conditions, the Q criterion vortex identification method was employed to capture the vortices in the flow field of Plane A. Figure 11 illustrates the vorticity and its corresponding entropy generation distribution, along with the average entropy generation in Plane A’s flow field. As indicated by the comparison of the average entropy generation in Plane A’s flow field shown in Figure 11b, it is evident that with the progression of cavitation, the entropy generation increases, leading to greater energy loss. Figure 11a presents the vortex map identified using the Q criterion, revealing that during the initial stages of cavitation, high vorticity primarily occurs in the blade exit region and the blade-free zone between the moving guide vanes. As cavitation intensifies, the scale of the high-intensity vortices in the blade-free zone increases, and the number of vortices in the impeller flow field also rises, resembling the vortex structure distribution depicted in Figure 9, thereby accurately identifying the vortex structures. Furthermore, Figure 11a also displays the entropy generation distribution, which upon comparison is predominantly concentrated in the vortex regions. Consequently, the cavitation vortices in the low-flow operating conditions of the pump turbine are identified as the primary cause of energy loss.

Figure 11.
Distribution of vorticity and entropy production.
4.3. POD Analysis of Vorticity Field
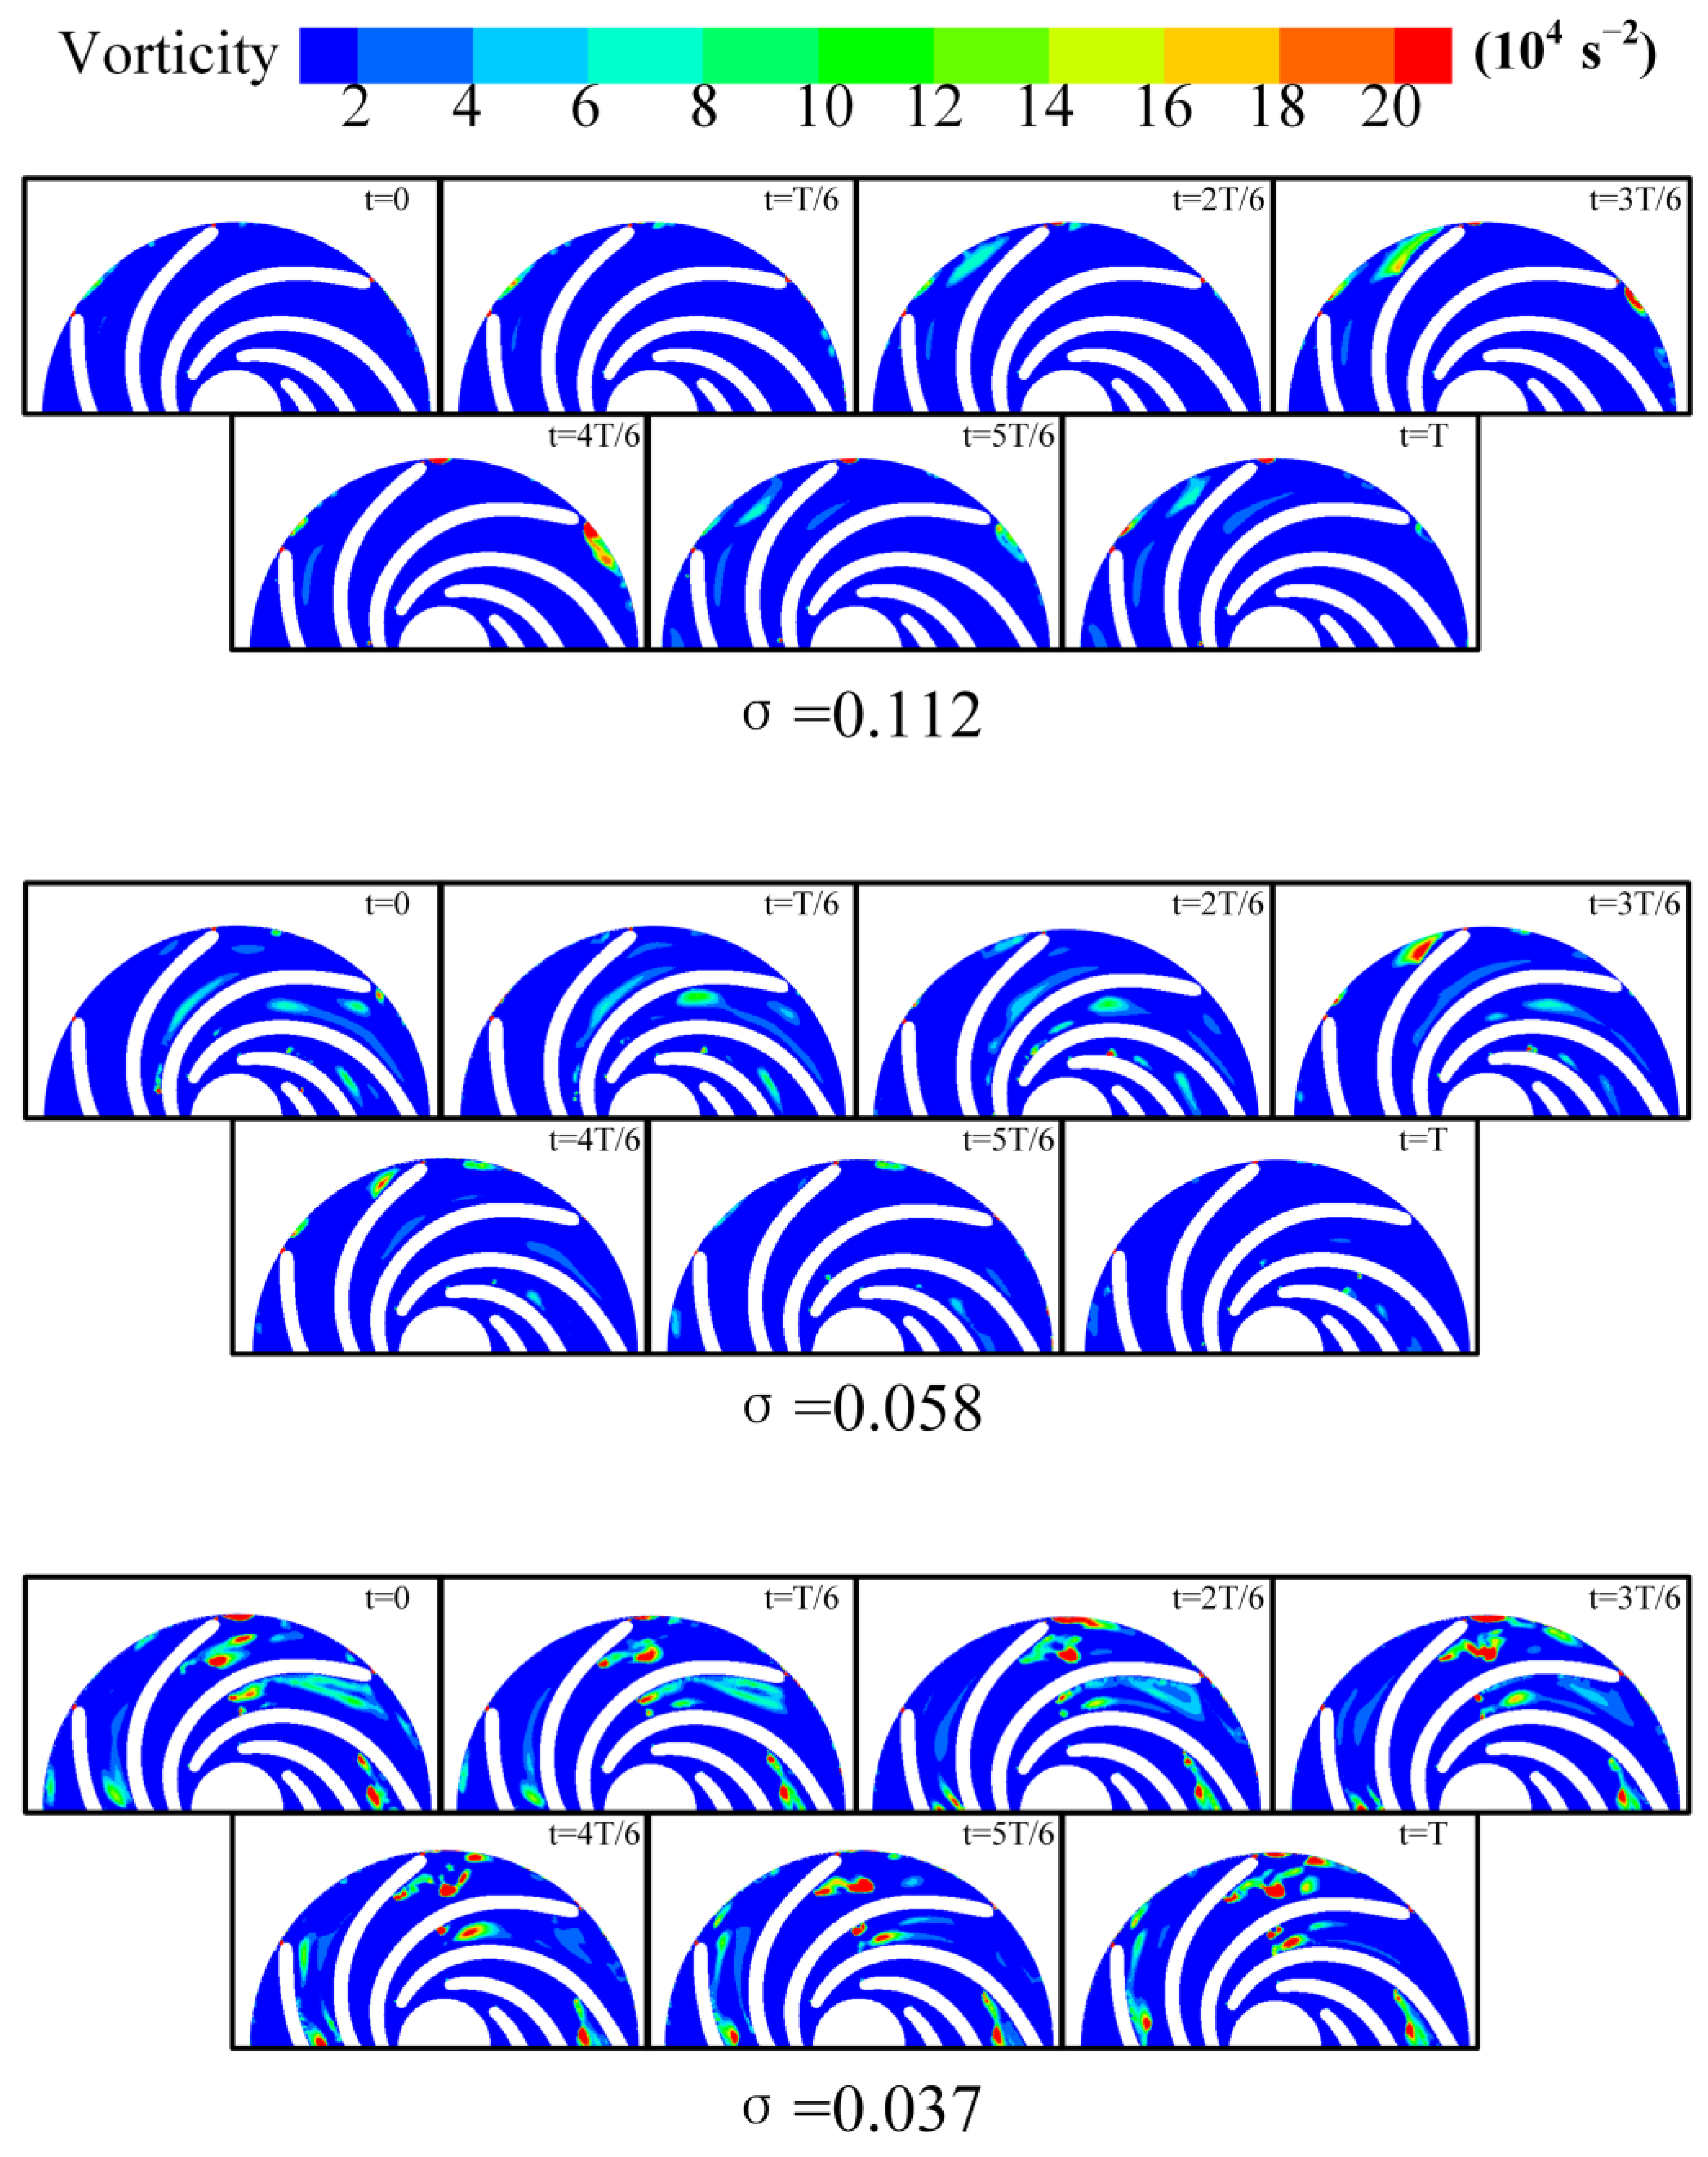
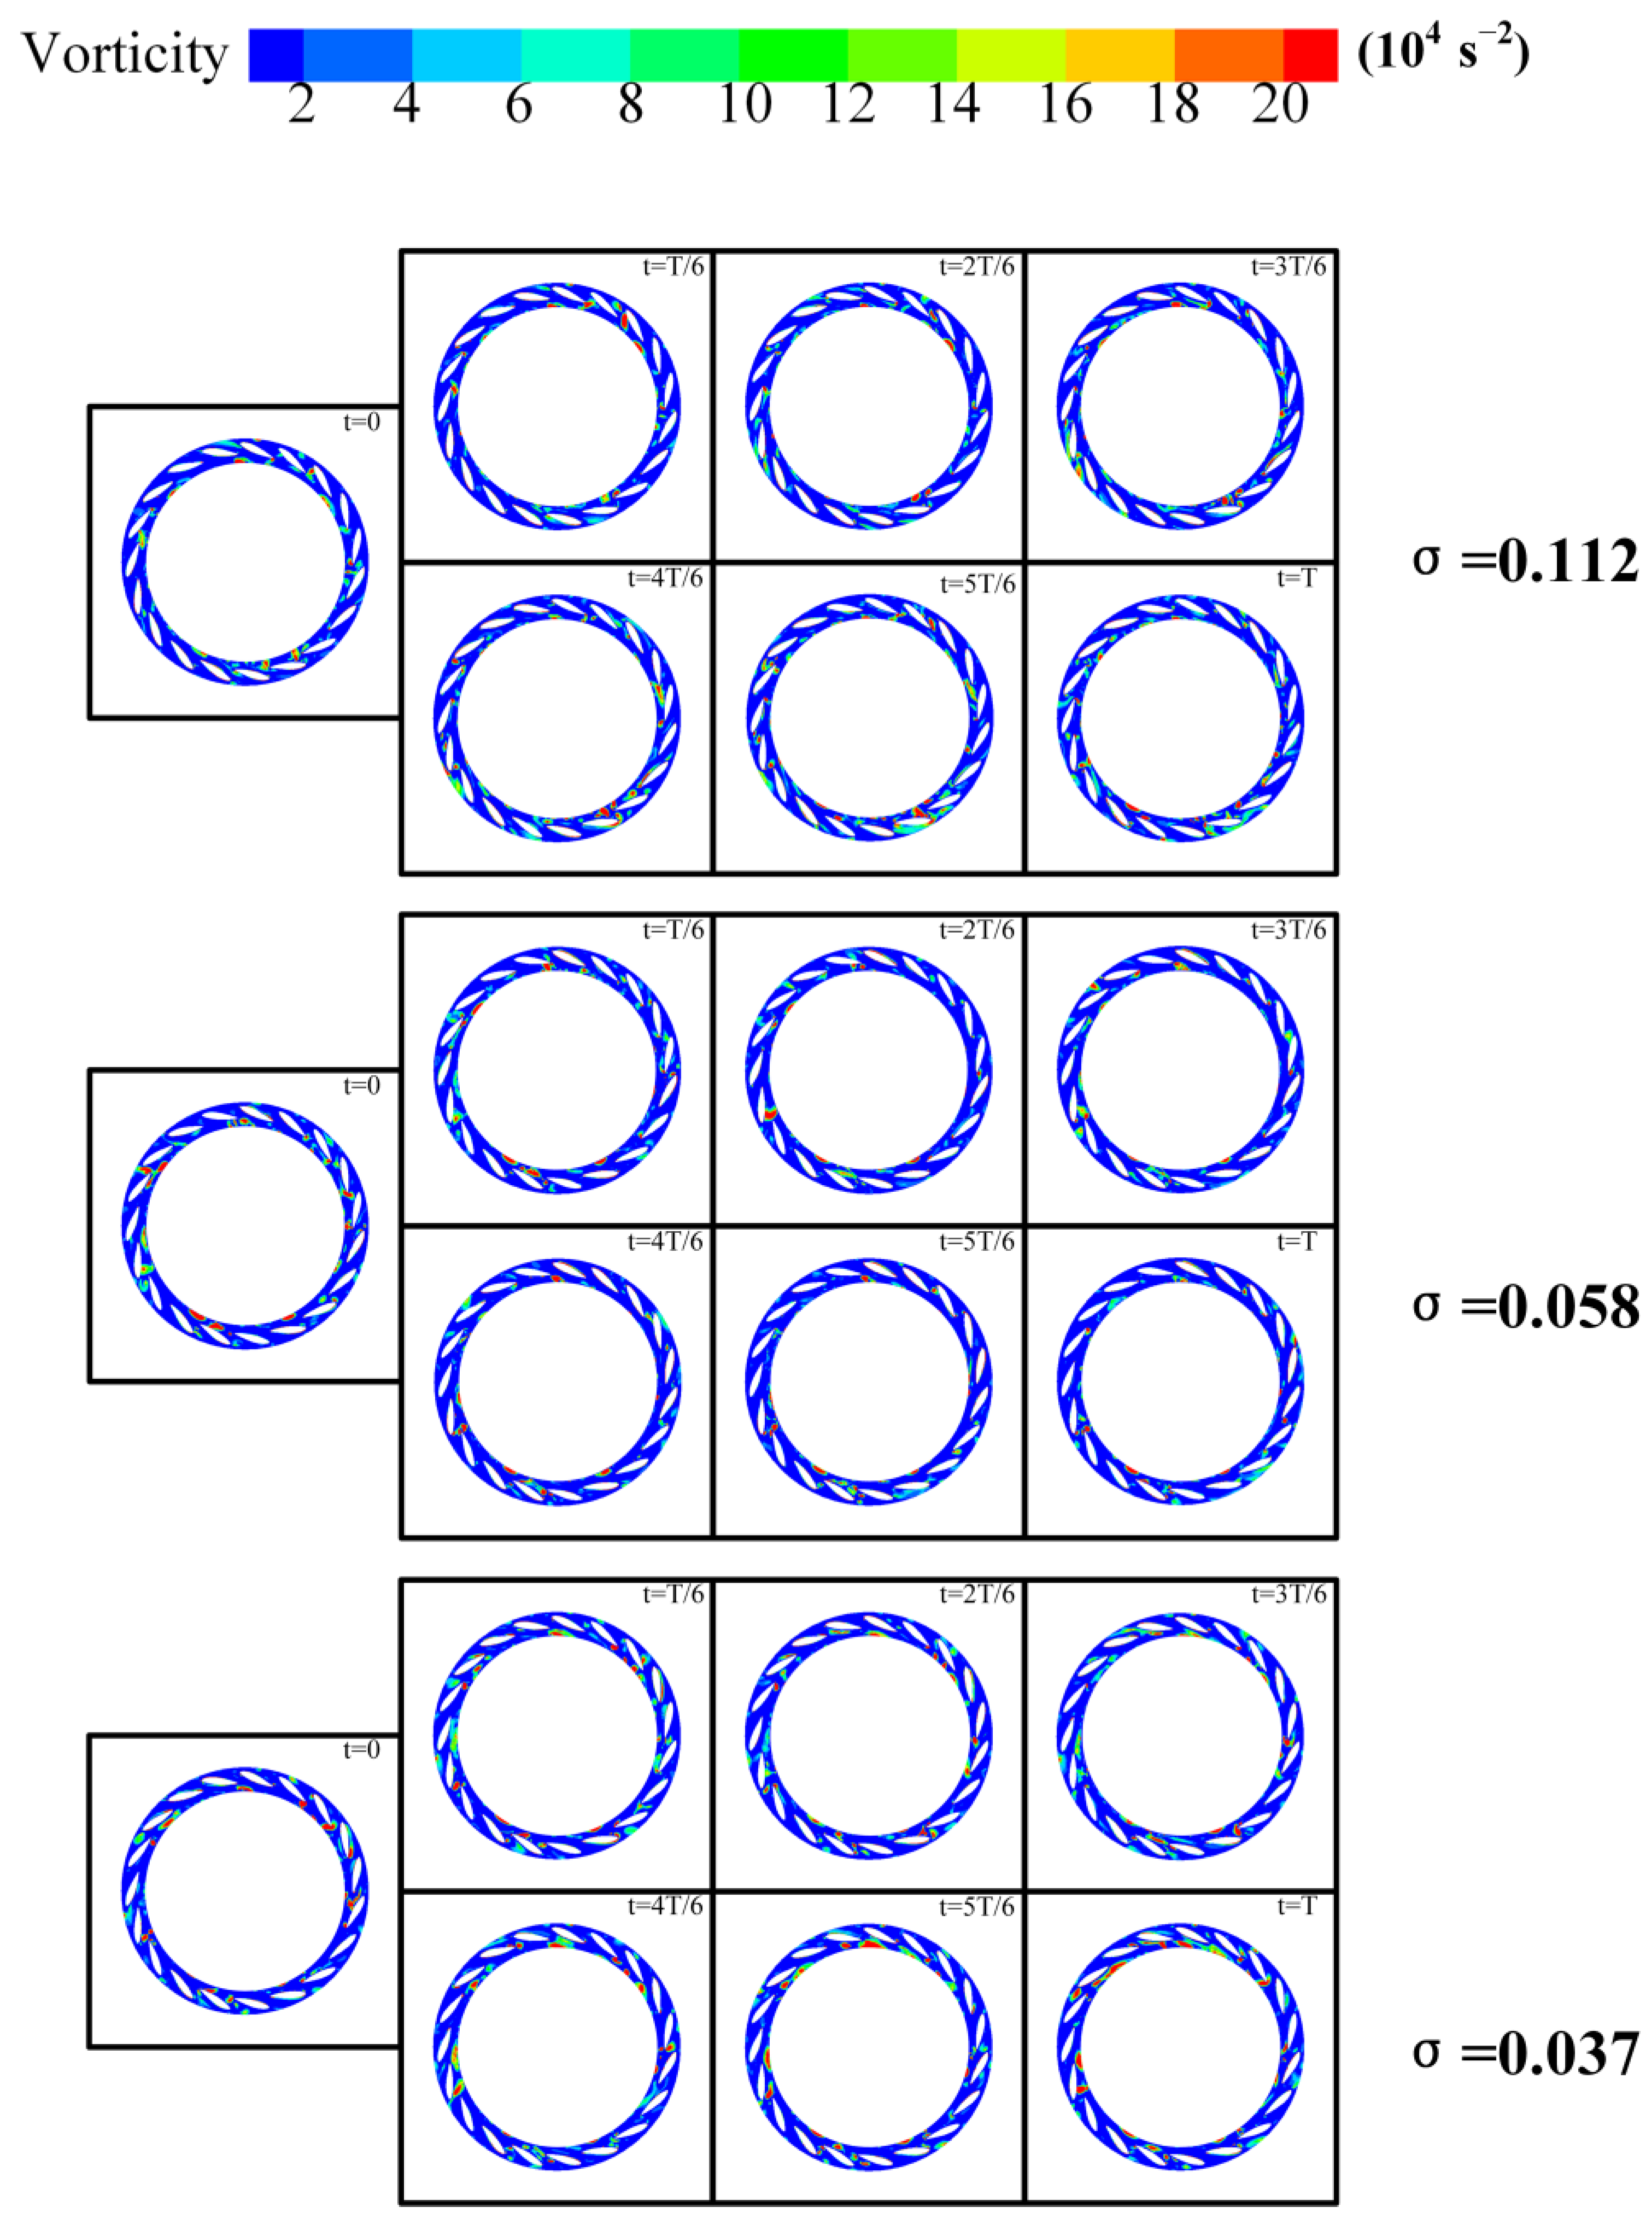
To investigate the evolution of vortices, Figure 12 illustrates the vortex evolution of the flow field at Plane A-1 over one rotation period under various cavitation conditions. When σ is 0.112, the changes in the blade tip vortex during one cycle are minimal, indicating that this cavitation condition primarily governs the vortex distribution in the impeller region. At the impeller outlet, vortices resulting from the shedding of the blade tip are present, with an evolution period approximately equal to one rotation period T. As the cavitation coefficient decreases to σ = 0.058, Plane A-1 generates vortices with consistent evolution periods at the same location. However, due to the development of cavitation, the intensity of these vortices is significantly higher than during the initial stages of cavitation. Additionally, other flow passages exhibit vortices of varying sizes that lack a clear evolutionary pattern. With the further reduction in the cavitation coefficient to σ = 0.058, cavitation becomes fully developed, resulting in a substantial presence of vortices with unstable evolution periods throughout the entire rotation cycle at Plane A-1.
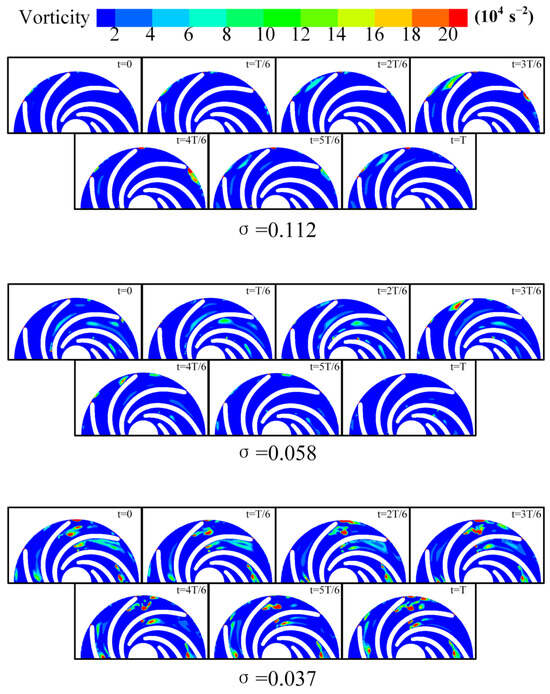
Figure 12.
Evolution of vortices in Plane A-1.
Figure 13 illustrates the evolution of vortices in the flow field of Plane A-2 over a single rotation period under various cavitation conditions. It is observed that large-scale vortices are predominantly located in the blade-free region and the trailing edge of the movable guide vanes. At the onset of cavitation, large-scale vortices are present in the blade-free area. As cavitation progresses, its influence on the flow field intensifies, leading to an expansion in vortex size in the blade-free region of Plane A-2, an increase in the number of vortex structures, and the emergence of small-scale, low-intensity vortices with varying periodicity.
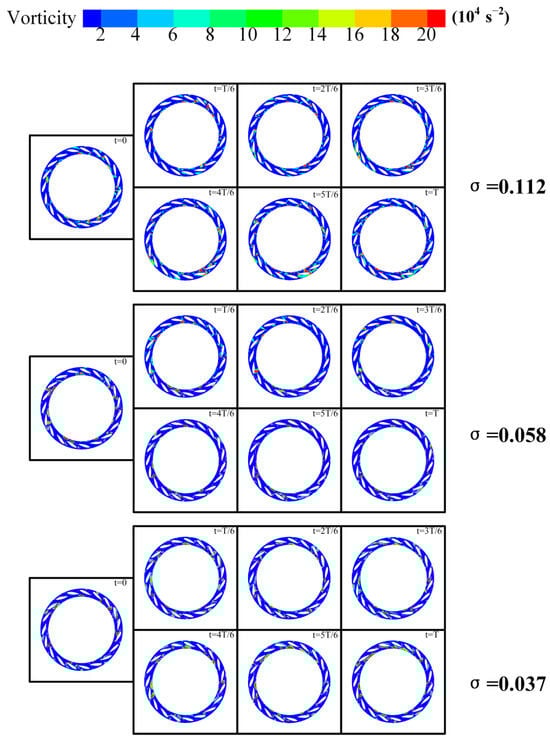
Figure 13.
Evolution of vortices in Plane A-2.
The instability of cavitation vortex structures leads to variability in the duration of vortex evolution cycles, making it challenging to observe the periodicity of these cycles. To address this, POD was employed to perform dimensionality reduction on snapshots of the vorticity field in a low-flow condition over two rotation periods. This approach allowed for the extraction of the primary coherent vortex structures on Plane A based on the energy contributions of the various mode orders.
Figure 14 illustrates the proportion of energy contained in various-order POD modes, represented as the ratio of the mode characteristic values to the sum of the eigenvalues. It is evident that the first-order mode possesses the highest energy proportion, significantly surpassing that of the second-order and higher modes, indicating that it represents the predominant coherent structures within the vorticity field. Furthermore, for modes of order greater than eight, the energy proportion falls below 1%, and this proportion decreases gradually with increasing mode order. This suggests that the corresponding mode vorticity fields are influenced by the unsteady characteristics of the flow, rendering their contributions negligible. Additionally, across different levels of cavitation, the distribution of energy proportions among the various modes remains largely consistent. Notably, the energy proportion of the first-order mode diminishes as the degree of cavitation intensifies, indicating that the progression of cavitation enhances the unsteady characteristics of the vorticity field.
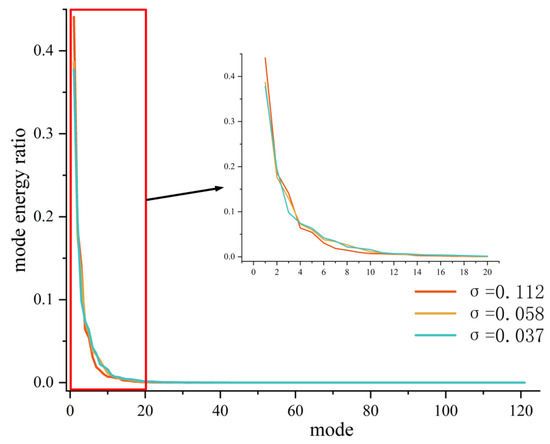
Figure 14.
POD mode energy contribution diagram.
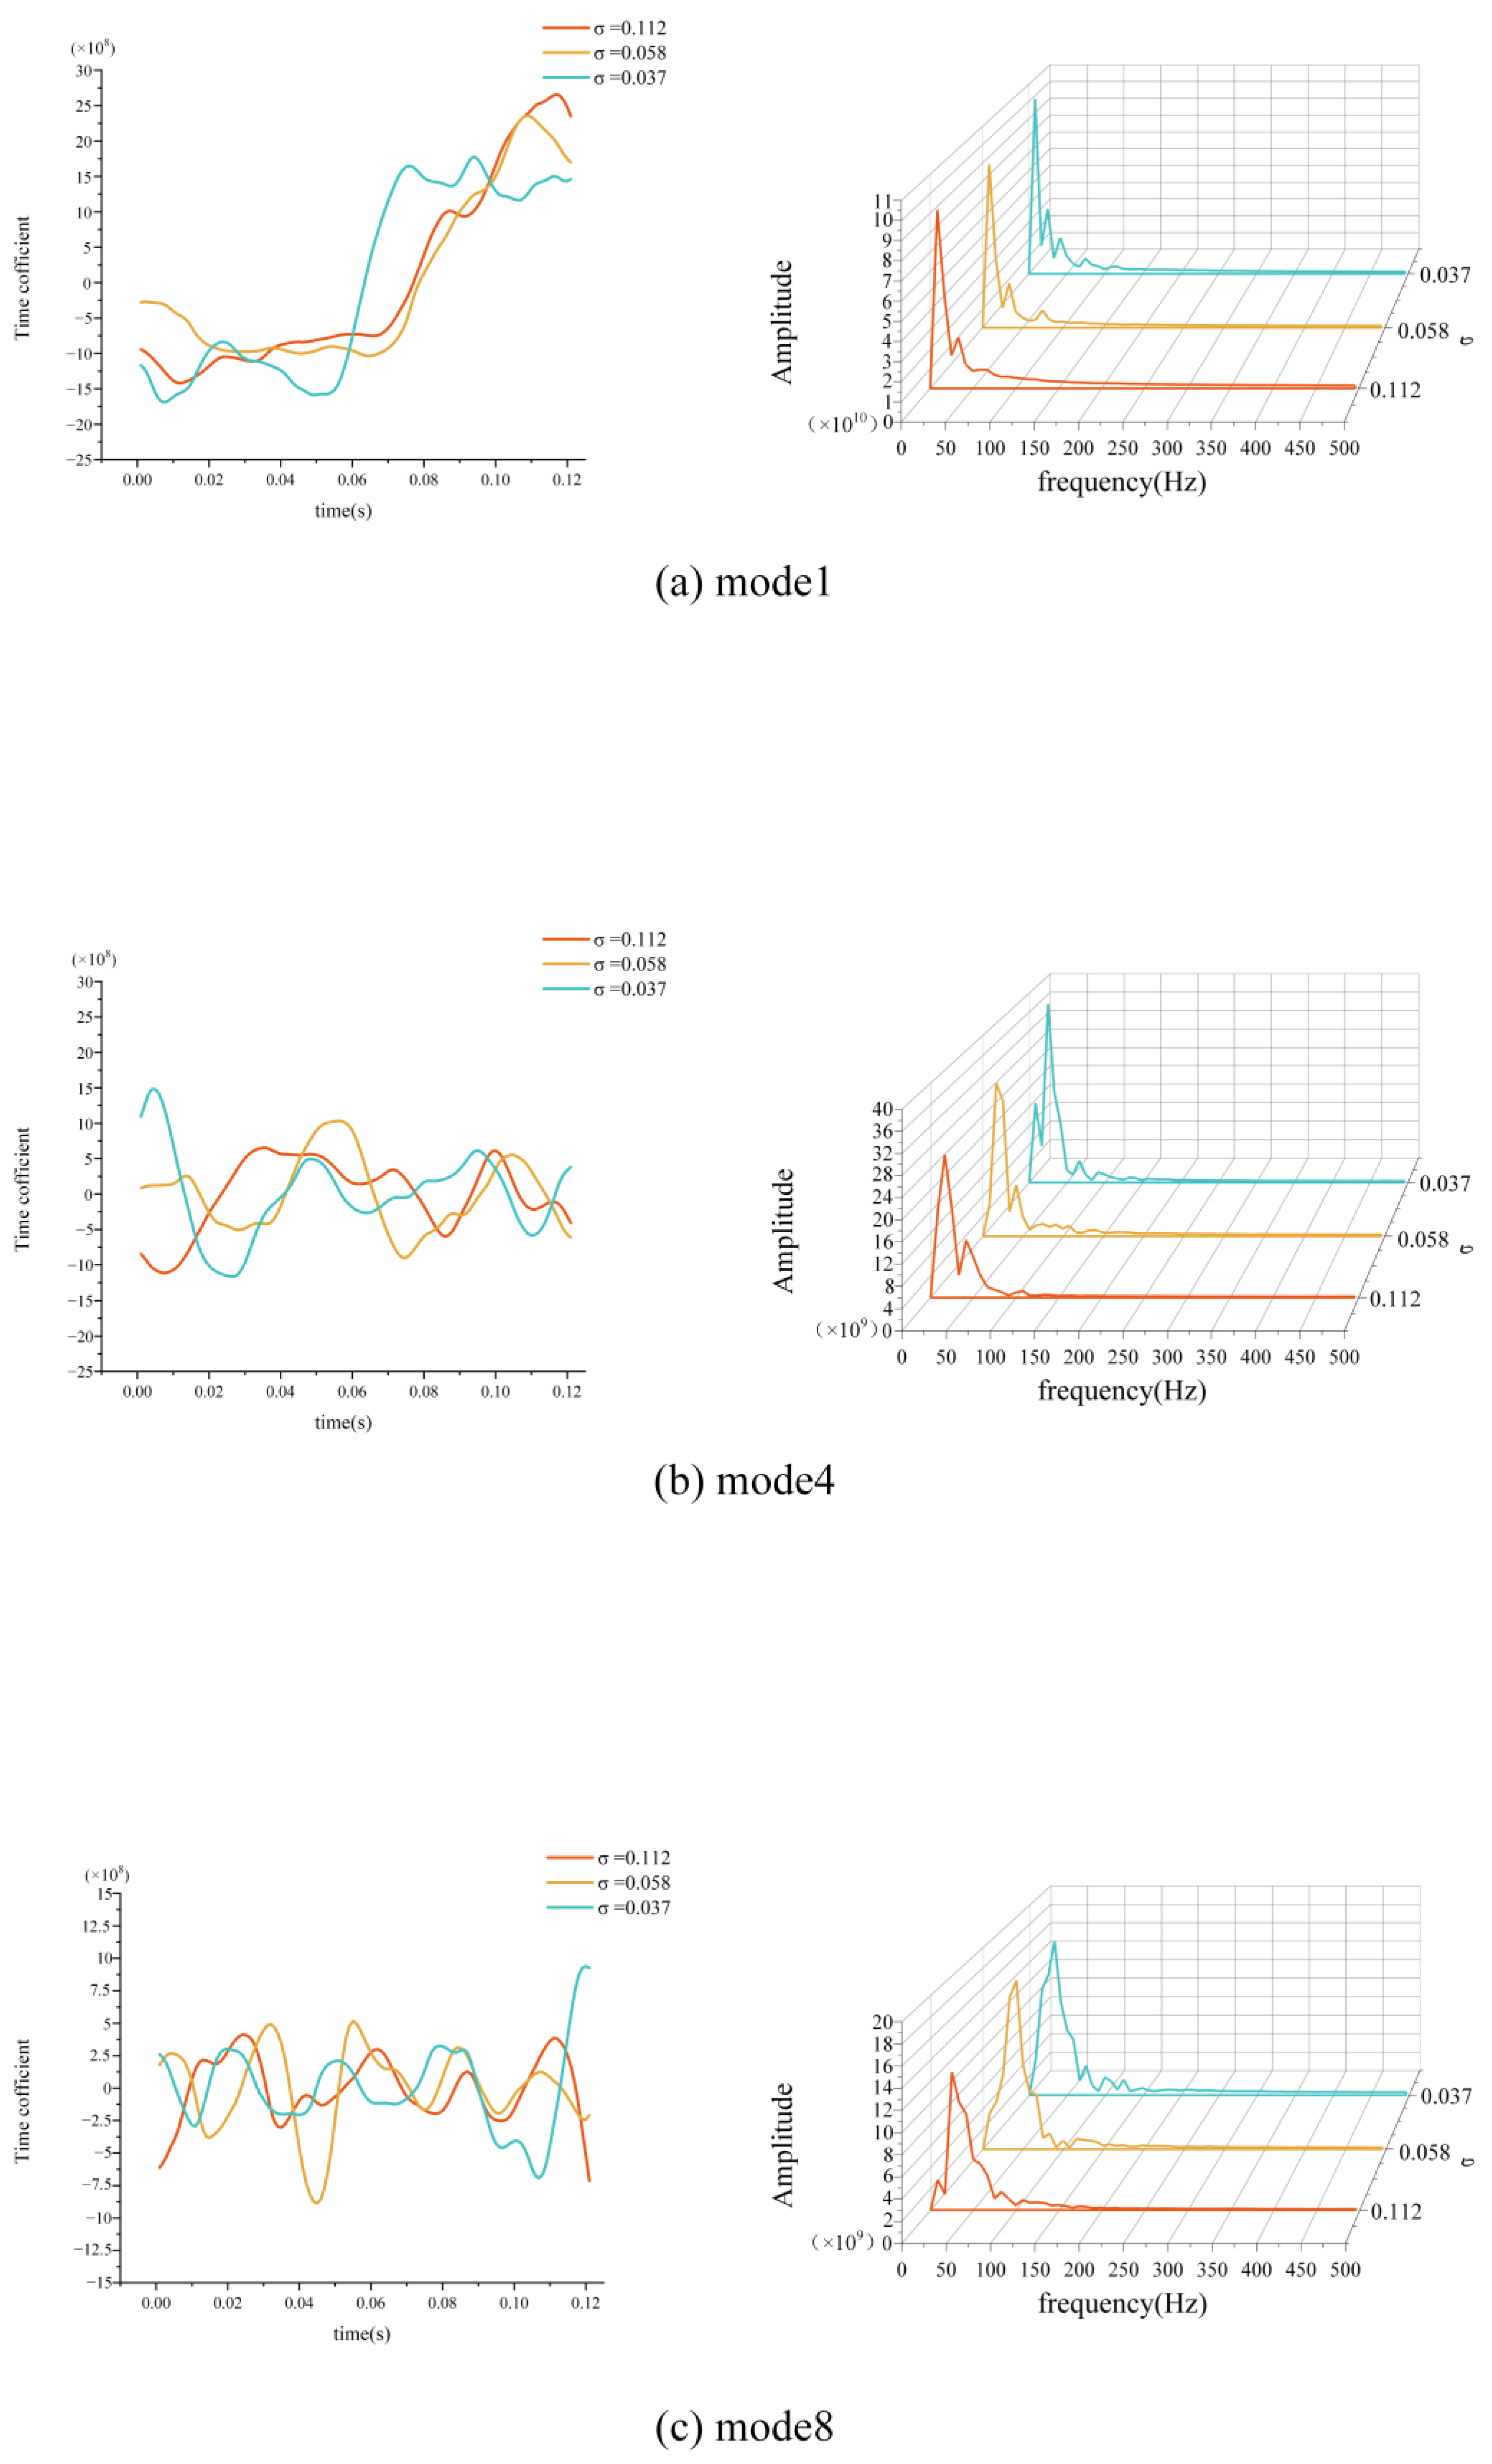
The time mode coefficients for the first, fourth, and eighth mode were subjected to a fast Fourier transform (FFT), resulting in the time evolution graphs and corresponding frequency spectra illustrated in Figure 15a–c. In Figure 15a, the evolution of the first-order POD mode’s time mode coefficients reveals a predominantly low frequency. This is attributed to a high energy proportion, indicating that the mode encompasses a significant amount of instability. As the instability of the cavitating flow field increases, the mode incorporates more unstable elements, leading to a chaotic evolution of the vortices. Conversely, as the mode order increases, the primary frequency in the time mode coefficients rises, while the energy proportion decreases, resulting in a reduction in the flow field information contained within the mode, thus rendering the frequency more distinct and clear.
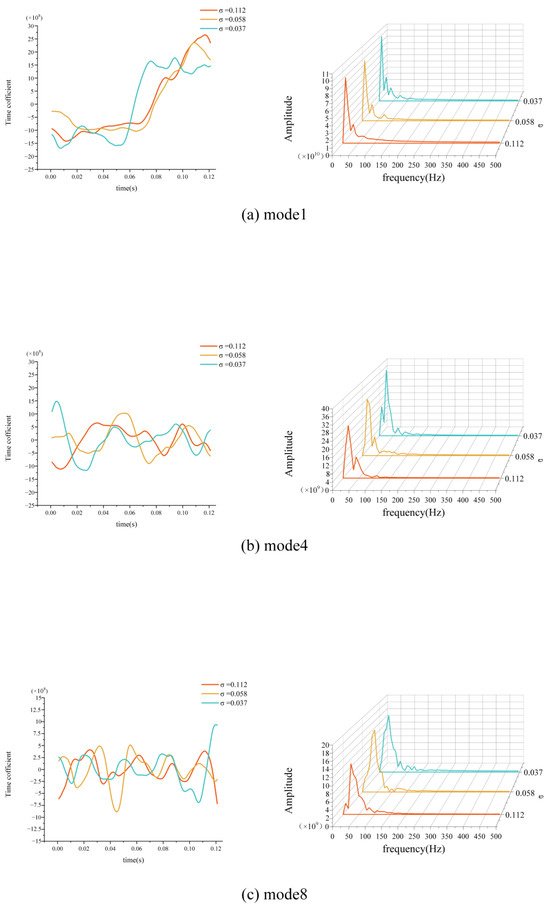
Figure 15.
Time mode coefficient time and frequency diagram.
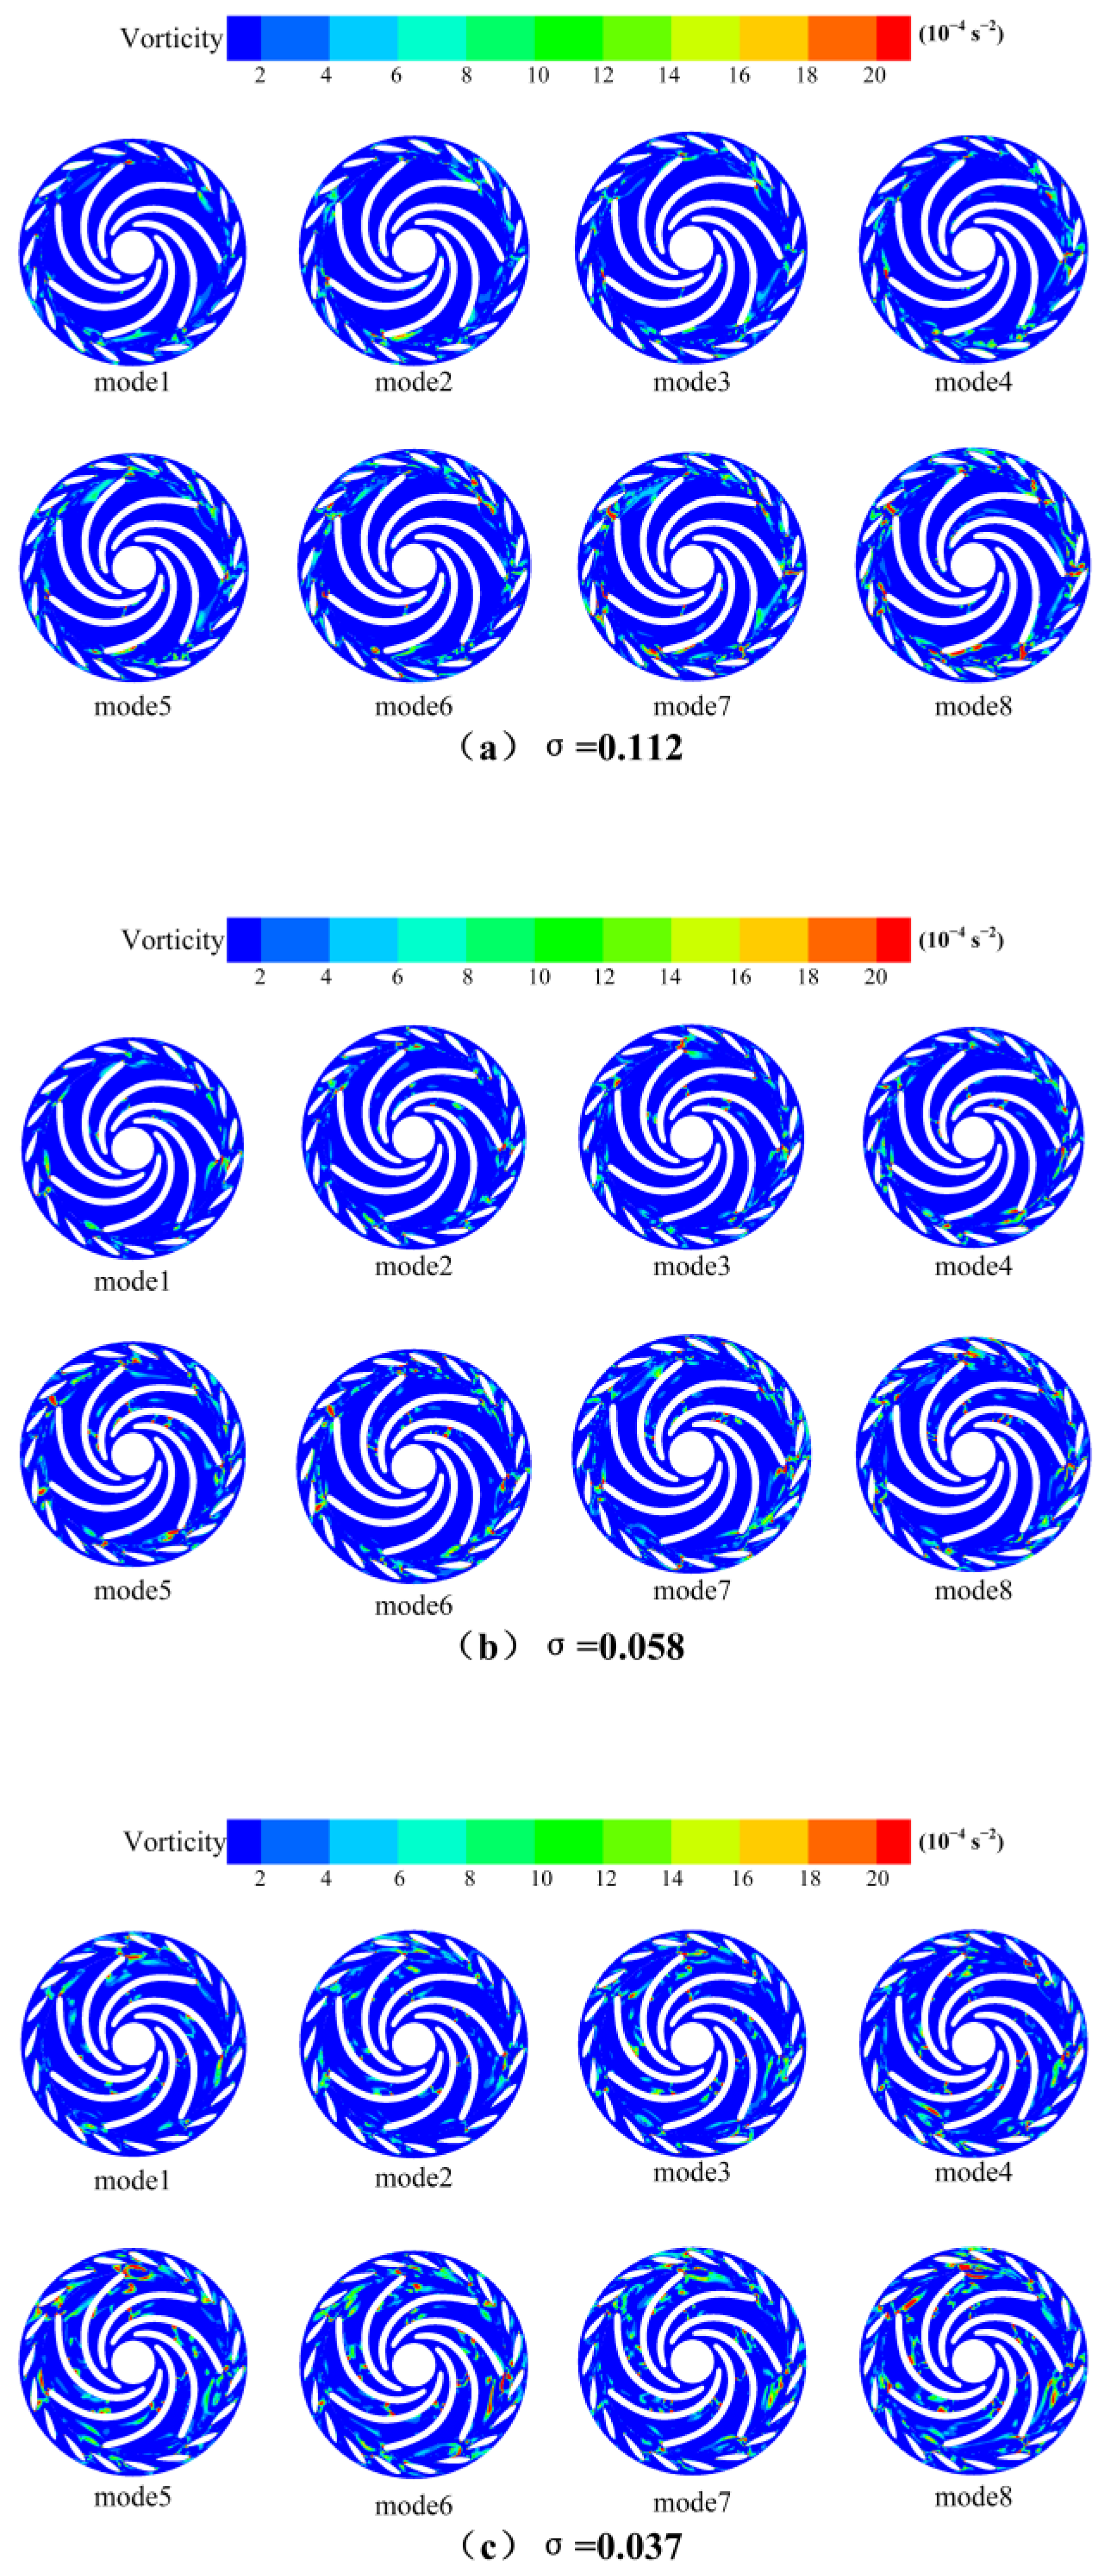
To provide a more intuitive and concrete observation of the coherent vortex structures at various cavitation levels, Figure 16 illustrates the spatial distribution of the first eight mode shapes. When the cavitation number σ is set at 0.112, mode 1 represents the coherent vortex attached to the outlet of the impeller blades. Modes 2–6 depict the diffusion of vorticity from the blade outlet into the non-bladed region. As the mode order increases to mode 7 and mode 8, the wake vortices at the blade outlet expand, leading to dynamic interactions with the movable guide vanes. Concurrently, numerous small-scale vortices emerge in the surrounding non-bladed area, and vorticity is also generated on both the pressure and suction sides of the blades. Therefore, at a cavitation number of σ = 0.112, the wake vortices at the blade outlet are distributed across all mode orders, representing the inherent modes of the flow field. The wake vortices from the blades are identified as the primary source of energy dissipation, while the small-scale vortices in the non-bladed region predominantly appear in higher mode orders, a phenomenon attributed to the characteristics of the unsteady flow field. Although the contribution of small-scale vortices to the main flow structure is relatively minor, their high-frequency evolution significantly enhances the energy dissipation within the flow field.

Figure 16.
The distribution of the first eight POD modes.
As cavitation progresses, the scale of the vortices represented by mode 1 increases, leading to a greater number of vortices adhering to the blade surfaces within the rotor passage. When severe cavitation occurs, vortices that detach from the suction side of the blades are distributed across all mode orders, particularly near the rotor exit. Concurrently, smaller-scale vortices begin to transition towards lower-order modes, which possess a higher energy contribution, thereby enhancing their impact on the flow field. Consequently, with the advancement of cavitation, the vortices associated with the blade wake, as represented by the lower-order modes, increase in size and number, resulting in heightened energy losses. This phenomenon is accompanied by a reduction in the energy contribution of mode 1, while the contributions from mode 2 and higher modes to the flow field become more significant, intensifying the unsteady characteristics of the flow and accelerating energy dissipation.
4.4. DMD Analysis of Vorticity Field
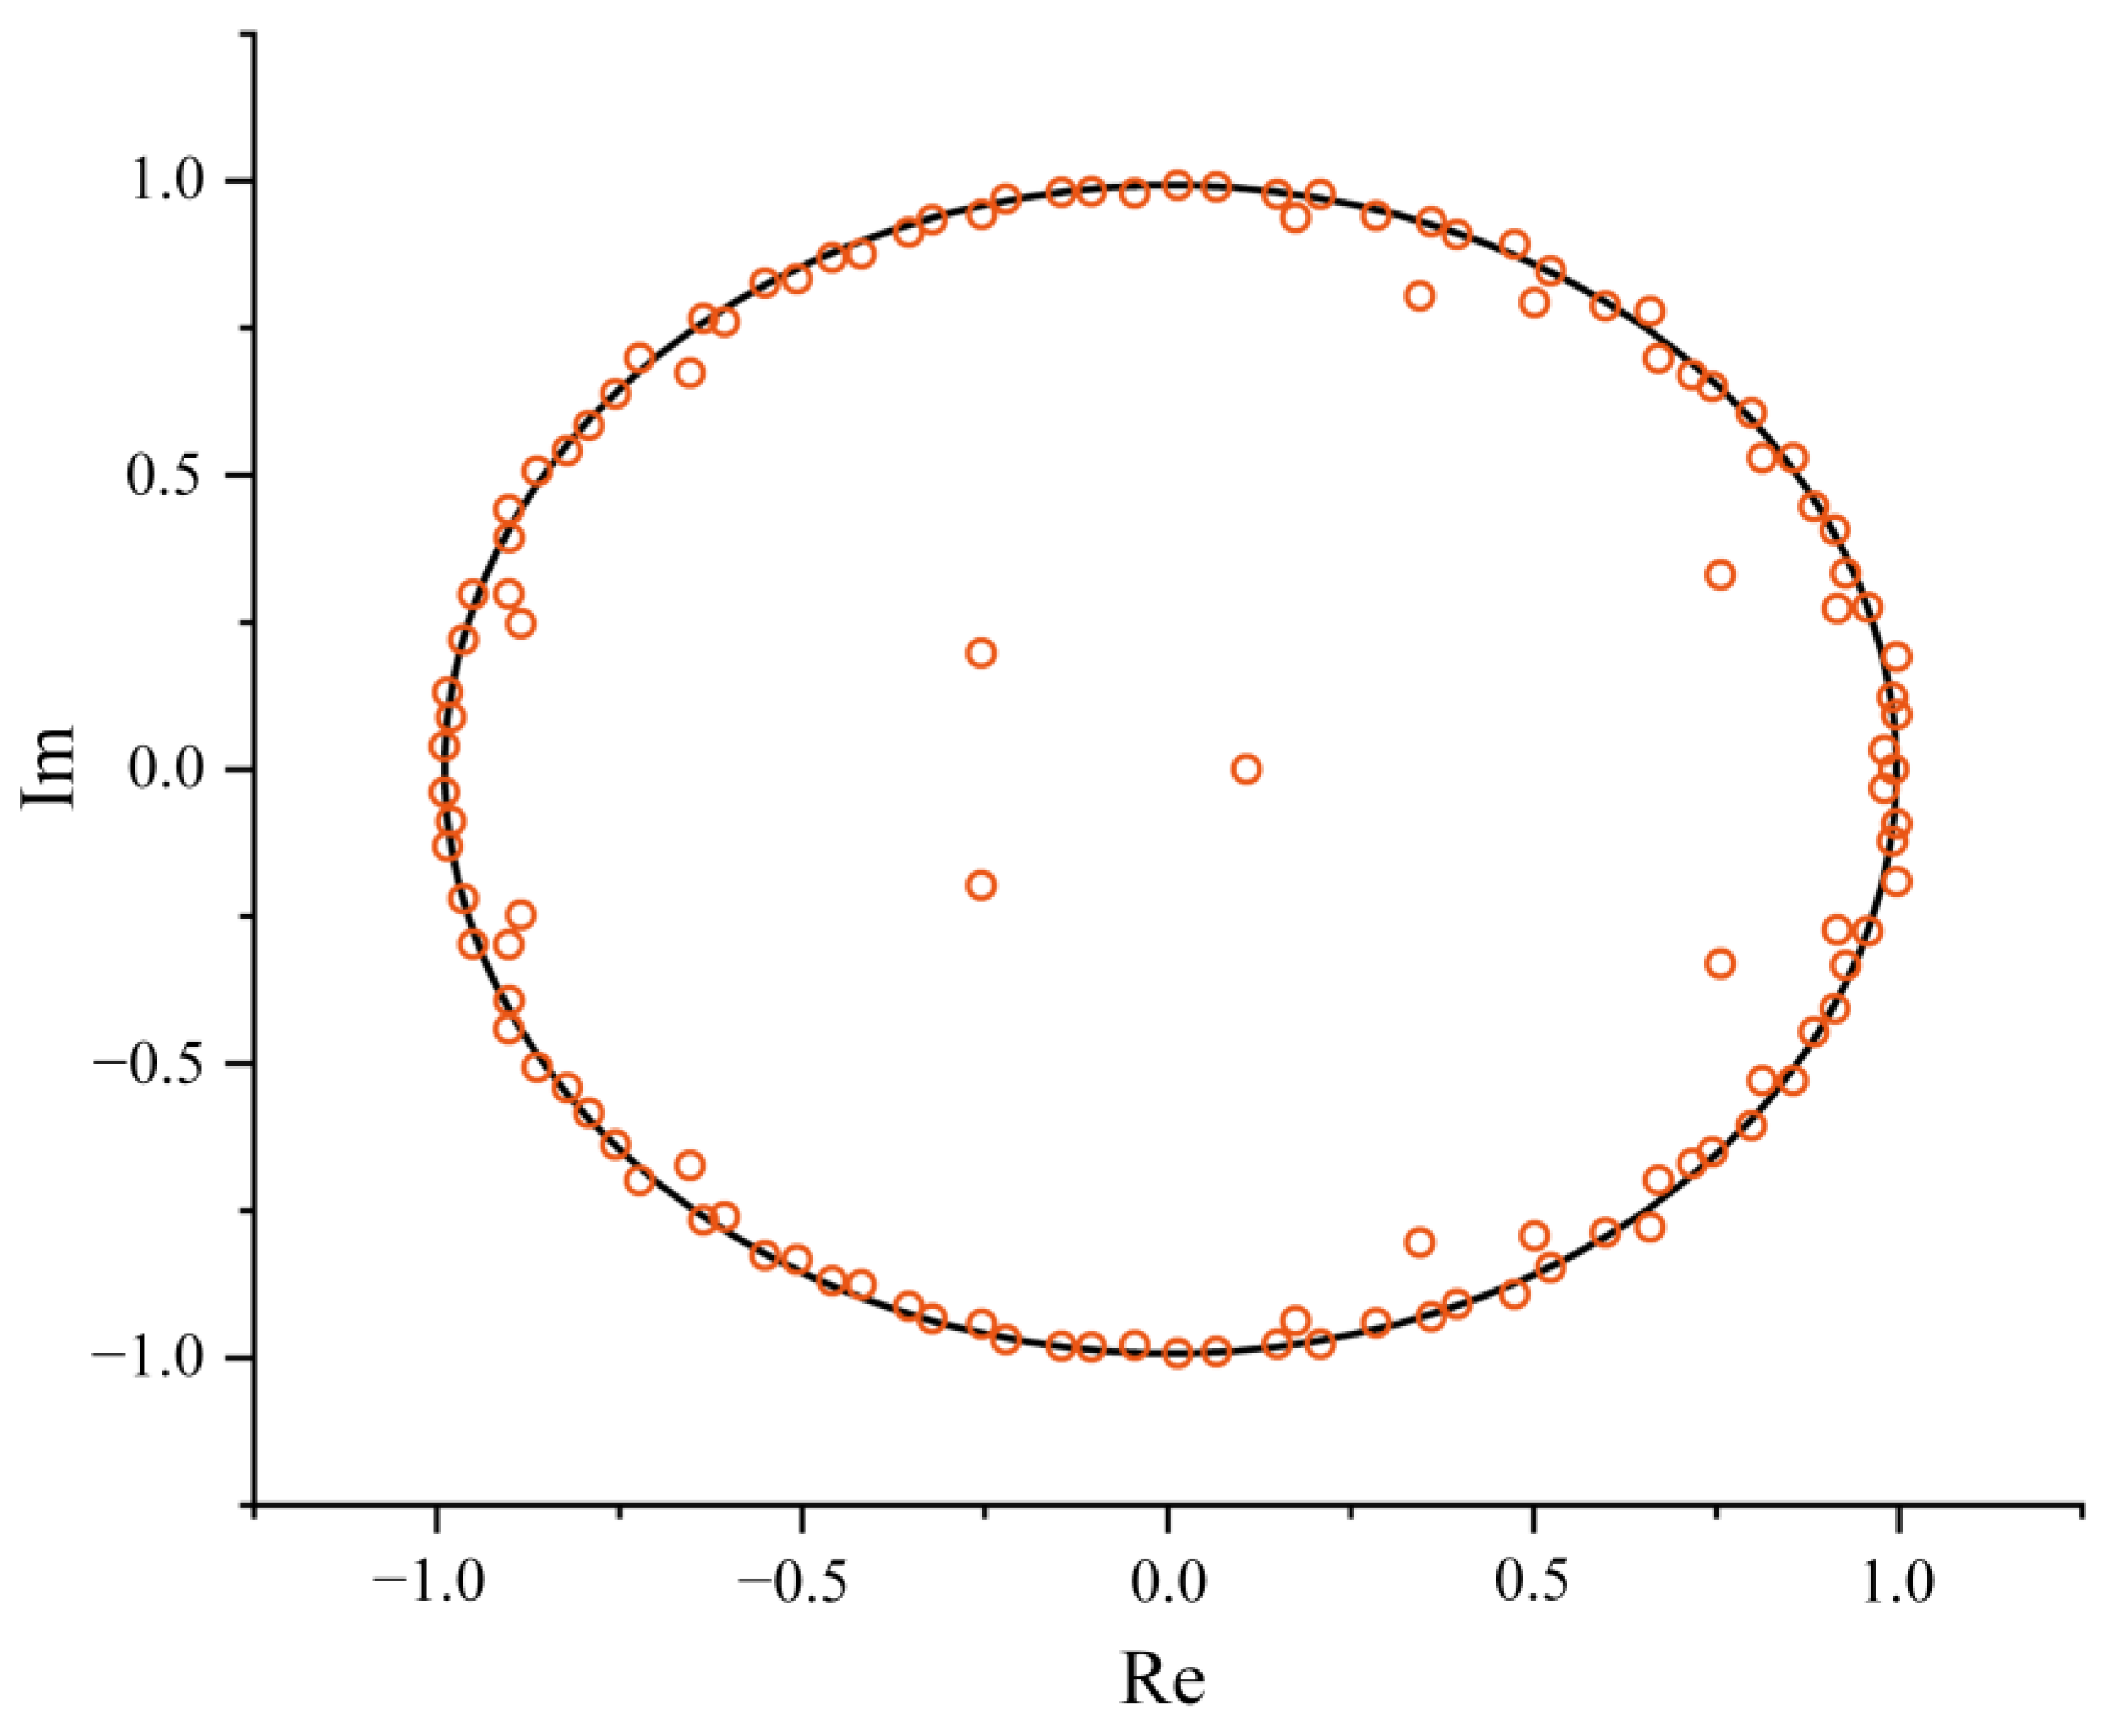
The POD method primarily identifies dominant coherent structures within a flow field by arranging modes based on their energetic contributions. The modes exhibit complex frequency components, and the DMD technique is employed for dimensionality reduction and decomposition of the flow field, allowing for the extraction of coherent structures at specific characteristic frequencies. This facilitates a comparative analysis of the dynamic characteristics of evolving vortex structures across different scales. Figure 17 illustrates the distribution of the DMD mode eigenvalues in the complex plane, where the horizontal axis represents the real part of the eigenvalues and the vertical axis represents the imaginary part. A majority of the eigenvalues cluster near the unit circle, indicating that the corresponding modes are relatively stable and represent the primary coherent structures of the vorticity field. Conversely, modes located within the unit circle are deemed unstable and do not correspond to the main vortex structures of the vorticity field. The parameters that describe the flow field information of each mode are the real parts of the spatial basis modes, with each set of conjugate eigenvalues corresponding to conjugate modes.
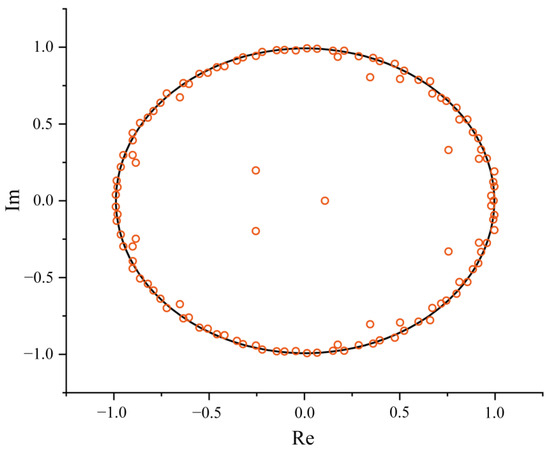
Figure 17.
Eigenvalue distribution.
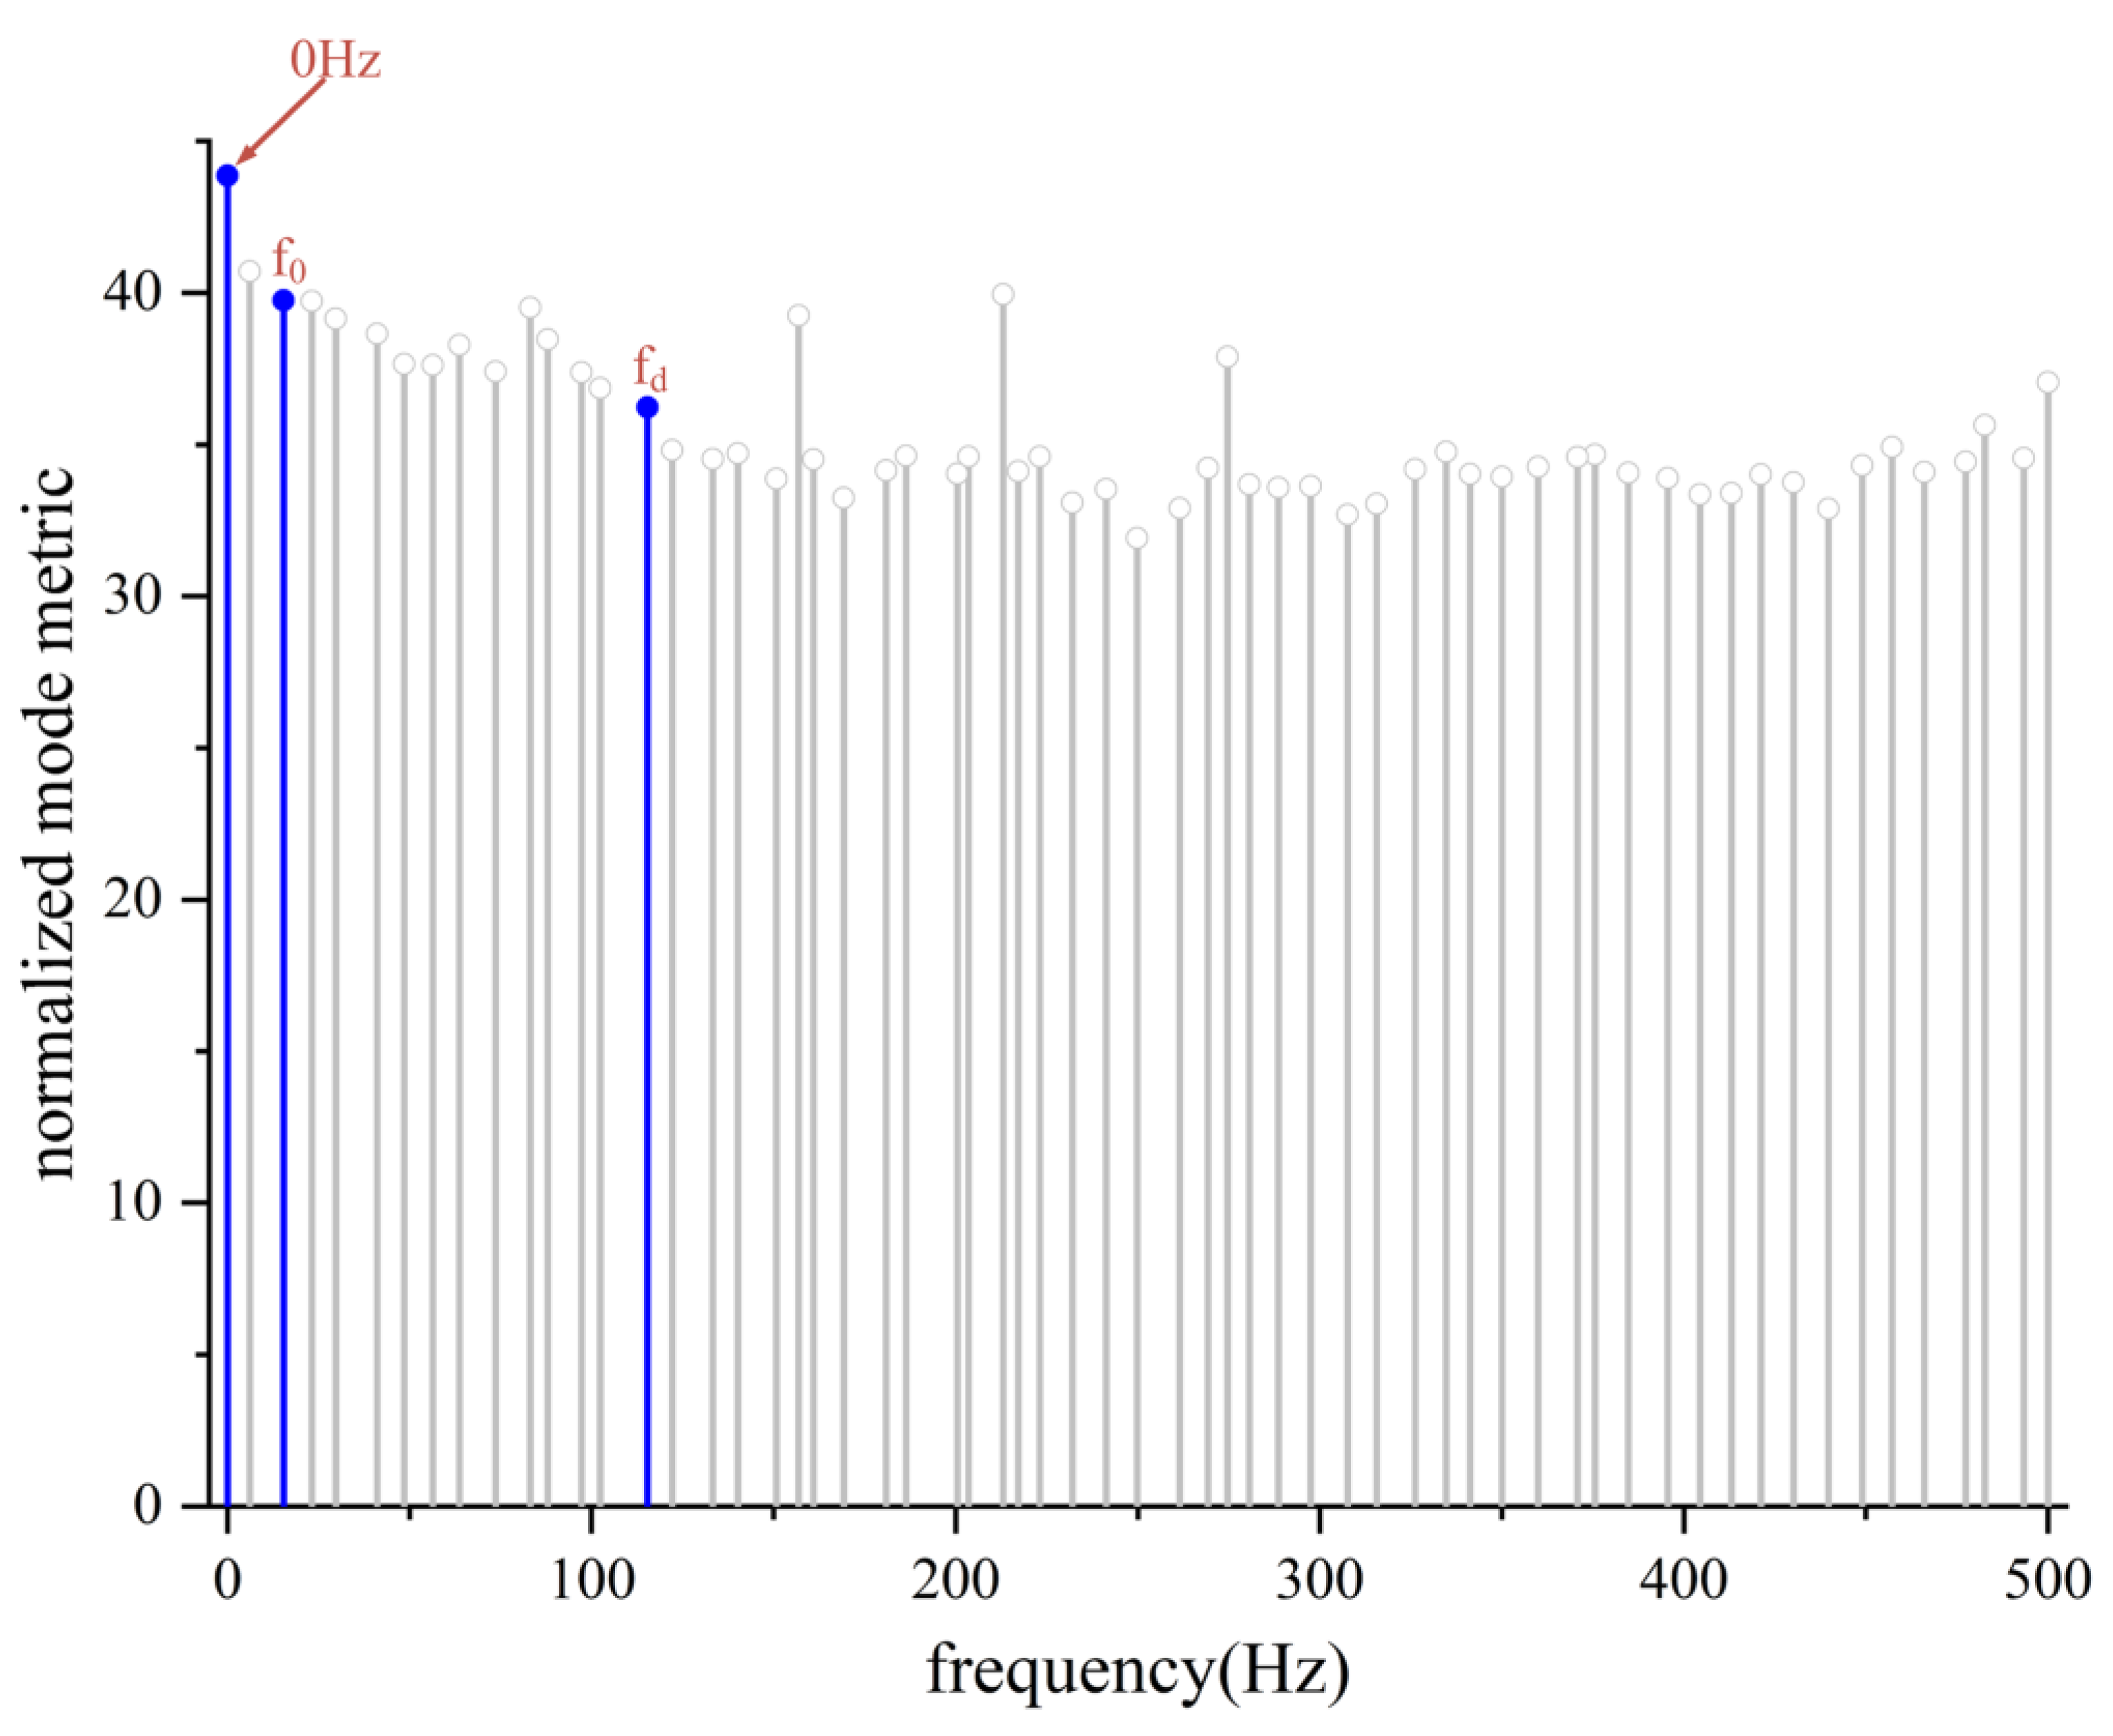
The mode frequencies and their corresponding correlation coefficients are illustrated in Figure 18. The analysis was conducted by extracting mode characteristics at three specific frequencies as follows: 0 Hz, the shaft passing frequency at f0 = 16.66 Hz, and the blade passing frequency at fd = 116.66 Hz, based on varying wheel speeds and the number of blades.
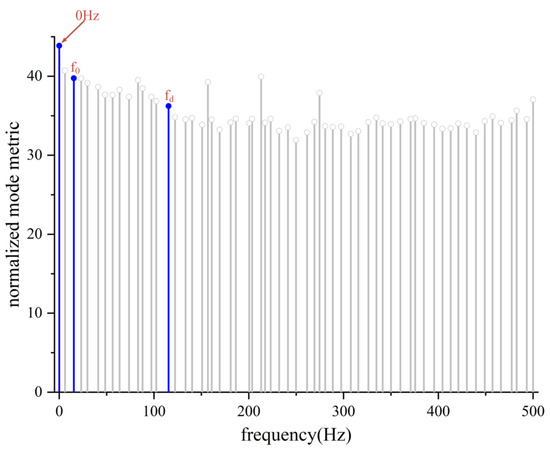
Figure 18.
DMD frequency spectral diagram.
The spatial distribution and comparison of three DMD modes under various cavitation conditions are illustrated in Figure 19. The spatial distribution of the 0 Hz frequency mode represents the dominant time-averaged flow field within the flow, highlighting the primary regions of vortex distribution. The coherent vortex locations in the f0 and fd frequency modes correspond to those observed in the 0 Hz frequency mode. The f0 frequency mode predominantly showcases large-scale coherent vortices evolving at the rotational frequency of the main axis. In contrast, the fd frequency mode depicts coherent vortices evolving at the blade passage frequency, characterized by smaller scales compared to the previous two modes. Consequently, the vortices in the cavitating flow field evolve primarily at the main axis rotational frequency, while the instability induced by cavitation also gives rise to coherent vortices evolving at higher frequencies, such as the blade passage frequency fd. As the degree of cavitation intensifies, there is an increase in the number of small-scale vortical structures.
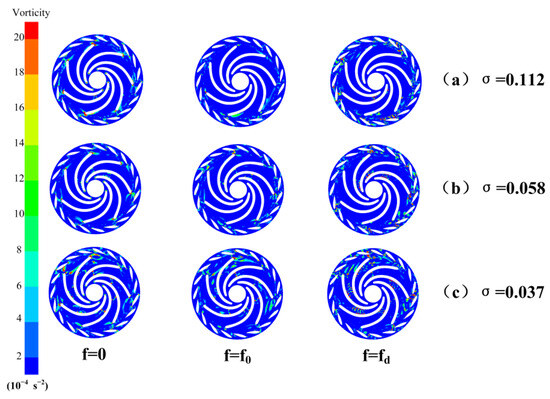
Figure 19.
DMD mode distribution.
5. Conclusions
This study investigated the impact of cavitation development on flow field structures through experimental and numerical methods, explored the correlation between energy loss distribution and vorticity distribution, and established the influence of cavitation evolution on vortex dynamics using mode decomposition methods. The key conclusions are as follows:
- The experimental and numerical performance curves align closely, with errors within acceptable limits, validating the accuracy of the numerical simulations. Using these simulations, cavitation characteristics under both the design flow rate (Qd) and 60% Qd conditions were investigated. Compared to the Qd condition, the 60% Qd condition exhibited more severe cavitation phenomena and larger-scale vortex structures.
- The Q criterion and entropy production results demonstrate that high-entropy-production regions closely coincide with high-intensity vortex regions under identical cavitation conditions; consequently, vortices in cavitation flow fields are identified as the primary cause of energy loss in hydraulic machinery.
- As the mode order increases, the energy content percentage of each mode decreases. The cumulative energy contribution of the first eight POD modes exceeds 99%, encompassing the dominant flow field structures. Specifically, low-order POD modes represent large-scale vortices with low-frequency characteristics and complex frequency characteristics, while high-order modes correspond to small-scale vortices characterized by high-frequency components and simpler frequency components. Intensified cavitation enhances flow field instability, leading to a reduction in energy contribution from low-order modes and an increase in high-order mode energy, accompanied by a rise in the vortex evolutionary frequency mode.
- The DMD method is employed to decompose the flow field from a frequency perspective, allowing for the extraction of coherent vortices. Cavitation vortices evolve at the rotational frequency of the main shaft f0, while the instability characteristics of the flow field induced by cavitation are accompanied by coherent vortices that evolve at higher frequencies, such as the blade passage frequency fd. Furthermore, as the degree of cavitation intensifies, there is an increase in the number of small-scale vortex structures.
The mode decomposition method proposed in this paper can be extended to other turbine flow field analyses, and the conclusions obtained can provide some reference for the design of pump turbine units. As this study did not use a certain linear combination of modes to perform flow field reconstruction, it is possible to further develop modes to combine the advantages of POD and DMD to form a new mode decomposition method and perform fast flow field reconstruction. Through the use of artificial intelligence to analyze and reconstruct the flow field, a function to predict the cavitation flow field quickly and accurately can be formed, and the cavitation performance of the machinery can be evaluated according to the corresponding indicators such that the fluid machinery can be optimized to the greatest extent in a very short time and the time cost can be greatly reduced.
Author Contributions
Analyzed the data and wrote the paper, J.L. (Jiaxing Lu) and J.L. (Jiarui Li); C.Z., Y.Z. and Y.H. designed the experiment and performed the simulation. All authors have read and agreed to the published version of the manuscript.
Funding
This work was funded by the Sichuan Province natural science Foundation project and the Joint Fund of National Natural Science Foundation (no. 2024NSFSC0214 and no. U23A20669).
Data Availability Statement
The data presented in this study are available in the main text of the article.
Conflicts of Interest
The authors declare no conflict of interest.
References
- Ambec, S.; Crampes, C. Electricity Provision with Intermittent Sources of Energy. Resour. Energy Econ. 2012, 34, 319–336. [Google Scholar] [CrossRef]
- Guezgouz, M.; Jurasz, J.; Bekkouche, B.; Ma, T.; Javed, M.S.; Kies, A. Optimal Hybrid Pumped Hydro-Battery Storage Scheme for off-Grid Renewable Energy Systems. Energy Convers. Manag. 2019, 199, 112046. [Google Scholar] [CrossRef]
- Pommeret, A.; Schubert, K. Optimal Energy Transition with Variable and Intermittent Renewable Electricity Generation. J. Econ. Dyn. Control 2022, 134, 104273. [Google Scholar] [CrossRef]
- Rehman, S.; Al-Hadhrami, L.M.; Alam, M.M. Pumped Hydro Energy Storage System: A Technological Review. Renew. Sustain. Energy Rev. 2015, 44, 586–598. [Google Scholar] [CrossRef]
- Widén, J.; Carpman, N.; Castellucci, V.; Lingfors, D.; Olauson, J.; Remouit, F.; Bergkvist, M.; Grabbe, M.; Waters, R. Variability Assessment and Forecasting of Renewables: A Review for Solar, Wind, Wave and Tidal Resources. Renew. Sustain. Energy Rev. 2015, 44, 356–375. [Google Scholar] [CrossRef]
- Xu, L.; Kan, K.; Zheng, Y.; Liu, D.; Binama, M.; Xu, Z.; Yan, X.; Guo, M.; Chen, H. Rotating Stall Mechanism of Pump-Turbine in Hump Region: An Insight into Vortex Evolution. Energy 2024, 292, 130579. [Google Scholar] [CrossRef]
- Liu, Y.; Gong, J.; An, K.; Wang, L. Cavitation Characteristics and Hydrodynamic Radial Forces of a Reversible Pump–Turbine at Pump Mode. J. Energy Eng. 2020, 146, 04020066. [Google Scholar] [CrossRef]
- Tao, R.; Xiao, R.; Wang, F.; Liu, W. Cavitation Behavior Study in the Pump Mode of a Reversible Pump-Turbine. Renew. Energy 2018, 125, 655–667. [Google Scholar] [CrossRef]
- Zhang, L.; Jing, X.; Wang, Z.; Chang, J.; Peng, G. Analysis of Francis Pump-Turbine Runner Cavitation Flows in Pump Mode. In Proceedings of the ASME 2009 Fluids Engineering Division Summer Meeting, Vail, CO, USA, 2–6 August 2009; pp. 131–134. [Google Scholar]
- Li, G.; Hou, W.; Wang, H.; Qin, H.; Zhu, G. Study on Cavitation Performance of High Water-Head Pump Turbine Based on CFD. Power Syst. Clean Energy 2017, 33, 131–136. [Google Scholar] [CrossRef]
- Hao, Y.; Tan, L. Symmetrical and Unsymmetrical Tip Clearances on Cavitation Performance and Radial Force of a Mixed Flow Pump as Turbine at Pump Mode. Renew. Energy 2018, 127, 368–376. [Google Scholar] [CrossRef]
- Meng, Q.; Shen, X.; Zhao, X.; Yang, G.; Zhang, D. Numerical Investigation on Cavitation Vortex Dynamics of a Centrifugal Pump Based on Vorticity Transport Method. JMSE 2023, 11, 1424. [Google Scholar] [CrossRef]
- Wu, J.; Qiu, N.; Zhu, H.; Xu, P.; Si, Q. Numerical Analysis of Vortex Structure in Centrifugal Pump Based on Unsteady Cavitation Flow. J. Xihua Univ. 2023, 42, 90–99. [Google Scholar]
- Zhang, Y.; Liu, K.; Li, J.; Xian, H.; Du, X. Analysis of the Vortices in the Inner Flow of Reversible Pump Turbine with the New Omega Vortex Identification Method. J. Hydrodyn 2018, 30, 463–469. [Google Scholar] [CrossRef]
- Ruan, H.; Guo, P.; Yu, L.; Zhou, C.; Chao, W.; Li, X. Cavitation induced flow instability mechanism of pumptubine under pump conditions. J. Drain. Irrig. Mach. Eng. 2021, 41, 779–786. [Google Scholar]
- Gong, R.; Wang, H.; Chen, L.; Li, D.; Zhang, H.; Wei, X. Application of Entropy Production Theory to Hydro-Turbine Hydraulic Analysis. Sci. China Technol. Sci. 2013, 56, 1636–1643. [Google Scholar] [CrossRef]
- Li, D.; Gong, R.; Wang, H.; Xiang, G.; Wei, X.; Qin, D. Entropy Production Analysis for Hump Characteristics of a Pump Turbine Model. Chin. J. Mech. Eng. 2016, 29, 803–812. [Google Scholar] [CrossRef]
- Yu, A.; Wang, Y.; Lv, S.; Tang, Q. Numerical Analysis of the Cavity Vorticity Transport and Entropy Production in a Micropump. Int. Commun. Heat Mass Transf. 2024, 159, 108144. [Google Scholar] [CrossRef]
- Lumley, J. The structure of inhomogeneous turbulent flows. Atmos. Turbul. Radio Wave Propag. 1967, 166–178. [Google Scholar]
- Schmid, P.; Sesterhenn, J. Dynamic Mode Decomposition of Numerical and Experimental Data. J. Fluid Mech. 2008, 656, 5–28. [Google Scholar] [CrossRef]
- Lu, J.; Wu, F.; Liu, X.; Zhu, B.; Yuan, S.; Wang, J. Investigation of the Mechanism of Unsteady Flow Induced by Cavitation at the Tongue of a Centrifugal Pump Based on the Proper Orthogonal Decomposition Method. Phys. Fluids 2022, 34, 105113. [Google Scholar] [CrossRef]
- Yang, G.; Zhang, D.; Shen, X.; Pan, Q.; Pang, Q.; Lu, Q. Investigation on Flow Instability in the Hump Region of the Large Vertical Centrifugal Pump under Cavitation Conditions Based on Proper Orthogonal Decomposition. Phys. Fluids 2024, 36, 115134. [Google Scholar] [CrossRef]
- Yang, J.; Feng, X.; Liao, Z.; Pan, K.; Liu, X. Analysis on the Mechanism of Rotating Stall Inner a Pump Turbine in Pump Mode Based on the Proper Orthogonal Decomposition. J. Fluids Eng. 2023, 145, 091202. [Google Scholar] [CrossRef]
- Xie, Q.; Chen, L.; Zhang, G.; Sun, T. Analysis of unsteady cavitation flow over hydrofoil based on dynamic mode decomposition. Chin. J. Theor. Appl. Mech. 2020, 52, 1045–1054. [Google Scholar]
- Lu, J.; Liu, J.; Qian, L.; Liu, X.; Yuan, S.; Zhu, B.; Dai, Y. Investigation of Pressure Pulsation Induced by Quasi-Steady Cavitation in a Centrifugal Pump. Phys. Fluids 2023, 35, 025119. [Google Scholar] [CrossRef]
- Sirovich, L. Turbulence and the dynamics of coherent structures. I. Coherent structures. Q. Appl. Math. 1987, 45, 561–571. [Google Scholar] [CrossRef]
- Cavazzini, G.; Houdeline, J.-B.; Pavesi, G.; Teller, O.; Ardizzon, G. Unstable Behaviour of Pump-Turbines and Its Effects on Power Regulation Capacity of Pumped-Hydro Energy Storage Plants. Renewable and Sustainable Energy Reviews 2018, 94, 399–409. [Google Scholar] [CrossRef]


Disclaimer/Publisher’s Note: The statements, opinions and data contained in all publications are solely those of the individual author(s) and contributor(s) and not of MDPI and/or the editor(s). MDPI and/or the editor(s) disclaim responsibility for any injury to people or property resulting from any ideas, methods, instructions or products referred to in the content. |
© 2025 by the authors. Licensee MDPI, Basel, Switzerland. This article is an open access article distributed under the terms and conditions of the Creative Commons Attribution (CC BY) license (https://creativecommons.org/licenses/by/4.0/).