Article

Optimizing Oil Recovery: A Sector Model Study of CO₂-Water-Alternating-Gas and Continuous Injection Technologies

1
Department of Petroleum Engineering, University of Louisiana, Lafayette, LA 70504, USA
2
Department of Petroleum Engineering, Colorado School of Mines, Golden, CO 80401, USA
*
Author to whom correspondence should be addressed.
Processes 2025, 13(3), 700; https://doi.org/10.3390/pr13030700
Submission received: 22 January 2025 / Revised: 23 February 2025 / Accepted: 26 February 2025 / Published: 28 February 2025
(This article belongs to the Special Issue Advances in Oil and Gas Reservoir Modeling and Simulation)

Abstract

:
Optimizing oil recovery from mature reservoirs remains a key challenge in the petroleum industry. This study evaluates the efficiency of CO2-WAG injection compared to continuous CO2 and water flooding using a sector model of the X Oil Field. A compositional reservoir simulator was employed to analyze oil recovery under water-wet and mixed-wet conditions, incorporating three-phase relative permeability and wettability effects. The results show that continuous CO2 flooding yields the highest oil recovery, with water-wet systems outperforming mixed-wet reservoirs. CO2-WAG injection provides a balanced approach, enhancing recovery while enabling CO2 sequestration, but remains less effective than continuous CO2 flooding. Water flooding, though the least efficient in terms of oil recovery, demonstrates long-term production stability. The gas–oil ratio (GOR) is notably higher in CO2-WAG, indicating gas breakthrough challenges. These findings emphasize the significant role of wettability in enhanced oil recovery (EOR) and suggest that continuous CO2 flooding is the most effective technique for maximizing production in heterogeneous reservoirs. This study contributes valuable insights for optimizing injection strategies, improving hydrocarbon recovery, and supporting sustainable reservoir management.

1. Introduction

Enhanced oil recovery (EOR) techniques play a pivotal role in maximizing hydrocarbon extraction from mature and heterogeneous reservoirs, where conventional methods often fail to achieve economic recovery targets. Among CO2-based EOR strategies, Water-Alternating-Gas (CO2-WAG) injection and continuous CO2 flooding have emerged as leading approaches due to their potential to improve sweep efficiency and mitigate challenges such as gas channeling and gravity override. Numerous studies have demonstrated that these technologies can enhance the EOR by 5–17% compared to traditional methods [1,2,3]. While WAG injection has historically been favored for its ability to balance fluid mobility and delay gas breakthrough, recent advancements have underscored a growing debate over the efficacy of continuous CO₂ flooding in heterogeneous reservoirs, particularly under specific operational and geological conditions [4,5,6,7,8].
A wealth of studies have demonstrated the advantages of WAG injection in heterogeneous systems. For instance, Al-Obaidi, Galkin and Smirnov [4] reported a 12% increase in oil recovery in water-wet carbonate reservoirs through improved mobility control. Recent findings have further reinforced these observations, with chemical-assisted WAG (e.g., surfactant- or foam-enhanced injection) achieving up to 5% higher recovery rates in fractured reservoirs compared to traditional methods [9]. However, emerging evidence has challenged this consensus. For example, a field study of a highly heterogeneous sandstone reservoir revealed that optimized continuous CO2 flooding outperformed WAG by 14% over a 15-year period, achieving 97 MMSTB recovery through high-pressure (2700 psi) miscible displacement [10]. Similarly, advanced numerical simulations have highlighted that continuous CO2 injection in reservoirs with staggered well patterns yield 3.1% higher recovery in high-permeability zones, emphasizing the role of operational design in EOR success [11,12].
The conflicting findings stem from unresolved complexities in heterogeneous reservoirs, including wettability dynamics and fluid–rock interactions. In water-wet systems, WAG’s alternating phases enhance macroscopic sweep by suppressing CO2’s low viscosity, but mixed-wet conditions introduce uncertainties. A simulation study demonstrated that continuous CO2 flooding can bypass wettability-driven trapping in mixed-wet reservoirs, outperforming WAG by 8% when capillary forces dominate [10]. Furthermore, operational parameters such as injection pressure, well spacing, and CO2 recycling efficiency (e.g., 40% in continuous vs. 25% in WAG) critically influence outcomes, as highlighted in recent economic analyses. Despite these insights, gaps persist in understanding how three-phase flow hysteresis, permeability anisotropy, and economic constraints interact to determine optimal EOR strategies.
This study addresses these gaps by conducting a comparative numerical analysis of CO2-WAG and continuous flooding in the X Oil Field’s heterogeneous sector model. Leveraging current advancements in compositional simulation frameworks (e.g., GEM and Eclipse), the work incorporates three-phase relative permeability hysteresis models and wettability variations to evaluate the sweep efficiency under realistic reservoir conditions.
By bridging theoretical insights with practical operational constraints, this study aims to resolve the ongoing debate over EOR optimization in heterogeneous reservoirs. The findings will provide actionable guidelines for selecting CO2-WAG and continuous injection methods, tailored to reservoir architecture, wettability profiles, and infrastructure readiness.

2. Materials and Methods

2.1. Properties of the Sector Model

A compositional simulation software was used for the numerical simulation of this study. Figure 1 demonstrates a 3D view of a seven-point CO2-WAG sector model. There are 32 layers in the model, and each layer has its own characteristics. The porosity and permeability distribution in some of the layers are shown in the figures below.

2.2. Reservoir Porosity

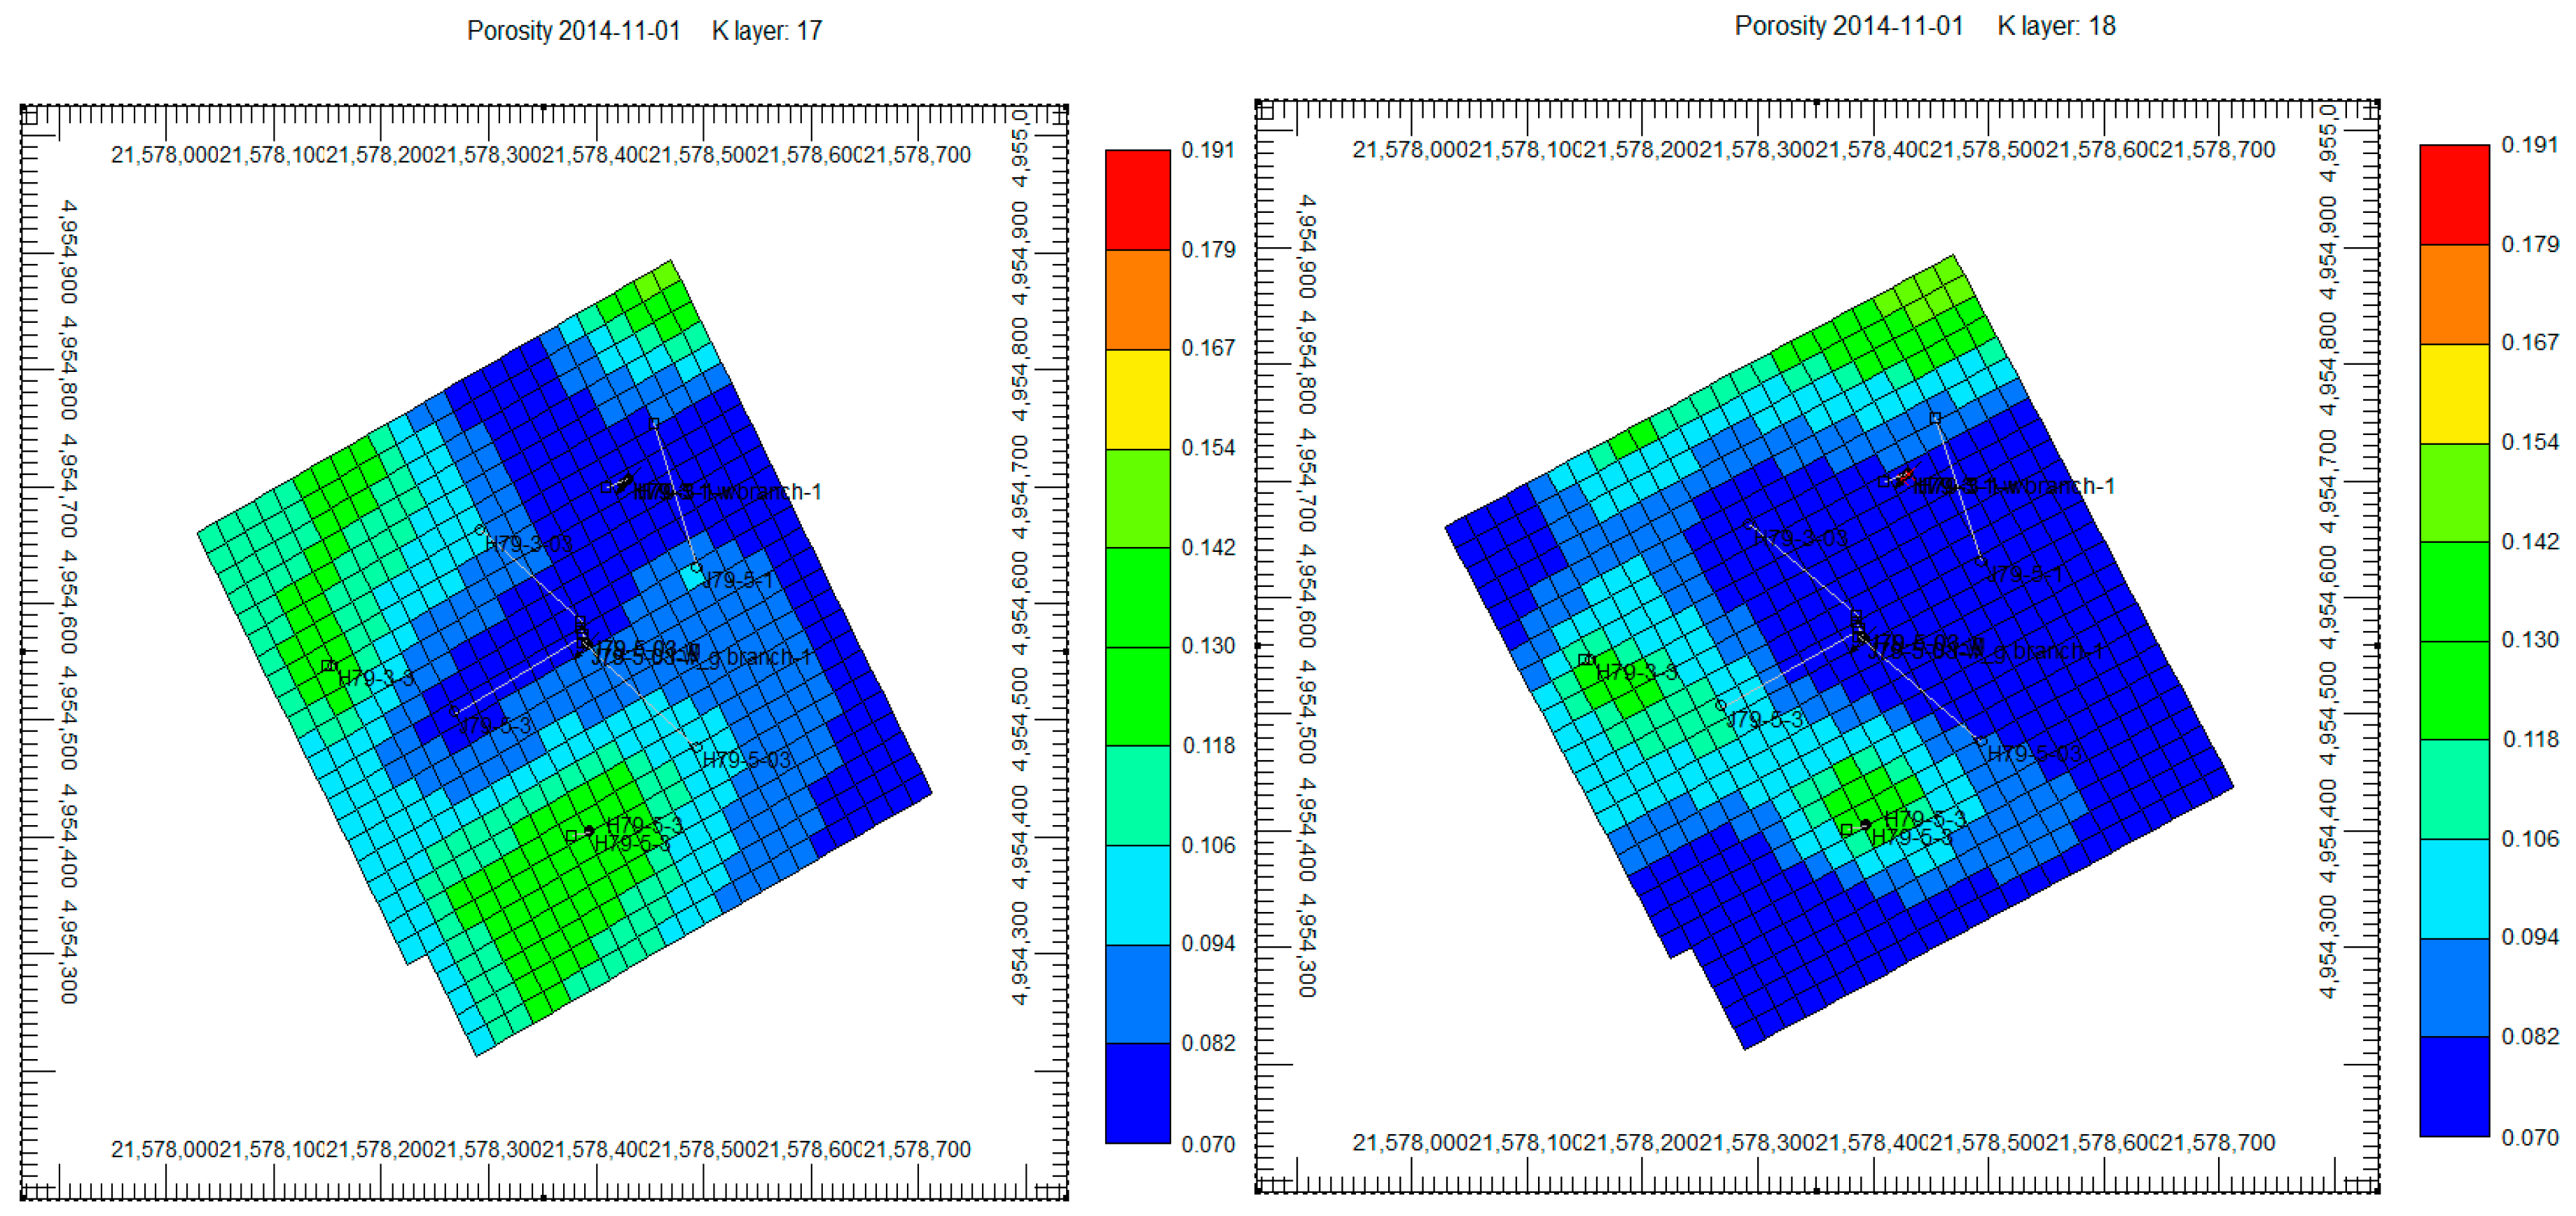
In this reservoir, the porosity ranges from 0.070 to 0.091. Most of the layers have the same porosity; however, the highest porosity value of 0.091 was found in layer 20. Figure 2 portrays the porosity distributions in layers 17 and 18.

2.3. Reservoir Permeability

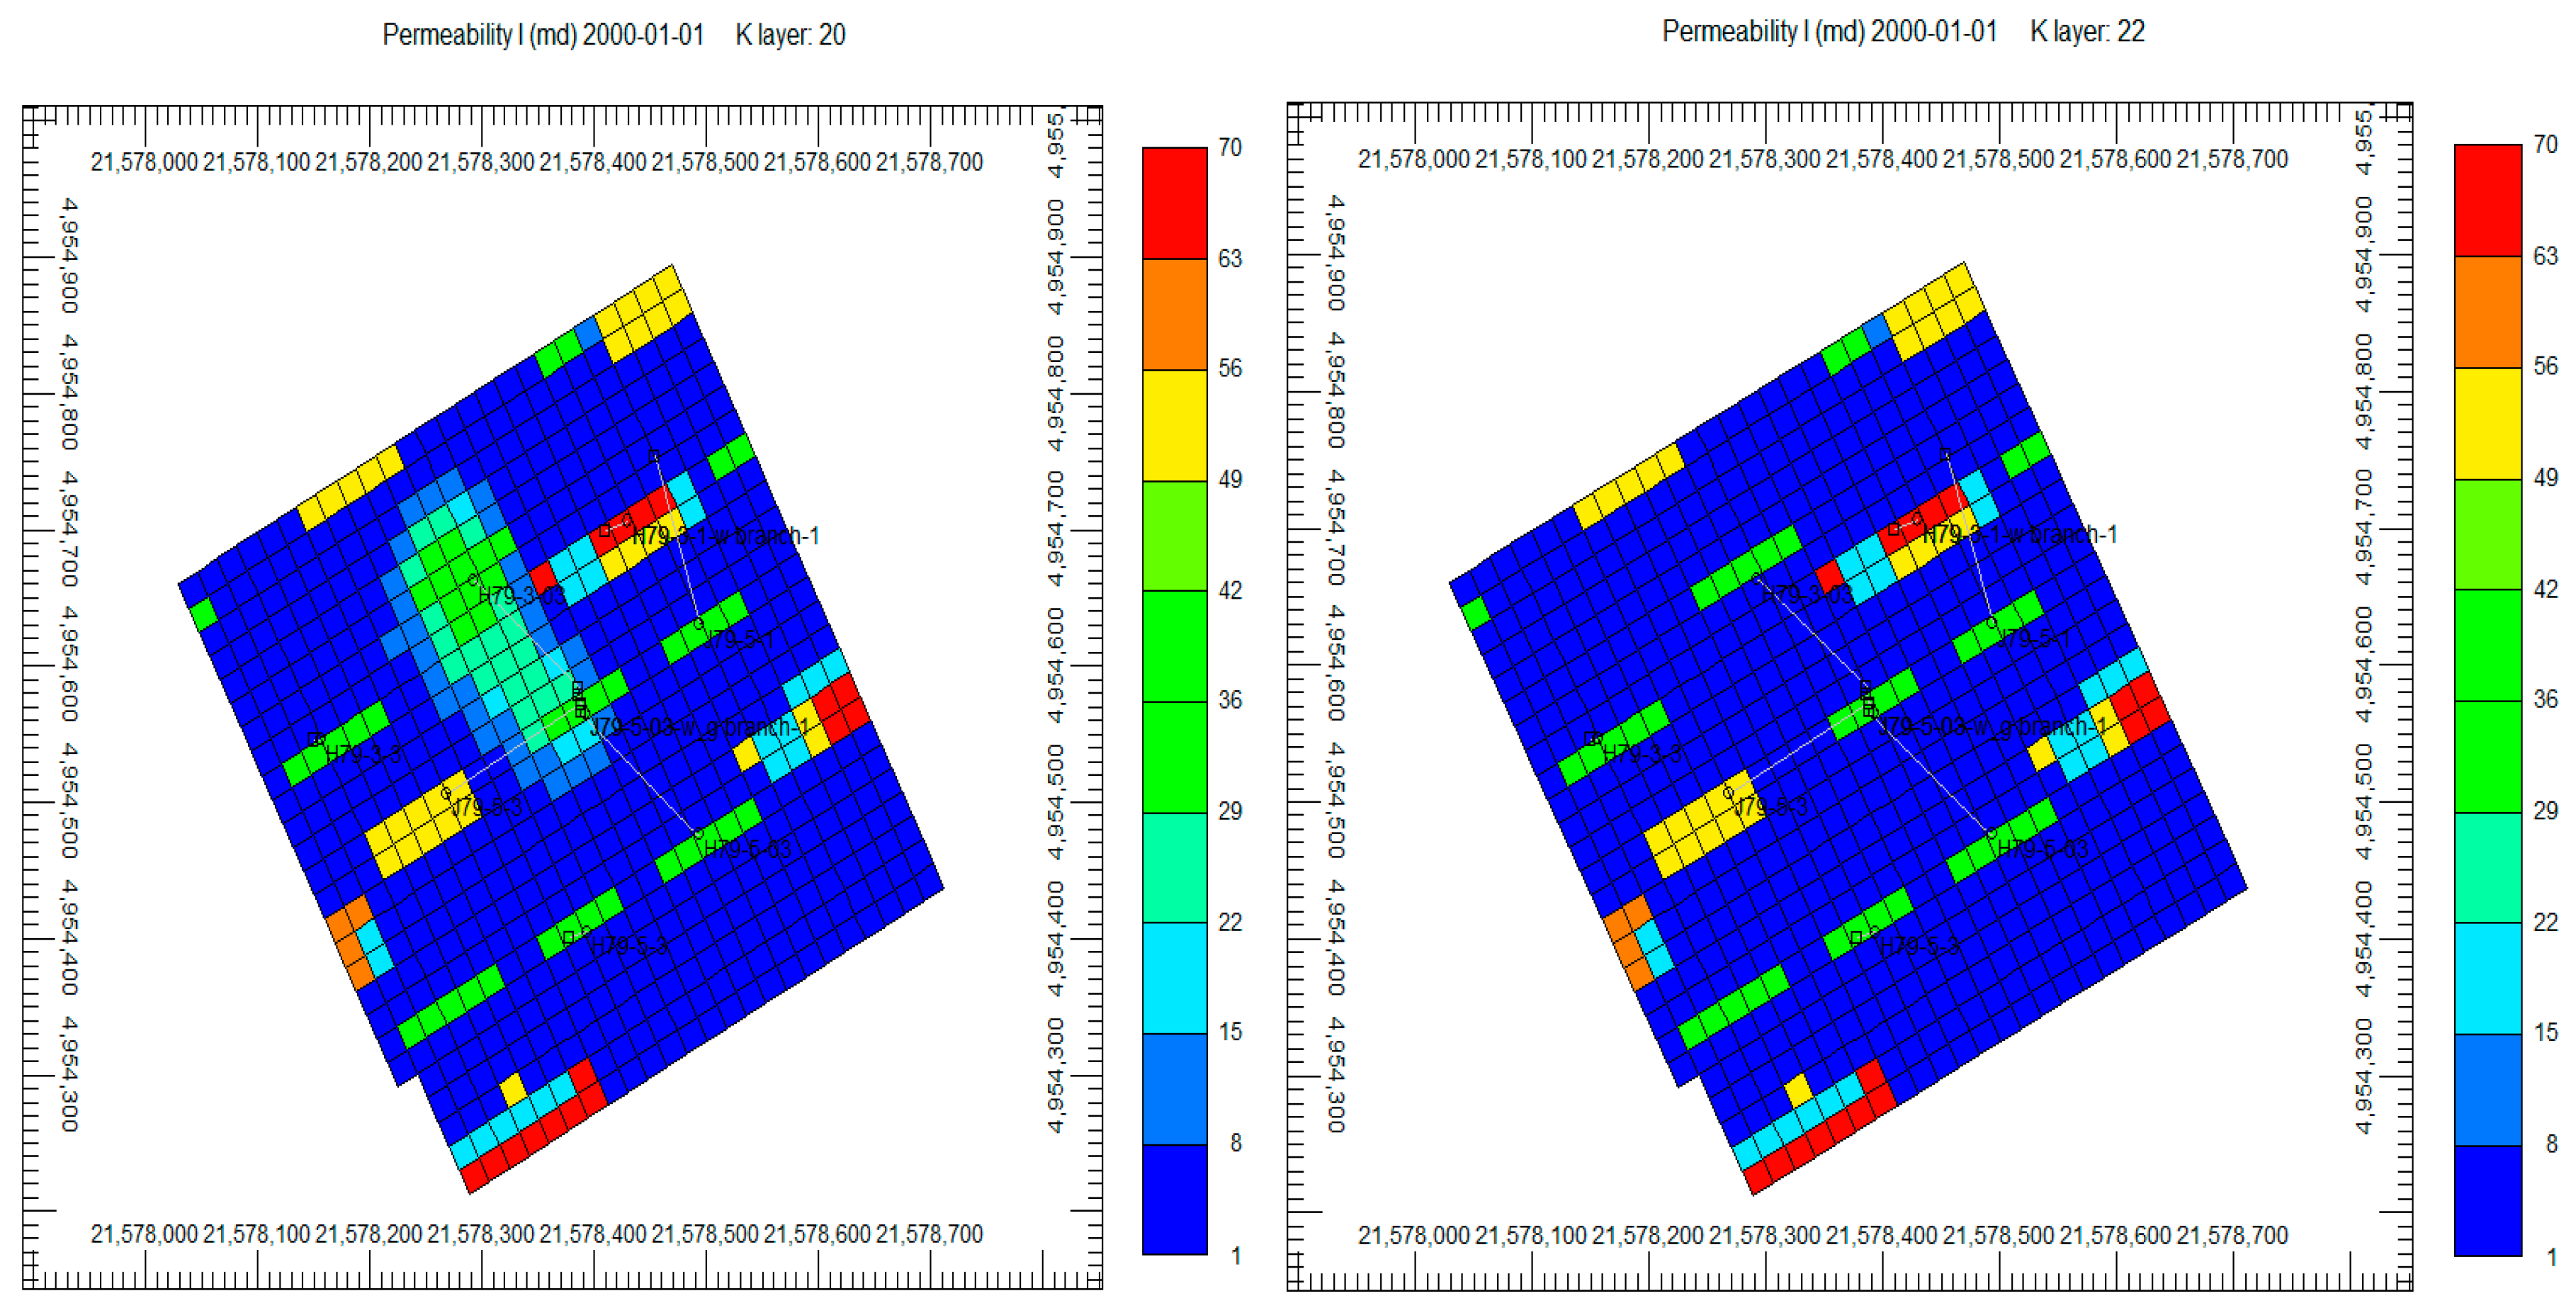
The study reservoir is heterogeneous. The permeability variation is high, with permeability ranging from 1 to 70 md. Most of the layers have the same permeability. The highest permeability was found in layers 20 and 22 (see Figure 3). In reservoirs with high permeability contrast, CO2 migration, and trapping efficiency are affected by the variability in flow paths. High-permeability layers, such as layers 20 and 22, act as conduits, enabling faster CO2 migration. Low-permeability layers may impede vertical migration and provide additional trapping mechanisms.

2.4. Reservoir Porosity, Permeability, and Thickness Statistical Analysis

Data portrayed in Figure 4, Figure 5, Figure 6, Figure 7, Figure 8, Figure 9 and Figure 10 have been measured.
Measurement Procedure:
  • Porosity: Measured using helium porosimetry and log-derived porosity data. The porosity values in the sector model range from 0.070 to 0.091, with the highest porosity (0.091) recorded in layer 20.
  • Permeability: Determined from core flooding experiments and well-test data. The permeability values range from 1 mD to 70 mD, with variations corresponding to different geological layers. Layers 20 and 22 exhibit the highest permeability.
  • Relative Permeability and Capillary Pressure (Figure 6, Figure 7, Figure 8, Figure 9 and Figure 10): These were obtained through laboratory special core analysis (SCAL) tests on representative core samples from the field. The curves were incorporated into the compositional reservoir simulator to model fluid flow accurately.
Figure 4 depicts a full examination of a water-wet reservoir, with histograms and box plots for porosity, permeability, and thickness. The porosity values vary from 0.0155 to 0.0178. The most common porosity readings appear to be around 0.017, indicating that the reservoir has low but rather uniform porosity. The fluid storage capacity is limited because of the poor porosity. A bimodal distribution may indicate varied rock kinds or compaction levels within the reservoir.
Permeability ranges from 10 to 50 mD, which is suitable for reservoirs with moderate to low permeability. The distribution seems bimodal, with peaks at 30 and 40 mD. This suggests two main river regimes or depositional differences. Heterogeneous permeability can result in uneven fluid flow, lowering manufacturing efficiency. To optimize output, this reservoir may require zonal completion or selective perforation.
The thickness measurements range from 12 m to 24 m, with most values being between 17 and 19 m. The histogram displays a bell-shaped (normal) distribution, indicating a well-defined depositional environment. Thickness influences the volume of hydrocarbons in place. The normal distribution implies a generally uniform reservoir thickness across the field. Overall, porosity is low, which means that fluid storage capacity is limited. Secondary recovery treatments might be required. Permeability is quite varied, with a bimodal distribution that suggests potential flow obstacles or high-permeability streaks. The thickness is generally distributed, indicating constant reservoir layers with few dramatic variances. Targeting high-permeability zones requires selective perforation. Improved recovery strategies are required for increased connectivity.
Figure 4. Porosity, permeability, and thickness histograms (water-wet conditions).
Processes 13 00700 g004
The graphs below in Figure 5 show histograms and box plots of permeability, thickness, and porosity for a mixed-wet reservoir, which has distinct flow characteristics from water-wet reservoirs. Porosity values vary from 0.0715 to 0.0745. Unlike the water-wet reservoir, the porosity is higher but has a narrow range, resulting in less variance. The distribution seems bimodal, with maximums at 0.072 and 0.074. Higher porosity results in increased storage capacity, although flow efficiency is dependent on permeability. Because permeability varies, pore throat distribution influences fluid flow.
Permeability readings vary from 10 mD to 50 mD, with a somewhat left-skewed distribution, indicating that the majority of values are on the lower end (10–30 mD). This permeability distribution is more spread out than in the water-wet reservoir, showing higher variability. Mixed-wet reservoirs frequently show larger capillary pressure differences, indicating that fluid movement is less uniform. To minimize early oil bypass, recovery solutions should focus on balanced depletion.
Thickness values range from 12 to 24 m, with the majority falling between 16 and 20 m. Consistent thickness ensures accurate hydrocarbon volume estimation. If high-permeability zones coincide with thicker reservoir portions, oil recovery will be more effective. Layered heterogeneity may still exist, necessitating zonal characterization.
Due to its mixed-wettability and heterogeneous permeability, this reservoir has more production issues than the water-wet scenario. However, the increased porosity and consistent thickness indicate that if well location and completions are performed correctly, oil-in-place volumes should be adequate.
Figure 5. Porosity, permeability, and thickness histograms (mixed-wet conditions).
Processes 13 00700 g005

2.5. Relative Permeability Curves

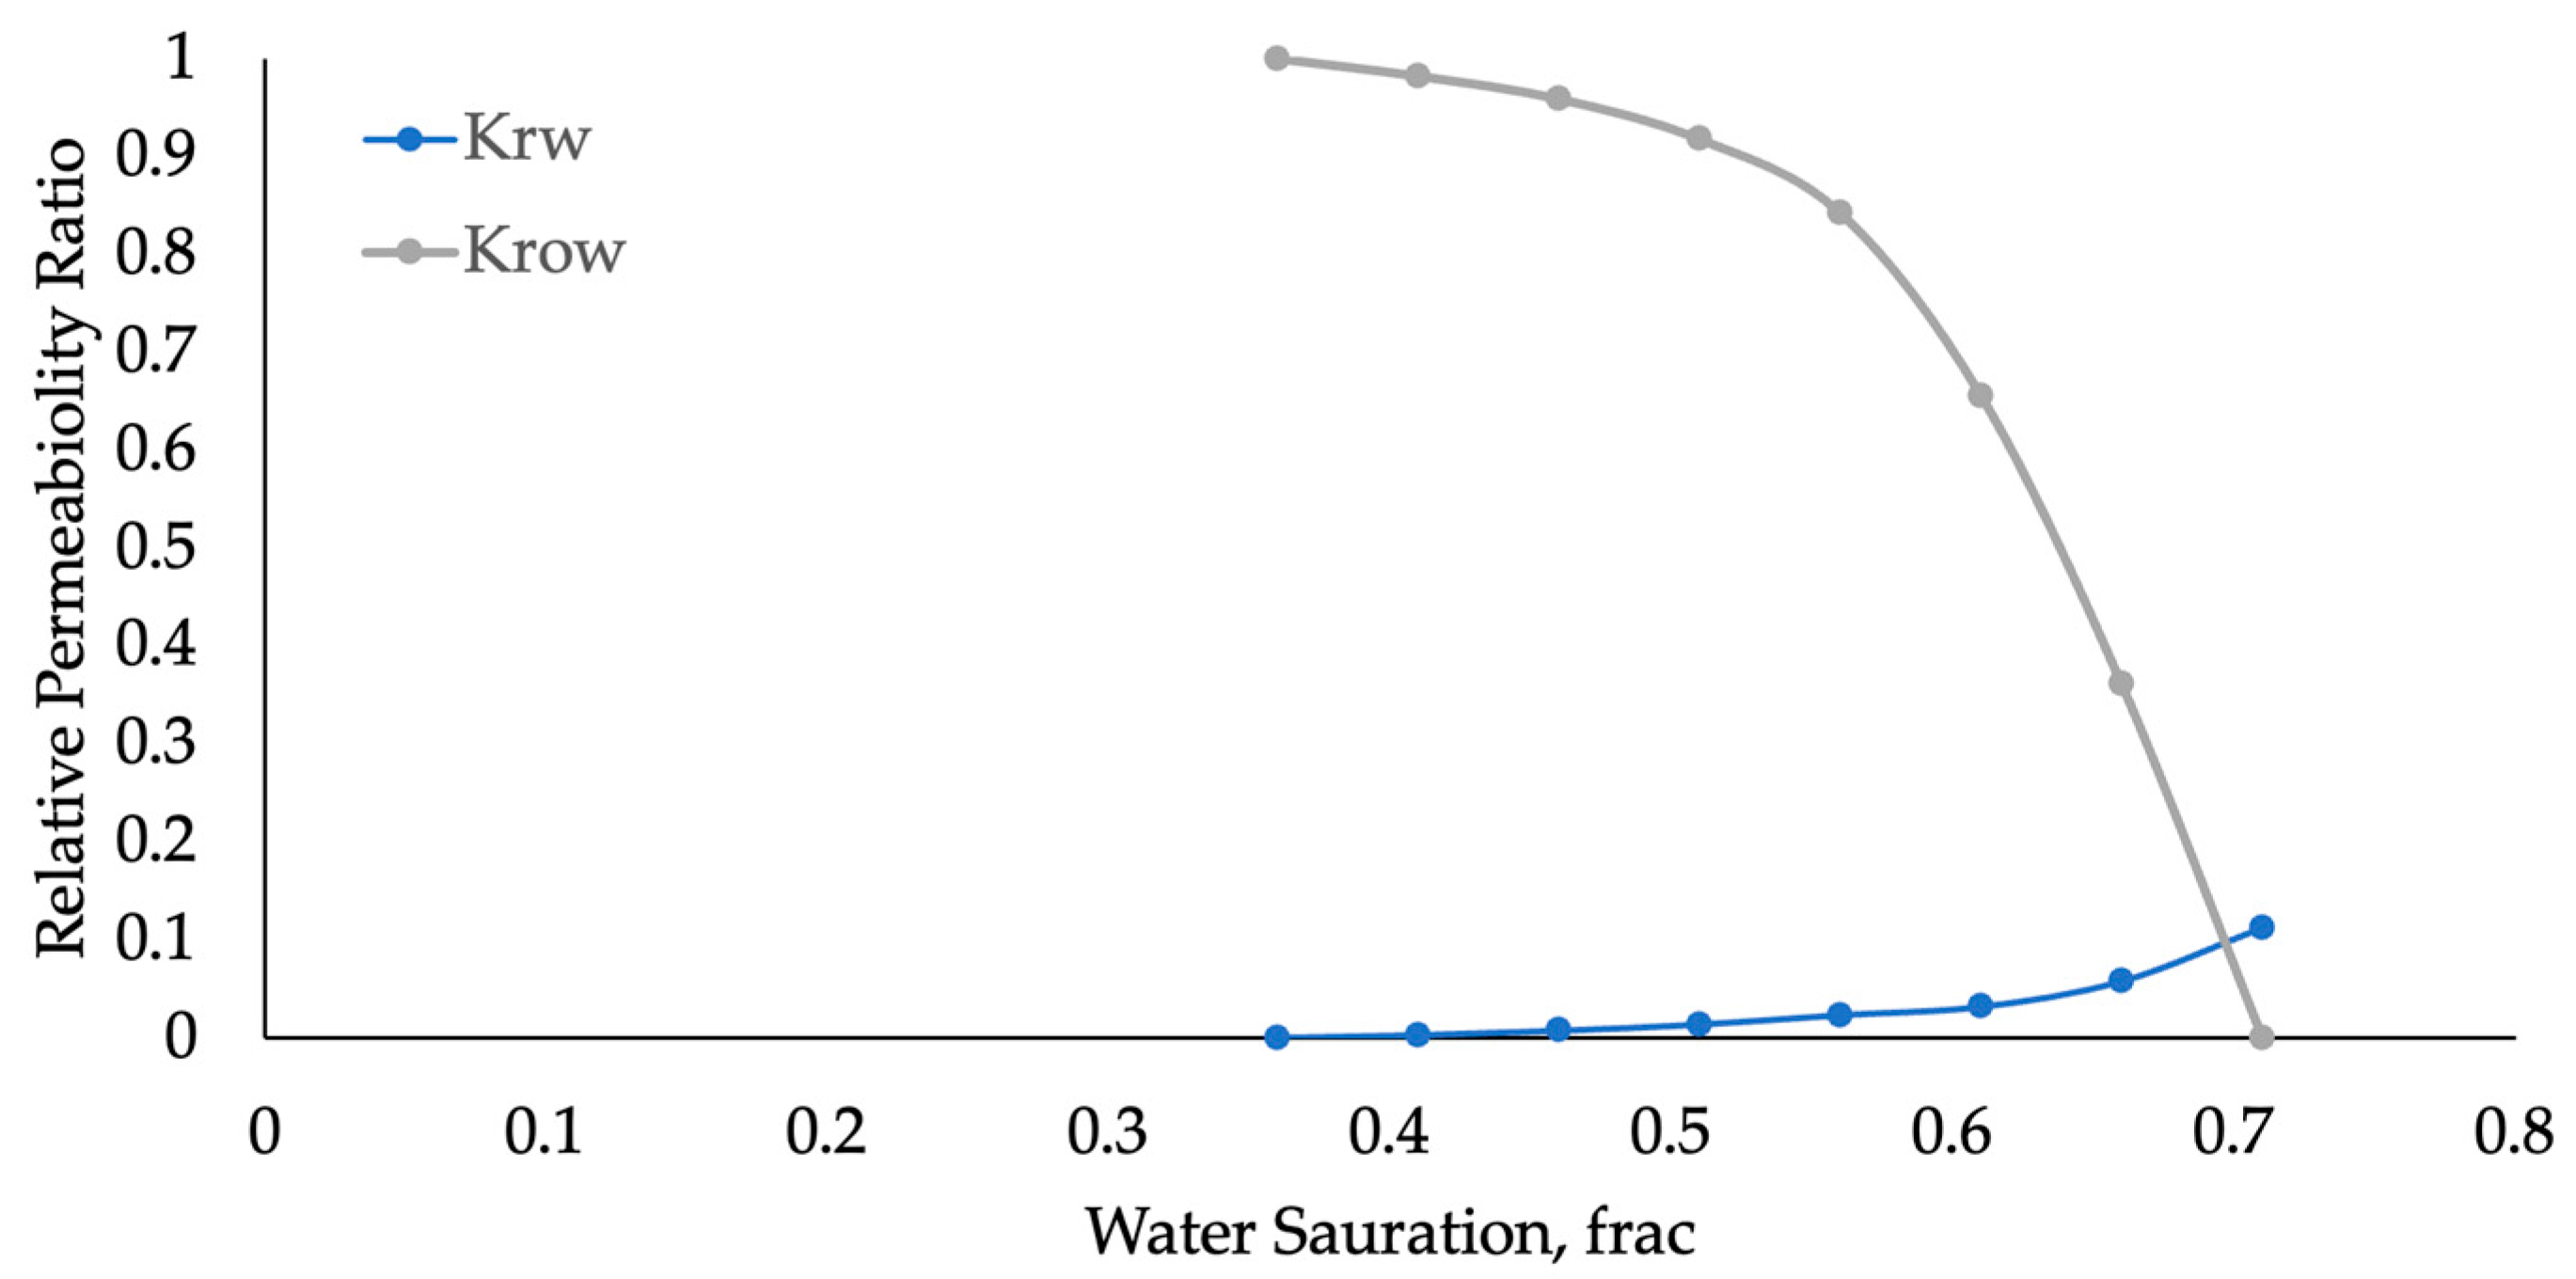
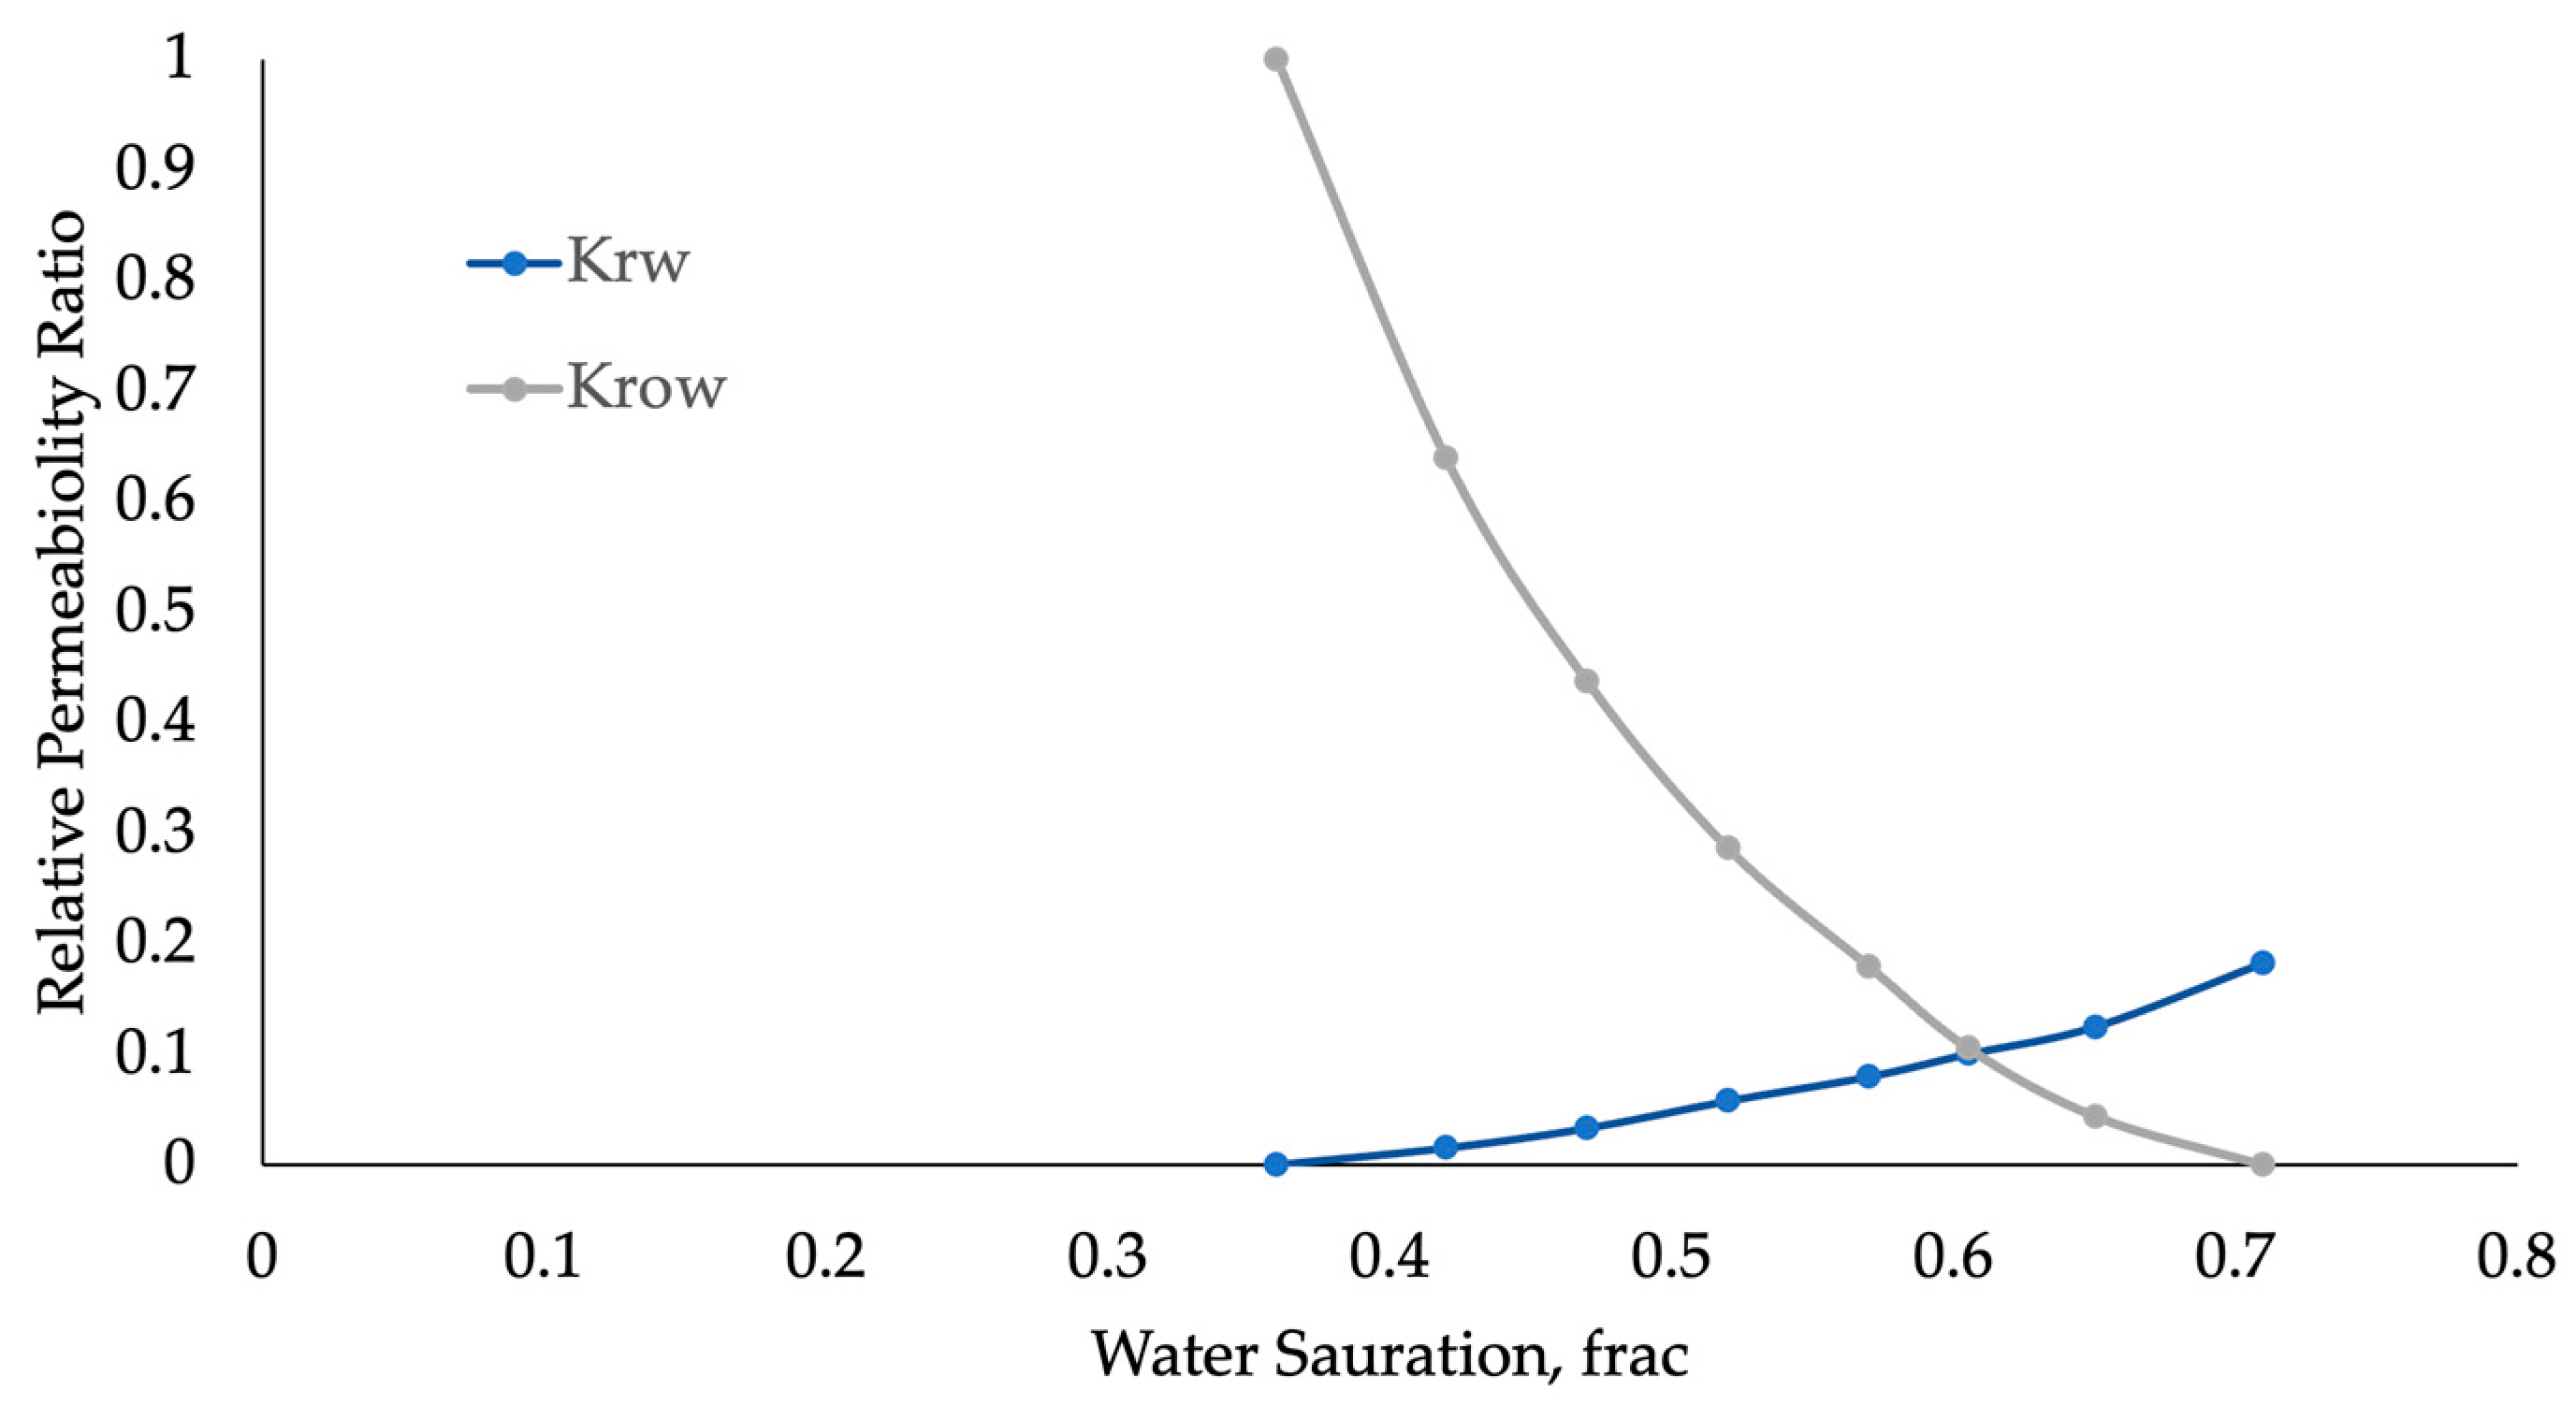
Figure 6 and Figure 7 depict the relative permeability data for two rock types (Type 1 and Type 2). Both formations are water-wet (Swx values when krw/kro vs. Sw intersect are larger than 0.5).
Figure 6. Relative permeability curves (rock type 1).
Processes 13 00700 g006
Figure 7. Relative permeability curves (rock type 2).
Processes 13 00700 g007
In water-wet rocks, despite the enhanced trapping, an early gas breakthrough may occur in high-permeability zones, requiring careful control of injection rates and cycle timing. In addition, high water retention in smaller pores can lead to water blockage in low-permeability zones, reducing oil recovery efficiency. However, the addition of CO2 will potentially alter rock wettability over time (e.g., shifting to intermediate-wet conditions), affecting long-term WAG performance.
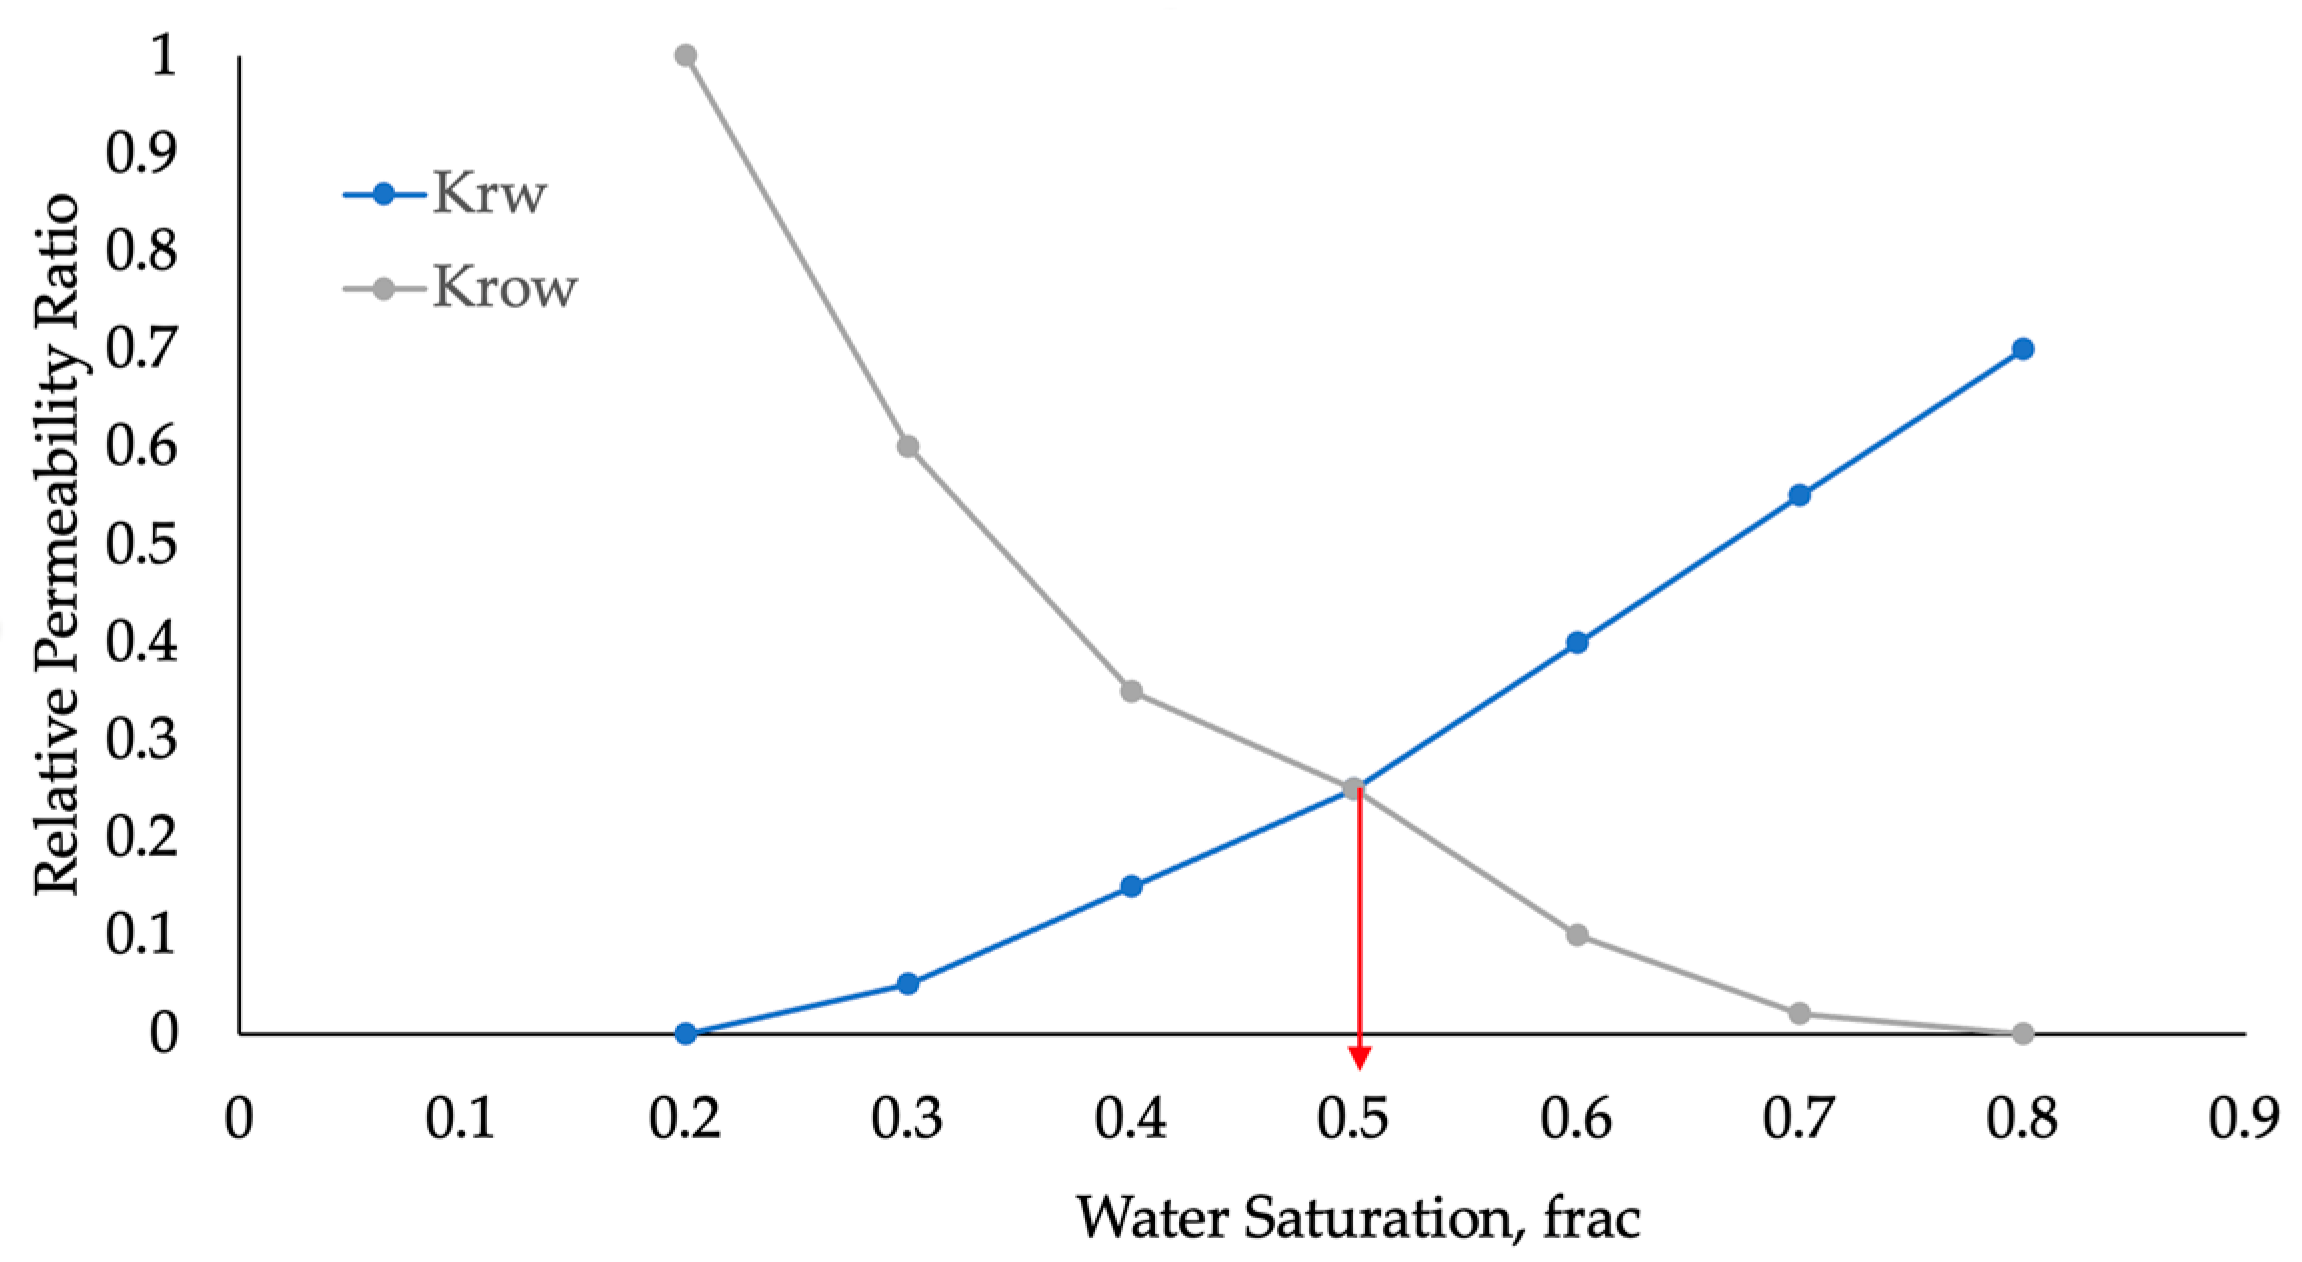
Figure 8 illustrates the relative permeability data of a mixed-wet system (Swx values when krw/kro vs. Sw intersect are at 0.5)
Figure 8. Relative permeability curves with water saturation (mixed-wet conditions).
Processes 13 00700 g008

2.6. Capillary Pressure Curves

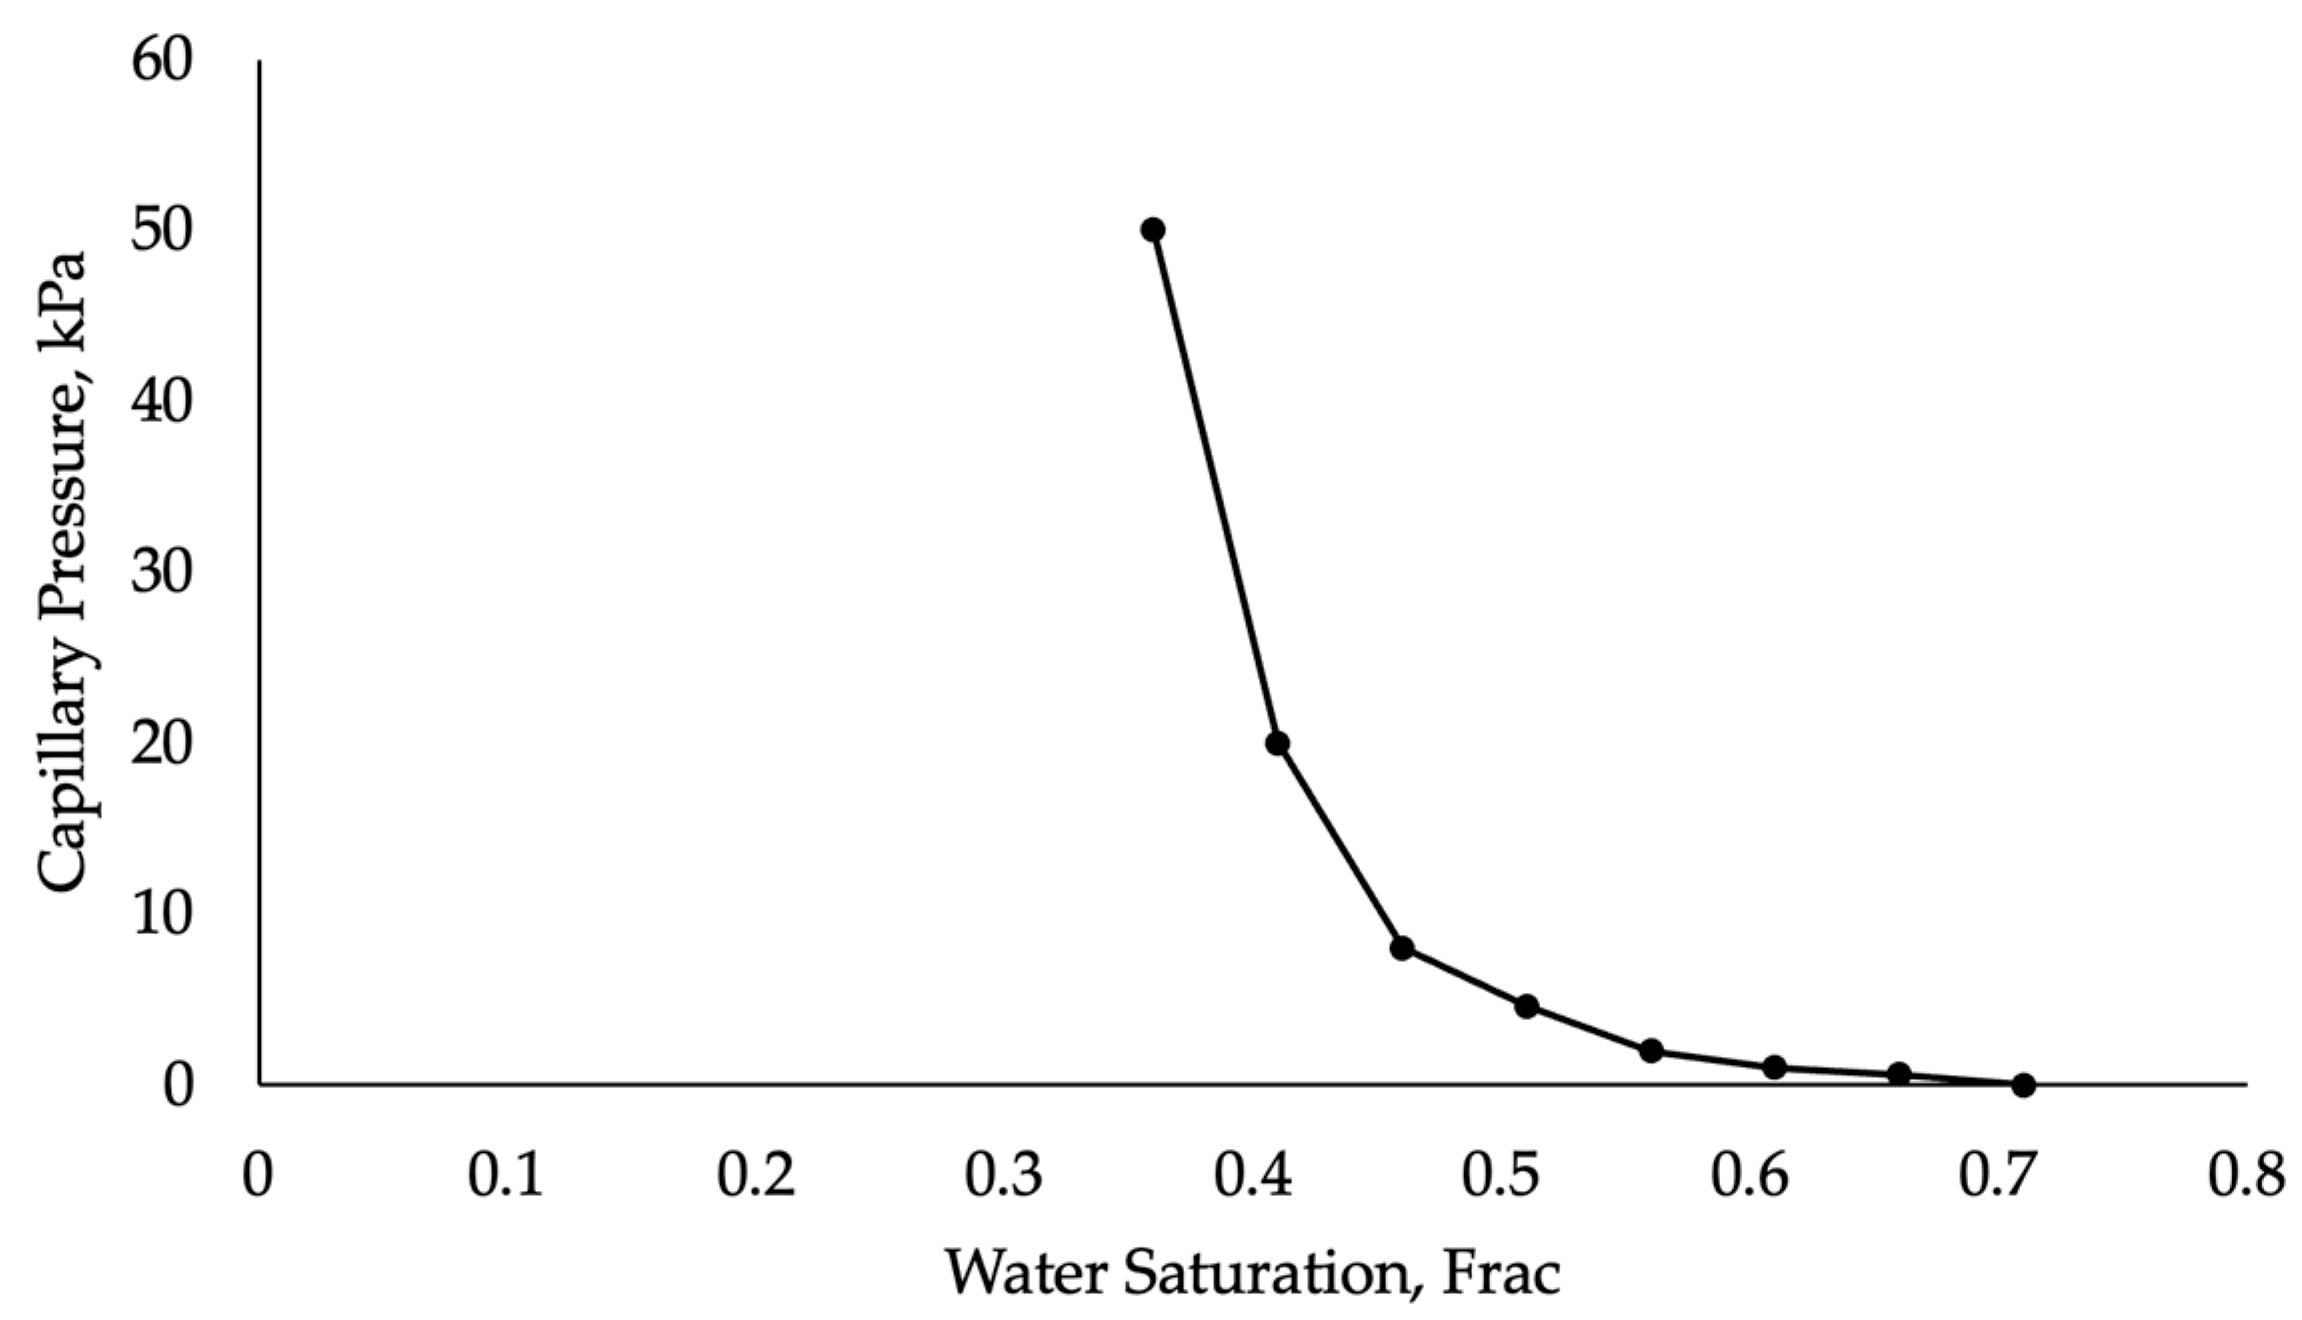
Figure 9 and Figure 10 illustrate the capillary pressure during injection under mixed-wet and water-wet conditions, respectively. The trend observed in the graphs indicates that water-wet conditions consistently resulted in better performance compared to mixed-wet conditions. In both cases, the plotted parameter exhibits a sharp initial decline, followed by a more gradual decrease as the x-axis variable increases. However, the water-wet system shows a less pronounced decline, suggesting more effective oil recovery.
Figure 9. Capillary pressure curve (mixed-wet conditions).
Processes 13 00700 g009
Figure 10. Capillary pressure curve (water-wet conditions).
Processes 13 00700 g010

3. Results and Discussion

3.1. CO2-WAG Recovery Technique

Following primary depletion, a secondary recovery technique—waterflooding—was implemented to restore declining formation pressure by injecting water into the reservoir. While this method led to some oil recovery, a substantial amount of oil remained trapped. To enhance recovery, a tertiary method, CO2-WAG injection, was introduced to extract the residual oil. Once CO2 was introduced in alternating slugs with water, a clear increase in oil production was observed across most of the wells, underscoring the effectiveness of WAG in mobilizing the remaining oil. This pattern is consistent with field observations by Christensen et al. and Al-Obaidi et al. [1,4], who noticed that WAG can enhance the sweep efficiency by periodically lowering the CO2 mobility in heterogeneous formations. This approach proved effective, leading to significant additional oil recovery.
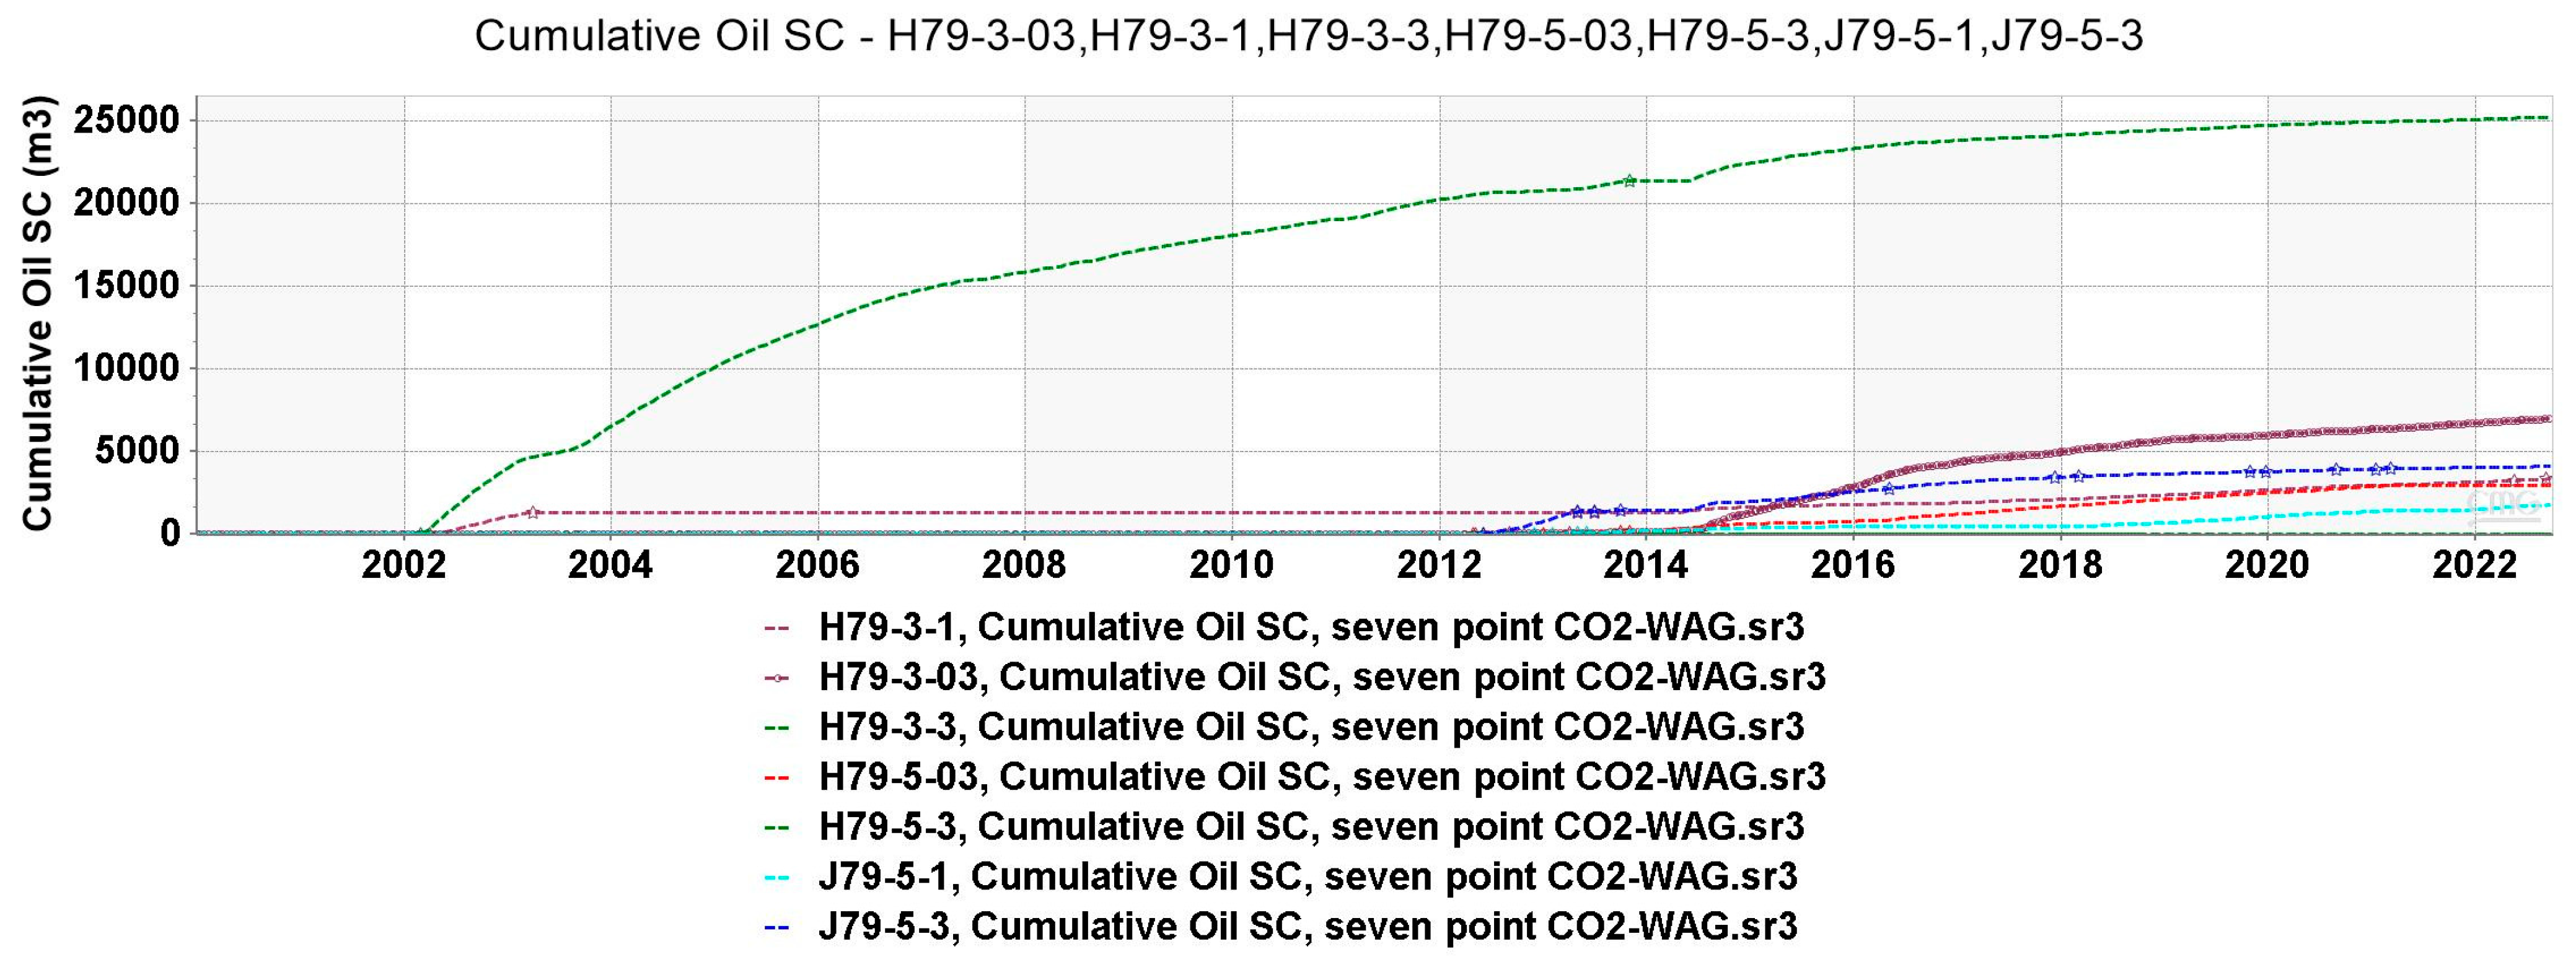
In this study, a sector model incorporating the real history of CO2-WAG implementation was used to assess its potential for oil production. Water injection commenced in 2002, with two wells, H79-3-03 and H79-5-3, showing an increase in the oil recovery factor. Approximately a year later, well H79-5-3 experienced a production surge, recovering around 25,000 m3 of oil. Production then stabilized until the transition to the tertiary CO2-WAG method. Additionally, another well, H79-3-1, achieved substantial oil recovery over time solely through water flooding.
Mechanistically, CO2 dissolution and miscibility with the reservoir oil reduce the oil viscosity, facilitating displacement from smaller pore spaces. Simultaneously, the injection of water slugs helps maintain a lower gas–oil ratio (GOR) at early stages by providing partial mobility control. However, as discussed later (Section 3.2 and Section 3.3), if the reservoir heterogeneity is high, CO2 can eventually channel through preferential flow paths, diminishing the long-term incremental oil recovery. Despite these limitations, Figure 11 demonstrates that CO2-WAG outperforms waterflooding alone for tertiary recovery, confirming its merit in improving the overall production from mature reservoirs [13].

3.2. WAG Performance in Comparison with Waterflood and CO2 Flood in the Water-Wet System

This research is based on a sector model consisting of two rock types and ten wells. Among them, seven are producer wells (H79-3-1, H79-3-03, H79-3-3, H79-5-03, H79-5-3, J79-5-1, and J79-5-3), while the remaining three serve as injector wells (H79-3-1-w, J79-5-03-w, and J79-5-3-g). For this investigation, the following three scenarios were evaluated in the first stage:
(1) Continually flooding with water; (2) CO2 flooding; (3) CO2-WAG injection.
The fundamental multiphase characteristics of the rock, such as capillary pressure and relative permeability curves, are influenced by its wettability, which directly affects fluid distribution and movement within the pores. While reservoirs can be water-wet, oil-wet, or mixed-wet, this study focuses solely on oil production in water-wet and mixed-wet systems. To ensure a fair comparison among the three injection methods, additional models will be developed for both water-wet and mixed-wet conditions.
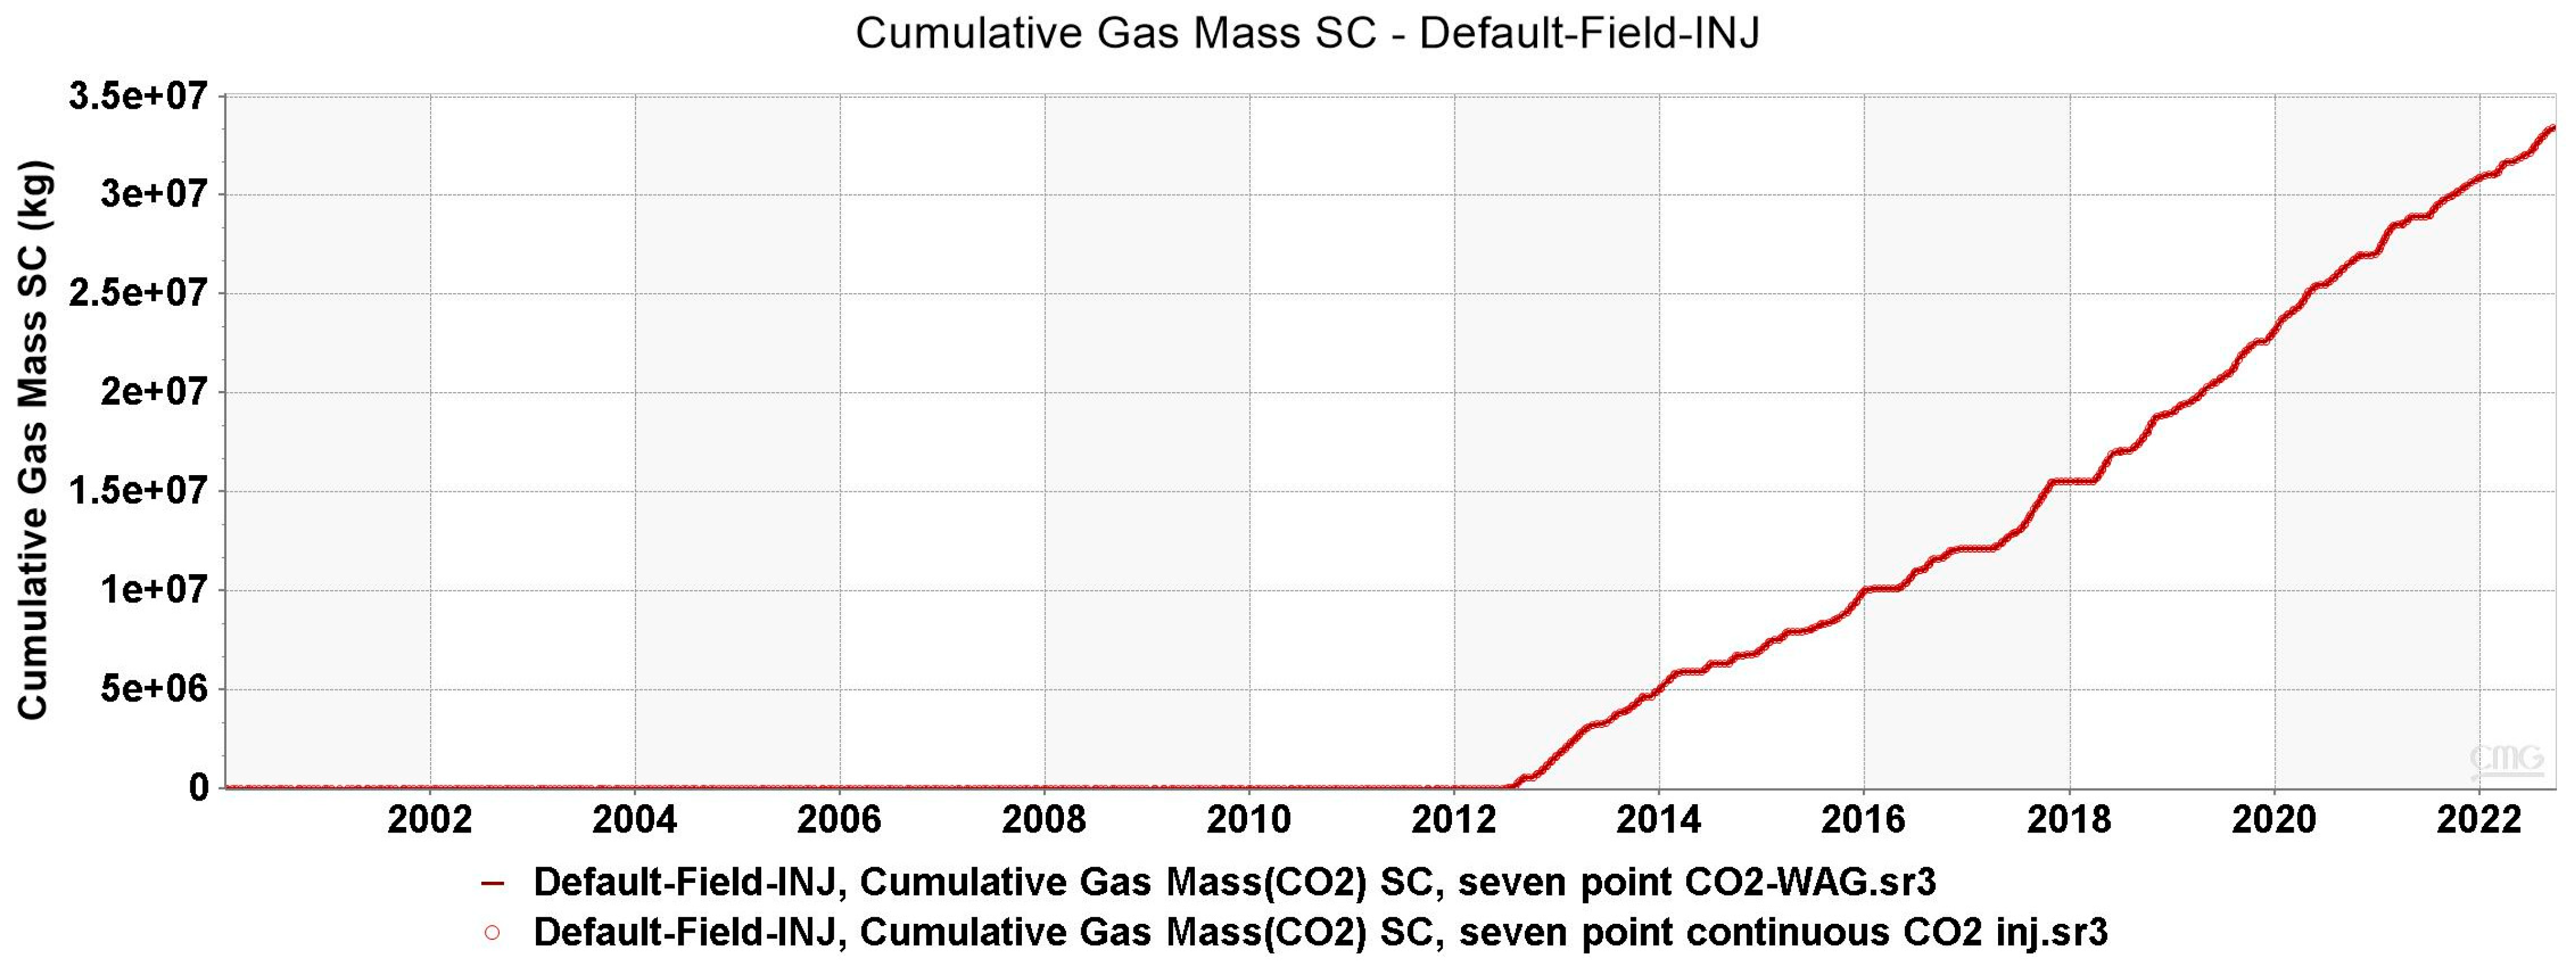
A comparison of the simulation results for CO2 injection and CO2-WAG shows that both techniques involved injecting the same amount of CO2 into the reservoir, as illustrated in Figure 12.
To ensure a fair comparison, the constraints for CO2 injection and water injection were set identical to those in the WAG injection sector model. For the water injection wells (H79-3-1-w, J79-5-03-w), the surface water rate (STW) was limited to 78.7 m3/day and 20.0 m3/day, respectively, while the bottom hole pressure (BHP) was capped at 30,000 MPa and 1,000,000 kPa. Similarly, for the gas injection well, the surface gas rate (STG) was restricted to 22,983.4 m3/day, with a maximum bottom hole pressure (BHP) of 1,000,000 kPa.
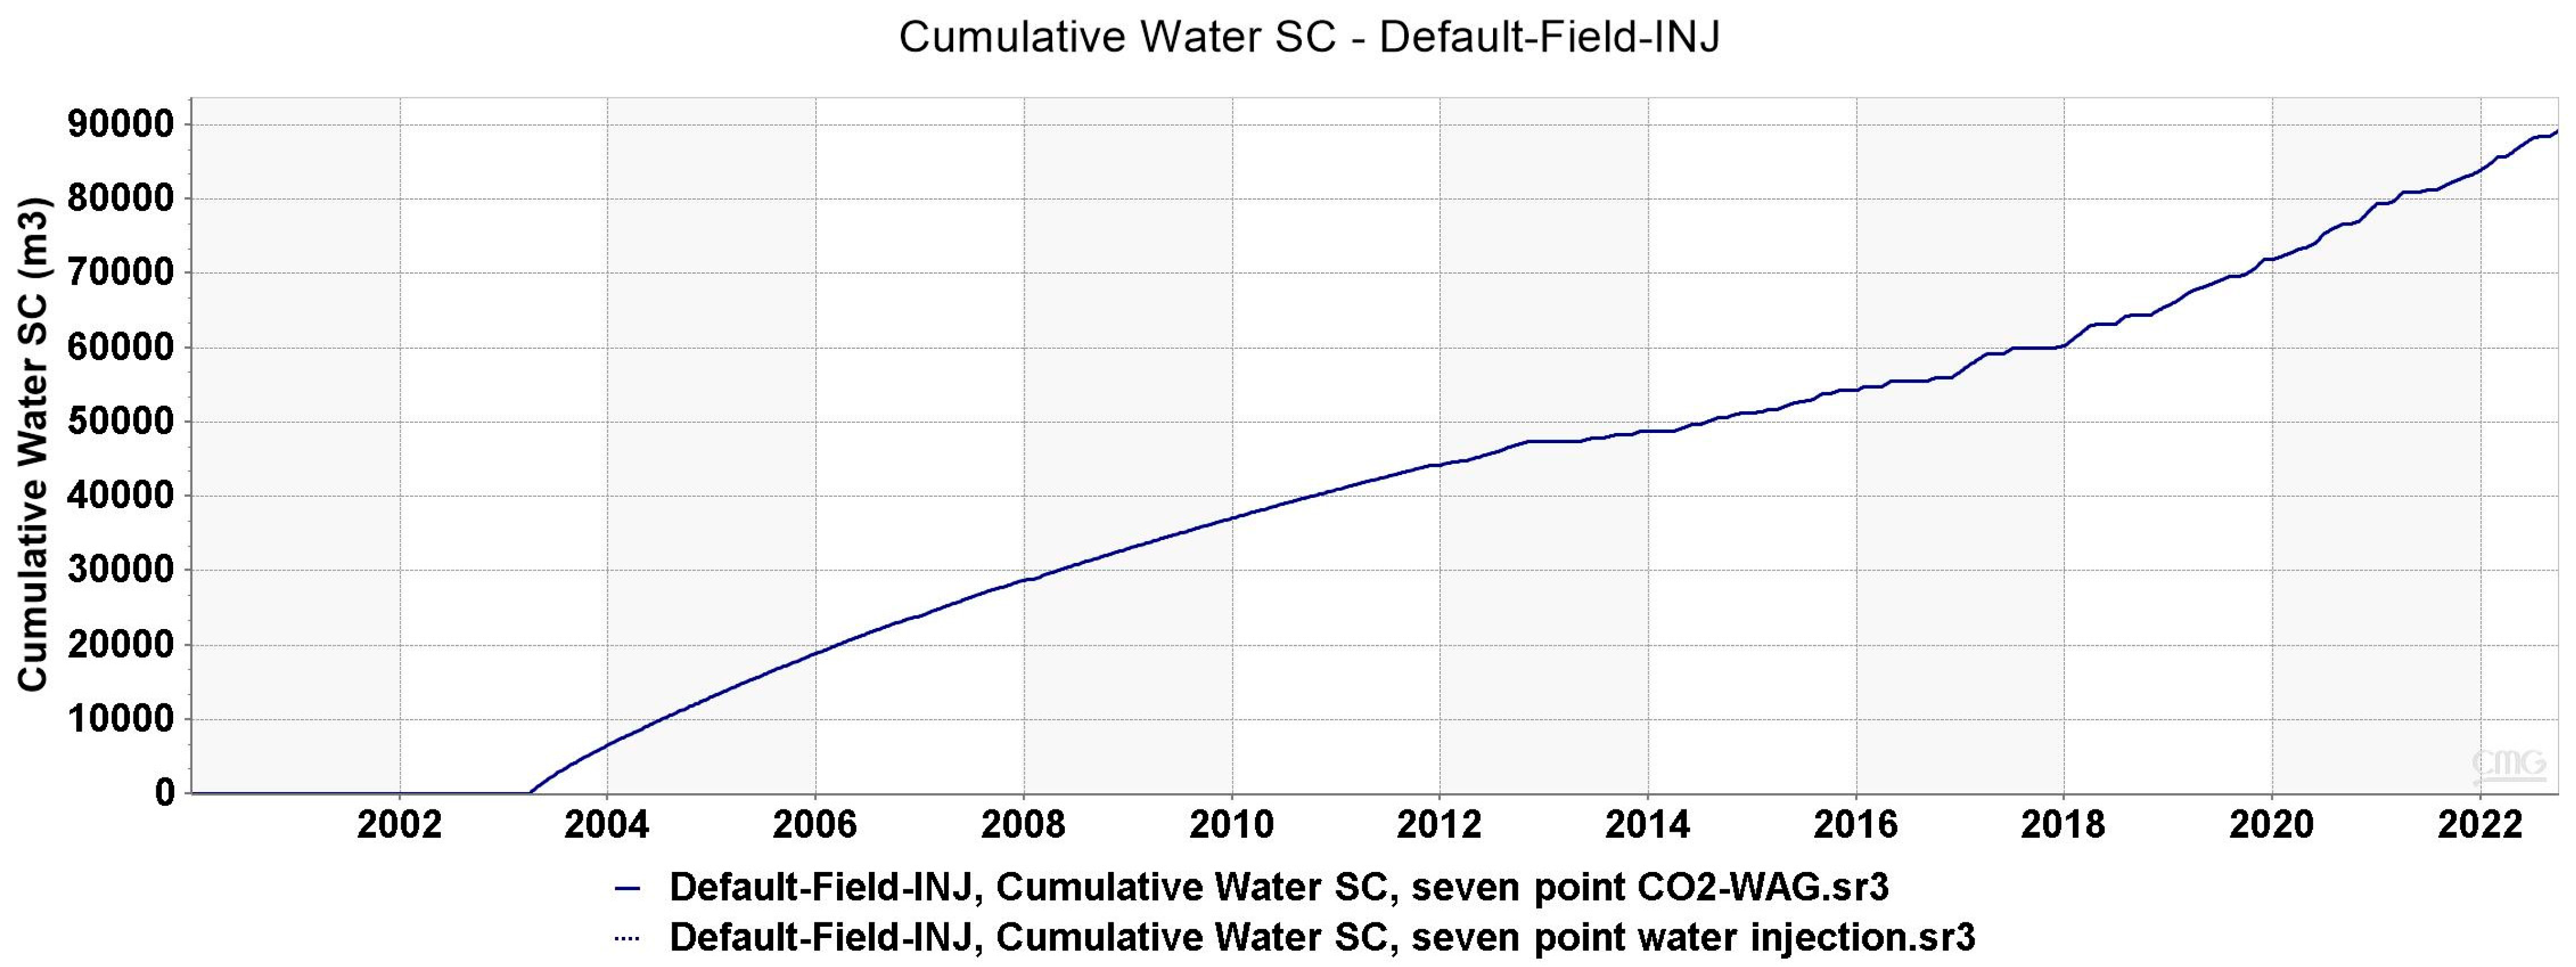
The volume of water injected into the two injection wells was kept consistent for both WAG and water injection operations, as illustrated in Figure 13. In both methods, more than 40,000 m3 of water was injected.
Figure 12 and Figure 13 confirmed that both CO2 and water volumes were similarly constrained for continuous flood vs. WAG. Such an approach allows a direct comparison of how injecting CO2 alone vs. alternating CO2 and water affects recovery.
A detailed analysis of the three injection methods revealed that CO2 injection initially achieved the highest oil production rate from 2015 to 2020. However, production declined in the later stages due to the CO2 breakthrough. Similarly, CO2-WAG injection demonstrated strong initial performance, though its oil production rate remained lower than that of continuous CO2 flooding. In contrast, water injection yielded the lowest oil production rate in the early stages but unexpectedly outperformed the other two methods in the later stages. The oil production trends for all three injection methods are illustrated in Figure 14.
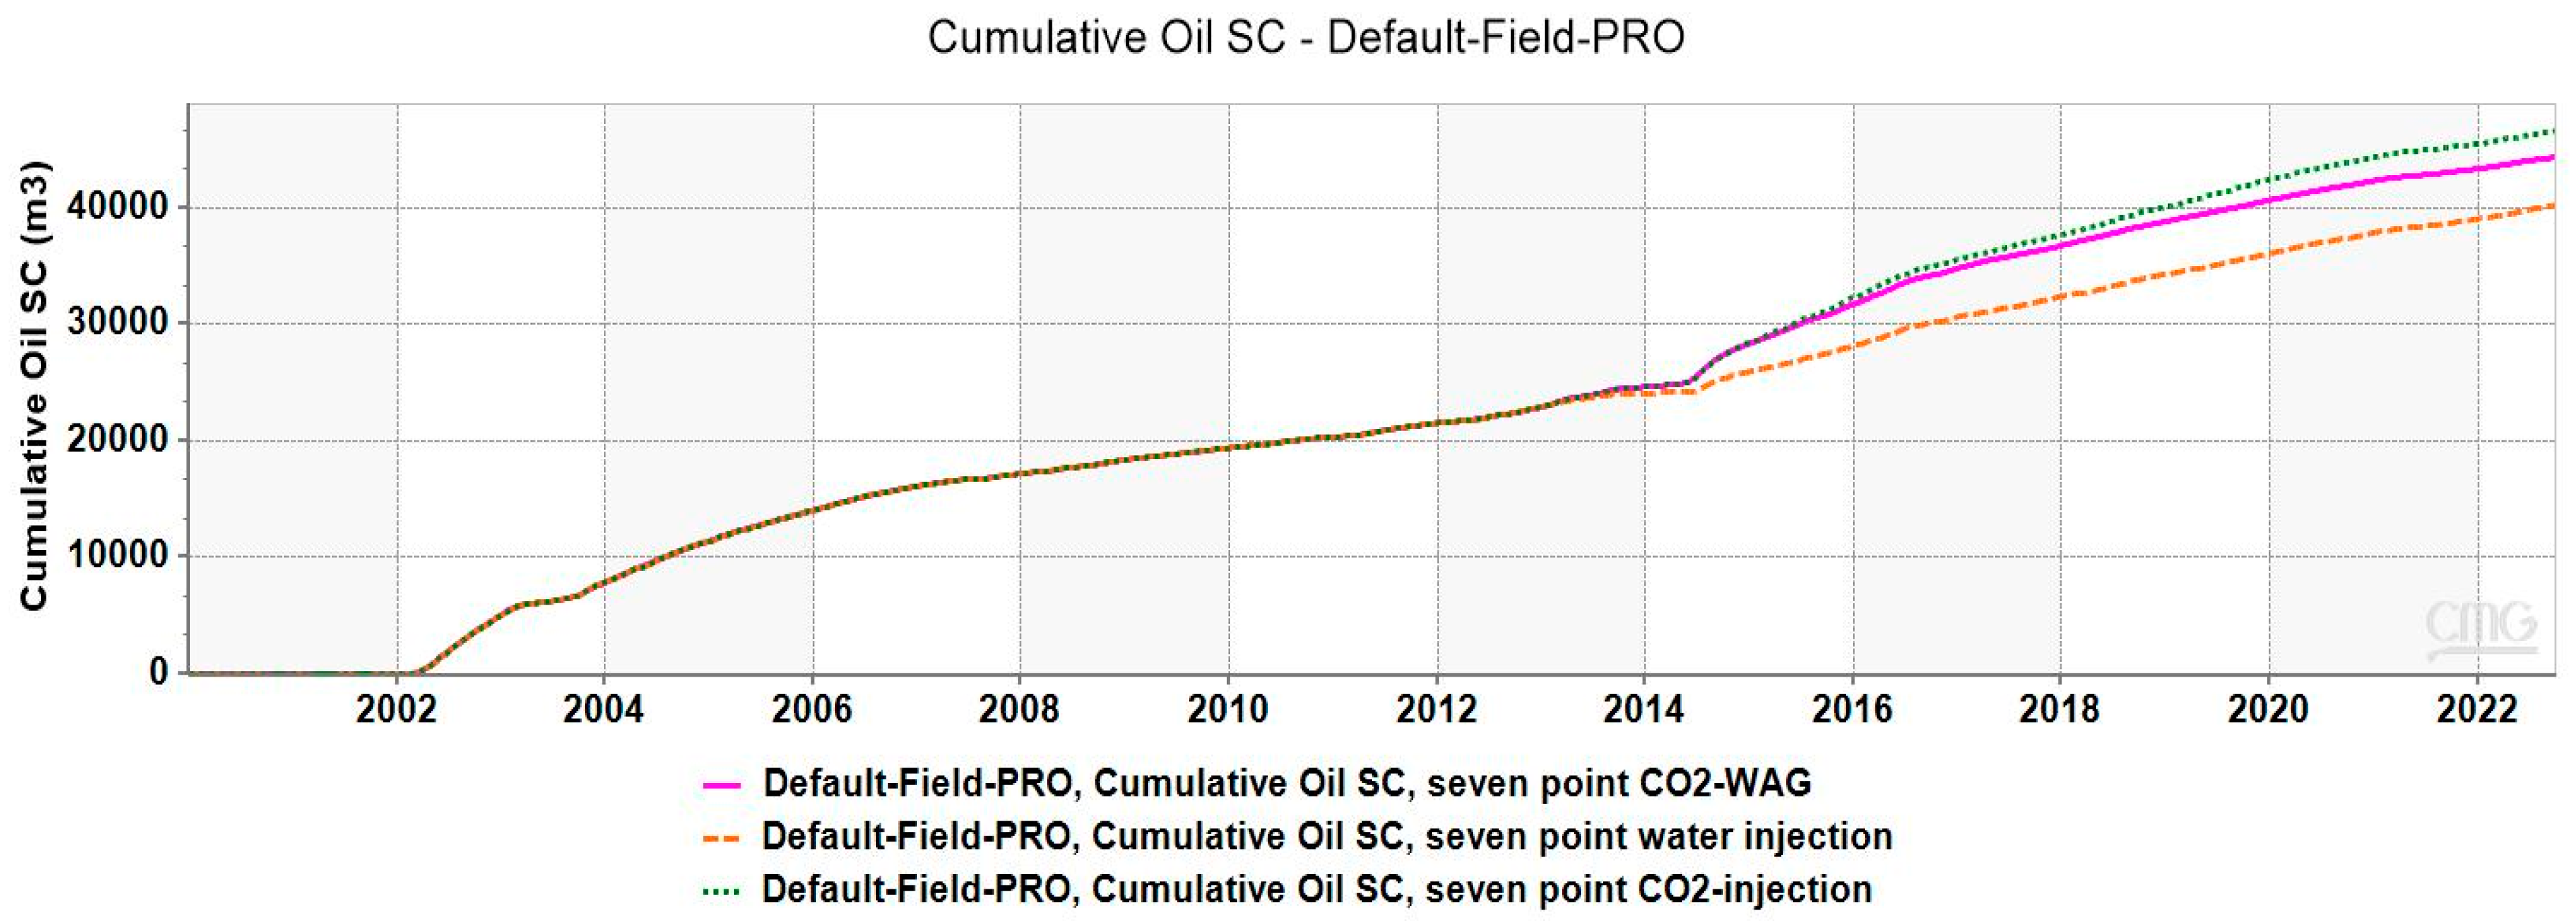
Figure 15 illustrates the total oil production from all three injection methods. Overall, the simulation results indicate a dramatic increase in cumulative oil production for each method from 2014 to 2022. Water injection had the lowest production, accounting for 40,000 m3 by the end of the period. The WAG method produced more oil than water injection alone, but still less than continuous CO2 injection, with a cumulative production of around 45,000 m3. In contrast, the continuous CO2 flooding technique achieved the highest cumulative oil production, reaching approximately 48,000 m3 by the end of the period. In conclusion, it was analyzed that continuous CO2 yields the highest total recovery (~48,000 m3), surpassing CO2-WAG (~45,000 m3) and waterflood (~40,000 m3). Similar trends have been reported by Bui et al. [10] where continuous CO2 injection achieved 14% higher oil recovery than WAG in certain high-permeability reservoirs.
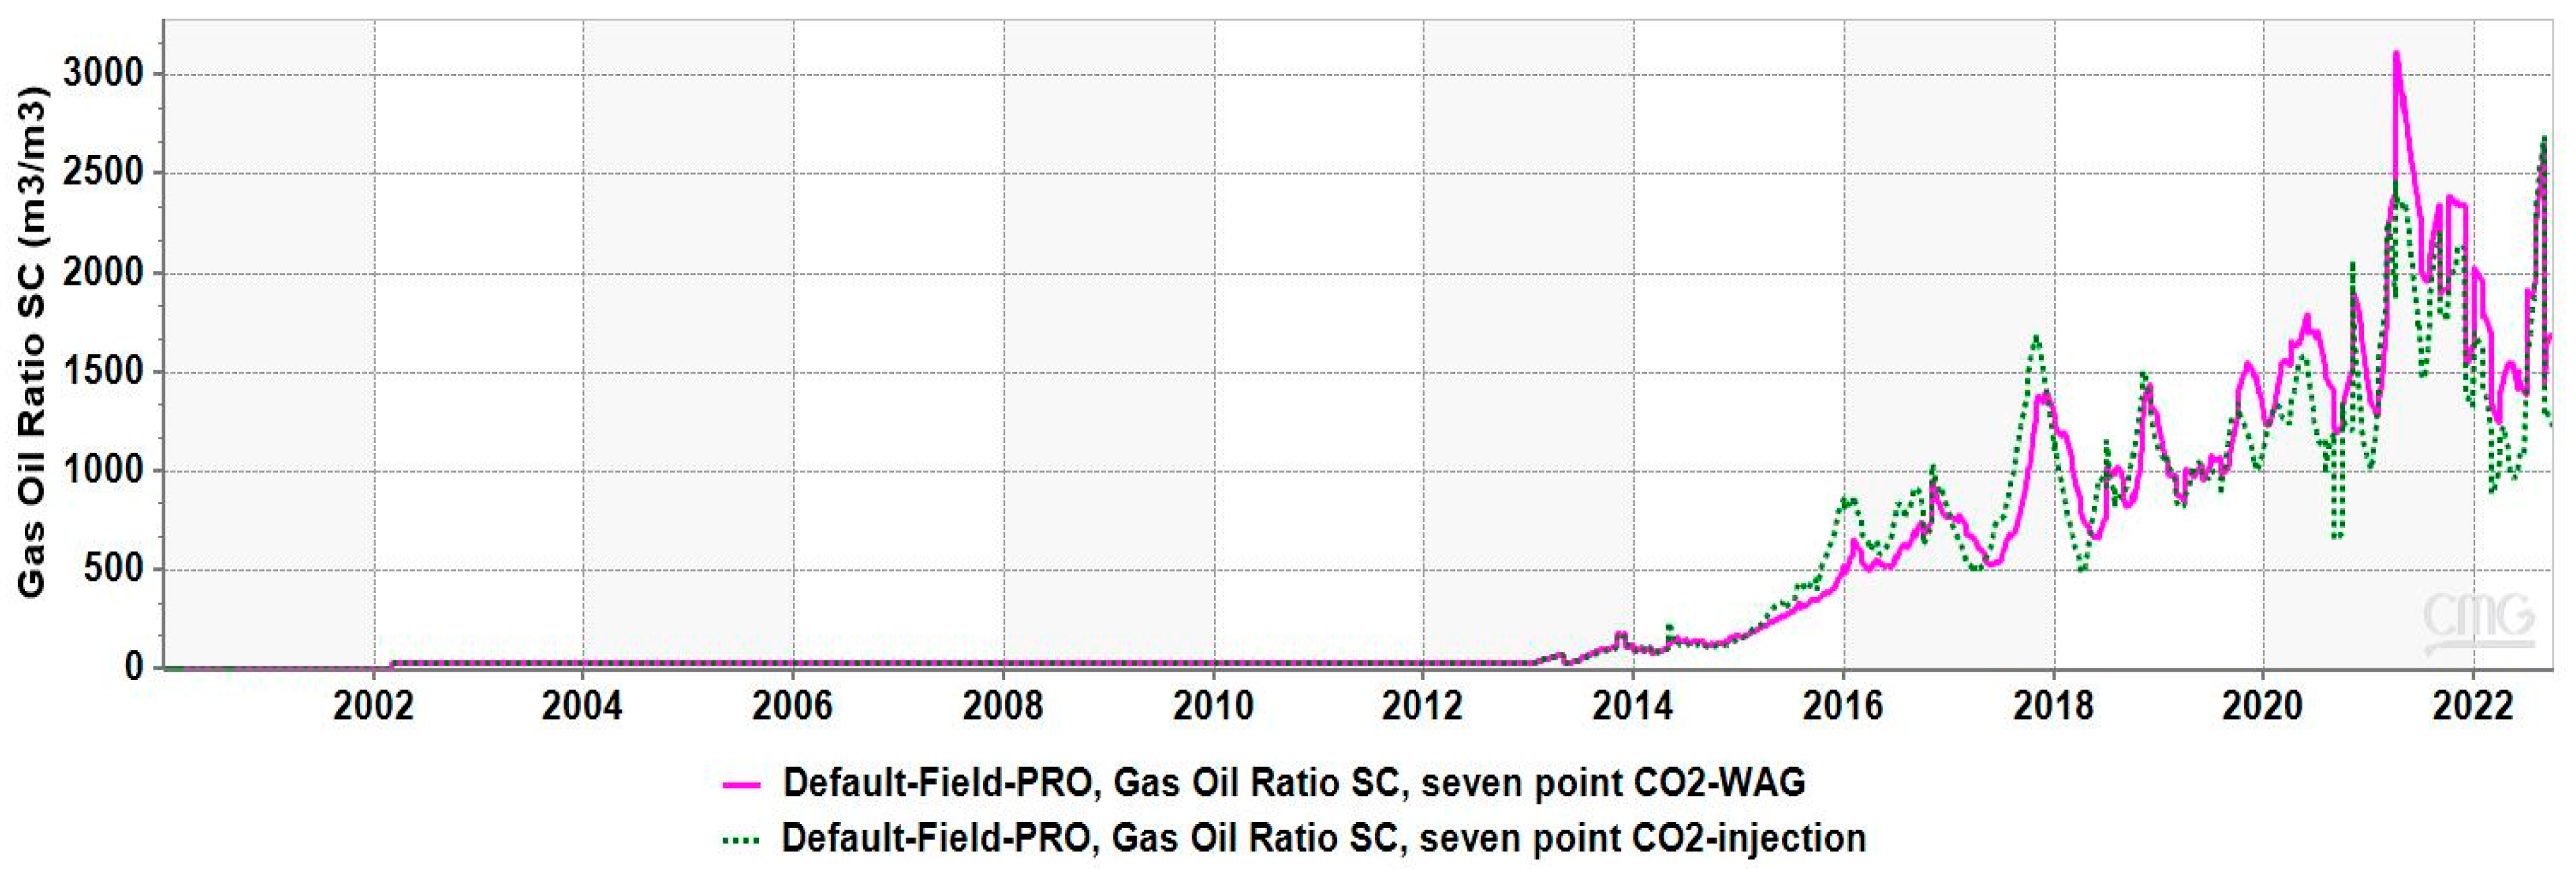
Figure 16 demonstrates that CO2-WAG not only results in lower oil production compared to continuous CO2 flooding but also exhibits a higher gas-oil ratio (GOR). This presents a significant drawback of the CO2-WAG injection method. In contrast, the GOR for continuous CO2 injection was initially higher but gradually decreased over time relative to CO2-WAG. The GOR for CO2-WAG peaked at around 32,000 m3/m3, marking the highest ratio throughout the period. This observation matches Adullah et al. [14] and Ding et al. [5] who found that sustained CO2 injection can develop stable miscible fronts in some formations despite early breakthrough risks.
Figure 17 shows that the water cut was quite similar during water injection and CO2-WAG. Although the water cut for CO2-WAG started lower than that of water flooding in the early stages, it gradually increased from 2015 until the end of the period. This result clearly indicates that the CO2-WAG process is not superior to water flooding in terms of water cut performance. The results highlight that in water-wet conditions, water cut is an important factor shaping the long-term economics and recovery efficiency, echoing earlier studies that emphasize the interplay of wettability, relative permeabilities, and fluid viscosities [15].
Overall, water-wet reservoirs exhibit higher overall recovery factors, as the wetting phase distribution favors water in smaller pores, enabling CO2 to displace oil more effectively in the larger pore channels. This aligns with the findings of Li et al. [7] who noted that strongly water-wet systems generally respond more predictably to gas-based EOR methods.

3.3. WAG Performance in Comparison with Waterflood and CO2 Flood in Mixed-Wet System

The simulation results for the mixed-wet system were comparable to those for the water-wet system, providing a foundation for the comparative study of oil rates. Throughout most of the period, the oil rate for CO2 flooding was consistently higher; however, by the end of the period, the oil rate for water injection surpassed that of CO2 flooding. The oil rate for CO2-WAG was nearly identical to that of continuous CO2 flooding initially but declined later on. In contrast, the oil rate for water flooding was lower in the early stages but increased by the end of the period. Figure 18 illustrates the oil rate in all three injection methods for mixed-wet reservoirs.
Figure 19 displays the cumulative oil production for all three injection methods in the mixed-wet system. Overall, the simulation results indicated an increase in oil production for each injection method from 2014 to 2022, similar to the trends observed in the water-wet system. However, the cumulative oil production for each method was notably lower compared to that of the water-wet reservoir. CO2 injection achieved a cumulative oil production of around 30,000 m3, remaining the highest among the flooding processes. In contrast, the cumulative oil production for CO2-WAG and water injection was approximately 28,000 m3 and 21,000 m3, respectively. The more complex capillary pressure profile in mixed-wet rocks (shown in Figure 9 and Figure 10) contributes to uneven displacement fronts, leading to additional oil bypass. Mixed-wettability can create regions of partial oil-wet conditions, reducing the sweep efficiency and hindering CO2 from contacting bypassed oil [16].
The gas–oil ratio (GOR) in the mixed-wet model is nearly identical to that in the water-wet model. Overall, the GOR data exhibit fluctuations. Initially, the GOR for CO2-WAG was lower compared to that for CO2 injection; however, it increased later on. Significant variations occurred after 2016 for both CO2-WAG and continuous CO2 GOR, likely due to modifications in well completion and gas meter maintenance issues. Figure 20 provides a comprehensive illustration of the GOR for the mixed-wet system.
Water cut is another important parameter to consider for optimizing the oil recovery factor. In this study, the water cut for both the CO2-WAG and water flooding techniques in mixed-wet systems was analyzed. The results were similar to those observed in the water-wet system, indicating that the water cut for CO2-WAG was lower in the initial stages compared to water flooding. However, over time, the water cut for CO2-WAG increased and eventually matched that of water flooding. These variations are illustrated in Figure 21. Water cut trends highlight that once waterflood or WAG fails to efficiently stabilize the gas front, both the oil rate and sweep efficiency drop significantly [12].
The standard deviation analysis reveals that the mixed-wet system has greater variability in cumulative oil production. This variability suggests an inconsistent performance due to the complex interactions between wettability effects, capillary forces, and injection fluid behavior. Water-wet systems, in contrast, exhibit more predictable recovery trends, contributing to a smoother performance across different injection strategies, as shown in Figure 22. This variability—observed in the standard deviation plots—mirrors insights from Fang et al. [12], who emphasize that even minor changes in injection scheduling or slug sizes can produce disproportionately large swings in mixed-wet fields.
In summary, the oil recovery factors from the simulation findings for the water-wet and mixed-wet systems were markedly different. In the water-wet model, the recovery factor for CO2 flooding was 27.2%, while the recovery factors for CO2-WAG and water flooding were 26% and 23.6%, respectively. In the mixed-wet model, continuous CO2 flooding also demonstrated a higher recovery efficiency than the other two injection techniques. As shown in Table 1, the recovery factors for CO2-WAG, water injection, and continuous CO2 injection were 16.2%, 12.4%, and 17.2%, respectively.
In the water-wet model, the total oil production from CO2 injection was 48,000 m3, slightly higher than the 45,000 m3 produced by CO2-WAG. In the mixed-wet model, although the overall results were lower compared to the water-wet model, oil production from continuous CO2 flooding remained higher than that of the other two injection methods within the same wettability system. Specifically, CO2-WAG produced a total of 174,328.3 barrels per day, while continuous CO2 injection produced 185,584 barrels per day, and continuous water flooding yielded 133,881.7 barrels per day.
Overall, these findings from results confirm that in both the water-wet and mixed-wet environments, continuous CO2 flooding typically leads to higher ultimate recovery. CO2-WAG remains an attractive alternative when balancing CO2 utilization, mobility control, and sequestration goals, but may require additional techniques (e.g., foam or polymer slugs) to outperform continuous CO2 in heterogeneous or mixed-wet settings [1,4,12].

4. Conclusions

This study evaluates the efficiency of CO2-WAG injection compared to continuous CO2 and water flooding in water-wet and mixed-wet reservoirs. The key results of this study are as follows:
  • Continuous CO2 injection achieves the highest oil recovery, particularly in water-wet systems.
  • CO2-WAG injection provides a balance between oil recovery and CO2 sequestration but remains less efficient than continuous CO2 flooding in terms of the overall oil recovery.
  • Water flooding, while the least effective for oil recovery, offers long-term production stability and pressure maintenance.
These findings highlight the importance of reservoir wettability in enhanced oil recovery (EOR) and confirm continuous CO2 injection as the most effective strategy for maximizing oil recovery in heterogeneous reservoirs.
However, this study has certain methodological limitations that should be considered:
  • The sector model used may not fully capture large-scale reservoir heterogeneities.
  • Assumptions made in relative permeability modeling could influence the accuracy of the results.
To address these limitations, future research should focus on the following:
  • Refining three-phase relative permeability models to improve the prediction accuracy.
  • Optimizing CO2 sequestration techniques for better long-term efficiency.
  • Conducting field-scale validations to ensure applicability to real-world reservoirs.
By addressing these aspects, future studies can enhance long-term sustainability and improve model reliability in CO2-based EOR strategies.

Author Contributions

Conceptualization, M.H. and F.B.; methodology, M.H.; software, M.H.; validation, M.H., F.B. and Z.H.; formal analysis, M.H.; investigation, M.H.; resources, M.H.; data curation, M.H.; writing—original draft preparation, M.H.; writing—review and editing, Z.H and D.A.; visualization, Z.H and D.A.; supervision, F.B.; project administration, F.B. All authors have read and agreed to the published version of the manuscript.

Funding

This research received no external funding.

Data Availability Statement

The original contributions presented in this study are included in the article. Further inquiries can be directed to the corresponding author.

Conflicts of Interest

The authors declare no conflicts of interest.

Abbreviations

The following abbreviations are used in this manuscript:
CO2-WAGCarbon dioxide-water-alternating-gas
EOREnhanced oil recovery
IPCCIntergovernmental Panel on Climate Change
GORGas–oil ratio
GEMGeneralized equation-of-state model
BHPBottom hole pressure
STWSurface water rate
STGSurface gas rate

References

  1. Christensen, J.R.; Stenby, E.H.; Skauge, A. Review of WAG field experience. SPE Reserv. Eval. Eng. 2001, 4, 97–106. [Google Scholar] [CrossRef]
  2. Skauge, A.; Stensen, J.Å. Review of WAG Field Experience. In Proceedings of the Oil Recovery–2003, 1st International Conference and Exhibition, Modern Challenges in Oil Recovery, Moscow, Russia, 19–23 May 2003; pp. 19–23. [Google Scholar]
  3. Li, W.; Schechter, D.S. Using polymer alternating gas to maximize CO2 flooding performance. In Proceedings of the SPE Trinidad and Tobago Section Energy Resources Conference, Port of Spain, Trinidad and Tobago, 9–11 June 2014. [Google Scholar]
  4. Al-Obaidi, S.; Galkin, A.; Smirnov, V. Numerical Simulation of Water Alternating Gas Injections (WAG) into Hydrocarbon Reservoirs: Factors Influencing Oil Recovery. J. Geol. Geophys. 2023, 12, 10001147. [Google Scholar]
  5. Ding, Y.; Qiao, L.; Li, Z.; Luo, R.; Han, G.; Tan, J.; Liu, X. Experimental study on oil recovery characteristics of different CO2 flooding methods in sandstone reservoirs with NMR. Fuel 2025, 385, 134124. [Google Scholar] [CrossRef]
  6. Kahrobaei, S.; Lamine, S.; Groenenboom, J.; van Batenburg, D. Water-Alternating-Gas Performance in Highly Heterogeneous Carbonates: Simulation Study Applied to Cross Sections of Brazil Pre-Salt Fields. SPE J. 2025, 1–15, SPE-224409-PA. [Google Scholar] [CrossRef]
  7. Li, S.; Zhang, Y.; Wang, N.; Wang, Z.; Liu, H. Pore-Scale Investigation of Water-Alternating-Gas Injection for CCUS in Water-Wet Porous Media. Energy Fuels 2025, 39, 3039–3055. [Google Scholar] [CrossRef]
  8. Luo, Q.; Li, Y.; Sun, H.; Liu, S.; Yu, Y.; Yang, Z. Research on CO2–WAG in Thick Reservoirs: Geological Influencing Factors and Random Forest Importance Evaluation. ACS Omega 2024, 9, 34118–34127. [Google Scholar] [CrossRef] [PubMed]
  9. Fang, P.; Zhang, Q.; Zhou, C.; Yang, Z.; Yu, H.; Du, M.; Chen, X.; Song, Y.; Wang, S.; Gao, Y.; et al. Chemical-Assisted CO2 Water-Alternating-Gas Injection for Enhanced Sweep Efficiency in CO2-EOR. Molecules 2024, 29, 3978. [Google Scholar] [CrossRef] [PubMed]
  10. Bui, D.; Nguyen, S.; Ampomah, W.; Acheampong, S.A.; Hama, A.; Amosu, A.; Koray, A.-M.; Appiah Kubi, E. A Comparison of Water Flooding and CO2-EOR Strategies for the Optimization of Oil Recovery: A Case Study of a Highly Heterogeneous Sandstone Formation. Gases 2025, 5, 1. [Google Scholar] [CrossRef]
  11. Yao, C.-J.; Xu, H.-S.; Liu, Y.-Q.; Hou, J.-X.; Zhang, X.-Q.; Li, C.-F. Study on CO2 Flooding Effect of Heterogeneous Reservoir Under Different Well Pattern; Springer: Singapore, 2024; pp. 250–261. [Google Scholar]
  12. Zhang, Y.-Q.; Yang, S.-L.; Bi, L.-F.; Gao, X.-Y.; Shen, B.; Hu, J.-T.; Luo, Y.; Zhao, Y.; Chen, H.; Li, J. A technical review of CO2 flooding sweep-characteristics research advance and sweep-extend technology. Pet. Sci. 2025, 22, 255–276. [Google Scholar] [CrossRef]
  13. Kang, M.; Christian, K.; Celia, M.A.; Mauzerall, D.L.; Bill, M.; Miller, A.R.; Chen, Y.; Conrad, M.E.; Bandilla, K.W. Identification and Characterization of High Methane-Emitting Abandoned Oil and Gas Wells. Fuel 2019, 242, 447–456. [Google Scholar] [CrossRef]
  14. Abdullah, N.; Hasan, N. The implementation of Water Alternating (WAG) injection to obtain optimum recovery in Cornea Field, Australia. J. Pet. Explor. Prod. 2021, 11, 1475–1485. [Google Scholar] [CrossRef]
  15. Wahyuningrum, C.; Fathaddin, M.T.; Nugrahanti, A.; Kasmungin, S.; Mardiana, D.A.; Omar, E.M.A. Study of the effect of cycle time and WAG ratio of CO2 miscible water alternating gas (WAG) injection in field X. AIP Conf. Proc. 2023, 2598, 030005. [Google Scholar] [CrossRef]
  16. Ju, B.; Wu, Y.-S.; Qin, J.; Fan, T.; Li, Z. Modeling CO2 miscible flooding for enhanced oil recovery. Pet. Sci. 2012, 9, 192–198. [Google Scholar] [CrossRef]
Figure 1. Three-dimensional view of CO2-WAG sector model.
Processes 13 00700 g001
Figure 2. Porosity distribution in layer 17 (left) and in layer 18 (right).
Processes 13 00700 g002
Figure 3. Permeability distribution in layer 20 (left) and in layer 22 (right).
Processes 13 00700 g003
Figure 11. Oil production by CO2-WAG injection process.
Processes 13 00700 g011
Figure 12. Cumulative CO2 injection during continuous CO2 flooding and CO2-WAG.
Processes 13 00700 g012
Figure 13. Cumulative water injection during continuous water flooding and CO2-WAG.
Processes 13 00700 g013
Figure 14. Oil production rate during continuous CO2 flooding, CO2-WAG, and water flooding techniques (water-wet conditions).
Processes 13 00700 g014
Figure 15. Cumulative oil production through continuous CO2 flooding, CO2-WAG, and water flooding techniques (water-wet conditions).
Processes 13 00700 g015
Figure 16. Gas oil ratio during continuous CO2 flooding and CO2-WAG flooding techniques (water-wet conditions).
Processes 13 00700 g016
Figure 17. Water cut during continuous CO2 flooding and CO2-WAG flooding techniques (water-wet conditions).
Processes 13 00700 g017
Figure 18. Oil production rate during continuous CO2 flooding, CO2-WAG, and water flooding techniques (mixed-wet conditions).
Processes 13 00700 g018
Figure 19. Cumulative oil production through continuous CO2 flooding, CO2-WAG, and water flooding techniques (mixed-wet conditions).
Processes 13 00700 g019
Figure 20. Gas–oil ratio during continuous CO2 flooding and CO2-WAG flooding techniques (mixed-wet conditions).
Processes 13 00700 g020
Figure 21. Water cut during continuous CO2 flooding and CO2-WAG flooding techniques (mixed-wet conditions).
Processes 13 00700 g021
Figure 22. Standard deviation analysis for water-wet and mixed-wet conditions.
Processes 13 00700 g022
Table 1. Oil recovery factors for water-wet and mixed-wet systems.
Injection MethodsWater-Wet SystemMixed-Wet System
CO2-WAG2616.1
CO2 flooding27.217.2
Water flooding23.612.4
Disclaimer/Publisher’s Note: The statements, opinions and data contained in all publications are solely those of the individual author(s) and contributor(s) and not of MDPI and/or the editor(s). MDPI and/or the editor(s) disclaim responsibility for any injury to people or property resulting from any ideas, methods, instructions or products referred to in the content.