
Heterogeneity of Pore and Fracture Structure in Tight Sandstone Using Different Fractal Models and Its Influence on Porosity–Permeability Variation

 ,
, 
Abstract
1. Introduction
2. Experimental Methods and Related Theories
2.1. Sample Preparation and Experimental Methods
2.2. Related Theories
3. Results and Discussions
3.1. Pore Types and Sample Types Assessed Using SEM and HPMI Tests
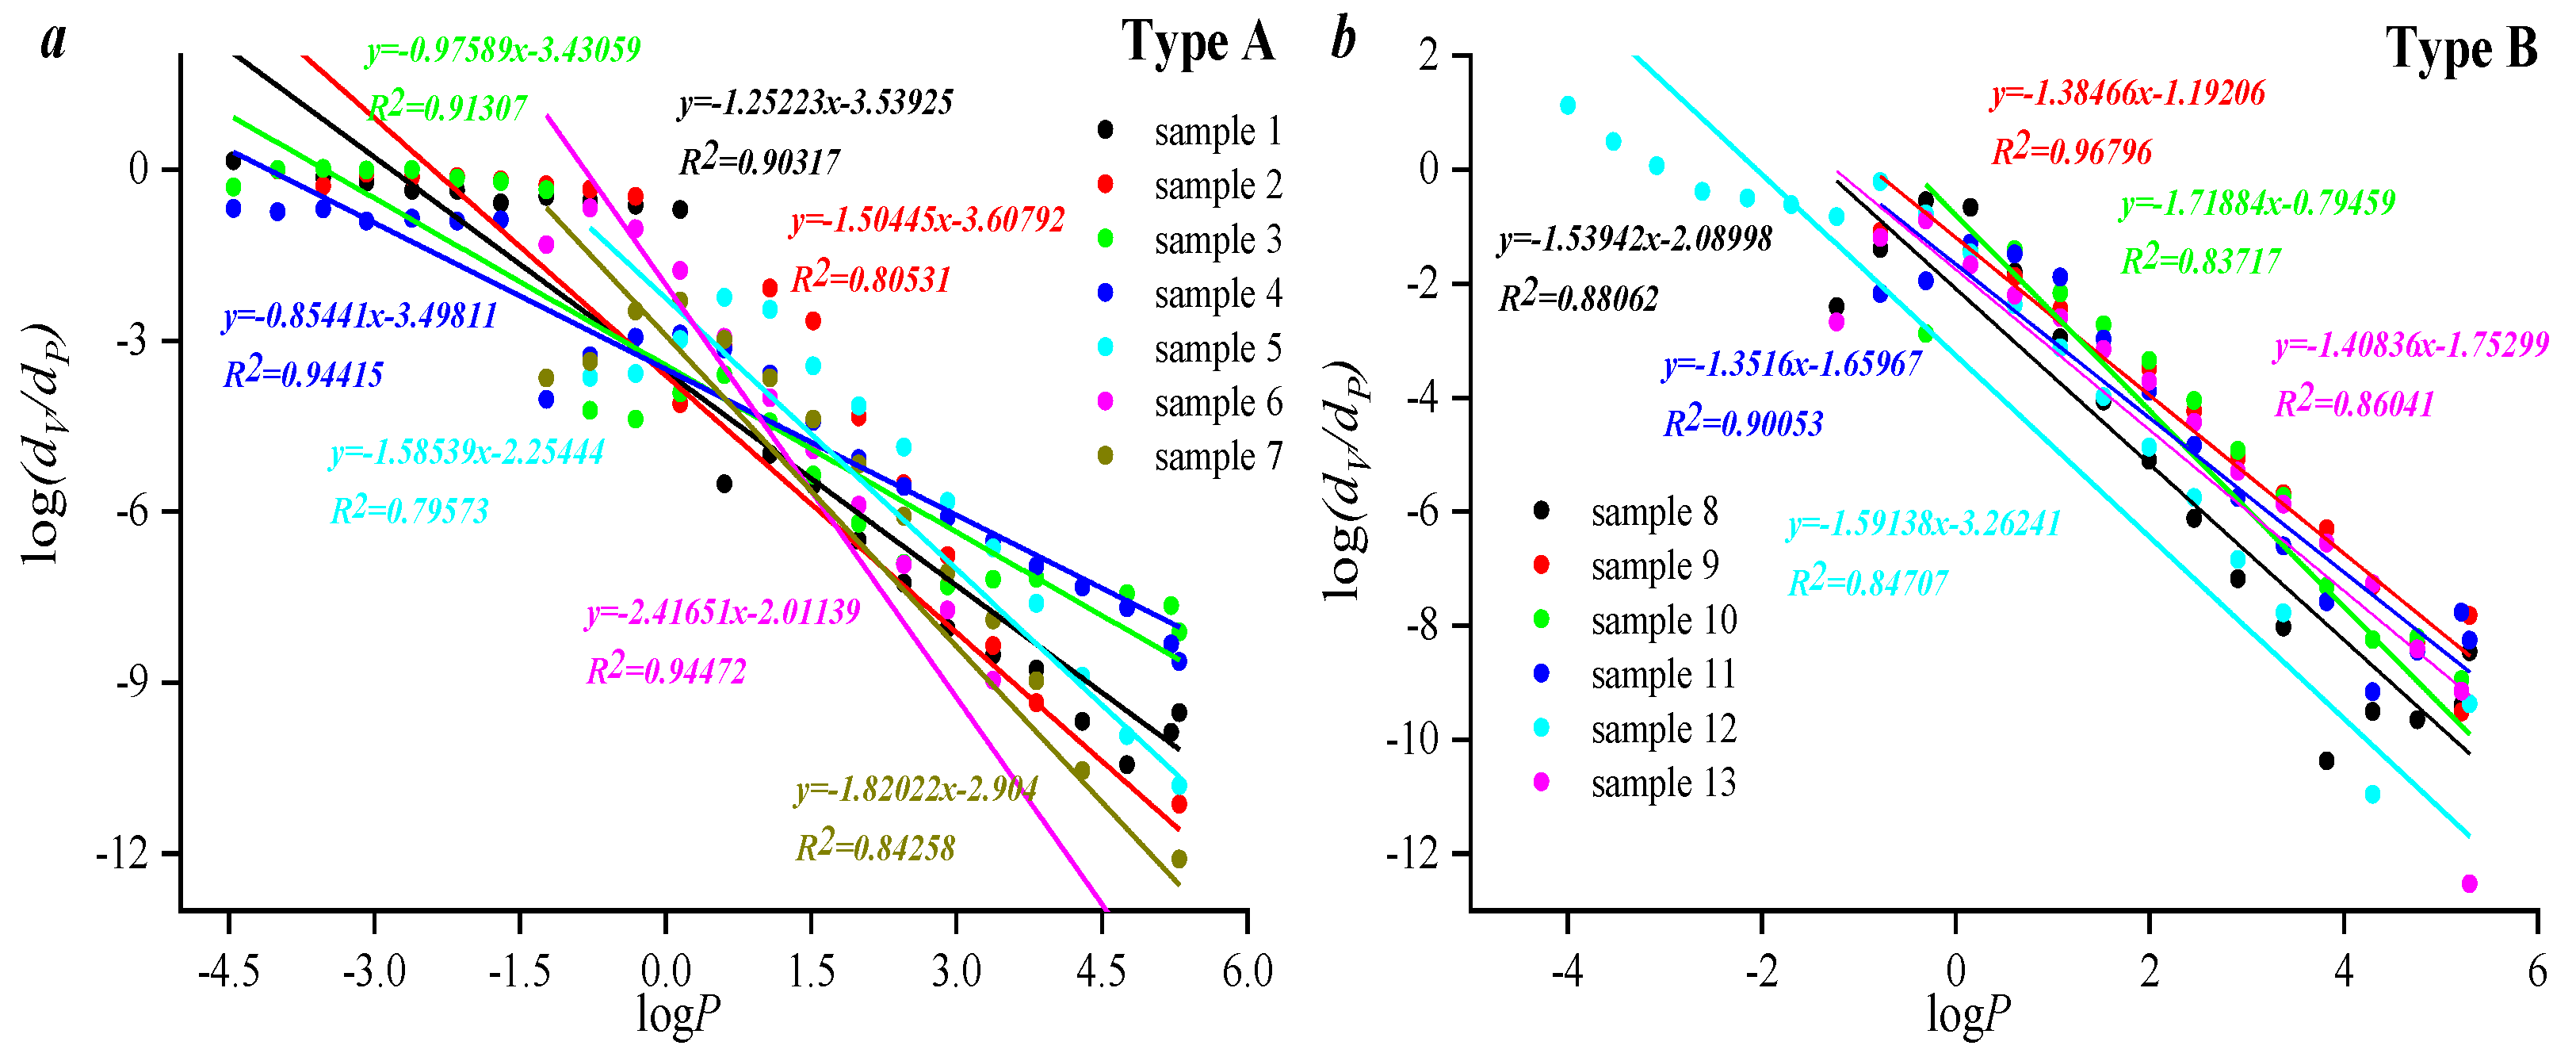
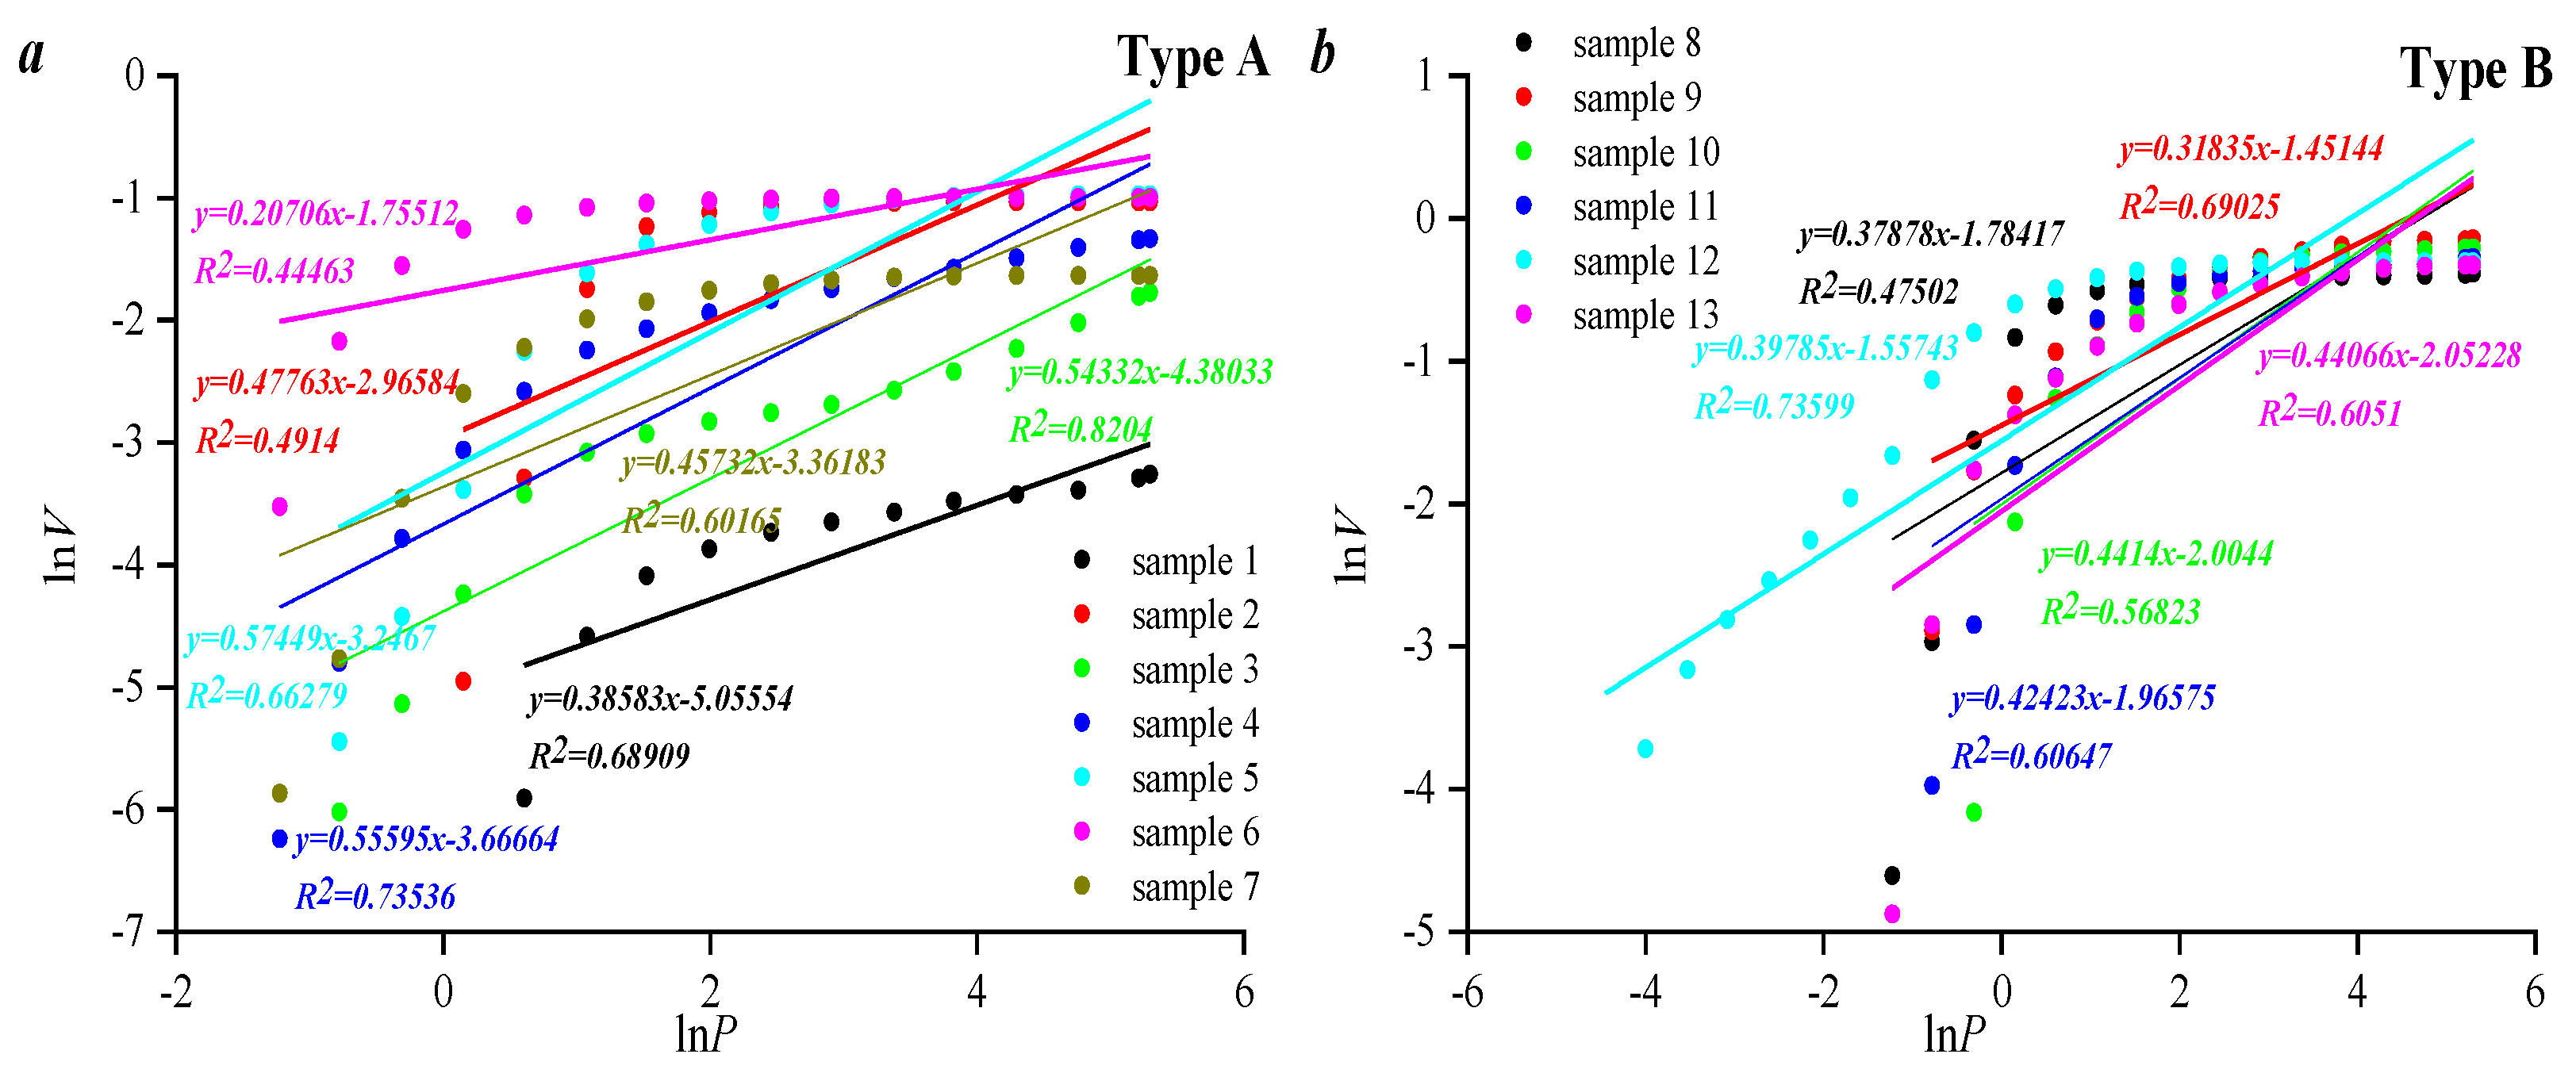
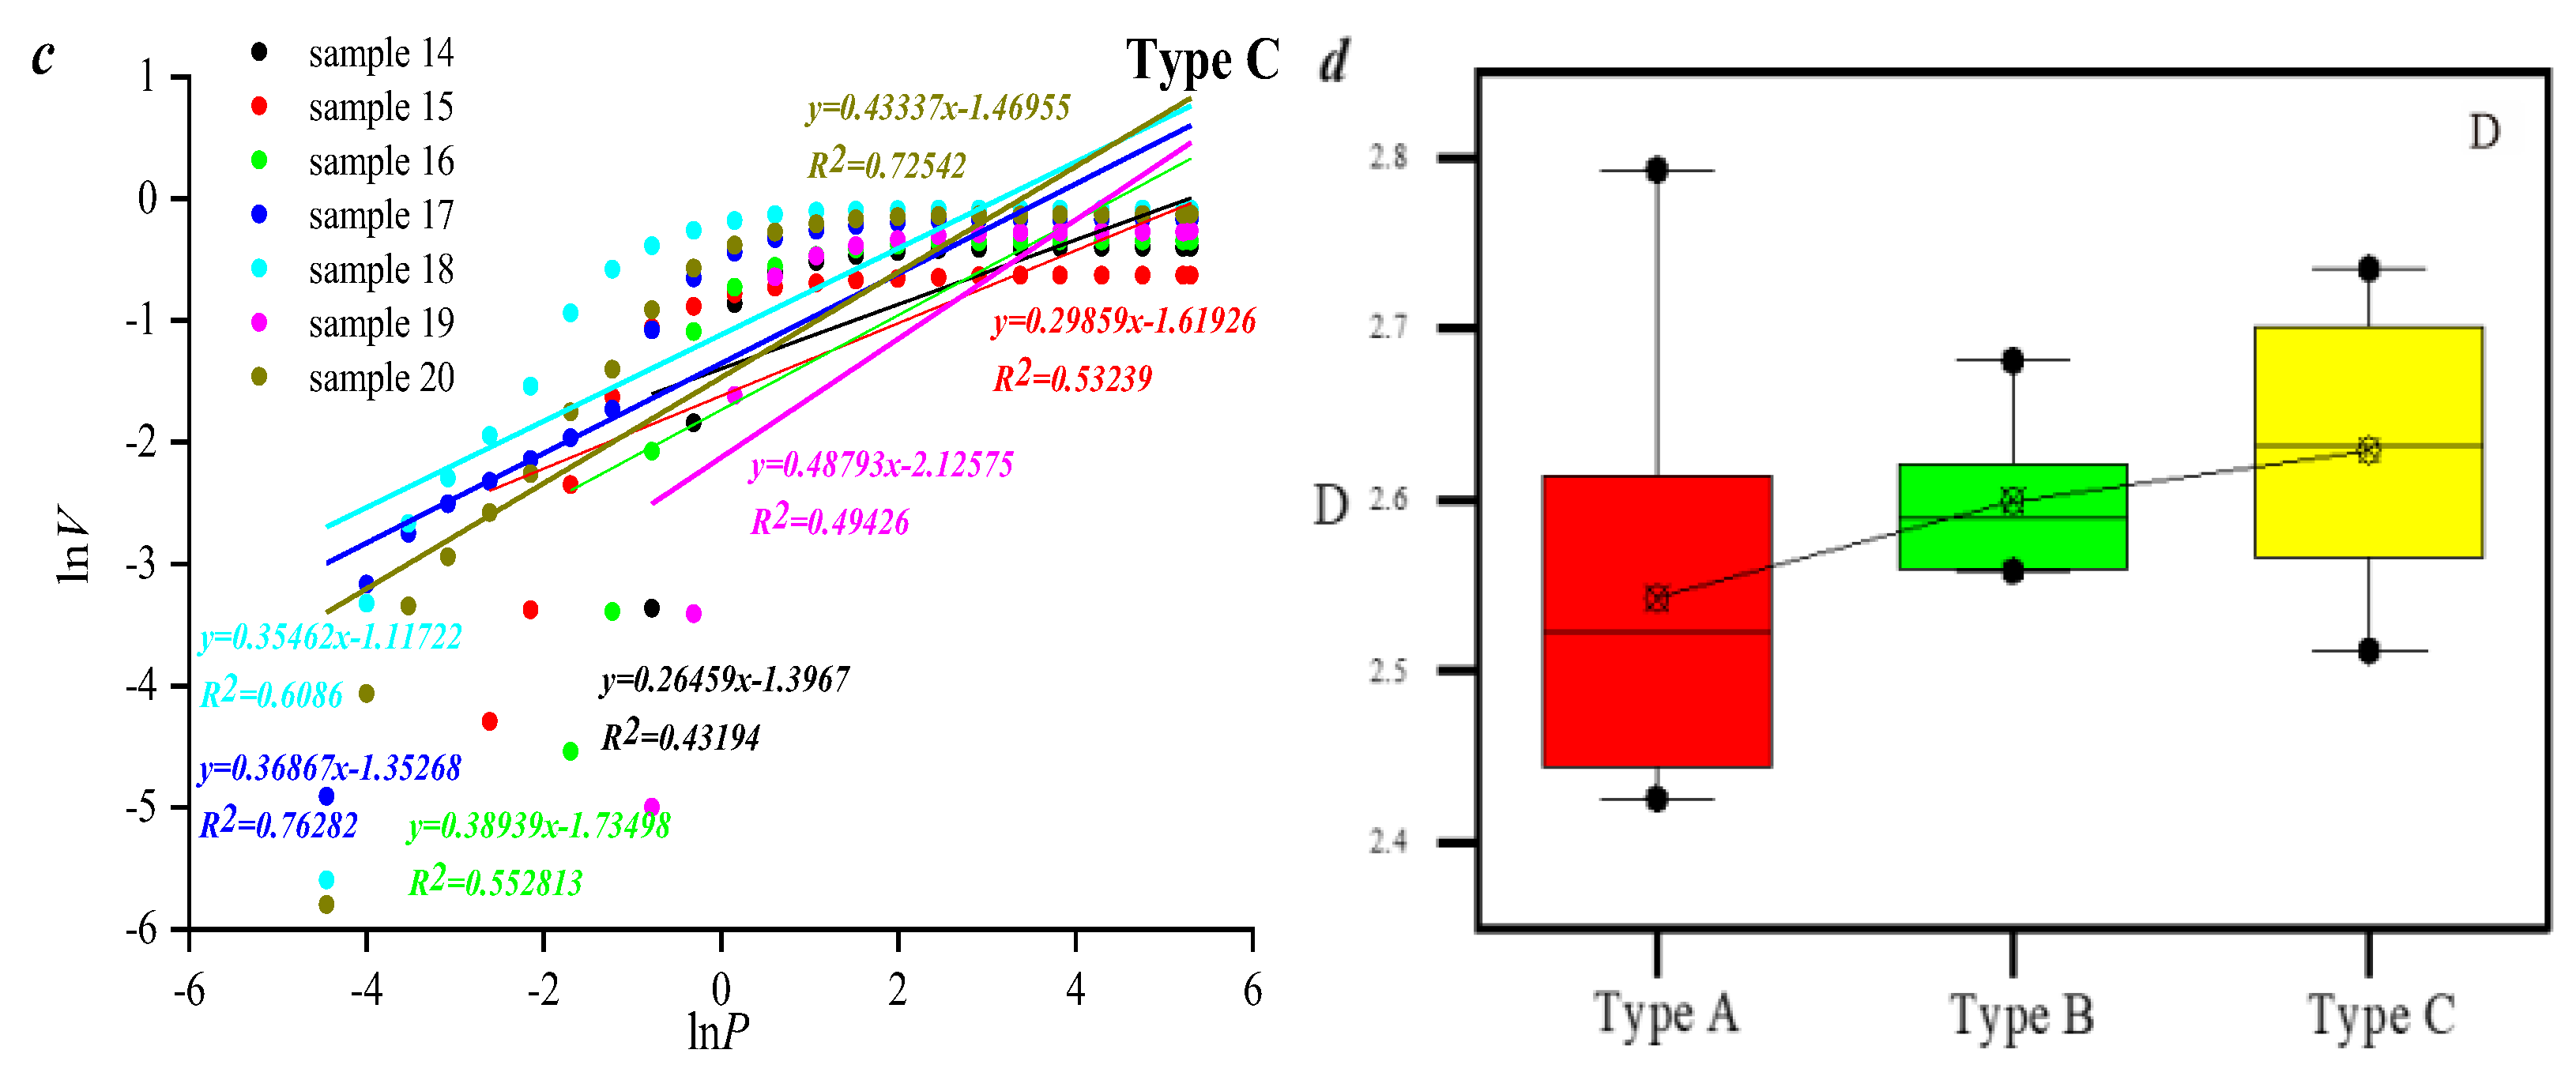
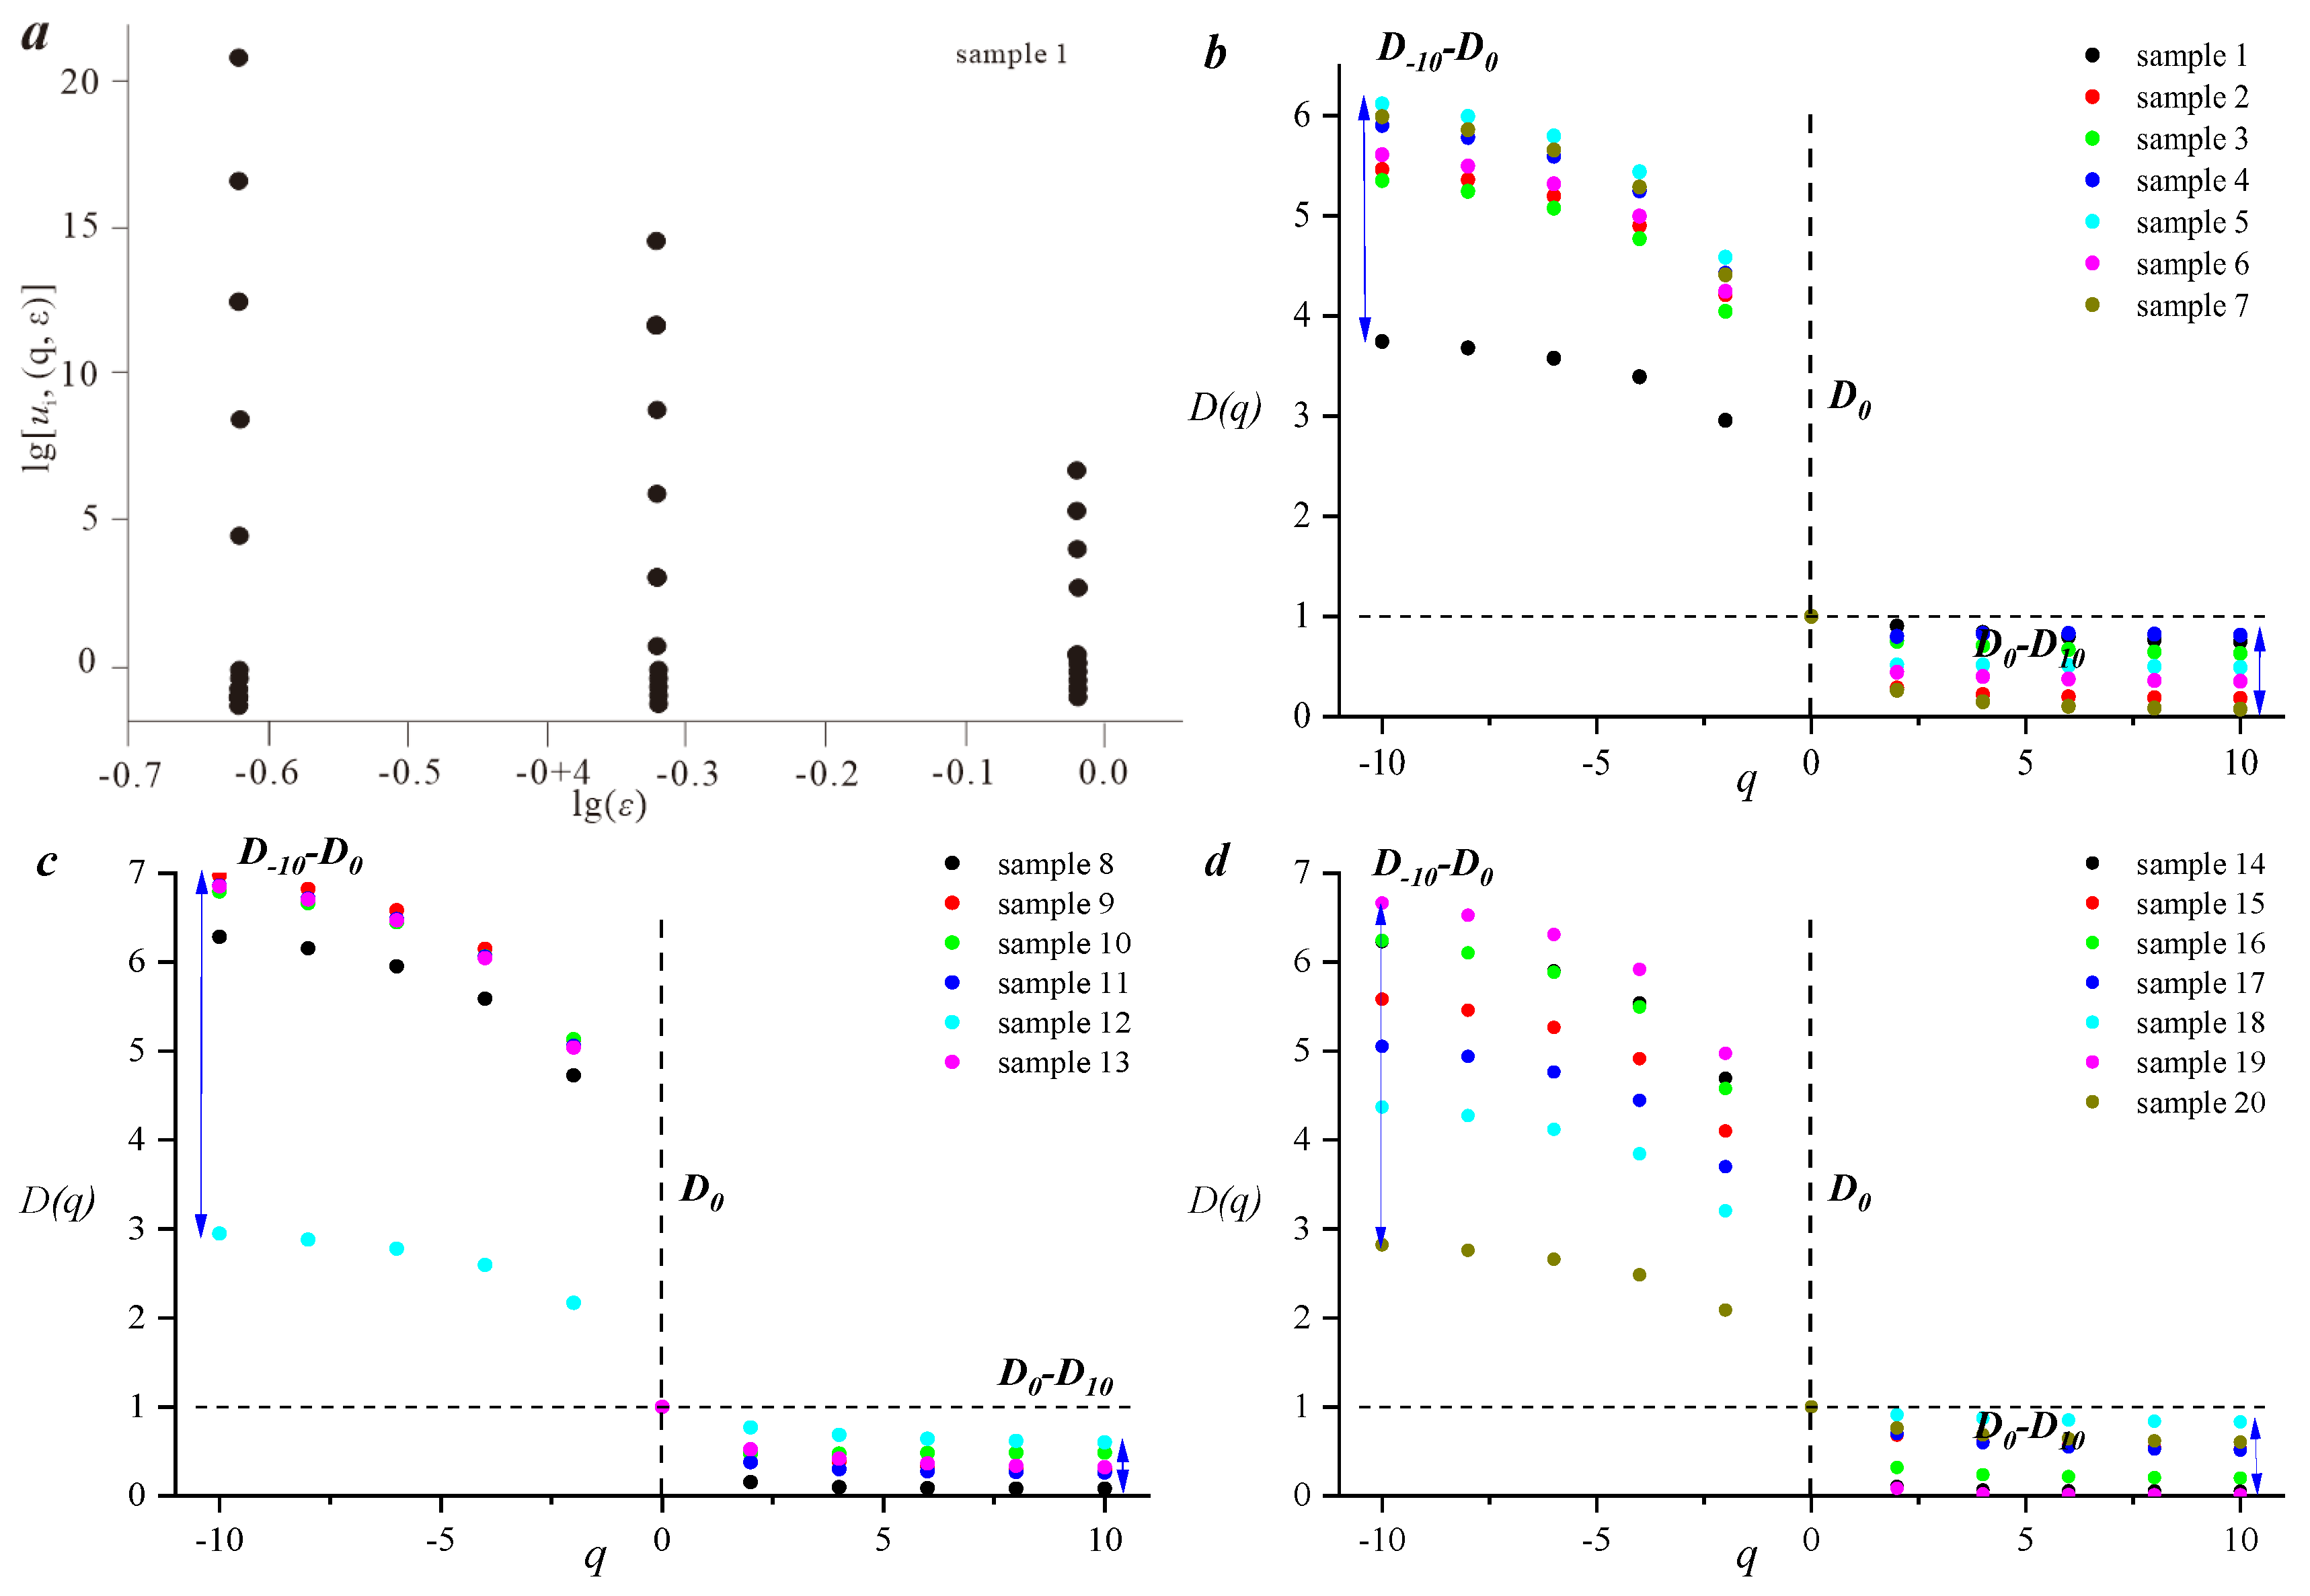
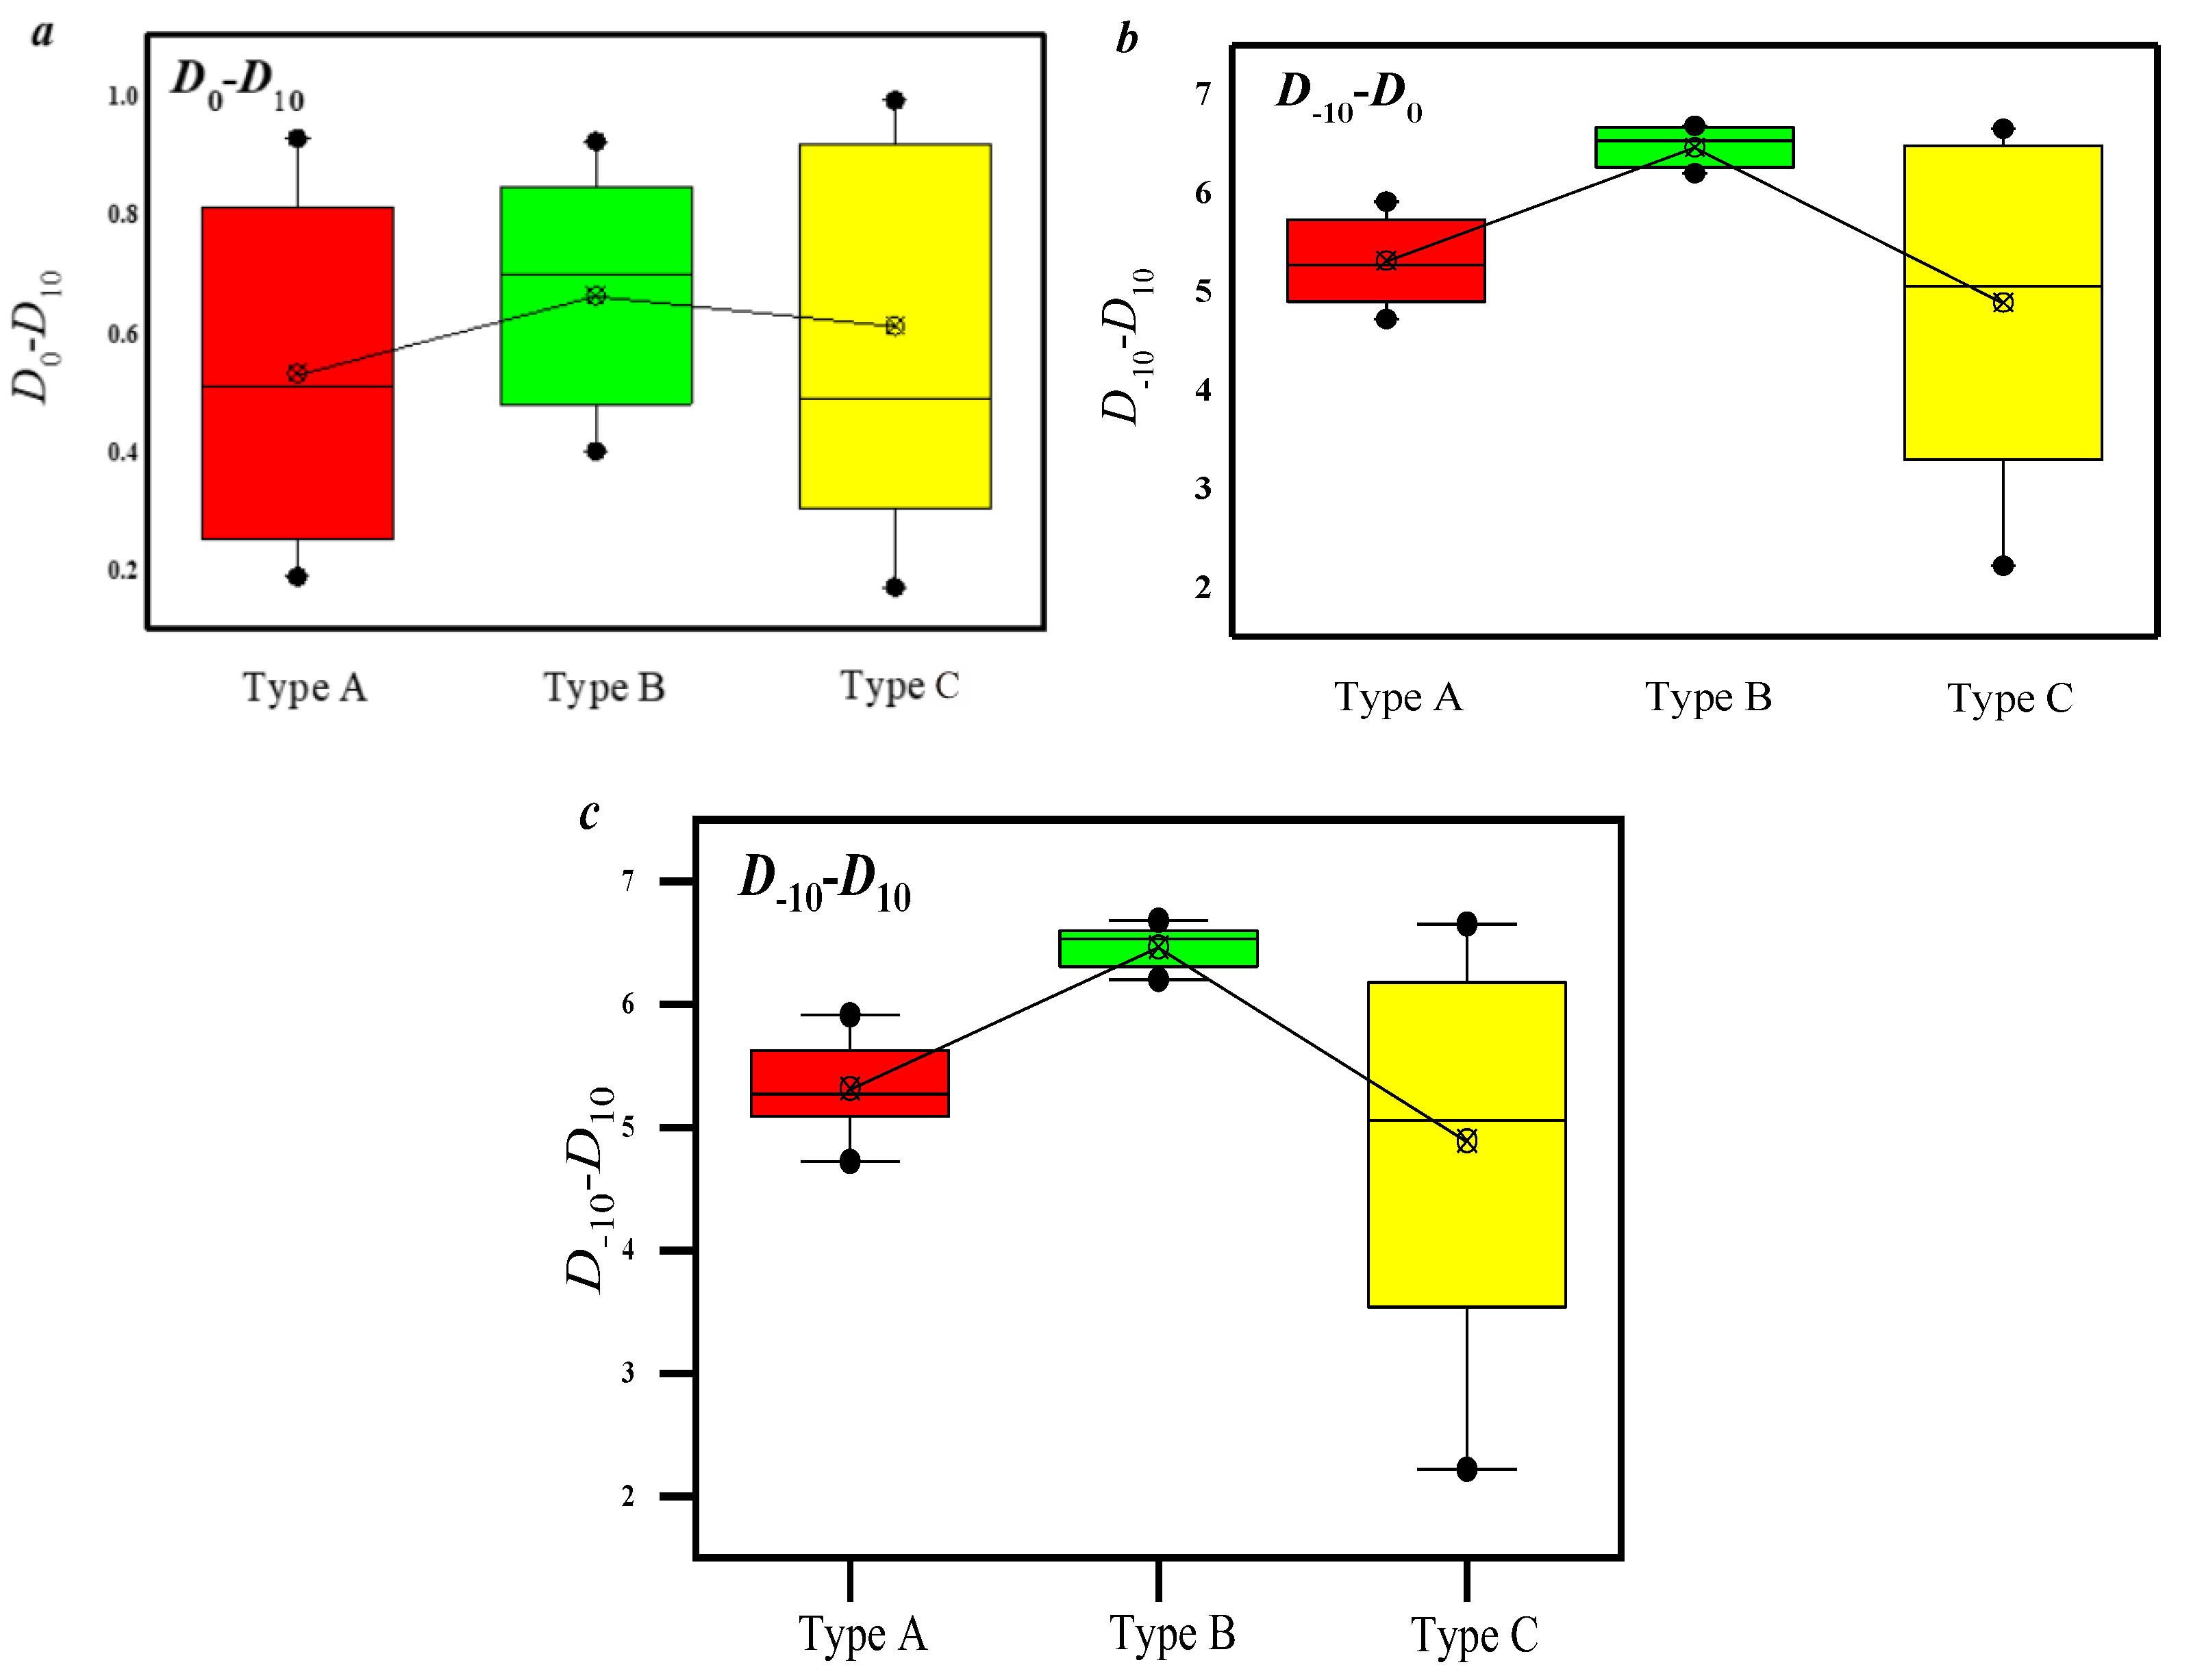
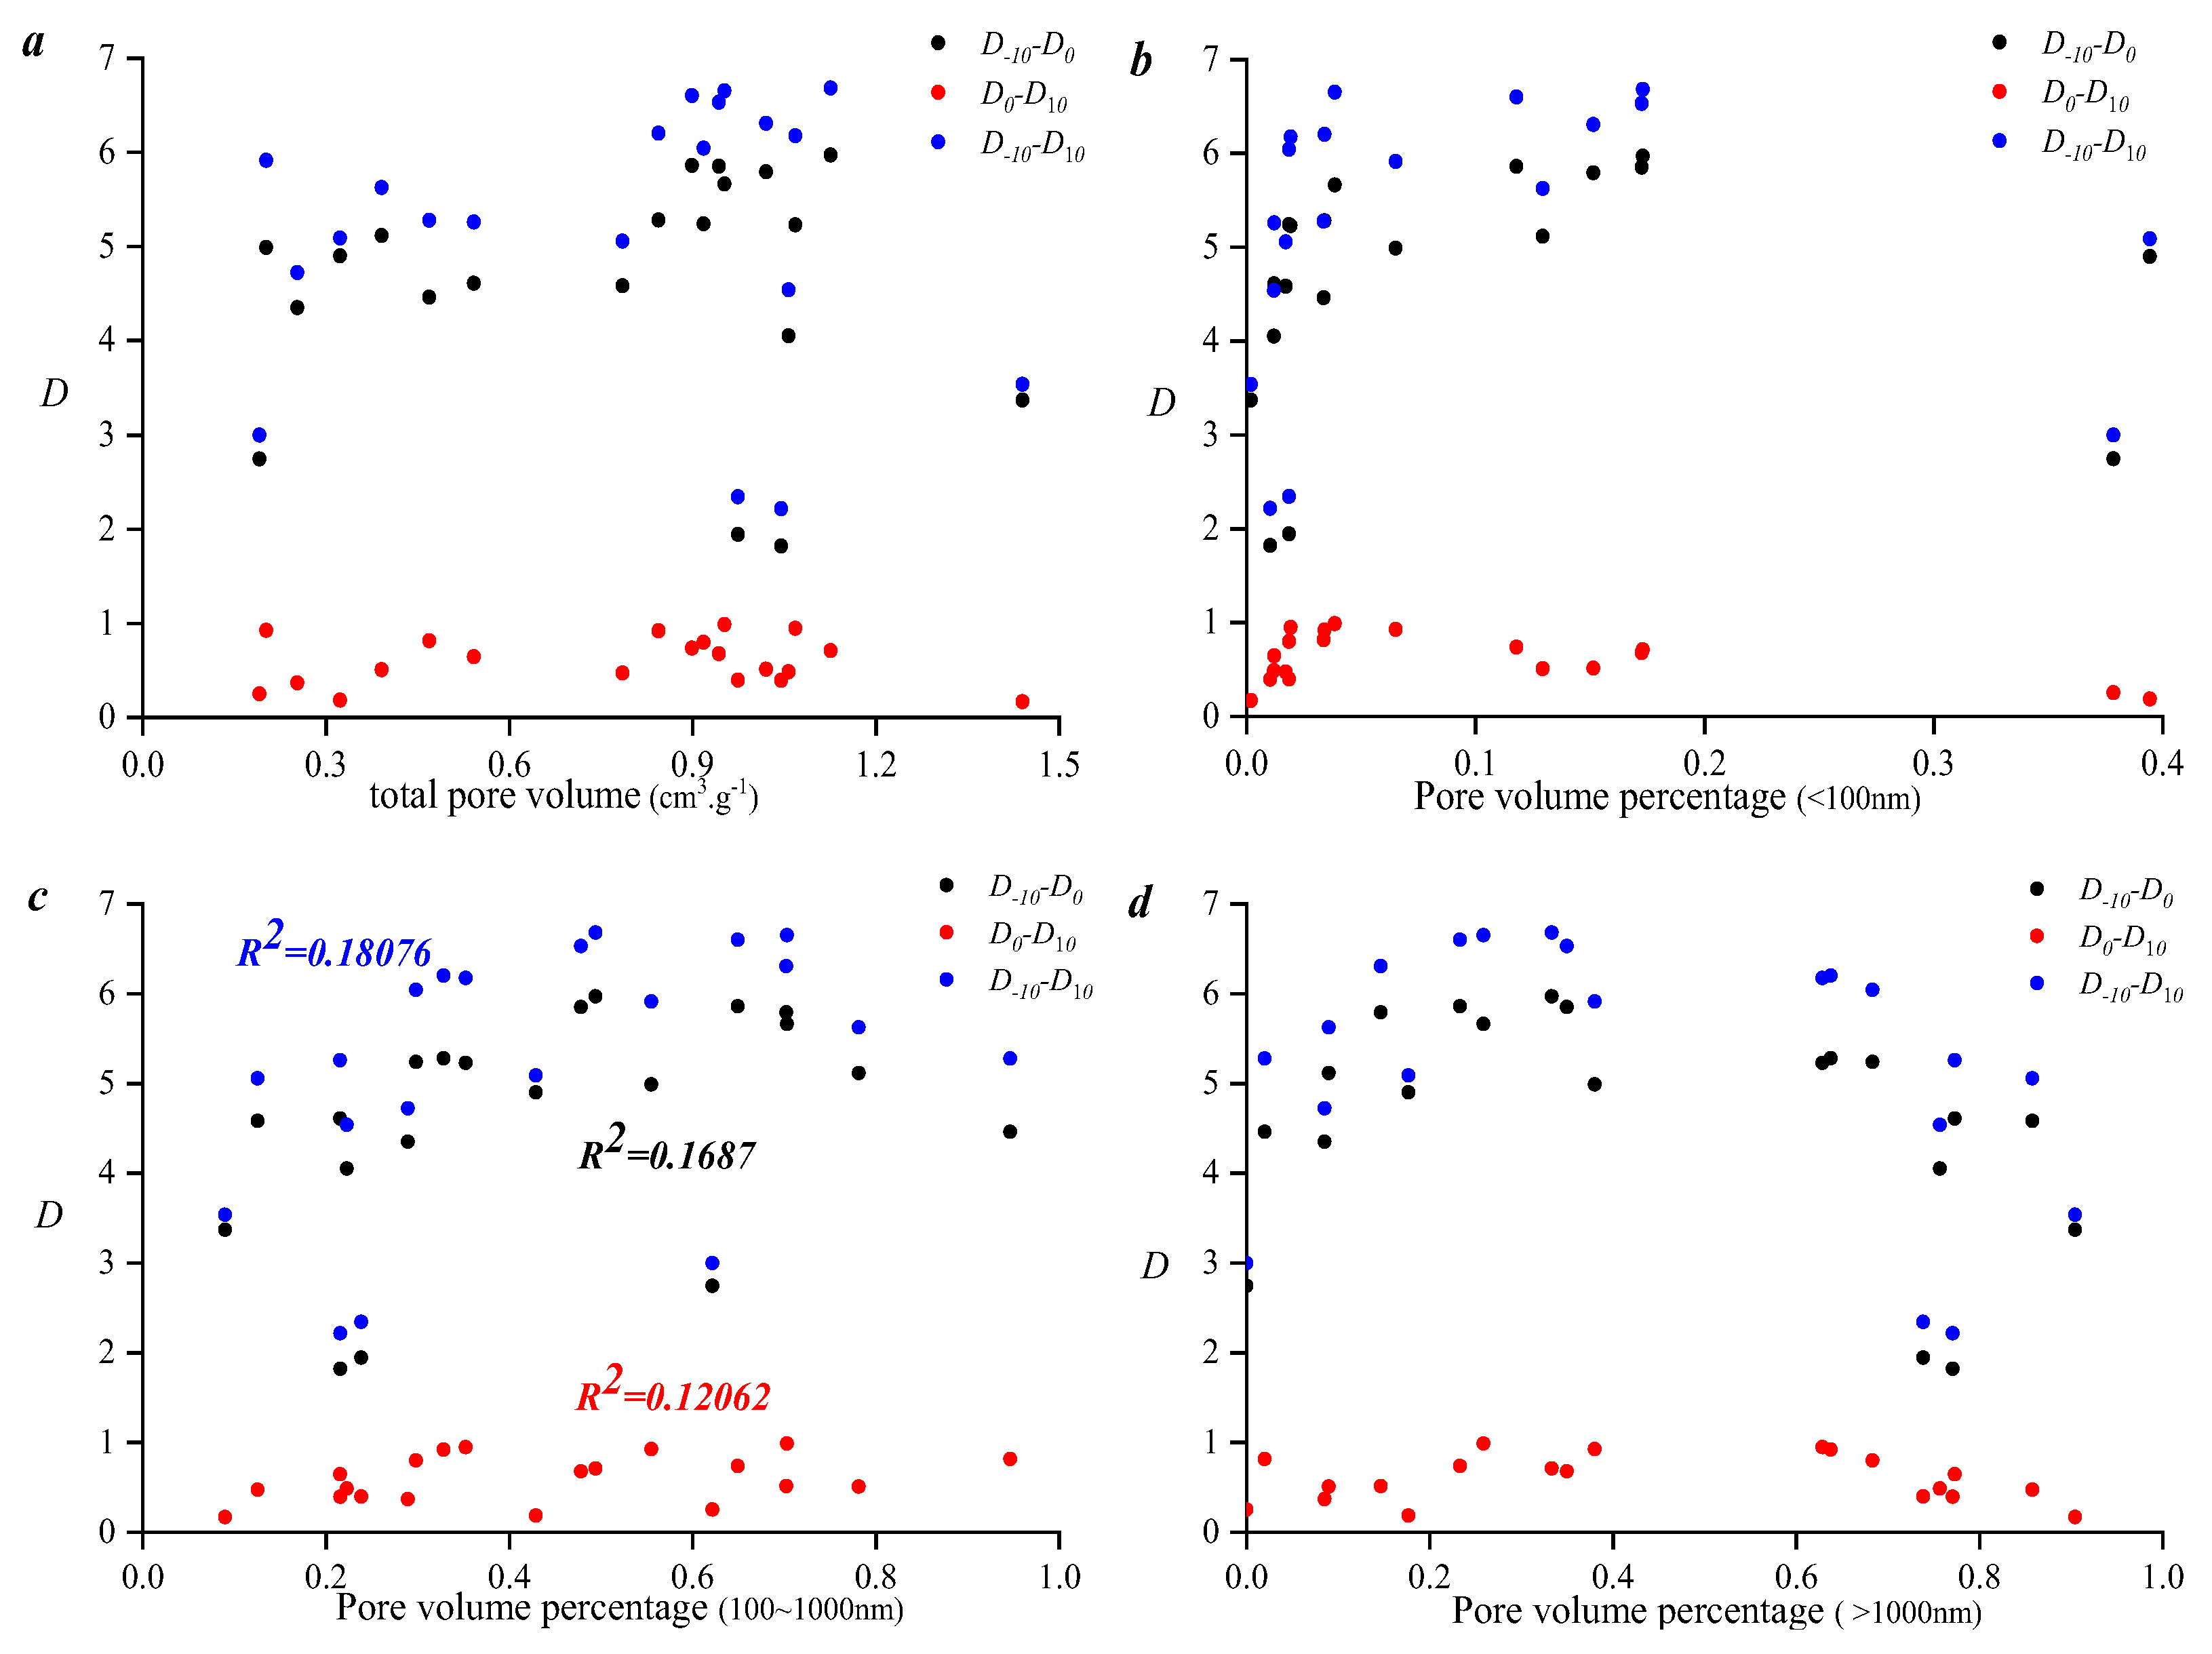
3.2. Pore Structure Heterogeneity Assessed Using Different Fractal Models
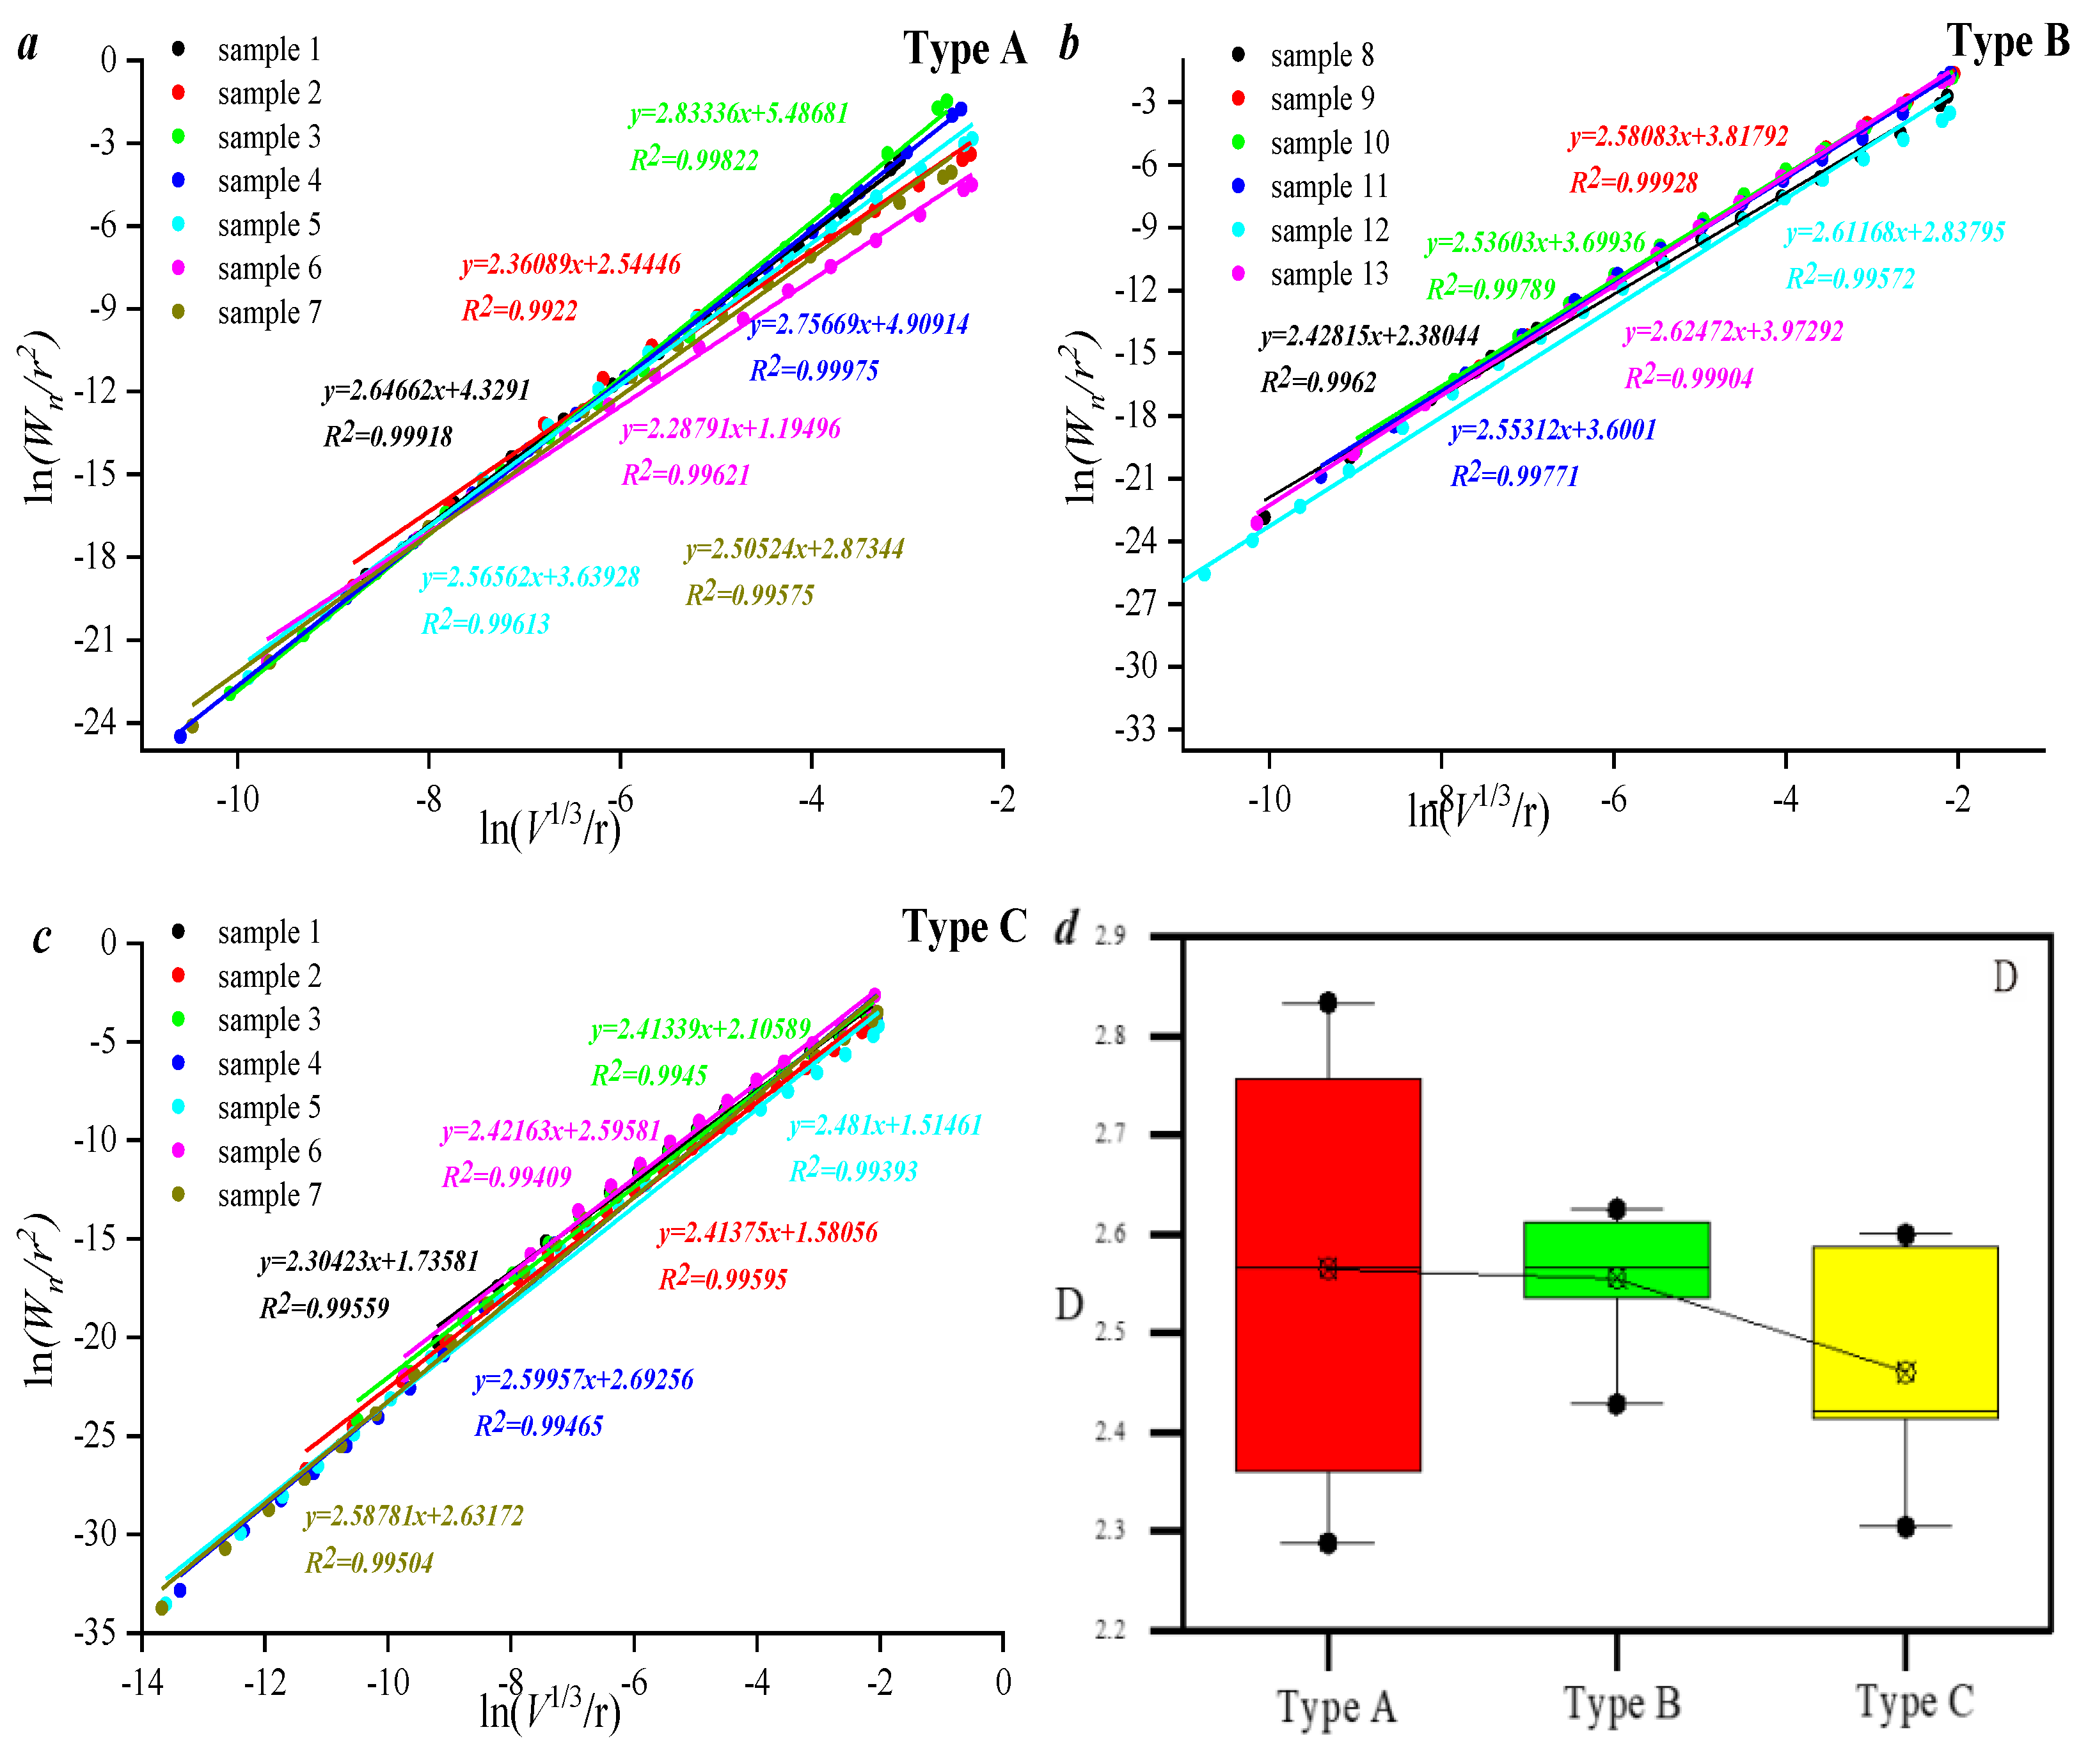
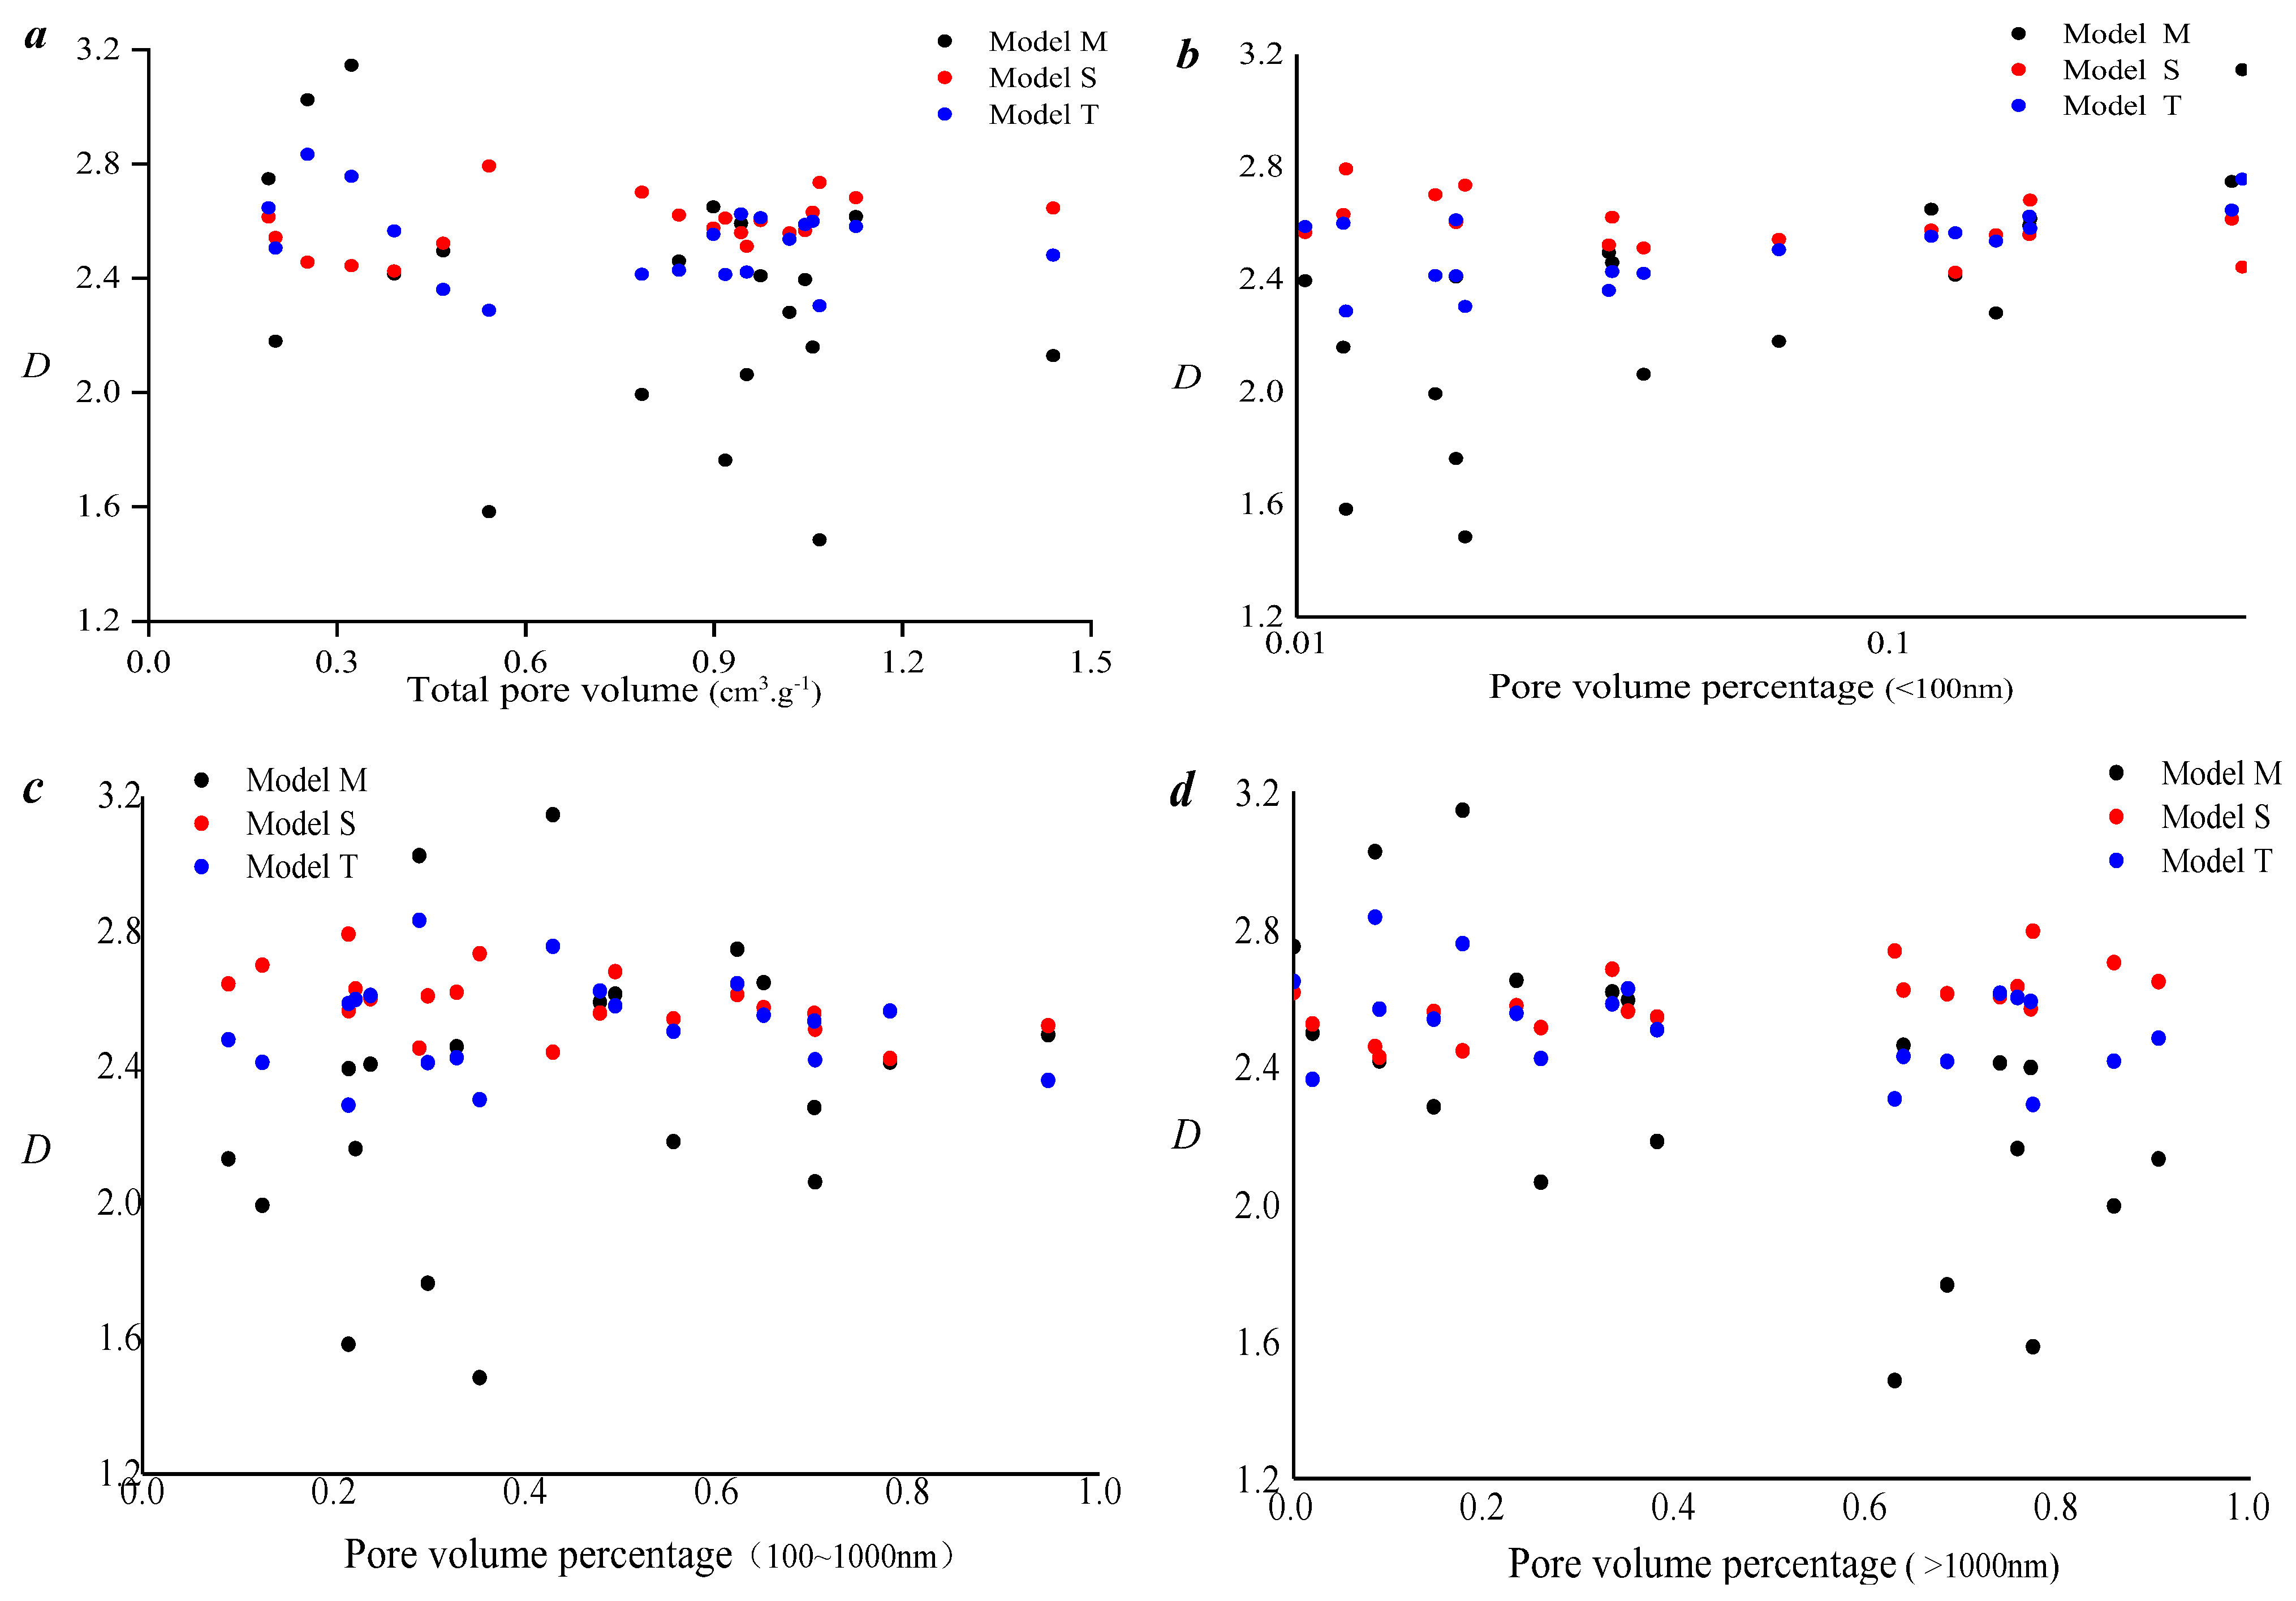
3.3. Applicability of Different Fractal Models in Characterizing Pore Fracture Structures
3.4. Porosity–Permeability and Compressibility Under the Effect of Pore Fracture Structure Heterogeneity
4. Conclusions
- (1)
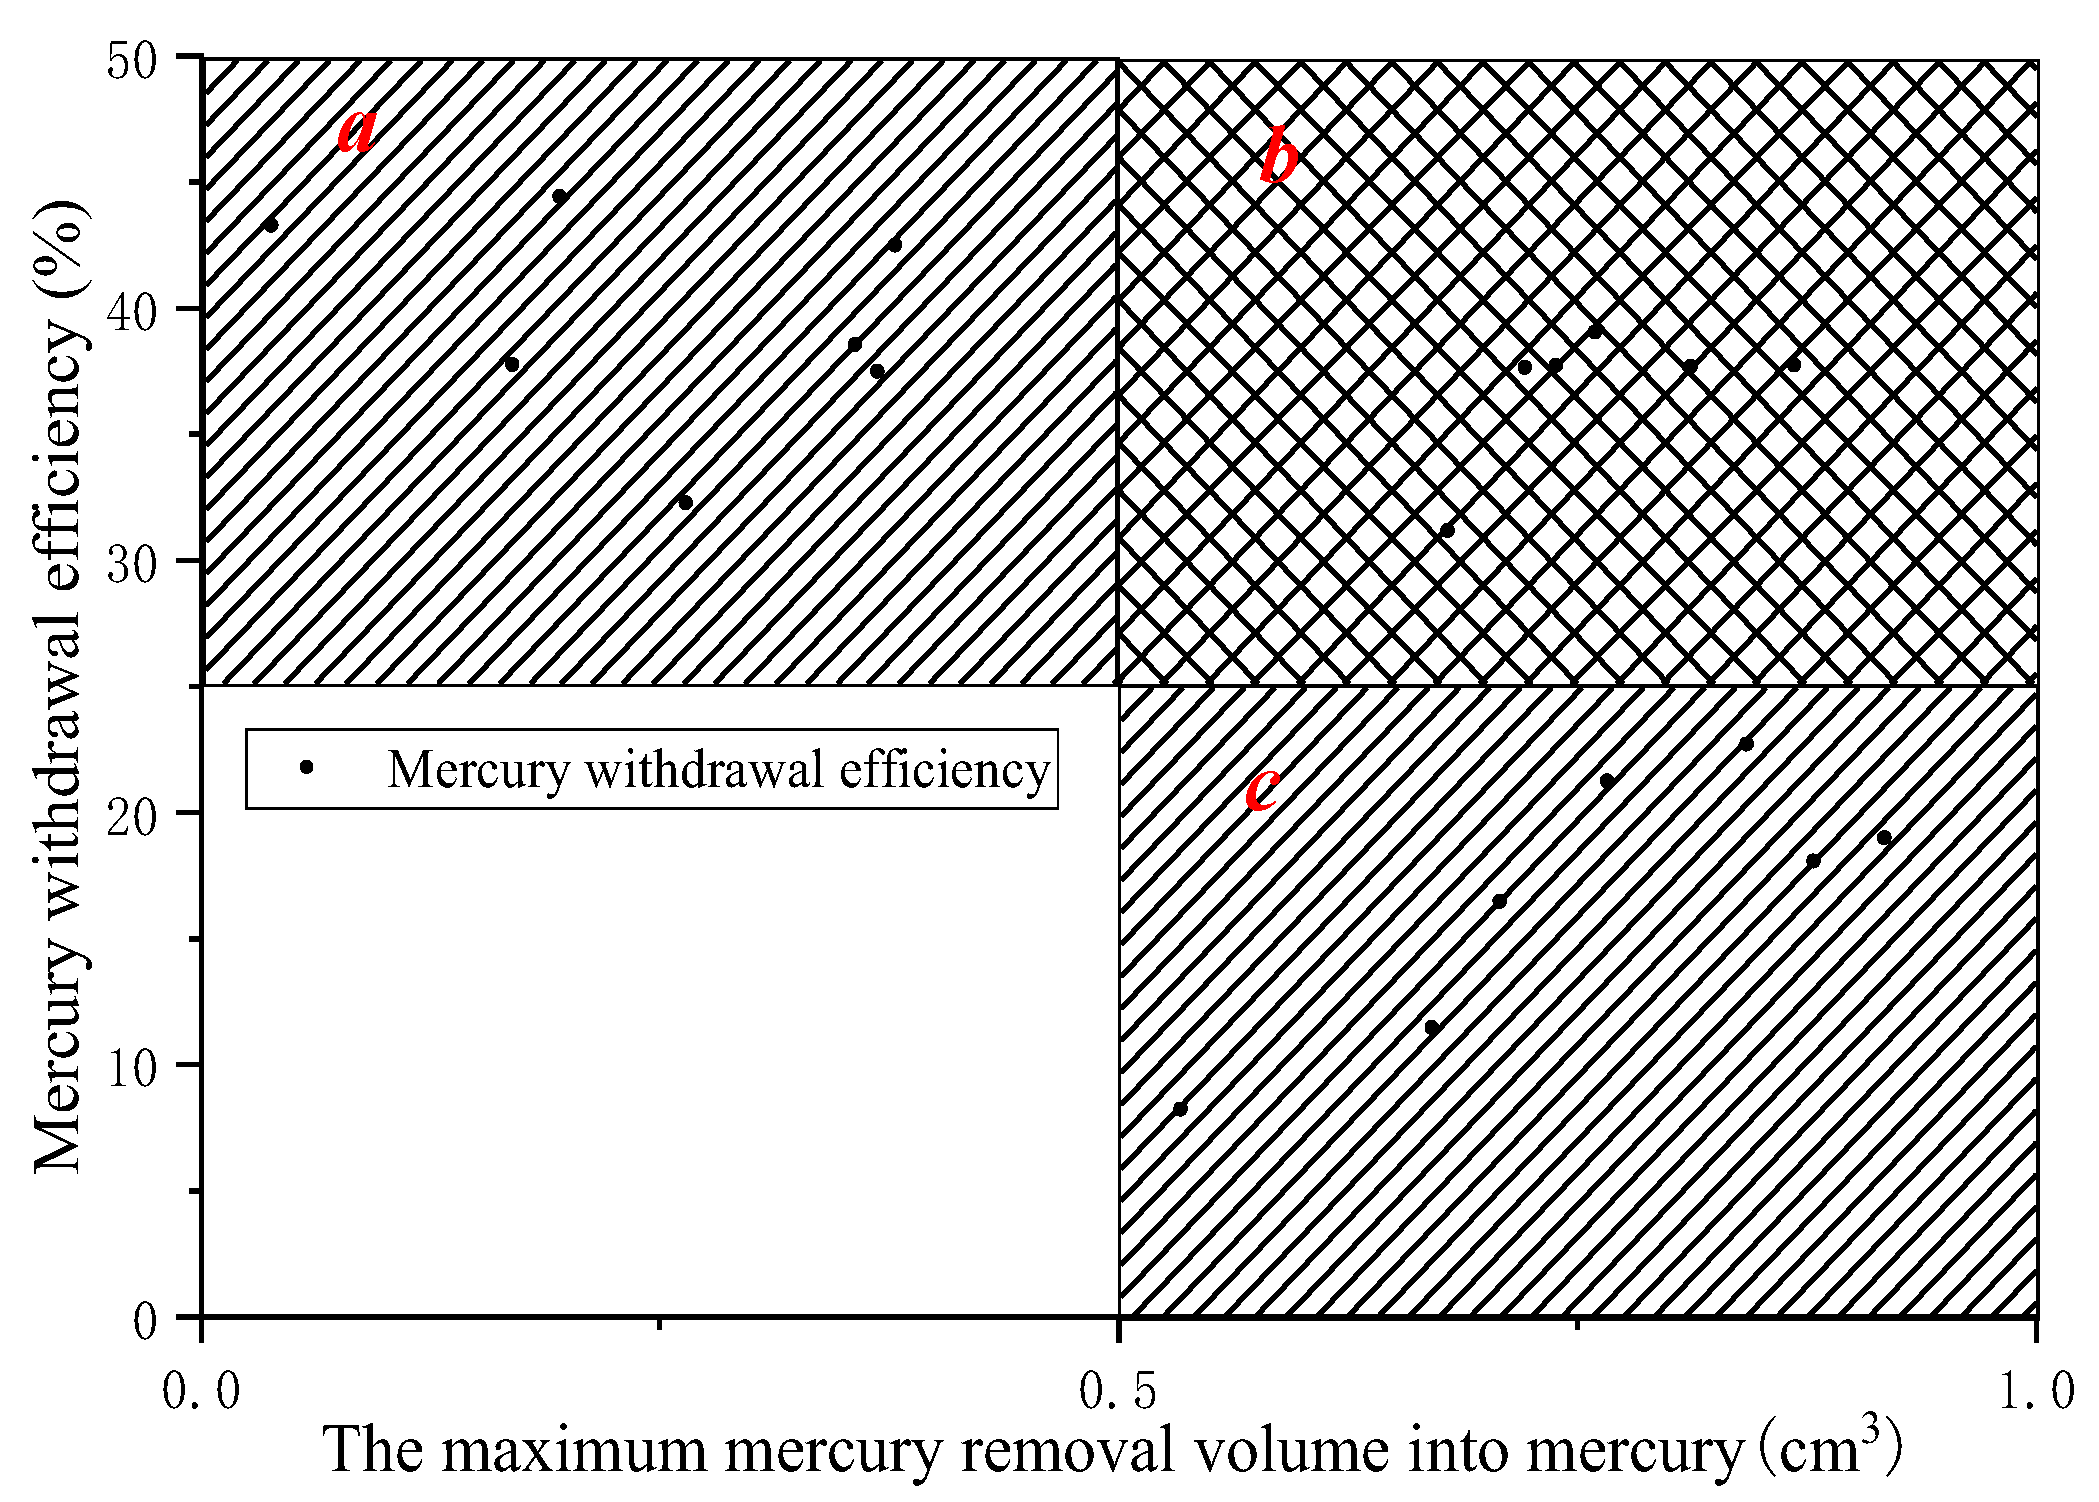
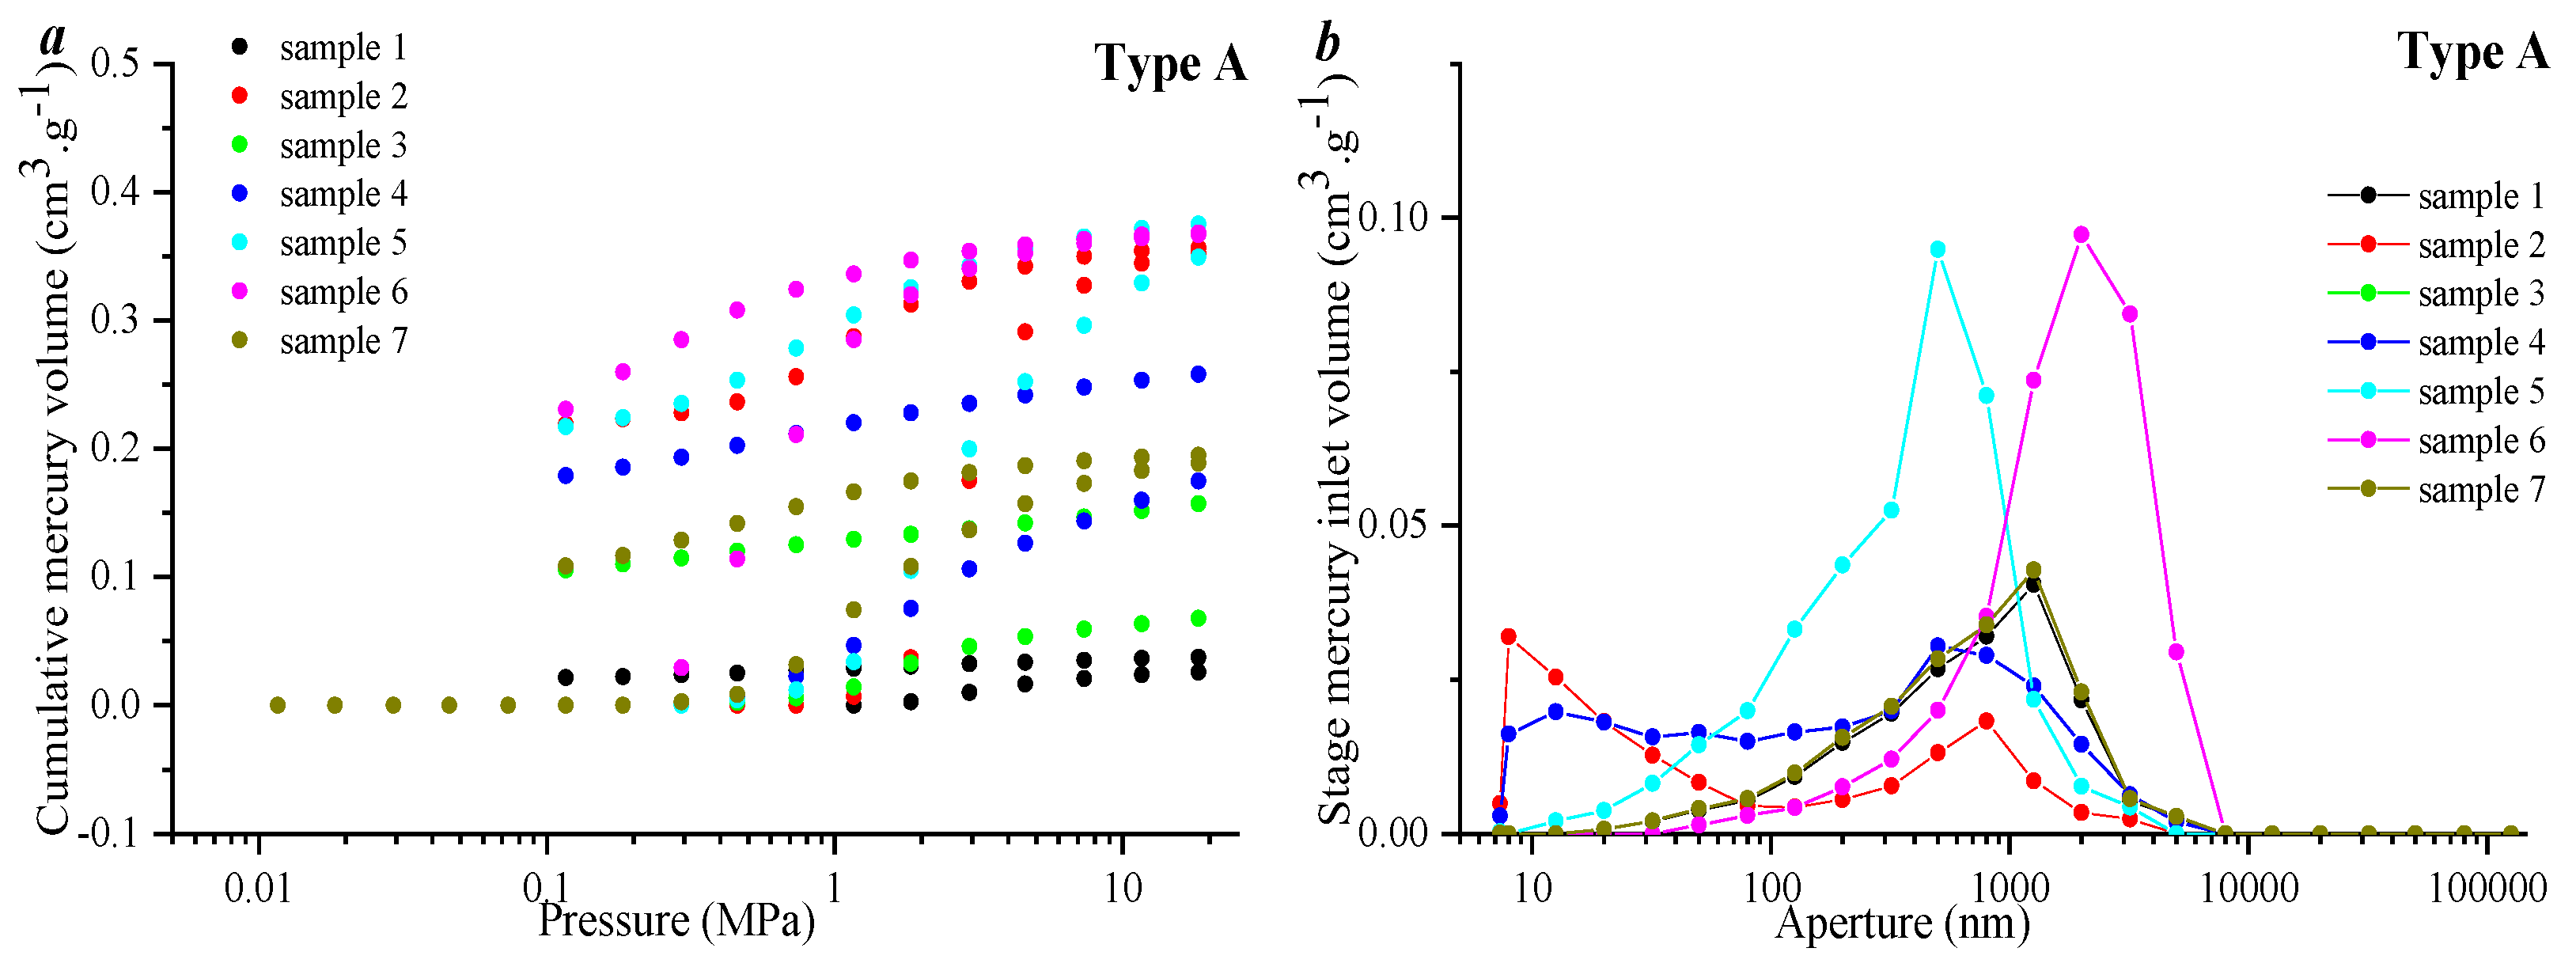
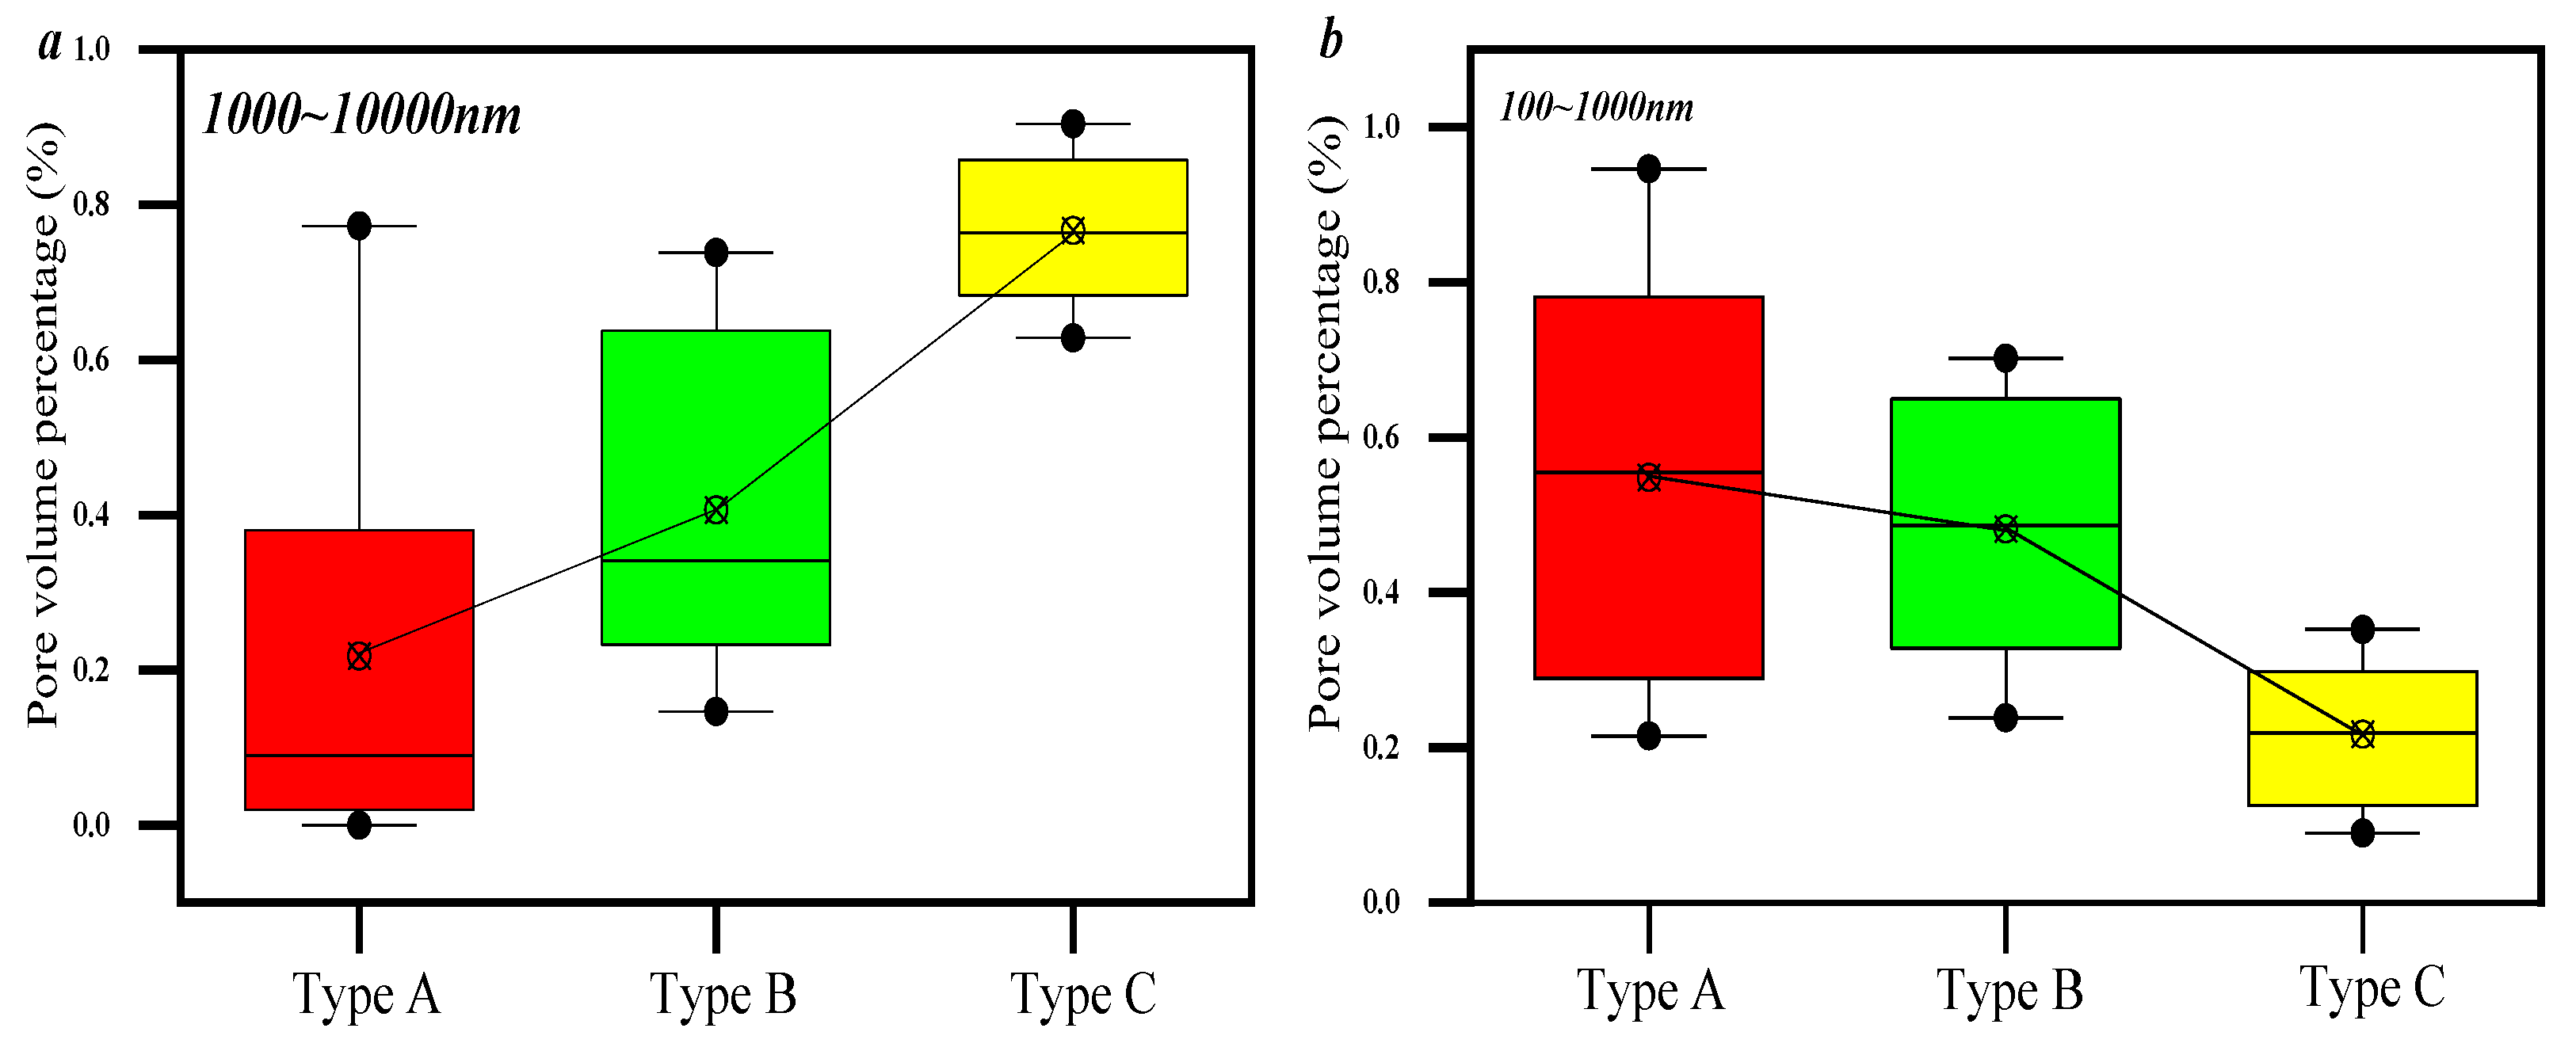
- All the samples can be divided into three types using maximum mercury injection volume and mercury withdrawal efficiency. Type A is represented by lower MMIV (less than 0.5 cm3·g−1) and higher MWE (larger than 25%) values, indicating that the pore volume of this type of samples is relatively lower, but the pore connectivity is good. The volume percentage of pores whose diameter is less than 100 nm and 100~1000 nm in type A samples is larger than that of type B and C samples, since in this type of samples, micropores are developed.
- (2)
- Therefore, the fractal dimension of type A samples is larger than that of type B and C samples, indicating that the pore volume distribution heterogeneity of this type of sample is larger than that of the other samples. The reason is that the volume of pores with diameters larger than 10,000 nm in type A samples is smaller, and only pores smaller than 10,000 nm are developed.
- (3)
- The fractal dimension value obtained with the M model has a good linear relationship with the thermodynamic model, which indicates that the M model and the thermodynamic model have good consistency in characterizing the pore distribution of tight sandstone. Multi-fractal results show that the lower pore volume in the selected samples controls the heterogeneity of pore distribution in the overall sample.
- (4)
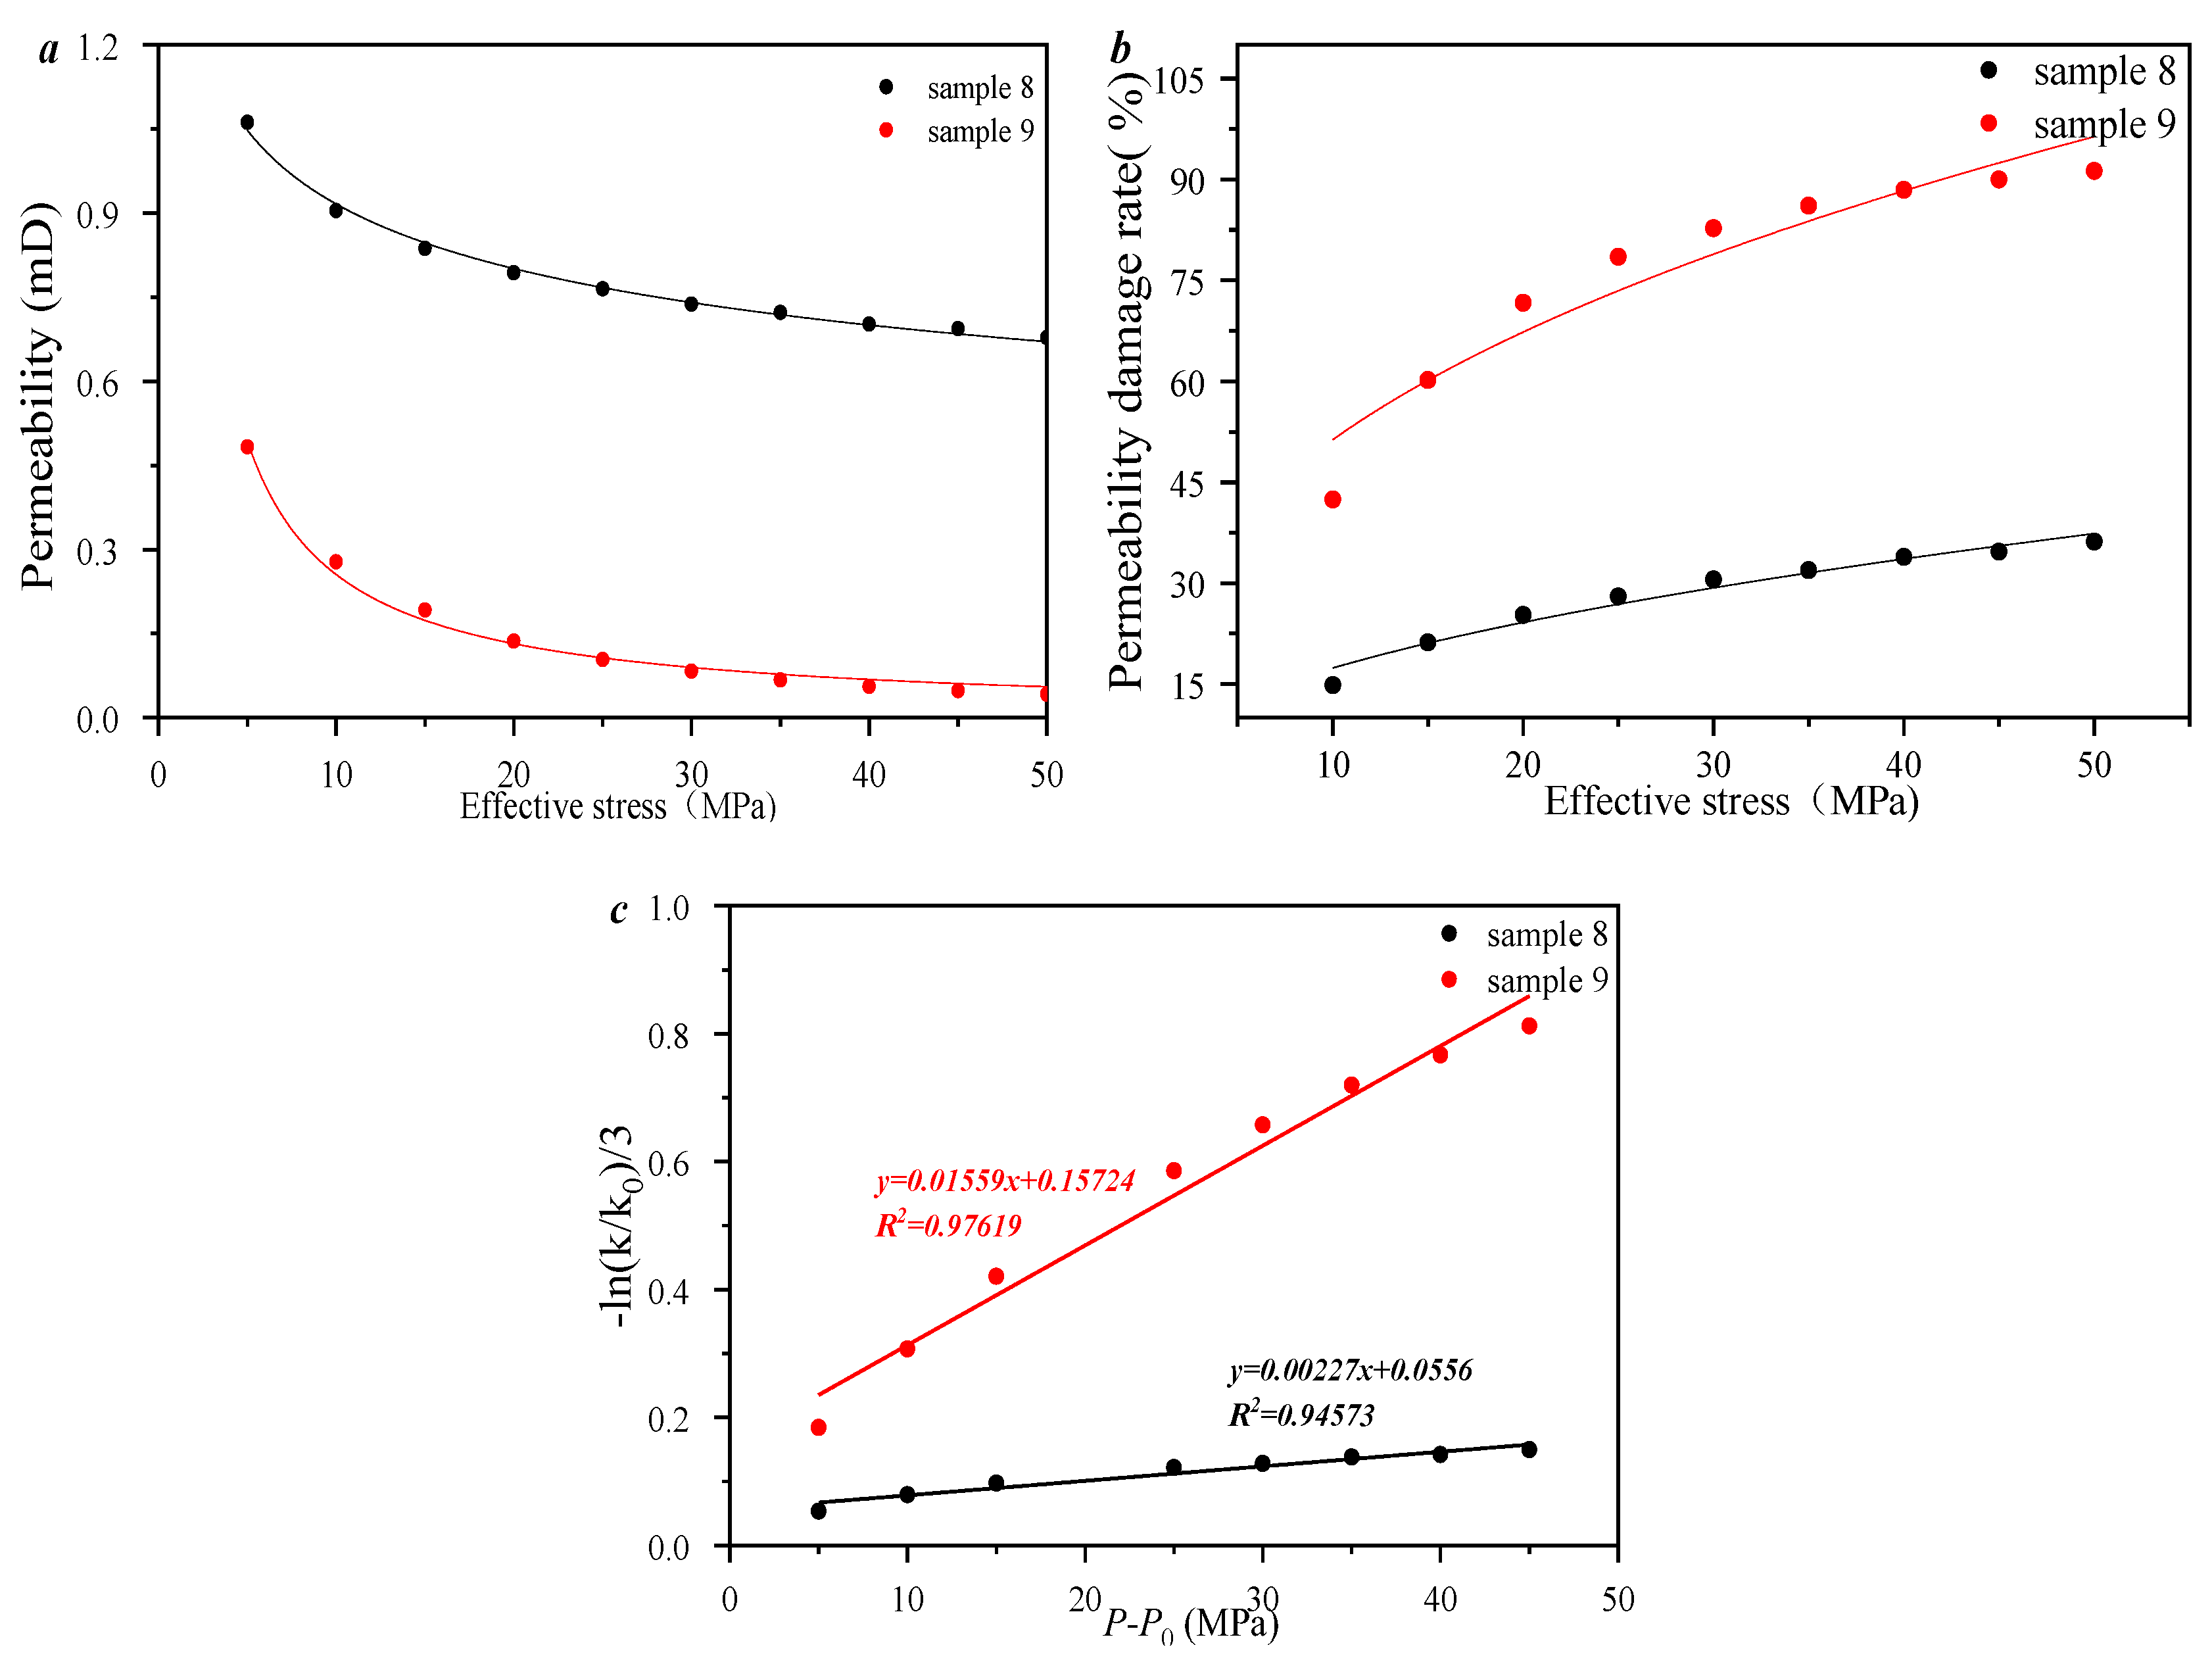
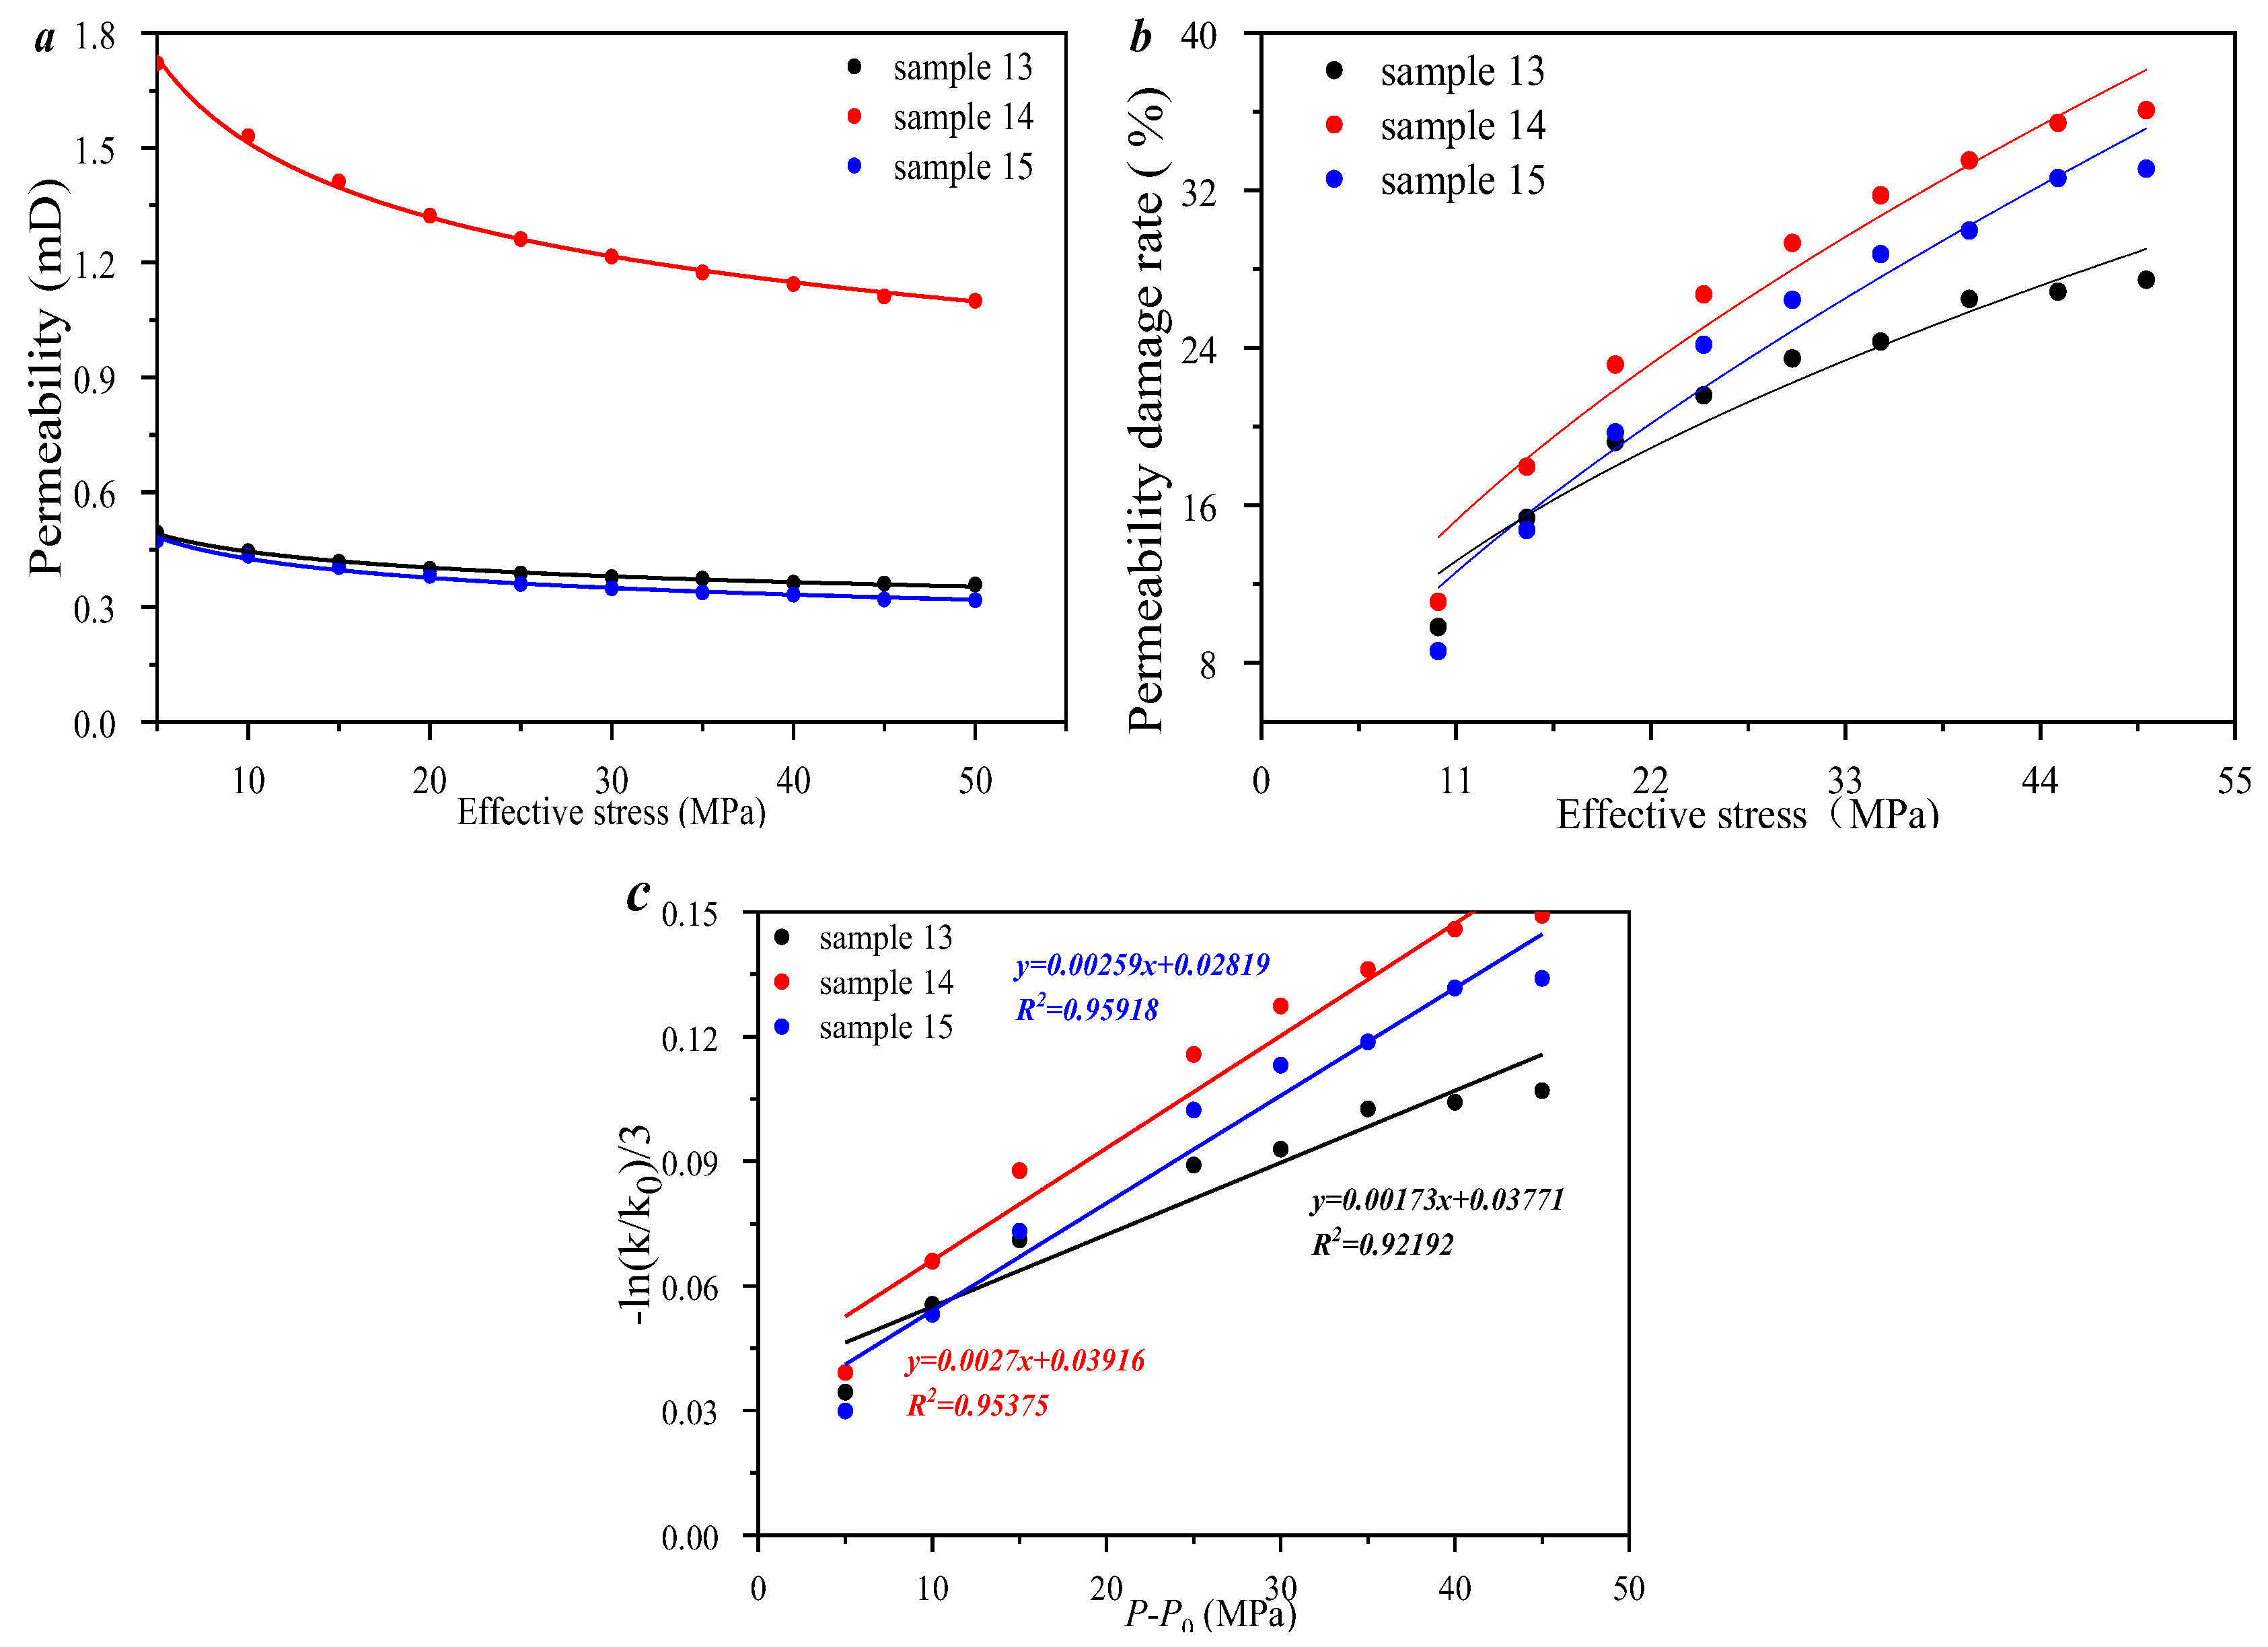
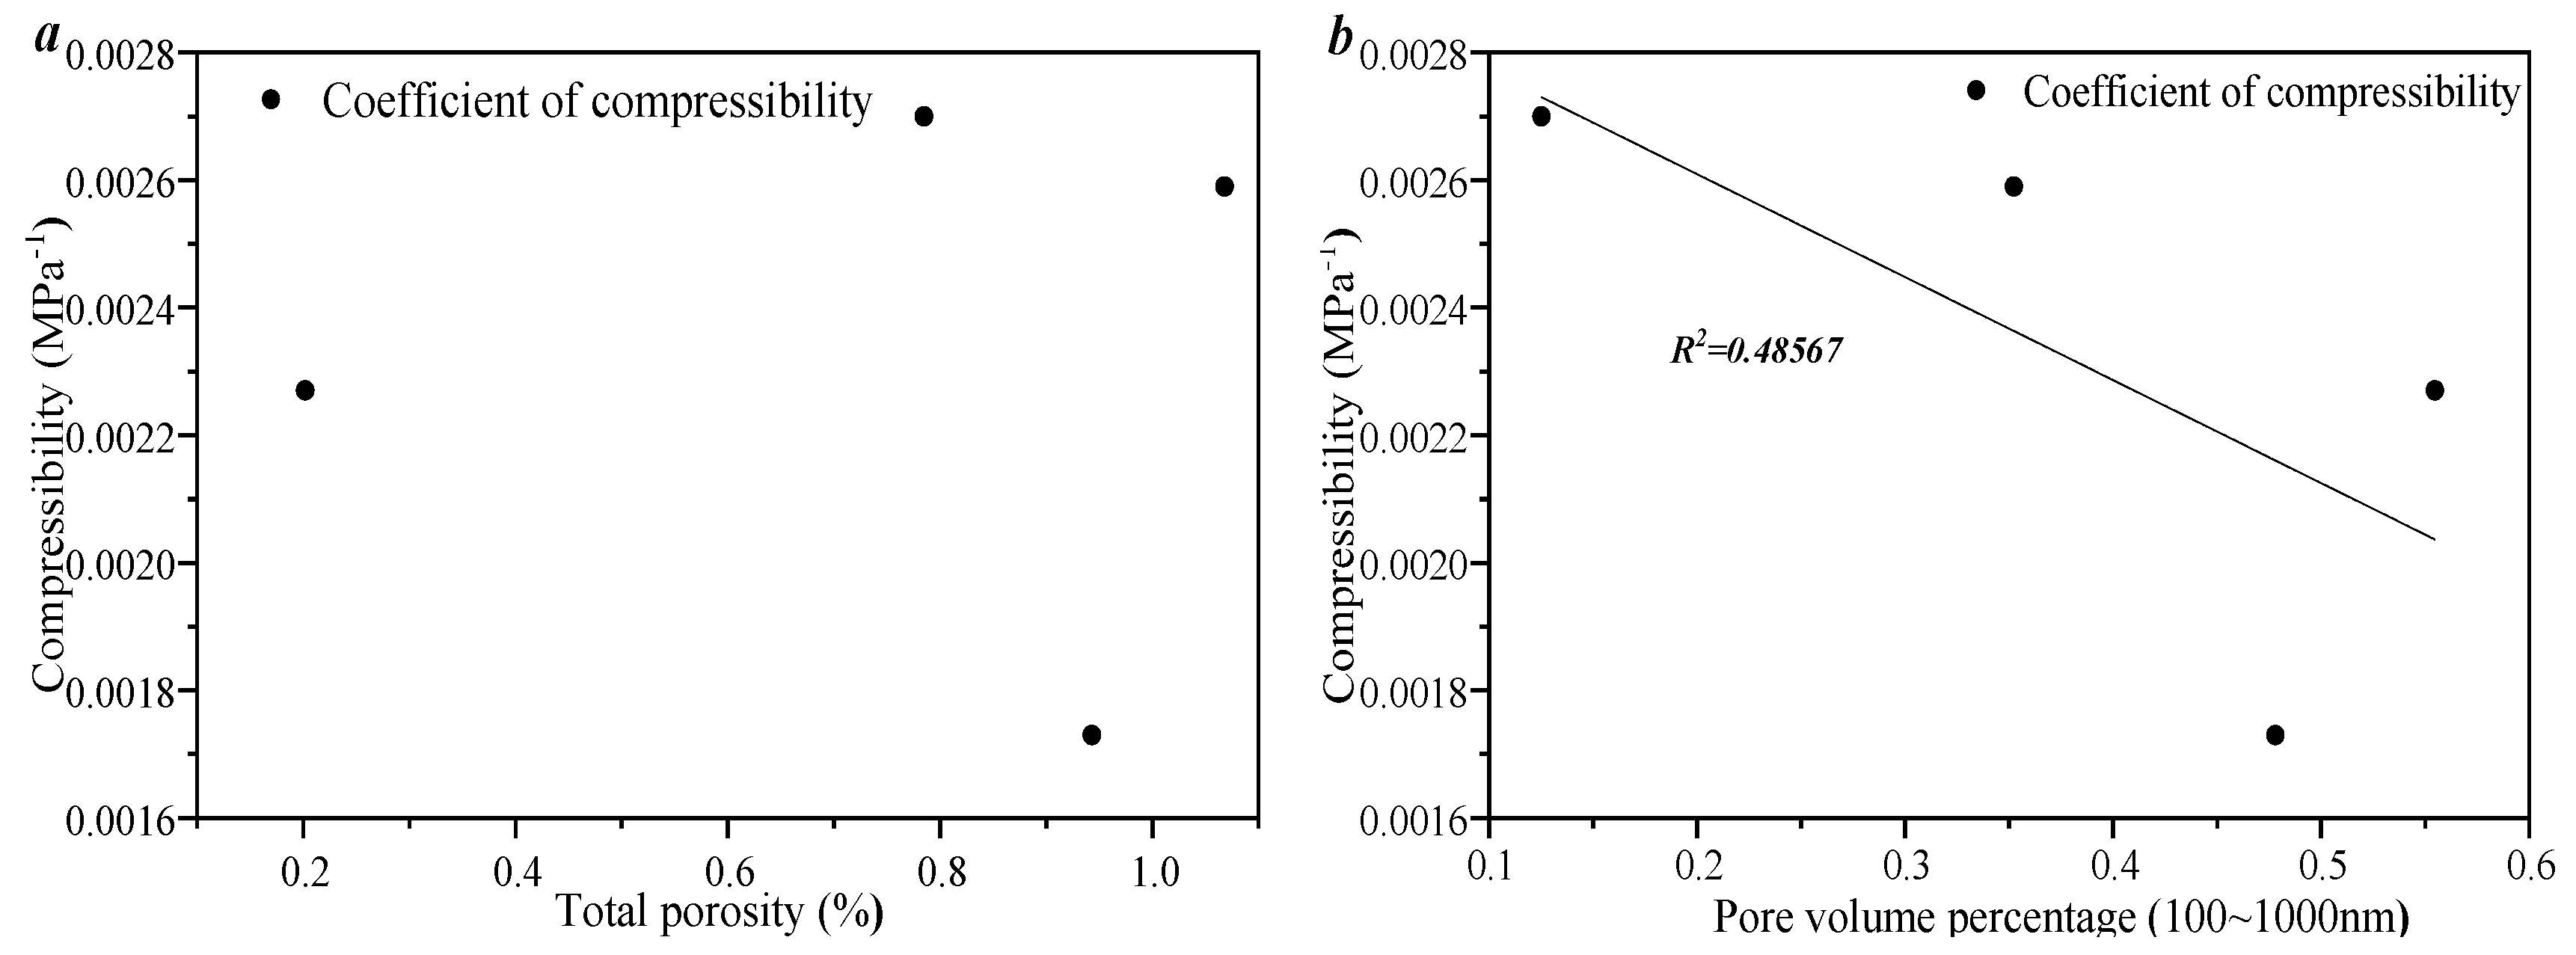
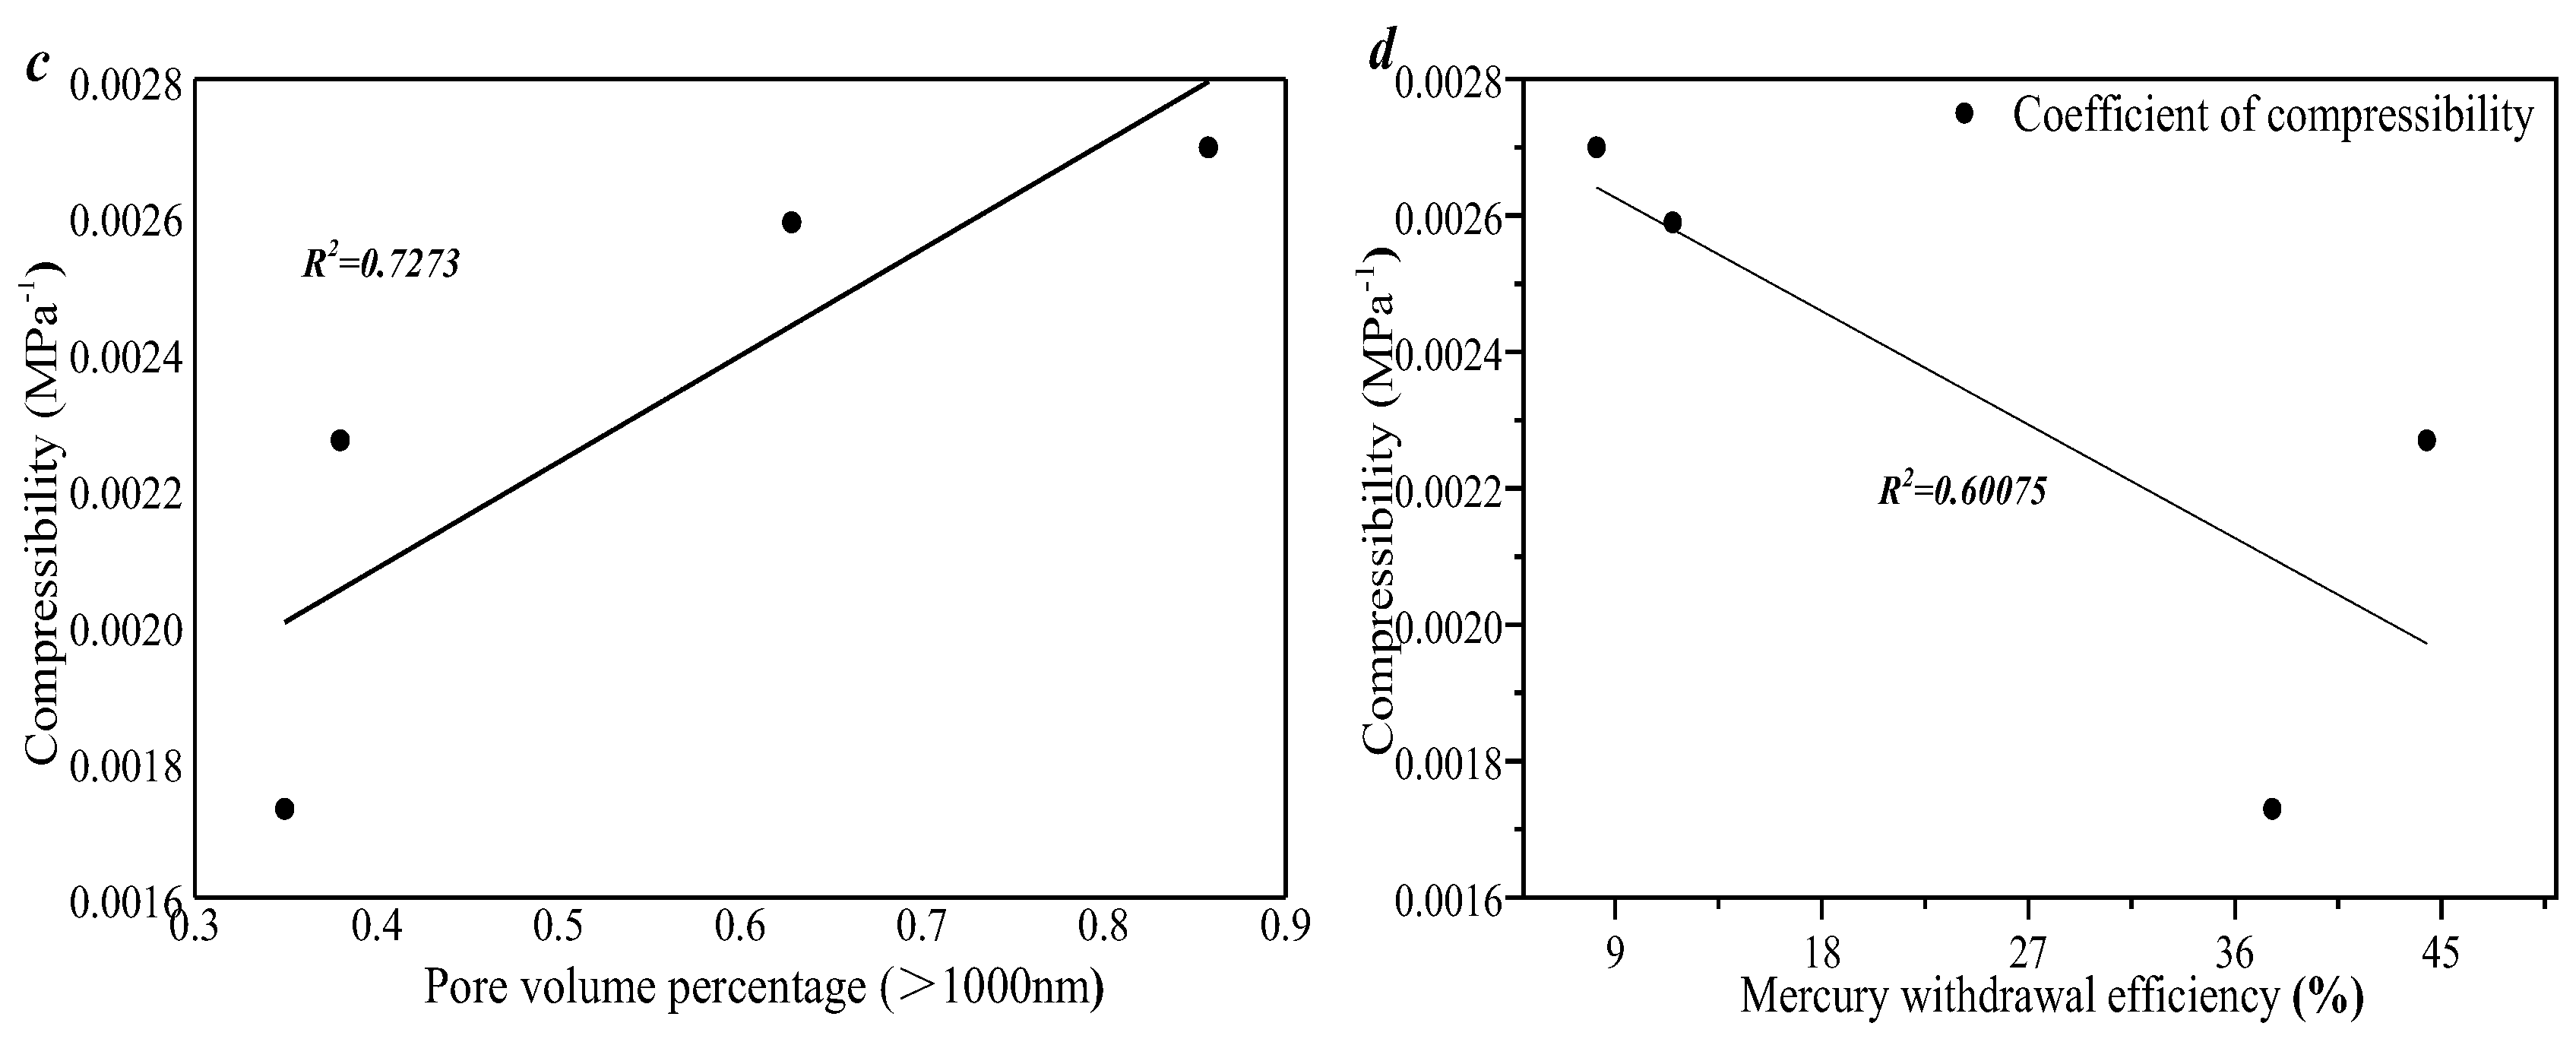
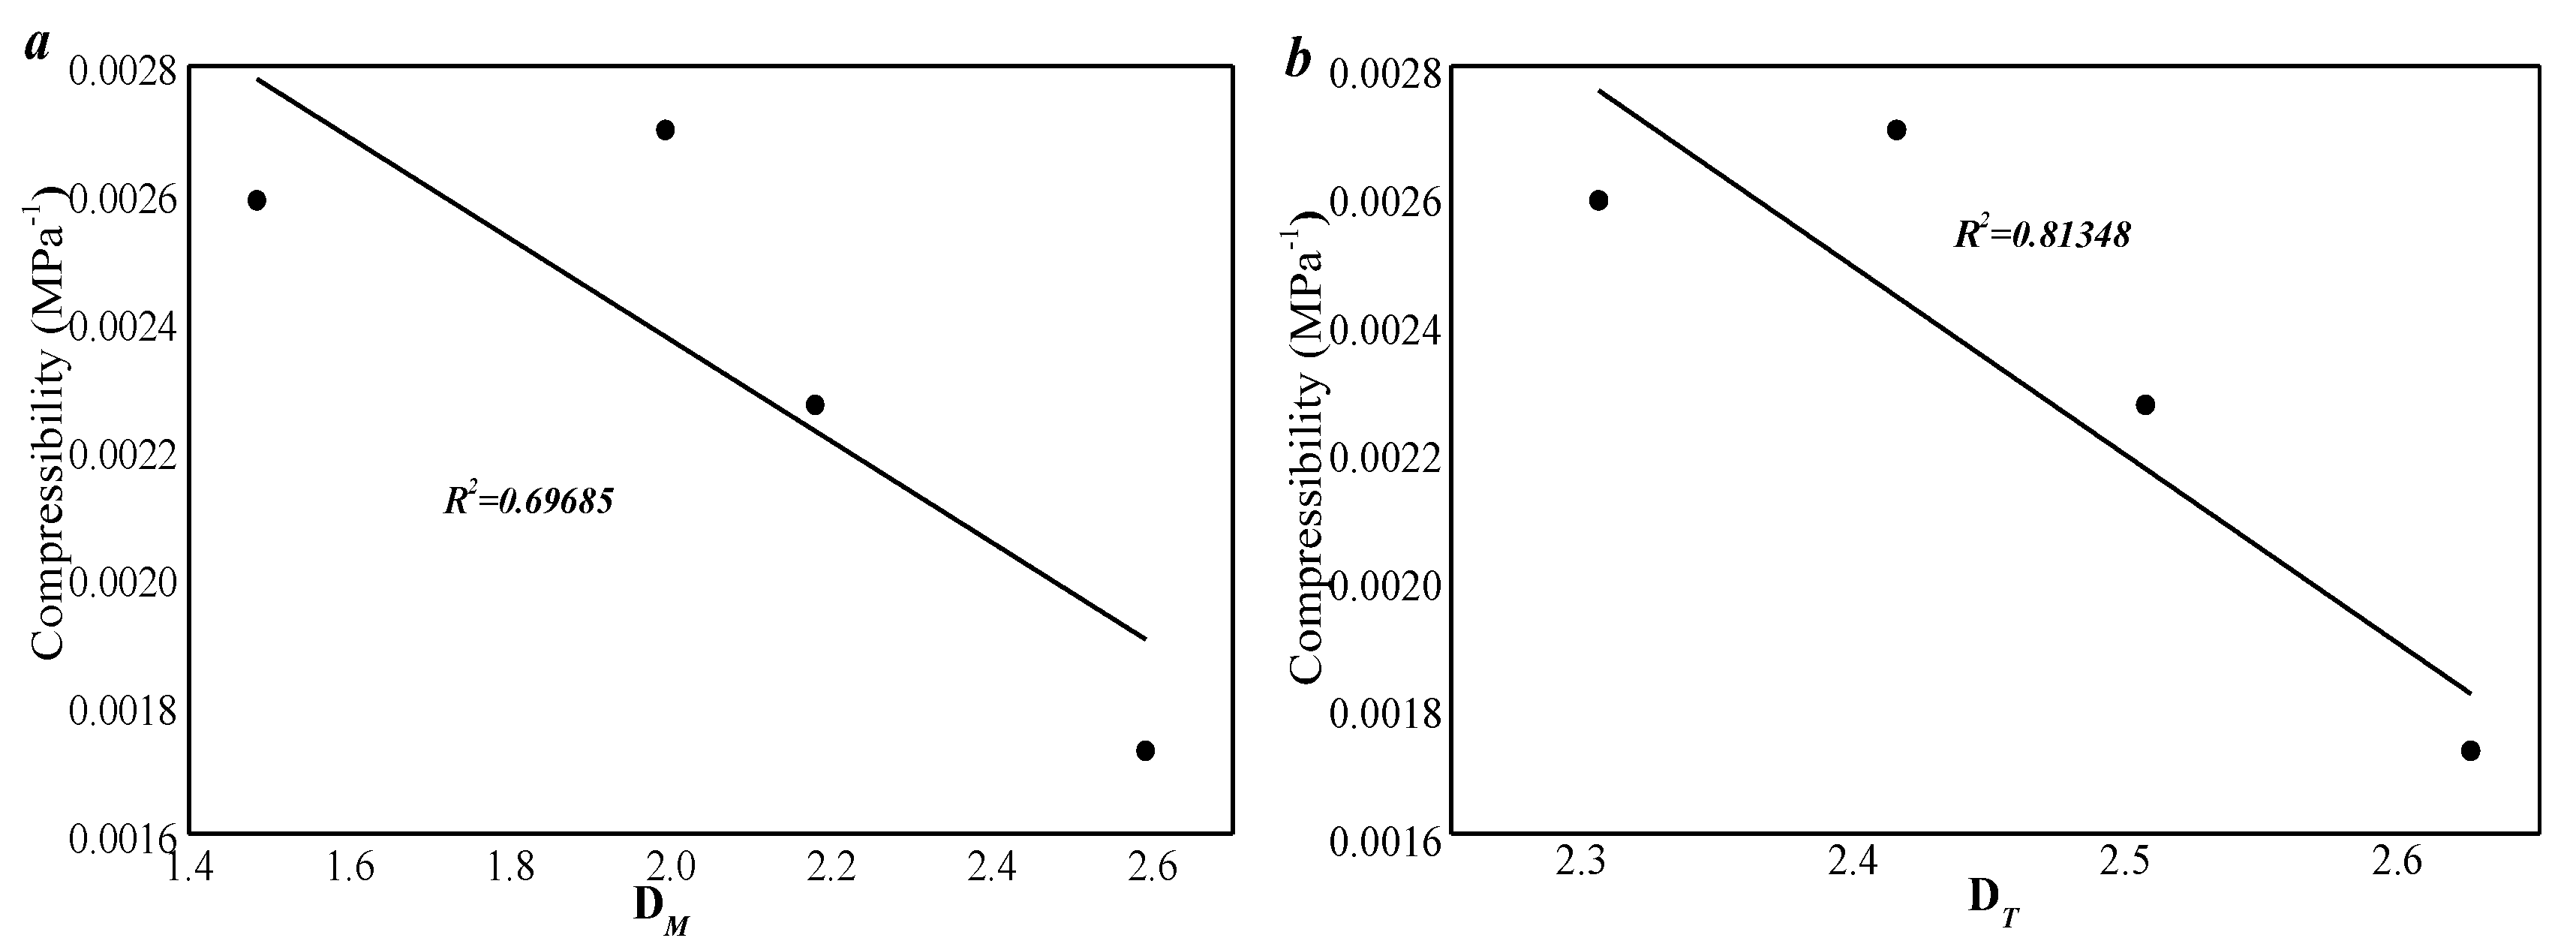
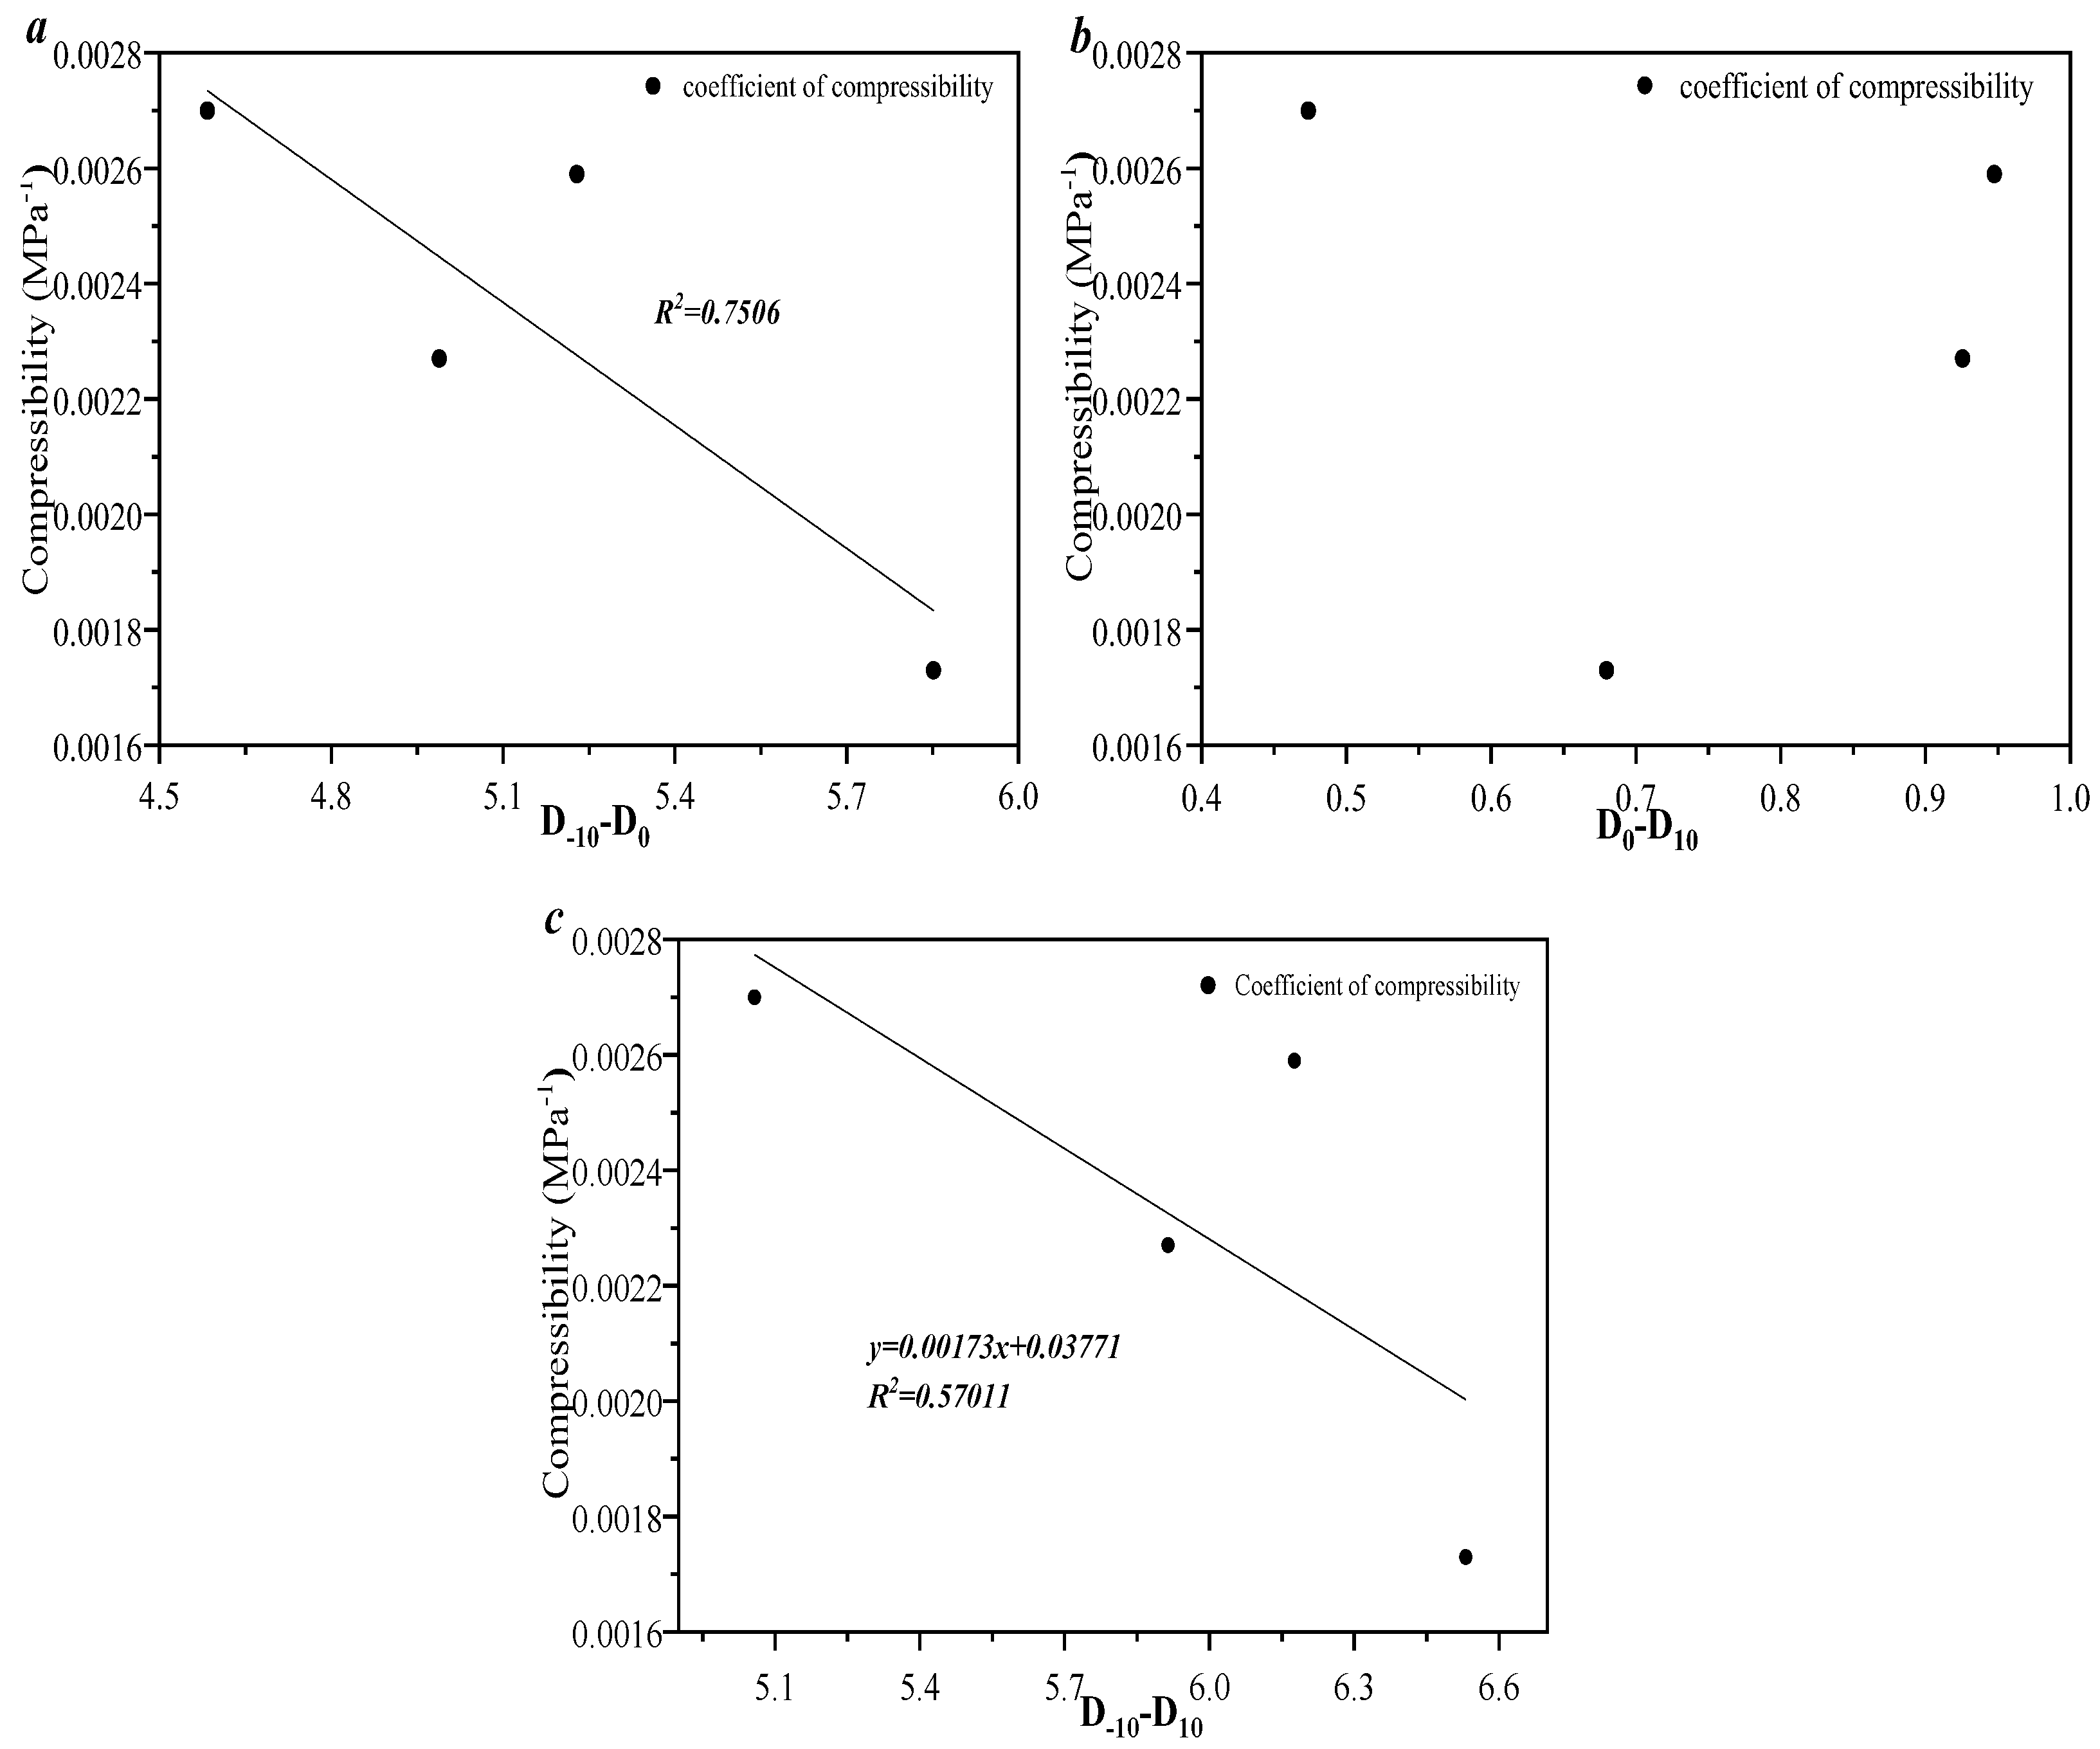
- As the effective stress increases, the permeability damage rate gradually increases in a power exponential equation. The correlation between porosity and compressibility is weaker, which indicates that only a portion of the pore volume in the sample provides compression space. As the pore volume of 100~1000 nm increases, the compressibility decreases linearly, which indicates that pore volumes larger than 1000 nm provide compression space for all the selected samples.
Author Contributions
Funding
Data Availability Statement
Conflicts of Interest
References
- Tang, W.; Li, D.; Zhang, X.; Guo, F.; Cui, C.; Pan, M.; Zhang, D.; Li, J.; Xu, X. A modified freezing-casted conductive hierarchical porous polymer composite electrode for electrochemical extraction of uranium from water. Sep. Purif. Technol. 2023, 319, 124087. [Google Scholar] [CrossRef]
- Zhang, X.; Cai, Y.Q.; Zhao, X.Q.; He, F. Metallogenic Conditions and of Prospecting Indications of Sandstone-type Uranium Deposits in the Western Margin of Qaidam Basin. Uranium Geol. 2025, 1–21. (In Chinese) [Google Scholar]
- Liu, H.; Fu, T.; Mao, Y. Metal Organic Framework-Based Materials for Adsorption and Detection of Uranium (VI) from Aqueous Solution. ACS Omega 2022, 7, 14430–14456. [Google Scholar] [CrossRef] [PubMed]
- Chen, Z.; Wang, J.; Hao, M.; Xie, Y.; Liu, X.; Yang, H.; Waterhouse, G.I.N.; Wang, X.; Ma, S. Tuning excited state electronic structure and charge transport in covalent organic frameworks for enhanced photocatalytic performance. Nat. Commun. 2023, 14, 1106. [Google Scholar] [CrossRef] [PubMed]
- Ahmadi, S.; Khormali, A. Development of an RSM-based predictive model for evaluation of corrosion efficiency of ATMP in one molar HCl for carbon steel samples. Pet. Sci. Technol. 2023, 4537–4555. [Google Scholar] [CrossRef]
- Zheng, L.; Nico, P.; Spycher, N.; Domen, J.; Credoz, A. Potential impacts of CO2 leakage on groundwater quality of overlying aquifer at geological carbon sequestration sites: A review and a proposed assessment procedure. Greenh. Gases-Sci. Technol. 2021, 11, 1134–1166. [Google Scholar] [CrossRef]
- Cheng, Y.; Luo, X.; Hou, B.; Zhang, S.; Tan, C.; Xiao, H. Pore Structure and Permeability Characterization of Tight Sandstone Reservoirs: From a Multiscale Perspective. Energy Fuels 2023, 37, 9185–9196. [Google Scholar] [CrossRef]
- Zhu, N.; Yao, S.; Zhang, Y.; Ning, S.; Jia, B.; Zhou, Y.; Zhang, W. Influence of coupled dissolution-precipitation processes on the pore structure, characteristics, and evolution of tight sandstone: A case study in the upper Paleozoic reservoir of Bohai Bay Basin, eastern China. J. Asian Earth Sci. 2024, 262, 105998. [Google Scholar] [CrossRef]
- Zhao, N.; Xu, T.; Wang, K.; Tian, H.; Wang, F. Experimental study of physical-chemical properties modification of coal after CO2 sequestration in deep unmineable coal seams. Greenh. Gases Sci. Technol. 2018, 8, 510–528. [Google Scholar] [CrossRef]
- Civitelli, M.; Ravidą, D.C.G.; Borrelli, M.; Criniti, S.; Falsetta, E. Diagenesis and petrophysics of Miocene sandstones within southern Apennines foreland, Italy. Mar. Pet. Geol. 2023, 155, 106411. [Google Scholar] [CrossRef]
- Shuai, S.; Jinxian, H.; Xiaoli, Z.; Ziqi, Y.; Jian, W.; Tiantian, Y.; Wei, W. Pore structure evolution of tar-rich coal with temperature-pressure controlled simulation experiments. Fuel 2023, 354, 129298. [Google Scholar] [CrossRef]
- Yang, K.; Wang, F.; Zhao, J. Experimental study of surfactant-enhanced spontaneous imbibition in fractured tight sandstone reservoirs: The effect of fracture distribution. Pet. Sci. 2023, 20, 370–381. [Google Scholar] [CrossRef]
- Yang, Y.; Xiao, W.; Zheng, L.; Lei, Q.; Qin, C.; He, Y.; Liu, S.; Li, M.; Li, Y.; Zhao, J.; et al. Pore throat structure heterogeneity and its effect on gas-phase seepage capacity in tight sandstone reservoirs: A case study from the Triassic Yanchang Formation, Ordos Basin. Pet. Sci. 2023, 20, 2892–2907. [Google Scholar] [CrossRef]
- Lai, J.; Wang, G.; Wang, Z.; Chen, J.; Pang, X.; Wang, S.; Zhou, Z.; He, Z.; Qin, Z.; Fan, X. A review on pore structure characterization in tight sandstones. Earth-Sci. Rev. 2018, 177, 436–457. [Google Scholar] [CrossRef]
- Lai, J.; Wang, G. Fractal analysis of tight gas sandstones using high-pressure mercury intrusion techniques. J. Nat. Gas Sci. Eng. 2015, 24, 185–196. [Google Scholar] [CrossRef]
- Feng, S.; Xie, R.; Radwan, A.E.; Wang, Y.; Zhou, W.; Cai, W. Accurate determination of water saturation in tight sandstone gas reservoirs based on optimized Gaussian process regression. Mar. Pet. Geol. 2023, 150, 106149. [Google Scholar] [CrossRef]
- Martyushev, D.A.; Davoodi, S.; Kadkhodaie, A.; Riazi, M.; Kazemzadeh, Y.; Ma, T. Multiscale and diverse spatial heterogeneity analysis of void structures in reef carbonate reservoirs. Geoenergy Sci. Eng. 2024, 233, 212569. [Google Scholar] [CrossRef]
- Wang, W.; Li, X.; Wei, Z.; Xin, Y.; Xiao, R.; Yang, H.; Chen, X. Effect of CO2–Brine–Rock Interactions on the Pore Structure of the Tight Sandstone During CO2 Flooding: A Case Study of Chang 7 Member of the Triassic Yanchang Formation in the Ordos Basin, China. ACS Omega 2023, 8, 3998–4009. [Google Scholar] [CrossRef]
- Zang, Q.; Liu, C.; Awan, R.S.; Yang, X.; Li, G.; Wu, Y.; Lu, Z.; Feng, D. Occurrence characteristics of the movable fluid in heterogeneous sandstone reservoir based on fractal analysis of NMR data: A case study of the Chang 7 Member of Ansai Block, Ordos Basin, China. J. Pet. Sci. Eng. 2022, 21, 110499. [Google Scholar] [CrossRef]
- Yao, P.; Zhang, J.; Lv, D.; Vandeginste, V.; Chang, X.; Zhang, X.; Wang, D.; Han, S.; Liu, Y. Effect of water occurrence in coal reservoirs on the production capacity of coalbed methane by using NMR simulation technology and production capacity simulation. Geoenergy Sci. Eng. 2024, 243, 213353. [Google Scholar] [CrossRef]
- Guo, X.; Huang, Z.; Zhao, L.; Han, W.; Ding, C.; Sun, X.; Yan, R.; Zhang, T.; Yang, X.; Wang, R. Pore structure and multi-fractal analysis of tight sandstone using MIP, NMR and NMRC methods: A case study from the Kuqa depression, China. J. Pet. Sci. Eng. 2019, 178, 544–558. [Google Scholar] [CrossRef]
- Wang, J.; Wu, S.; Li, Q.; Guo, Q. An investigation into pore structure fractal characteristics in tight oil reservoirs: A case study of the Triassic tight sandstone with ultra-low permeability in the Ordos Basin, China. Arab. J. Geosci. 2020, 13, 961. [Google Scholar] [CrossRef]
- Xu, S.; Yang, Z.; Wu, S.; Wang, L.; Wei, W.; Yang, F.; Cai, J. Fractal Analysis of Pore Structure Differences Between Shale and Sandstone Based on the Nitrogen Adsorption Method. Nat. Resour. Res. 2022, 31, 1759–1773. [Google Scholar] [CrossRef]
- Li, J.; Zhou, K.; Liu, W.; Deng, H. NMR research on deterioration characteristics of microscopic structure of sandstones in freeze-thaw cycles. Trans. Nonferrous Met. Soc. China 2016, 26, 2997–3003. [Google Scholar] [CrossRef]
- Zeng, S.; Zhang, Y.; Sun, B.; Cai, Q.; Zeng, B.; Shen, Y.; Wen, X. Pore structure characterization and permeability prediction of uranium-bearing sandstone based on digital core. Nucl. Eng. Technol. 2024, 56, 4512–4521. [Google Scholar] [CrossRef]
- Li, P.; Zheng, M.; Bi, H.; Wu, S.; Wang, X. Pore throat structure and fractal characteristics of tight oil sandstone: A case study in the Ordos Basin, China. J. Pet. Sci. Eng. 2017, 149, 665–674. [Google Scholar] [CrossRef]
- Ge, X.; Fan, Y.; Li, J.; Aleem Zahid, M. Pore structure characterization and classification using multifractal theory—An application in Santanghu basin of western China. J. Pet. Sci. Eng. 2015, 127, 297–304. [Google Scholar] [CrossRef]
- SY/T 6385-2016; Method for Determination of Rock Porosity and Permeability Under Overburden Pressure. Standards Press of China: Beijing, China, 2016.
- Zuo, M.; Chen, H.; Liu, X.; Liu, H.; Wu, Y.; Qi, X. Fractal model of spontaneous imbibition in low-permeability reservoirs coupled with heterogeneity of pore seepage channels and threshold pressure. Pet. Sci. 2024, 21, 1002–1017. [Google Scholar] [CrossRef]
- Seidle, J.P.; Jeansonne, M.W.; Erickson, D.J. Application of Matchstick Geometry to Stress Dependent Permeability in Coals. In Proceedings of the SPE Rocky Mountain Regional Meeting, Casper, WY, USA, 18–21 May 1992. [Google Scholar]


| Sample Number | Pore Volume (cm3·g−1) | Porosity (%) | Permeability (mD) | Mercury Withdrawal Efficiency (%) | Mineral Content | |||
|---|---|---|---|---|---|---|---|---|
| Quartz | Feldspar | Calcite | Clay Mineral | |||||
| 1 | 0.191 | 4.6 | 0.0315 | 43.30 | 8 | 91 | ||
| 2 | 0.469 | 4.1 | 0.0487 | 38.53 | 33 | 63 | 2 | |
| 3 | 0.253 | 2.1 | 0.0705 | 37.78 | 13 | 79 | 1 | |
| 4 | 0.323 | 2.6 | 0.274 | 32.27 | 3 | 90 | ||
| 5 | 0.391 | 3.1 | 0.0725 | 42.50 | 20 | 70 | 2 | |
| 6 | 0.542 | 4.4 | 0.225 | 37.47 | 26 | 73 | ||
| 7 | 0.202 | 2.1 | 0.330 | 44.37 | 6 | 87 | ||
| 8 | 0.844 | 6.8 | 0.923 | 31.12 | 7 | 90 | 2 | |
| 9 | 1.126 | 8.8 | 0.627 | 37.76 | 10 | 81 | ||
| 10 | 1.02 | 8.3 | 0.300 | 37.6350 | 5 | 94 | ||
| 11 | 0.899 | 7.3 | 0.155 | 39.0789 | 4 | 94 | ||
| 12 | 0.974 | 7.9 | 1.96 | 37.7153 | 11 | 68 | ||
| 13 | 0.943 | 7.6 | 0.786 | 37.6354 | 8 | 75 | 1 | |
| 14 | 1.068 | 11.6 | 0.406 | 11.5145 | 1 | 98 | ||
| 15 | 0.785 | 9.0 | 1.81 | 8.19569 | 9 | 87 | 1 | |
| 16 | 0.918 | 8.2 | 0.762 | 16.4799 | 31 | 61 | ||
| 17 | 1.057 | 8.6 | 1.88 | 22.6168 | 7 | 45 | 1 | |
| 18 | 1.44 | 12 | 5.56 | 18.9480 | 10 | 83 | 3 | |
| 19 | 0.952 | 7.8 | 0.387 | 21.1926 | 10 | 79 | ||
| 20 | 1.045 | 8.1 | 3.02 | 18.1180 | 42 | 31 | 24 | |
Disclaimer/Publisher’s Note: The statements, opinions and data contained in all publications are solely those of the individual author(s) and contributor(s) and not of MDPI and/or the editor(s). MDPI and/or the editor(s) disclaim responsibility for any injury to people or property resulting from any ideas, methods, instructions or products referred to in the content. |
© 2025 by the authors. Licensee MDPI, Basel, Switzerland. This article is an open access article distributed under the terms and conditions of the Creative Commons Attribution (CC BY) license (https://creativecommons.org/licenses/by/4.0/).
Share and Cite
Kang, Q.; Jiang, Y.; Li, J.; Qin, Z.; Zhang, W.; Guo, Y.; Zhang, J. Heterogeneity of Pore and Fracture Structure in Tight Sandstone Using Different Fractal Models and Its Influence on Porosity–Permeability Variation. Processes 2025, 13, 679. https://doi.org/10.3390/pr13030679
Kang Q, Jiang Y, Li J, Qin Z, Zhang W, Guo Y, Zhang J. Heterogeneity of Pore and Fracture Structure in Tight Sandstone Using Different Fractal Models and Its Influence on Porosity–Permeability Variation. Processes. 2025; 13(3):679. https://doi.org/10.3390/pr13030679
Chicago/Turabian StyleKang, Qinrong, Yongdong Jiang, Jiahui Li, Zhengyuan Qin, Weizhong Zhang, Yuqiang Guo, and Junjian Zhang. 2025. "Heterogeneity of Pore and Fracture Structure in Tight Sandstone Using Different Fractal Models and Its Influence on Porosity–Permeability Variation" Processes 13, no. 3: 679. https://doi.org/10.3390/pr13030679
APA StyleKang, Q., Jiang, Y., Li, J., Qin, Z., Zhang, W., Guo, Y., & Zhang, J. (2025). Heterogeneity of Pore and Fracture Structure in Tight Sandstone Using Different Fractal Models and Its Influence on Porosity–Permeability Variation. Processes, 13(3), 679. https://doi.org/10.3390/pr13030679