Abstract
Ebullated bed vacuum residue hydrocracking is a well-established technology providing a high conversion level of low-value residue fractions in high-value light fuels. The main challenge in this technology when processing vacuum residues derived from different crude oils is the sediment formation rate that leads to equipment fouling and cycle length shortening. With the severity enhancement, the asphaltenes become more aromatic and less soluble which leads to sediment formation when the difference between solubility parameters of asphaltenes and maltenes goes beyond a threshold value. Although theoretical models have been developed to predict asphaltene precipitation, the great diversity of oils makes it impossible to embrace the full complexity of oil chemistry by any theoretical model making it impractical for using it in all applications. The evaluation of process data of a commercial ebullated bed vacuum residue hydrocracker, properties of different feeds, and product streams by intercriteria and regression analyses enabled us to decipher the reason for hydrocracked oil sediment content rising from 0.06 to 1.15 wt.%. The ICrA identified the presence of statistically meaningful relations between the single variables, while the regression analysis revealed the combination of variables having a statistically meaningful effect on sediment formation rate. In this study, vacuum residues derived from 16 crude oils have been hydrocracked as blends, which also contain fluid catalytic cracking heavy cycle oil and slurry oil (SLO), in a commercial H-Oil plant. It was found that the hydrocracked oil sediment content decreased exponentially with fluid catalytic cracking slurry oil augmentation. It was also established that it increased with the magnification of resin and asphaltene and the reduction in sulfur contents in the H-Oil feed.
1. Introduction
Ebullated hydrocracking technology is stated to process over 90% of the world’s vacuum residues that are hydrocracked [1]. It has proved to provide a high level of vacuum residue conversion and a cycle length of three years and more [2]. The cycle length has been shown to have a greater impact on refinery profitability than the conversion level of vacuum residue [2]. The main factor influencing cycle length is the sediment formation rate [3,4,5,6,7,8]. Asphaltenes are believed to be the main factor contributing to sediment formation in the residue hydroprocessing [9,10,11]. Increasing the residue hydrocracking severity leads to decreasing the asphaltene H/C atomic ratio, a result of cracking of attached aliphatic moieties [9]. Thus, the asphaltene solubility parameter enhances with severity augmentation making the asphaltenes less soluble [9,12]. When the difference between solubility parameters of asphaltenes and the surrounding oil becomes higher than 3 MPa0.5, precipitation of asphaltenes occurs [13]. In order to avoid the detrimental effect of asphaltenes on sediment formation residue, deasphaltization has been applied in both academic research [14,15,16,17,18,19] and engineering practice [20,21]. Decreasing asphaltene content by deasphaltization magnifies hydrogenation (density reduction) and impurity removal [22]. The commercial application of deasphaltization of 50% of vacuum residue feeding an ebullated bed hydrocracker enabled raising of the reactor temperature by 7 °C, and conversion enhancement by 15 wt.% [21].
It has been reported that the sediment formation rate depends on the behavior of asphaltenes, which are contained in the residue feed [23], on the liquid hourly space velocity (LHSV; the lower the LHSV, the lower sediment formation rate is) [24], and on the reaction characteristics [25]. The increase in reaction temperature to augment conversion is associated with an exponential enhancement of sediment formation rate, and consequently of fouling [26,27]. With increasing temperature, the proportion of thermal cracking increases faster than hydrogenation reactions, leading to higher aromatization of asphaltenes, making them more susceptible to precipitation [28]. Chabot and Shiflett [28] showed that the vacuum residues obtained from different crude oils can exhibit quite different propensity to sediment formation. Alonso et al. [29] differentiate the residue feeds to hydrocrack as such with high sediment formation propensity (originating from heavy and extra heavy crude oils), medium sediment formation (originating from intermediate crude oils), and low sediment formation (originating from light crude oils).
Different strategies have been used to mitigate asphaltene precipitation and consequently equipment fouling [26,27,30,31,32,33,34,35,36,37,38,39,40,41]. Kunas et al. [26] and Respini et al. [27] reported that the use of chemical additives could help retard the process of asphaltene precipitation and deposition. Marafi et al. [30] determined that during hydrocracking of Kuwait vacuum residue the addition of high aromatic fluid catalytic cracking (FCC) gas oils, light cycle oil (LCO) and heavy cycle oil (HCO), significantly decreased the sediment formation rate. Marques et al. [31], during hydrocracking of Urals vacuum residue, observed a gradual decrease in the rate of sediment formation when FCC slurry oil (SLO) was gradually added to the Urals vacuum residue in the range of 5–15 wt.%. García et al. [32] investigated the hydrocracking of a vacuum residue from a petroleum refinery in an H-Oil pilot plant by injecting FCC SLO in 5 to 10 vol.% into different points of the pilot unit. They observed that the addition of FCC SLO to the vacuum residue feedstock led to a marginal reduction in sediment formation. They explained this finding with saturation of the FCC SLO aromatics in the reaction section. The addition of FCC SLO in the product recovery section, however, led to sediment reduction of 40%. Tirado and Ancheyta [33] communicated that the addition of high aromatic FCC gas oils to heavy crude oil during hydrocracking led to the following effects: the LCO and the HCO decreased the sediment formation, while the SLO increased it. Silverman et al. [18] and Mountainland and Rueter [35] indicated that the addition of the nano-dispersed HCAT catalyst to the solid catalyst decreased sediment formation rate during vacuum residue hydrocracking even when recycle was used [35]. Lakhanpal et al. [36] and Robert et al. [37] demonstrated that catalysts specially designed to retard sediment formation can decrease fouling during vacuum residue hydrocracking. Marchal et al. [38] found that the promotion of the acidic and hydrogenation functions of a solid NiMo catalyst by its doping with F improved the conversion of the sediment precursors (asphaltenes). They hypothesized that the higher activity of the catalyst with respect to hydrogenation reactions leads to lower deposition of coke on the catalyst surface, which limits pore plugging and promotes intranuclear diffusion of large molecules into the pore. The development of solid catalysts with high average pore diameters improves the activity towards hydrodemetallation and hydrodeasphaltization that results in a lower sediment formation rate, but also in a lower hydrodesulfurization [39]. Improvement of activity of the catalyst in the first reactor and keeping the ratio ΔT first reactor/ΔT second reactor in a commercial hydrocracker not lower than 2.0 allowed significant reduction in fouling that enabled reactor temperature enhancement by 16 °C, and a conversion rise of 23 wt.% [40]. Despite the promising results of retardation of asphaltene sedimentation by using chemical additives reported in some research [26,27,41], experience has shown that the performance of the additives is specific to the different oils [2,42]. If an additive is effective with a certain oil, with another oil it could be completely inert, or even be a promoter of asphaltene sedimentation [2,42].
All the research conducted reveals the complex matter of the sedimentation phenomenon and the strategy to reduce the rate of sedimentation may differ for each case. For example, the addition of FCC SLO into the feedstock can decrease sedimentation during hydrocracking of Kuwait and Urals vacuum residues [30,31], may have no effect when a petroleum refinery vacuum residue is hydrocracked [32], or even increase the sedimentation when heavy crude oil is hydrocracked [33]. The effect of the vacuum residues coming from different crudes on sedimentation has been also well illustrated in [28,29,43]. Our own experience with the ebullated bed vacuum residue hydrocracking gained from 10 years’ exploitation of an H-Oil hydrocracker has shown that the vacuum residues from some Middle East crude oils retard sediment formation [2].
The investigation of precipitation of asphaltenes and deposit formation has shown that it is quite a complex phenomenon [44,45], which is affected by the polydispersity of the asphaltene fraction [46] and the distribution of solubility within this fraction [23,47]. Ovalles et al. [48] summarized that the low solubility parameter asphaltenes are more reactive than the higher solubility parameter analogs and that these two fractions are related to the sediment formation. This simplified two-term approximation asphaltene solubility model contrasts with the identified complex structures pertaining to the island and archipelago structural motifs [49,50,51,52]; it is still unknown how they would influence the asphaltene sedimentation. Gray et al. [53] reported that there is a positive correlation between the amount of archipelago structural motifs in asphaltenes and the yield of products with boiling points below 524 °C under hydrocracking. They also reported that coke yield increased with the proportion of island structures in asphaltenes, meaning that asphaltenes with an island structure are coke precursors. Therefore, one may suggest that the content of asphaltenes with an island structure should be the main contributor to asphaltene sedimentation. Chacón-Patinìo et al. [51] showed in their study that the dominance of island or archipelago structural motifs in asphaltene fraction is sample-dependent. The picture may become even more complicated when asphaltene fractions obtained from blends of vacuum residual oils in different ratios are hydrocracked. That is the case in this study, where blends of 16 vacuum residues originating from diverse crude oils were hydrocracked in a commercial H-Oil plant within 50 days. Laboratory experience has shown that each vacuum residue sample requires about a week for full testing. Moreover, the refining practice relies on routine oil laboratory tests in contrast to the sophisticated analytical techniques reported by Chacón-Patiño et al. [49,50,51]. The lack of data for full testing reports of both H-Oil feed and hydrocracked residual oils for the investigated 50 days of H-Oil operation, for the reasons explained above, did not allow us to perform a comprehensive thermodynamic analysis. This made the authors of this study look for the use of other tools. The successful application of intercriteria analysis in more than 40 studies [40] in the field of petroleum processing was the basis to employ it again in this investigation. In addition, a multiple regression analysis was employed as well for the purpose of model development of sedimentation.
Despite the theoretical research conducted in the field of asphaltene precipitation, the basis that controls the precipitate formation process in vacuum residue hydrocracking is not well defined. The asphaltenes and oils are so diverse [2,42] and the measurement of their properties is frequently related to such a high degree of uncertainty that as Wiehe [54] stated no concept is definite. The petroleum chemistry is so complex that none of the developed models can embrace the full diversity of oils. This can explain why the empirical approach has found such a wide application in practical petroleum engineering.
The widening of the crude oil basket starting from last year in the LUKOIL Neftohim Burgas refinery resulted in the processing of 23 various crude oils and two imported atmospheric residues. In November 2024, while processing blends of 15 crude oils, the sediment content in the hydrocracked atmospheric residue rose from 0.04 to 1.67 wt.%. In January 2025, while processing blends of 14 crude oils, a sudden increase in sediment content in the hydrocracked atmospheric residue from 0.05 to 1.15 wt.% was observed.
The aim of this research is to perform a root cause analysis of the high sedimentation observed in the commercial H-Oil plant by employment of ICrA and regression analysis.
2. Materials and Methods
Properties of vacuum residual oils being hydrocracked during this study along with the FCC SLO and FCC HCO injected in the FCC feed are summarized in Table 1.

Table 1.
Physical and chemical properties of vacuum residues being hydrocracked at the commercial H-Oil hydrocracker and FCC gas oils injected in the feed.
Density of the vacuum residual oils was measured indirectly from the densities of a series of solutions of vacuum residues in toluene at different concentrations as described in [2]. Solutions of vacuum residues in toluene at concentrations up to a vacuum residue mass fraction of 6% were prepared. Sulfur content of vacuum residues was measured by energy dispersive X-ray fluorescence spectrometry in accordance with the ASTM D 4294 method [55]. Asphaltene (C7, and C5) content was determined as heptane and pentane insolubles following the procedure described in the standard method ASTM D 6560 [56]. SARA composition of vacuum residue fractions was measured by the LNB refinery in-house method.
More details about the SARA procedure are presented in [57]. The Conradson carbon content of studied oils was measured in accordance with ASTM D 189 [58]. The nitrogen content of residual oils was determined following the ASTM D 5291 [59] requirements. Total sediment existent content (TSE) of the hydrocracked atmospheric residue (ATB) was measured by hot filtration in accordance with the method ISO 10307-1 [60]. Total sediment potential content of the partially blended fuel oil (PBFO) was determined using standard thermal procedures for ageing of residual fuel oil as detailed in the standard method ISO 10307-2 [61].
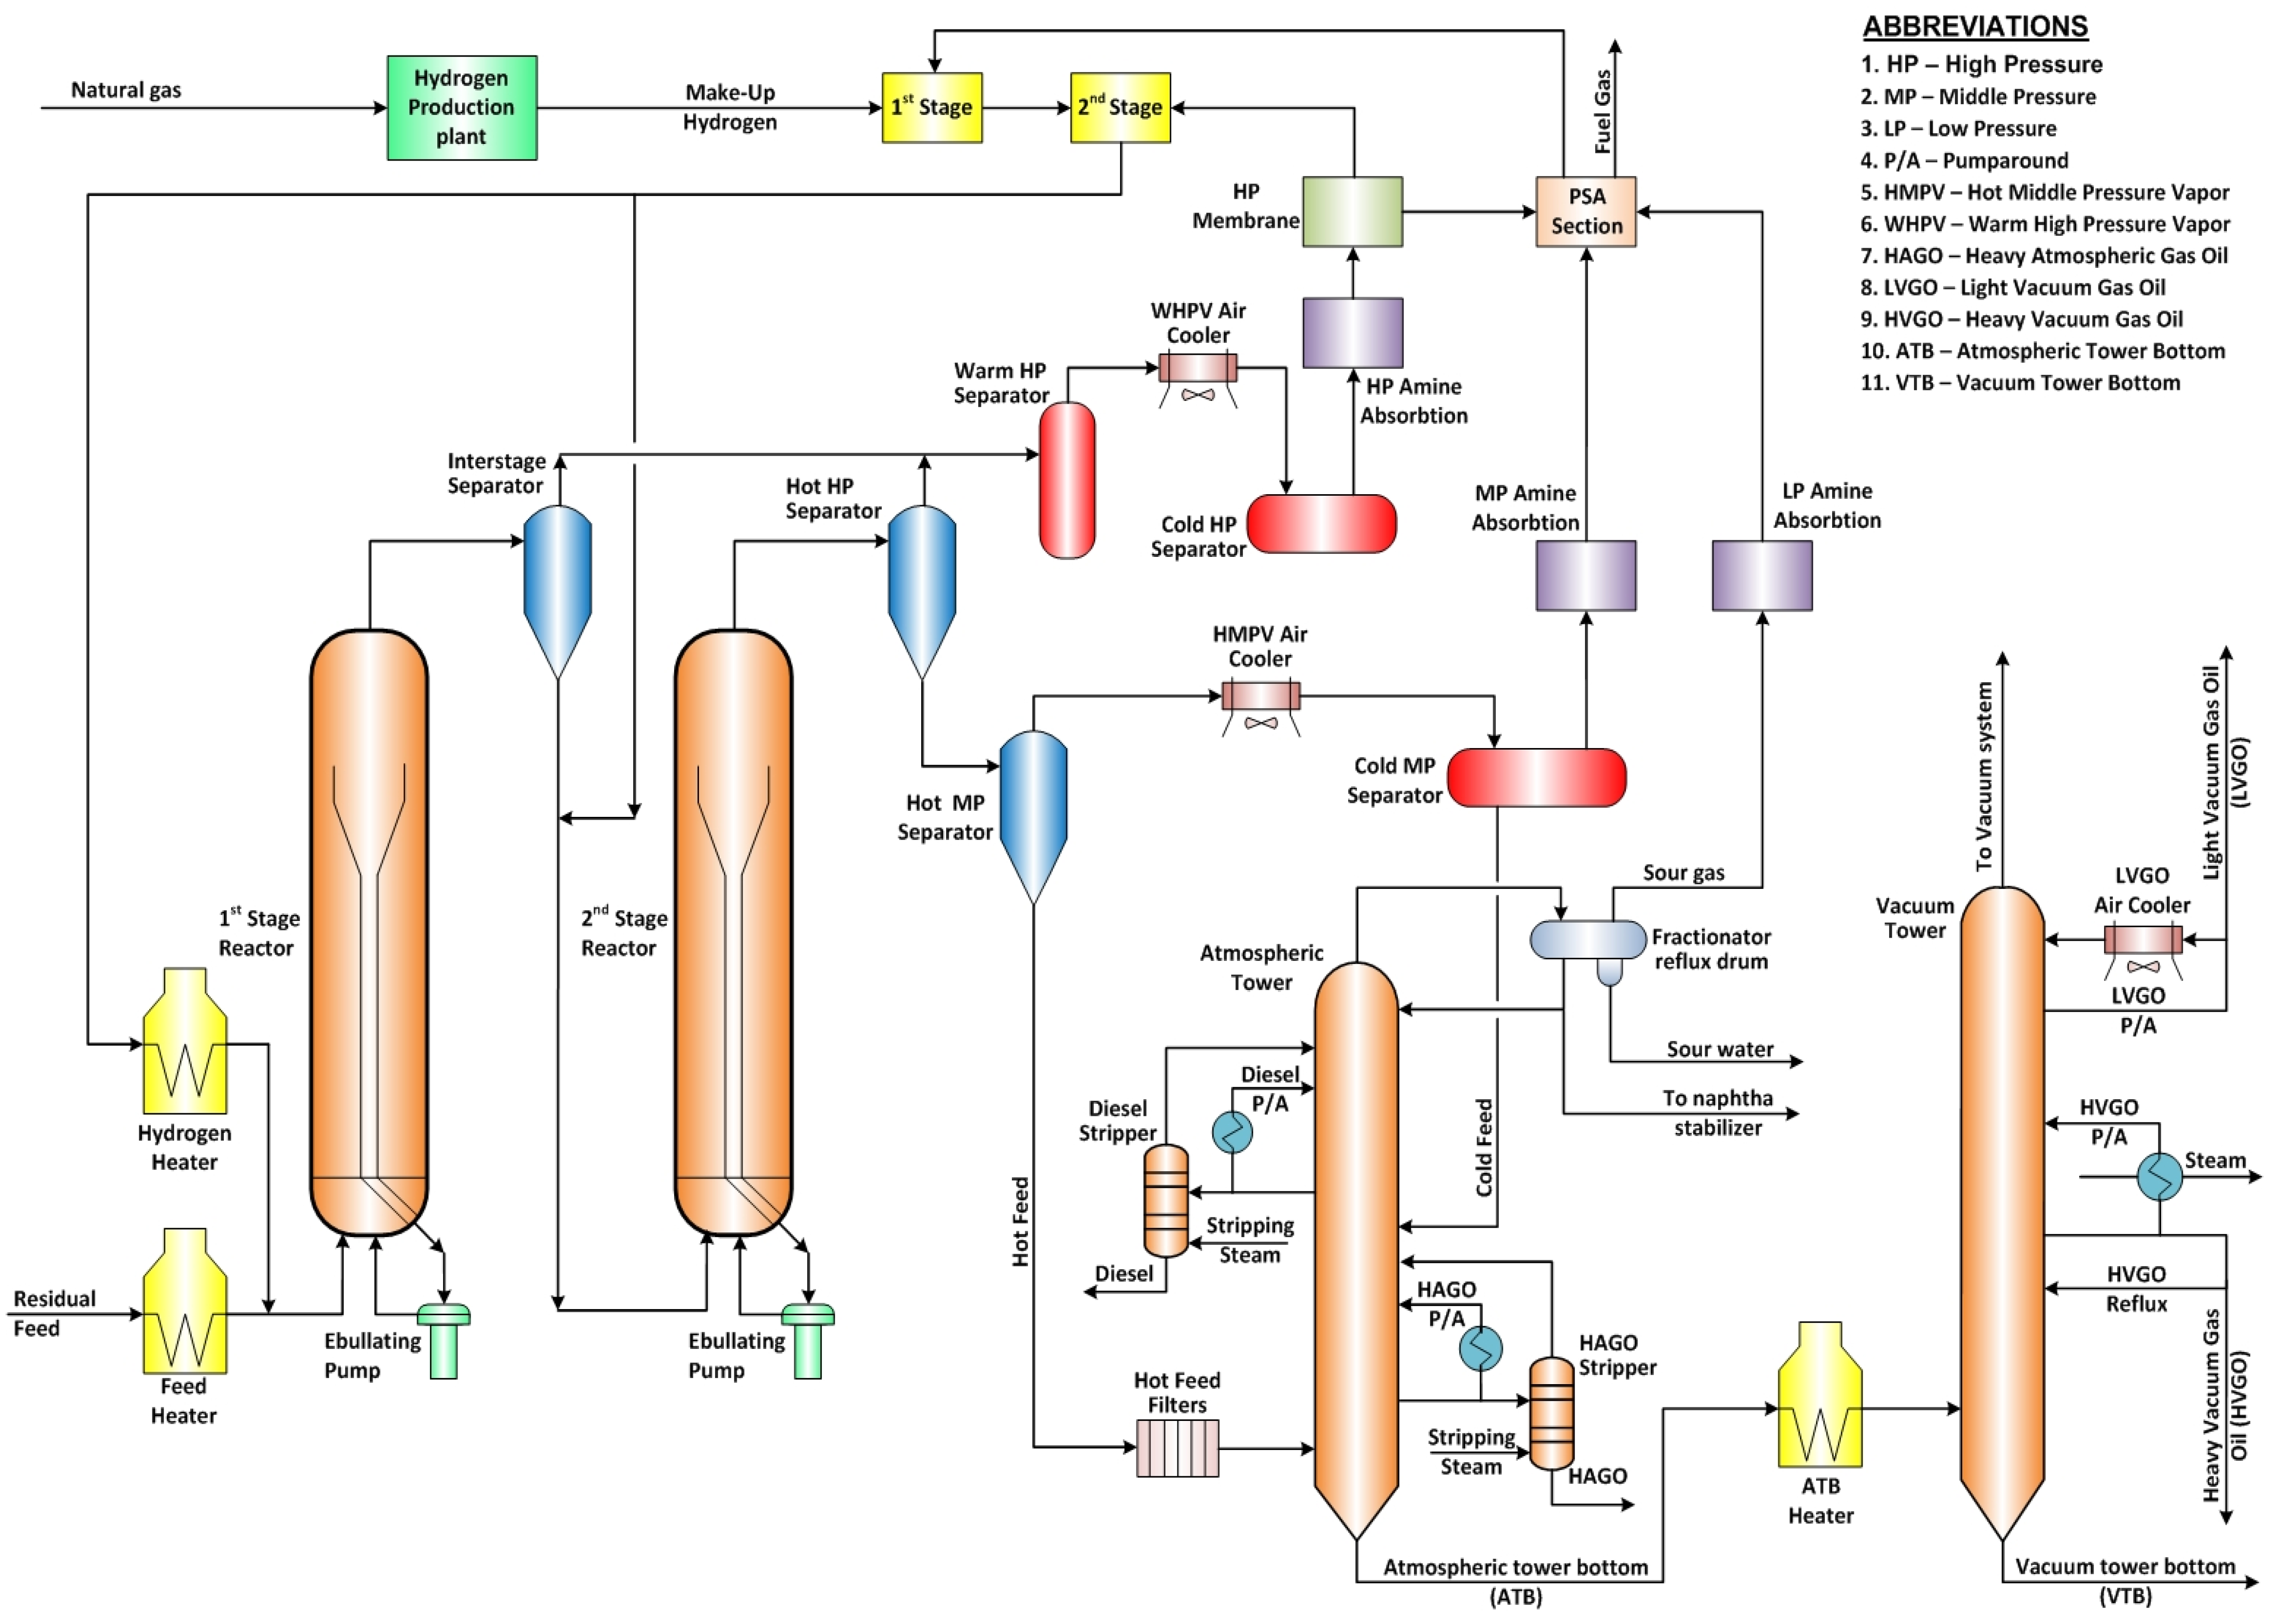
The processing diagram of the commercial H-Oil ebullated bed vacuum residue hydrocracker is presented in Figure 1. Details of the LNB H-Oil residue hydrocracker operating conditions are presented in [2].
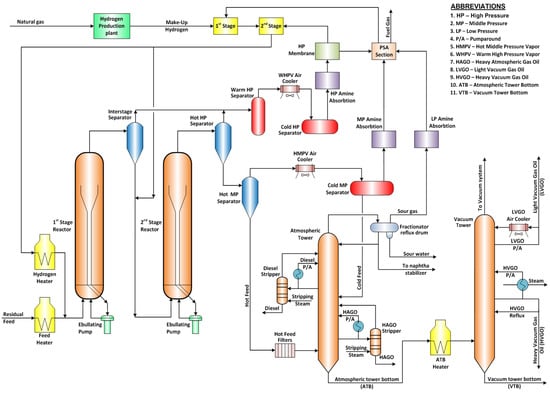
Figure 1.
Process flow diagram of the commercial H-Oil residue hydrocracker under study.
The evaluation of relationships between the composition data of the H-Oil feed, processing conditions, and the sediment content in both ATB and PBFO was made by using intercriteria analysis (ICrA) [62]. Details of the theory and application of ICrA are presented in [63]. The ICrA approach calculates two intuitionistic fuzzy functions: μ and υ whose values define the degree of the relationship between the criteria.
For μ = 0.75 ÷ 1.00 and υ = 0 ÷ 0.25, a region of statistically meaningful positive consonance is determined, while at μ = 0 ÷ 0.25 and υ = 0.75 ÷ 1.00, an area of statistically meaningful negative consonance is derived. All other cases are considered to be dissonance. Two software packages for ICrA were established and freely available as open source from https://intercriteria.net/software/ (accessed on 11 February 2025) and detailed in [64,65,66].
Before ICrA evaluation, all variables are normalized using the normalization formula (Equation (1)).
where:
Xnew = The normalized variable;
X = Actual value of the investigated variable;
Xmin = The minimal value the investigated variable;
Xmax = The maximal value the investigated variable.
The effect of H-Oil feed composition (the content of vacuum residues derived from different crude oils) and detailed characterization (SARA composition, physicochemical properties) on the sediment content in the ATB were assessed by both ICrA and multiple regression analysis.
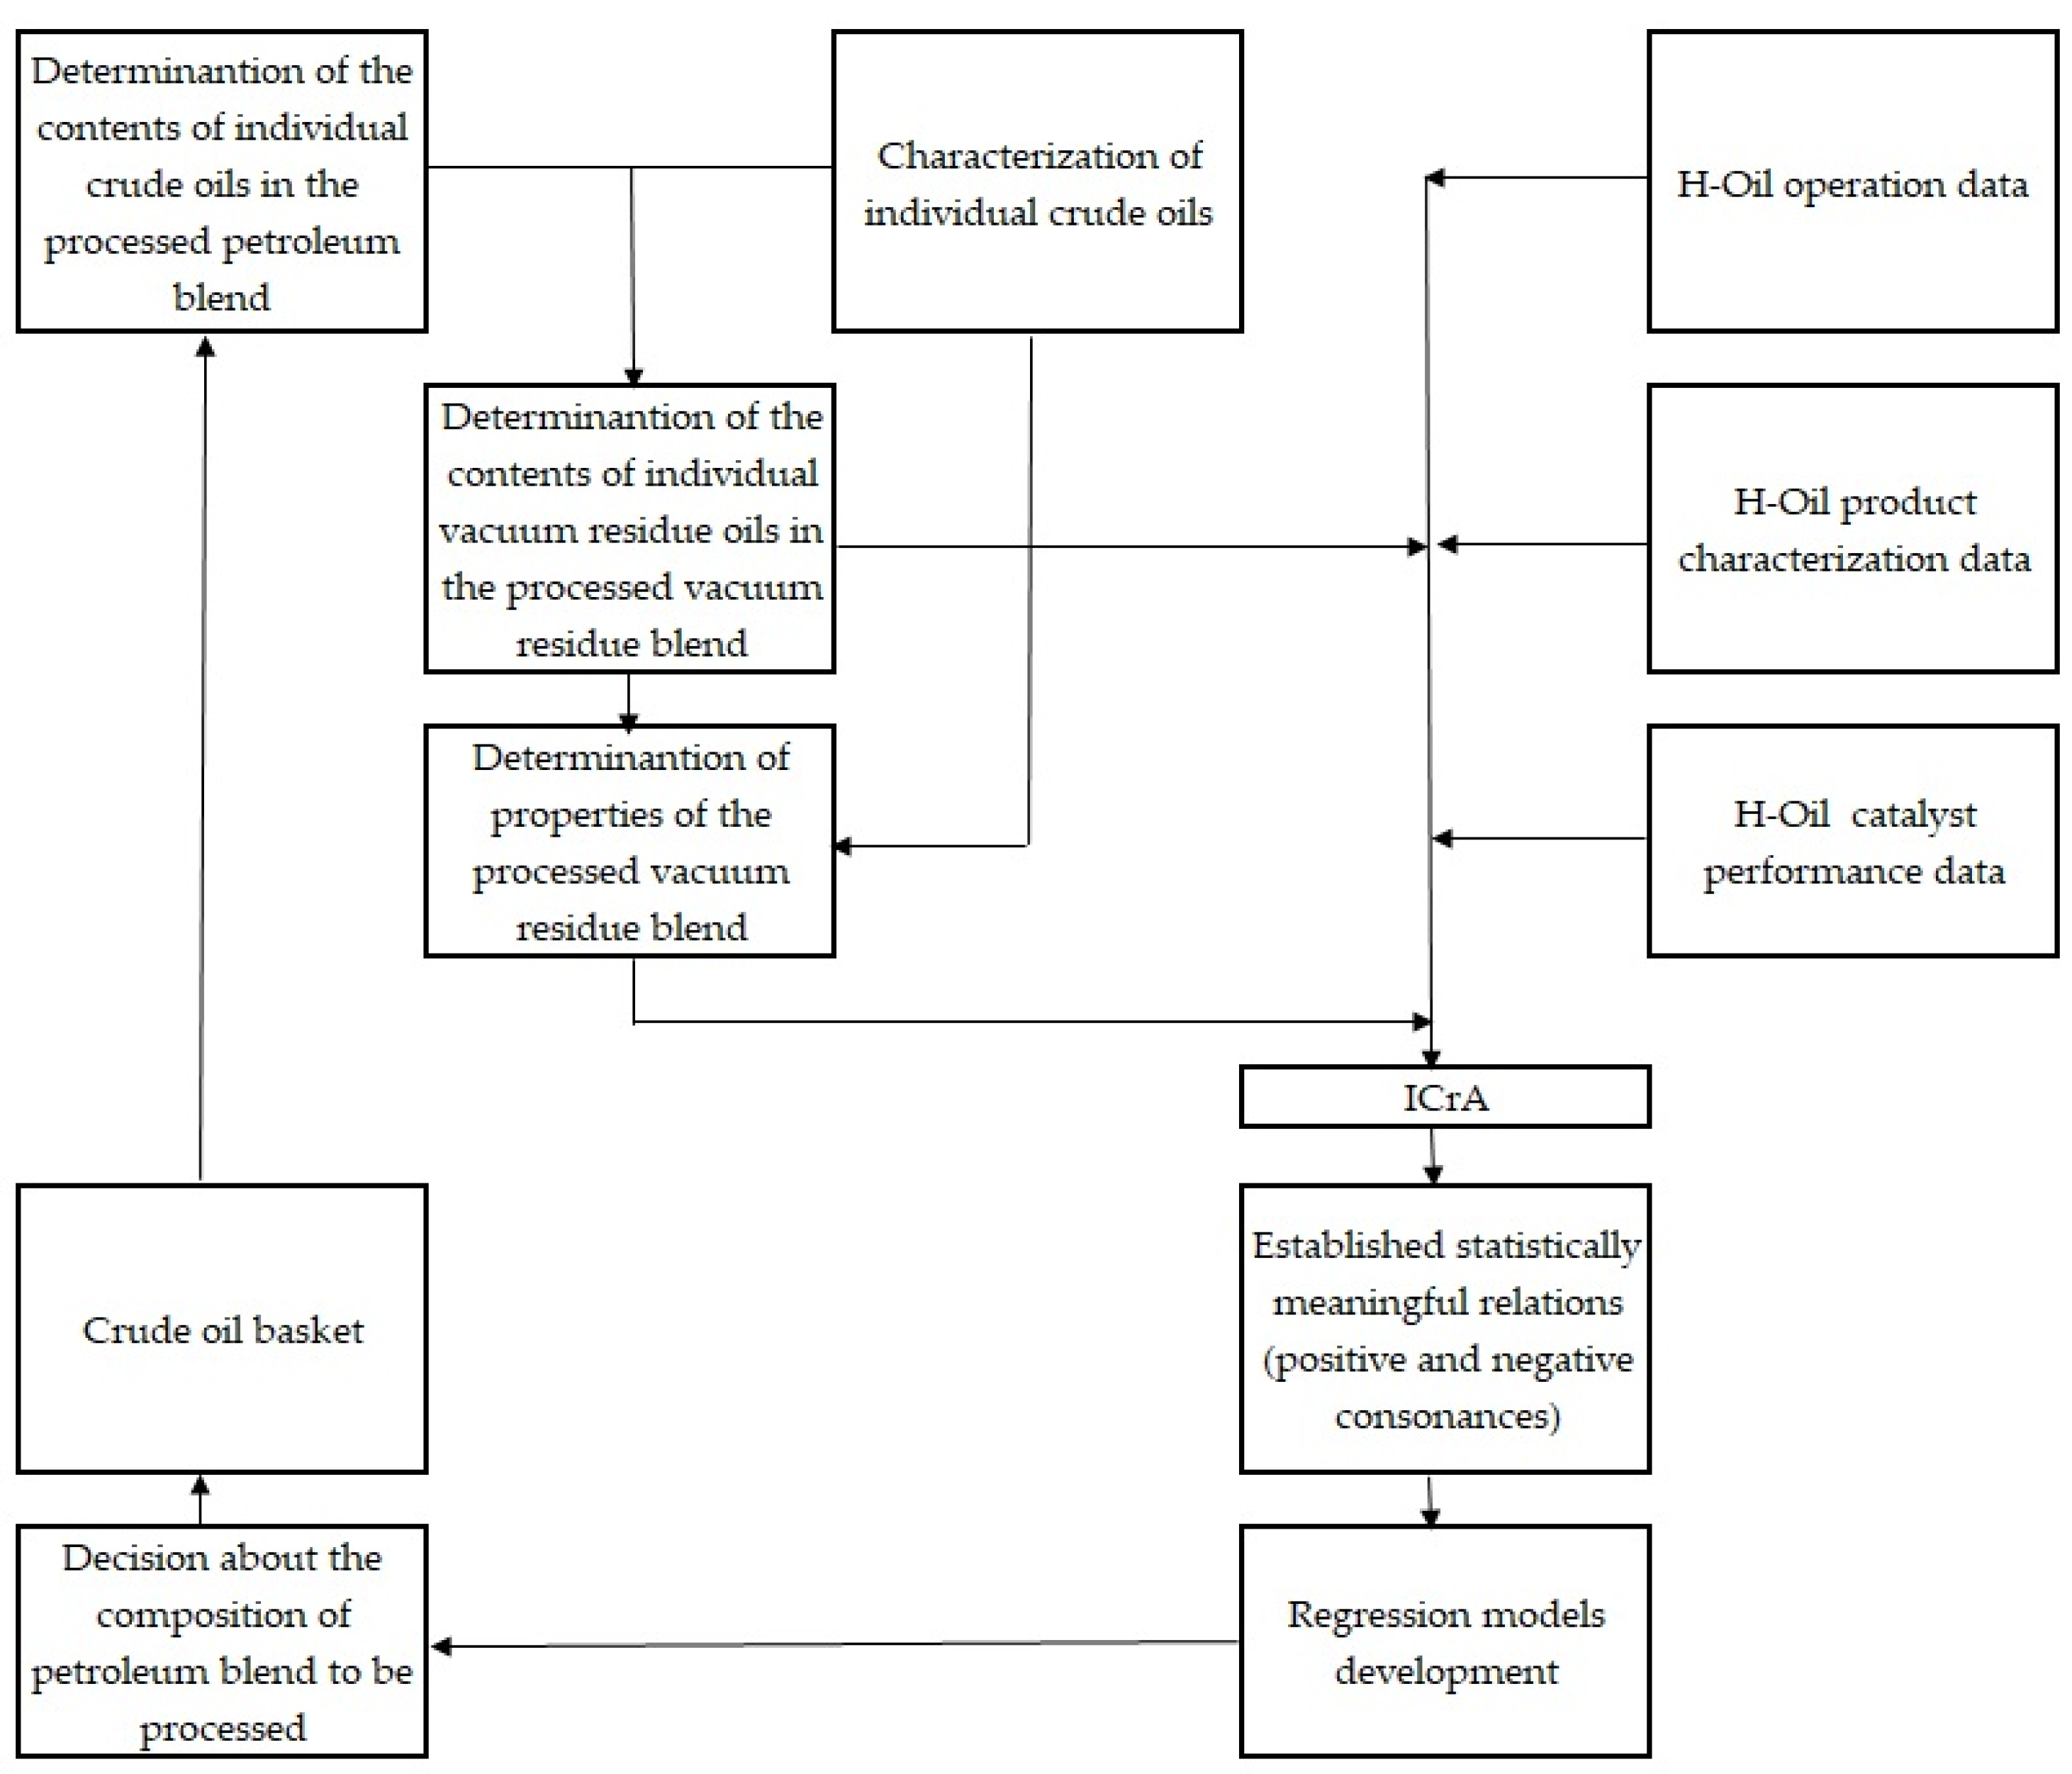
Figure 2 summarizes the methodology used in this research.

Figure 2.
Experimental methodology.
3. Results and Discussion
Two cases were investigated at the commercial H-Oil vacuum residue hydrocracker. The first considers the operation of H-Oil hydrocracker without operation of the FCC unit, that supplies the H-Oil unit with the FCC HCO and SLO which are injected in the feed and a part of the FCC HCO is also used as a cutter stock in the process of partially blended fuel production. The second investigates the operation of the H-Oil hydrocracker when the FCC unit is in operation too and different amounts of FCC gas oils are used at the H-Oil unit. Data of the composition of the crude blend processed at the LNB refinery and that of the vacuum residue blend hydrocracked at the H-Oil unit for Case 1 are presented in Table 2.
Table 2.
The composition of the crude oil blend processed at the LNB refinery and that of the vacuum residue blend hydrocracked at the H-Oil unit for the case when the FCC unit was out of operation (Case 1).
Data of the composition of the crude blend processed at the LNB refinery and of the vacuum residue blend hydrocracked at the H-Oil unit for Case 2 are summarized in Table 3.
Table 3.
The composition of the crude oil blend processed at the LNB refinery and the vacuum residue blend hydrocracked at the H-Oil unit for the case when the FCC unit was in operation (Case 2).
The effect of the amount of FCC gas oils injected in the H-Oil feed and the vacuum residue blend composition on sediment formation rate is discussed below.
3.1. Influence of the Amount of FCC HCO and SLO Injected in the Vacuum Residue Feed on Sediment Formation Rate in the H-Oil Hydro Cracker (Case 1)
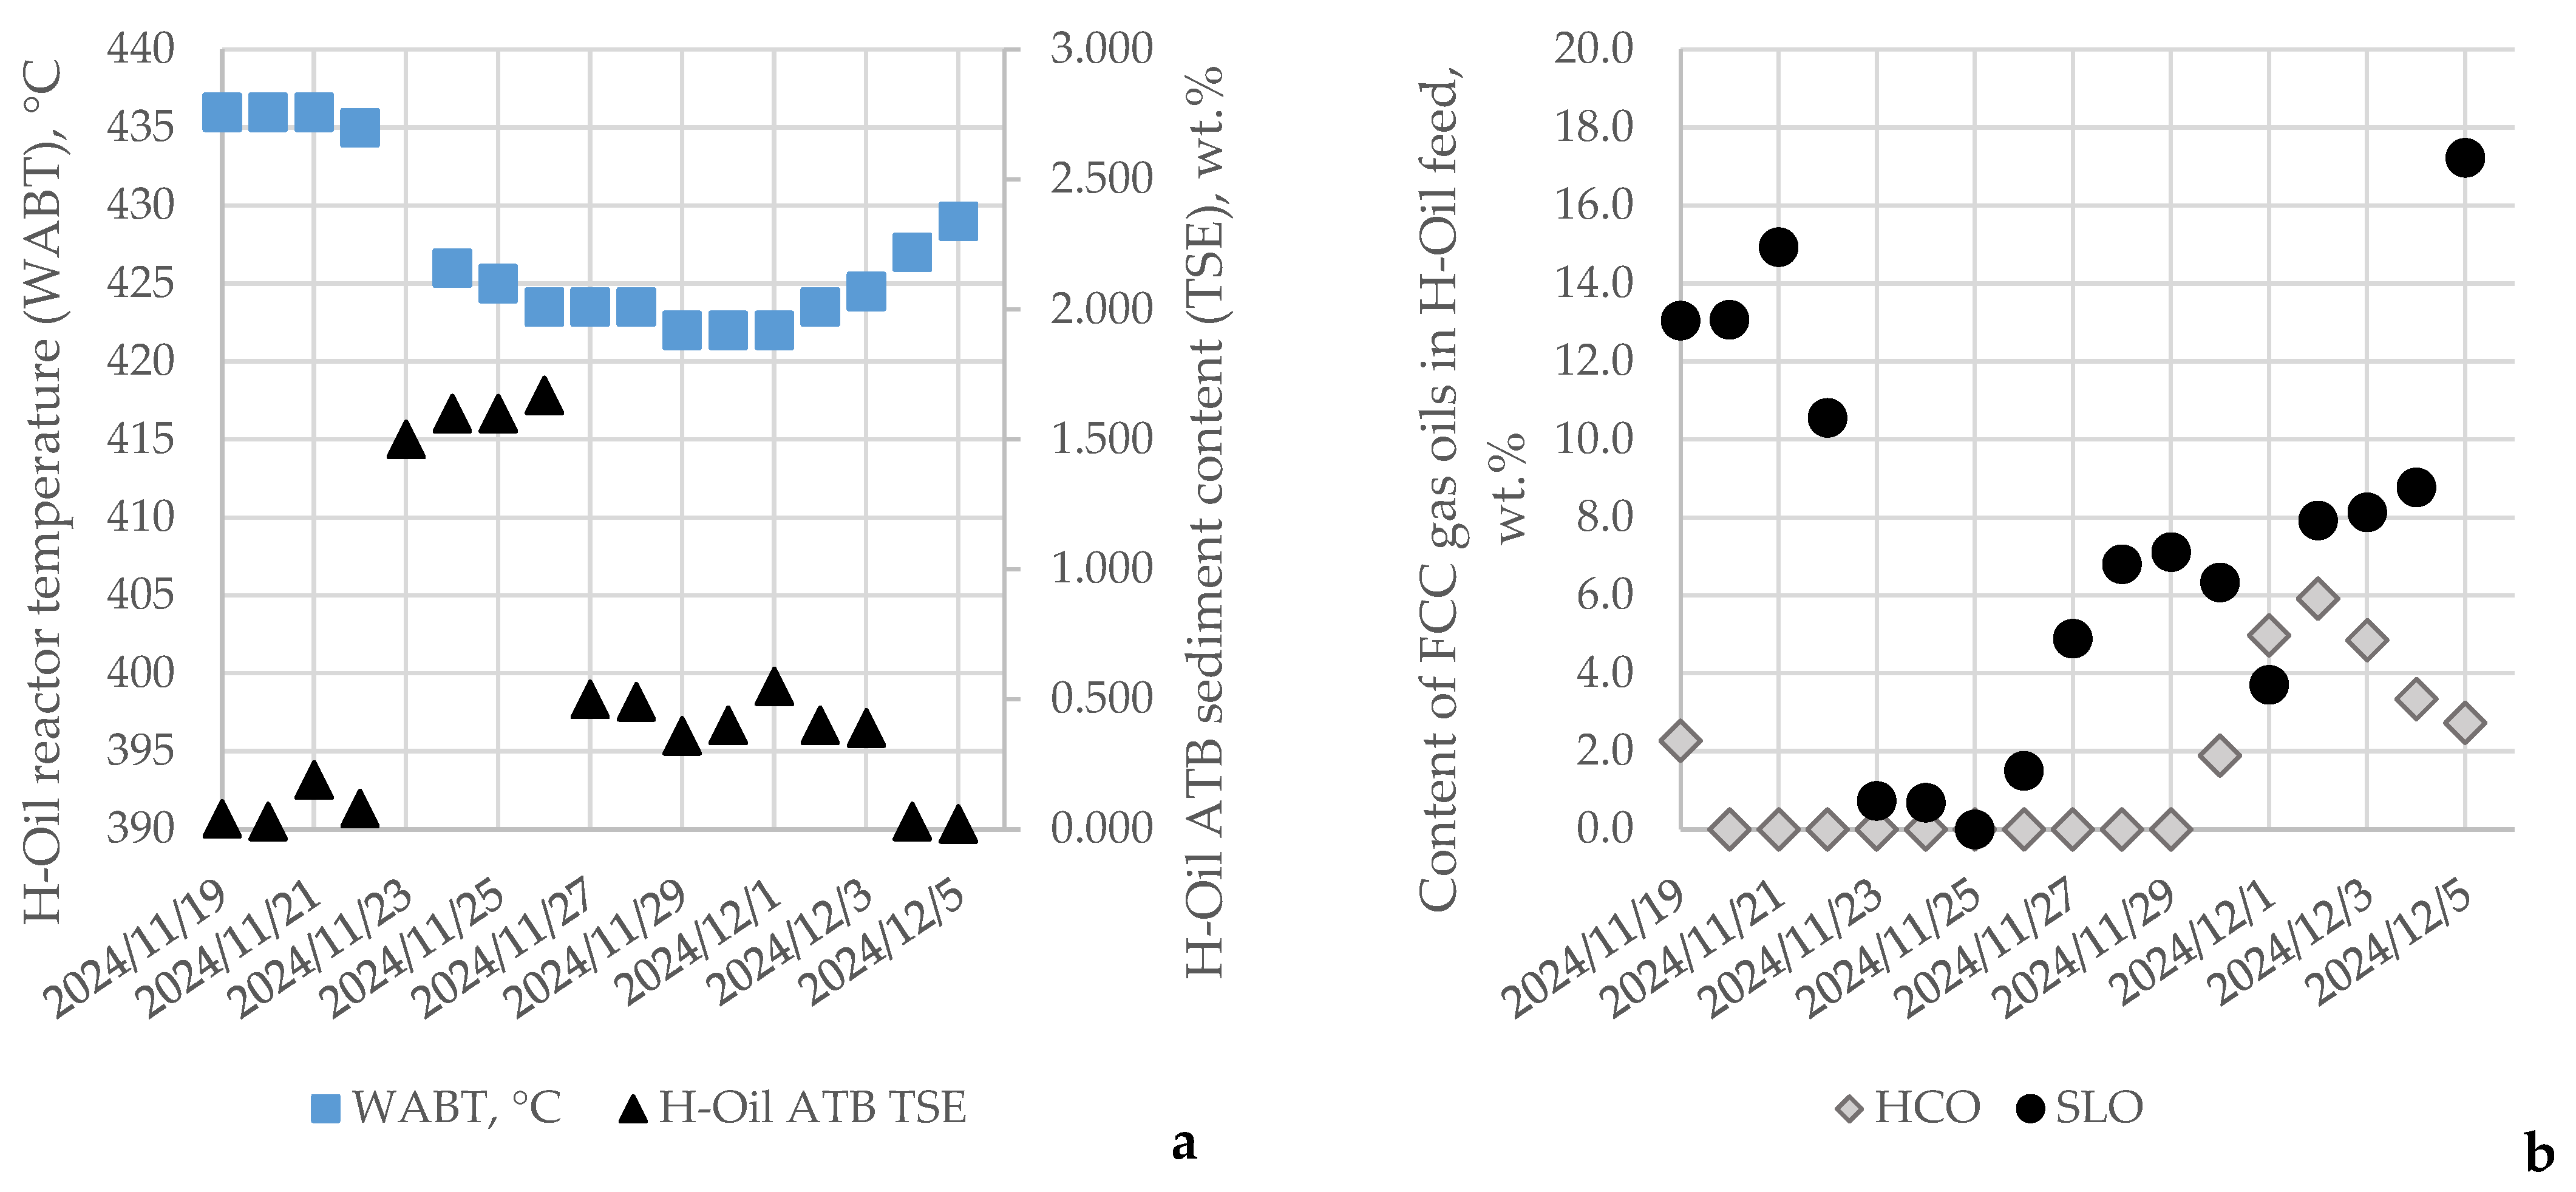
The data in Figure 3 indicate how the sediment content in the H-Oil ATB, along with the weight average bed temperature (WABT: average temperature of both reactors), and the content of FCC HCO and SLO in the H-Oil feed have been varied during the investigation of Case 1.
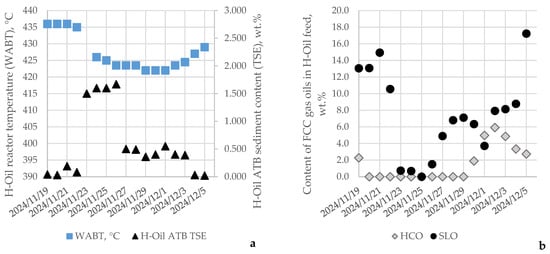
Figure 3.
Variation of sediment content in the hydrocracked atmospheric residue (ATB TSE), average reactor temperature (WABT) (a), and contents of FCC HCO and SLO in the H-Oil feed (b) for the investigated period of time of Case 1.
It is evident from the data in Figure 3a,b that the reduction in FCC SLO from about 13 wt.% of H-Oil feed to zero is associated with an increase in the ATB sediment content from 0.1 to 1.6 wt.%. Although the reactor temperature diminished from 436 °C to 424 °C, the ATB sediment content remained at the extremely high level of 1.6 wt.%. Hardly after injection of 7.1 wt.% FCC SLO in the H-Oil feed, the ATB sediment content drops to 0.5 wt.% at a reactor temperature of 422 °C. The augmentation of the FCC SLO amount injected in the H-Oil feed up to 17 wt.% leads to 0.02 wt.% sediment content in the hydrocracked atmospheric residue at 429 °C reactor temperature.
In order to evaluate which process and feed characteristics have a statistically meaningful relation to the sediment formation rate expressed by the TSE of ATB and TSP of PBFO, an ICrA assessment was performed. Table 3 and Table 4 display μ and υ values of all investigated variables like reaction temperature, catalyst addition rate (CAR), the content of vacuum residues originating from the 16 crude oil in the H-Oil vacuum residue feed, etc. The data in Table 4 and Table 5 demonstrate that the PBFO TSP has a negative statistically meaningful consonance with the first reactor ΔT (μ = 0.18; υ = 0.77), and positive consonances with the contents of vacuum residues in the residue blend originating from the crude oils CPC (μ = 0.76; υ = 0.21), Helm (μ = 0.79; υ = 0.16), and Tempa Rossa (μ = 0.83; υ = 0.15). These findings imply that the vacuum residues from the mentioned crude oils disturb the colloidal stability of the PBFO and conduce the formation of sediments after thermal ageing. The first reactor ΔT depends on the catalyst activity in this reactor and the properties of the vacuum residue feedstock. The higher the catalyst activity in the first reactor and sulfur content in the feedstock the lower the TSP in the PBFO.
Table 4.
μ-values from ICrA evaluation of the data for Case 1.
Table 5.
υ-values from ICrA evaluation of the data for Case 1.
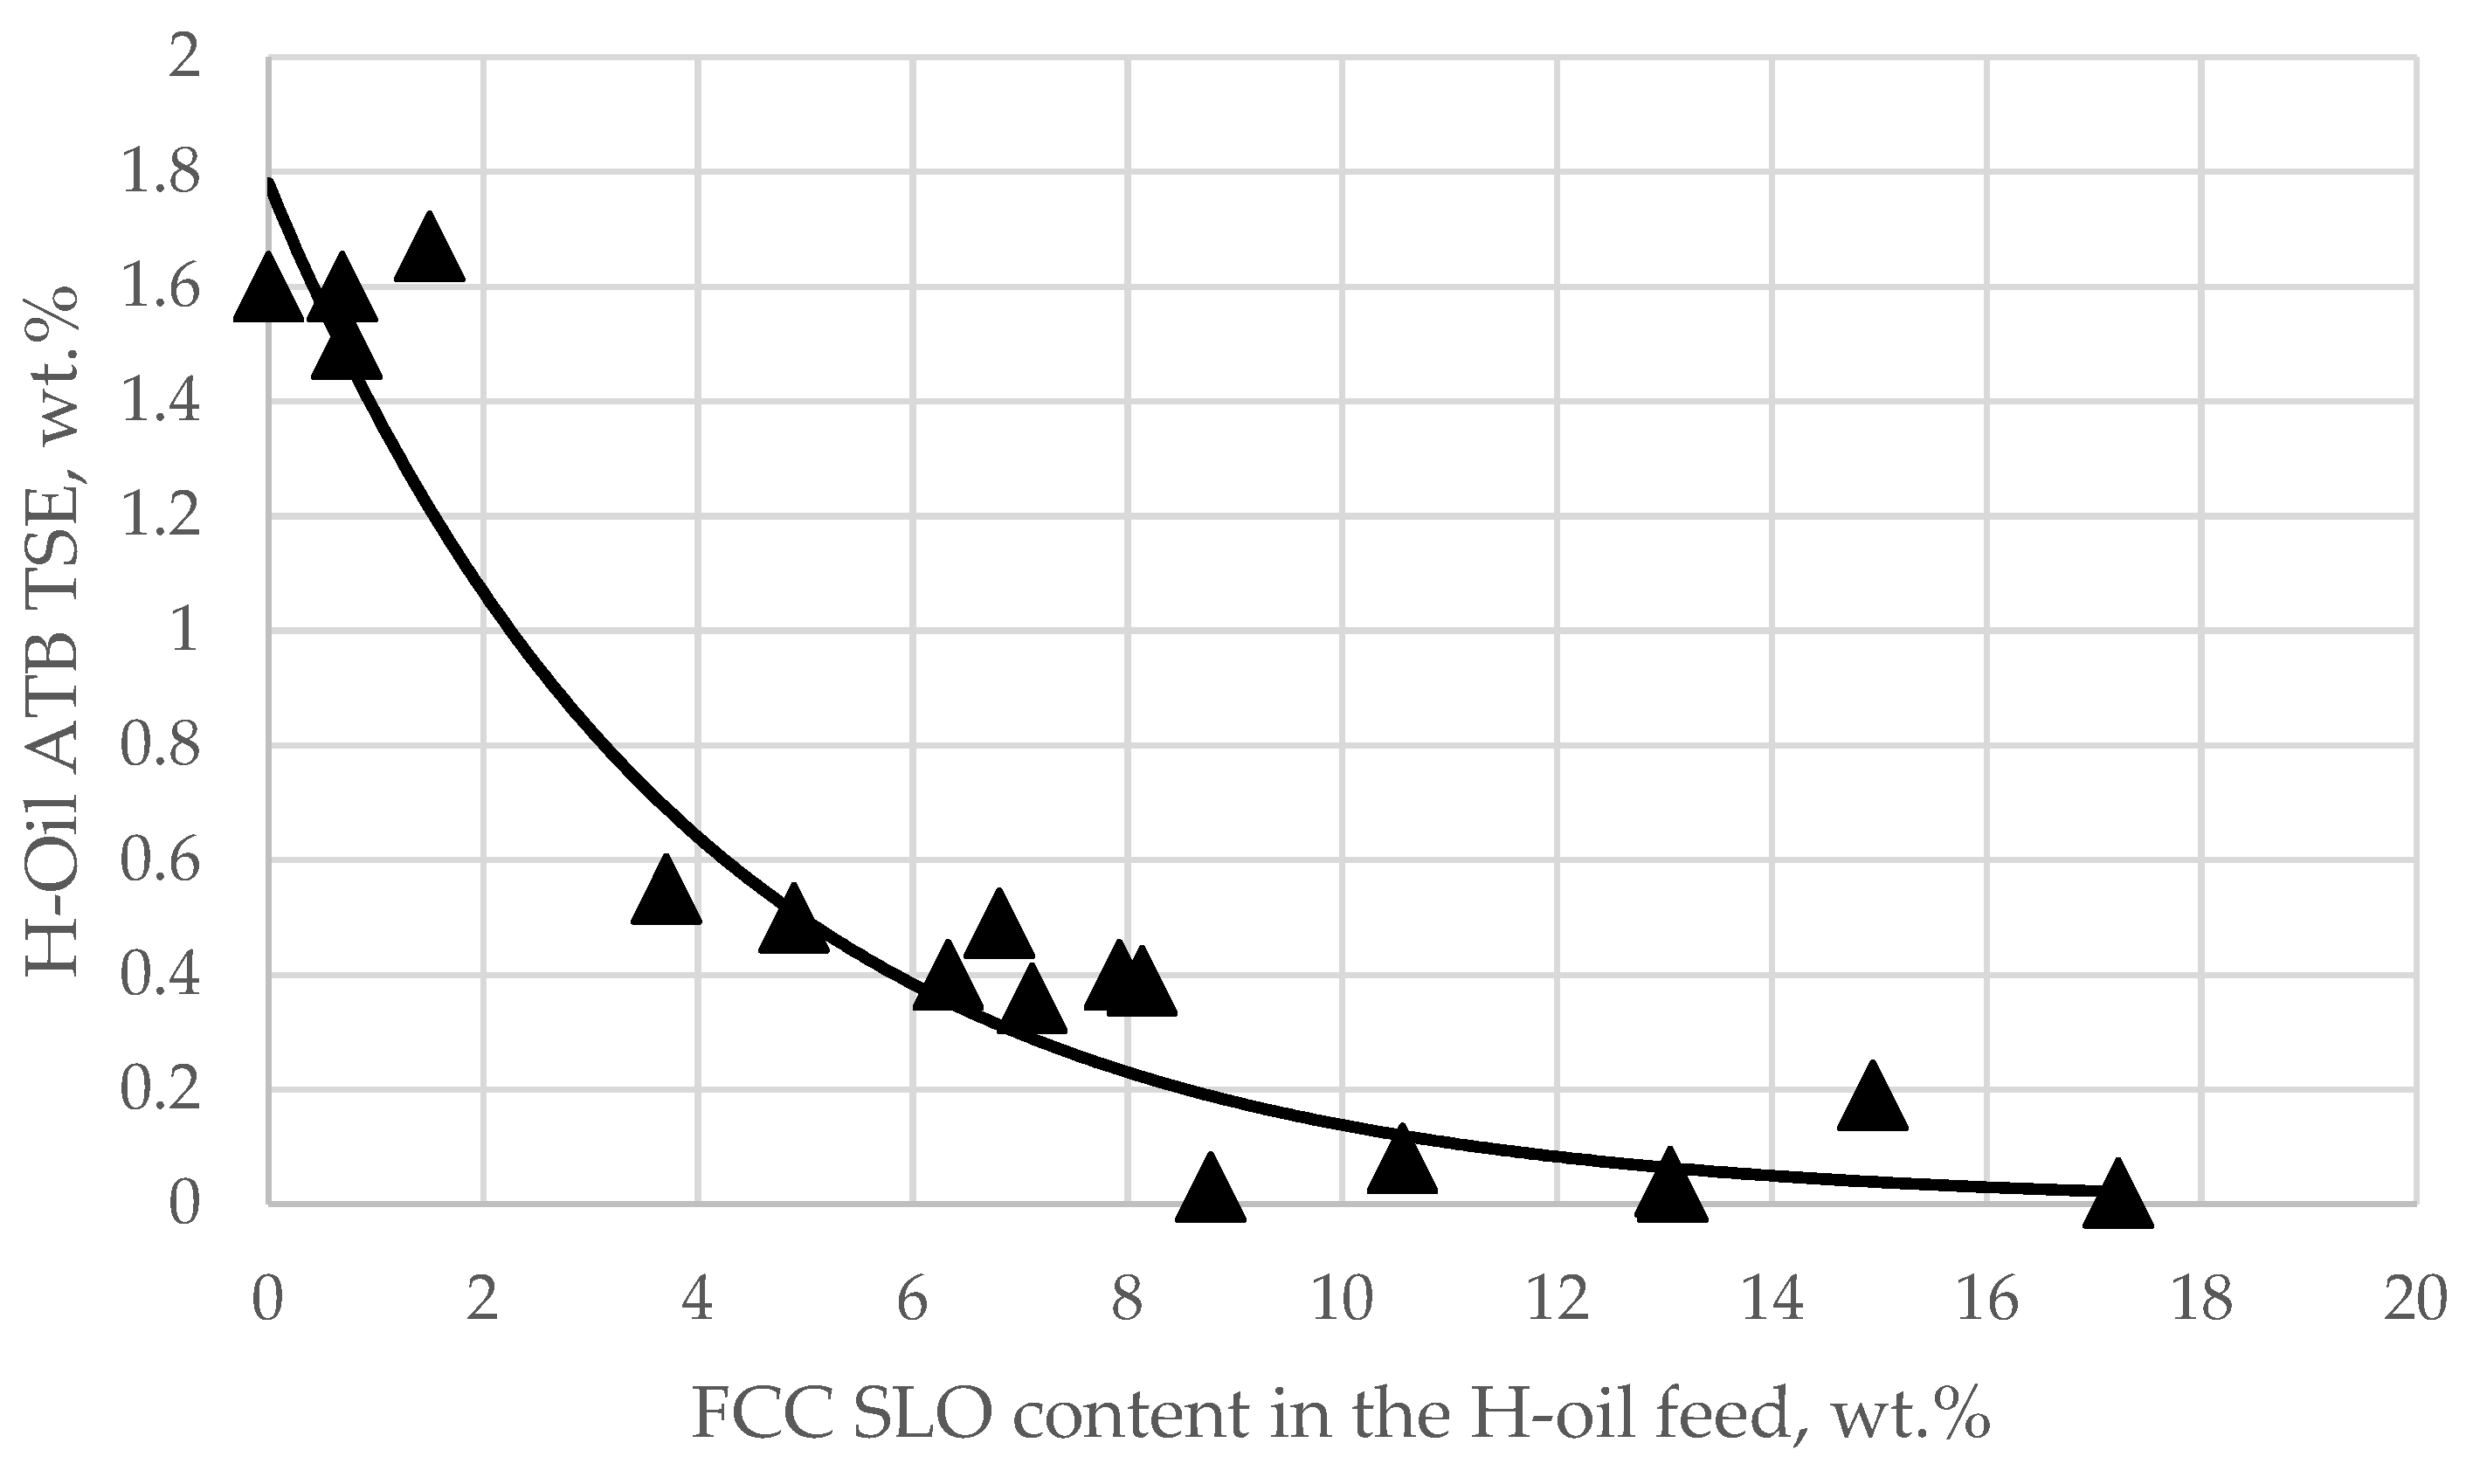
Concerning the ATB TSE, one can see from the data in Table 4 and Table 5 that the single most influential factor having control on sedimentation is the content of SLO in the H-Oil feed (μ = 0.09; υ = 0.88). The higher the SLO content in the H-Oil feed the lower the sediment content in the ATB is. Figure 4 shows that there exists a strong exponential dependence of H-Oil ATB TSE on the SLO content in the feed.
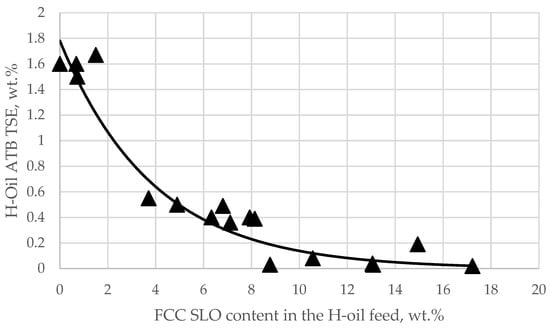
Figure 4.
Dependence of sediment content in the hydrocracked atmospheric residue from the H-Oil hydrocracker on the FCC SLO content in the H-Oil feed.
The regression equation of Figure 4 is presented as Equation (2).
where:
ATBTSE = total sediment existent in the H-Oil ATB product, wt.%;
FCC SLO = content of FCC SLO in the H-Oil feed, wt.%.
The data in Table 4 and Table 5 indicate that for this data set the FCC HCO has no effect on sedimentation, neither for ATB TSE, nor for the PBFO TSP, in contrast to the FCC SLO. These findings are not in full agreement with the results reported by Marafi et al. [30] who showed that both FCC gas oils improved the sedimentation during hydrocracking of Kuwait vacuum residue, although the FCC SLO was found more effective. The results from the current study are in contrast to those reported by Tirado and Ancheyta [33] who showed that the FCC SLO was not suitable as a sedimentation inhibitor during hydrocracking of heavy crude oil. They are also not in agreement with the investigation of García et al. [32] demonstrating that FCC SLO is effective as sedimentation inhibitor when added after the reaction section, but are in agreement with the report of Margues et al. [31], who injected FCC SLO in the vacuum residue hydrocracking feed. Based on these findings, one may conclude that the efficiency of using the FCC gas oils as sedimentation inhibitors in heavy oil hydrocracking may depend on the feed being hydrocracked, unit configuration, operating conditions, catalyst type and characteristics, etc.
3.2. Influence of the Vacuum Residue Blend Composition on Sediment Formation Rate in the H-Oil Hydro Cracker (Case 2)
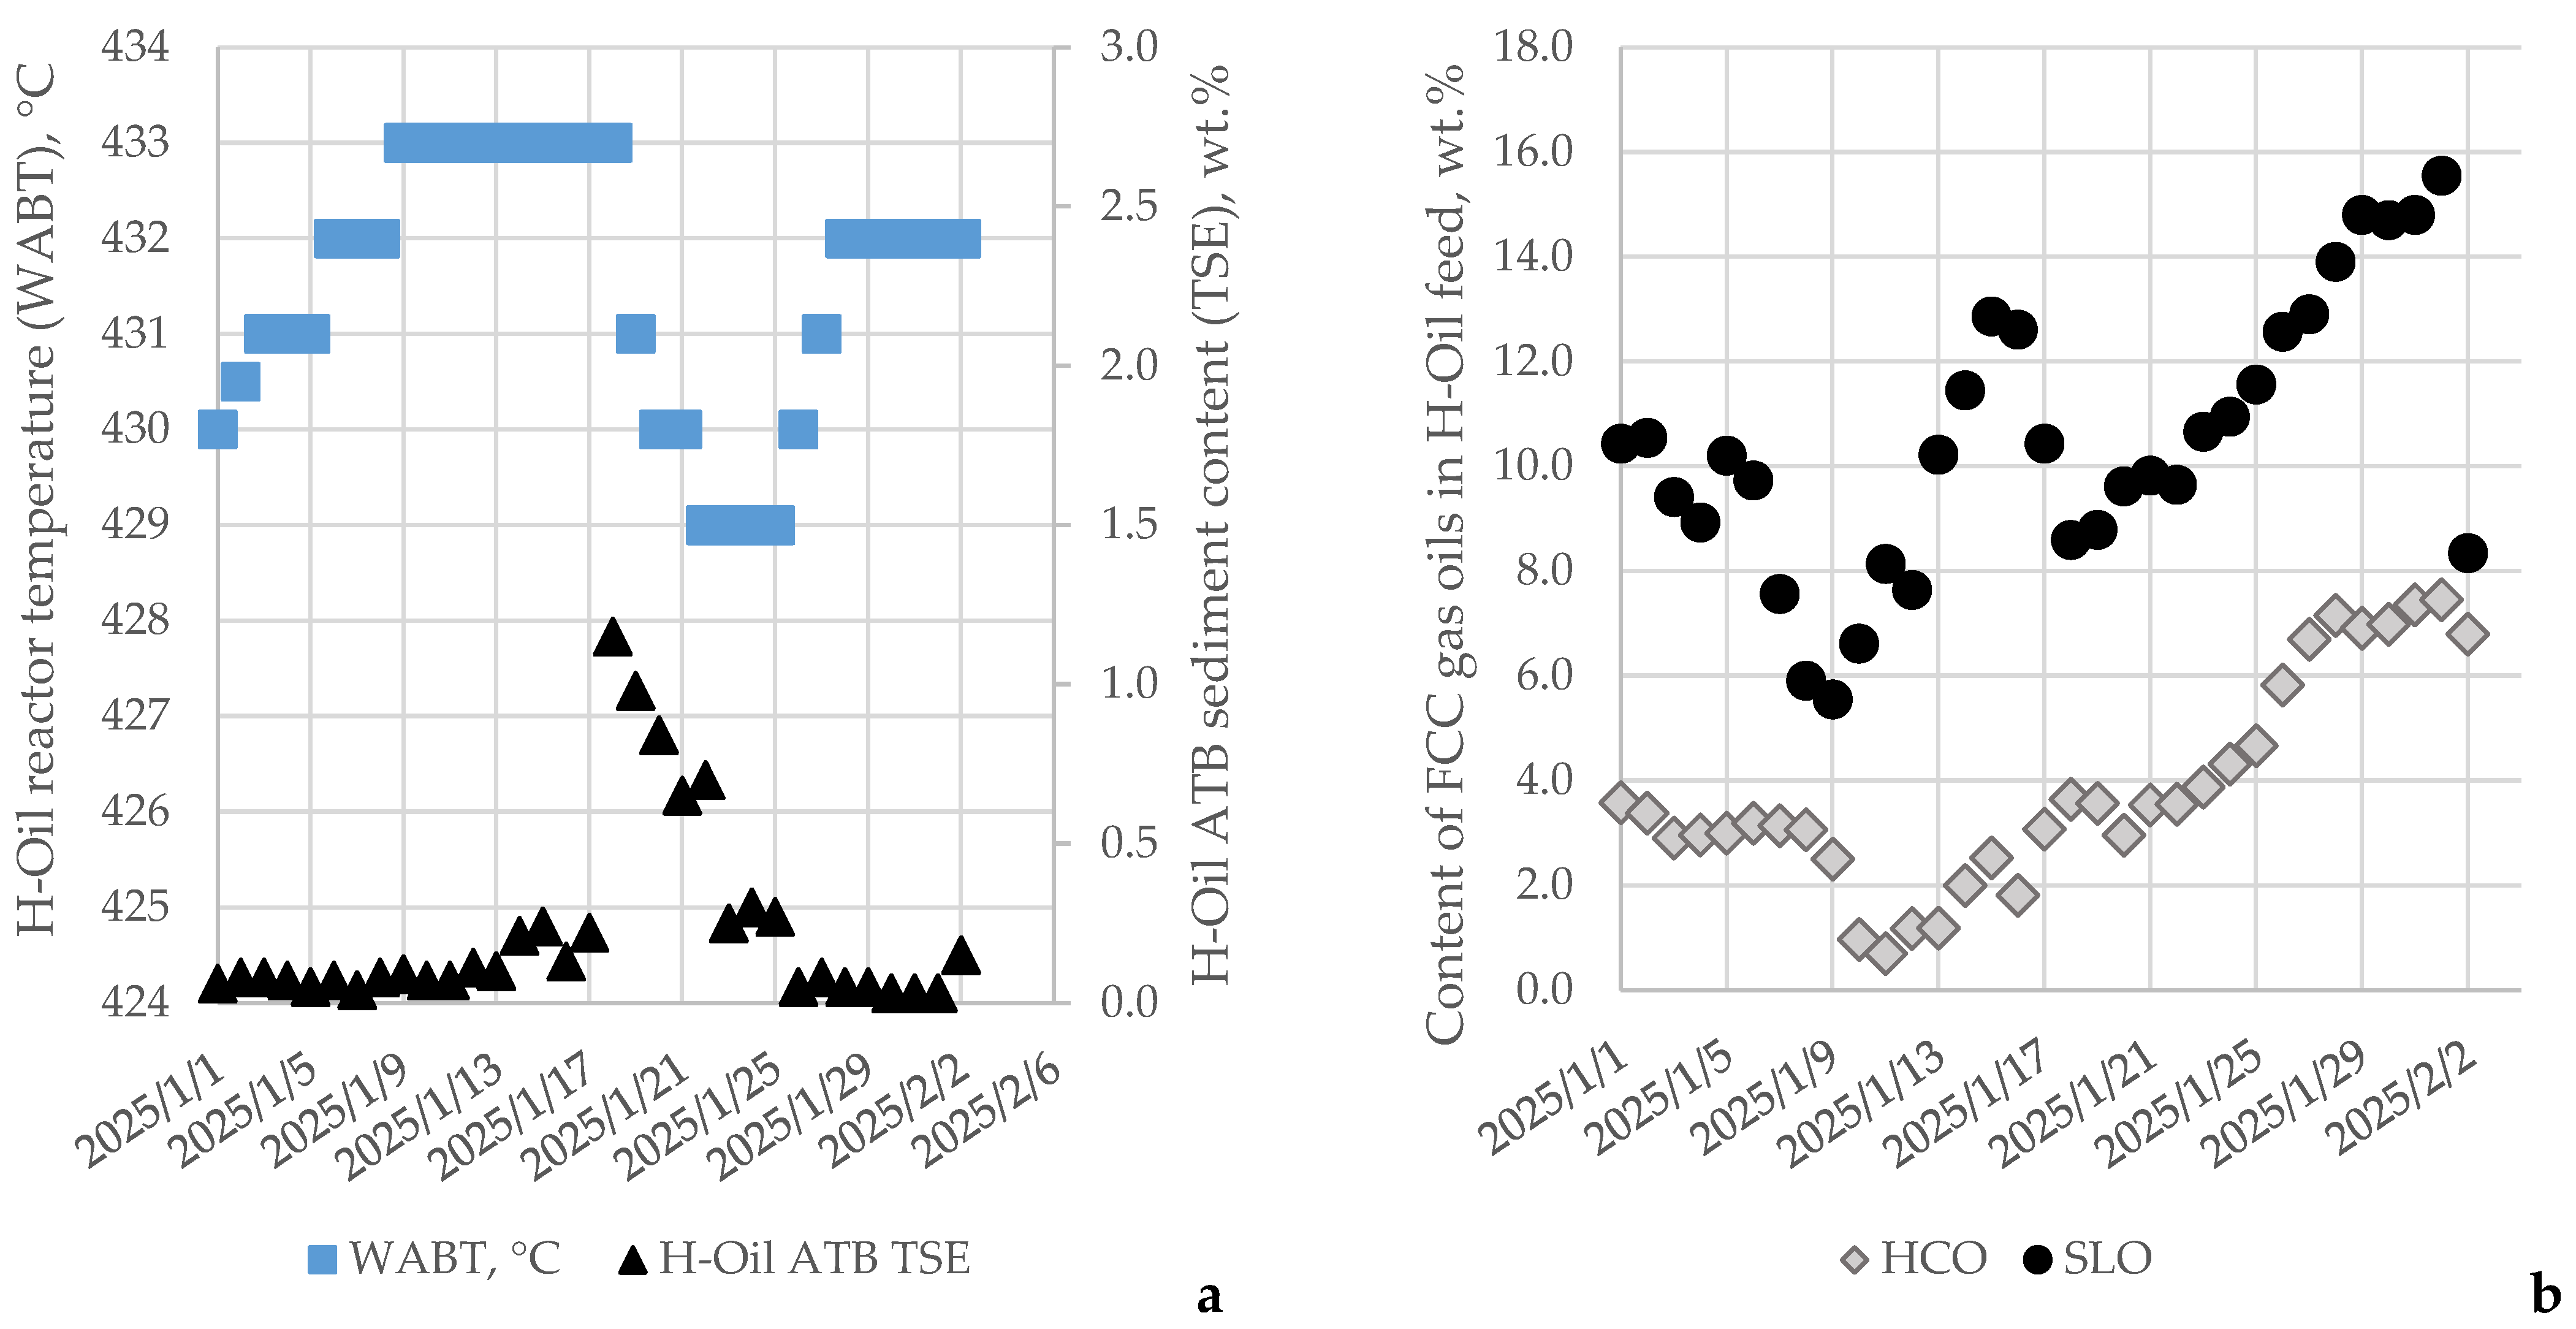
The variation of ATB TSE, WABT, and the contents of FCC HCO and SLO in the H-Oil feed for the investigated period of time of Case 2 is depicted in Figure 5.
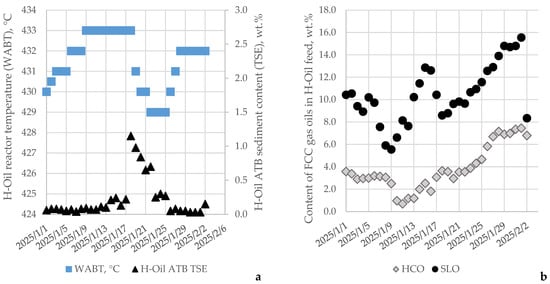
Figure 5.
Variation of sediment content in the ATB, WABT (a), and contents of FCC HCO and SLO in the H-Oil feed (b) for the investigated period of time of Case 2.
The data in Figure 5a show a sudden increase in sediment level in the H-Oil ATB product from 0.2 to 1.2 wt.% on 18 January 2025. If one compares the data in Figure 5a,b, one can see that regardless of the reduction in the FCC SLO from 10 to 5 wt.% for the period 1 January 2025–9 January 2025 the ATB TSE remained at 0.08 wt.% irrespective of reactor temperature enhancement from 430 to 433 °C. This suggests that the vacuum residue blend composition is favorable from the point of view of retardation of sedimentation. From 14 January 2025 to 17 January 2025, the ATB TSE is stepwise magnified from 0.08 to 0.20 wt.% regardless of the relatively high FCC SLO content in the H-Oil feed of about 10 wt.% suggesting a change in the properties of the vacuum residue H-Oil feed. At 8.6 wt.% FCC SLO in the H-Oil feed and 3.6 wt.% FCC HCO, the content of sediments in the ATB jumped to 1.20 wt.% which is definitely an effect coming from the vacuum residue blend composition. This is associated with a reactor temperature reduction from 433 down to 429 °C. The gradual rise in FCC SLO reaching a peak of 15.6 wt.% and that of FCC HCO of 7.3 wt.% (Figure 5b) is associated with a decline in ATB TSE down to 0.03 wt.% (Figure 5a).
The influence of FCC SLO on H-Oil ATB TSE was quantified by Equation (2). By subtracting the H-Oil ATB TSE calculated by Equation (2) from that for Case 2, one can obtain the amount of H-Oil ATB TSE, termed resulting from the effect of the vacuum residue mixture composition alone. To determine the presence or absence of relations of to the vacuum residue blend composition, an ICrA evaluation was performed. As shown in Table 6 and Table 7, the only variable to have statistically meaningful relation is the content of El Bouri-derived vacuum residue in the H-Oil vacuum residue blend feedstock. The El Bouri vacuum residue content has a positive consonance with the (μ = 0.77; υ = 0.17), implying that the increase in its content in the H-Oil feed will be accompanied by increment of sediment content in the ATB product.
Table 6.
μ-values from ICrA evaluation of the data for Case 2.
Table 7.
υ-values from ICrA evaluation of the data for Case 2.
The ICrA and the correlation analysis can evaluate the presence or absence of statistically meaningful relations between a pair of variables one by one. However, they are not in a position to evaluate the presence of statistically meaningful relations between a target variable with a combination of variables. This can be done by multiple regression analysis.
If the multiple correlation coefficient is equal or higher than 0.75 and the regression coefficients have probability value lower than 0.05 then the variables in the regression equation can be considered to significantly affect the target variable. In this way, by performing the multiple regression analysis of the data for and the contents of vacuum residues in the H-Oil vacuum residue blend feedstock for Case 2 it was found that the vacuum residues from the crude oils El Bouri, Basra Med, and CPC have a statistically meaningful relation to the target variable Equation (3) shows the developed multiple correlation.
where:
= The difference between measured H-Oil ATB TSE for Case 2 and that calculated by Equation (2) H-Oil ATB TSE, wt.%;
EB = content of vacuum residue obtained from El Bouri crude oil in the H-Oil vacuum residue feed blend, wt.%;
BM = content of vacuum residue obtained from Basra Medium crude oil in the H-Oil vacuum residue feed blend, wt.%;
CPC = content of vacuum residue obtained from CPC crude oil in the H-Oil vacuum residue feed blend, wt.%.
The probability values of the regression coefficients of EB, BM, and CPC were , 0.0013, and 0.0043, respectively.
The evaluation of data for the H-Oil feed blend properties calculated by using the data of individual vacuum residue contents for Case 2 and the data of vacuum residue properties shown in Table 1 by multiple regression analysis enabled the development of the correlation displayed as Equation (4).
where:
= The content of sediments in the H-Oil ATB for Case 2, wt.%;
S = content of sulfur in H-Oil feed blend, wt.%;
Res = content of resins in H-Oil feed blend, wt.%;
C7 asp = content of C7-asphaltenes in H-Oil feed, wt.%.
The probability values of the regression coefficients of S, Res, and C7 asp were , 0.0001, and 0.0043, respectively.
Equation (4) suggests that the higher sulfur vacuum residues, which contain less resins and asphaltenes, can retard the process of sedimentation.
An interesting observation is that the variables affecting the rate of precipitate formation are the same as those controlling the reactivity of the vacuum residue during hydrocracking, as reported in [67]. Adams et al. [67] communicated that the higher the sulfur content and the lower the resins and asphaltenes, the higher the conversion achieved during hydrocracking of vacuum residues at the same operating conditions. Thus, one may conclude that the components which retard conversion and promote sediment formation in the vacuum residue hydrocracking are resins and asphaltenes, while sulfur content contributes to conversion enhancement and sediment formation rate reduction. It deserves mentioning here that some oils, like for example Basra Med in this study (see Equation (3), seem to contain natural sedimentation inhibitors and they can mitigate the issue with sedimentation, deposit formation, and consequently fouling [68]. In [42], it was shown that the addition of FCC SLO to the H-Oil hot middle pressure separator (HMPS) bottom product decreased its asphaltene content, suggesting asphaltene dissolution, and this could be the possible explanation for the reduction in sedimentation when oils containing natural sedimentation inhibitors are added to the H-Oil feed.
4. Conclusions
The formation of coke-like sediments in vacuum residue hydrocracking is a very complex phenomenon leading to a short cycle length, deteriorated heat exchanger performance, and worsened vacuum residue hydrocracking performance as a whole. In various investigations it was shown that sediments are formed as a result of the precipitation of the most insoluble part of the oil. Due to the complexity of the vacuum residue, which is the most intricate fraction of the crude oil, the exact reason for the occurrence of sedimentation is not completely known and the measures taken to retard sedimentation give different results in the various investigated cases. The addition of high aromatic FCC SLO and the place of its injection was reported to inhibit sediment formation. The addition of FCC HCO was also announced to have a diminishing effect on sedimentation. Some vacuum residues were communicated to have a low propensity to sedimentation, whereas others were reported to have a high amenity to form precipitates. The exact reason for this behavior is still not well defined.
In the current study, it was found that the sedimentation in a commercial H-Oil hydrocracking plant is exponentially decreased when the FCC SLO is injected in the H-Oil feed. The FCC HCO was not determined to have a diminishing effect on sedimentation in contrast to some research reports. The vacuum residue blend composition was also found to have influence on the sediment formation rate. The vacuum residue from Basra Med has a reduction effect on sedimentation while the vacuum residues from El Bouri and CPC crude oils promote it. Resins and asphaltenes were found to conduce to the formation of precipitants, while sulfur depresses it.
ICrA as a statistical tool was availed to evaluate the presence or absence of statistically meaningful relations between the sediment content in heavy hydrocracked oils. It determined that the FCC SLO had a negative consonance with the sediment content of hydrocracked atmospheric residue. It also determined that El Bouri crude had a positive consonance with the sedimentation. The multiple correlation analysis found that in addition to El Bouri the vacuum residues from the crude oils CPC and Basra Med have also a statistically meaningful effect on sedimentation as a combination effect of these three vacuum residues on precipitate formation.
Author Contributions
Conceptualization, D.S. and I.S.; methodology, R.D. and V.T.; software, V.B.; validation, S.S., E.S. and K.A.; formal analysis, R.N.; investigation, A.V. and P.K.; resources, D.Y.; data curation, S.V.; writing—original draft preparation, D.S. and I.S.; writing—review and editing, D.S. and I.S.; supervision, I.S.; project administration, R.N. All authors have read and agreed to the published version of the manuscript.
Funding
This research was funded by Prof. Dr. Asen Zlatarov University–Burgas, Project: Study of the process of inhibiting the precipitation of asphaltenes in petroleum fluids by chemical additives, No NIH-502/2024.
Data Availability Statement
Data are contained within the article.
Conflicts of Interest
Authors Ivelina Shiskova, Dicho Stratiev and Rosen Dinkov were employed by LUKOIL Neftohim Burgas. The remaining authors declare that the research was conducted in the absence of any commercial or financial relationships that could be construed as a potential conflict of interest.
Nomenclature
| ATB | Atmospheric tower bottom |
| CAR | Catalyst addition rate, g/t feed |
| C5-asp | Content of asphaltenes insoluble in n-pentane, wt.% |
| C7-asp | Content of asphaltenes insoluble in n-heptane, wt.% |
| CCR | Conradson carbon residue |
| FCC | Fluid catalytic cracking |
| HCO | Heavy cycle oil |
| ICrA | Intercriteria analysis |
| LNB | LUKOIL Neftohim Burgas Refinery |
| N | Nitrogen content |
| PBFO | Partially blended fuel oil |
| Res | Resins |
| S | Sulphur content |
| SARA | Saturates, aromatics, resins, asphaltenes |
| SLO | Slurry oil |
| TSE | Total sediments existent, wt.% |
| TSP | Total sediments potential, wt.% |
| VR | Vacuum residue |
| WABT R-1 | Weight average bed temperature of the first reactor, °C |
| WABT R-2 | Weight average bed temperature of the second reactor, °C |
| ∆T R-1 | ∆T of the first reactor, °C |
| ∆T R-2 | ∆T of the second reactor, °C |
References
- Frecon, J.; Le-Bars, D.; Rault, J. Flexible Upgrading of Heavy Feedstocks. PTQ 2019, Q1, 1–11. [Google Scholar]
- Stratiev, D.; Shishkova, I.; Dinkov, R.; Dobrev, D.; Argirov, G.; Yordanov, D. The Synergy Between Ebullated Bed Vacuum Residue Hydrocracking and Fluid Catalytic Cracking Processes in Modern Refining—Commercial Experience; Marin Drinov Publishing House of Bulgarian Academy of Sciences: Sofia, Bulgaria, 2022. [Google Scholar]
- Stanislaus, A.; Hauser, A.; Marafi, M. Investigation of the Mechanism of Sediment Formation in Residual Oil Hydrocracking Process through Characterization of Sediment Deposits. Catal. Today 2005, 109, 167–177. [Google Scholar] [CrossRef]
- Manek, E.; Haydary, J. Hydrocracking of Vacuum Residue with Solid and Dispersed Phase Catalyst: Modeling of Sediment Formation and Hydrodesulfurization. Fuel Process Technol. 2017, 159, 320–327. [Google Scholar] [CrossRef]
- Pang, W.W.; Kuramae, M.; Kinoshita, Y.; Lee, J.K.; Zhang, Y.Z.; Yoon, S.H.; Mochida, I. Plugging Problems Observed in Severe Hydrocracking of Vacuum Residue. Fuel 2009, 88, 663–669. [Google Scholar] [CrossRef]
- Sayles, S.; Ohmes, R.; Manner, R. Seven Rules of Sedimentation in Hydrocracking. PTQ 2015, Q2, 89–98. [Google Scholar]
- Li, Q.; Li, Q.; Cao, H.; Wu, J.; Wang, F.; Wang, Y. The Crack Propagation Behaviour of CO2 Fracturing Fluid in Unconventional Low Permeability Reservoirs: Factor Analysis and Mechanism Revelation. Processes 2025, 13, 159. [Google Scholar] [CrossRef]
- Li, Q.; Li, Q.; Wu, J.; Li, X.; Li, H.; Cheng, Y. Wellhead Stability During Development Process of Hydrate Reservoir in the Northern South China Sea: Evolution and Mechanism. Processes 2025, 13, 40. [Google Scholar] [CrossRef]
- Sundaram, K.M.; Mukherjee, U.; Baldassari, M. Thermodynamic Model of Sediment Deposition in the LC-FINING Process. Energy Fuels 2008, 22, 3226–3236. [Google Scholar] [CrossRef]
- Andersen, S.I.; Speight, J.G. Thermodynamic models for asphaltene solubility and precipitation. J. Pet. Sci. Eng. 1999, 22, 53–66. [Google Scholar] [CrossRef]
- Hernández, E.A.; Lira-Galeana, C.; Ancheyta, J. Analysis of Asphaltene Precipitation Models from Solubility and Thermodynamic-Colloidal Theories. Processes 2023, 11, 765. [Google Scholar] [CrossRef]
- Rogel, E. Theoretical estimation of the solubility parameter distributions of asphaltenes, resins, and oils from crude oils and related materials. Energy Fuels 1997, 11, 920–925. [Google Scholar] [CrossRef]
- Gray, M.R. Upgrading Oilsands Bitumen and Heavy Oil; The University of Alberta Press: Edmonton, AB, Canada, 2015. [Google Scholar]
- Alkafeef, S.F.; Al-Marri, S.S. Asphaltene Remediation and Improved Oil Recovery by Advanced Solvent Deasphalting Technology. ACS Omega 2023, 8, 26619–26627. [Google Scholar] [CrossRef]
- Prajapati, R.; Kohli, K.; Maity, S.K.; Garg, M.O. Coking propensity during hydroprocessing of vacuum residues, deasphalted oils, and asphaltenes. Fuel 2017, 203, 514–521. [Google Scholar] [CrossRef]
- Cabrales-Navarro, F.A.; Pereira-Almao, P. Reactivity and comprehensive kinetic modeling of deasphalted vacuum residue thermal cracking. Energy Fuels 2017, 31, 4318–4332. [Google Scholar] [CrossRef]
- Nguyen, N.T.; Kang, K.H.; Seo, P.W.; Kang, N.; Pham, D.V.; Ahn, C.; Kim, G.T.; Park, S. Hydrocracking of C5-deasphalted oil: Effects of H2 and dispersed catalysts. Pet. Chem. 2021, 61, 172–182. [Google Scholar] [CrossRef]
- Díaz-Boffelli, G.; Ancheyta, J.; Muñoz, J.A.D.; Centeno, G. Experimental study and economic analysis of heavy oil partial upgrading by solvent deasphalting-hydrotreating. Energy Fuels 2018, 32, 55–59. [Google Scholar] [CrossRef]
- Ahmed, H.S.; El-Kady, F.Y. Hydrocracking Deasphalted Oil from an Atmospheric Residuum. Energy Sources Part A 2008, 30, 247–258. [Google Scholar] [CrossRef]
- Schwalje, D.; Peer, E. Hydroprocessing and hydrocracking DAO. In Proceedings of the Annual Meeting, Marriott River Center, San Antonio, TX, USA, 19–21 March 2017. [Google Scholar]
- Suursalmi, T. Operating RHC-unit with DAO feed. In Ebullated Bed Resid Users Workshop Vancouver Canada; Shell Catalyst Technologies: Calgary, AB, Canada, 2018. [Google Scholar]
- Samano, V.; Fania Guerrero, F.; Ancheyta, J.; Trejo, F.; Dıaz, J.A.I. A batch reactor study of the effect of deasphalting on hydrotreating of heavy oil. Catal. Today 2010, 15, 264–271. [Google Scholar] [CrossRef]
- Rogel, E.; Ovalles, C.; Pradhan, A.; Leung, P.; Chen, N. Sediment Formation in Residue Hydroconversion Processes and Its Correlation to Asphaltene Behavior. Energy Fuels 2013, 27, 6587–6593. [Google Scholar] [CrossRef]
- Dreillard, M.; Marques, J.; Barbier, J.; Feugnet, F. Deep Conversion of Vacuum Residue While Limiting Sediment Formation. In Proceedings of the Petrophase Conference, The Chateaux at Deer Valley, Park City, UT, USA, 8–12 July 2018. [Google Scholar]
- Lim, S.H.; Go, K.S.; Nho, N.S.; Kim, Y.K.; Kwon, E.H.; Kim, K.H.; Lee, J.G. Reaction Characteristics and Sediment Formation of Slurry Phase Hydrocracking with Vacuum Residue in a Bench-Scale Bubble Column Reactor. J. Pet. Sci. Eng. 2021, 196, 107713. [Google Scholar] [CrossRef]
- Kunnas, J.; Ovaskainen, O.; Respini, M. Mitigate Fouling in Ebullated Bed Hydrocrackers. Hydrocarb. Process. 2010, 10, 59–64. [Google Scholar]
- Respini, M.; Ekres, S.; Wright, B.; Žajdlík, R. Strategies to Control Sediment and Coke in a Hydrocracker. PTQ 2013, Q2, 1–11. [Google Scholar]
- Chabot, J.; Shiflett, W. Residuum Hydrocracking: Chemistry and Catalysis. PTQ 2019, Q3, 1–9. [Google Scholar]
- Alonso, F.; Ancheyta, J.; Centeno, G.; Marroquín, G.; Rayo, P.; Silva-Rodrigo, R. Effect of Reactor Configuration on the Hydrotreating of Atmospheric Residue. Energy Fuels 2019, 33, 1649–1658. [Google Scholar] [CrossRef]
- Marafi, M.; Al-Barood, A.; Stanislaus, A. Effect of Diluents in Controlling Sediment Formation During Catalytic Hydrocracking of Kuwait Vacuum Residue. Pet. Sci. Technol. 2005, 23, 899–908. [Google Scholar] [CrossRef]
- Marques, J.; Maget, S.; Verstraete, J.J. Improvement of Ebullated-Bed Effluent Stability at High Conversion Operation. Energy Fuels 2011, 25, 3867–3874. [Google Scholar] [CrossRef]
- García, F.O.; Mar-Juárez, E.; Schacht Hernández, P. Controlling Sediments in the Ebullated Bed Hydrocracking Process. Energy Fuels 2012, 26, 2948–2952. [Google Scholar] [CrossRef]
- Tirado, A.; Ancheyta, J. Batch Reactor Study of the Effect of Aromatic Diluents to Reduce Sediment Formation during Hydrotreating of Heavy Oil. Energy Fuels 2018, 32, 60–66. [Google Scholar] [CrossRef]
- Silverman, B.; Sláva, J.; Gendler, J. The HCAT® Technology at Slovnaft a Year in Review. In Proceedings of the 14th International Bottom of the Barrel Conference, Madrid, Spain, 12–13 May 2016. [Google Scholar]
- Mountainland, D.; Rueter, M. Using HCAT® Technology with Vacuum Bottoms Recycle. In Proceedings of the 15th International Bottom of the Barrel Conference, Dubrovnik, Croatia, 18–19 May 2017. [Google Scholar]
- Lakhanpal, B.; Klein, D.; Leung, P.; Tombolesi, B.; Kubiak, J. Upgrading Heavy Oils with New Catalyst Technology. PTQ 2004, Q4, 41–47. [Google Scholar]
- Robert, E.; Merdrignac, I.; Rebours, B.; Harlé, V.; Kressmann, S.; Colyar, J. Contribution of Analytical Tools for the Understanding of Sediment Formation: Application to H-Oil® Process. Pet. Sci. Technol. 2003, 21, 615–627. [Google Scholar] [CrossRef]
- Marchal, C.; Uzio, D.; Merdrignac, I.; Barré, L.; Geantet, C. Study of the Role of the Catalyst and Operating Conditions on the Sediments Formation during Deep Hydroconversion of Vacuum Residue. Appl. Catal. A Gen. 2012, 411–412, 35–43. [Google Scholar] [CrossRef]
- Nguyen, T.H.; Nguyen, Q.A.; Cao, A.N.T.; Ernest, T.; Nguyen, T.B.; Pham, P.T.H.; Nguyen, T.M. Hydrodemetallization of Heavy Oil: Recent Progress, Challenge, and Future Prospects. J. Pet. Sci. Eng. 2022, 216, 110762. [Google Scholar] [CrossRef]
- Shishkova, I.; Stratiev, D.; Sotirov, S. Petroleum Chemistry and Processing Investigated by the Use of Intercriteria Analysis; Professor Marin Drinov Publishing House of Bulgarian Academy of Sciences: Sofia, Bulgaria, 2024; pp. 124–141. [Google Scholar]
- Remesat, D.; Elgahawy, Y.; Maharajh, E.; Martin, J. Anti-Fouling Additives to Improve Heavy Oil Processing, Digital Refining, PTQ Q2. 2023. Available online: https://www.digitalrefining.com/article/1002894/anti-fouling-additives-to-improve-heavy-oil-processing (accessed on 21 February 2025).
- Stratiev, D.; Nikolova, R.; Veli, A.; Shishkova, I.; Toteva, V.; Georgiev, G. Mitigation of Asphaltene Deposit Formation via Chemical Additives: A Review. Processes 2025, 13, 141. [Google Scholar] [CrossRef]
- Gragnani, A.; Putek, S. Resid Hydrocracker Produces Low-Sulfur Diesel from Difficult Feeds. Hydrocarb. Process. 2006, 85, 95–100. [Google Scholar]
- Gray, M.R.; Yarranton, H.W.; Chacón-Patiño, M.L.; Rodgers, R.P.; Bouyssiere, B.; Giusti, P. Distributed Properties of Asphaltene Nanoaggregates in Crude Oils: A Review. Energy Fuels 2021, 35, 18078–18103. [Google Scholar] [CrossRef]
- Gray, M.R.; Yarranton, H.W. Quantitative Modeling of Formation of Asphaltene Nanoaggregates. Energy Fuels 2019, 33, 8566–8575. [Google Scholar] [CrossRef]
- Khaleel, A.T.; Sisco, C.J.; Tavakkoli, M.; Vargas, F. An Investigation of the effect of asphaltene polydispersity on asphaltene precipitation and deposition tendencies. Energy Fuels 2022, 36, 8799–8808. [Google Scholar] [CrossRef]
- Rogel, E.; Ovalles, C.; Moir, M. Asphaltene chemical characterization as a function of solubility: Effects on stability and aggregation. Energy Fuels. 2012, 26, 2655–2662. [Google Scholar] [CrossRef]
- Ovalles, C.; Rogel, E.; Moir, M.E.; Brait, A. Hydroprocessing of vacuum residues: Asphaltene characterization and solvent extraction of spent slurry catalysts and the relationships with catalyst deactivation. Appl. Catal. A Gen. 2016, 532, 57–64. [Google Scholar] [CrossRef]
- Chacón-Patiño, M.L.; Rowland, S.M.; Rodgers, R.P. Advances in Asphaltene Petroleomics. Part 1: Asphaltenes Are Composed of Abundant Island and Archipelago Structural Motifs. Energy Fuels 2017, 31, 13509–13518. [Google Scholar] [CrossRef]
- Chacón-Patiño, M.L.; Rowland, S.M.; Rodgers, R.P. Advances in Asphaltene Petroleomics. Part 2: Selective Separation Method That Reveals Fractions Enriched in Island and Archipelago Structural Motifs by Mass Spectrometry. Energy Fuels 2018, 32, 314–328. [Google Scholar] [CrossRef]
- Chacón- Patiño, M.L.; Rowland, S.M.; Rodgers, R.P. Advances in Asphaltene Petroleomics. Part 3. Dominance of Island or Archipelago Structural Motif Is Sample Dependent. Energy Fuels 2018, 32, 9106–9120. [Google Scholar] [CrossRef]
- Chacón-Patiño, M.L.; Smith, D.F.; Hendrickson, C.L.; Marshall, A.G.; Rodgers, R.P. Advances in Asphaltene Petroleomics. Part 4. Compositional Trends of Solubility Subfractions Reveal That Polyfunctional Oxygen-Containing Compounds Drive Asphaltene Chemistry. Energy Fuels 2020, 34, 3013–3030. [Google Scholar] [CrossRef]
- Gray, M.R.; Chacón-Patiño, M.L.; Rodgers, R.P. Structure–Reactivity Relationships for Petroleum Asphaltenes. Energy Fuels 2022, 36, 4370–4380. [Google Scholar] [CrossRef]
- Wiehe, I.A. Asphaltene solubility and fluid compatibility. Energy Fuels. 2012, 26, 4004–4016. [Google Scholar] [CrossRef]
- ASTM D 4294-24; Standard Test Method for Sulfur in Petroleum and Petroleum Products by Energy Dispersive X-Ray Fluorescence Spectrometry. ASTM: West Conshohocken, PA, USA, 2024.
- ASTM D 6560-22; Standard Test Method for Determination of Asphaltenes (Heptane Insolubles) in Crude Petroleum and Petroleum Products. ASTM: West Conshohocken, PA, USA, 2022.
- Mitkova, M.; Stratiev, D.; Shishkova, I.; Dobrev, D. Thermal and Thermo-Catalytic Processes for Heavy Oil Conversion; Professor Marin Drinov Publishing House of Bulgarian Academy of Sciences: Sofia, Bulgaria, 2017. [Google Scholar]
- ASTM D189-24; Standard Test Method for Conradson Carbon Residue of Petroleum Products. ASTM: West Conshohocken, PA, USA, 2024.
- ASTM D 5291-21; Standard Test Methods for Instrumental Determination of Carbon, Hydrogen, and Nitrogen in Petroleum Products and Lubricants. ASTM: West Conshohocken, PA, USA, 2021.
- ISO 10307-1:2009; Petroleum Products—Total Sediment in Residual Fuel Oils Part 1: Determination by Hot Filtration. ISO: Geneva, Switzerland, 2009.
- ISO 10307-2:2009; Petroleum Products—Total Sediment in Residual Fuel Oils Part 2: Determination Using Standard Procedures for Ageing. ISO: Geneva, Switzerland, 2009.
- Atanassov, K.; Mavrov, D.; Atanassova, V. Intercriteria Decision Making: A New Approach for Multicriteria Decision Making, Based on Index Matrices and Intuitionistic Fuzzy Sets. In Issues in Intuitionistic Fuzzy Sets and Generalized Nets, 11; Atanassov, K., Kacprzyk, J., Krawczak, M., Szmidt, E., Eds.; Warsaw School of Information Technology: Warsaw, Poland, 2014; pp. 1–8. [Google Scholar]
- Atanassov, K.; Atanassova, V.; Gluhchev, G. Intercriteria analysis: Ideas and problems. Notes Intuitionistic Fuzzy Sets 2015, 21, 81–88. [Google Scholar]
- Mavrov, D. Software for InterCriteria Analysis: Implementation of the Main Algorithm. Notes Intuitionistic Fuzzy Sets 2015, 21, 77–86. [Google Scholar]
- Mavrov, D. Software for Intercriteria Analysis: Working with the Results. Annu. Inform. Sect. Union Sci. Bulg. 2015, 8, 37–44. [Google Scholar]
- Ikonomov, N.; Vassilev, P.; Roeva, O. ICrAData—Software for InterCriteria Analysis. Int. J. Bioautoma. 2018, 22, 1–10. [Google Scholar] [CrossRef]
- Adams, J.J.; Rovani, J.F.; Planche, J.P.; Loveridge, J.; Literati, A.; Shishkova, I.; Palichev, G.; Kolev, I.; Atanassov, K.; Nenov, S.; et al. SAR-AD Method to Characterize Eight SARA Fractions in Various Vacuum Residues and Follow Their Transformations Occurring during Hydrocracking and Pyrolysis. Processes 2023, 11, 1220. [Google Scholar] [CrossRef]
- van den Berg, F.G.A.; Kapusta, S.D.; Ooms, A.C.; Smith, A.J. Fouling and Compatibility of Crudes as Basis for a New Crude Selection Strategy. Pet. Sci. Technol. 2003, 21, 557–568. [Google Scholar] [CrossRef]
Disclaimer/Publisher’s Note: The statements, opinions and data contained in all publications are solely those of the individual author(s) and contributor(s) and not of MDPI and/or the editor(s). MDPI and/or the editor(s) disclaim responsibility for any injury to people or property resulting from any ideas, methods, instructions or products referred to in the content. |
© 2025 by the authors. Licensee MDPI, Basel, Switzerland. This article is an open access article distributed under the terms and conditions of the Creative Commons Attribution (CC BY) license (https://creativecommons.org/licenses/by/4.0/).