Abstract
This paper aims to investigate the flow characteristics of the primary side fluid in a casing once-through steam generator (COTSG) under vertical conditions, providing theoretical support for its design in nuclear power plants. The study employs the three-dimensional CFD software STAR-CCM+, utilizing the Reynolds stress transport turbulent model for numerical simulations, and presents a method for determining the fully developed section of the heat transfer channel based on dimensionless velocity overlap analysis (entrance length L∗ = 80 De). Through analysis, the frictional resistance characteristic curve of the spiral channel with coiled wire is divided into three regions: laminar region, transition region, and turbulent region. Over a Reynolds number range of 1000–30,000 and heat transfer powers of 1–30 kW, an expression between the frictional resistance coefficient and the Reynolds number for the spiral channel with coiled wire is established, achieving a prediction error within ±10% through a kinematic viscosity correction factor (ct) accounting for heat transfer effects. This paper conducts a detailed study of the fully developed fluid in the spiral channel with coiled wire, revealing significant axial variations in the frictional resistance coefficient and identifying distinct velocity distribution patterns in different flow regimes (maximum velocity in central sub-channels for laminar/transition regions vs. boundary sub-channels for turbulent regions). The critical Reynolds number for laminar-to-turbulent transition increases with higher heat transfer powers, demonstrating the stabilizing effect of enhanced cooling on flow regimes. These findings provide quantitative criteria for optimizing heat exchanger design under vertical operating conditions with varying thermal loads.
1. Introduction
The development and application of nuclear energy are crucial for enhancing a nation’s comprehensive competitiveness [1]. With continuous advancements in the field of nuclear science, designing more compact and sophisticated nuclear power plants to meet diverse military strategic needs has become a current research hotspot. In the process of miniaturizing nuclear power plants, the miniaturization of steam generators has become a key link in achieving compact nuclear energy devices. To develop a smaller-sized steam generator with enhanced heat transfer performance without compromising the thermal exchange efficiency of the primary and secondary sides has become a new trend in design innovation. The casing once-through steam generator, known for its compact structure and high heat transfer efficiency, serves as a “key hub” for heat transfer between the primary and secondary sides of miniaturized nuclear power plants and is increasingly becoming a focus of scientific research. For the casing once-through steam generator, the key flow channel is the spiral channel with coiled wire. Therefore, studying the thermohydraulic characteristics of the spiral channel with coiled wire is essential for a thorough understanding of the operating mechanism of the casing once-through steam generator.
In recent years, numerous scholars have conducted extensive research on the resistance characteristics of fluids in spiral channels. Based on extensive experimental data, Cheng and Todreas [2] developed multiple calculation models for the friction factor in wire-wrapped spiral channels, providing significant reference value for subsequent research. Furthermore, they proposed empirical formulas for the Reynolds number transition points from laminar to transitional flow and from transitional to turbulent flow, and provided methods for calculating the friction factor for fluids under different flow regimes. Gu [3] conducted numerical simulations and experimental studies to investigate the mechanism of vortex flow in complex channels for enhancing heat transfer, exploring the impact of different structures and layouts on heat transfer performance; thus, providing a theoretical basis and technical support for the design and optimization of spiral baffle electric heaters and twisted elliptical tube heat exchangers. The geometric structure of spiral channels has a significant impact on the flow characteristics of fluids. Ghobadi et al. [4] found that in small-scale spiral channels, an increase in the curvature of the spiral leads to an increase in pressure drop under low Reynolds number conditions, indicating that the disturbance of the fluid in the pipe is enhanced, thereby increasing the pressure drop. Zhang et al. [5] observed the flow behavior of fluids in rectangular cross-section spiral channels through experiments. They noted that due to the effects of centrifugal and torsional forces, the axial velocity of the fluid reaches its peak near the outer wall of the pipe, and two significant secondary vortices are formed in the flow cross-section. Nobari et al. [6] conducted a detailed study on the role of the Richardson number in mixed convection in spiral channels. They found that under the influence of gravity, asymmetric vortices are generated inside the channel, which increases the complexity of the flow, thereby enhancing heat transfer. Starting from the specific structural parameters of the spiral channel, they analyzed the flow behavior of the fluid under laminar conditions. Compared to turbulent flow, the disorder of the fluid in laminar flow is lower, and the fluid flow in turbulent conditions exhibits more intense turbulent characteristics. According to the experimental research by Zhang et al. [5], it can be understood that in rectangular cross-section spiral channels, the disturbance intensity near the wall is higher than in the central region of the pipe. The reason why changes in the geometric parameters and internal structure of the spiral channel can significantly affect its heat transfer efficiency is that these adjustments alter the centrifugal and buoyancy forces experienced by the fluid, and these changes further affect the dynamics and distribution patterns of vortices and secondary flows. This impact directly relates to the disturbance level of the fluid and the thickness of the boundary layer, thereby affecting the performance of heat transfer. Liu et al. [7] conducted numerical simulations to study the thermo-fluid characteristics of liquid lead-bismuth eutectic mixtures in single spiral coils. They first verified the accuracy of the simulation method, then analyzed the effects of spiral coil spacing and flow conditions on fluid flow and heat transfer characteristics and proposed empirical relationships for predicting fluid resistance and convective heat transfer coefficients. These results are significant for the design and evaluation of the safety and economy of advanced nuclear reactors using spiral channels. Wang et al. [8] conducted numerical simulations to study the thermo-fluid characteristics of helium-xenon (He-Xe) gas mixtures in 2 × 2 rod bundles with spiral wires. The study found that the presence of spiral wires forms vortices and changes the velocity and temperature distribution of the coolant, leading to hot spots at the corners where the spiral wires contact the fuel rods, with the highest temperature reaching 1600 K. The spiral wire structure increases the frictional pressure drop by 20–50% and has a reducing effect on the Nusselt number. Different spiral wire spacings and quantities have different impacts on the thermo-fluid characteristics. Yang [9] studied the enhancement of heat transfer characteristics of molten salt FLiBe using fully conformal triangular spiral wires in an annular channel. He conducted numerical simulations to analyze the flow and heat transfer characteristics under different spiral spacings, annular widths, and Reynolds numbers (4000–10,000). The study found that adding triangular spiral wires significantly reduces the length of the flow and heat transfer entrance regions and generates vortices. Yuan et al. [10] conducted numerical simulations to study the fluid flow and heat transfer characteristics of fuel assemblies with hybrid-mode spiral wires in fast neutron reactors. Using the standard k-ε model in ANSYS Fluent (Ver.19.0) to simulate fluid flow and heat transfer processes, they studied the effects of different wire winding directions and quantities on the coolant temperature field, flow field, and pressure drop. The results showed that compared to traditional modes, the hybrid mode can make the coolant temperature distribution more uniform, reduce the highest temperature, and decrease the pressure drop by about 10%. Moreover, the hybrid mode can increase the power density without increasing the power consumption of the main pump, helping to improve the natural circulation capability of the reactor and reduce the requirements for materials. Saha et al. used a single-phase model to investigate the flow and heat transfer characteristics of Al2O3-water and TiO2-water nanofluids in horizontal pipes [11]. They also conducted a numerical analysis of the heat transfer behavior of Al2O3 and TiO2 nanofluids in circular pipes under turbulent flow conditions [12]. The research found that smaller nanoparticle sizes and higher volume concentrations could significantly improve heat transfer efficiency [13]. The research results provide a theoretical basis for optimizing the heat transfer performance of nanofluids in practical applications [14]. They also studied the enhancement of heat transfer in horizontal pipes using hexagonal perforated tube inserts. Through numerical simulation, the flow and heat transfer behavior under different diameter ratios and Reynolds numbers were analyzed, and it was found that such inserts could significantly increase the Nusselt number, thereby improving heat exchange efficiency [15]. Golam [16] investigated the thermohydraulic performance of plain tubes with different cross-sectioned wire coils under turbulent flow conditions. Through experimental and numerical methods, the study examined the impacts of various wire coil distributions and cross-sectional shapes on heat transfer and friction factors. The results show that the addition of wire coils significantly enhances heat transfer efficiency. Among the various configurations tested, the star-shaped cross-section wire coil provides the highest heat transfer enhancement, while the triangular cross-section has the lowest performance evaluation criterion. He concludes that the cross-sectional shape of the wire coil significantly affects the hydrothermal performance, offering valuable insights for heat exchanger design. Mousavi Ajarostaghi et al. [17] conducted a numerical evaluation of the impact of using an innovative spiral turbulator on the thermal performance of a helical double-pipe heat exchanger. The study investigated the effects of the turbulator on heat transfer and fluid flow, revealing that the use of the spiral turbulator significantly enhances the thermal performance by increasing the Nusselt number and reducing pressure drop. Ali et al. [18] explored the performance improvement of high voltage direct current (HVDC) devices using a novel vortex-generating heat sink design. The study investigated the impact of the new heat sink design on the thermal management of HVDC devices, demonstrating enhanced heat dissipation and improved overall device performance. The research provides valuable insights for the design and optimization of cooling solutions in HVDC systems, contributing to more efficient and reliable operation. Jasim et al. [19] conducted a numerical examination of the hydrothermal behavior of hybrid nanofluid flow in shell and double coil heat exchangers. The study analyzed the heat transfer and fluid flow characteristics of two distinct shell-and-coil heat exchangers with specialized designs, using water-based hybrid nanofluids such as Water/MgO-TiO2 and Ag-HEG/water. The results showed that the unique geometry with Water/Ag-HEG achieved the highest thermal performance across all examined Reynolds numbers, with significant improvements in thermal efficiency compared to pure water. Elboughdiri et al. [20] conducted a numerical analysis of the thermohydraulic performance of corrugated spiral tubes with diverse arc corrugation configurations. The study investigated the impact of different corrugation parameters, such as height, width, and spacing, on the thermal hydraulic performance of the tubes. The results showed that the corrugation parameters significantly affected the performance, with certain configurations leading to enhanced heat transfer efficiency. The research provides valuable insights for the design and optimization of corrugated spiral tubes in heat exchangers. Xu et al. [21] conducted numerical simulations using ANSYS Fluent software to study the thermo-fluid characteristics of rod bundles with spiral wires in fourth-generation nuclear power reactors. They compared the effects of circular and wing-shaped spiral wires on fluid flow and heat transfer, using the Shear Stress Transport (SST) k-ω model and the Reynolds stress model (RSM) for simulations, and ultimately concluded that the RSM model is more suitable for numerical calculations of such problems. The results showed that, compared to circular wires, wing-shaped wires can reduce frictional pressure drop, improve the uniformity of temperature distribution, reduce hot spot temperatures, and demonstrate better overall performance in performance evaluation standards. This paper conducts numerical studies on the primary side coolant flow channels with rectangular spiral wires in steam generators. By comparing the simulation results of different turbulence models with experimental data, it was found that the Reynolds stress transport (RST) model in STAR-CCM+ is the most consistent with experimental results. Therefore, in the CFD numerical simulations of this paper, the RST model is used to study the thermohydraulic characteristics of the spiral channel with coiled wire.
Despite extensive research on spiral channel hydrodynamics, critical gaps remain in understanding vertical flow behavior under variable thermal loads. Existing studies primarily focus on horizontal or adiabatic conditions, neglecting the combined effects of gravitational orientation and heat transfer on frictional resistance—a key concern in compact nuclear steam generators. Furthermore, current friction factor correlations lack viscosity corrections for cooled channels, resulting in high prediction errors in high-heat-flux scenarios. To address these gaps, this study focuses on the flow characteristics of the primary side spiral channel with coiled wire in the casing once-through steam generator, using a combination of experimental research and numerical simulation with three-dimensional CFD software STAR-CCM+ 18.04 for analysis. CFD numerical simulations provide a more detailed study of the flow field within the spiral channel, while experimental research ensures the accuracy of the numerical simulations. The two methods complement each other and are indispensable. Through this study, we have derived an expression for the frictional resistance coefficient of the spiral channel with coiled wire under various operating conditions, which will provide important theoretical support for the design and safe operation of miniaturized nuclear power plants. This study investigates the flow characteristics within the spiral channel with coiled wire on the primary side of a casing once-through steam generator. By analyzing the criteria for determining the fully developed section of the cooling channel, numerical simulations are conducted on the fluid flow within the fully developed section of the spiral channel with coiled wire. The variation of the frictional resistance coefficient under vertical conditions is examined. Based on these results, the simulation data are integrated and analyzed, and a kinematic viscosity correction factor is introduced to develop an expression for the frictional resistance coefficient applicable to various operating conditions. This study further investigates the flow resistance characteristics along the direction of fluid flow in the heat-exchange spiral channel. The present work systematically investigates the flow characteristics of a coiled wire spiral channel under vertical conditions, with a focus on bridging the gap between idealized models and real-world nuclear reactor constraints.
2. Experimental Facility
To investigate the flow characteristics of the primary side spiral flow channel with coiled wire in the casing once-through steam generator, cold-state experiments were conducted on a thermohydraulic test bench with the spiral channel with coiled wire as the experimental section. The experimental data obtained were used for model validation to ensure the accuracy of numerical simulations. Due to limitations in experimental conditions, currently, only cold-state experiments can be performed on the experimental section of the spiral channel with coiled wire. For the validation of numerical models involving heat transfer conditions, the author conducted relevant studies in the heat transfer experimental section of the rod bundle channel [22] and integrated the results to ensure the accuracy of the numerical research findings presented in this paper.
The experimental facility consists of a thermohydraulic experimental loop and an instrumental measurement system. The experimental loop is capable of simulating the thermohydraulic characteristics of the spiral channel with coiled wire under cold-state conditions, while the instrumental measurement system can monitor parameters such as temperature, flow rate, and pressure in the experimental loop in real time.
2.1. Experimental Loop
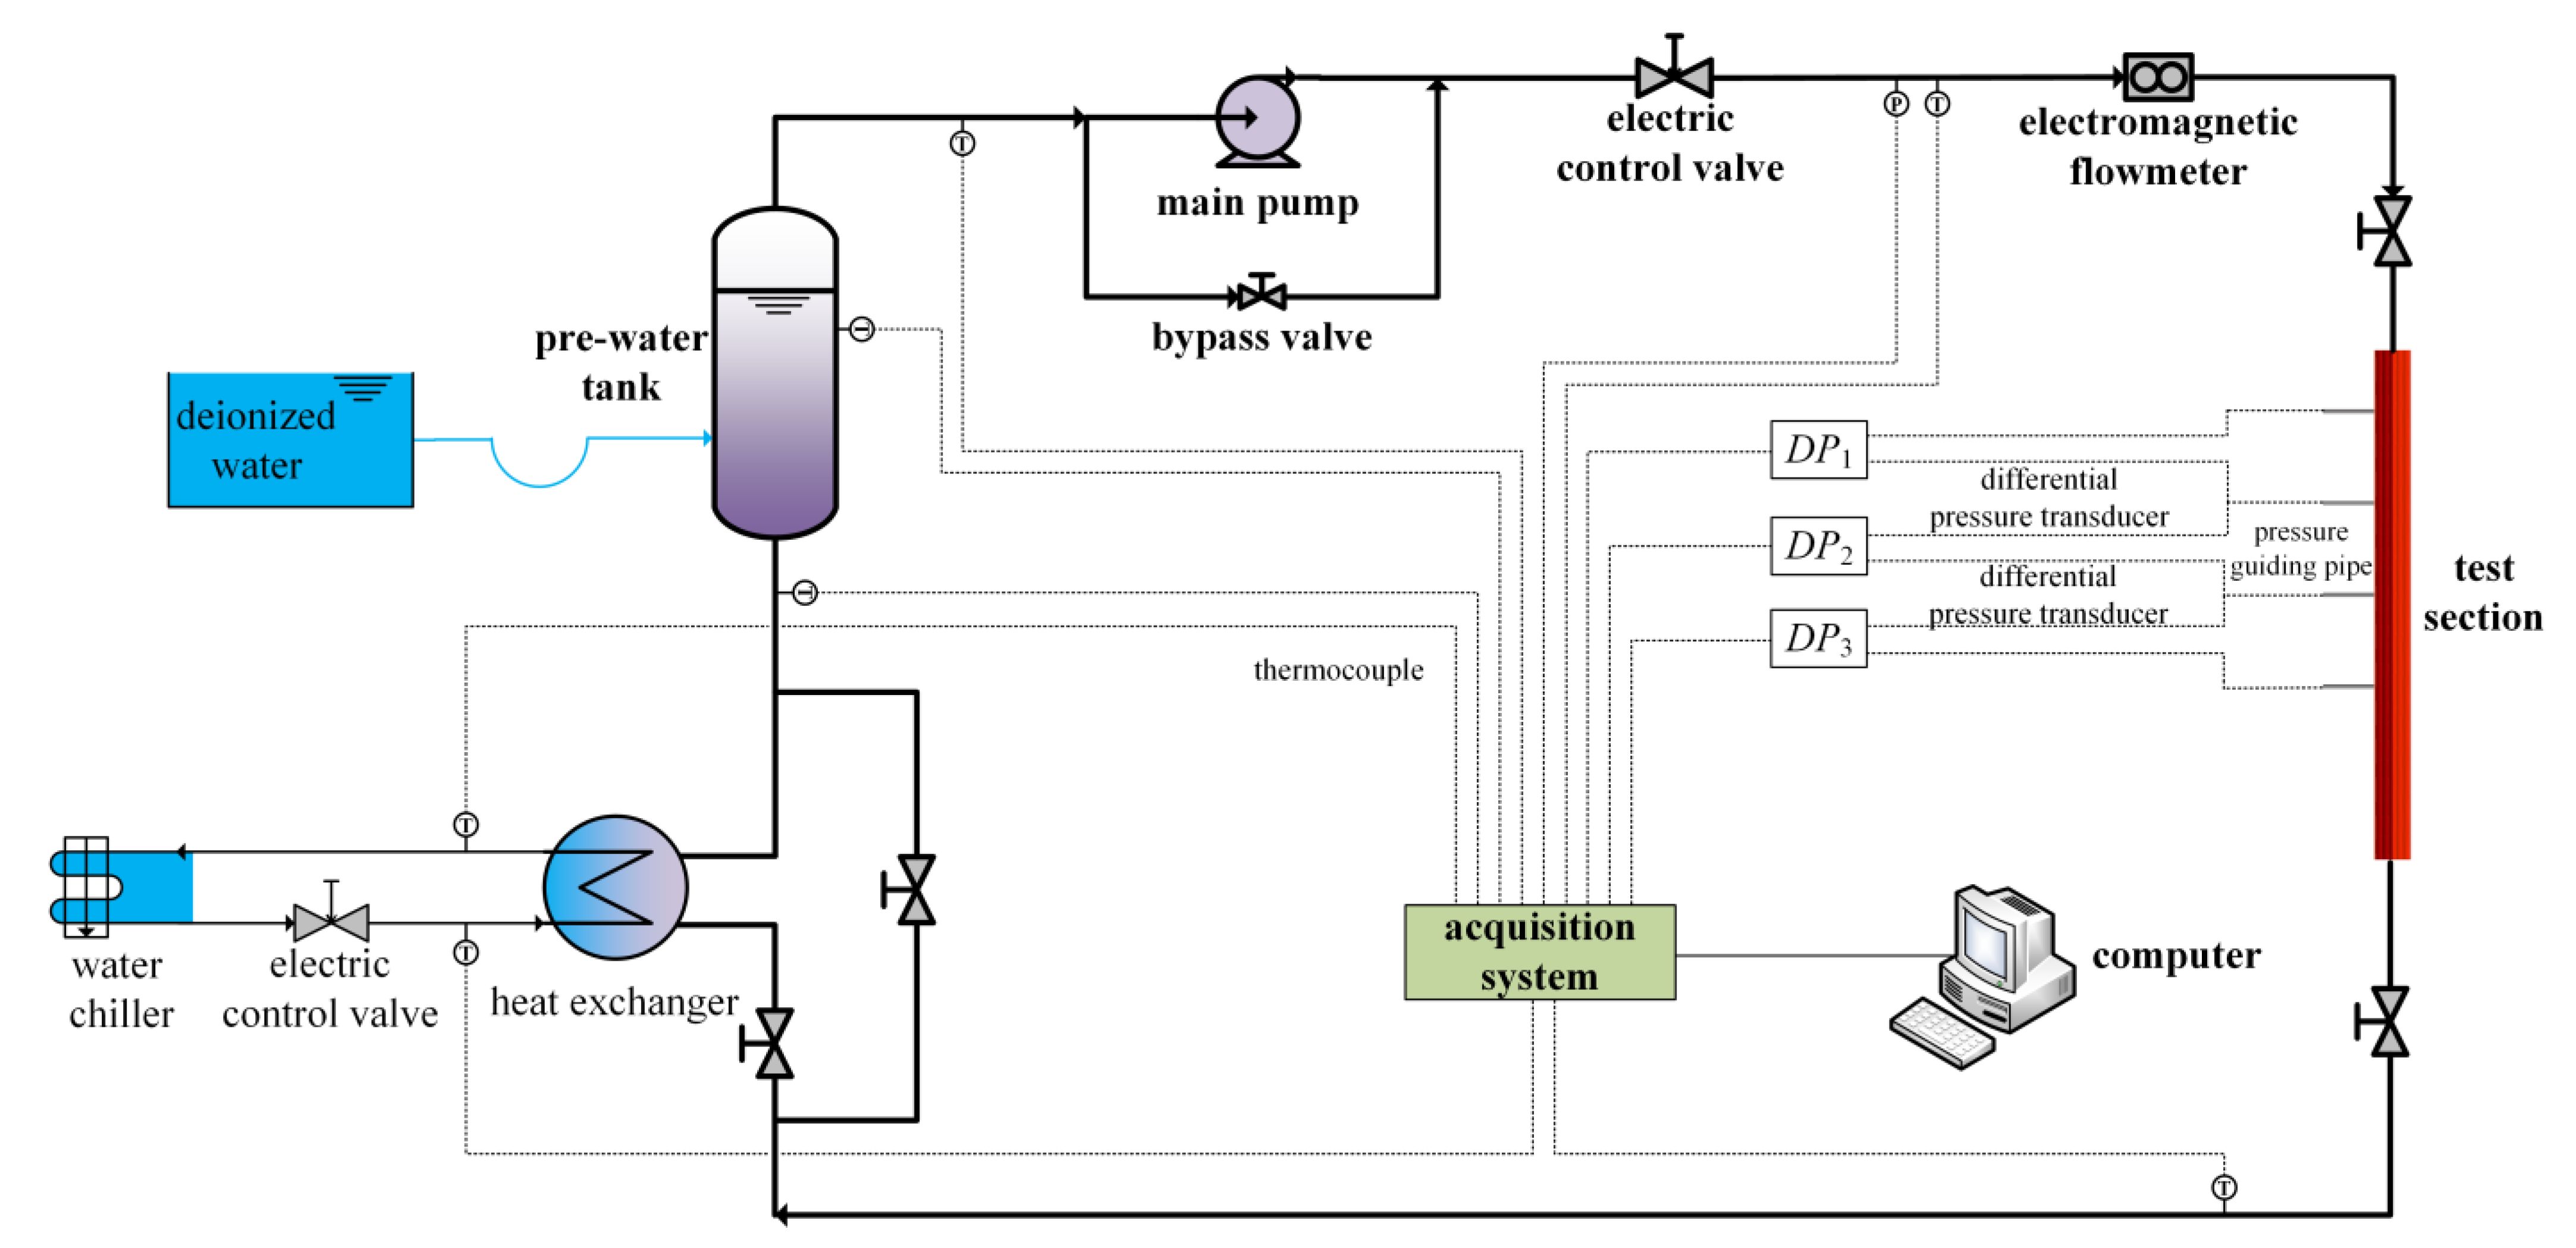
The operation process of the experimental loop system for the spiral channel with coiled wire is shown in Figure 1. The main loop is designed with a pressure of 0.35 MPa and a temperature of 70 °C. The main loop consists of a main pump, a heat exchanger, a pre-water tank, an experimental section, an electromagnetic flowmeter, several valves, and connecting pipes between the equipment. The water flow in the main loop can be adjusted by changing the opening degree of the electric control valve. The temperature of the fluid at the inlet of the experimental section of the spiral channel with coiled wire can be regulated by controlling the temperature of the fluid in the pre-water tank. There are four pressure guiding pipes in the experimental section of the spiral channel with coiled wire, which can measure the pressure drop of the channel. During the experiment, the fluid is preheated to the specified temperature in the pre-water tank. The main pump is then started, and once a stable circulation of the fluid in the main loop is established, the experiment can begin. The experimental fluid (water) flows out from the outlet of the main pump, passes through the electric control valve and the electromagnetic flowmeter in sequence, and then enters the experimental section. The flow field of the primary side spiral channel with coiled wire in the casing once-through steam generator is simulated in the experimental section. The fluid flows downward and exits through the outlet pipe of the experimental section, then returns to the main pump through the connecting pipes, thereby forming a closed loop. Throughout the experiment, important parameters such as the temperature, flow rate, pressure, and pressure drop of the fluid in the experimental loop system are measured simultaneously and displayed in the data acquisition system, as shown in the specific measurement points in Figure 1.
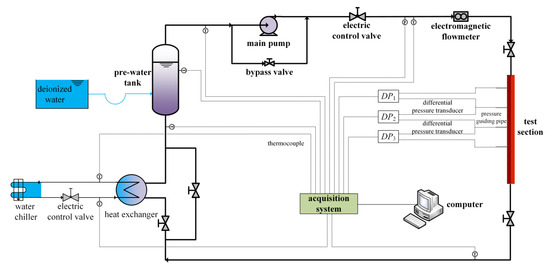
Figure 1.
Thermal hydraulic experimental facility for coiled wire spiral channel.
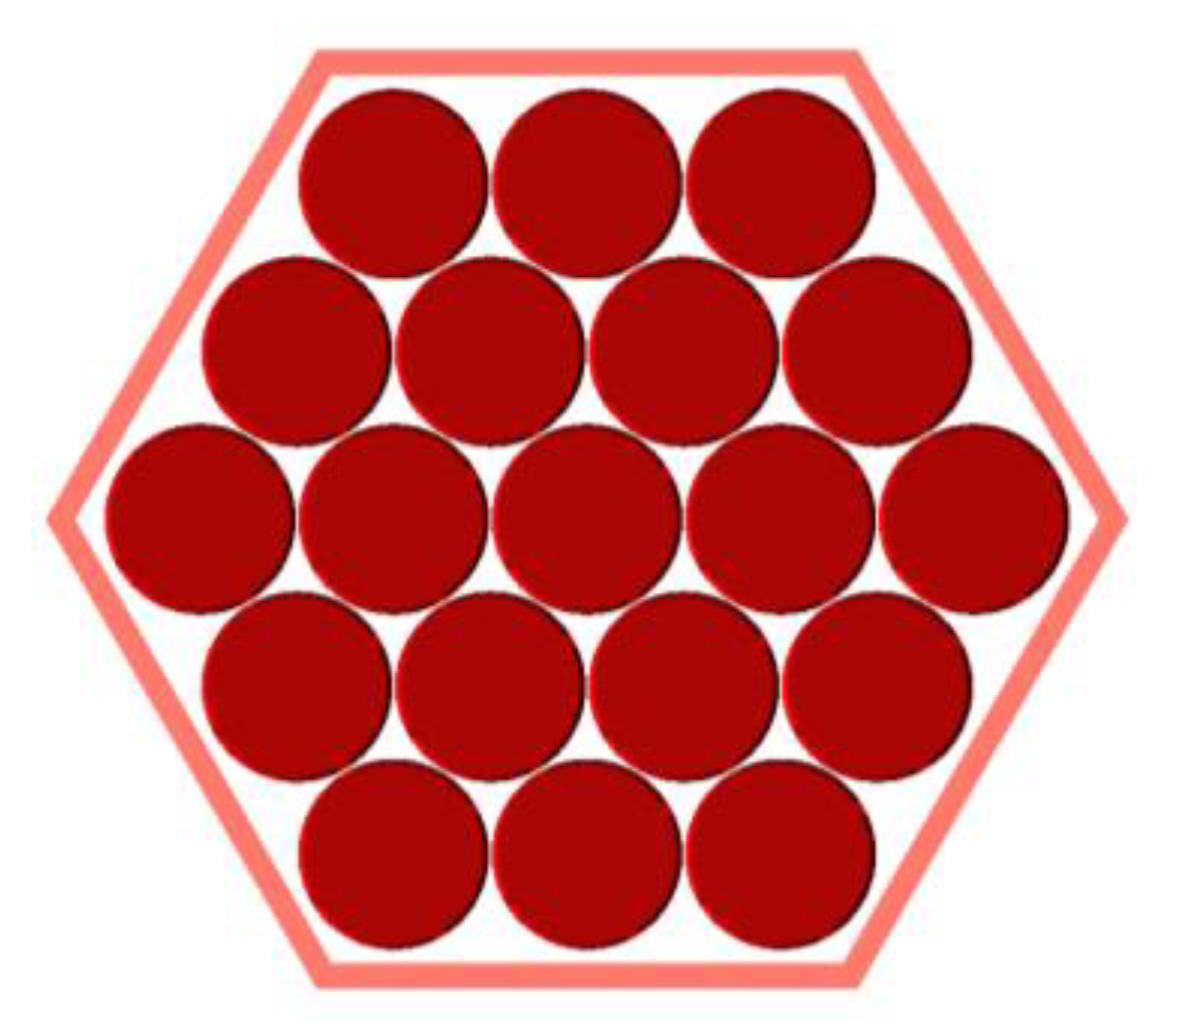
The core component of the experimental loop is the test section of the spiral channel with coiled wire. This test section is divided into two main parts: the pressure-bearing shell and the tube bundle. The pressure-bearing shell is primarily composed of a hexagonal channel and metal fittings, with a grid plate at the inlet section to stabilize the flow. The tube bundle consists of 19 acrylic rods, each wrapped with FEP material to form coiled wires, arranged tangentially and positioned within the hexagonal channel using simplified grids, as shown in Figure 2. The flow area of the spiral channel with the coiled wire test section is A = 1139.4 mm2 and its cross-sectional schematic is shown in Figure 3.

Figure 2.
Schematic of tube bundle.
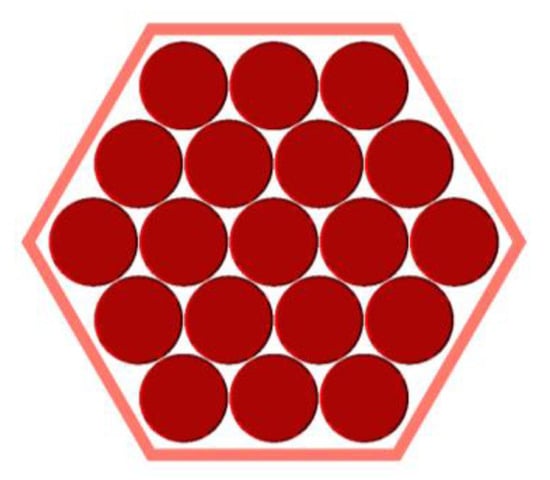
Figure 3.
Cross-sectional structure diagram of the spiral channel with coiled wire.
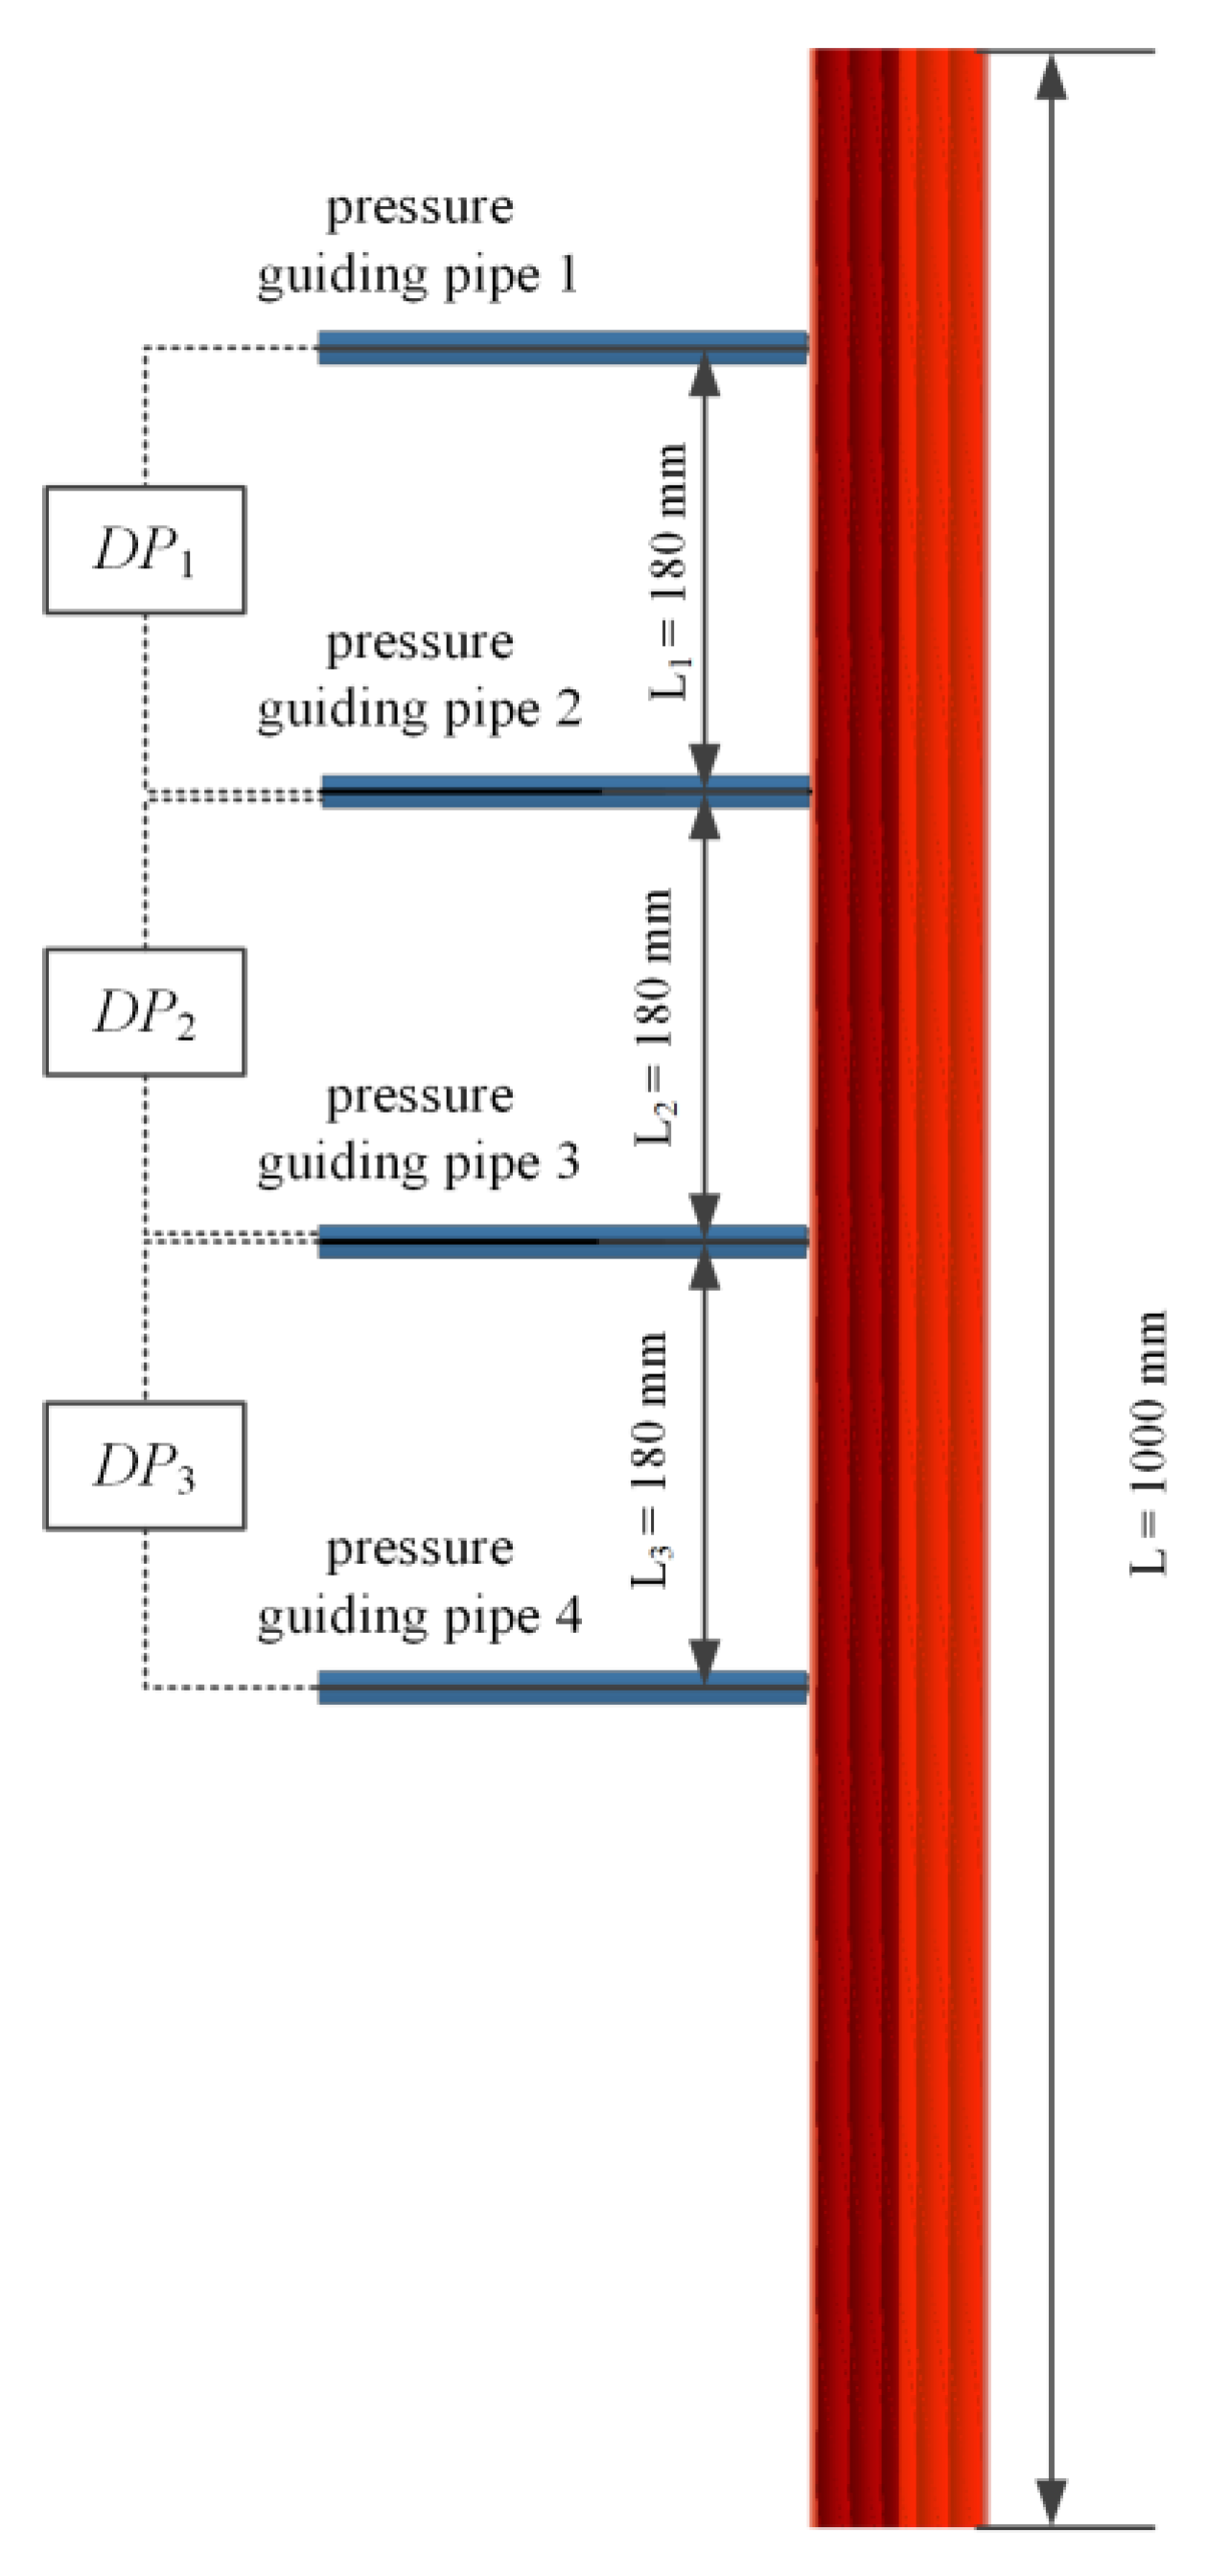
To monitor the pressure drop changes of the fluid within the spiral channel with coiled wire in real time, four pressure guiding pipes were installed on the test section. In this study, all pressure measurement points are located along the same vertical direction. The total length of the channel is L = 1000 mm, and each pressure measurement segment is 180 mm long, as shown in Figure 4. Cold-state thermal hydraulic experiments were conducted using the aforementioned test section to lay the groundwork for the subsequent numerical simulation studies, ensuring the reliability of the numerical simulation results.
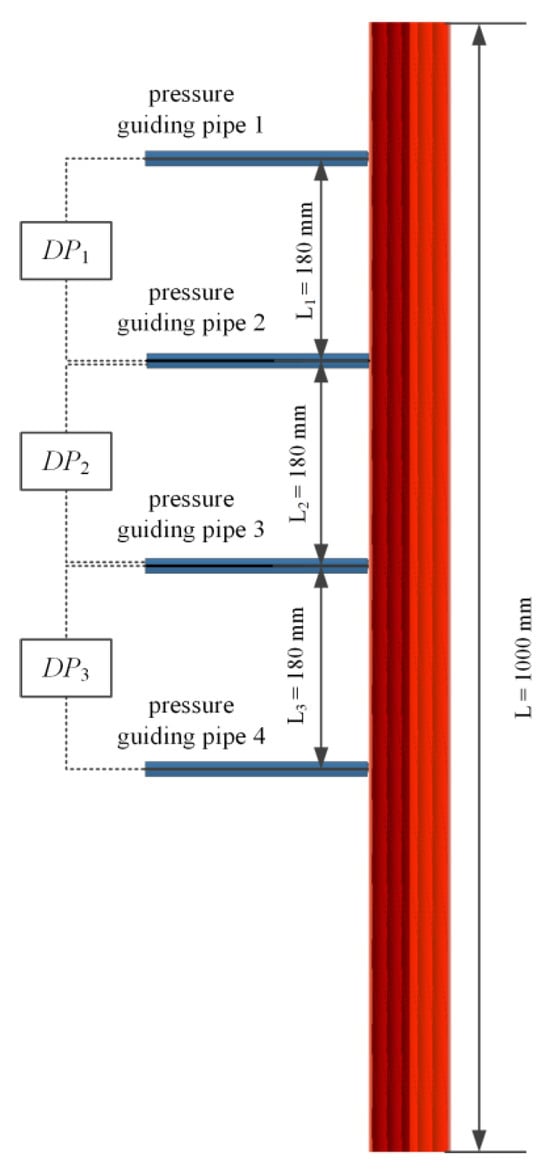
Figure 4.
Layout of pressure measurement points in the spiral channel with coiled wire.
2.2. Instrumentation Systems
The fluid velocity within the test section of the spiral channel with coiled wire is measured using an electromagnetic flowmeter. The thermocouples used for measuring the fluid temperature in the experimental loop are K-type armored thermocouples. The pressure drop inside the test section is measured by differential pressure transducers. All measurement data are recorded by the National Instruments (NI) data acquisition system. Table 1 provides detailed information on the measured parameters and the corresponding instrument errors.

Table 1.
Measurement parameters and instrumentation errors [23].
During the experiment, the system flow rate is controlled by continuously monitoring the flow measurement data and adjusting the opening of the relevant loop valves, ensuring that the flow rate in the test section remains within the permissible range. The system temperature is controlled by continuously monitoring the temperature measurement points and adjusting the flow rate of the cooling water loop, ensuring that the fluid temperature in the test section remains within the permissible range.
2.3. Uncertainty Analysis
This paper primarily investigates the flow resistance characteristics within a spiral channel with coiled wire, with a particular focus on the Reynolds number and the friction factor within the channel. The uncertainties of the Reynolds number, Re, and the friction factor, λ, can be analyzed using error propagation formulas.
The calculation method for the Reynolds number is as follows:
Here, De is the equivalent diameter in meters (m); A is the cross-sectional area of the fluid flow in square meters (m2); χ is the wetted perimeter of the flow channel in meters (m); v is the fluid velocity in meters per second (m/s); m is the mass flow rate of the fluid in kilograms per second (kg/s); ρ is the density of the fluid in kilograms per cubic meter (kg/m3); and υ is the kinematic viscosity of the fluid in square meters per second (m2/s).
According to the uncertainty analysis method described by J. P. Holman [24], the uncertainty of the Reynolds number wRe is calculated using Equation (4). The calculated uncertainty of the Reynolds number ranges from 0.05% to 0.31%.
Here, wi represents the uncertainties of the various variables in the Reynolds number, and the corresponding parameters xi represent the mass flow rate m, the kinematic viscosity of the fluid υ, the density of the fluid ρ, and the wetted perimeter of the flow channel χ.
The calculation formula for the frictional resistance coefficient λ is as follows:
The uncertainty wλ of the frictional resistance coefficient λ can be calculated using Equation (6). After derivation and calculation, the uncertainty of the frictional resistance coefficient ranges from 0.09% to 0.61%.
Here, ΔPf is the frictional pressure drop of the fluid across the pressure measurement segment DP2, in Pascals (Pa); L2 is the length of the pressure measurement segment DP2, in meters (m). wi represents the uncertainties of the independent variables in the frictional resistance coefficient, and the corresponding parameters xi represent the equivalent diameter De, the cross-sectional area of the fluid flow A, the density of the fluid ρ, the frictional pressure drop of the fluid ΔPf, the length of the pressure measurement segment DP2 L2, and the mass flow rate m.
3. Numerical Methods
To investigate the flow characteristics within the spiral channel with coiled wire, this study employs the three-dimensional CFD software STAR-CCM+ 18.04, based on the finite volume method, to perform numerical simulations of the 19 rod spiral channel test section with coiled wire under vertical conditions, as shown in Figure 1.
3.1. Mathematical Model
Computational Fluid Dynamics (CFD) is a product of the integration of modern fluid mechanics, numerical mathematics, and computer science. It provides comprehensive modeling capabilities for both incompressible and compressible fluids, as well as for laminar, transitional, and turbulent flow conditions. Three-dimensional modeling in CFD can be used to study the thermal hydraulic characteristics of various complex geometries. For the steady-state frictional resistance characteristics within the spiral channel with coiled wire studied in this paper, the governing equations for the fluid are as follows.
- Continuity Equation:
The Reynolds stress transport (RST) model is the most complex and computationally expensive Reynolds-Averaged Navier-Stokes (RANS) turbulence model in STAR-CCM+. The fluid turbulence in the spiral channel with coiled wire studied in this paper has strong anisotropy, making it suitable for numerical simulation using the RST model. The RST model, also known as the second-moment closure model, can directly calculate the components of the Reynolds stress tensor by solving the transport equations.
The RST model approximates the stress tensor as:
In the equations: ρ is the density, in units of kg/m3; is the trace of the Reynolds stress tensor; is the unit tensor.
The Reynolds stress tensor is defined as:
where, are the fluctuating velocities in the x, y, and z directions, respectively.
The RST model solves the transport equations for each component of the Reynolds stress tensor. Since the Reynolds stress transport equation inherently accounts for the effects of turbulent anisotropy, streamline curvature, swirl rotation, and high strain rates, the RST model can more accurately predict complex flows. In the Reynolds stress transport model, the transport equation for the Reynolds stress tensor is given by [25]:
where, is the mean velocity; is the Reynolds stress diffusion; is the turbulent result; is the buoyancy result; is the expansion dissipation; is the pressure strain tensor; is the turbulent dissipation rate tensor; is the user-specified source term.
3.2. Mesh Independence Verification
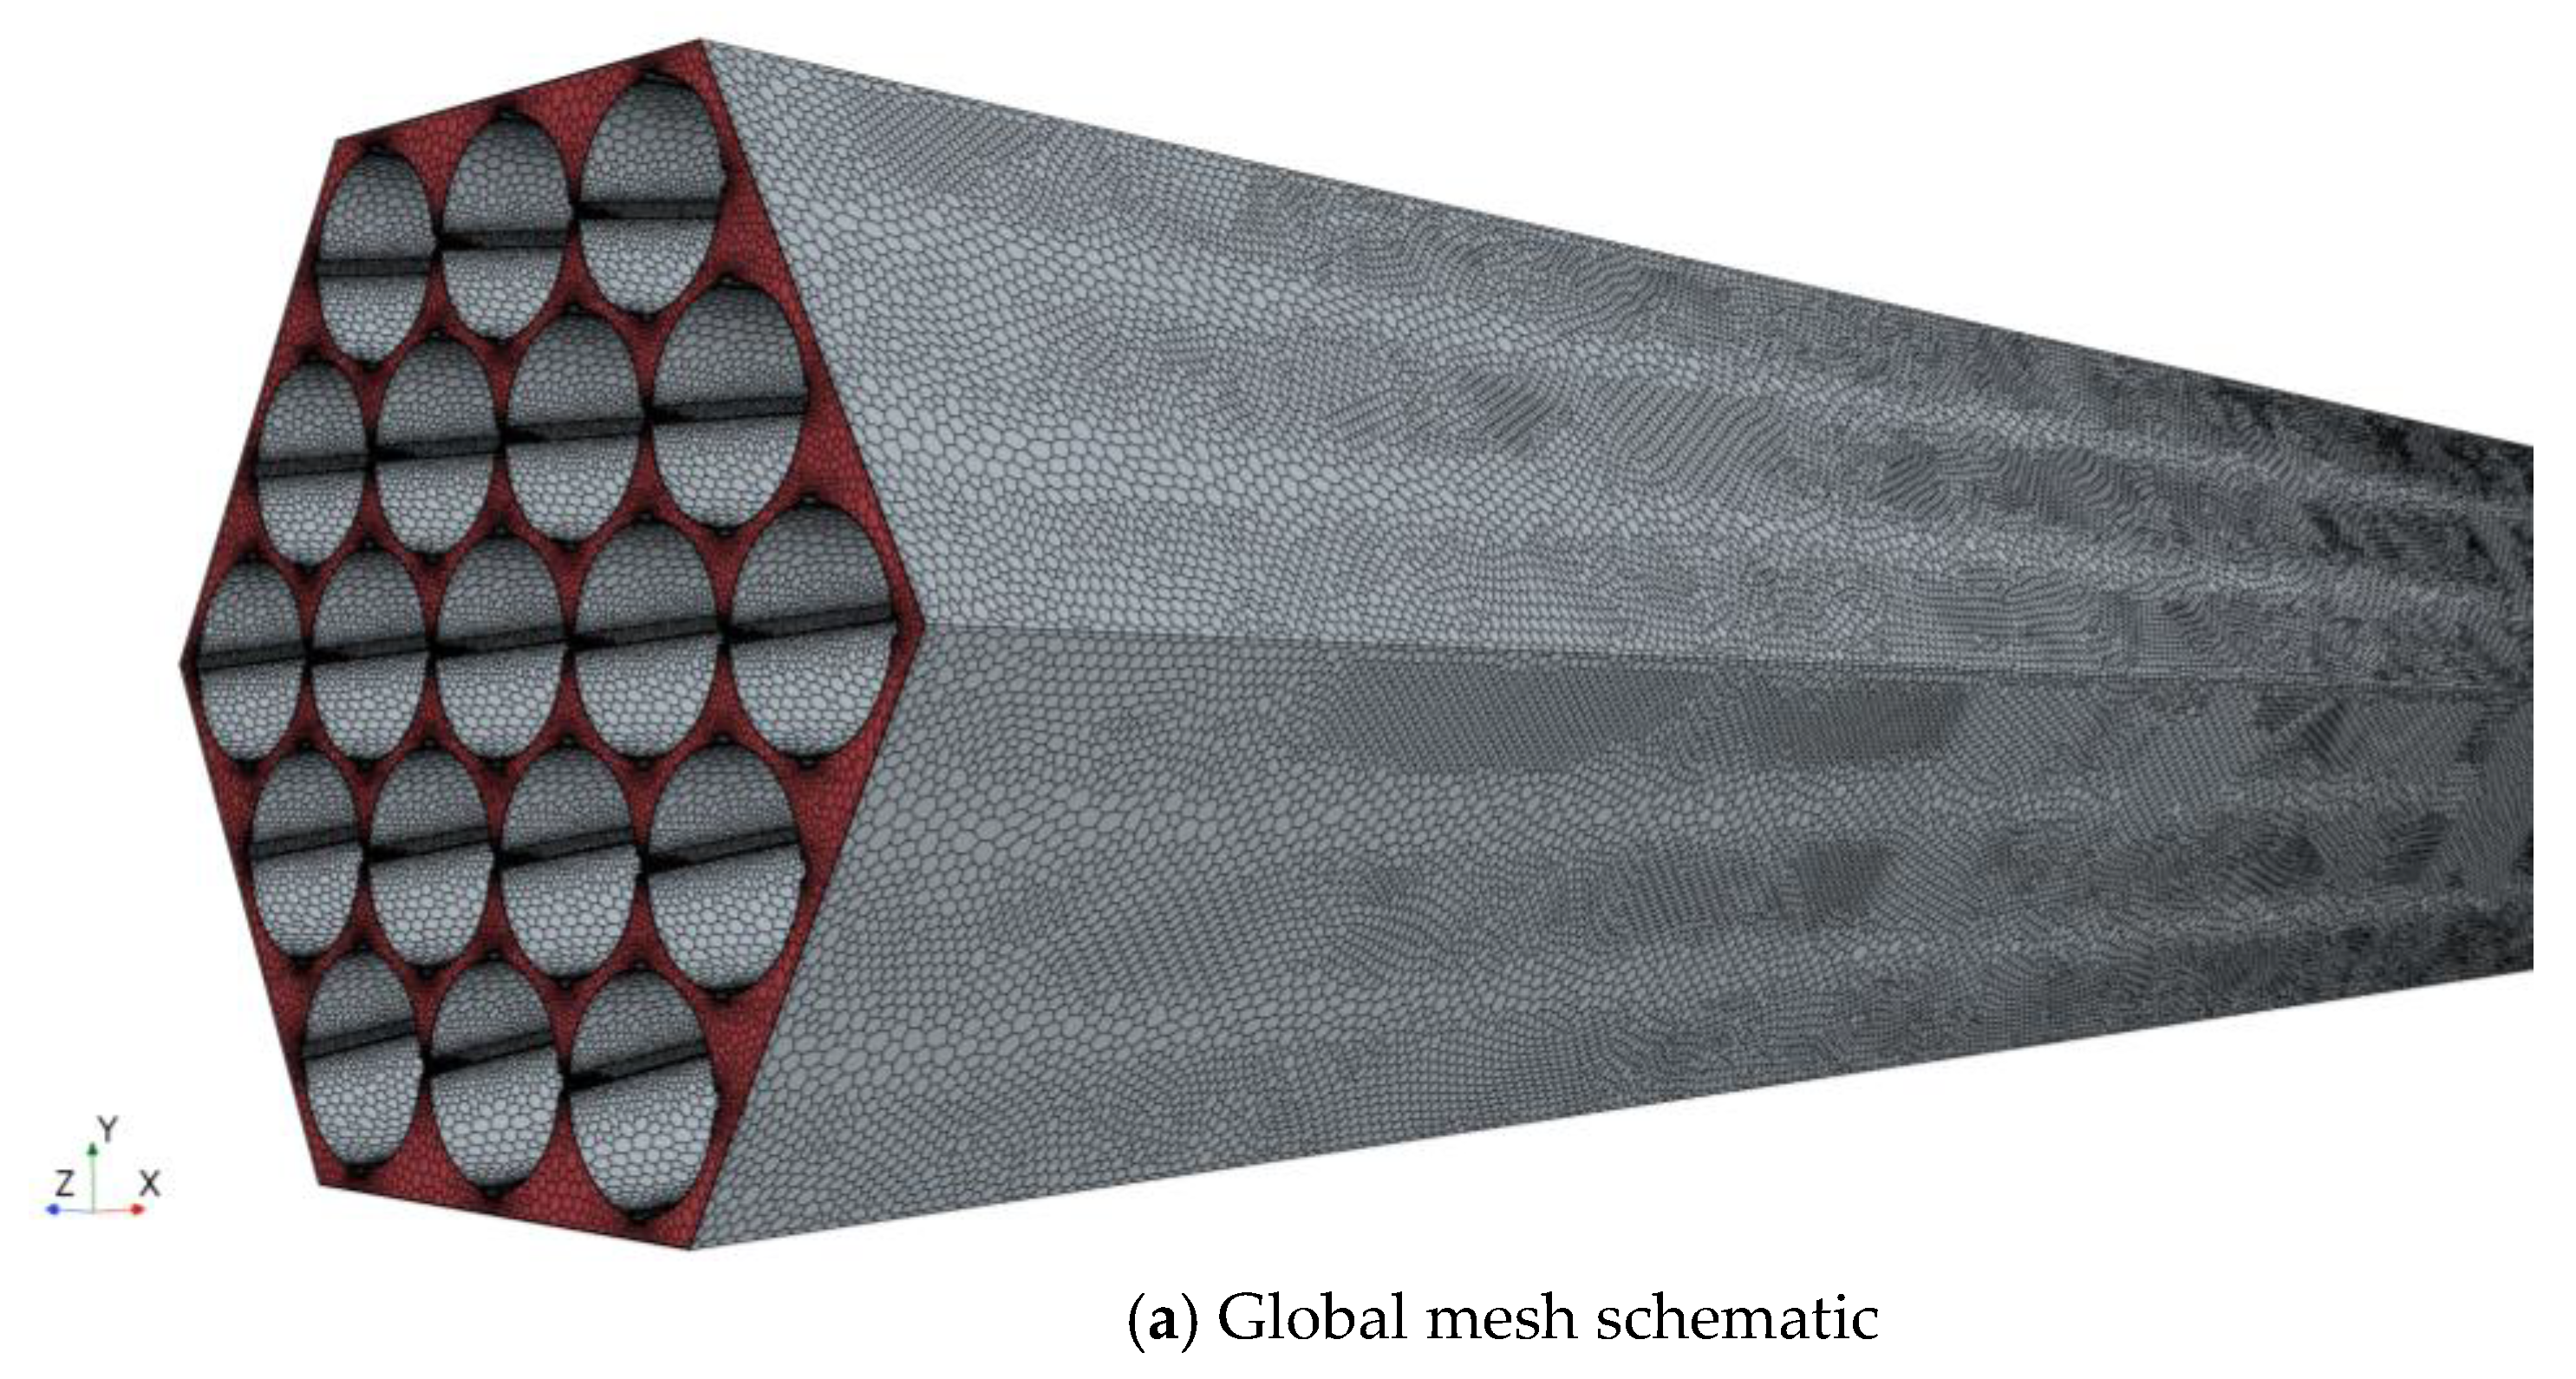
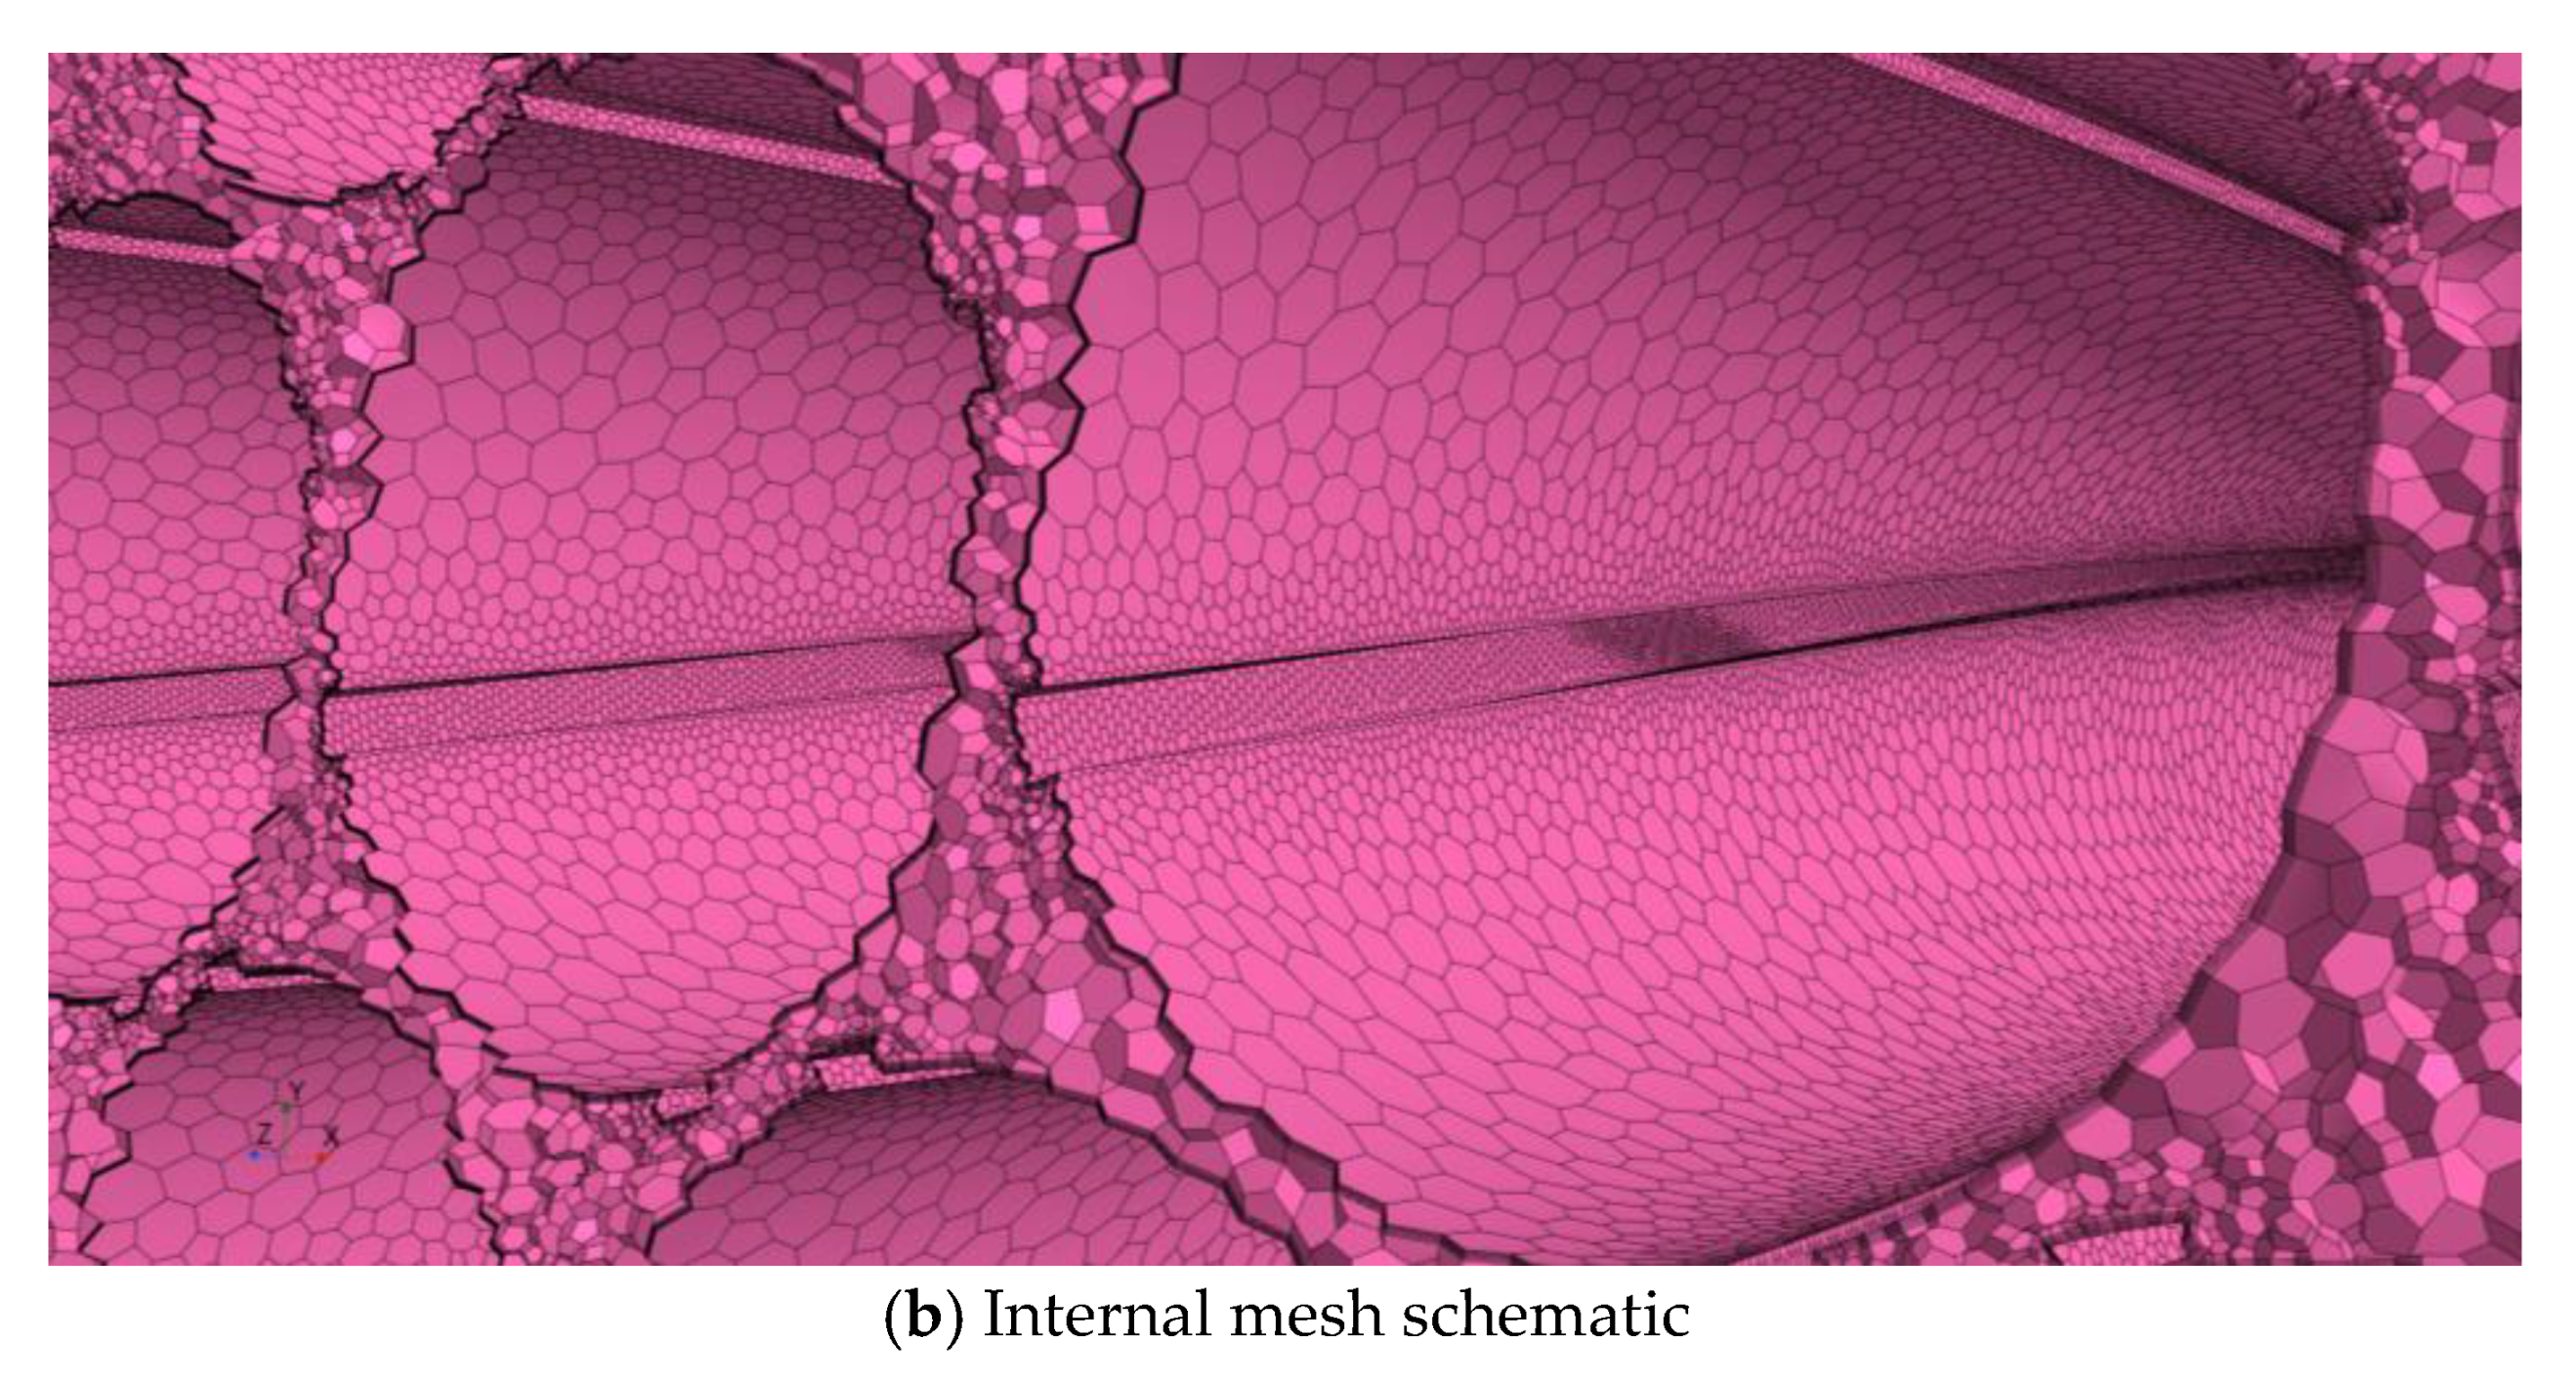
STAR-CCM+ utilizes the polyhedral mesh advocated by CD-adapco. Compared to traditional tetrahedral meshes, polyhedral meshes can enhance computational performance by approximately 3 to 10 times while maintaining the same level of computational accuracy. Therefore, this study employs polyhedral meshes for the grid division of the main structure of the spiral channels with coiled wire. For the grid division near the wall boundaries, prism layer meshes are used to better simulate the wall boundary layer. The surface remesher can improve the overall quality of the existing surface and optimize the volumetric mesh model. Figure 5 presents the three-dimensional meshes generated within the spiral channel with coiled wire, including a global mesh schematic and an internal mesh schematic.
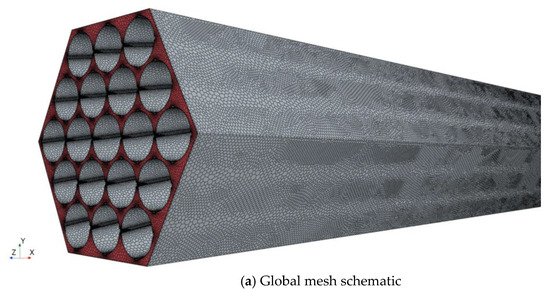
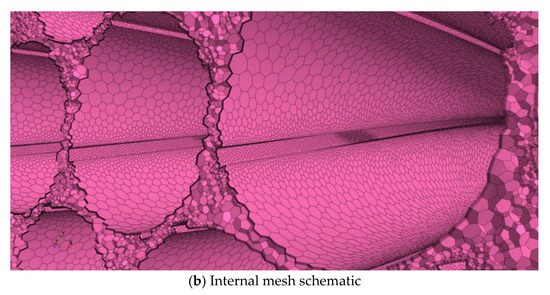
Figure 5.
Mesh schematic of the spiral channel with coiled wire.
To ensure the accuracy of the numerical simulations, a mesh independence verification is necessary to confirm that the number of cells does not significantly affect the CFD simulation results. In this section, we conduct a mesh evaluation on the spiral channel with coiled wire under the operating conditions of system pressure p = 0.1 MPa, inlet velocity vi = 1.79 m/s, and inlet temperature Ti = 299.65 K, aiming to determine the minimum number of cells required for accurate simulation of the flow characteristics within the channel. The outlet velocity vo of the spiral channel with coiled wire, the outlet temperature To of the channel, and the pressure drop ΔP between pressure guiding pipes 2 and 3 (as shown in Figure 4) are selected as monitoring quantities. By adjusting the surface size of the polyhedral mesh and the number of prism layers and prism layer stretching, numerical simulations are performed at grid numbers of 14,149,427, 21,023,326, 24,788,095, and 36,049,558, and the simulation results from the four mesh configurations are compared. As the number of cells increases from 14,149,427 to 36,049,558, the changes in the monitoring quantities vo, To, and ΔP with the number of cells are compared and presented in Table 2. The table shows that as the number of cells increases, the trends of the monitoring quantities become stable. Comparing mesh model #2 with #4, the change in ΔP is 0.084%, the change in vo is 0.041%, and the change in To is 0.00003%, indicating that the number of cells at 21,023,326 is sufficient for mesh independence. Mesh model #2 can be selected for numerical simulations under vertical conditions. Additionally, by checking the mesh quality, it is found that the volume change ratio is between 0.01 and 1, the face validity is 1, and the cell quality is between 0.06 and 1. The mesh quality is considered good, ensuring the convergence and accuracy of the calculations.

Table 2.
Grid independence verification.
3.3. Validation of Model Accuracy
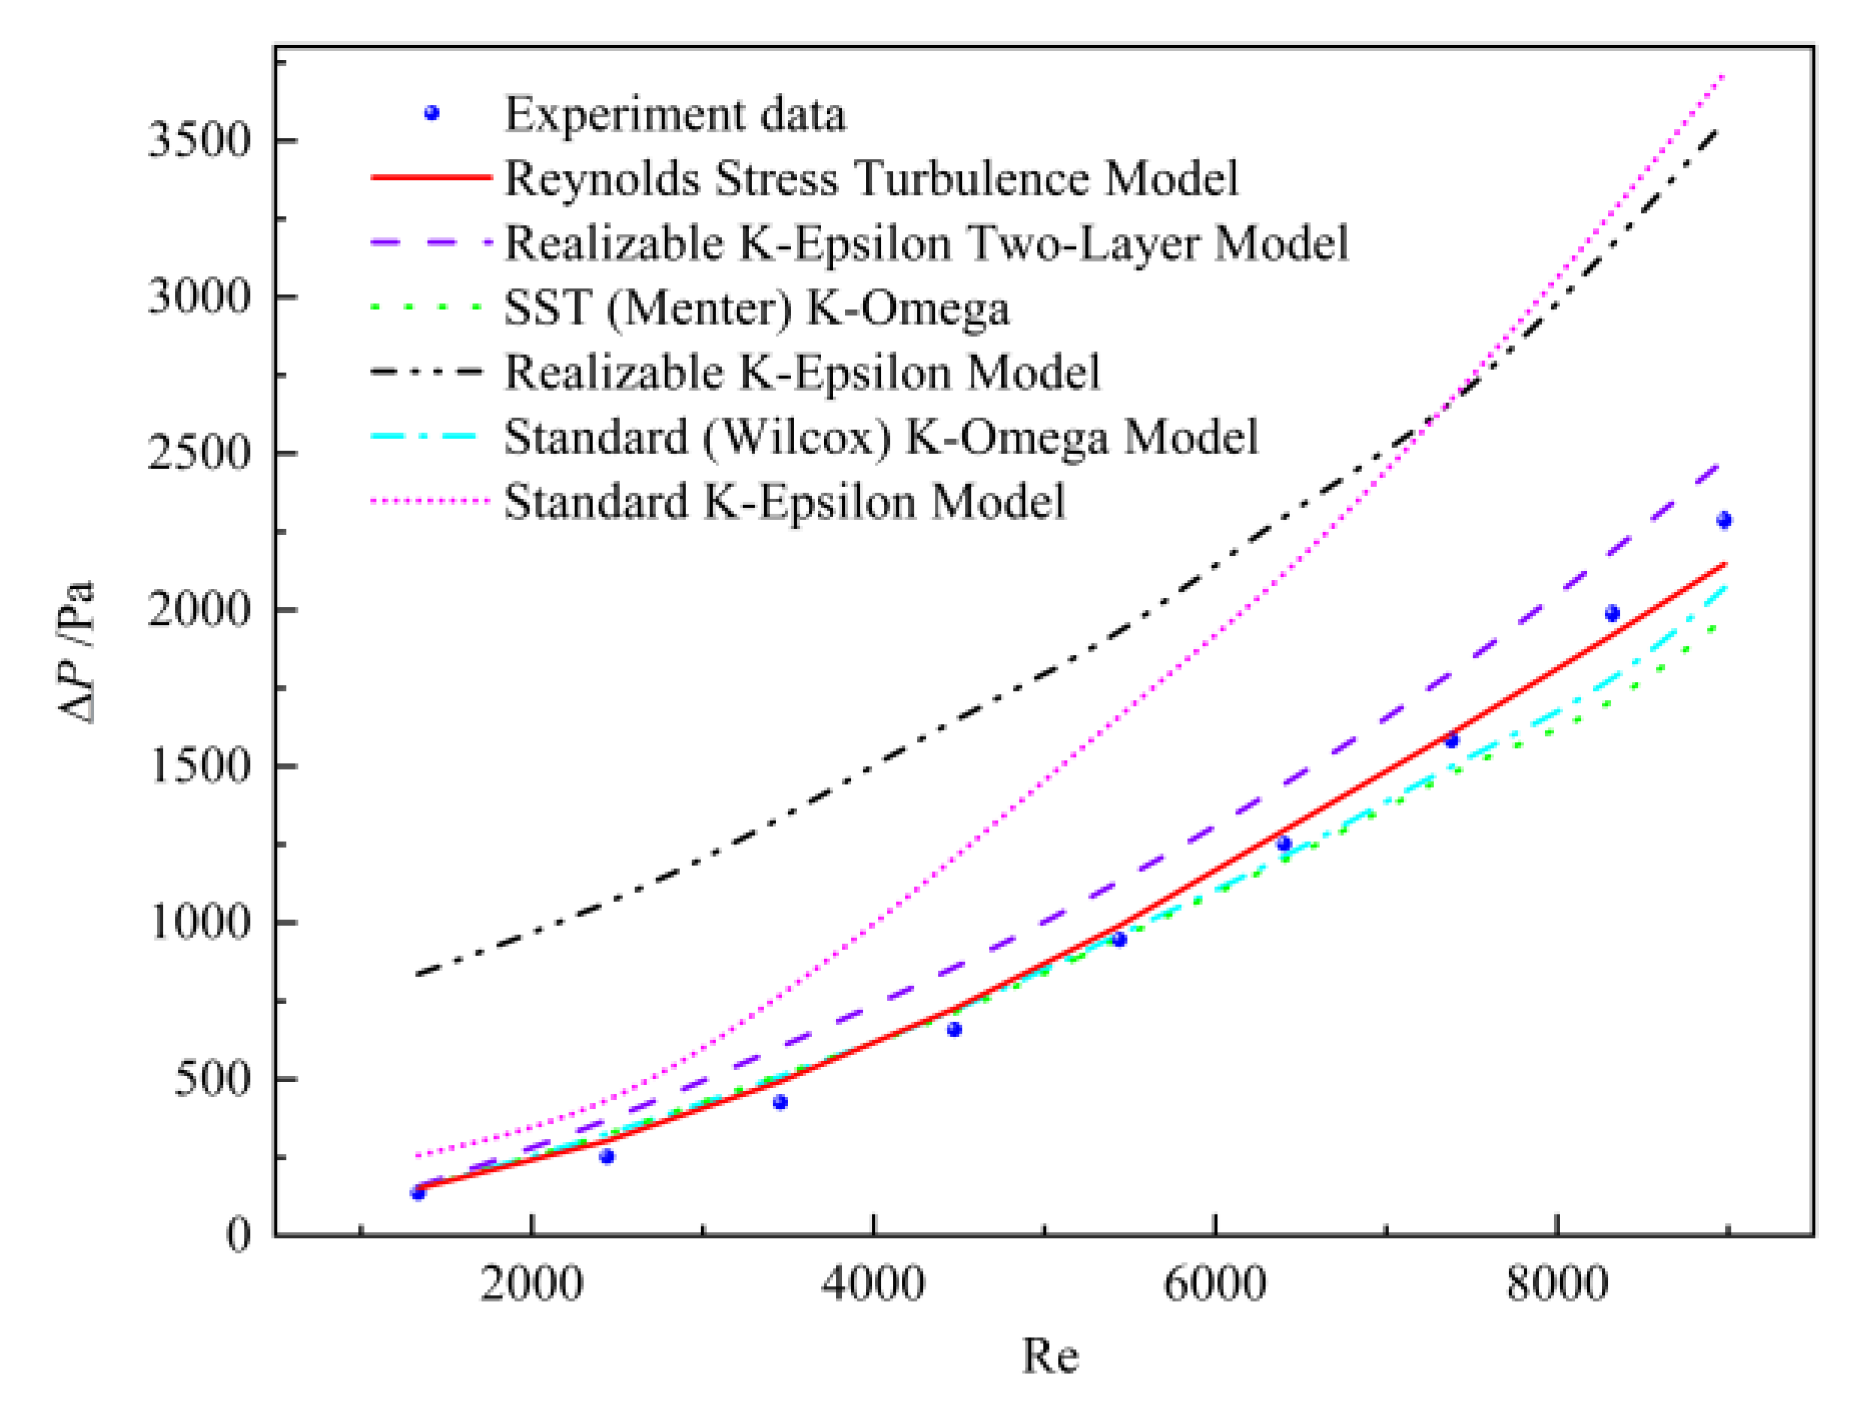
To ensure the accuracy of the three-dimensional CFD numerical simulations, a model validation was conducted for the spiral channel with coiled wire under vertical conditions. The experimental results were compared with the numerical simulation results to ensure the accuracy of the numerical simulations. Experiments were conducted on the experimental setup shown in Figure 1, with system pressure p = 0.1 MPa and inlet temperature Ti = 299.65 K of the coiled wire spiral channel test section. The pressure drop results were measured over a wide range of Reynolds numbers. To find the most suitable turbulence model for studying the primary side spiral channel with coiled wire in casing once-through steam generator, six models were simulated, including the SST (Menter) K-Omega model, the realizable K-Epsilon model, the realizable K-Epsilon two-layer model, the Reynolds stress turbulence model (i.e., the RST model), the standard (Wilcox) K-Omega model, and the standard K-Epsilon model. For the numerical simulation of the spiral channel with coiled wire, the heat transfer wall of the channel was set as a constant heat source, the outer wall of the channel was set as adiabatic, the channel inlet was set as a velocity inlet boundary, and the outlet was set as an outlet boundary. All wall boundaries were set as no-slip walls. Numerical simulations were performed for different turbulence models under the same experimental conditions, and the simulation results of different models were compared with the experimental results. Since this paper focuses on the flow characteristics of the spiral channel, the pressure drop ΔP of the pressure measurement segment DP2 in the spiral channel with coiled wire (as shown in Figure 4) was selected as the monitoring quantity. In the STAR-CCM+ simulation file, the pressure drop values for the pressure measurement segment DP2 under different operating conditions were obtained by creating derived parts and generating reports. The pressure drop ΔP of the pressure measurement segment DP2 under different turbulence models and experimental results was plotted against the Reynolds number, as shown in Figure 6. From the figure, it can be seen that the Reynolds stress transport model is the closest to the experimental results. An appropriate boundary layer mesh distribution is one of the key factors in effectively using turbulence models. The quality of the boundary layer mesh can be controlled by maintaining the Y+ value range. Generally, for the Reynolds stress transport model used in this study, STAR-CCM+ typically requires the Y+ to be between 0.1 and 10 to ensure that the model accurately captures the turbulent characteristics near the wall. A Y+ that is too low may lead to numerical stability issues, while a Y+ that is too high may prevent accurate resolution of the turbulent structure near the wall. Upon inspection, the Y+ of the model simulation results was between 0.1 and 8, meeting the standards of STAR-CCM+.
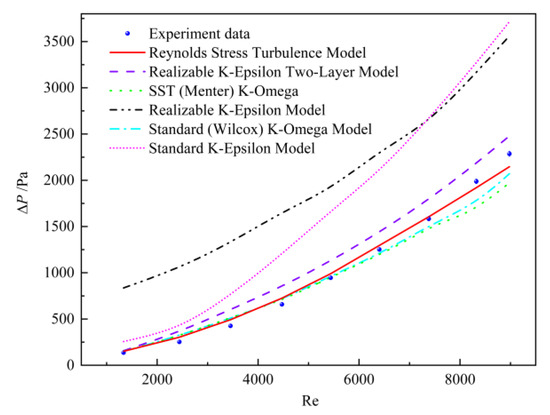
Figure 6.
Comparison of pressure drop between different turbulence models and experimental results in CFD.
For the laminar region, this paper conducted numerical simulations using both the laminar flow model and the Reynolds stress transport model. The results showed that the two models produced almost identical results for the pressure drop. Therefore, the Reynolds stress transport model is also used for simulations in the laminar region in this paper.
To facilitate subsequent numerical studies on the primary side spiral channel with coiled wire in the casing once-through steam generator, and to investigate the flow characteristics of the primary side coolant under cooling conditions, this paper conducts research on the coolant flow channels composed of 7 rods. Due to experimental limitations, the above cold-state experiments were performed only for the 19 rod coiled wire spiral channel without heat transfer. The aforementioned mesh independence verification and model accuracy verification were also conducted for this 19 rod coiled wire spiral channel in the cold state. For the validation of numerical models under heat transfer conditions, readers may refer to our previous study [22]. In the present work, to control computational costs while ensuring accuracy, we adopted the 7 rod configuration for the heat-exchanging coiled wire spiral channel analysis. We applied the same rigorous grid independence and model accuracy verification procedures described earlier to the 7 rod case, which confirmed the reliability of the numerical results. This approach significantly reduces the number of grids while maintaining accurate analysis of the thermal hydraulic characteristics of the complex flow channel. The feasibility and reliability of this numerical simulation simplification method have been confirmed by relevant scholars [26]. The results of this study will be crucial for a comprehensive understanding of the thermal hydraulic characteristics of the once-through steam generator.
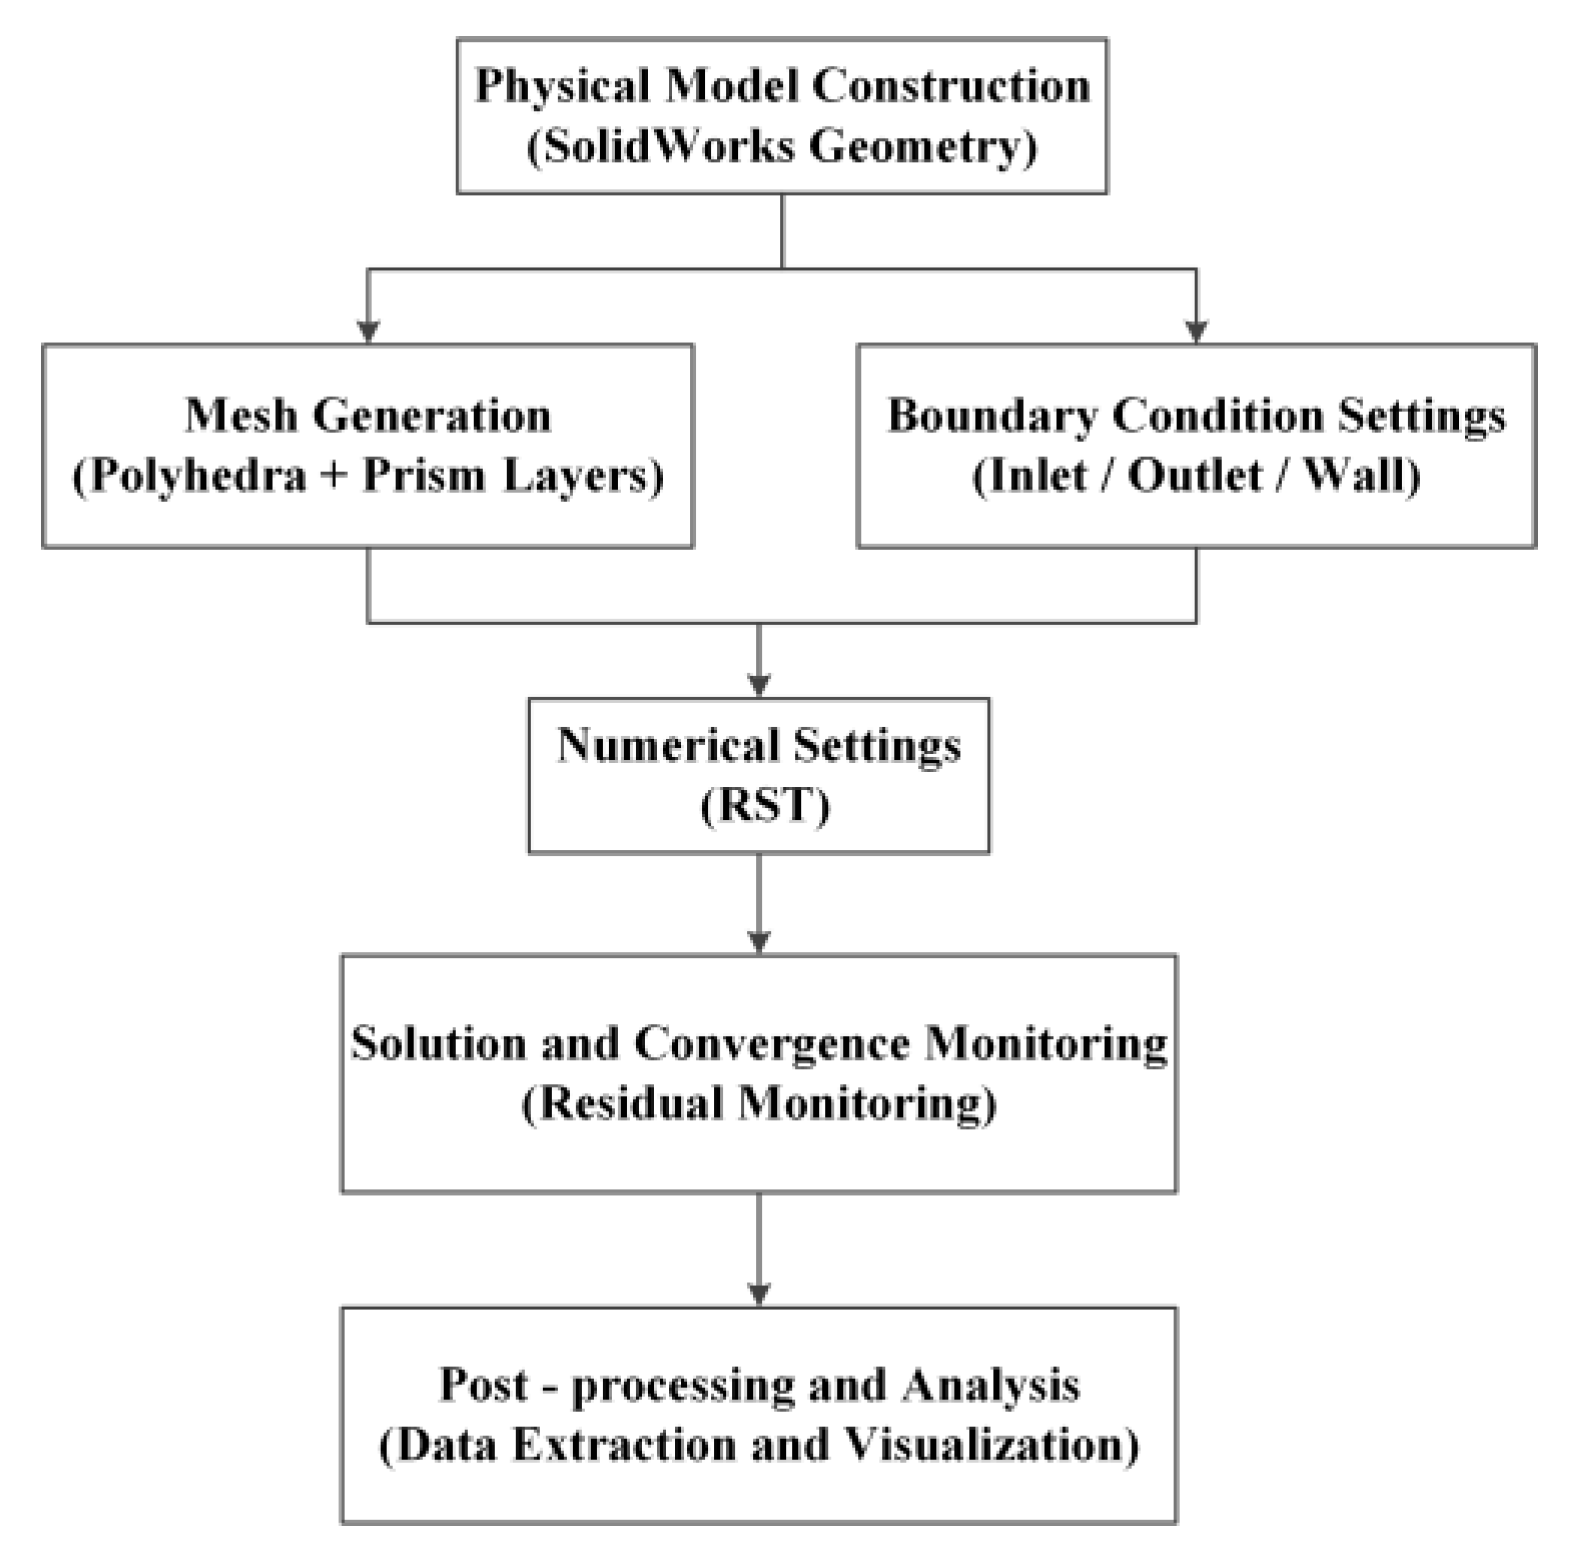
The specific numerical procedure in this study is depicted in Figure 7. Given the complexity of the research object, the first step was to construct the geometric model of the experimental section in SolidWorks 2024. The model was then imported into STAR-CCM+ for numerical simulation. For mesh generation, a combination of polyhedral and prism layer meshes was employed. Subsequently, boundary conditions were set according to the requirements of the research scenarios, including those for the inlet, outlet, and wall surfaces. Following this, the model was configured, with the Reynolds stress transport model being utilized for numerical simulation in this study. Thereafter, the stopping criteria were established, and residual monitoring was implemented. Finally, data analysis and post-processing were carried out based on the simulation results.
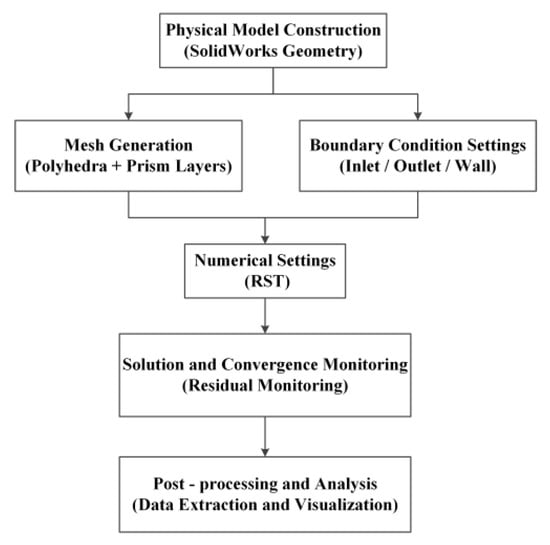
Figure 7.
Numerical solution flowchart.
4. Determination of the Fully Developed Section
When using CFD numerical simulations to study the flow characteristics within a spiral channel with coiled wire, the inlet boundary is set as a velocity inlet, and the inlet velocity magnitude is set to a constant. This results in an entrance effect for the viscous fluid flow within the channel. This paper focuses solely on the flow characteristics within the fully developed section of the spiral channel with coiled wire and does not study the flow characteristics within the entrance section. Additionally, since the subject of this study is the spiral channel under cooling conditions, the fluid is continuously cooled by the secondary-side fluid in the steam generator during the flow process. Therefore, the method for determining the fully developed section differs from that of non-heat-exchanging channels. This section will provide a detailed explanation of the method for determining the fully developed section under vertical conditions.
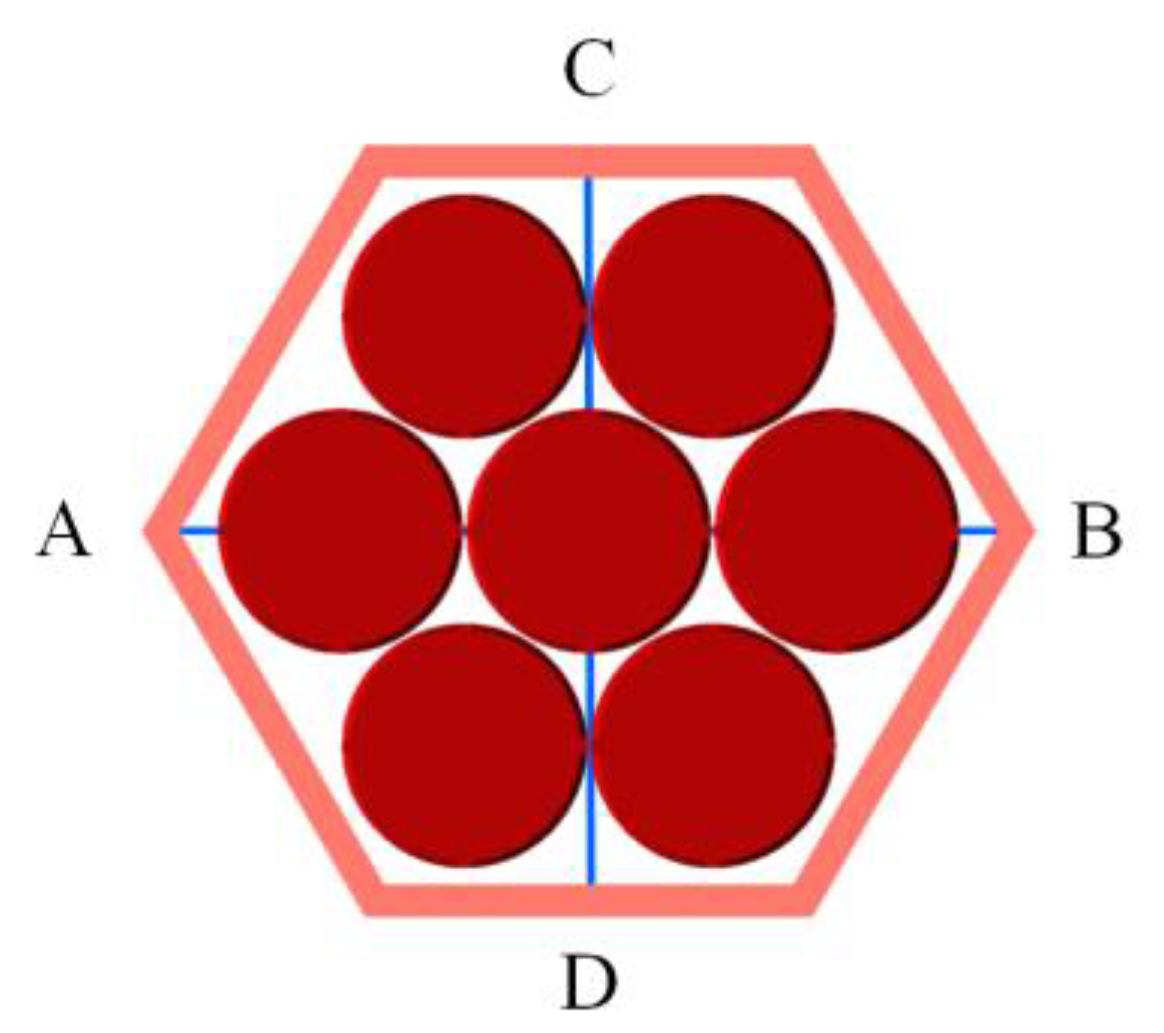
To identify the fully developed fluid region, two representative probe lines were selected in the STAR-CCM+ simulation, as shown in Figure 8. To ensure smooth meshing, a distance of 0.2 mm was left between the coiled wires of adjacent rods. The probe line AB is divided into 4 segments by the heat exchanger tubes, passing through the corner and central sub-channels of the spiral channel; the probe line CD is divided into 2 segments, passing through the boundary and central sub-channels of the spiral channel. To accurately determine the fully developed section of the spiral channel under cooling conditions, the dimensionless velocity on probe lines AB and CD was calculated every 10 mm along the flow direction of the spiral channel using the following formula:
In the formula: v is the fluid velocity distributed along the probe line in each segment, in units of m/s; vm is the maximum fluid velocity in each segment of the probe line, in units of m/s. The dimensionless velocity distribution curves along the two probe lines at different heights are plotted. If the dimensionless velocity distribution curves at adjacent heights are essentially coincident, it can be considered that the fluid has reached a fully developed flow state.
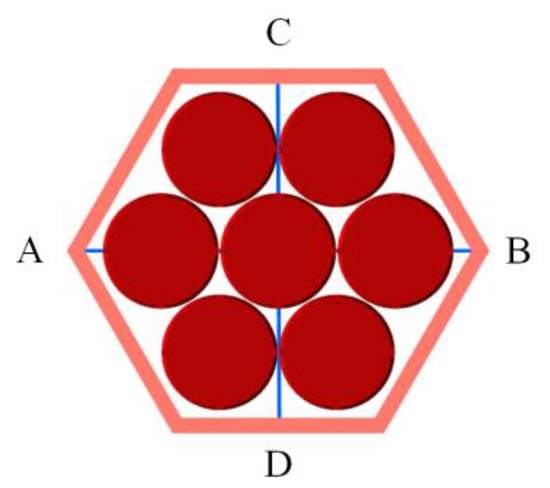
Figure 8.
Schematic diagram of probe line.
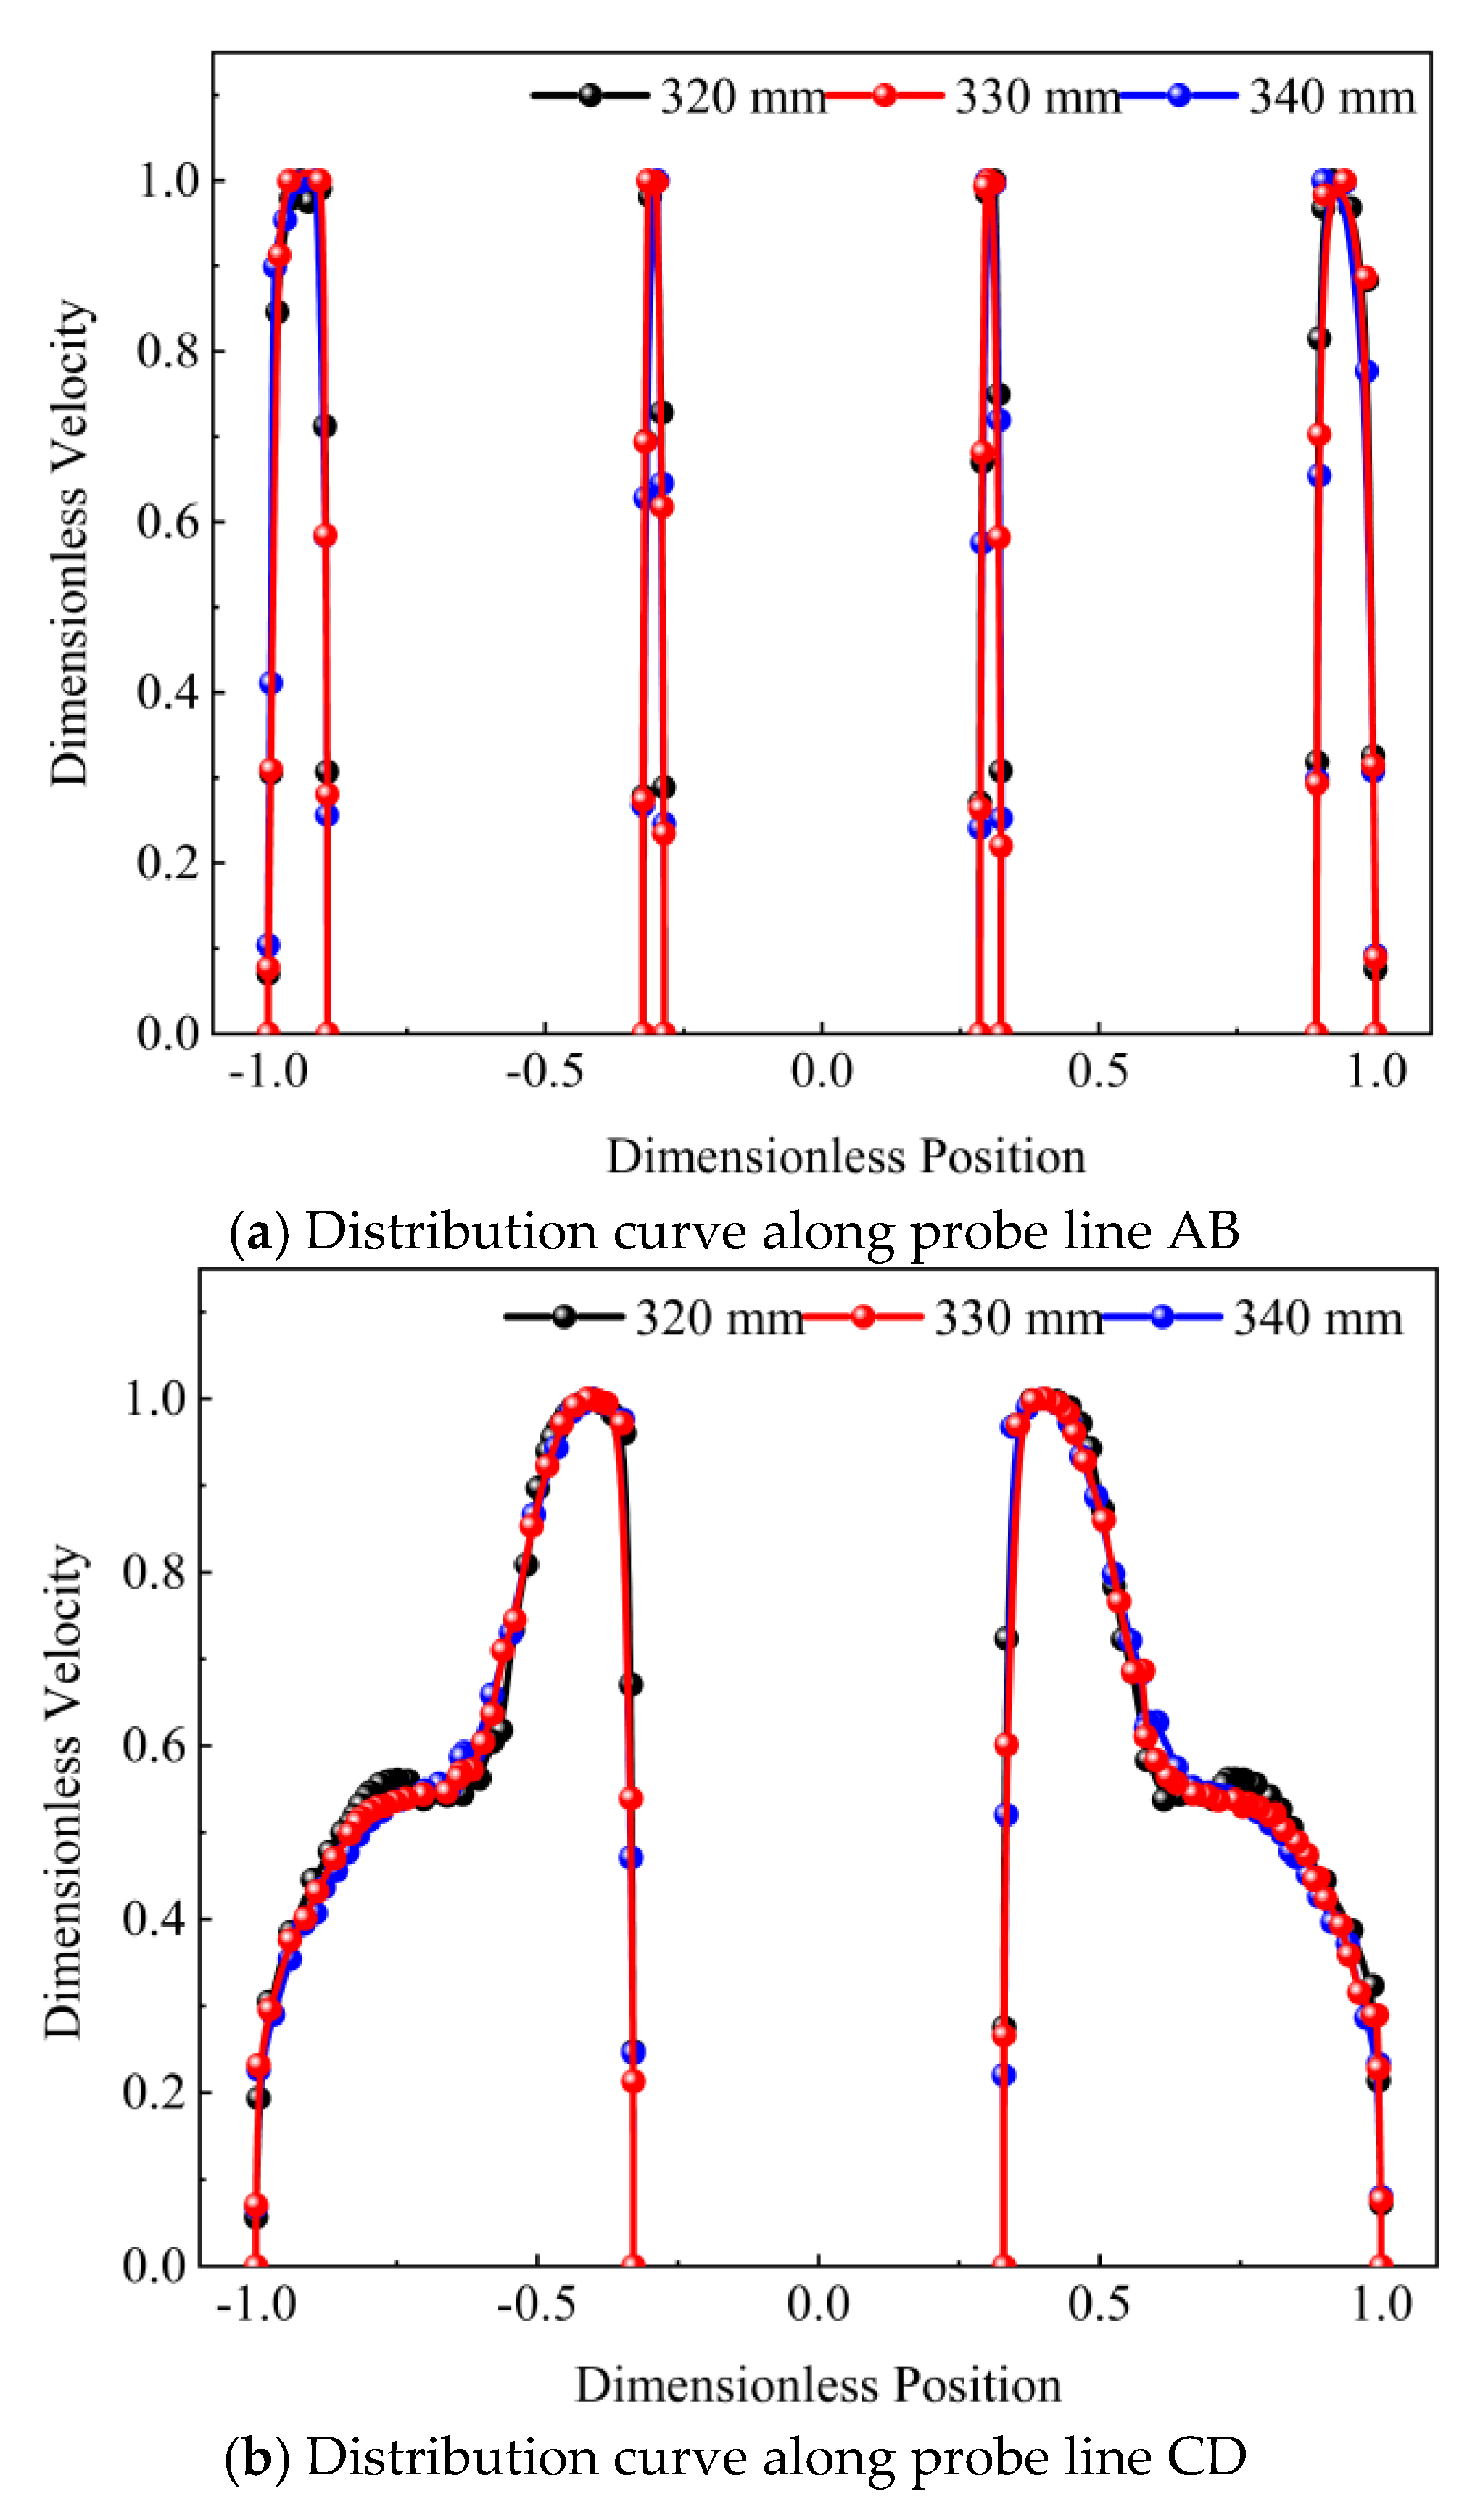
The dimensionless velocity distribution curves at different heights from the inlet of the spiral channel were calculated and processed from the numerical simulation results under various operating conditions (including different flow velocities and heat transfer powers). The degree of overlap of these distribution curves was used to determine whether the fluid in the cooling channel had reached a fully developed state. Additionally, the ratio of the transverse fluctuating velocity to the mainstream velocity at different cross-sections from the inlet of the spiral channel was calculated. Analysis of the data indicates that when this ratio falls below 11.5%, the fluid can be considered fully developed. After statistical analysis of the entrance lengths under different operating conditions, it was found that for the casing once-through steam generator’s primary side spiral channel with coiled wire studied in this paper, the entrance length is L∗ = 80De. For the geometric dimensions of the spiral channel studied in this paper, the entrance length is calculated to be 330 mm. The accuracy of the entrance length calculation is affected by factors such as the spacing between adjacent axial probe lines and the mesh conditions, but it is sufficient to ensure that the fluid outside the aforementioned entrance length is fully developed, meaning that the subjects of this study are all within the fully developed section of the fluid.
Figure 9 presents the dimensionless velocity calculation results along two representative probe lines under typical operating conditions. The horizontal axis represents the dimensionless position, indicating the distribution along the probe line; the legend represents the distance from the channel inlet, showing the dimensionless velocity distribution curves at different heights. Since the probe lines AB and CD are divided into 4 segments and 2 segments, respectively, by the heat exchanger tubes, the dimensionless velocity distribution curves in the figure are shown as 4 segments and 2 segments, respectively. Additionally, since the dimensionless velocity is calculated for each segment of every probe line separately, the maximum value of each dimensionless velocity curve is 1. From the figure, it can be seen that for the condition with Re = 5082, the dimensionless velocity curves at 330 mm and 340 mm from the inlet of the spiral channel are essentially coincident, indicating that the fluid has reached a fully developed state at an entrance length of 330 mm. After analyzing a large number of different operating conditions, it is concluded that the fluid reaches a fully developed state at an entrance length of 330 mm.
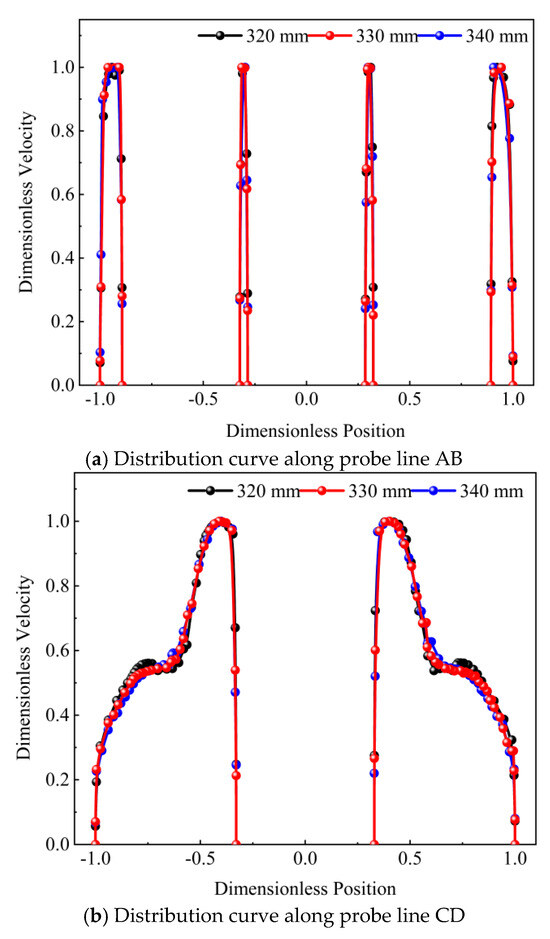
Figure 9.
Dimensionless velocity of typical working condition.
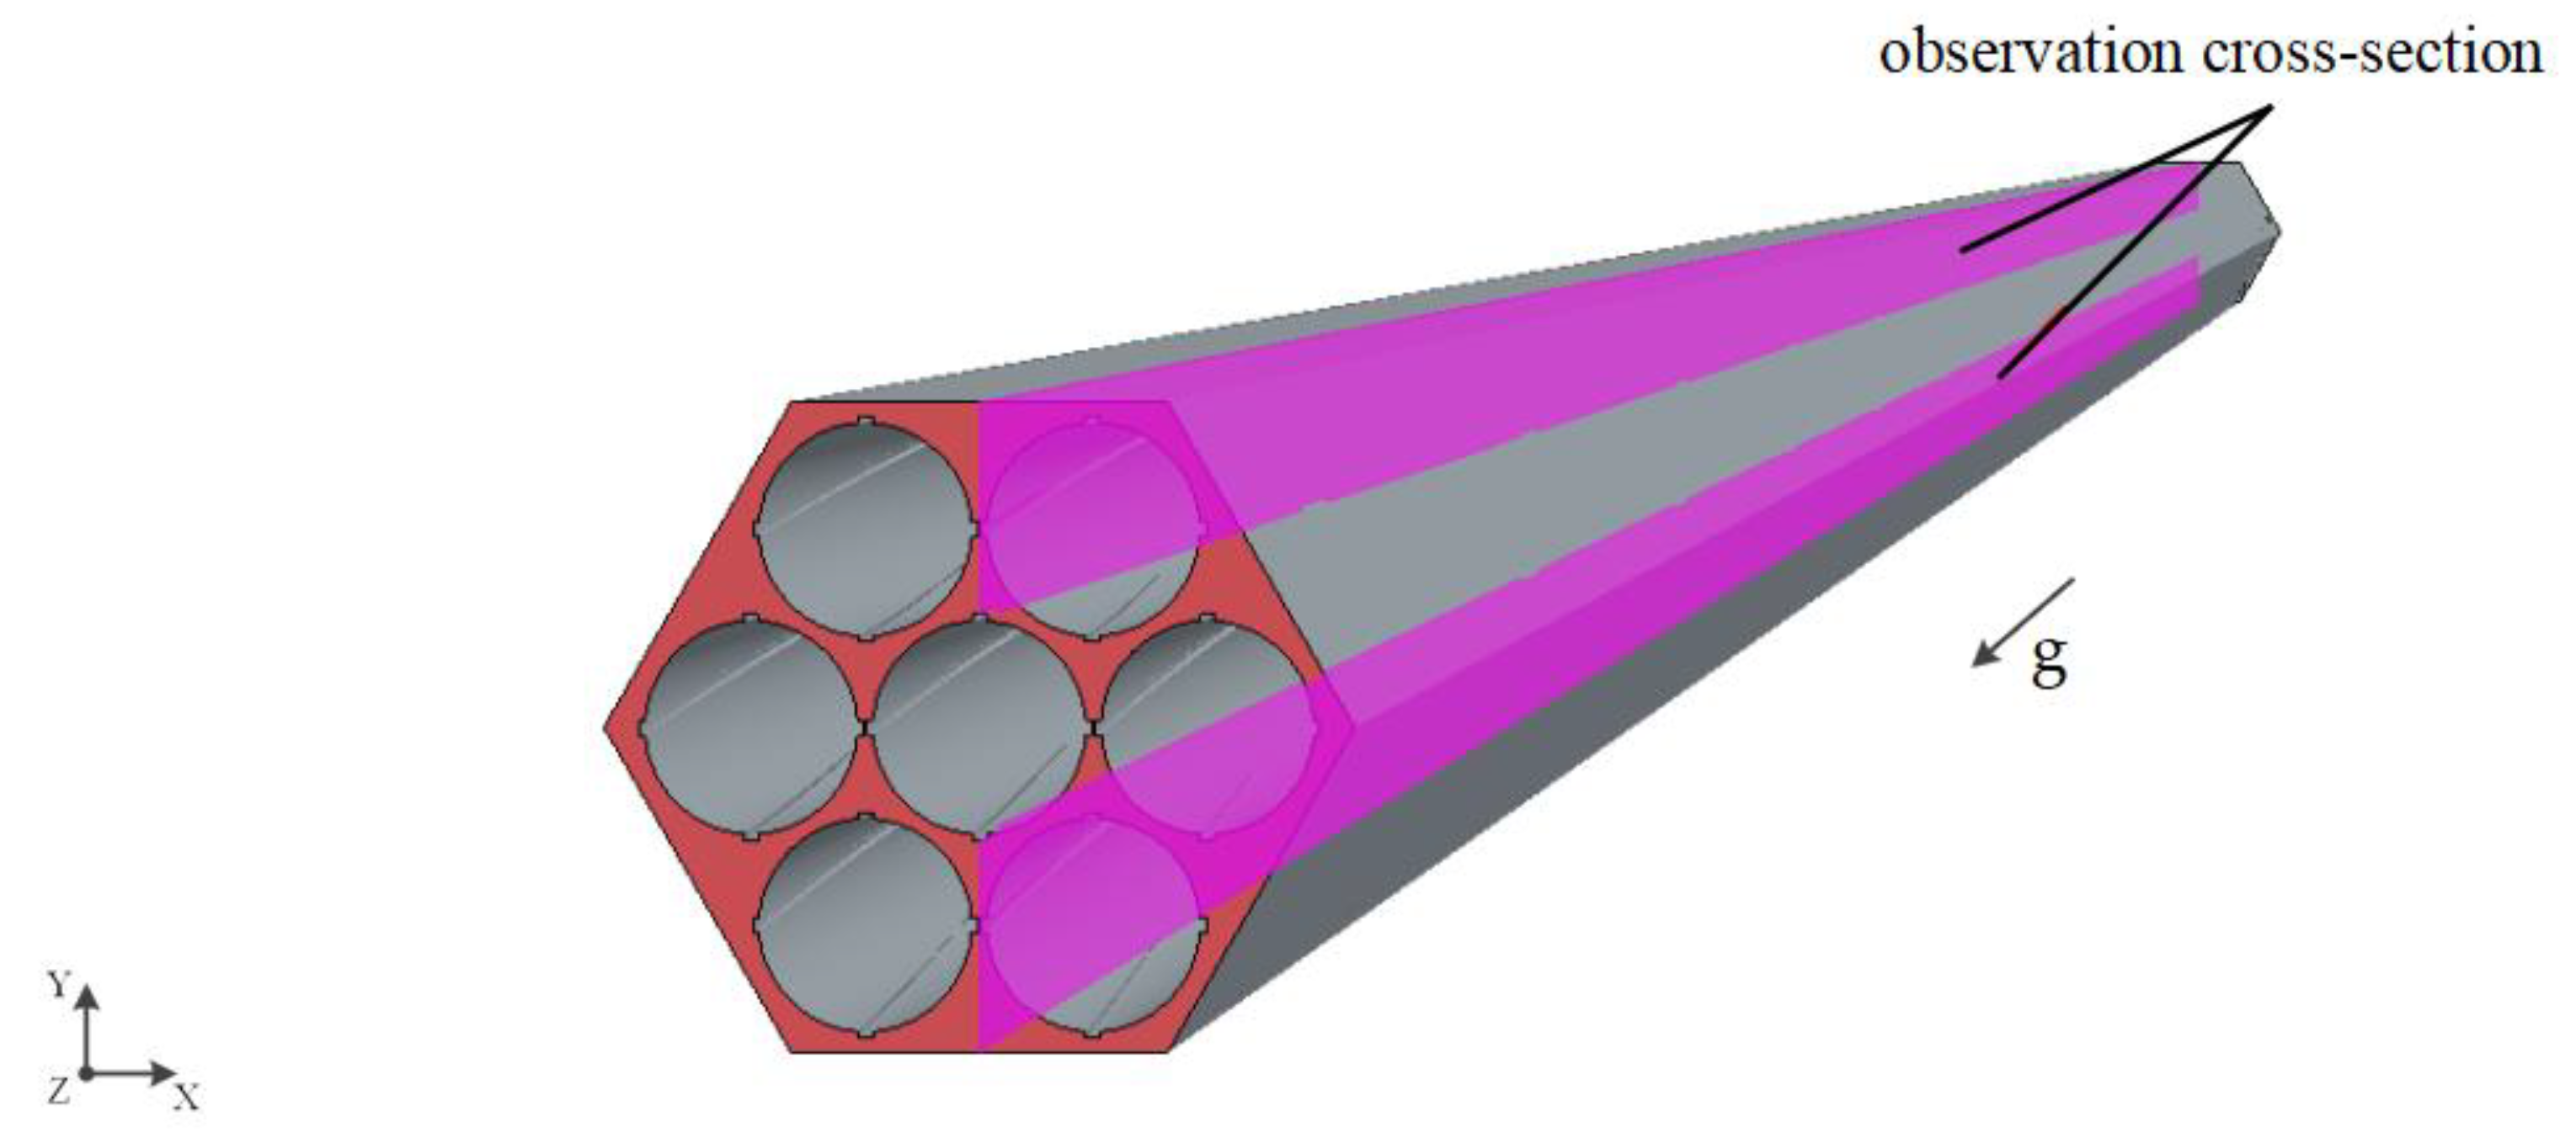
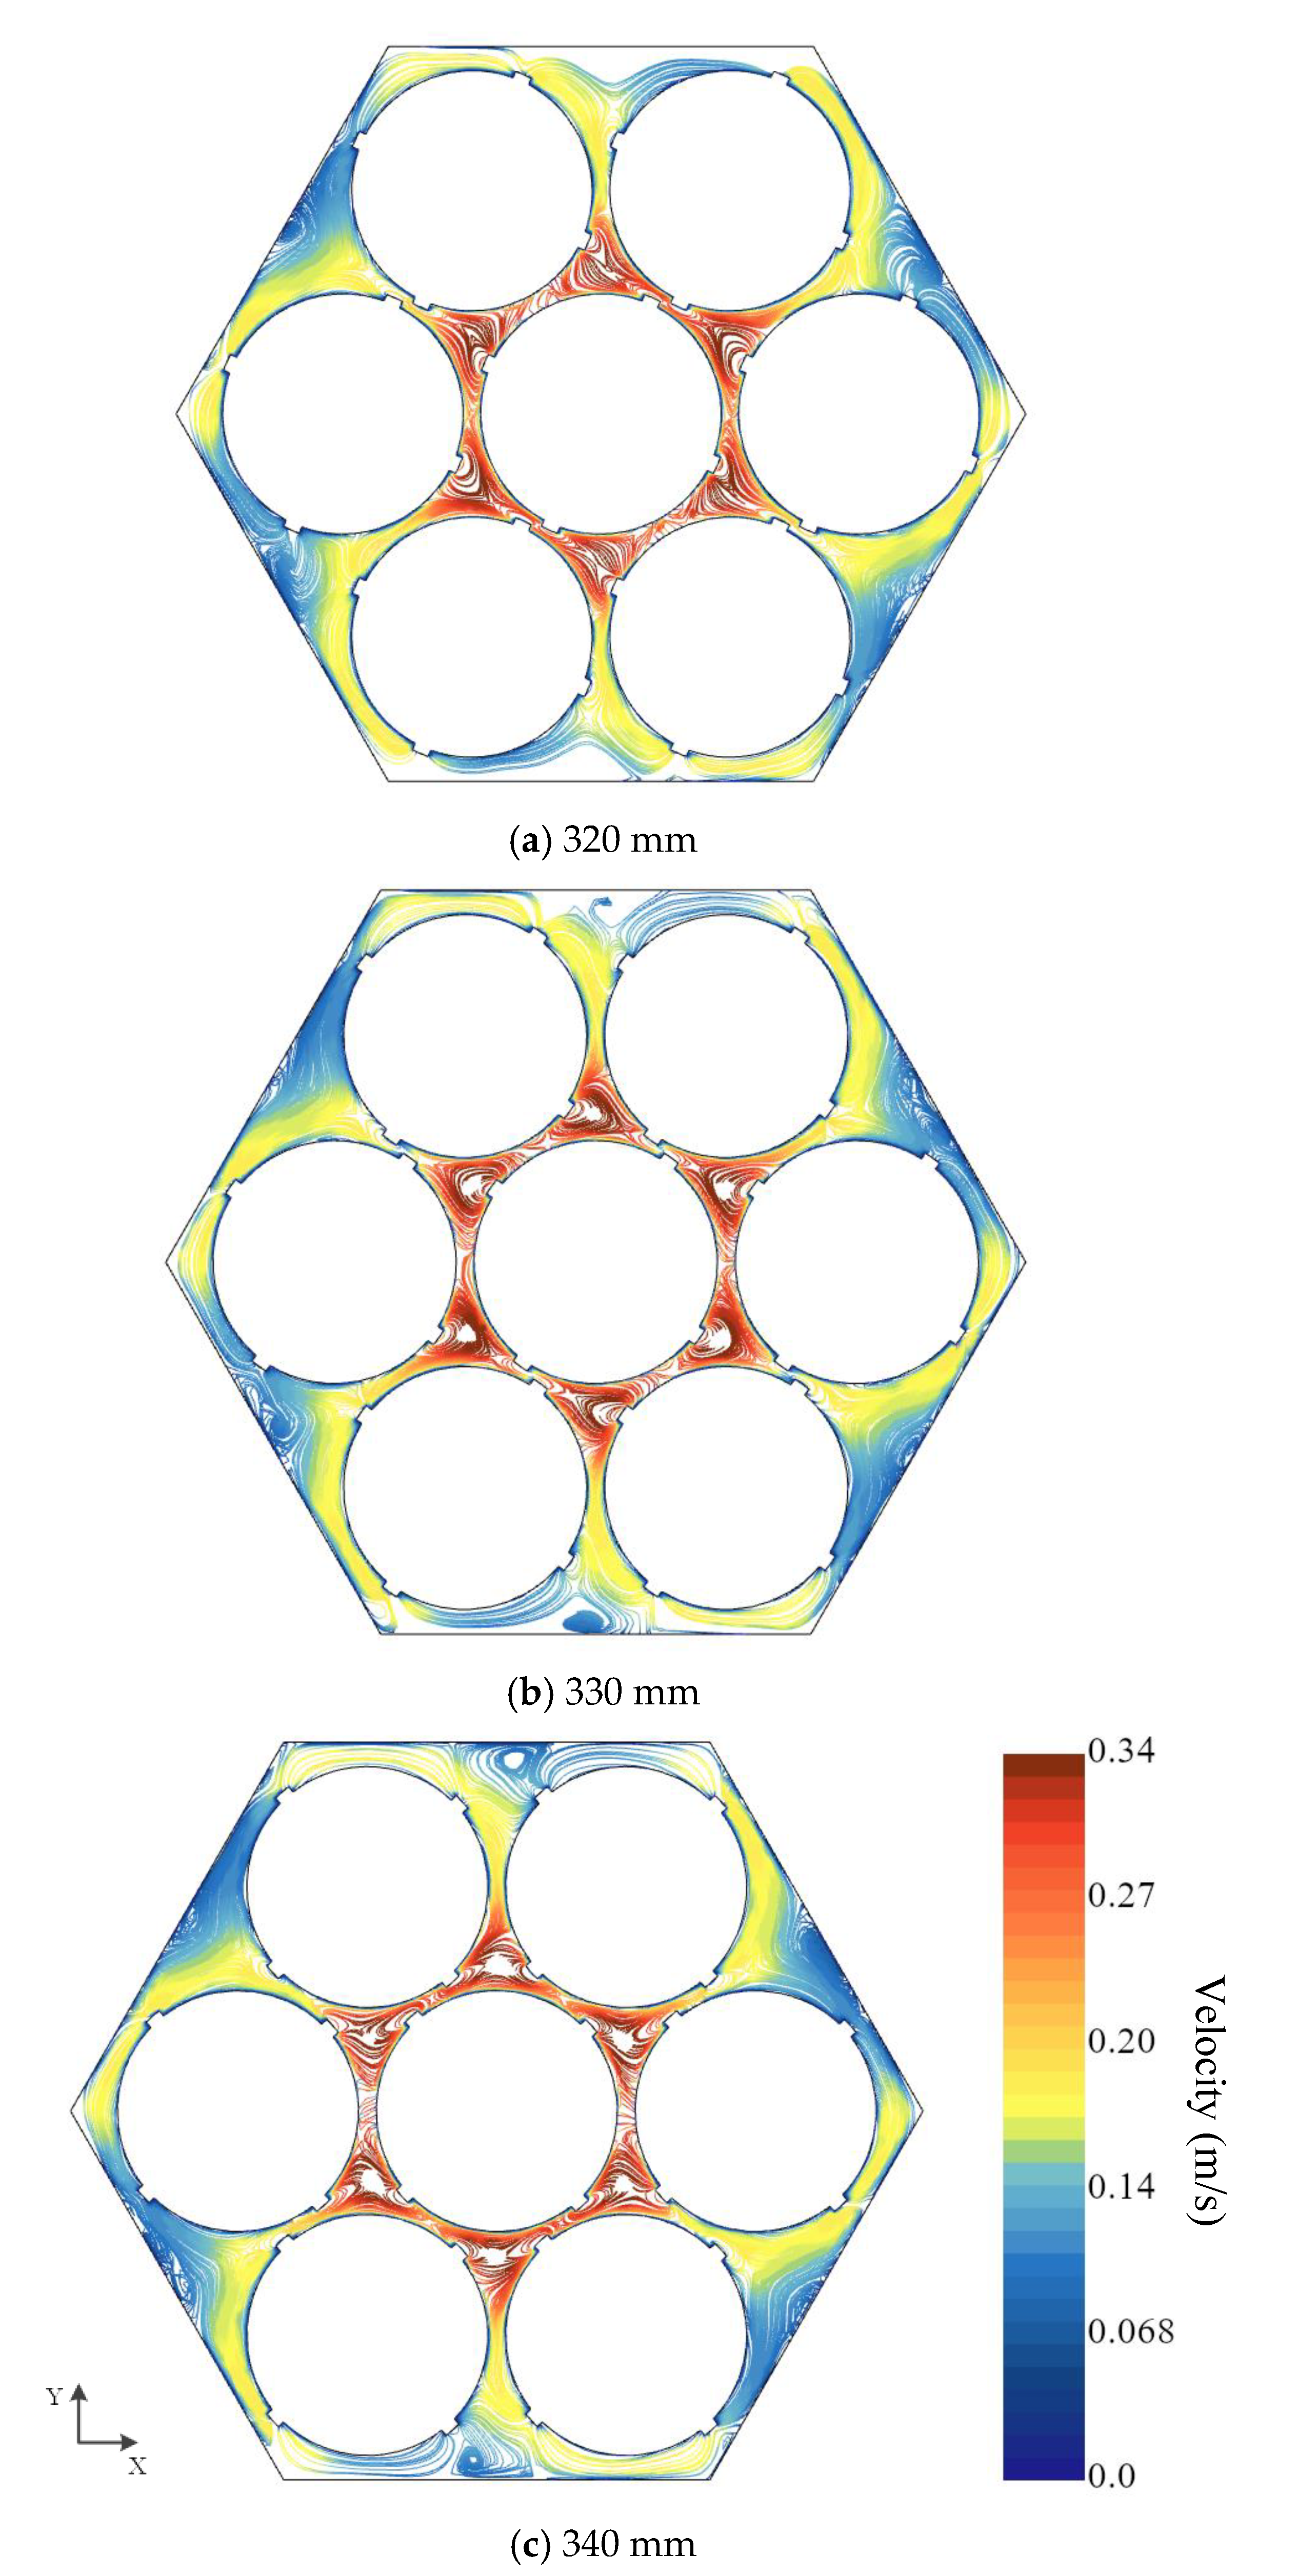
Due to the complexity of the structure of the research object in this paper, the cross-section where the probe line CD is located, as shown in Figure 10, is selected as the observation cross-section for the flow field analysis. Figure 11 presents the velocity contour map of the observation cross-section under the condition of Re = 5082, with the positions of the cross-sections at 320 mm, 330 mm, and 340 mm from the inlet of the spiral channel marked. The velocity distributions along the streamlines of these three cross-sections are shown in Figure 12. It can be observed that the fluid velocity distribution at the inlet of the channel is uniform. As the fluid cools gradually within the channel, the fluid velocity in the central sub-channels gradually exceeds that in the other sub-channels. After reaching full development, the fluid in the spiral channel continues to cool, and its velocity increases further. From the velocity contour map of the observation cross-section, it can be seen that the fluid has reached full development at 330 mm from the inlet. The velocity distributions along the streamlines of the selected cross-sections show that the transverse flow is restricted by the channel geometry and the coiled wire, resulting in a complex flow field distribution with an overall trend of rotating in the direction of the coiled wire. This is due to the structural characteristics of the spiral channel: the space between the heat exchanger tubes is narrow, with only the central sub-channels having a larger space. The fluid near the heat exchanger tubes has a lower velocity due to the boundary layer effect, while the fluid in the central sub-channels is less affected by the boundary layer, resulting in a higher axial velocity. The fluid in the corner and boundary sub-channels supplements the central sub-channels during the flow process, and the streamline distribution is complex due to the rotation direction of the coiled wire, with the velocity distribution showing the highest velocity in the central sub-channels. Additionally, the velocity distribution differences among the three cross-sections are small. This is because the mainstream velocity of the fluid is relatively high under this operating condition, and the temperature drop of the fluid is small within the same interval, resulting in minimal changes in the velocity distribution across different cross-sections, consistent with the conclusions of the dimensionless velocity distribution curves shown in Figure 9. The calculated ratio of the transverse fluctuating velocity to the mainstream velocity at the cross-section 330 mm from the inlet of the coiled wire spiral channel is 11.5%, indicating that the fluid has reached full development at 330 mm.
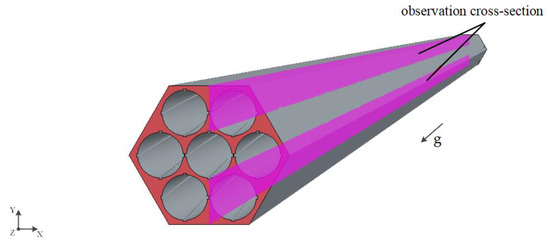
Figure 10.
Schematic diagram of observation cross-section.

Figure 11.
Velocity contour along the observation cross-section.
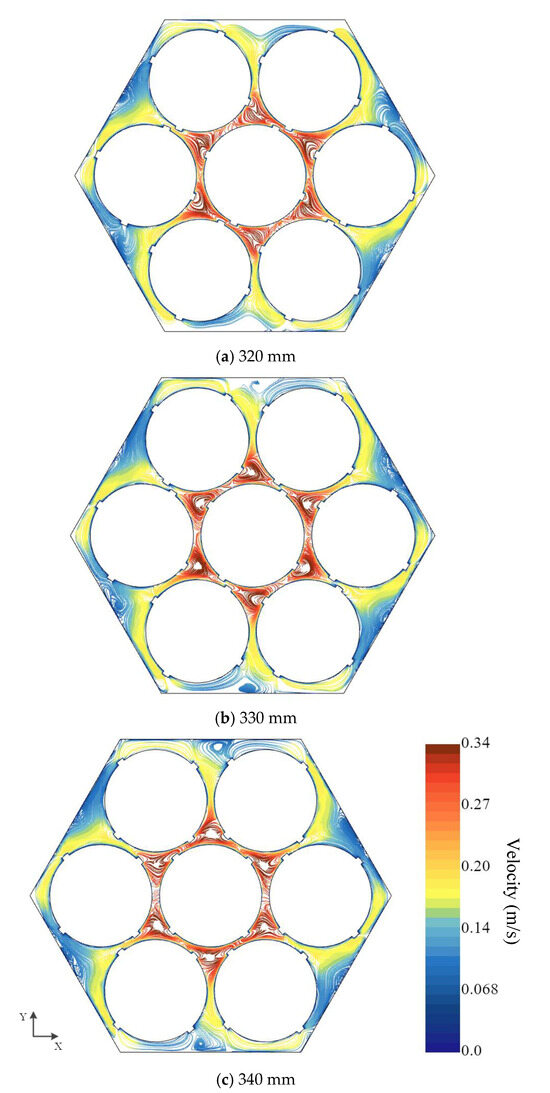
Figure 12.
Streamline velocity distribution under typical operating conditions.
In the subsequent studies on the spiral channel with coiled wire under vertical conditions, we will focus on the fluid within the fully developed region, i.e., the fluid in the channel beyond 330 mm from the inlet.
5. Results and Discussion
5.1. Numerical Analysis of Resistance Characteristics in Spiral Channel with Coiled Wire
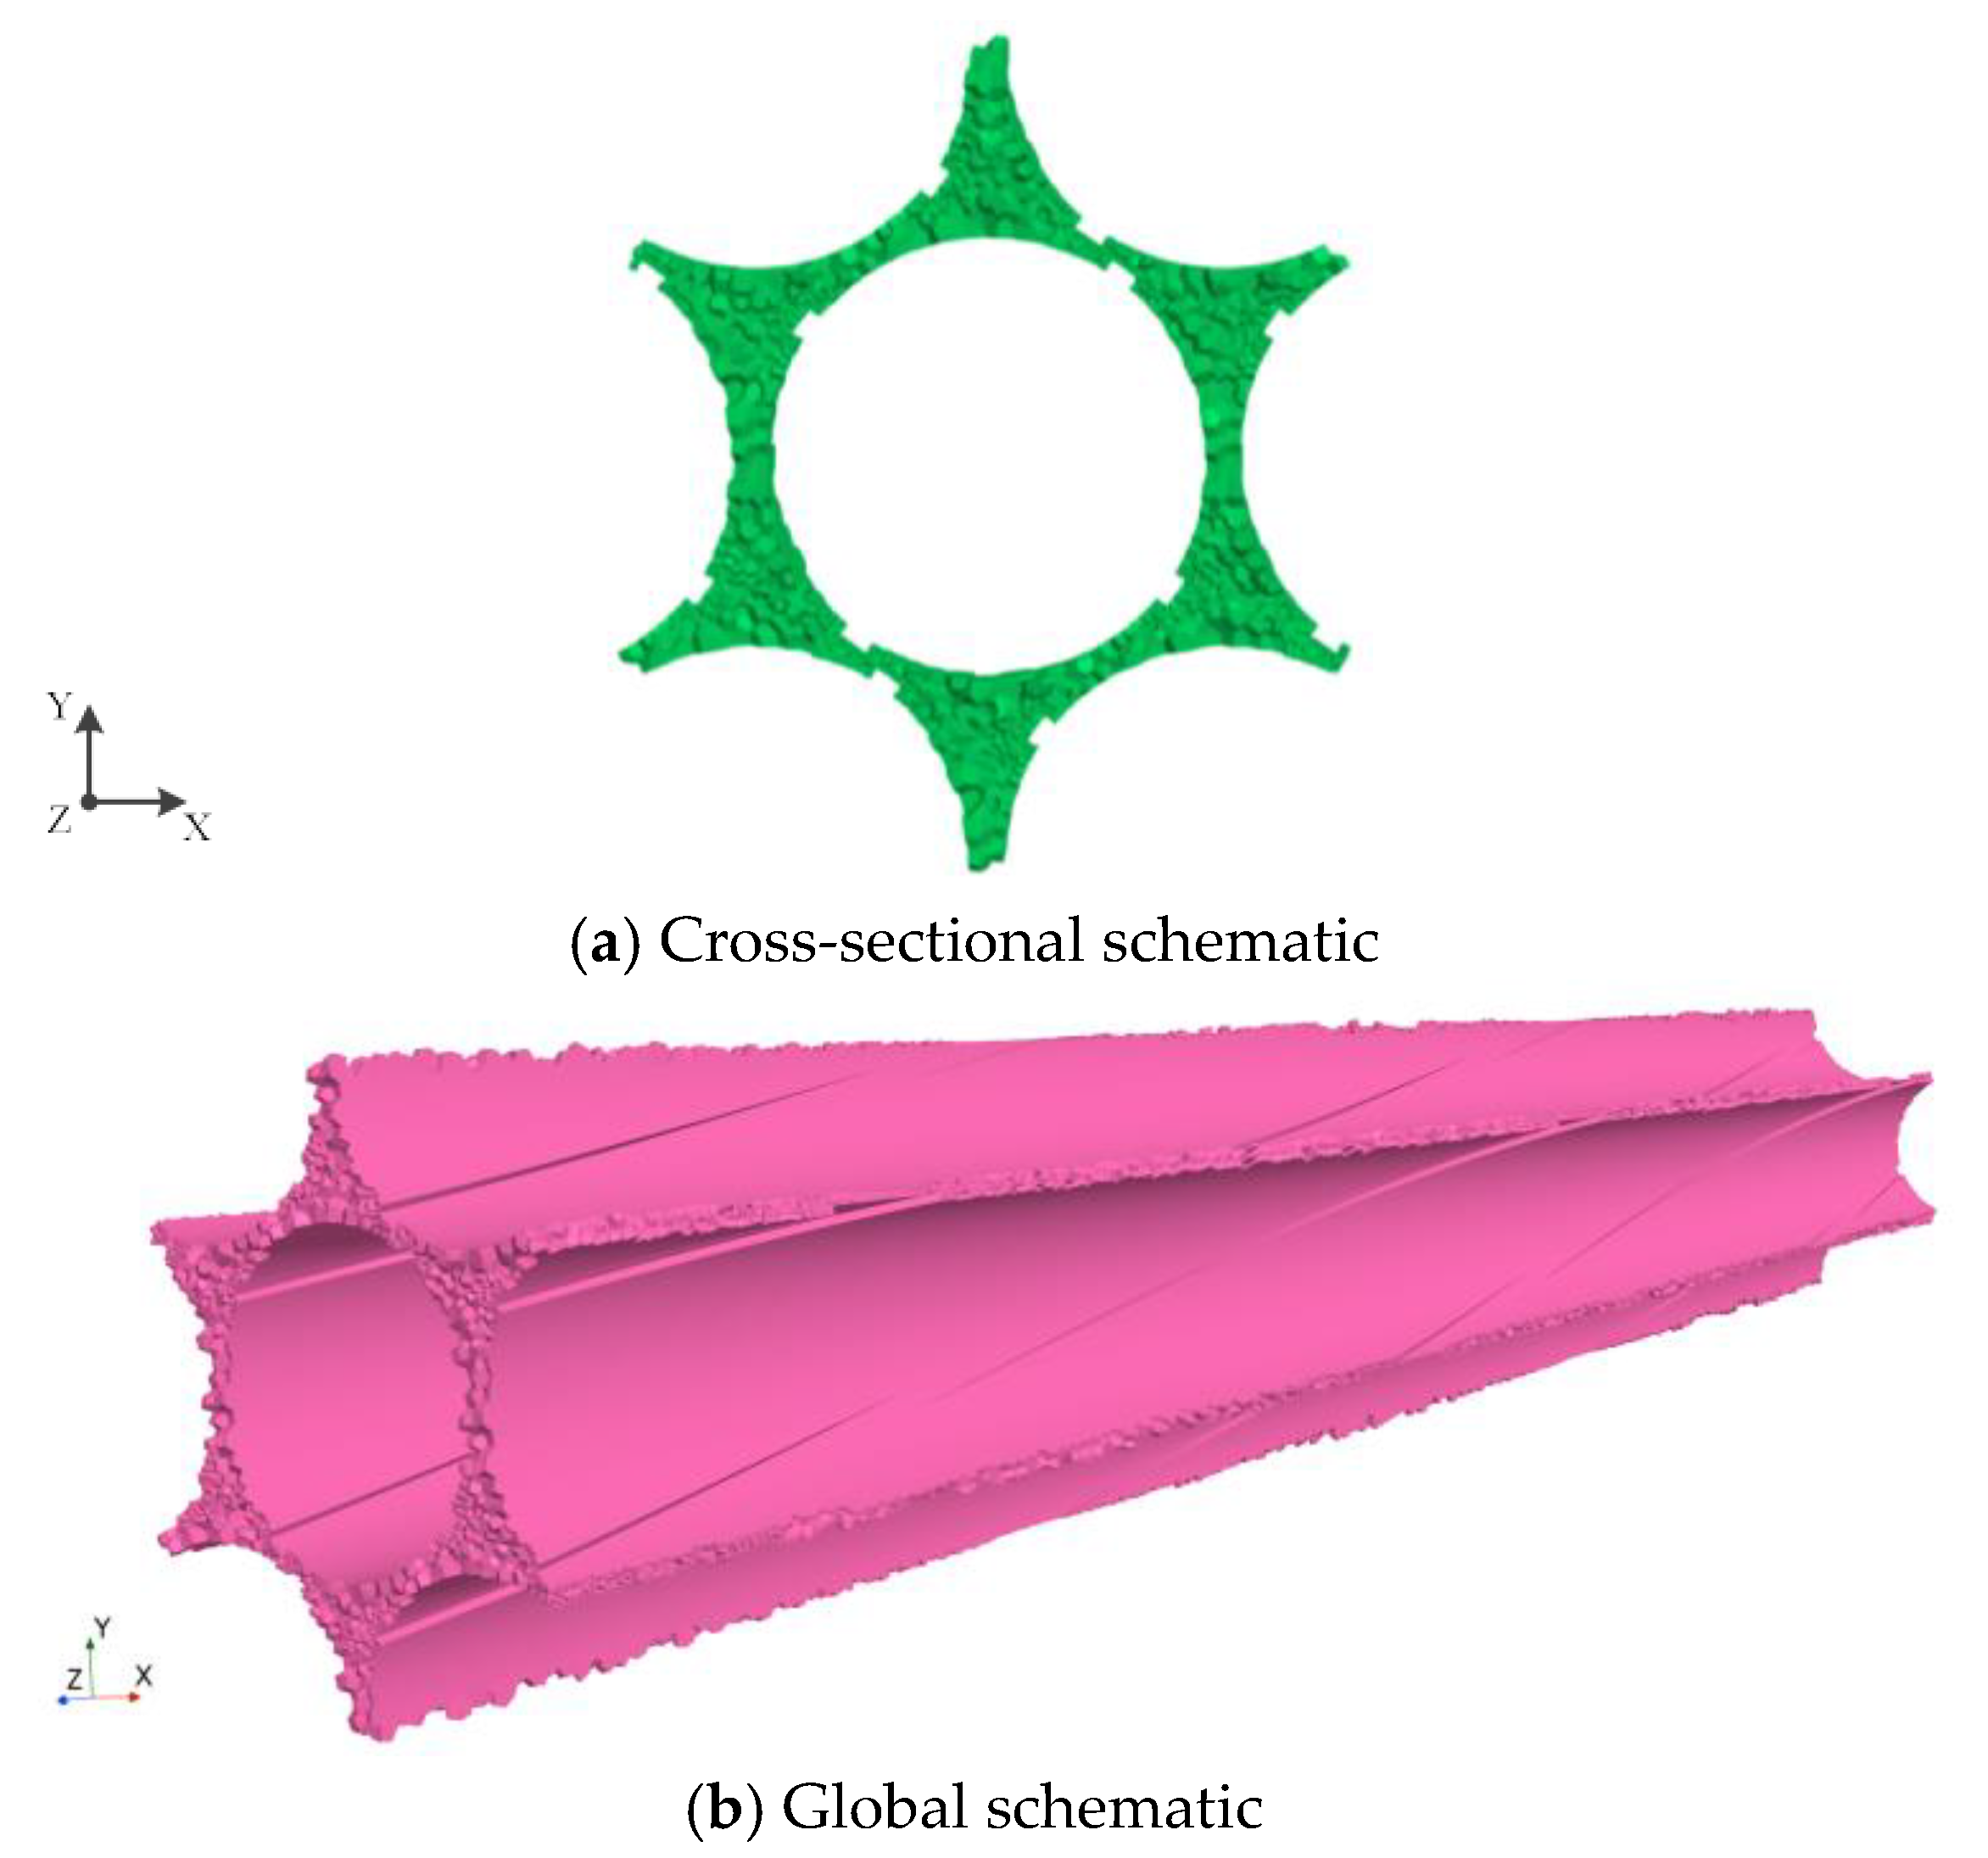
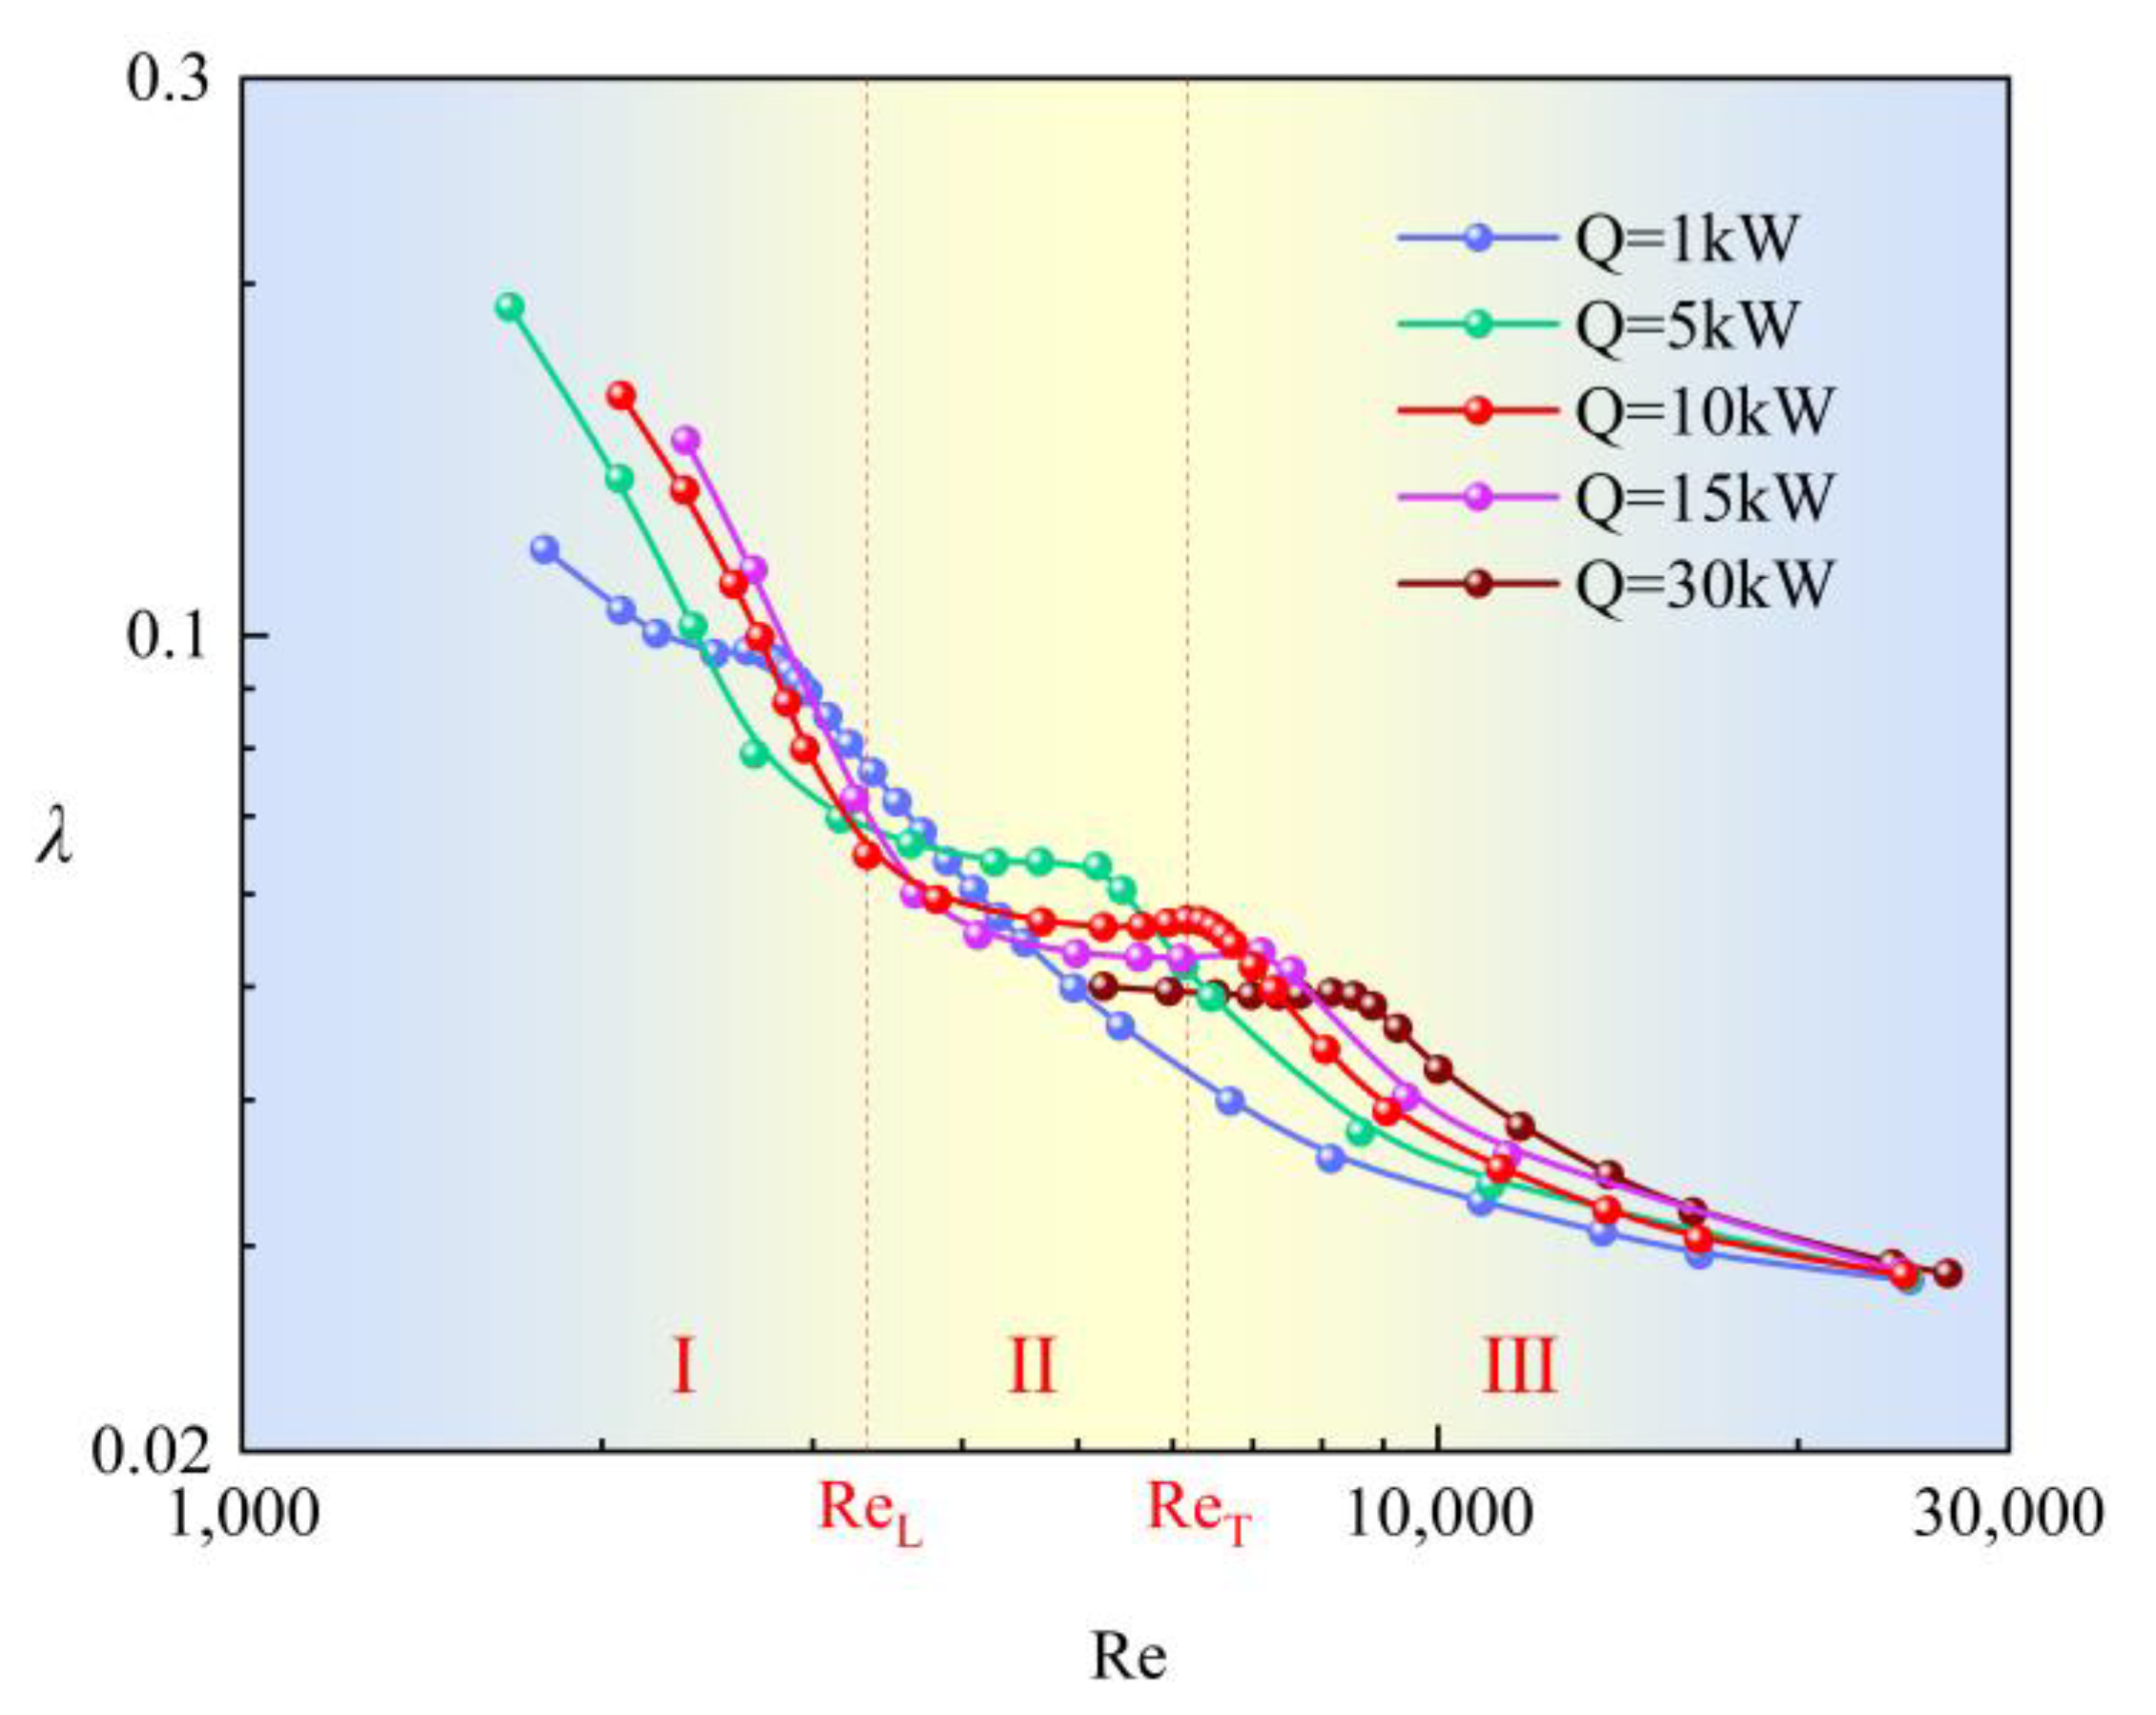
This section presents a numerical study of the frictional resistance in spiral channel with coiled wire under vertical conditions. The numerical simulation results for a 180 mm section of the spiral channel after the inlet were extracted to analyze the frictional resistance characteristics within the spiral channel with coiled wire. During the simulation, the inlet temperature of the channel was maintained at 550 K, and the system pressure was kept at 15 MPa. The frictional resistance coefficient λ was calculated for different Reynolds numbers by varying the inlet velocity. To investigate the effect of different heat transfer powers on the frictional resistance characteristics, studies were conducted for heat transfer powers Q = 1, 5, 10, 15, and 30 kW. Data from the fully developed section were extracted from the STAR-CCM+ simulation results, and to minimize the influence of the hexagonal casing, only the region of the central sub-channels shown in Figure 13 was used for data analysis. The variation curve of the frictional resistance coefficient with the Reynolds number is shown in Figure 14. When extracting data, the surface average values of the parameters of interest (including temperature, pressure, etc.) were taken as the parameters at the selected cross-sections. The average values of the parameters at the two ends of the extracted 180 mm fully developed section were used as the results for the current operating conditions. The Reynolds number Re and the frictional resistance coefficient λ for the current operating conditions were then calculated using Equations (3) and (5).
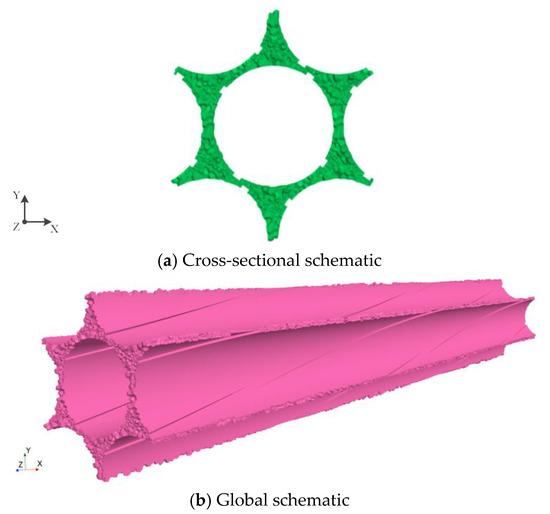
Figure 13.
Schematic of the central sub-channels (with mesh).
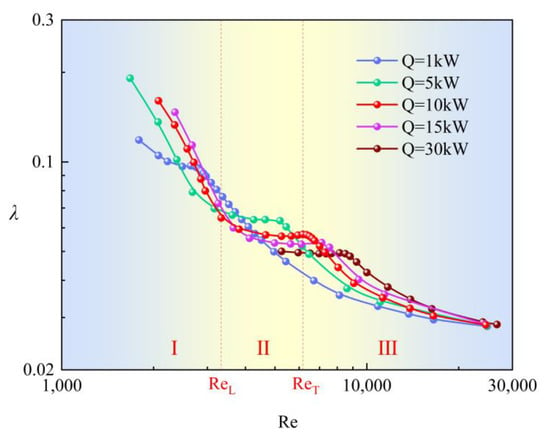
Figure 14.
Numerical simulation results of λ with different heat transfer powers.
From the figure, it can be observed that for the same heat transfer power, the frictional resistance coefficient λ in the spiral channel with coiled wire generally decreases with the increase of the Reynolds number. Based on the characteristics of the curves, the flow state of the fluid within the spiral channel with coiled wire can be divided into three regions: I. Laminar region, II. Transition region, III. Turbulent region. For better understanding, the condition with a heat transfer power Q = 10 kW is used as an example, and the regions are indicated in red in Figure 14. The characteristics of each region are described below.
- I.
- Laminar Region
When Re < ReL, the flow is in the laminar region. The frictional resistance coefficient in this region is the highest and essentially follows a straight line in a logarithmic coordinate system. Without considering heat transfer, the frictional resistance coefficient in the laminar region of the spiral channel with coiled wire can be fitted using the formula for a regular circular pipe:
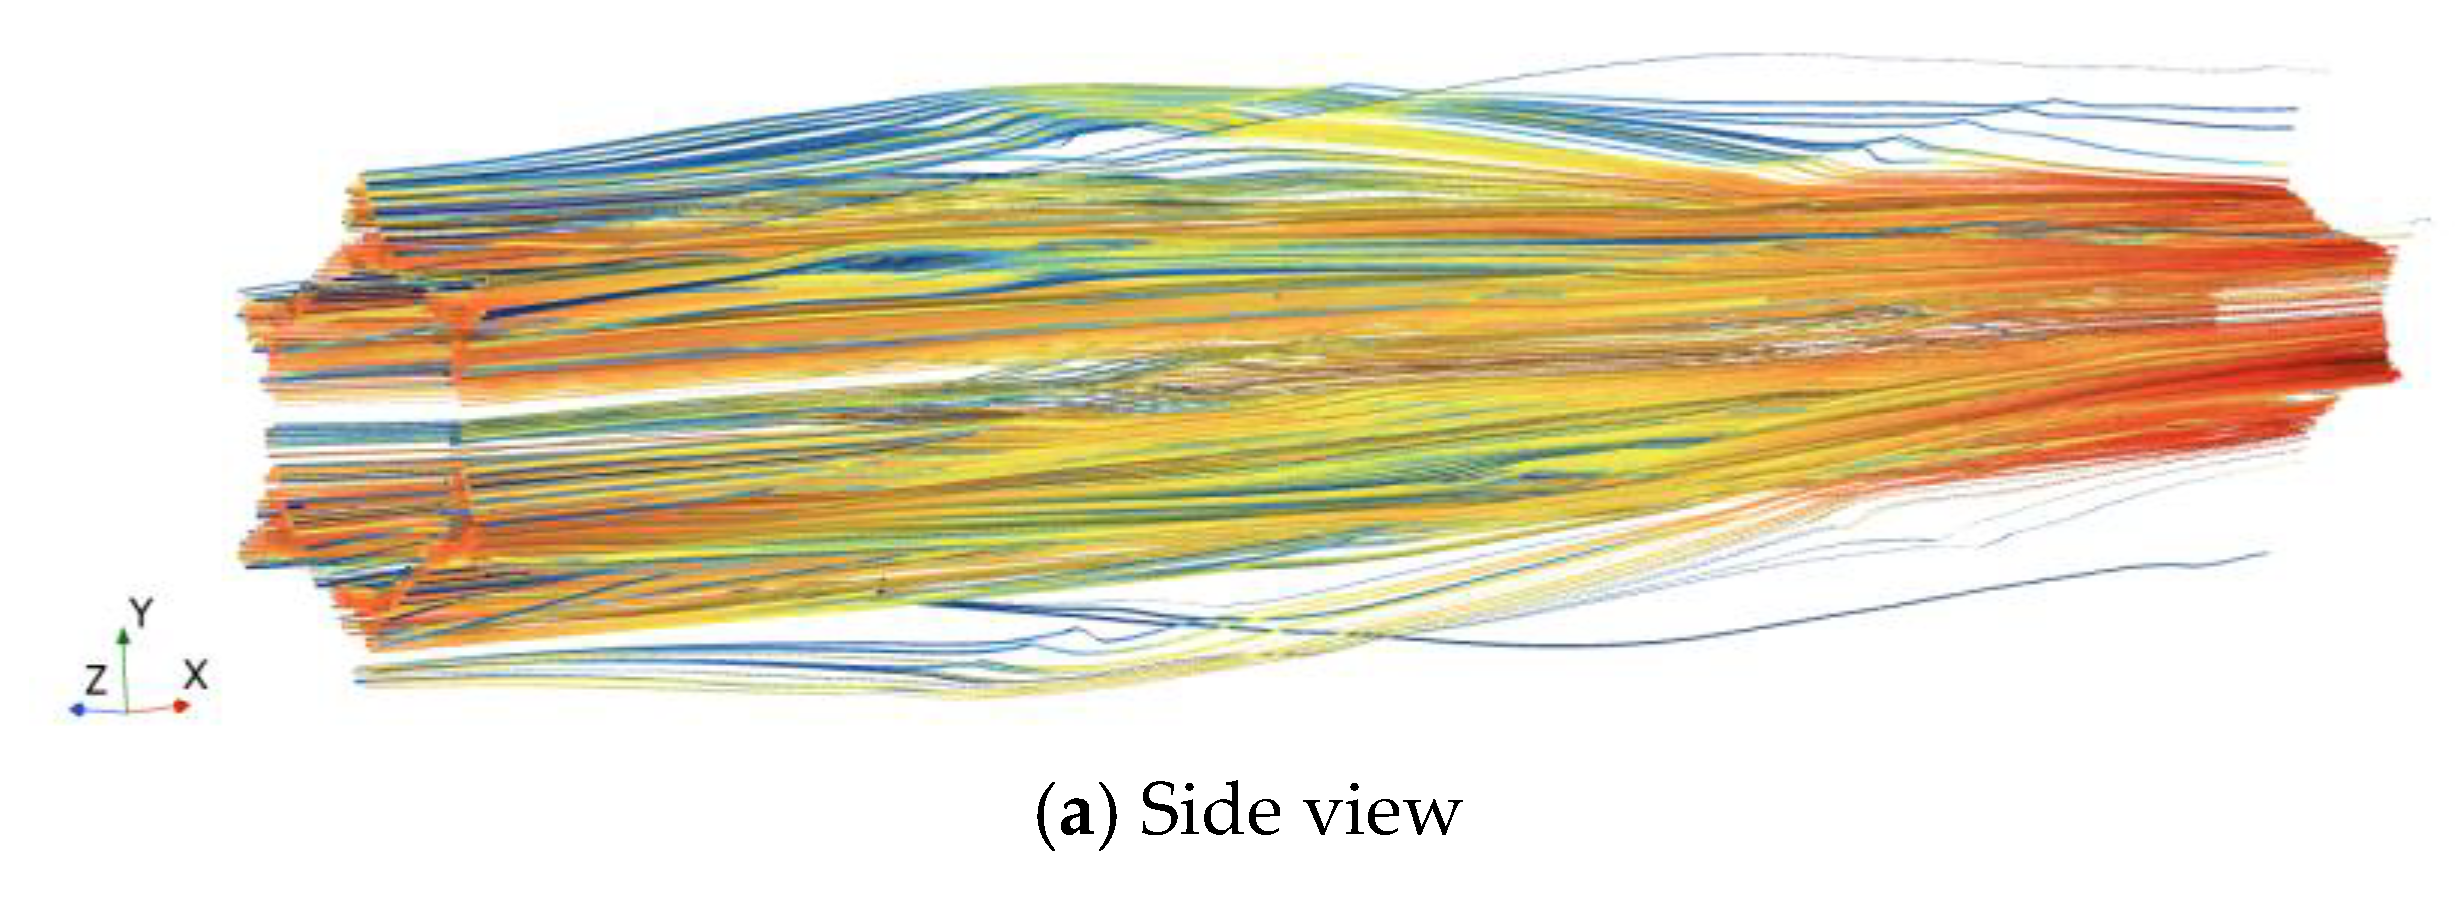
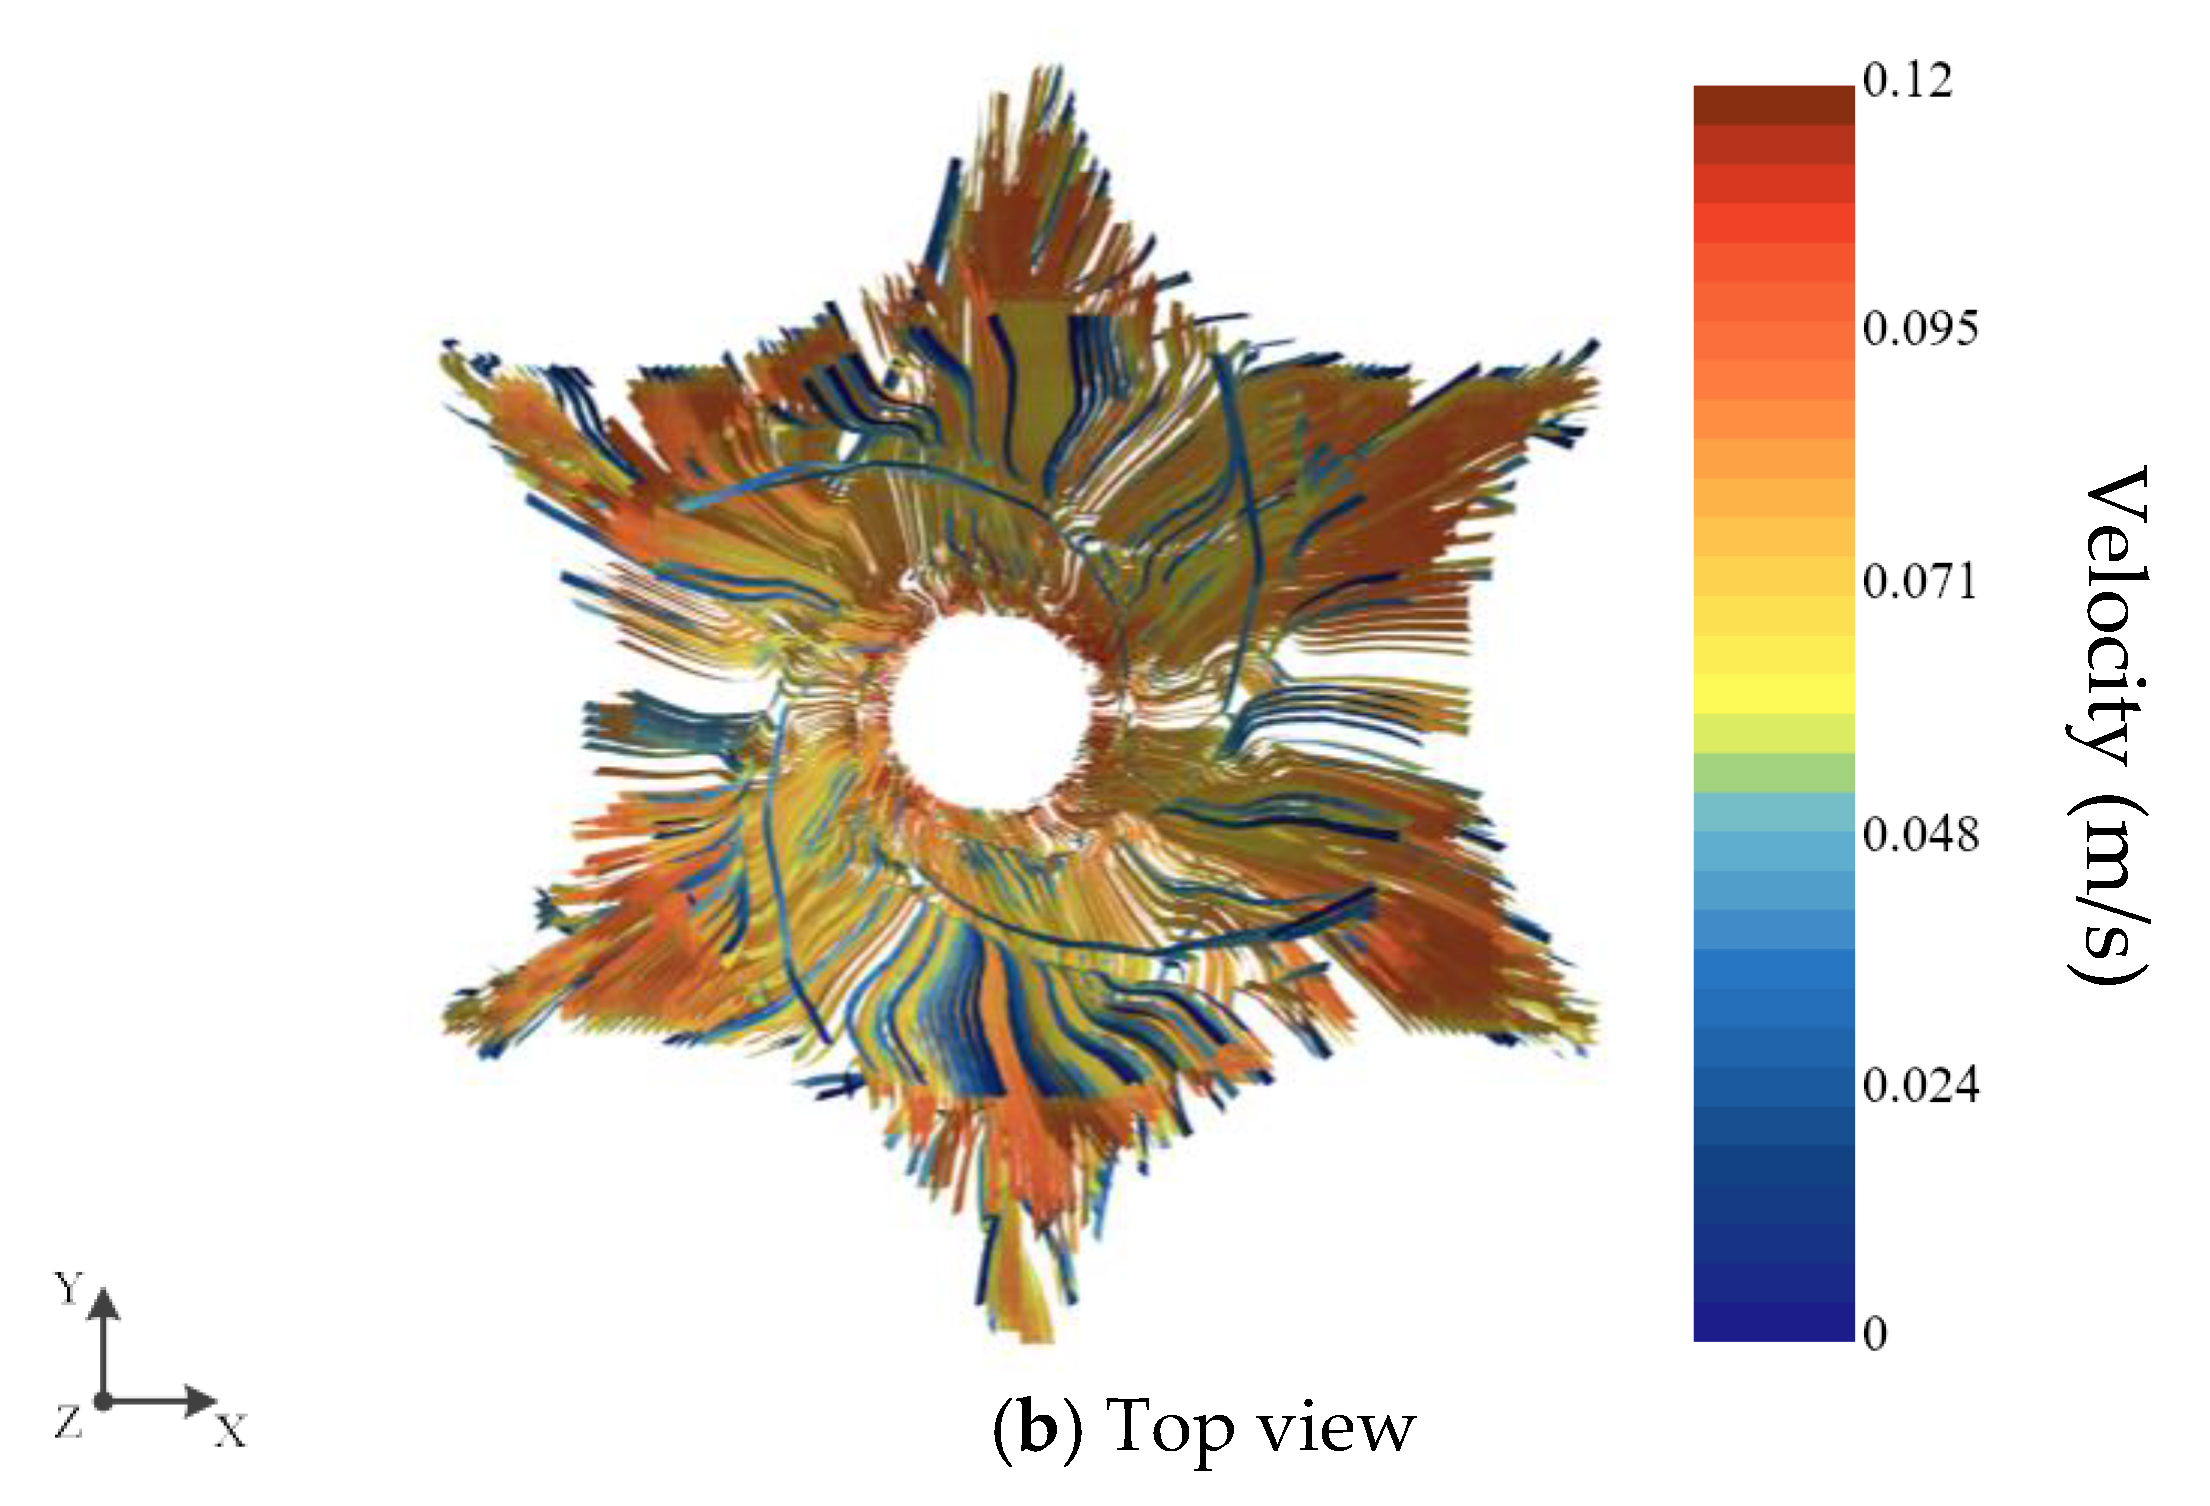
where CL is a constant that can be determined from the data. In the spiral channel with coiled wire, due to the influence of the channel geometry, vortices are formed in the flow path, as shown in Figure 15. The direction of gravity in the figure is opposite to the z-axis, and the fluid flows from top to bottom. These vortices increase the mixing and energy dissipation of the fluid, thereby causing the frictional resistance coefficient in the channel to be much higher than that in a regular circular pipe [27], i.e., CL > 64.
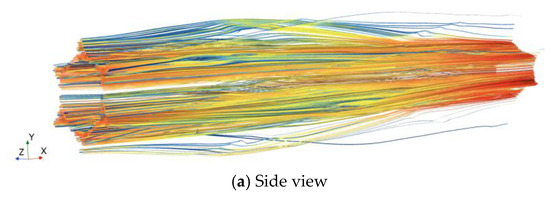
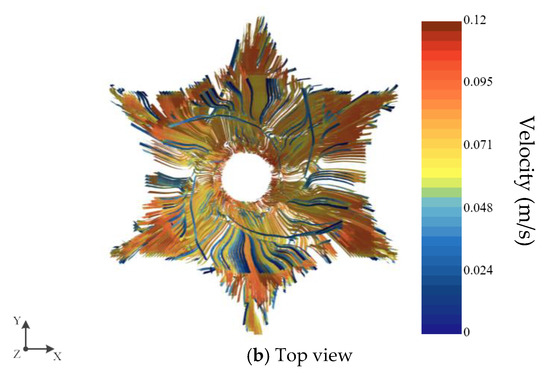
Figure 15.
Streamline schematic for laminar flow condition (Q = 10 kW, Re = 2577).
It is also worth noting that the transition point ReL from the laminar region to the transition region in the spiral channel with coiled wire varies under different heat transfer powers: the higher the heat transfer power, the higher the critical Reynolds number for the transition from laminar to turbulent flow in the spiral channel. This is because as the heat transfer power increases, the average temperature of the fluid decreases, and the viscosity increases, delaying the transition from laminar to turbulent flow. When the fluid has a higher viscosity, the intermolecular forces are greater, which increases the stability of the flow, inhibits the increase in turbulent intensity, reduces the formation of vortex structures, and makes the fluid more inclined to maintain a laminar flow state. Moreover, the critical Reynolds number in the spiral channel with coiled wire is higher than that in a regular circular pipe, as the secondary flow effects in the spiral channel compete with the instability of the transition from laminar to turbulent flow, thereby delaying this transition [28,29].
For the condition with a heat transfer power of 30 kW, due to the high cooling power, the fluid temperature can become negative at low Reynolds numbers; thus, in this study, there is no laminar region under this heat transfer power.
- II.
- Transition Region
When ReL < Re < ReT, the flow is in the transition region. In this region, as the fluid velocity increases, the frictional resistance coefficient in the spiral channel with coiled wire first decreases and then slightly increases. This is because when the Reynolds number of the fluid is low, the flow is primarily controlled by viscous forces; when the Reynolds number is high, the influence of inertial forces gradually becomes dominant. Under the combined effects of the transition in flow state and secondary flows, energy dissipation increases, thereby raising the frictional resistance coefficient. When heat transfer is not considered, the frictional resistance coefficient in the transition region can be calculated by non-linearly combining the friction factors of the laminar and turbulent flow regions. The relationship for the frictional resistance coefficient in the transition region of the spiral channel with coiled wire can be fitted using the following formula [2]:
In the formula, CL, CT, m, γ1, and γ2 are constants; ϕ is the intermittency factor, ranging from 0 to 1, which can be considered as representing the part of the flow field in the channel where the fluid is in the transitional flow; ReL is the Reynolds number transition point where the fluid transitions from the laminar region to the transition region in the spiral channel; ReT is the Reynolds number transition point where the fluid transitions from the transition region to the turbulent region in the spiral channel.
It can also be observed that as the heat transfer power increases, the transition of the fluid in the channel from laminar to turbulent flow is delayed, causing the Reynolds number range of the transition region to shift to the right. This, in turn, leads to a decrease in the frictional resistance coefficient in the transition region as the heat transfer power increases.
- III.
- Turbulent Region
When Re > ReT, the flow is in the turbulent region. In this region, as the Reynolds number increases, the frictional resistance coefficient λ continues to decrease. This is because when the Reynolds number of the fluid is high, the internal vortices and turbulent disturbances within the fluid help to thin the boundary layer, thereby reducing the frictional resistance coefficient in the spiral channel with coiled wire. When heat transfer is not considered, the relationship for the frictional resistance coefficient in the turbulent region of the spiral channel can be fitted using the following formula [2]:
In the formula, CT and m are constants, with values the same as those of the variables with the same symbols in Equation (16).
It can also be observed that as the heat transfer power increases, it gradually affects the fluid properties, which in turn affects the frictional resistance coefficient in the turbulent region of the spiral channel. Analysis shows that the influence pattern is the same as in the laminar region: the greater the heat transfer power, the greater the frictional resistance coefficient. However, this influence decreases with increasing Reynolds number and can be almost negligible when the Reynolds number exceeds 25,000. This is because at high Reynolds numbers, the flow velocity is very high, and the temperature drop of the fluid over a finite heat transfer length is small, leading to minimal changes in fluid properties; thus, resulting in a smaller impact on the frictional resistance coefficient.
Since then, a broad range of Reynolds numbers has been studied for the coiled wire spiral channel under vertical conditions. Because the fluid in the spiral channel is continuously cooled, there are some differences compared to the traditional Moody chart. This section refers to the naming method in the Moody chart and uses numerical simulation to analyze the variation trend of the frictional resistance characteristics in the coiled wire spiral channel under cooling conditions. The extensive range of operating conditions compensates for the shortcomings of experimental research. When the heat transfer power is large, leading to a significant difference between the average temperature of the fluid and the temperature of the solid heat transfer wall, the Reynolds number alone cannot fully reflect the influence of fluid property changes on the frictional resistance coefficient. At this time, the method of introducing the kinematic viscosity correction coefficient can be considered [30], and the prediction expressions of the frictional resistance coefficient in Equations (15)–(18) are corrected by multiplying the right side of Equations (15)–(18) by the kinematic viscosity correction coefficient ct, as follows:
In the formula, CN and n are constants; υw and υf are the kinematic viscosities calculated using the average wall temperature and the average fluid temperature, respectively, in units of m2/s. The form of the formula refers to the research method of E. N. Sieder and G. E. Tate [30], and then a large amount of data is used to fit the exponent n and the proportionality factor CN through nonlinear least squares fitting. After introducing the correction factor ct, the differences in the frictional resistance coefficient caused by changes in fluid viscosity under different temperature differences can be considered, thereby obtaining the expression for the frictional resistance coefficient λ in the coiled wire spiral channel under different heat transfer powers. According to the above method, a large number of numerical simulation results are analyzed, and the relationship between the λ and Re in the coiled wire spiral channel under cooling conditions is fitted as follows:
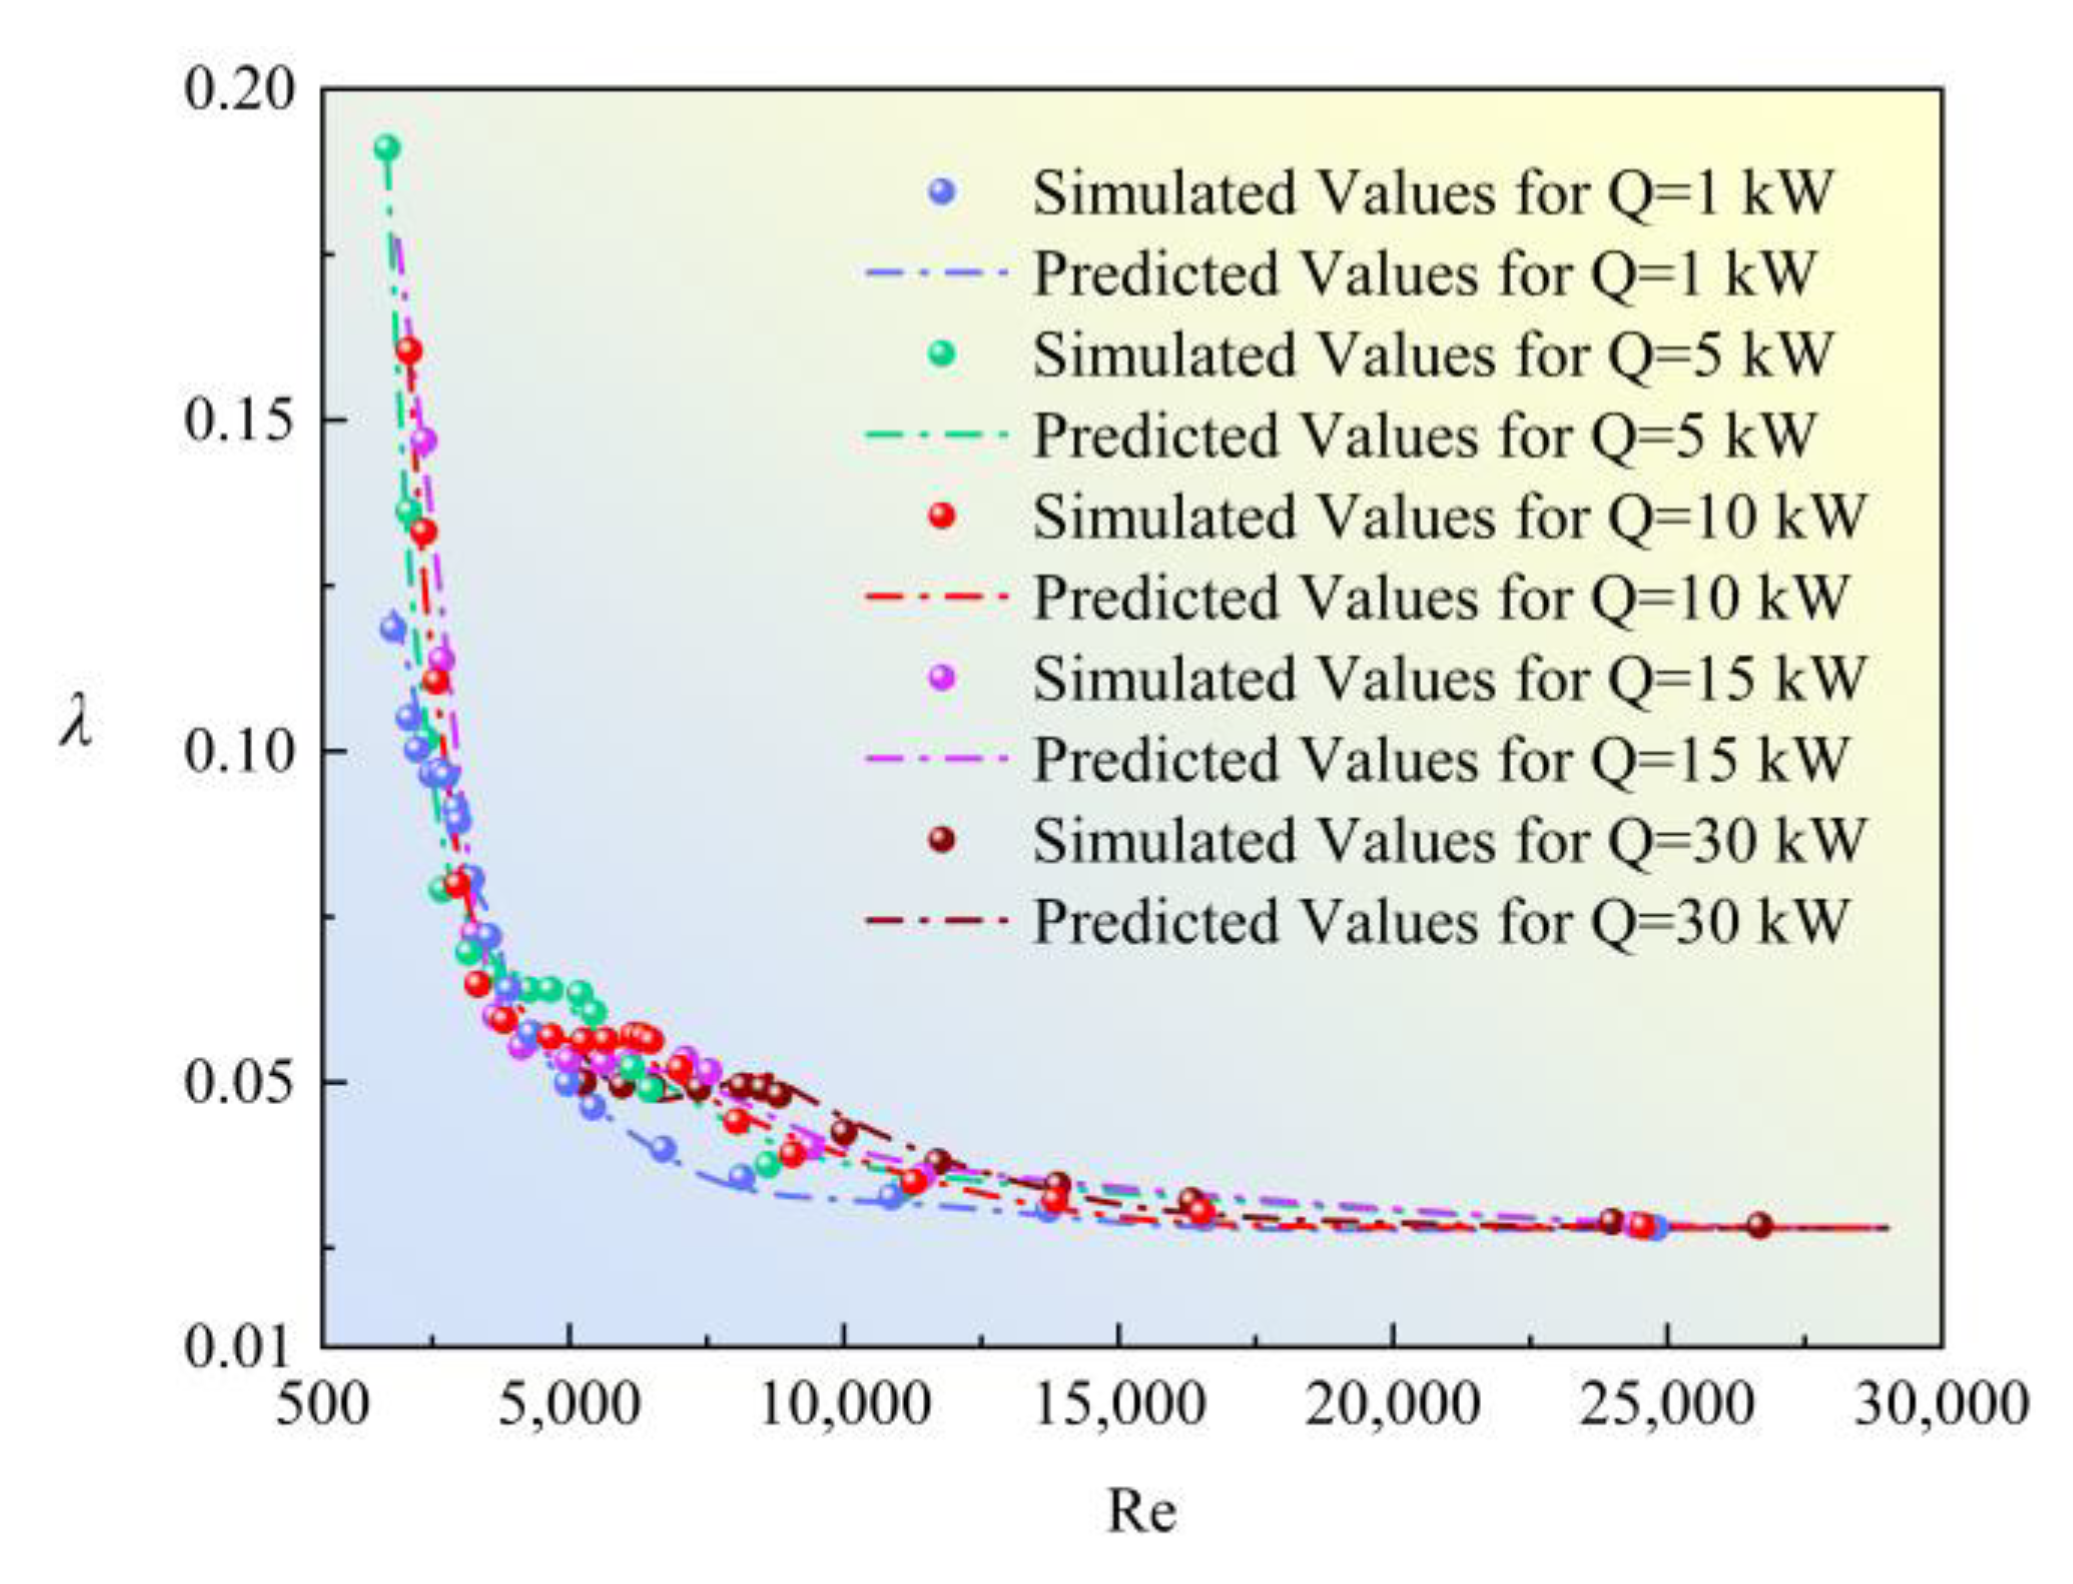
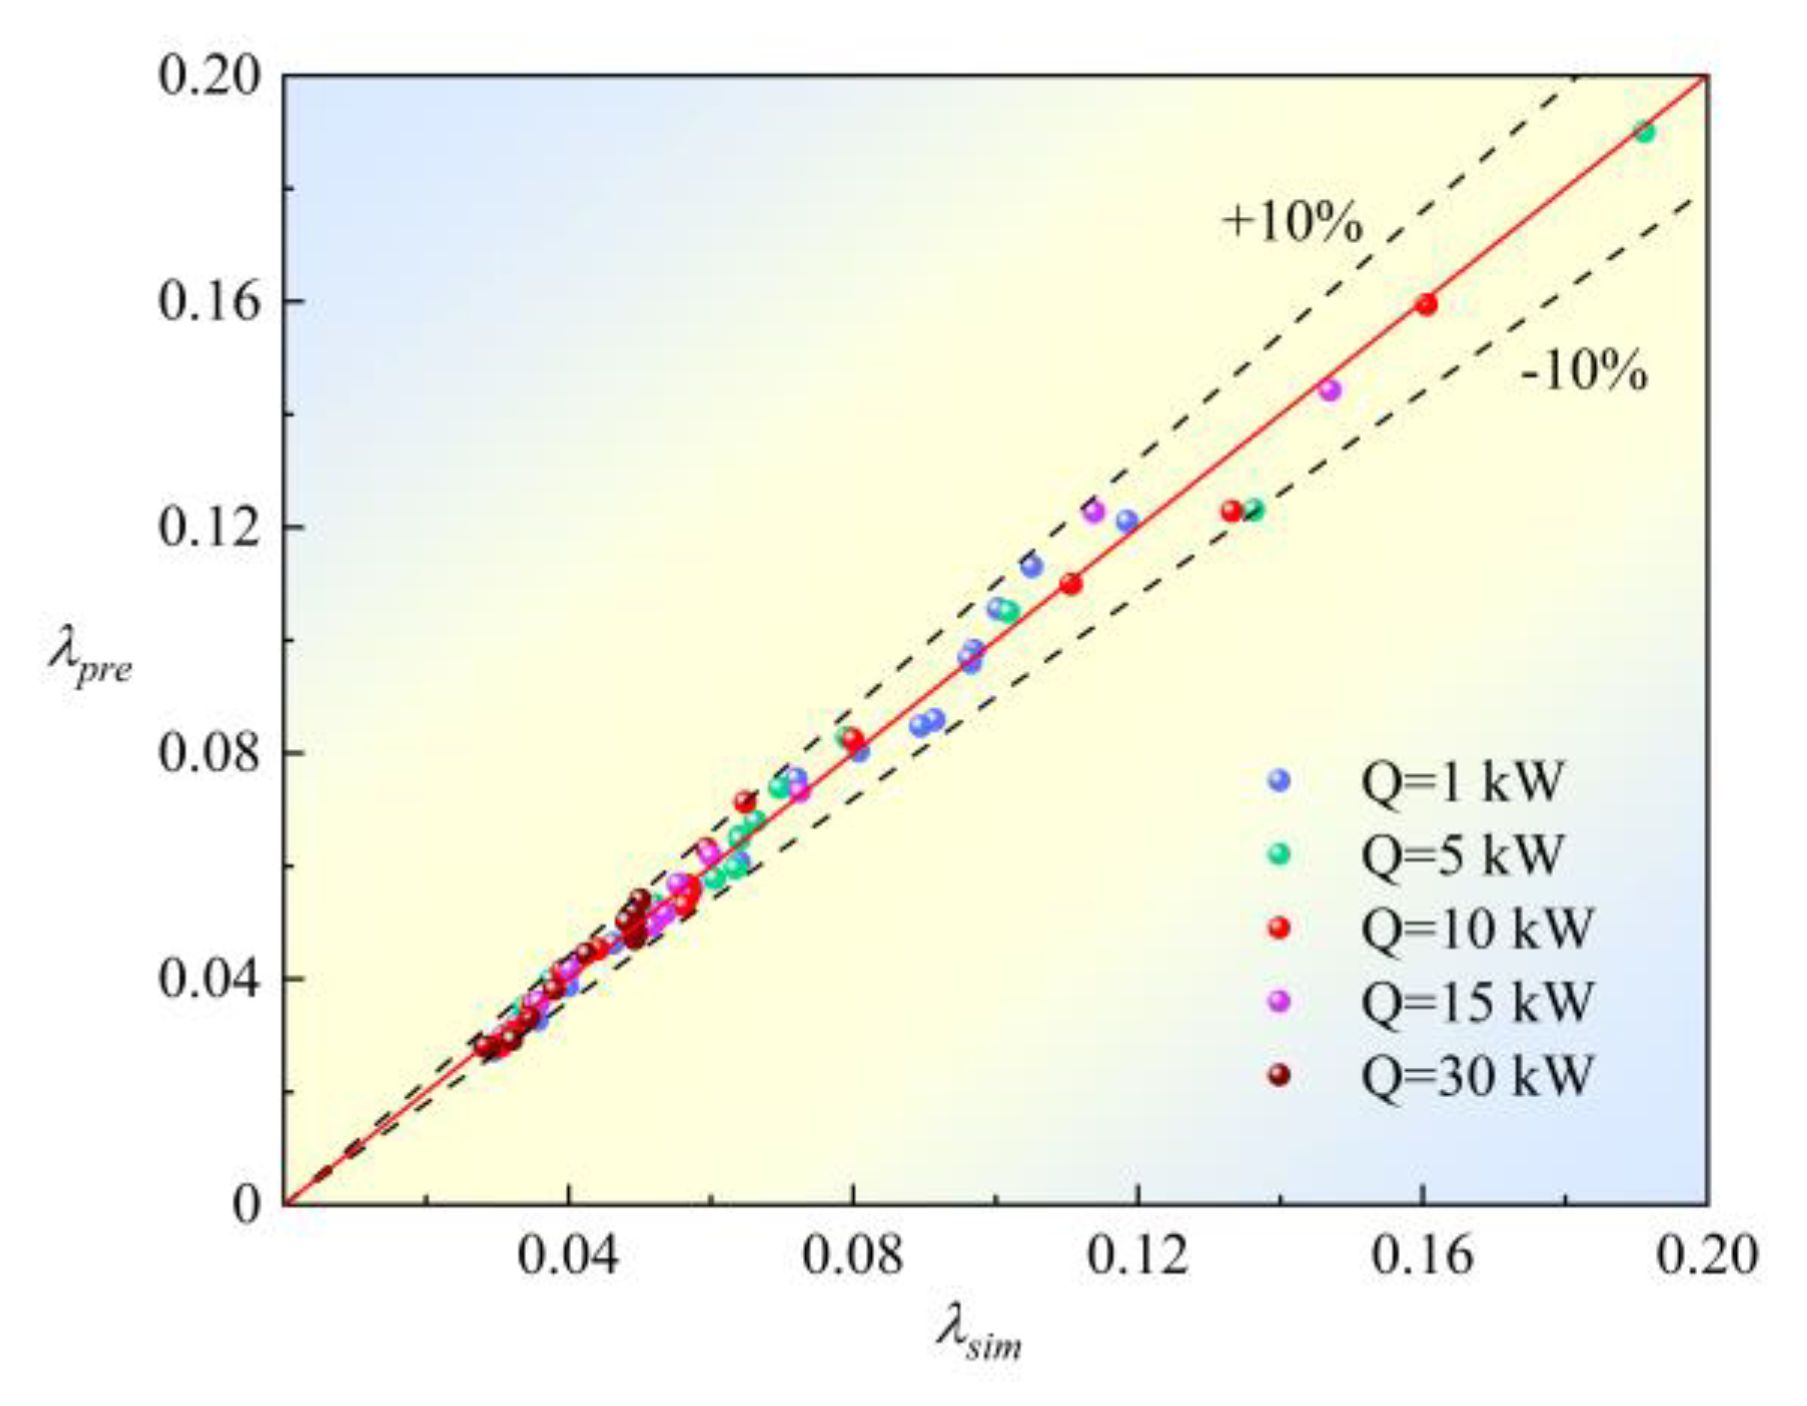
From the above formula, it can be seen that the frictional resistance coefficient in the coiled wire spiral channel under vertical conditions is closely related to the fluid velocity, fluid property parameters (including density and kinematic viscosity), and the structural dimensions of the spiral channel with coiled wire (including the side length of the outer shell channel, the number and diameter of the rods, the rod center distance, and the coiled wire dimensions, etc.). After introducing the correction factor ct, the fitted curve is shown in Figure 16. The dashed line in the figure represents the prediction of the simulation values by the predictive correlation (20) developed in this section, and the corresponding simulation values are indicated by data points of the same color. It can be seen from the figure that the predicted frictional resistance coefficient results under different heat transfer power conditions match well with the simulation values, and their relationship is shown in Figure 17. It can be seen that Formula (20) can accurately predict the frictional resistance coefficient in the laminar, transition, and turbulent regions under different heat transfer power conditions, with the error controlled within ±10%. In this study, a large amount of data were verified, and the results showed that the predictive correlation of the frictional resistance coefficient has a good correlation with the numerical simulation results. Therefore, only the representative data mentioned above are presented. In future research, if the effect of heat transfer on the fluid needs to be considered, the same method can be used to fit the resistance coefficient relationship, which reflects the universality of the above method. The form of the expression remains consistent, but the proportionality factors and exponents in the correlation need to be adjusted accordingly for different research objects. The frictional resistance coefficient correlation proposed in this section for vertical conditions is applicable to the operating range of Reynolds numbers 1000–30,000, system pressures 14–16 MPa, and heat transfer powers 1–30 kW.
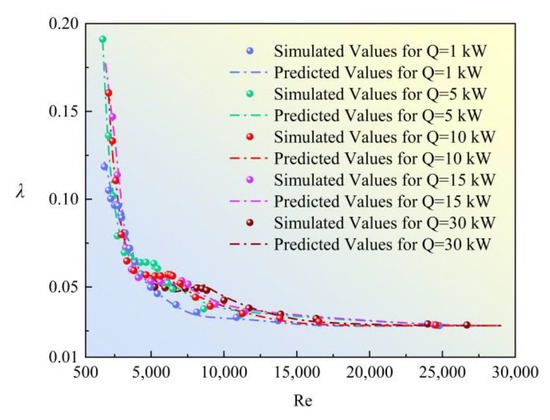
Figure 16.
Comparison between simulated and predicted frictional resistance coefficients with different heat transfer powers. (The lines represent the predictions from the correlation function developed in this paper for the simulated values, which are shown as data points of the same color).
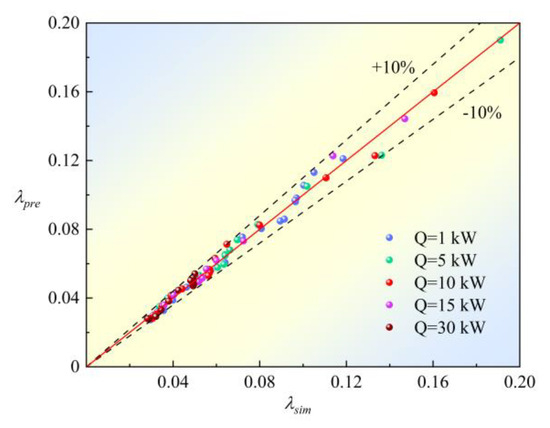
Figure 17.
Relationship between simulated and predicted frictional resistance coefficients with different heat transfer powers.
5.2. Detailed Study of Axial Resistance Characteristics
In the previous section, we investigated the frictional resistance characteristics of the coiled wire helical channel under vertical conditions and calculated the frictional resistance coefficient within the fully developed section. However, the study in the previous section treated the fluid within the fully developed section as a whole. In reality, under cooling conditions, the fluid properties vary along the axial direction of the channel, which in turn causes the frictional resistance coefficient to change along the axial direction of the channel. The frictional pressure drop per unit length can be expressed as:
Here, G = ρv is the mass flux, in units of kg/m2·s. Therefore, the total frictional pressure drop ΔPf across the channel should be the integral of dPf/dz along the channel:
Here, De is the equivalent diameter, which is a constant for the subject of this study. Moreover, for a single operating condition, the mass flux along the axial direction of the channel is also a constant. Therefore, the above formula can be rearranged as:
This is the precise calculation formula for the frictional pressure drop along the cooling channel. Since it is difficult to obtain the distribution of density ρ and the frictional resistance coefficient λ along the axial direction of the channel, the above formula is not used for solving in practical engineering applications. Instead, the method used in Section 5.1 is employed to simplify the calculation. This section takes advantage of the superiority of CFD simulation results by dividing the coiled wire spiral channel into several short segments of equal length. In each segment, due to the short cooling length, the cooling conditions have a negligible effect on the fluid properties within that segment, which can be ignored. Therefore, the density and frictional resistance coefficient in each segment can be considered as constants. The frictional pressure drop and density of each segment are then extracted from the CFD simulation results to calculate the frictional resistance coefficient for that segment. For any segment i of the spiral channel with coiled wire, the frictional resistance coefficient can be expressed as:
Here, Δz is the length of each segment of the channel, and to ensure the accuracy of the calculation results, Δz is taken as 0.01 m; ρi is the average density at the two ends of the i-th segment of the channel, in units of kg/m3; and ΔPfi is the frictional pressure drop of the i-th segment of the channel, in units of Pa. The frictional resistance coefficient λi is considered to be at the center of the i-th segment of the channel, and the frictional resistance coefficient for each segment is calculated separately to obtain the distribution of the frictional resistance coefficient along the axial direction of the coiled wire spiral channel in the fully developed section. This allows us to explore the variation pattern of the frictional resistance coefficient along the axial direction of the coiled wire spiral channel. This section analyzes the fully developed fluid in the 180 mm section after the entrance length, focusing on the three regions of the frictional resistance characteristic curve for the coiled wire spiral channel discussed in Section 5.1. The friction characteristics along the axial direction of the spiral channel are studied for each region under the condition of a heat transfer power of 10 kW.
5.2.1. Axial Frictional Resistance Characteristics in Laminar Region
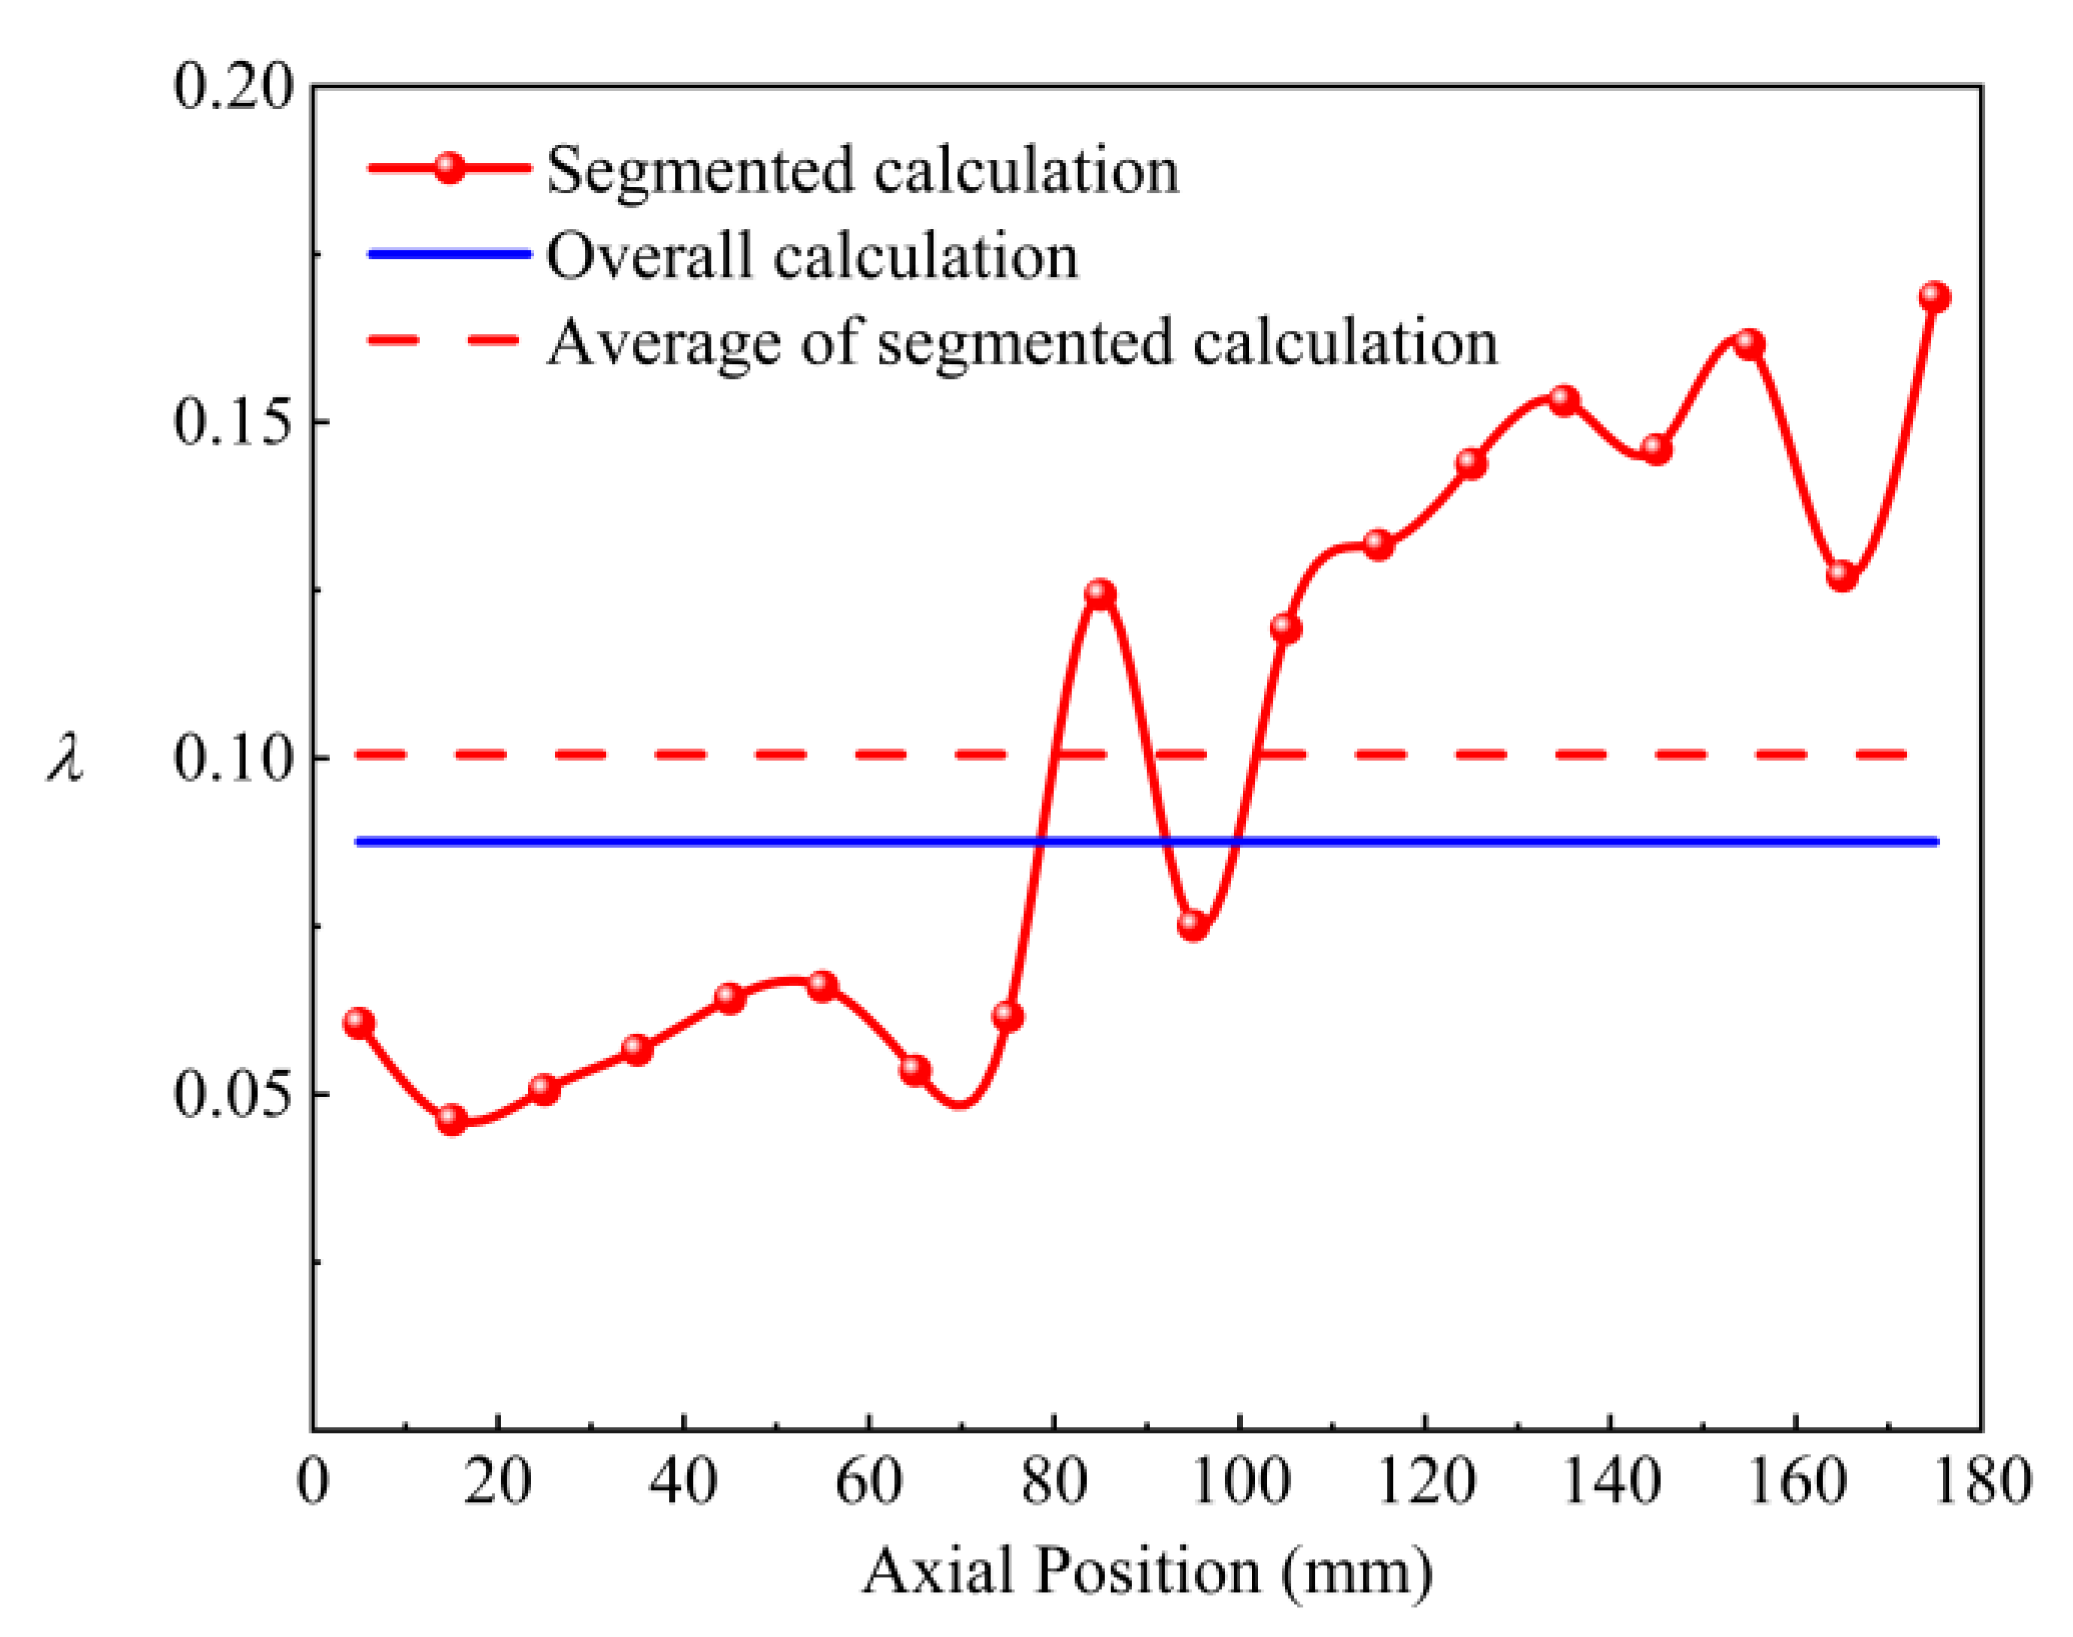
This section selects the simulation results under the condition of Re = 2857 to analyze the axial frictional resistance characteristics in the laminar region, as shown in Figure 18. The segmented calculation results in the figure are the frictional resistance coefficients along the cooling coiled wire spiral channel obtained according to Equation (24). The overall calculation results are the frictional resistance coefficients obtained by calculating the entire fully developed section as a whole, as described in Section 5.1. The average value of the segmented calculations represents the average of the segmented calculation results at different positions. The axial position on the horizontal axis indicates the distance from the inlet cross-section of the fully developed section of the channel. It can be seen that the frictional resistance coefficient distributed along the axial direction of the channel in the laminar region fluctuates significantly, with the maximum fluctuation reaching 67.6% compared to the average value of the segmented calculations; it can also be noted that the overall calculation results are lower than the average value of the segmented calculations, with a difference of 12.9%. The fluid velocity in the laminar region is low, and the fluid properties change significantly along the axial direction due to cooling, with large heat transfer disturbances and many influencing factors, which are the main reasons for the large fluctuations in the frictional resistance coefficient. Additionally, it can be observed that the frictional resistance coefficient along the channel increases overall in the direction of fluid flow. This is because the fluid velocity in the laminar region is low, and the fluid temperature decreases significantly during flow, leading to a substantial increase in viscosity, which in turn causes the frictional resistance coefficient to rise overall along the channel.
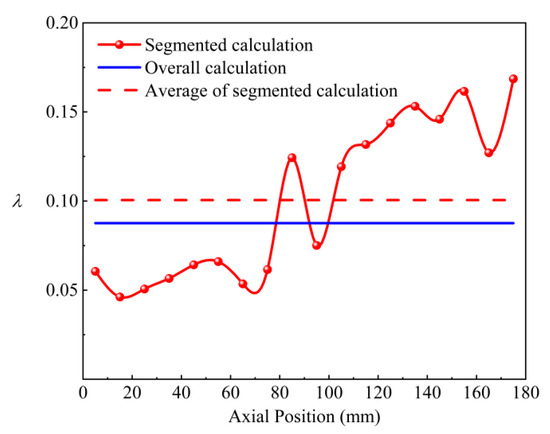
Figure 18.
Distribution of axial frictional resistance coefficient in laminar region.
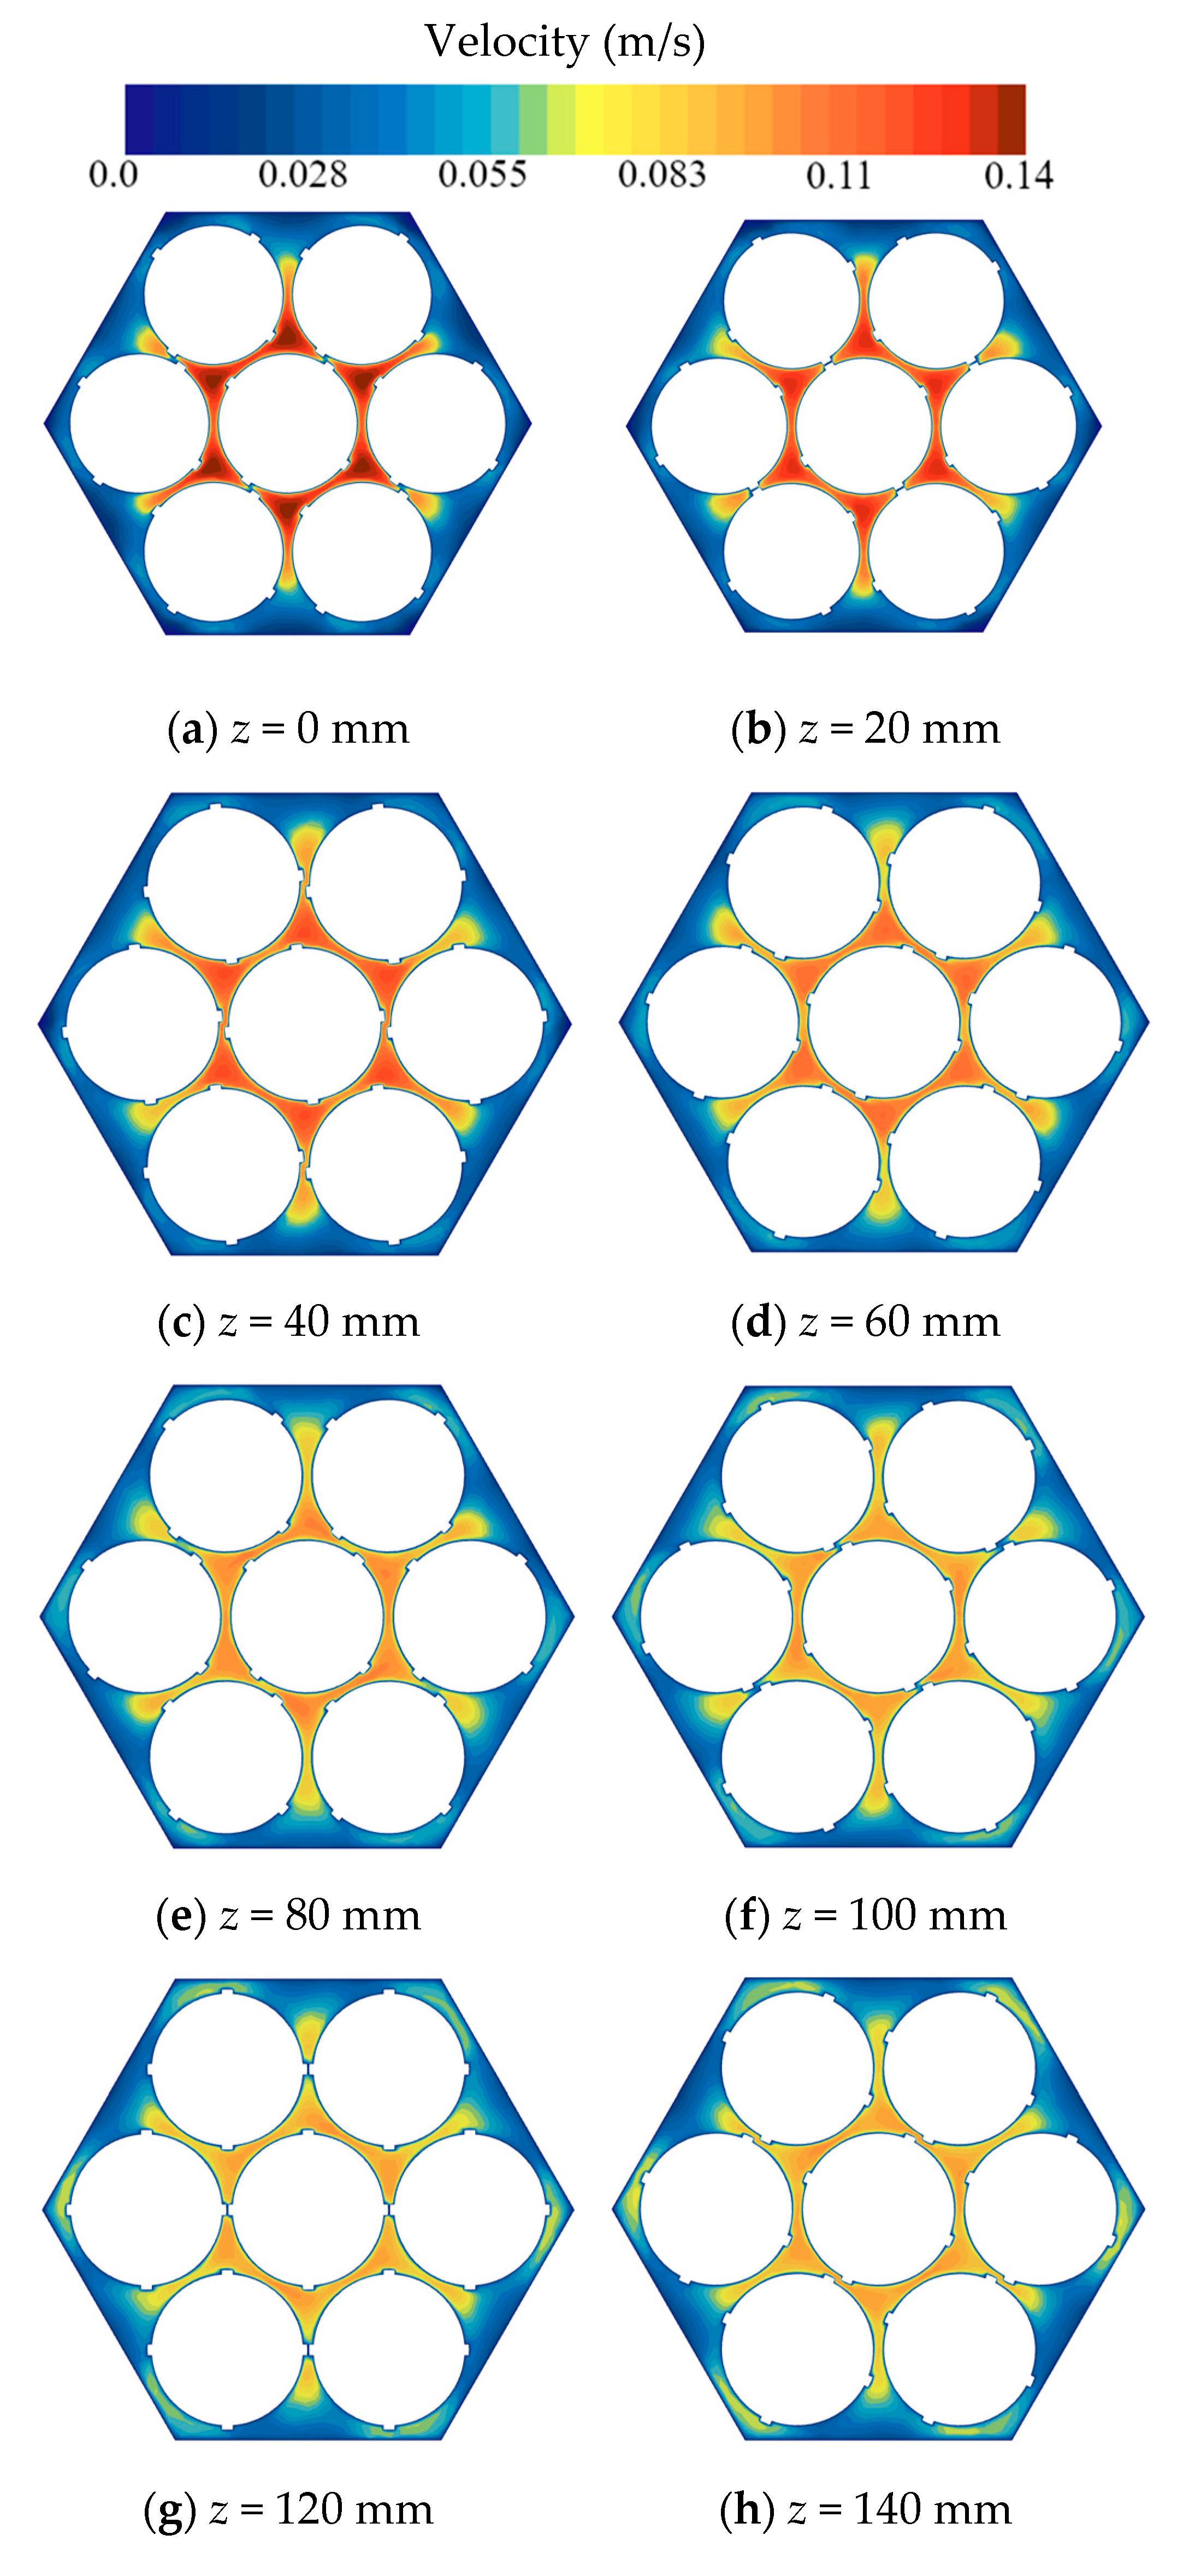
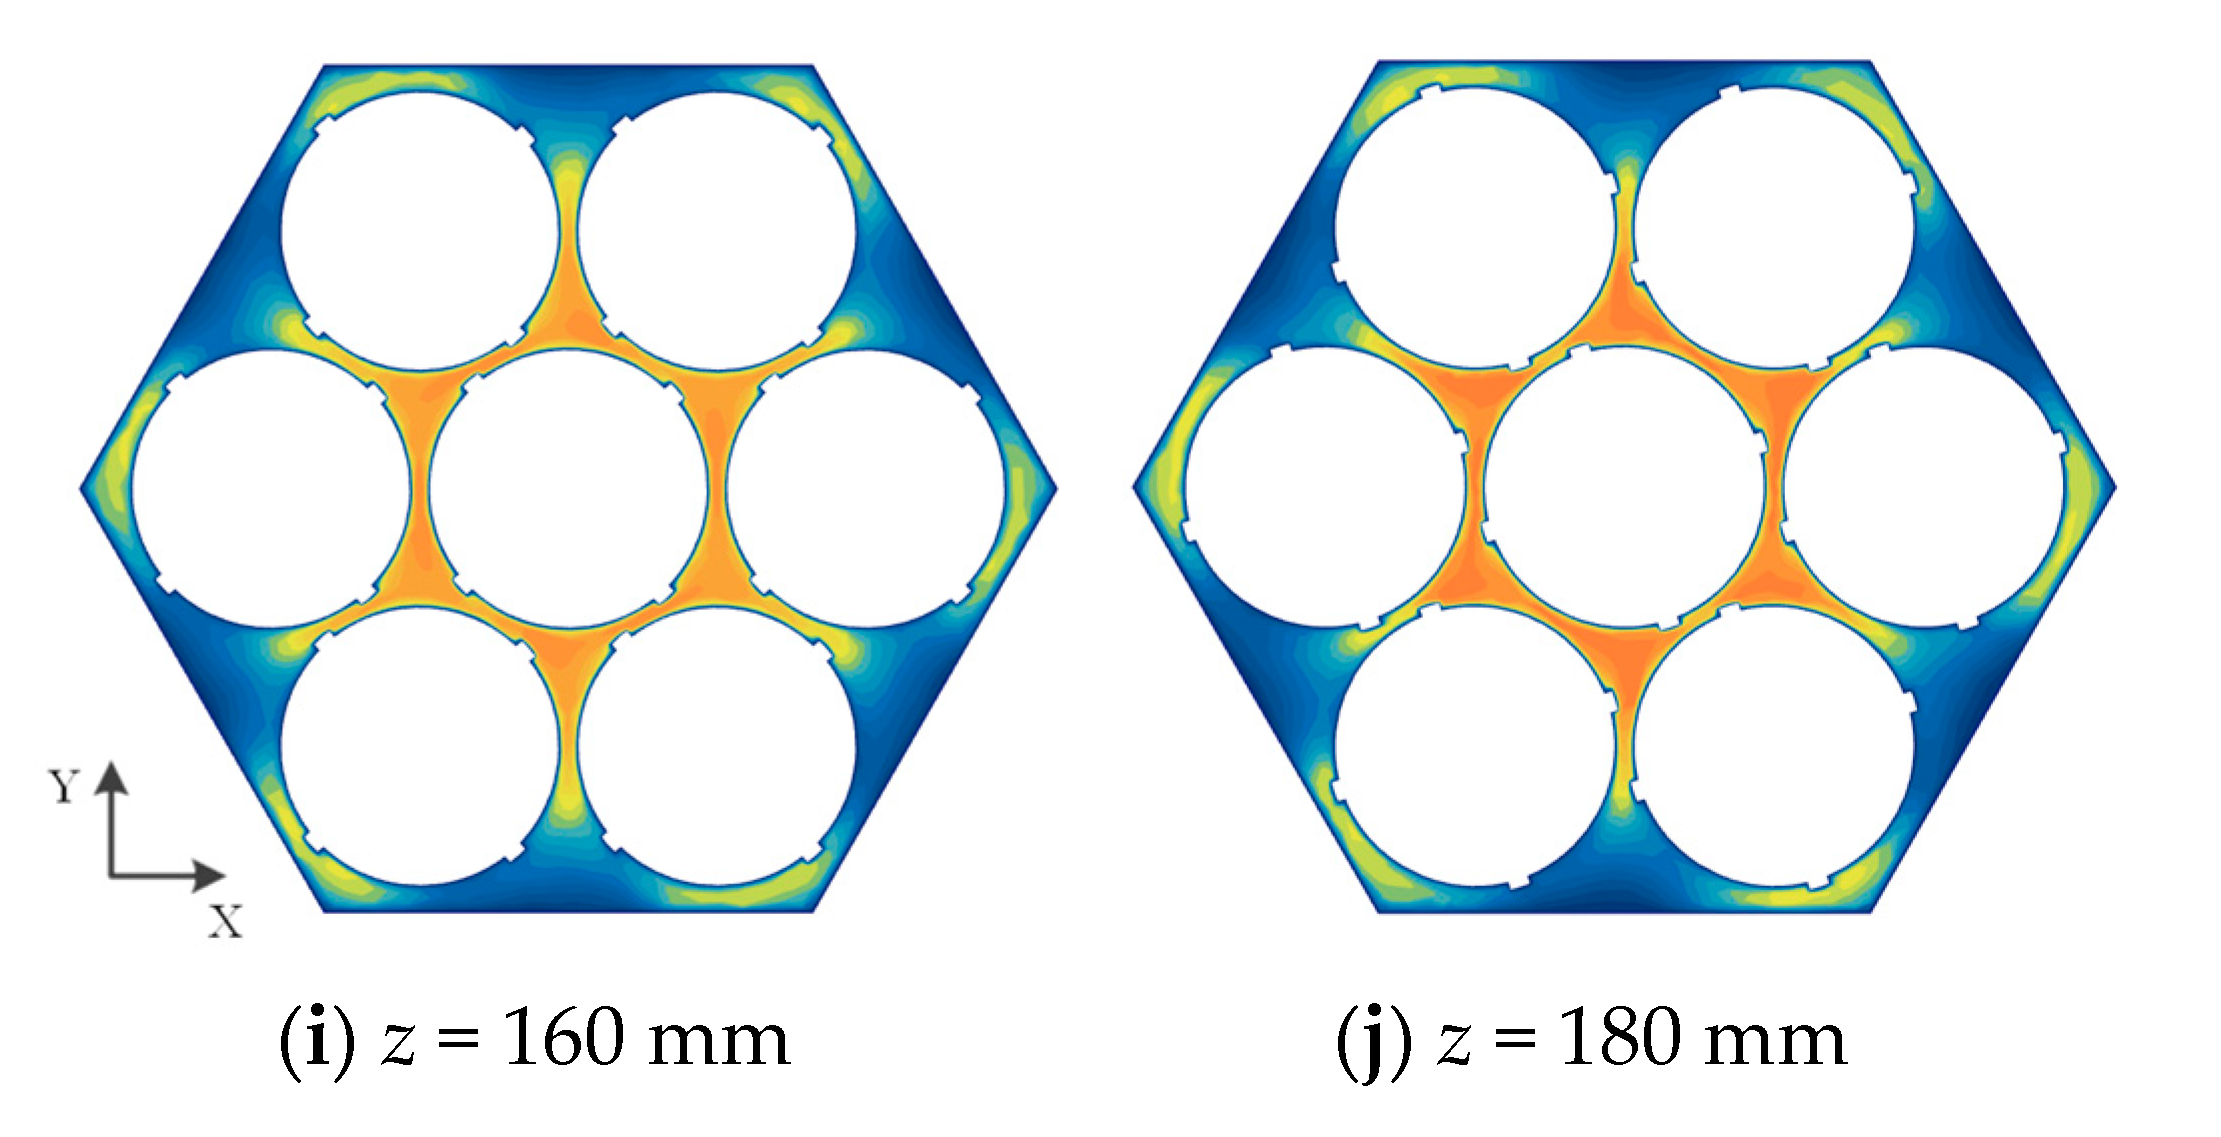
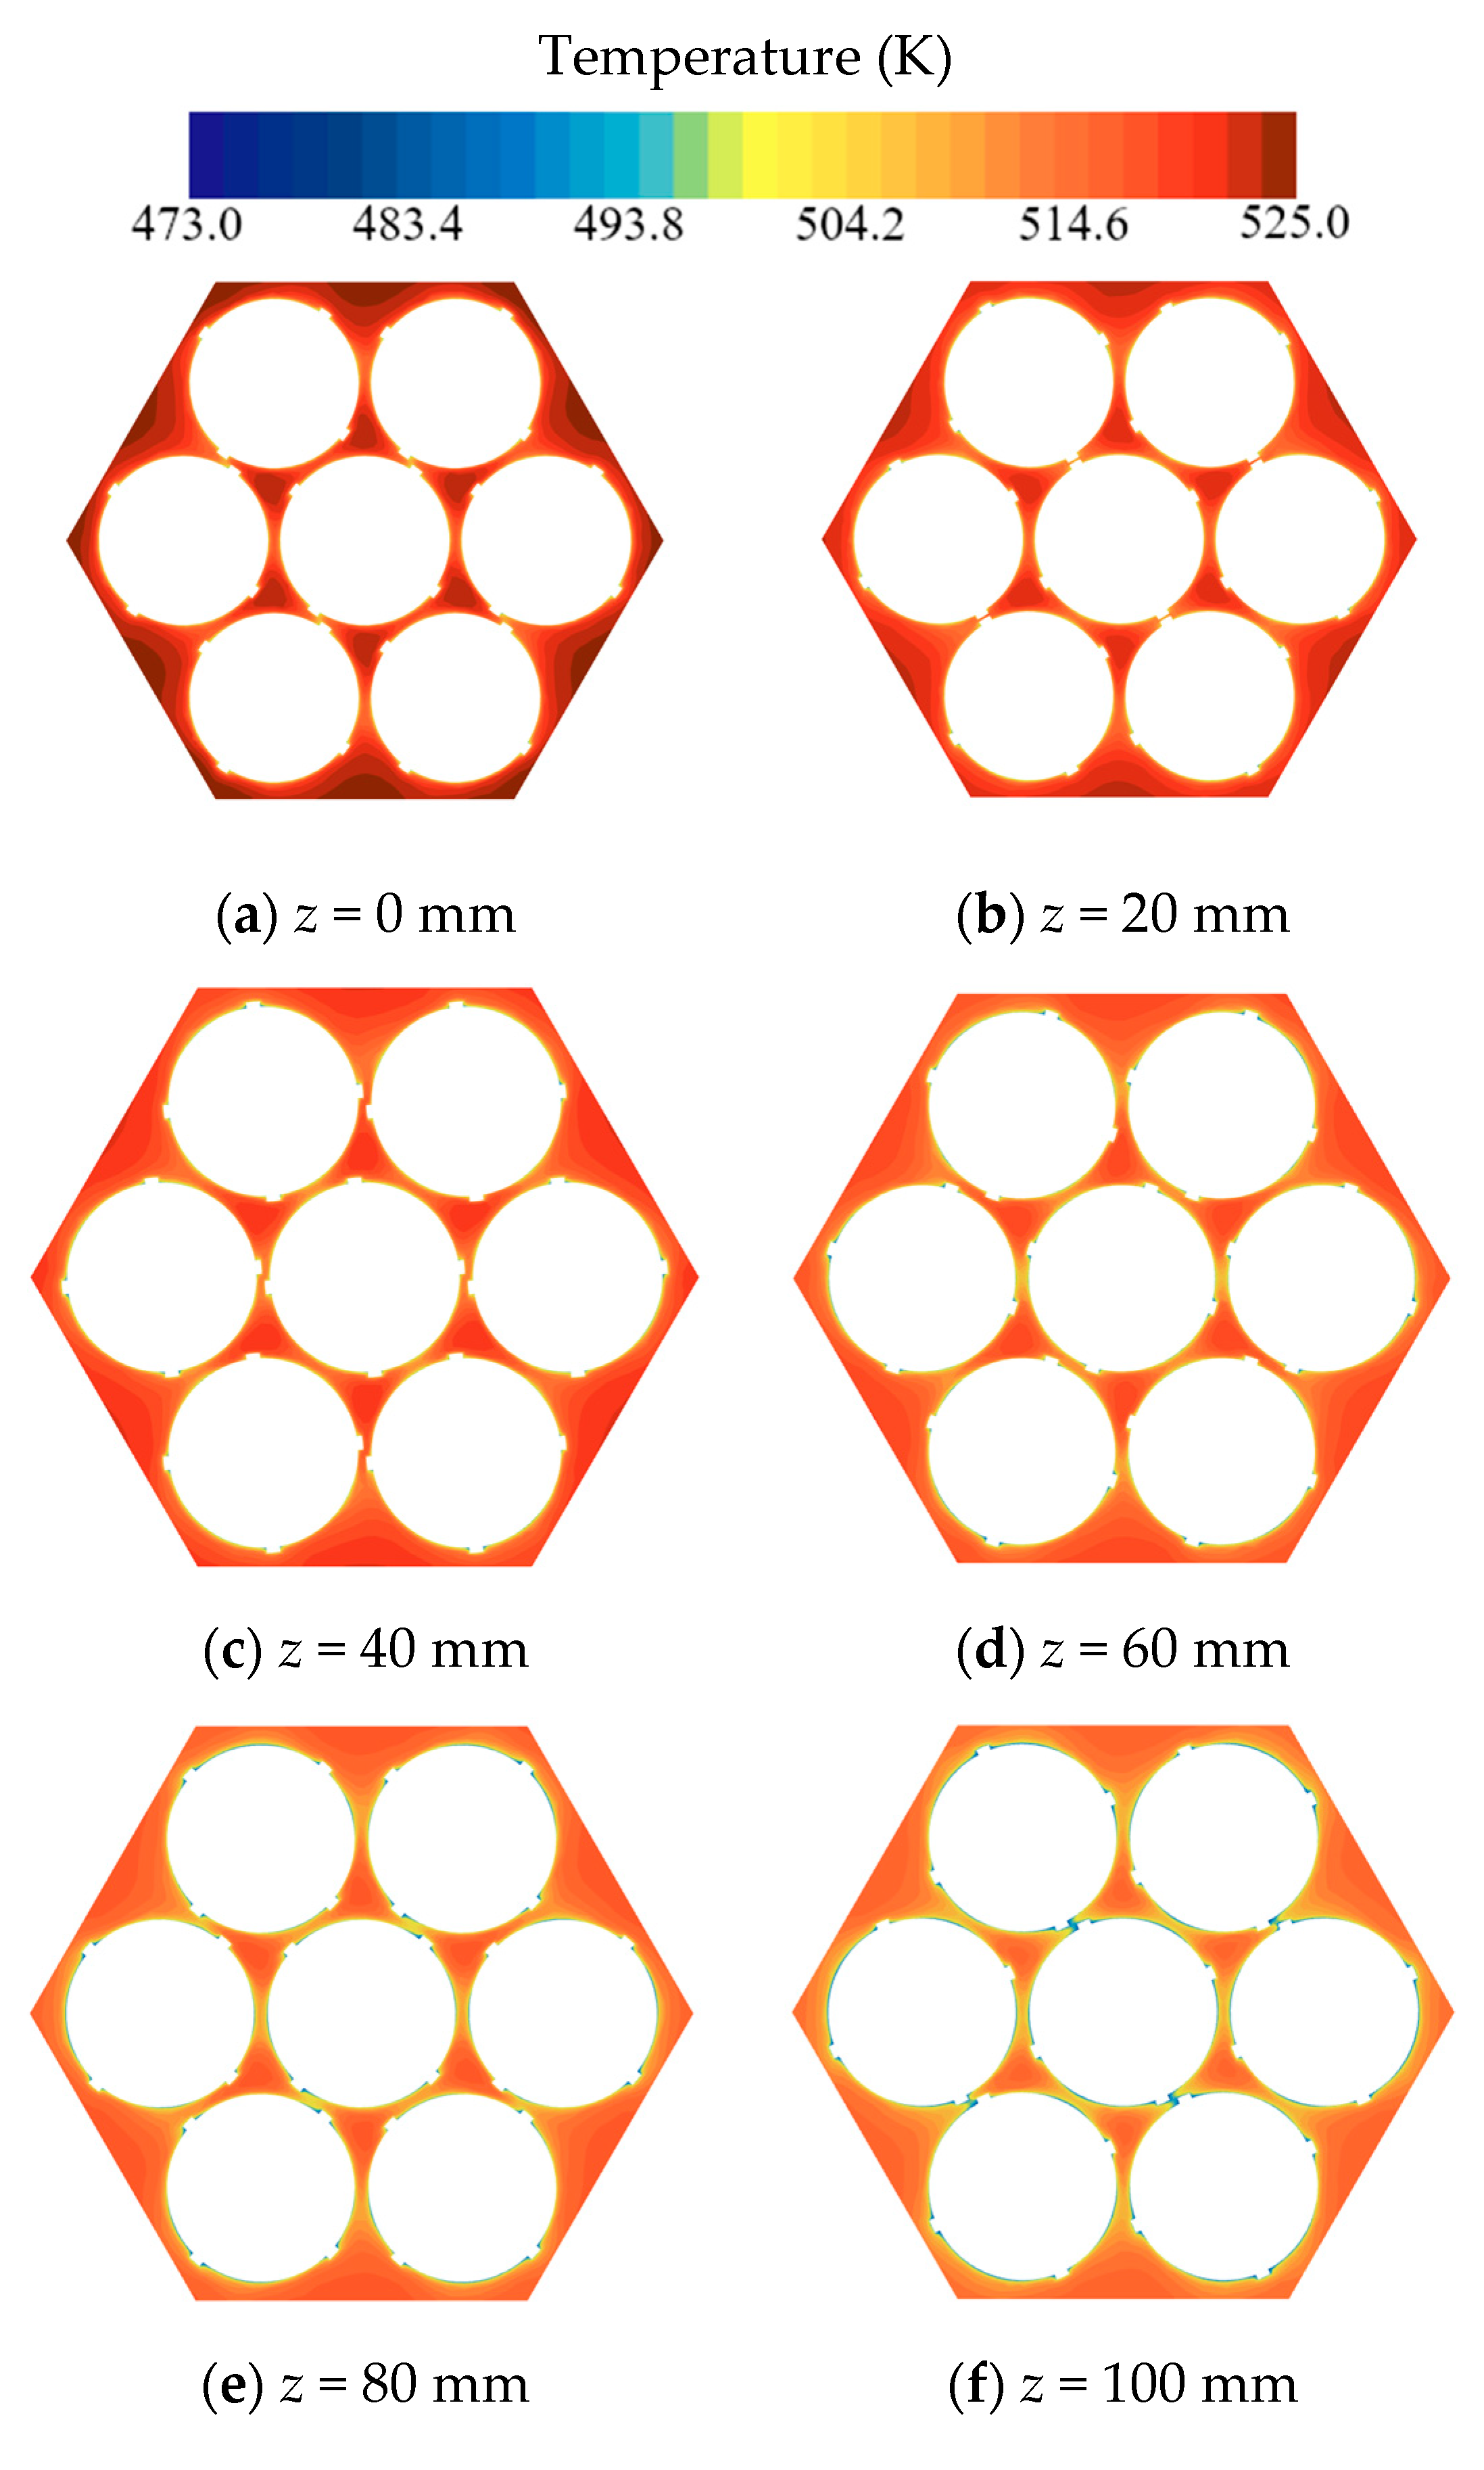
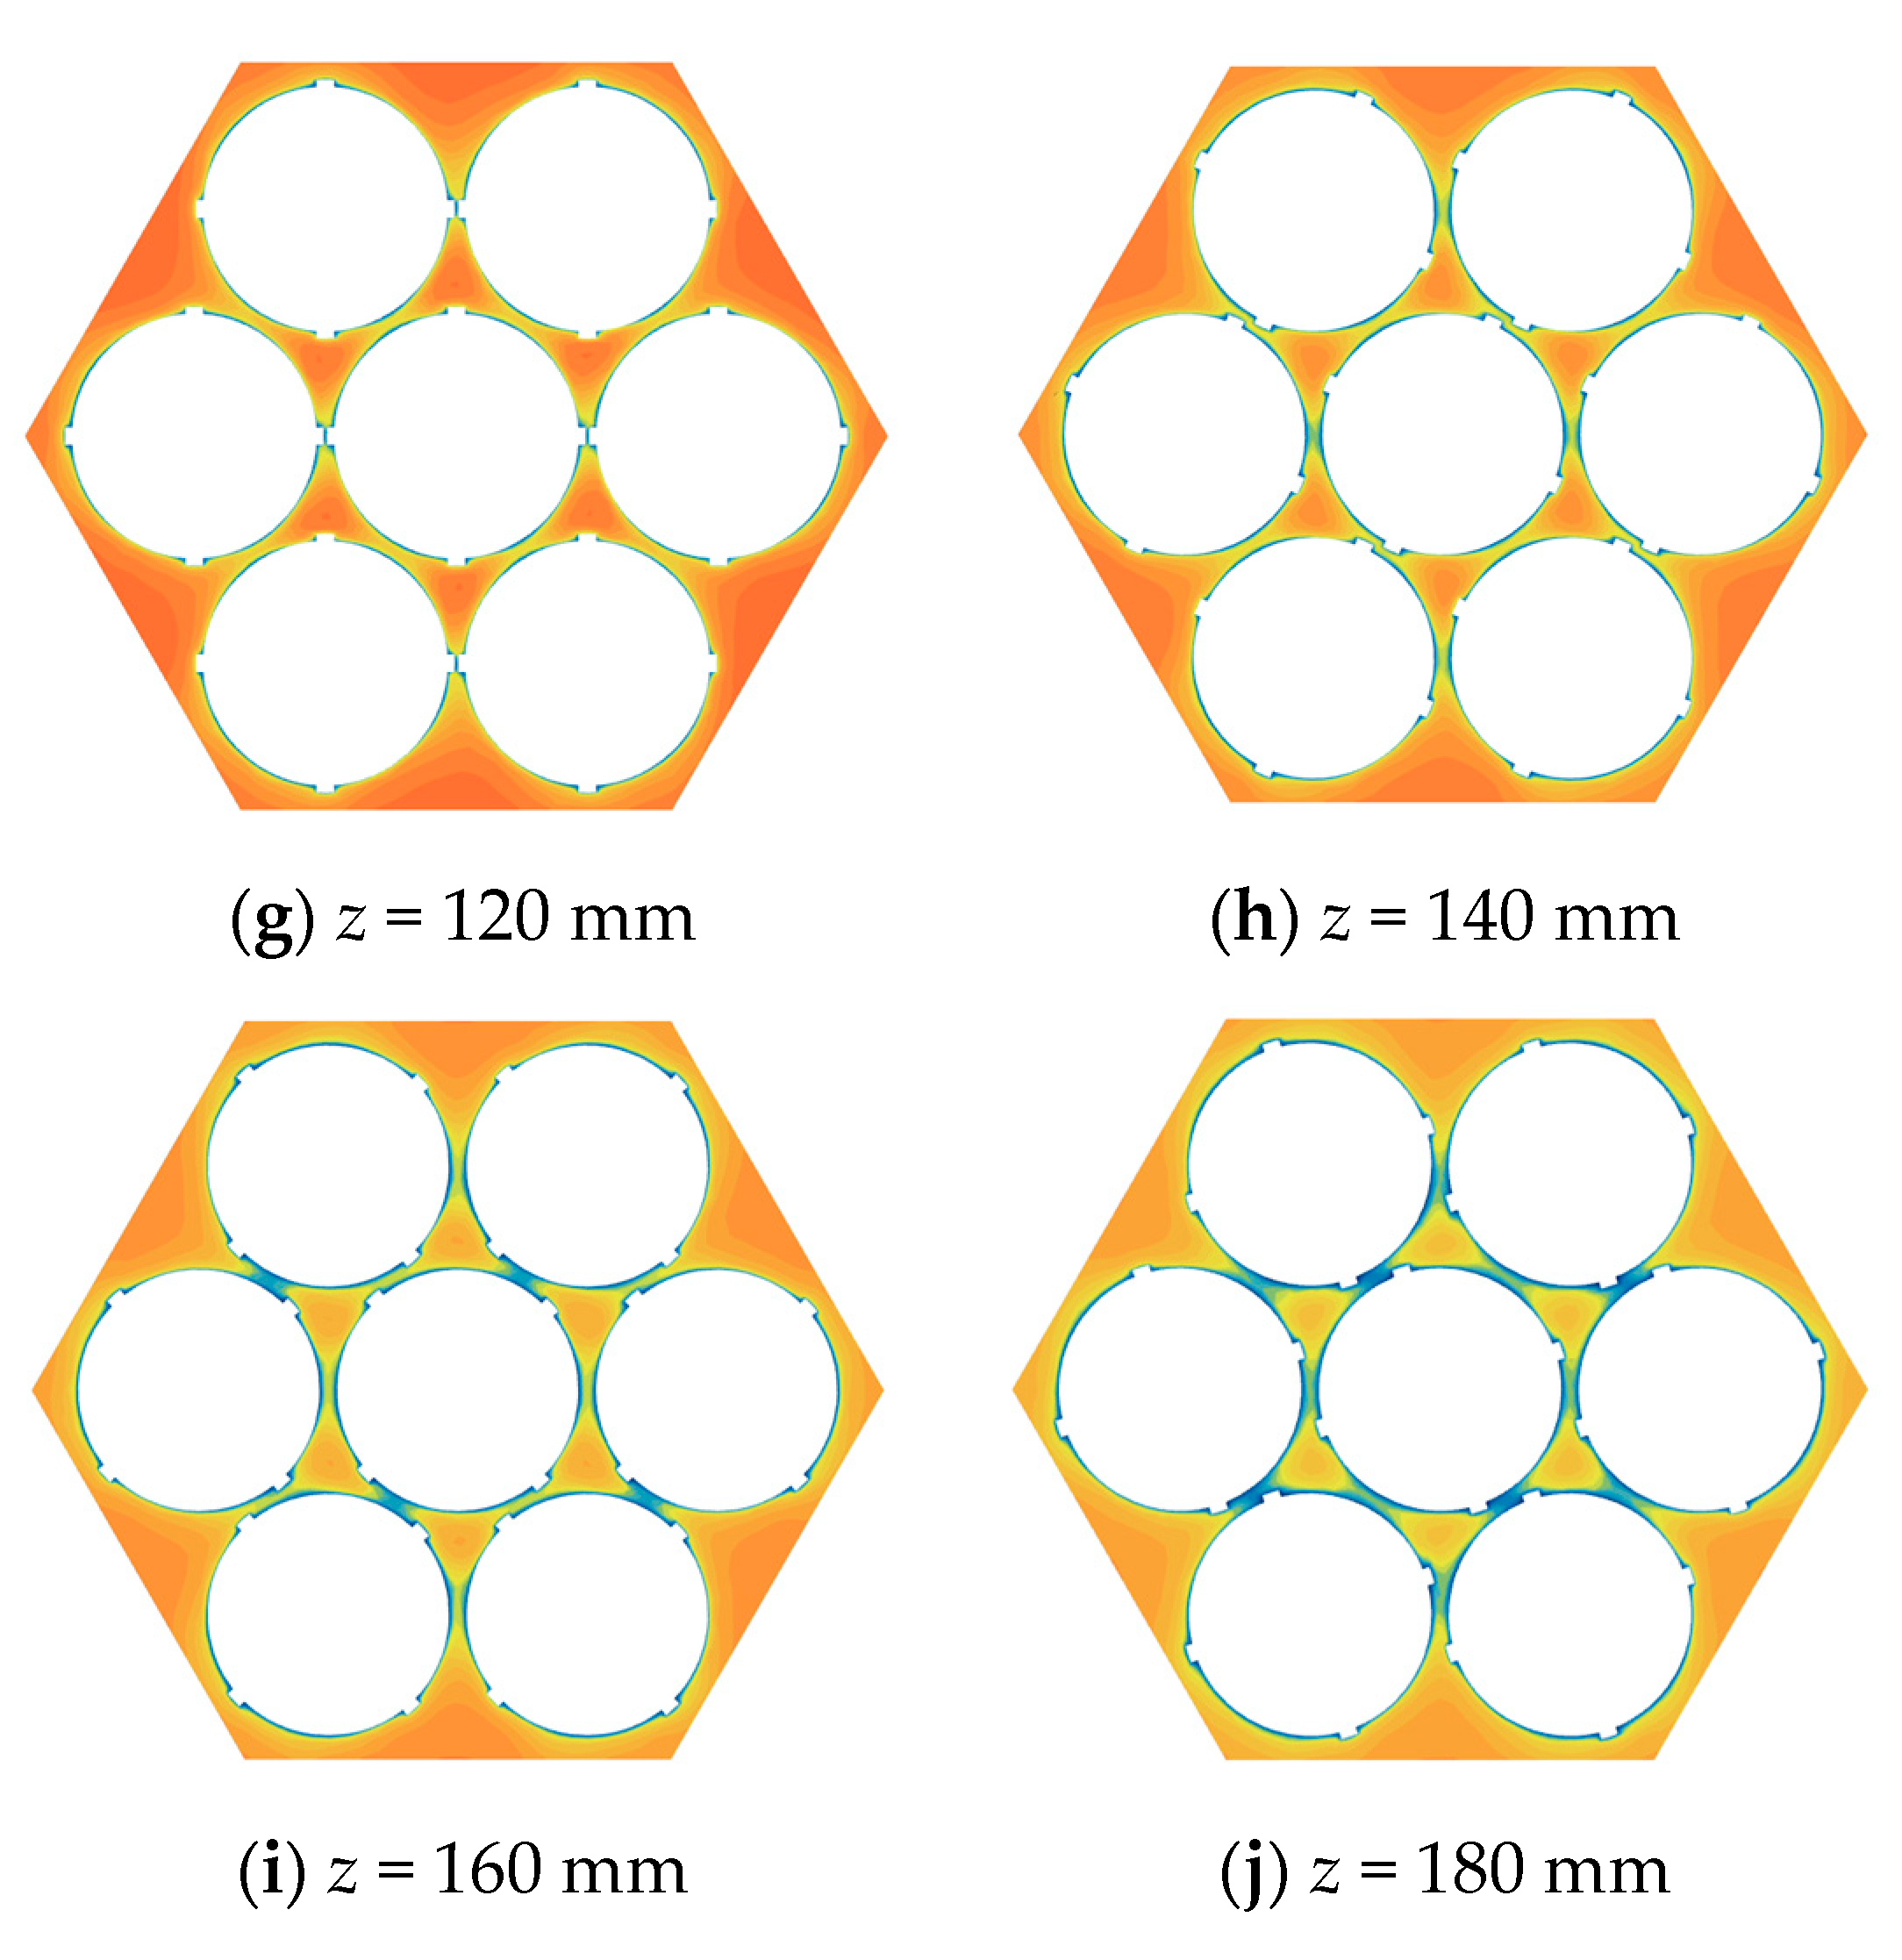
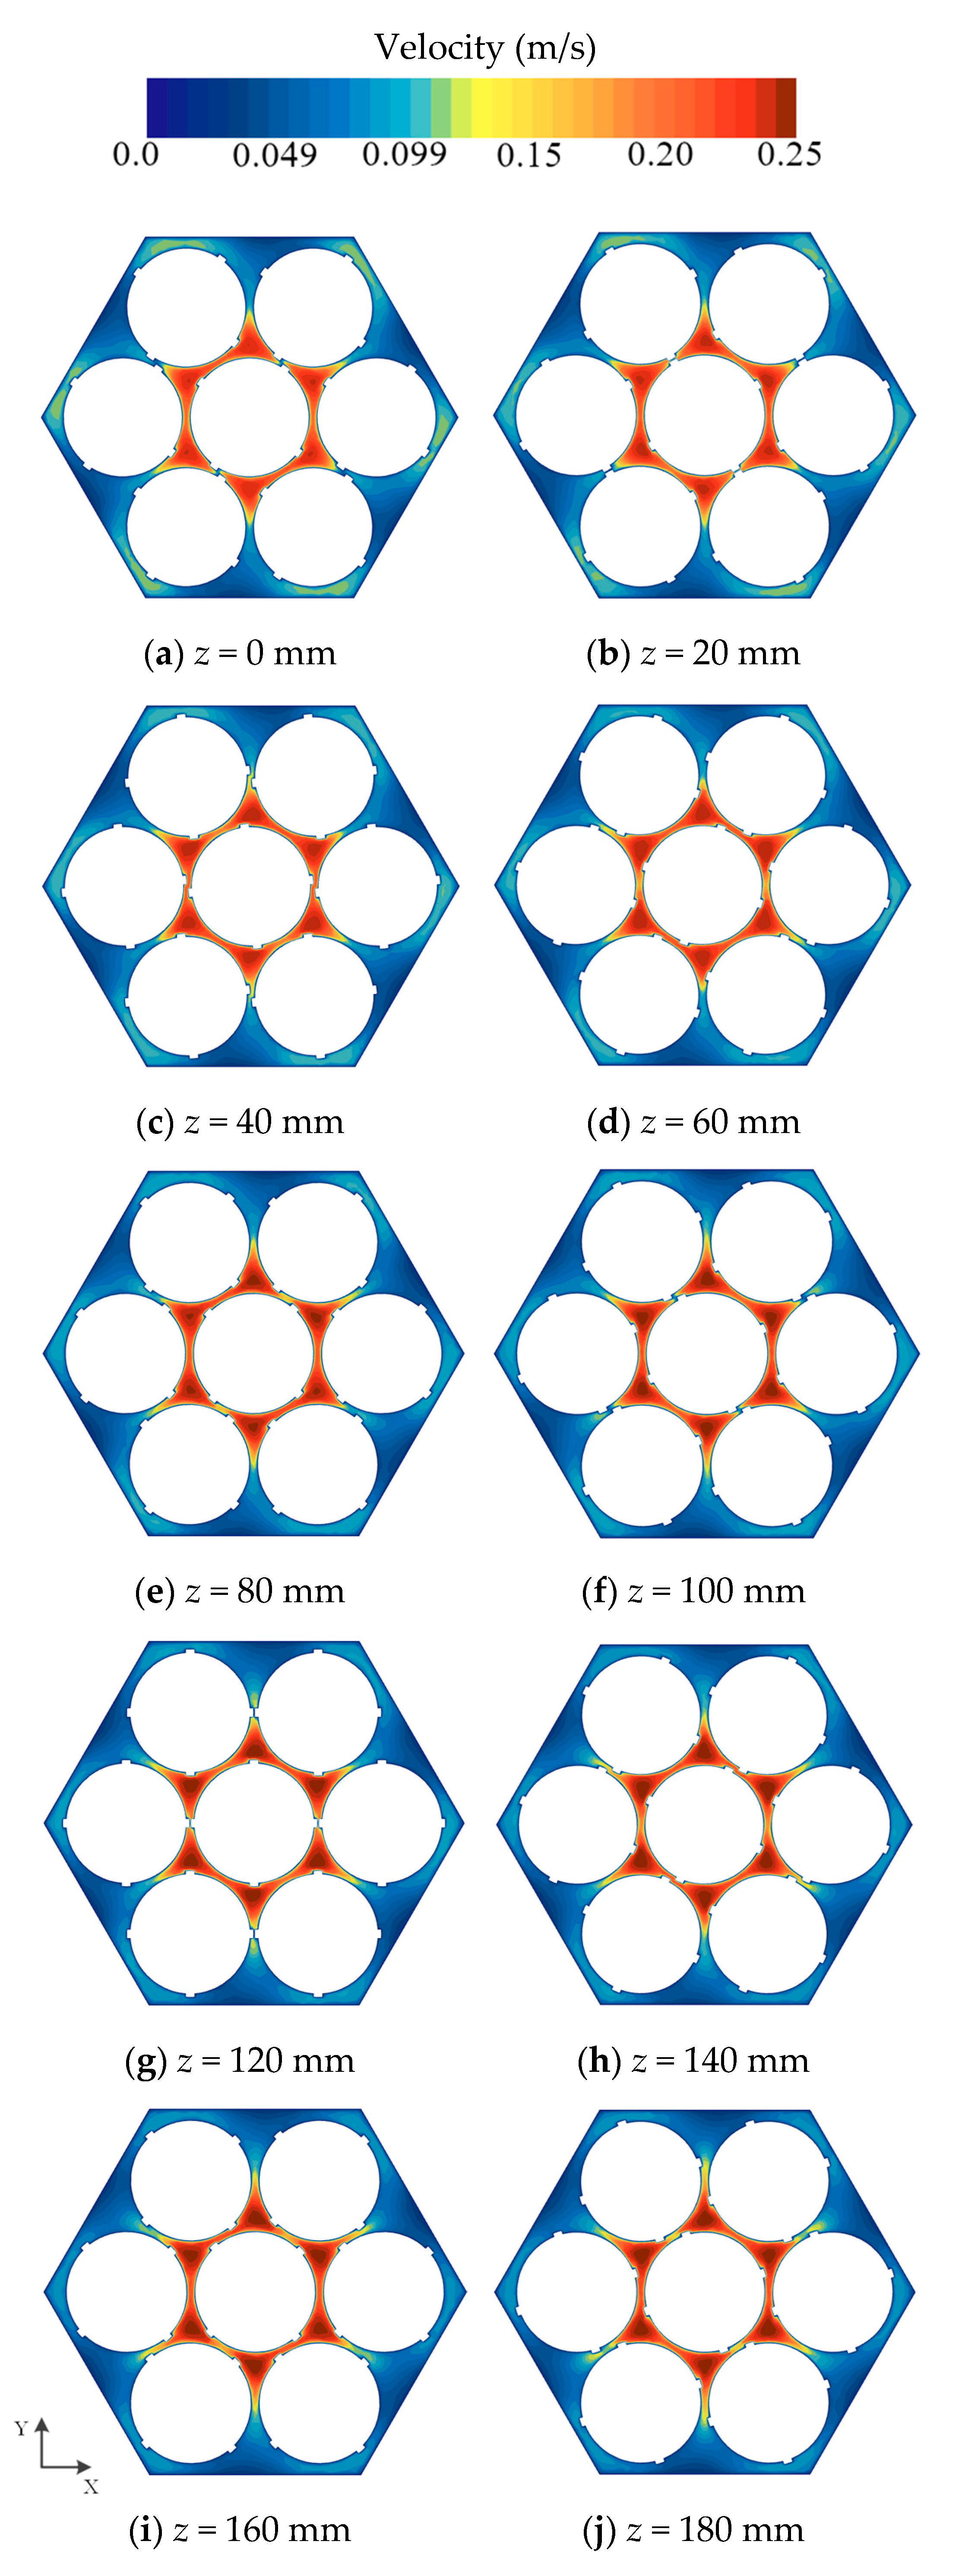
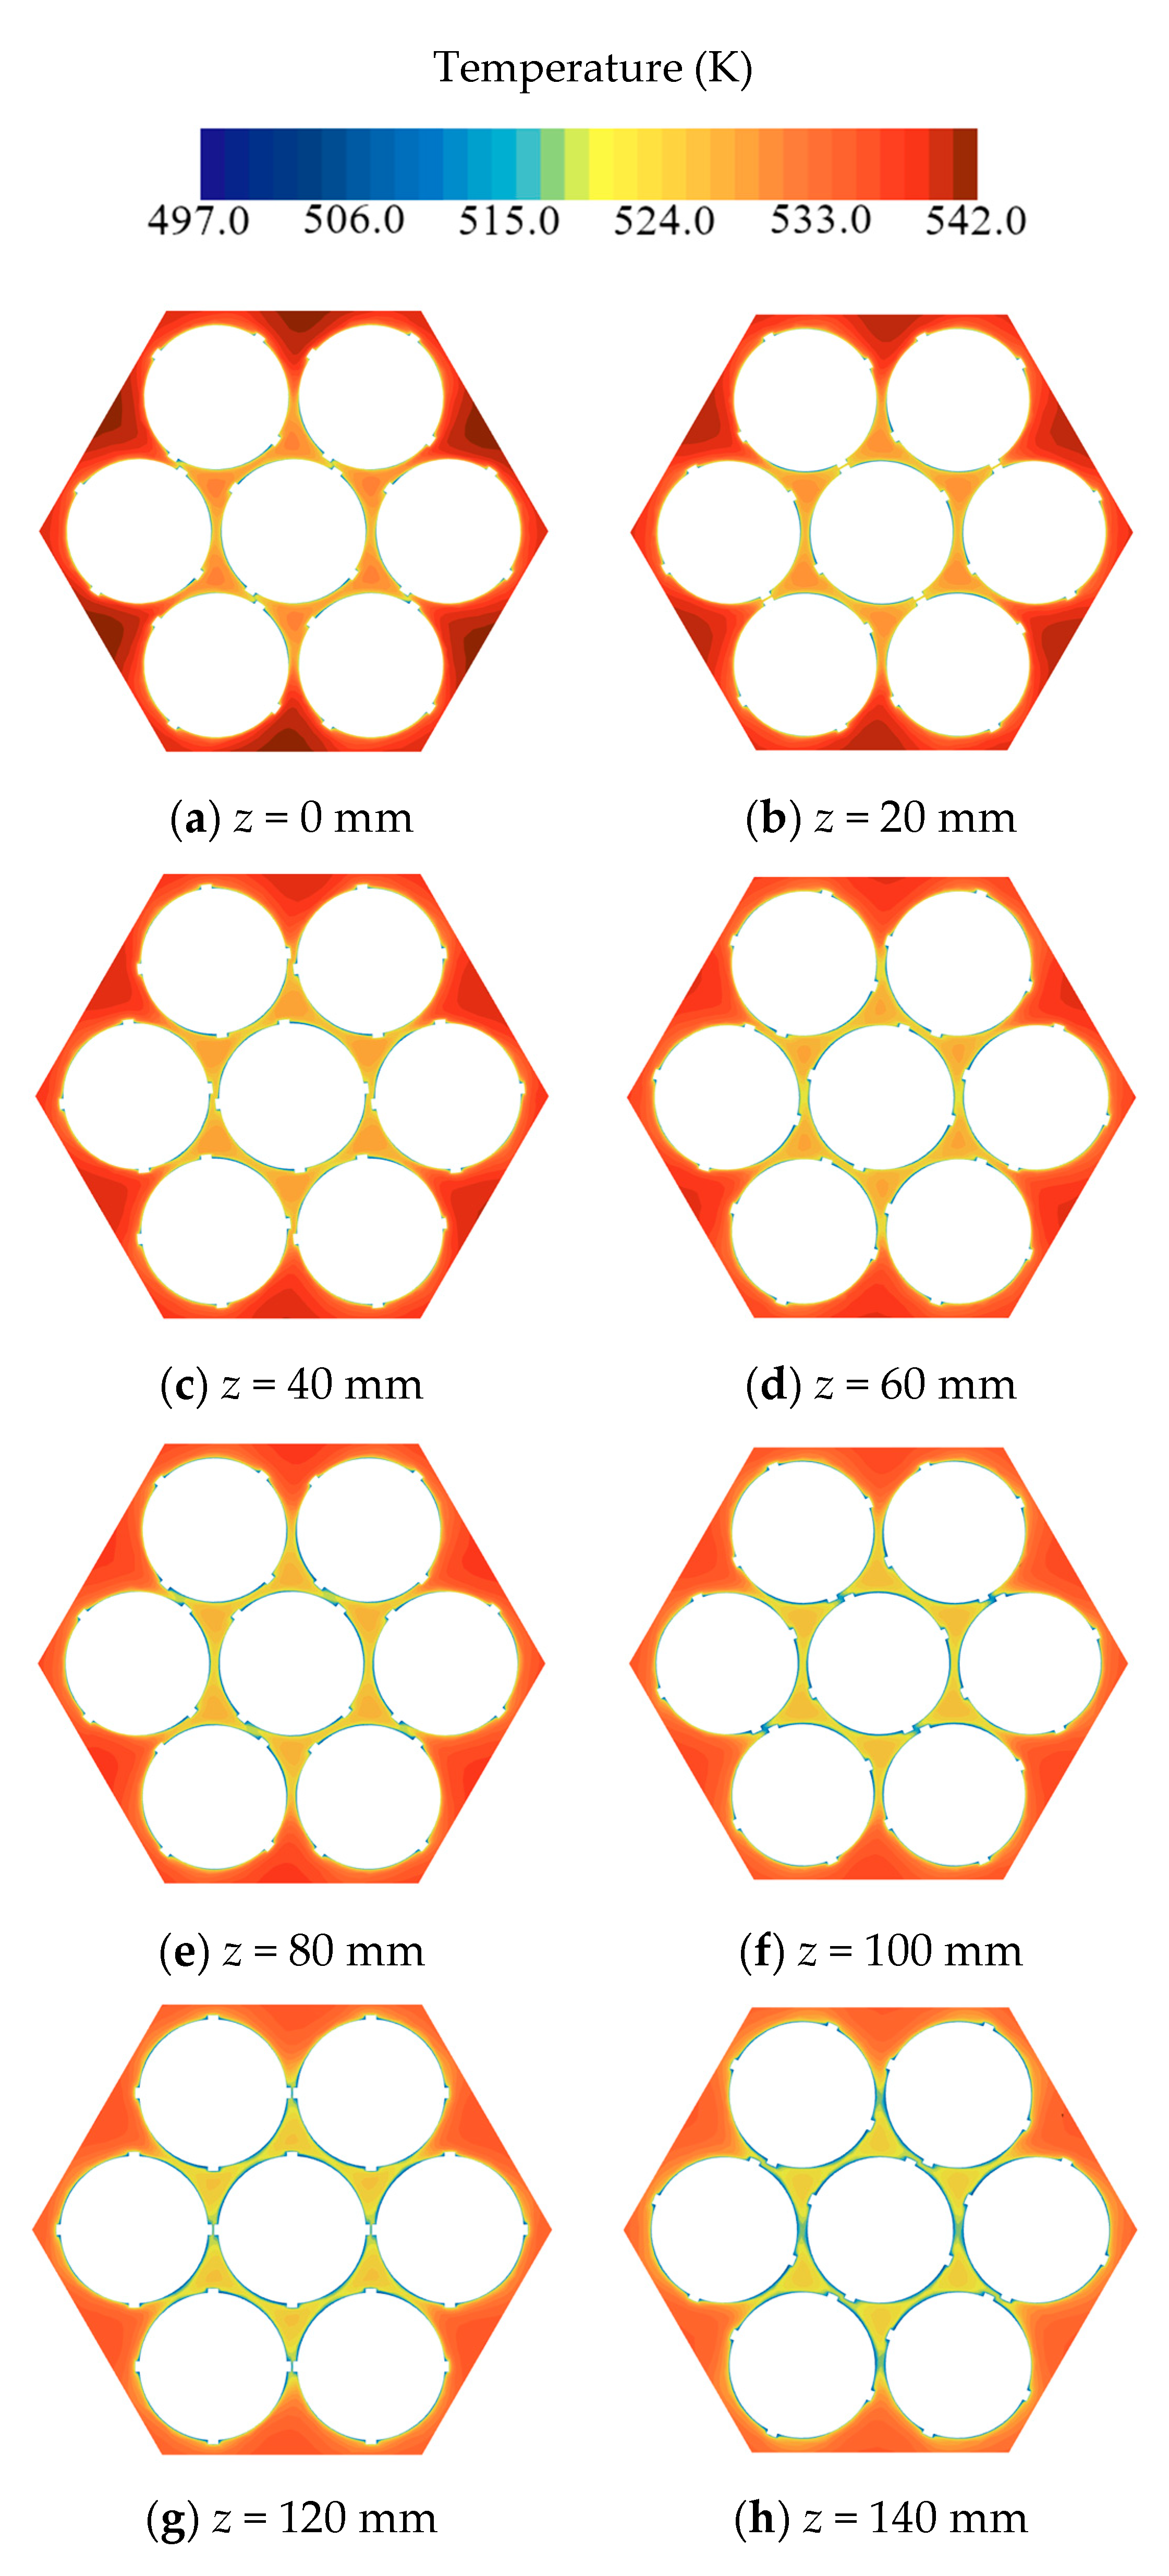
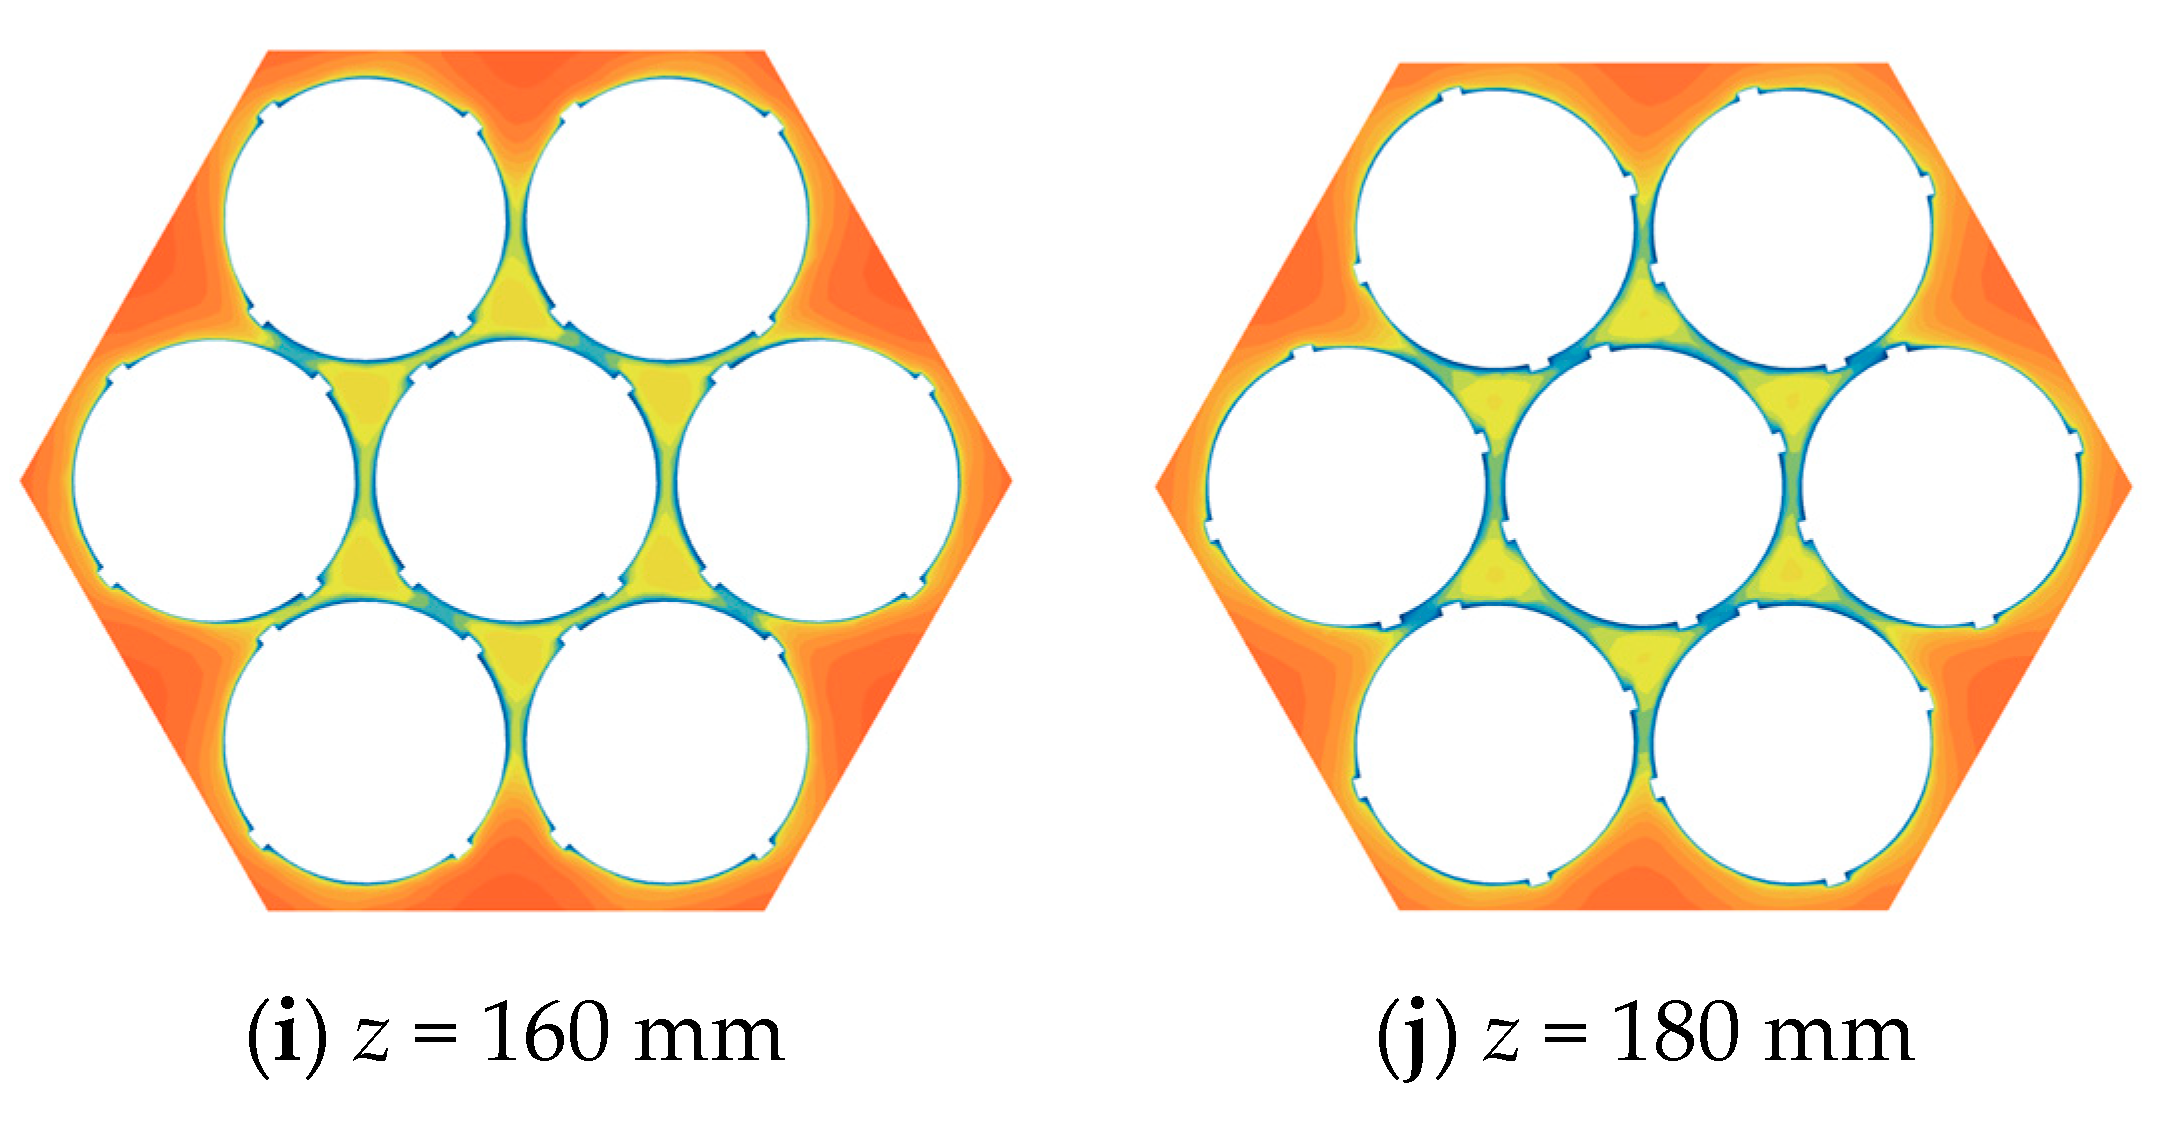
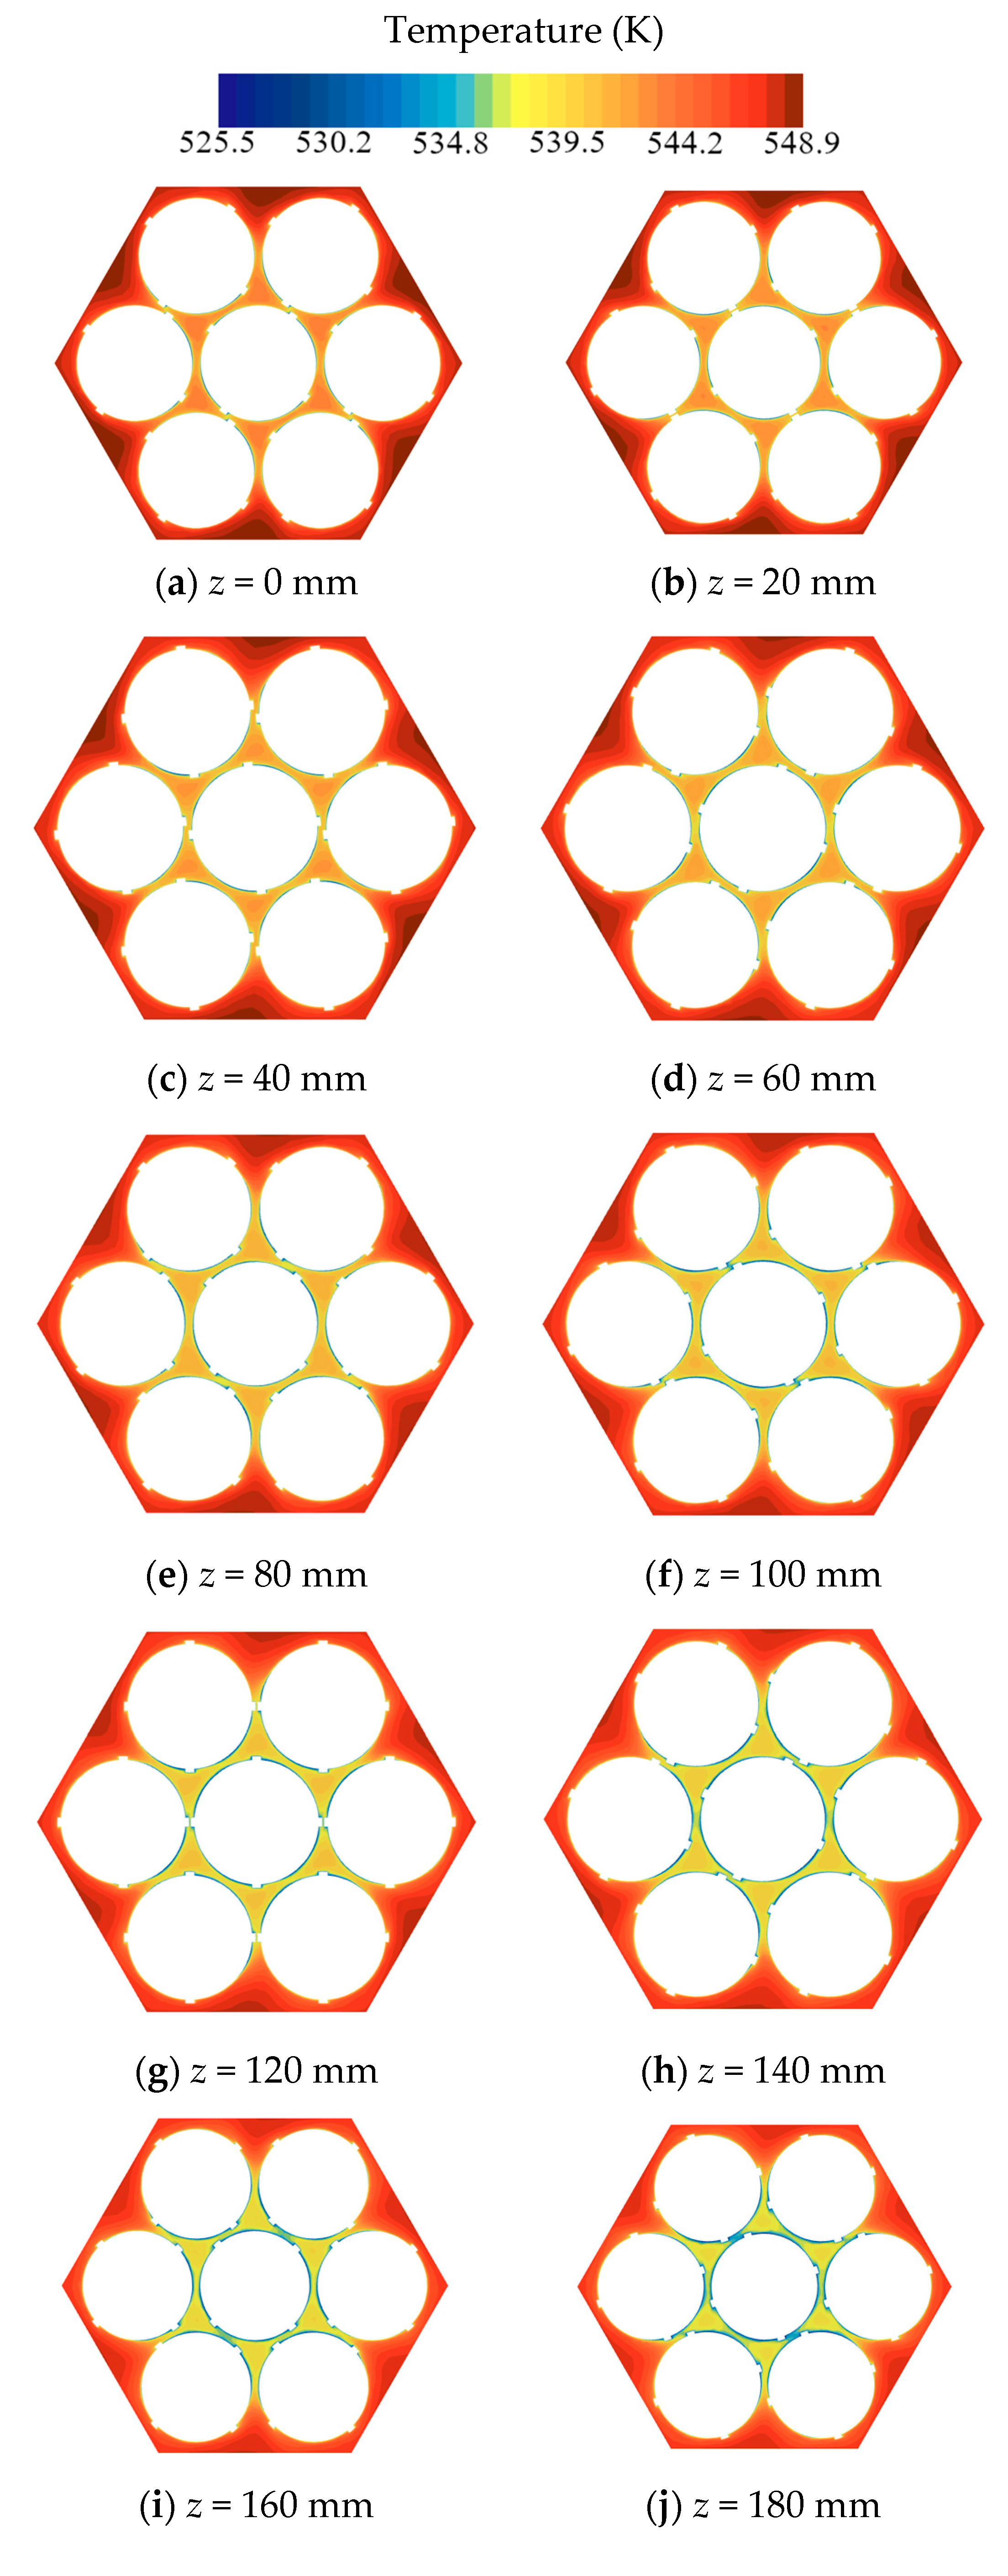
To further investigate the flow characteristics of the fluid in the laminar region along the axial direction of the cooling channel, the velocity and temperature field distributions at different cross-sections within the fully developed section are provided every 20 mm, as shown in Figure 19 and Figure 20. In the figures, z represents the distance from the inlet cross-section of the fully developed section of the spiral channel. It can be seen from the figures that the velocity distributions at different cross-sections show little difference, all presenting the situation where the velocity in the central sub-channels is the highest, which is consistent with the conclusions in Section 4. This is still attributed to the influence of the boundary layer: the fluid velocity is low near the wall and high away from the wall. The center of the central sub-channels is the farthest from the wall, and under the combined action of the coiled wire structure, the velocity is the highest in the central sub-channels. In the laminar region, due to the low fluid velocity, the transverse mixing between different sub-channels is relatively weak; similarly, due to the low velocity, the temperature at different cross-sections is significantly affected by heat transfer, leading to large changes in fluid properties, which in turn causes large fluctuations in the frictional resistance coefficient distribution along the axial direction.
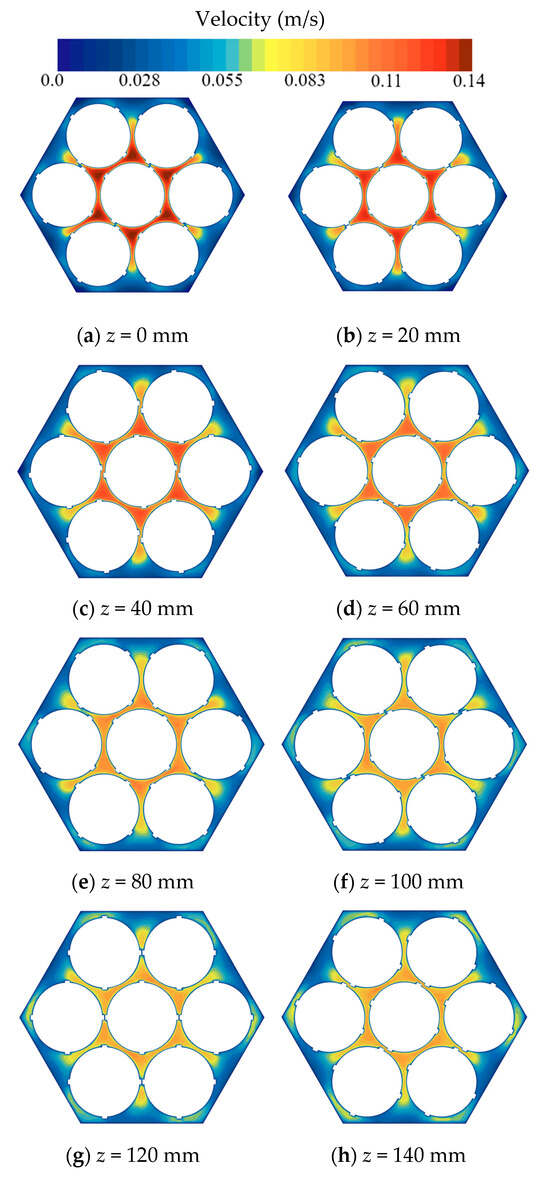
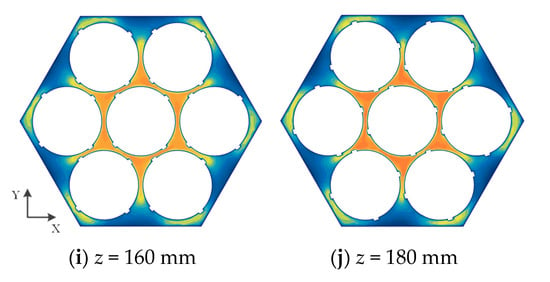
Figure 19.
Velocity contours of different cross sections in the fully developed section of the laminar region.
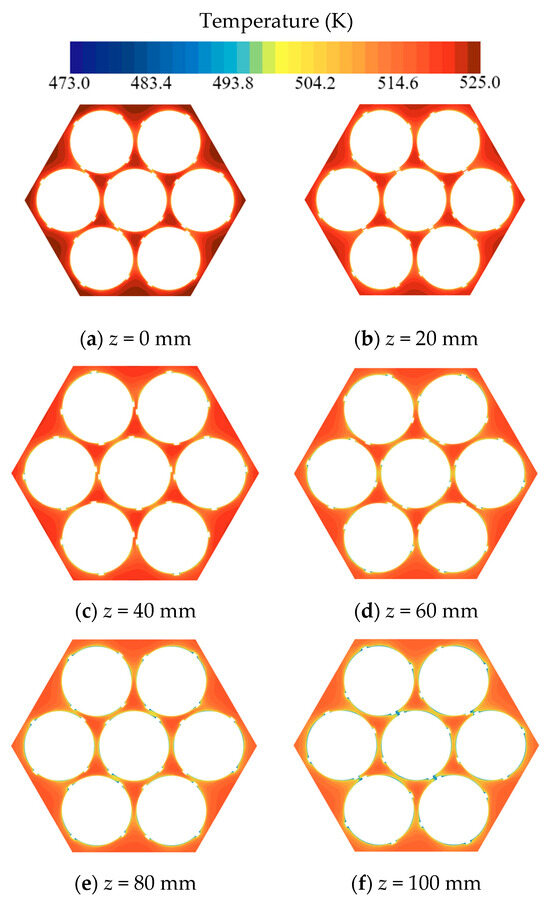
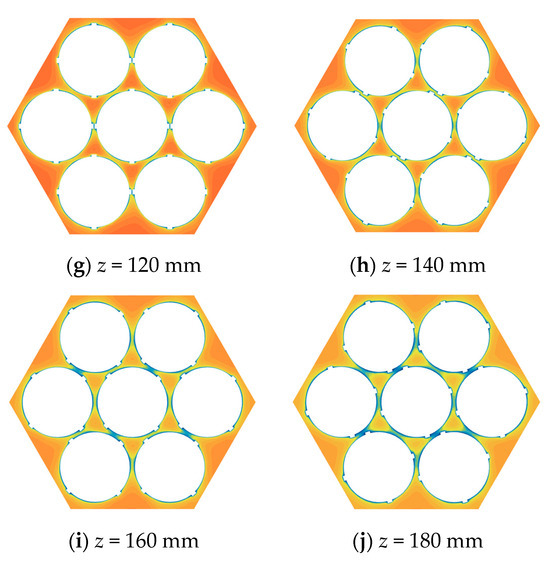
Figure 20.
Temperature contours of different cross sections in the fully developed section of the laminar region.
During the fluid flow process, as the geometric structure of the channel changes, the fluid at the wire intersection has better heat transfer with the channel wall, resulting in a lower fluid temperature at this location. Simultaneously, due to the narrow flow path at the wire intersection, the fluid velocity is reduced under the influence of the boundary layer. As the fluid continues to flow forward, the fluid mixes with the adjacent central sub-channel’s fluid under the influence of the wire, further enhancing heat transfer and making the fluid temperature in the channel more uniform. The fluid temperature in the central sub-channels is reduced overall, subsequently leading to a decrease in the fluid temperature in the corner and boundary sub-channels.
During the downward flow of fluid in the channel, continuous heat transfer causes the fluid temperature to gradually decrease, which in turn leads to an increase in fluid density and viscosity. In the laminar region, the fluid is significantly affected by viscosity. The increase in viscosity causes the boundary layer to thicken, occupying a larger cross-sectional area of the flow path, further reducing the effective cross-sectional area of the central sub-channels. This results in a gradual decrease in the fluid velocity in the central sub-channels as the fluid flows, as shown in Figure 19.
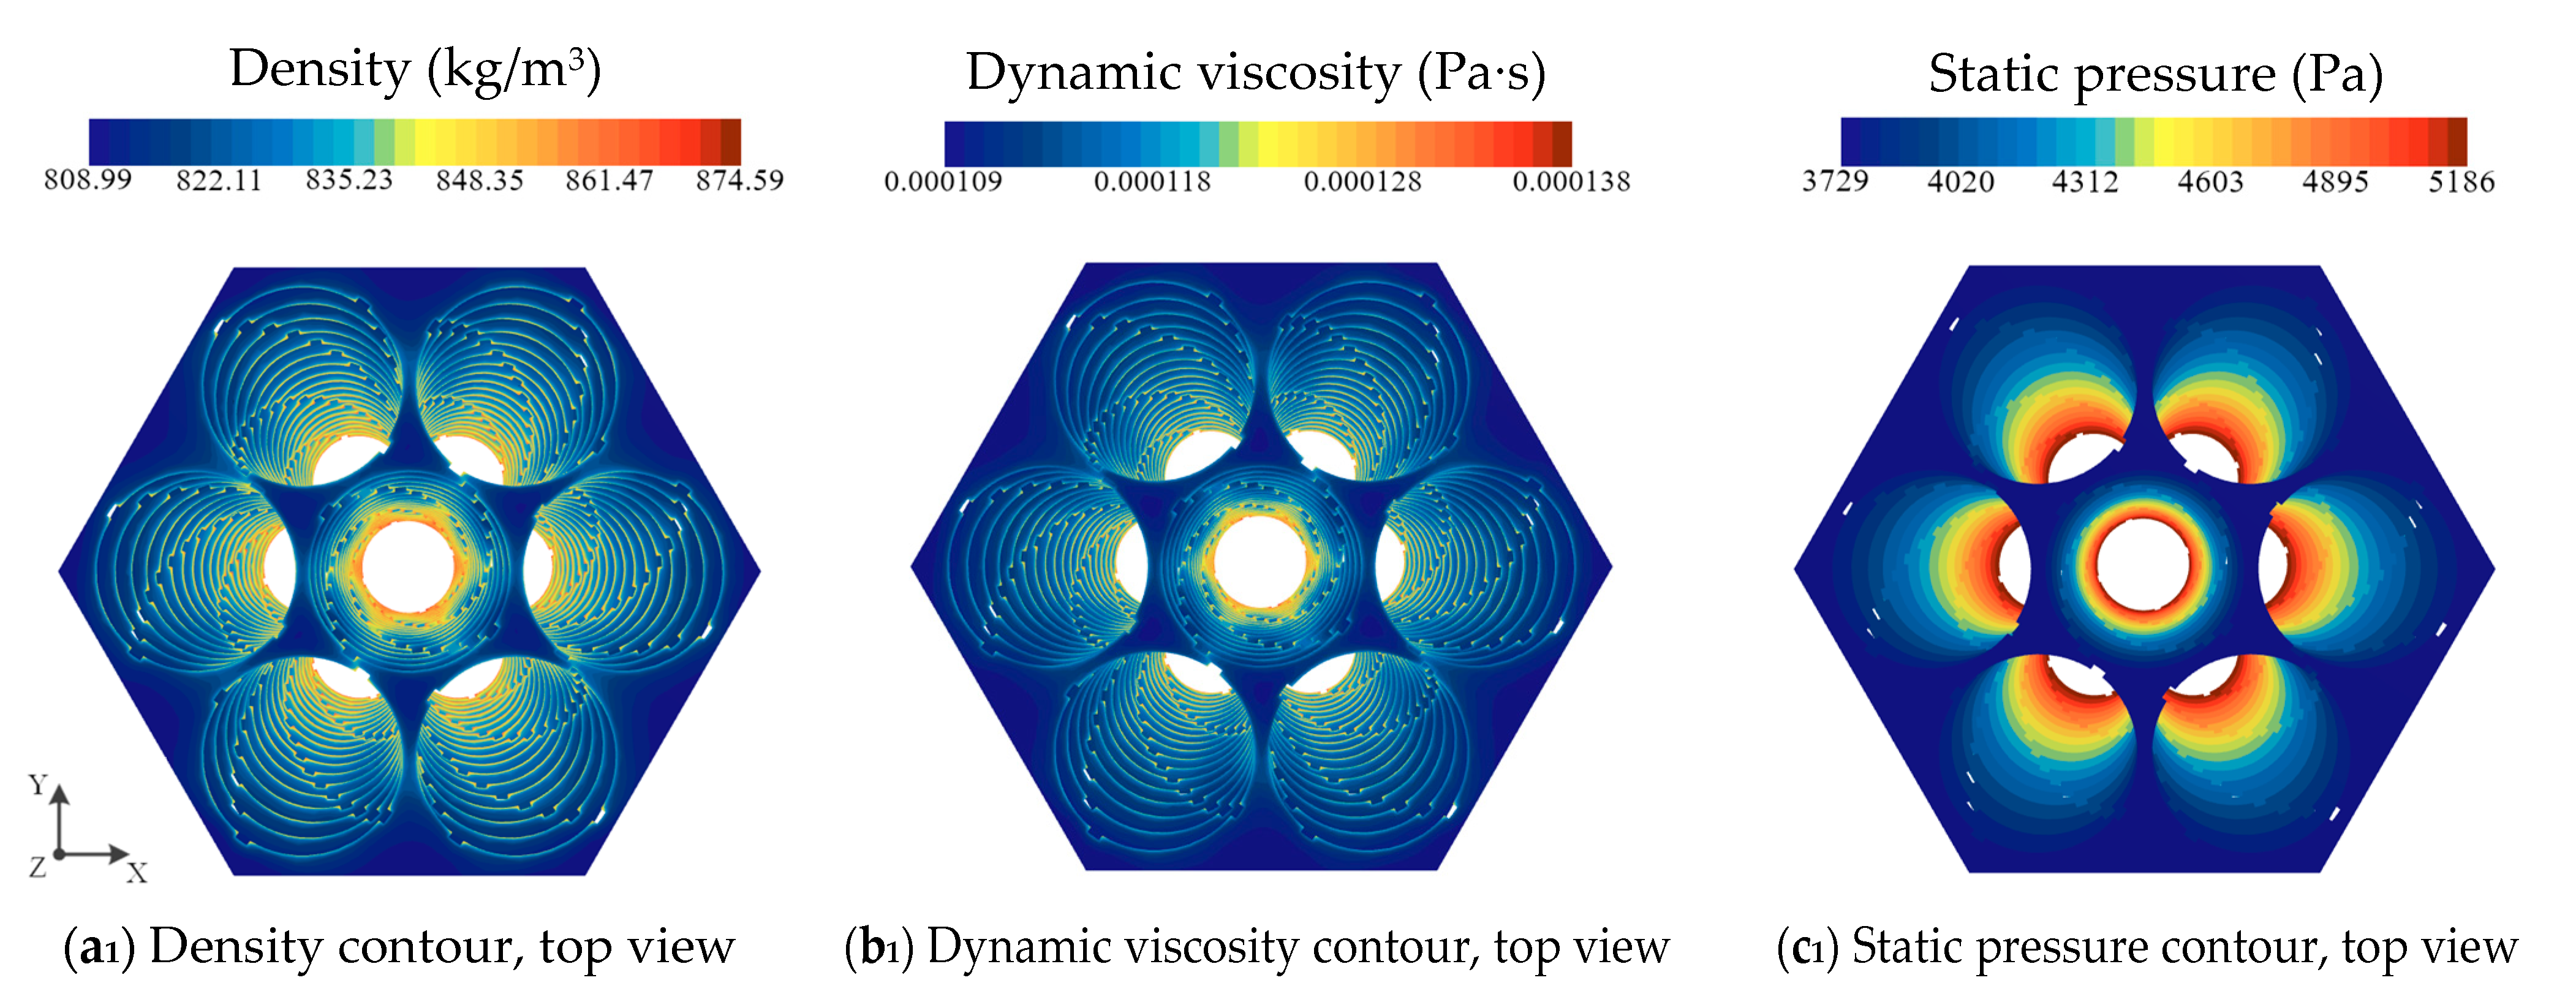
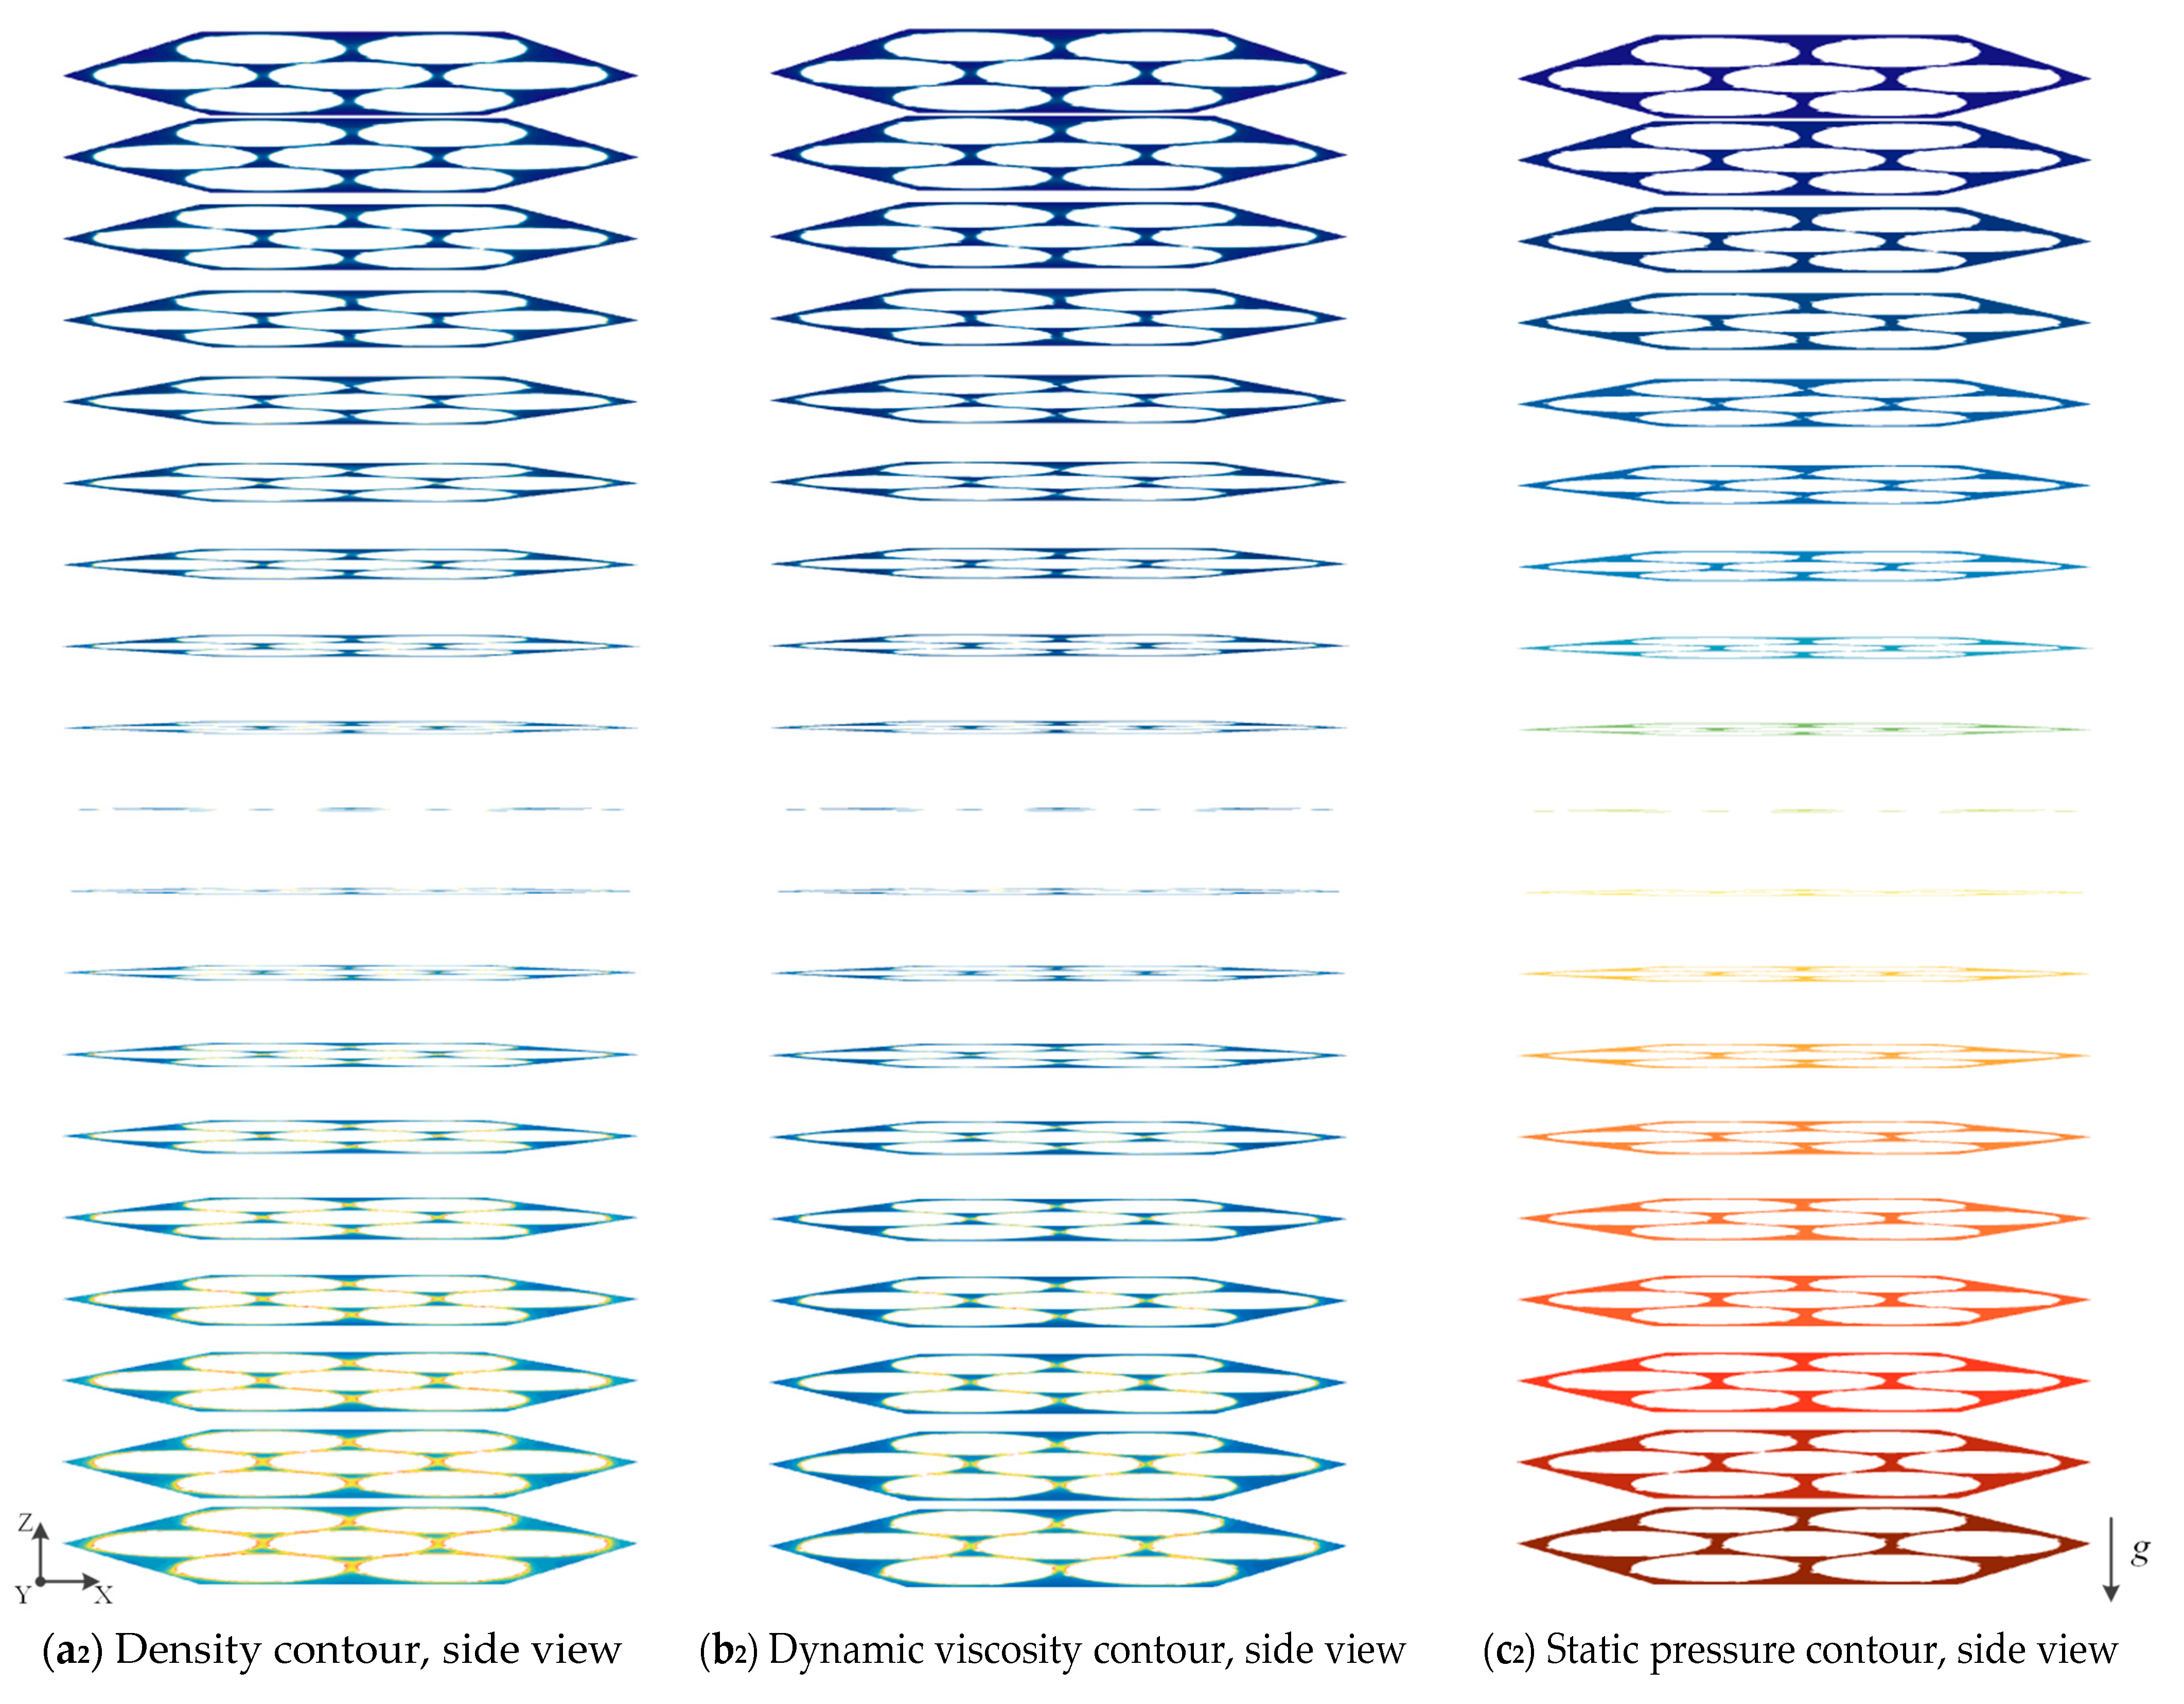
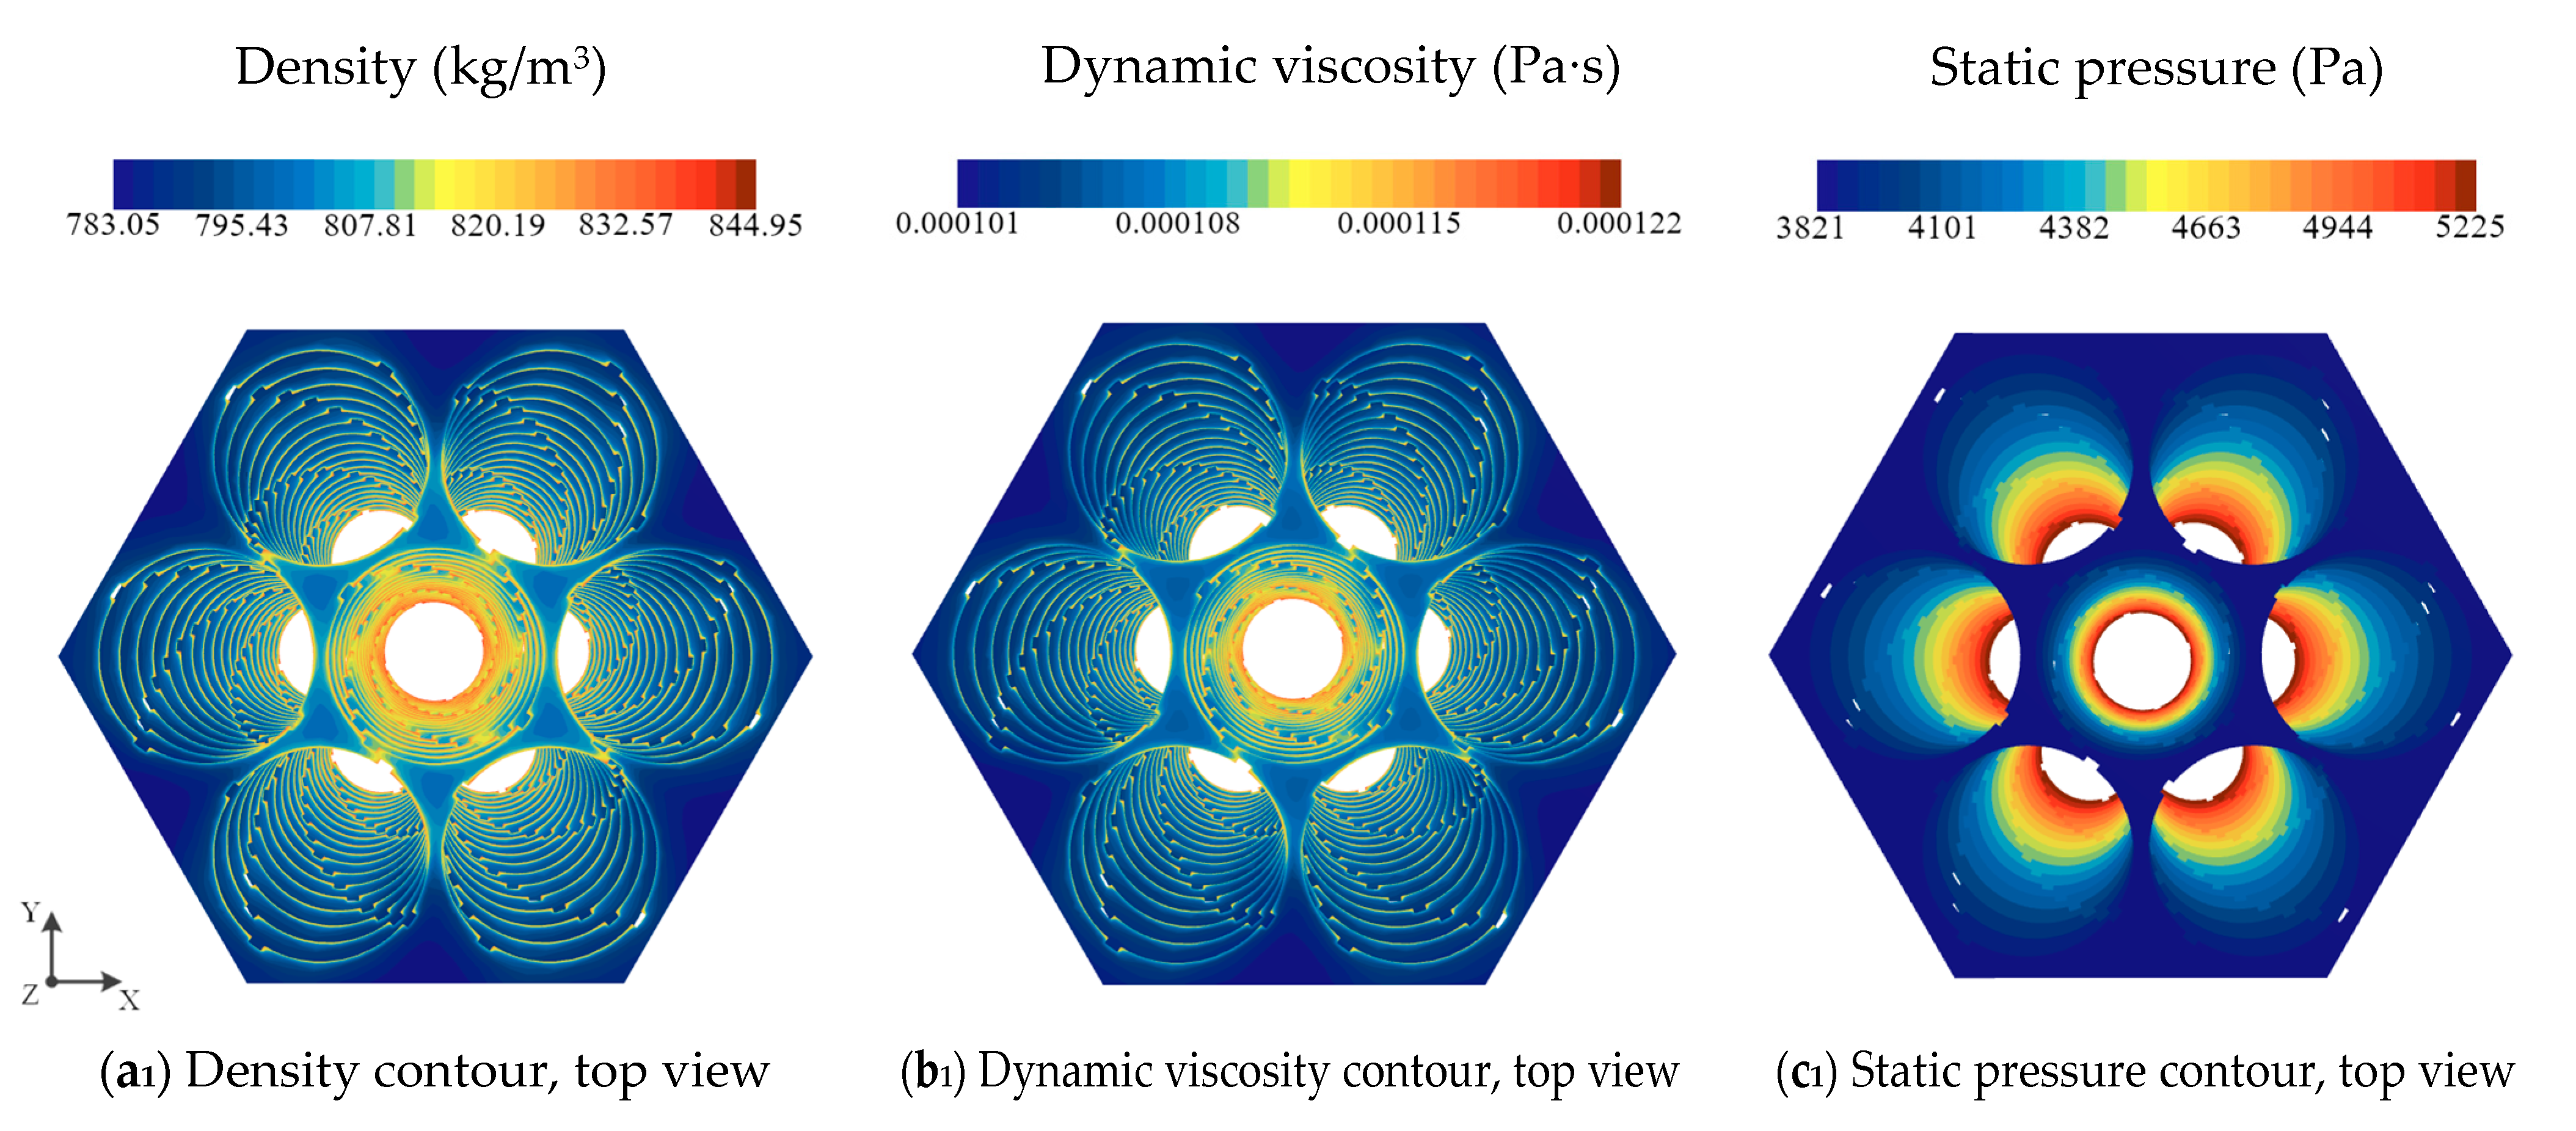
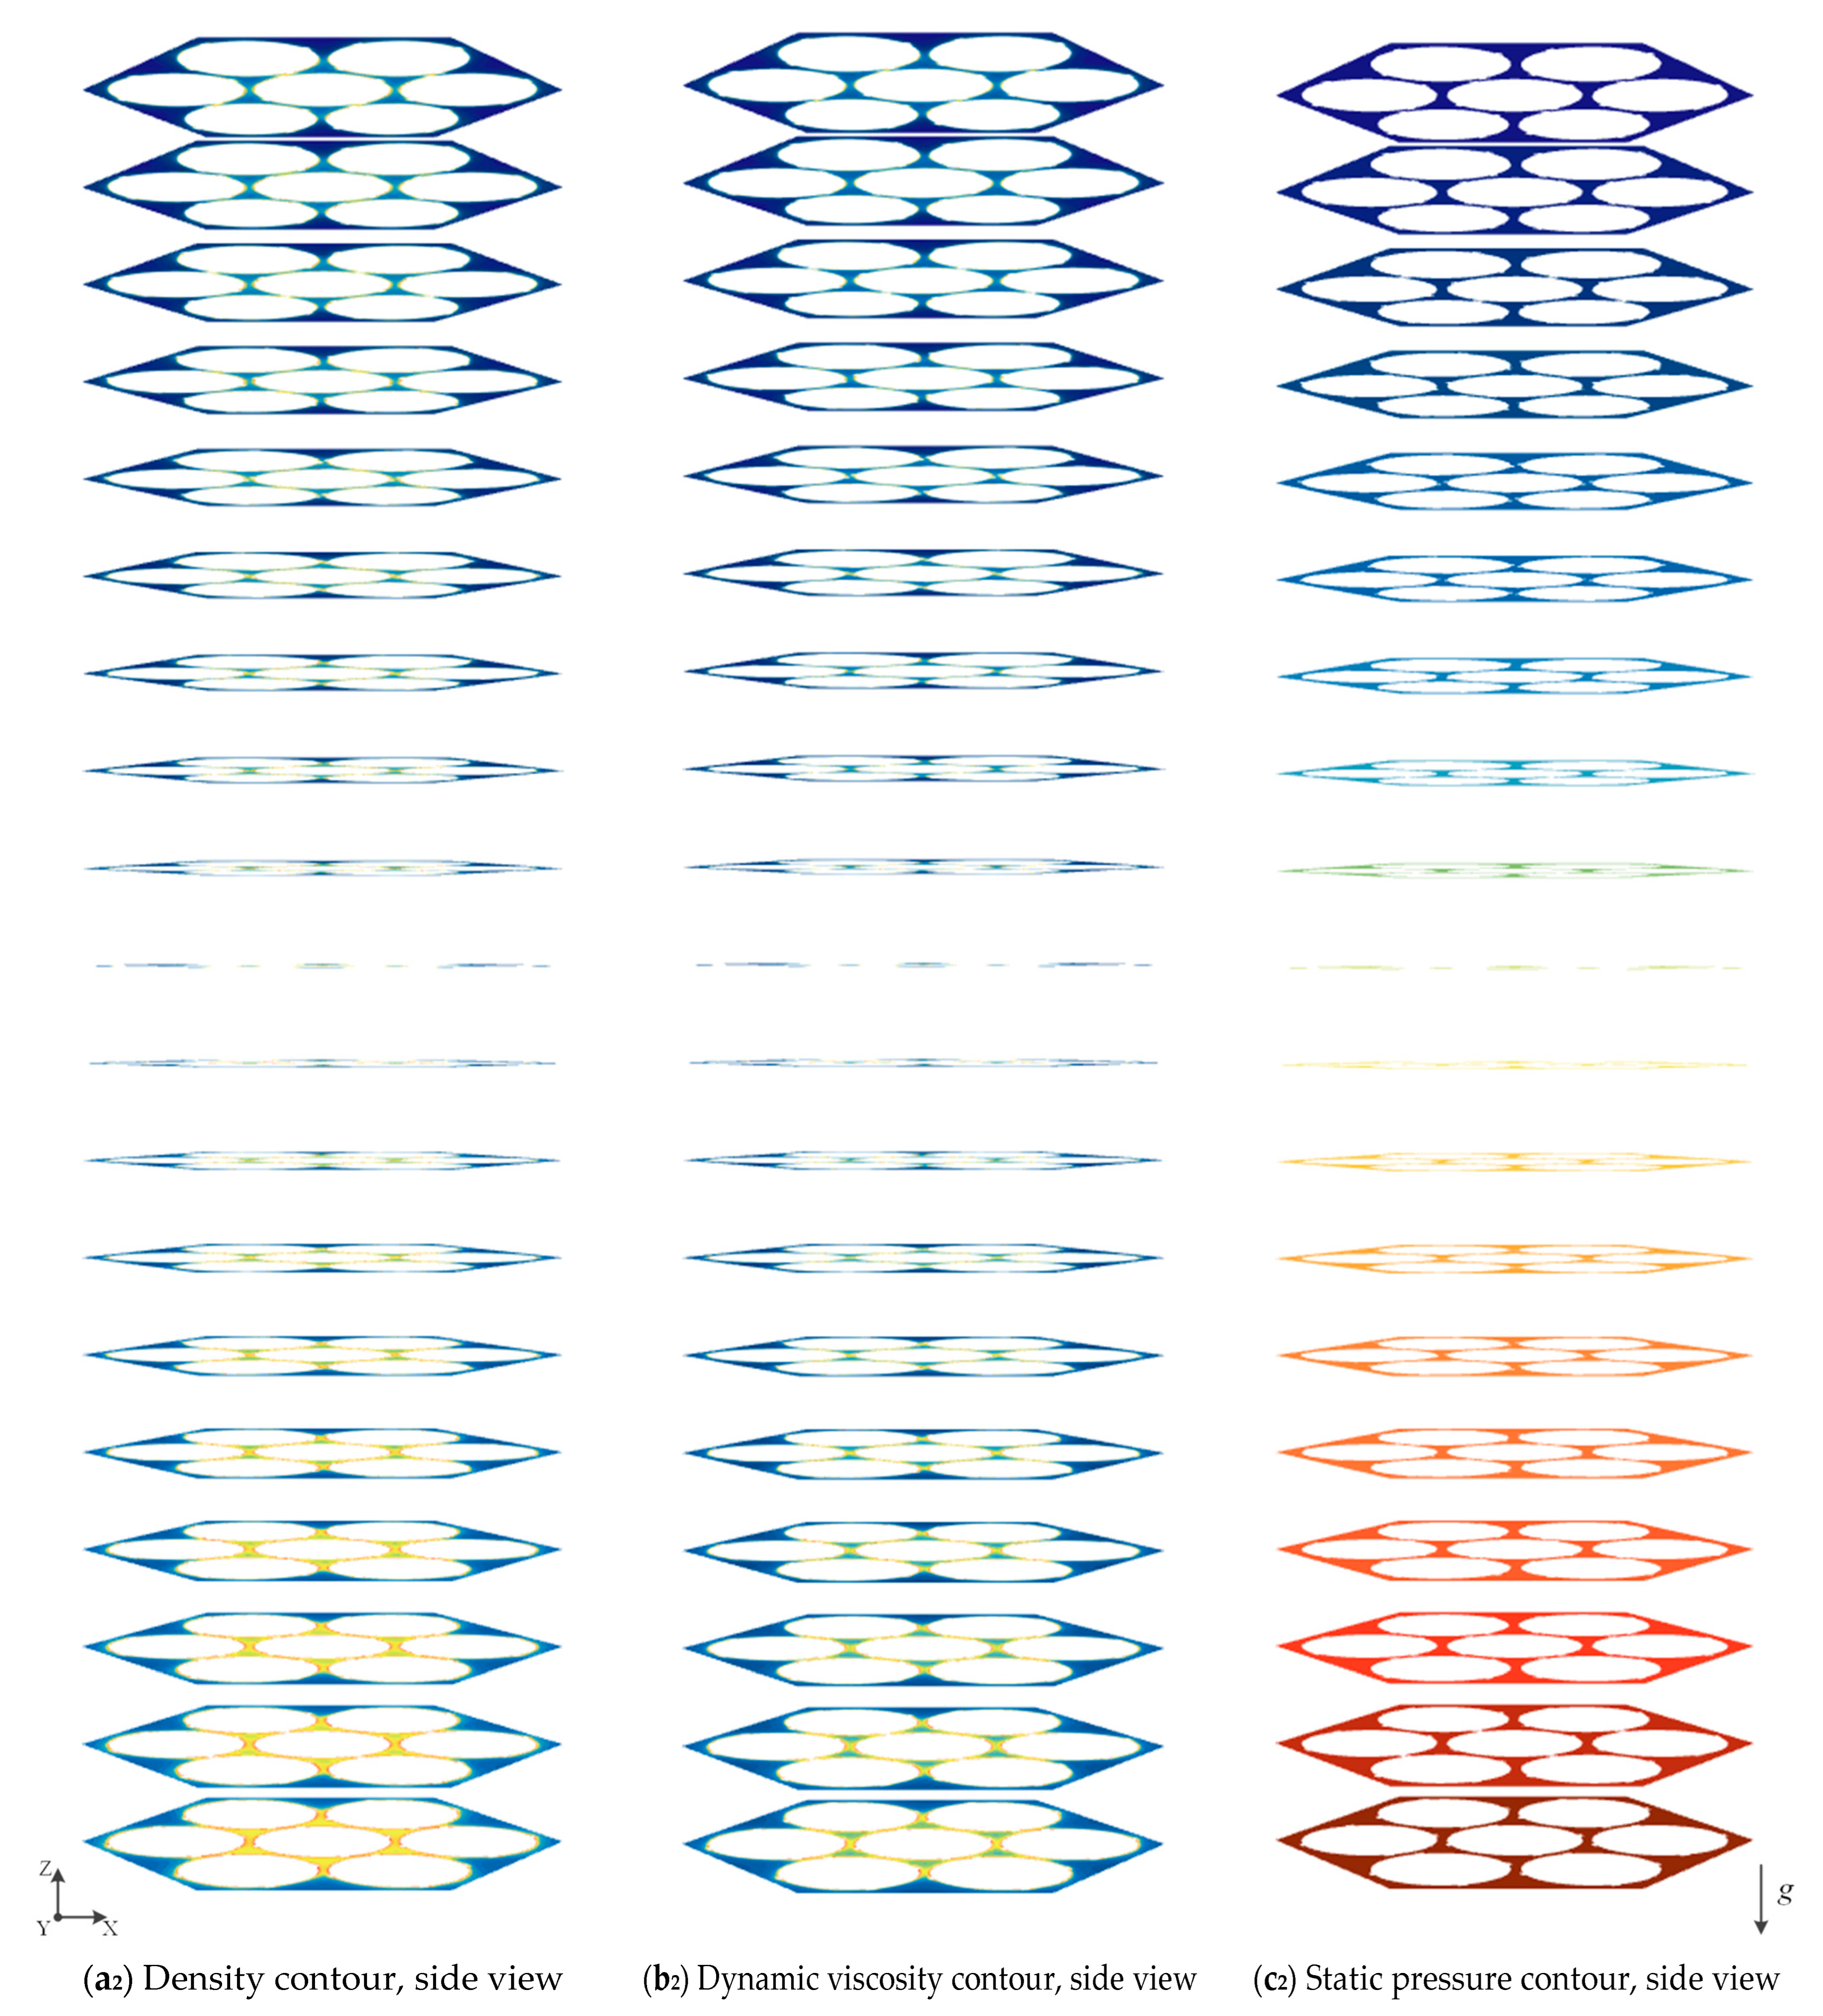
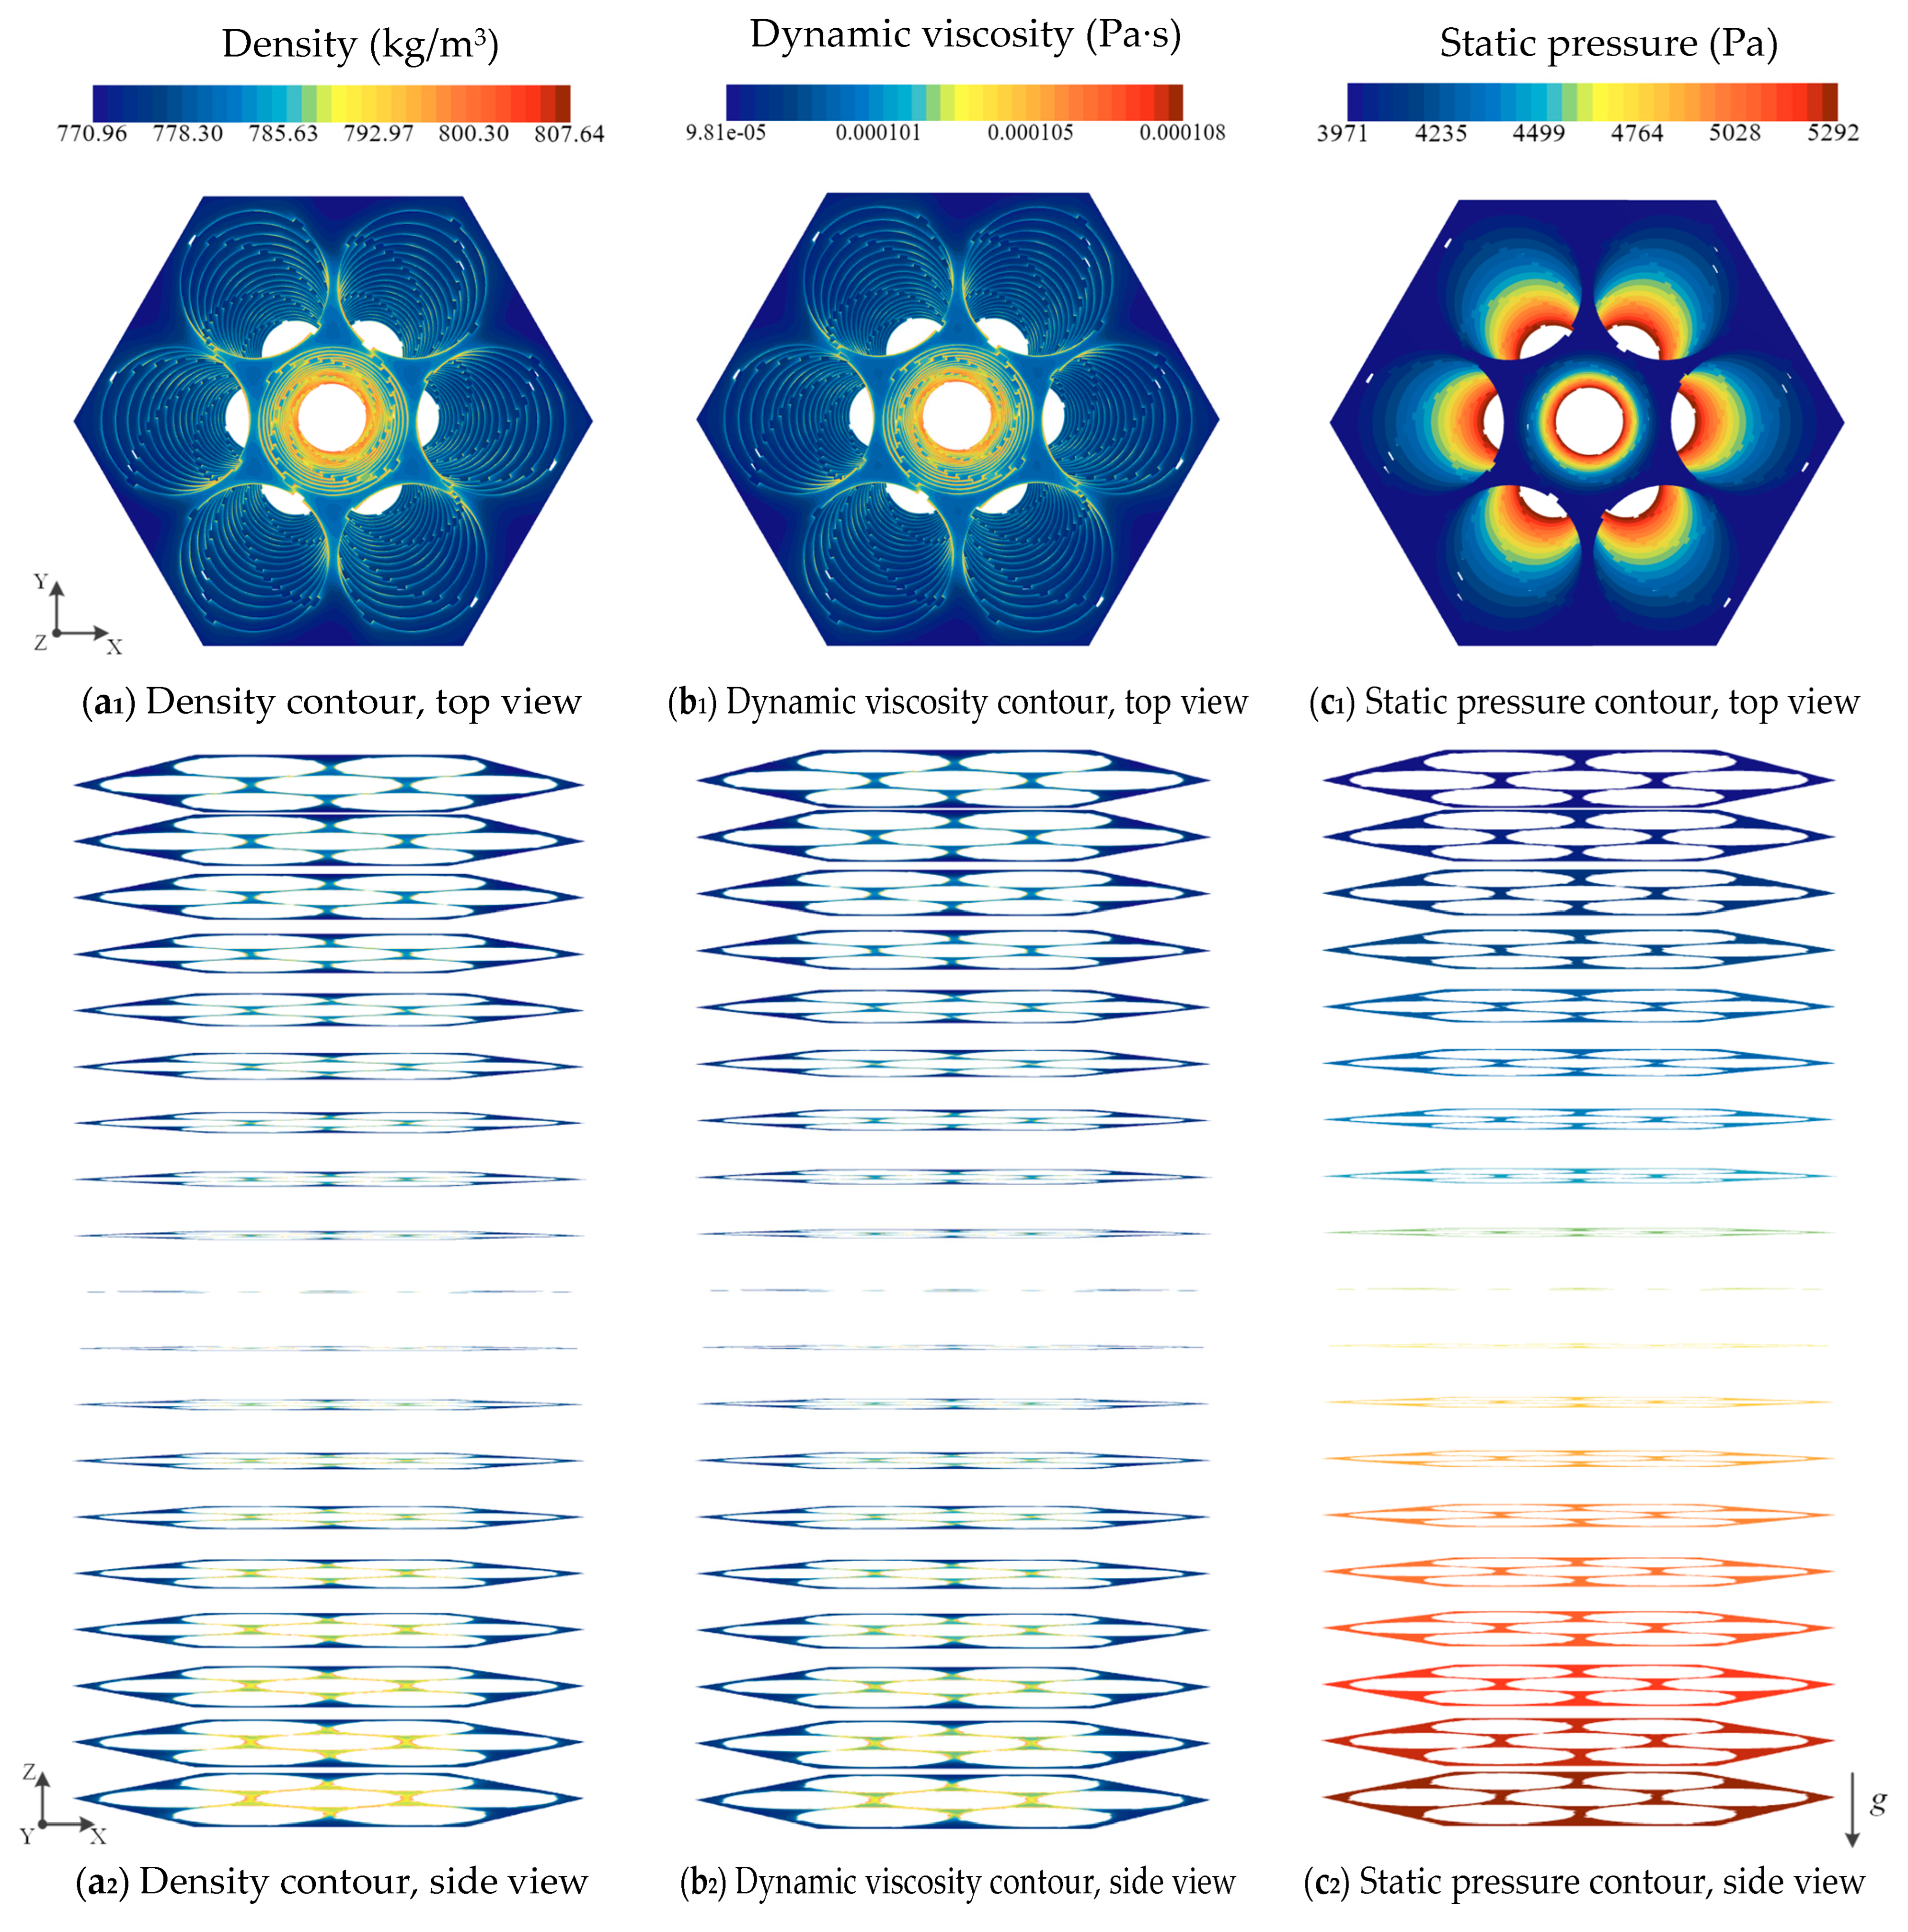
To better understand the axial flow characteristics of the spiral channel with coiled wire, Figure 21 presents the density, dynamic viscosity, and static pressure contour maps for cross-sections from 0 to 180 mm along the fully developed section of the channel. The positions of the cross-sections in the figure correspond to the actual locations, with each section spaced 10 mm apart, moving away from the inlet. To facilitate observation, both top and side views of each cross-section are provided. By examining the contour maps, it is further confirmed that the behavior of the coolant in the coiled wire spiral channel described earlier is accurate. It can be observed that the fluid near the heat transfer wall has a lower temperature, higher density, and higher dynamic viscosity, while the fluid farther from the heat transfer wall has the opposite characteristics. The static pressure of the fluid at the same height is essentially the same, and it gradually increases with decreasing vertical height.
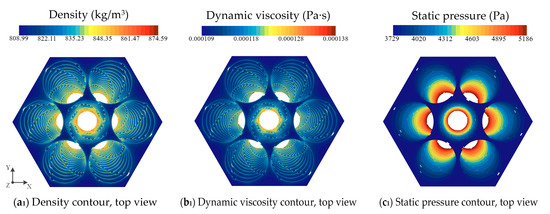
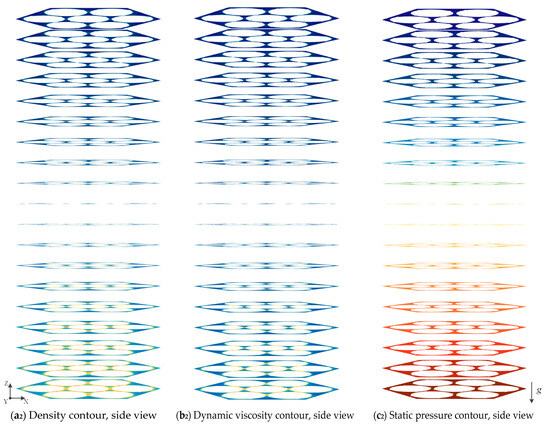
Figure 21.
Contours of different cross sections in the laminar region.
5.2.2. Axial Frictional Resistance Characteristics in Transition Region
To analyze the axial frictional resistance characteristics in the transition region, this section selects the simulation results under the condition of Re = 5654, as shown in Figure 22. The physical meanings and calculation methods in the figure are the same as those in the previous section. It can be observed that the frictional resistance coefficient distributed along the axial direction of the coiled wire spiral channel in the transition region fluctuates much less than in the laminar region. Compared with the average value of the segmented calculations, the maximum fluctuation is 22.4%. It can also be noted that the overall calculation results are higher than the average value of the segmented calculations, with a difference of 2.6%. The fluid velocity in the transition region is slightly higher than in the laminar region, and the fluid properties change less along the axial direction due to cooling, resulting in smaller fluctuations in the frictional resistance coefficient. It can also be observed that the frictional resistance coefficient along the coiled wire spiral channel decreases overall in the direction of fluid flow. This is because, in the transition region, the flow state of the fluid gradually shifts from laminar to turbulent flow. Turbulent disturbances begin to appear and gradually intensify, leading to more intense mixing between fluid molecules, a more uniform distribution of fluid energy, a gradual weakening of fluid viscosity, and a thinning of the boundary layer. As a result, the frictional resistance coefficient decreases overall along the direction of fluid flow.
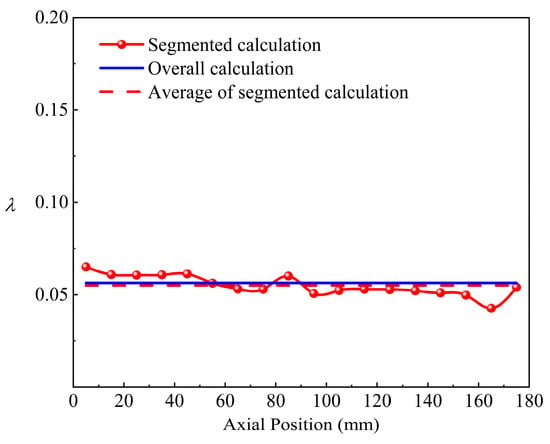
Figure 22.
Distribution of axial frictional resistance coefficient in the transition region.
Figure 23 and Figure 24 still show the distribution of velocity and temperature fields at different cross-sections every 20 mm in the fully developed section of the transition region. The fluid velocity in this region is higher, and the influence of heat transfer conditions on the fluid is not as significant as in the laminar region. It can be observed from the figures that as the channel continues to cool, the fluid temperature gradually decreases. However, due to the higher fluid velocity, the rate of temperature decrease is slower than that in the laminar region. Under the influence of heat transfer at the wall of the coiled wire spiral channel, the fluid temperature closest to the heat transfer surface decreases first, followed by the overall temperature decrease in the adjacent central sub-channels. The fluid temperature in the corner sub-channels decreases next, influenced by the geometry of the channel, and finally, the fluid temperature in the boundary sub-channels decreases.
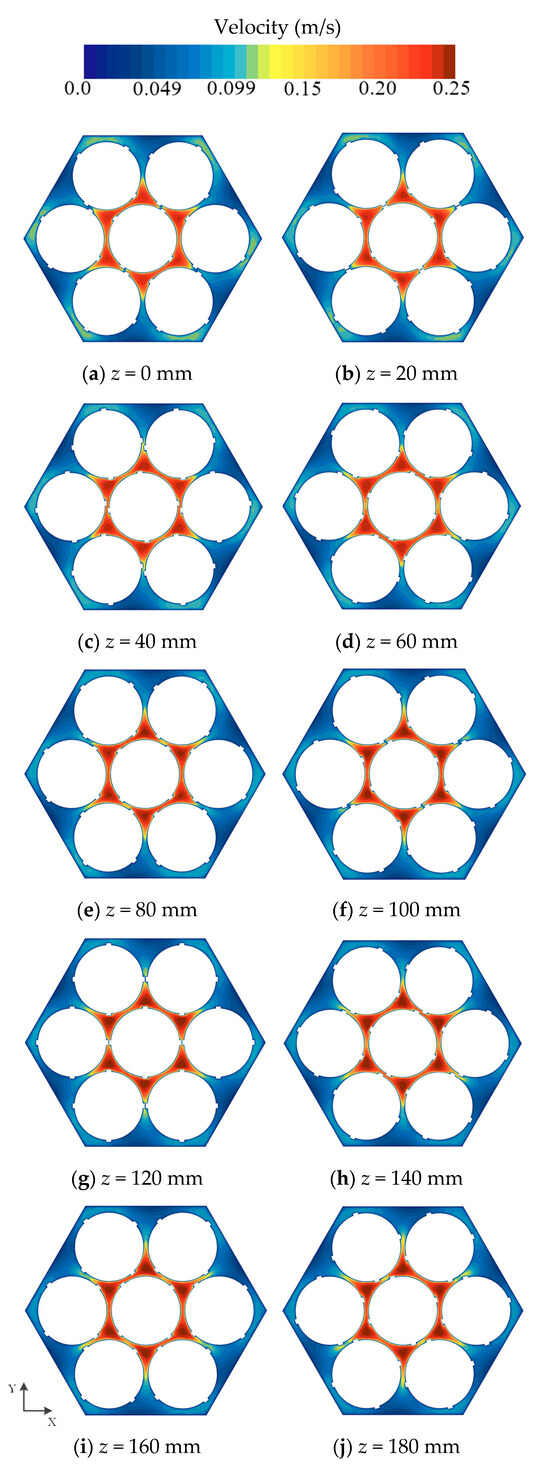
Figure 23.
Velocity contours of different cross sections in the fully developed section of the transition region.
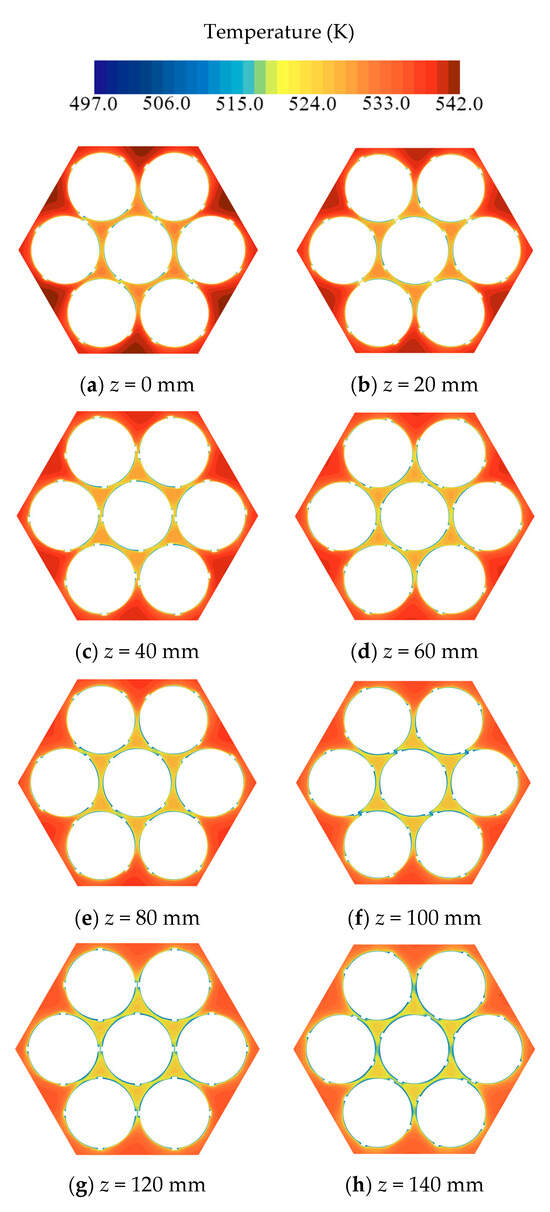
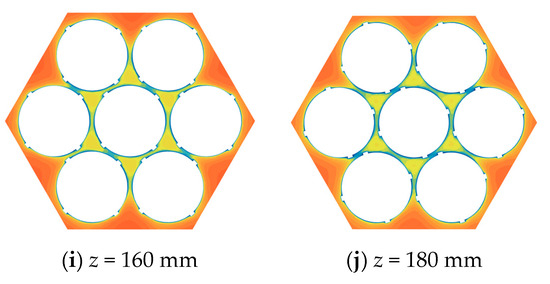
Figure 24.
Temperature contours of different cross sections in the fully developed section of the transition region.
For the velocity field, the fluid velocity in this region is higher than in the laminar region, and the transverse mixing between different sub-channels is enhanced. The flow velocity is much higher in the region adjacent to the central heat transfer rod. It can be observed from the figures that the velocity distribution at different cross-sections in the transition region shows little difference, with the highest velocity at the center of the central sub-channels, followed by the corner sub-channels, and the lowest velocity in the boundary sub-channels. Unlike the laminar condition, the fluid velocity in the central sub-channels gradually increases as the fluid flows. This is because, in the transition region, the shift in the flow state thins the boundary layer, allowing more thorough mixing between the low-speed fluid near the wall and the high-speed fluid in the central sub-channels. Under the influence of the channel geometry, fluid from the corner and boundary sub-channels supplements the central sub-channels, resulting in a larger fluid velocity in the central sub-channels that increases as the fluid flows.
Figure 25 also provides the distribution of density, dynamic viscosity, and static pressure at different cross-sections from 0 to 180 mm along the fully developed section of the coiled wire spiral channel. It can be seen that the changes in fluid properties at different cross-sections in the transition region are smaller than those in the laminar region, leading to smaller fluctuations in the frictional resistance coefficient along the axial direction.
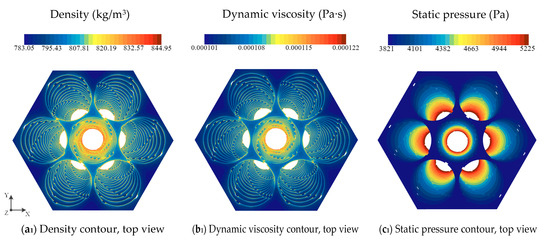
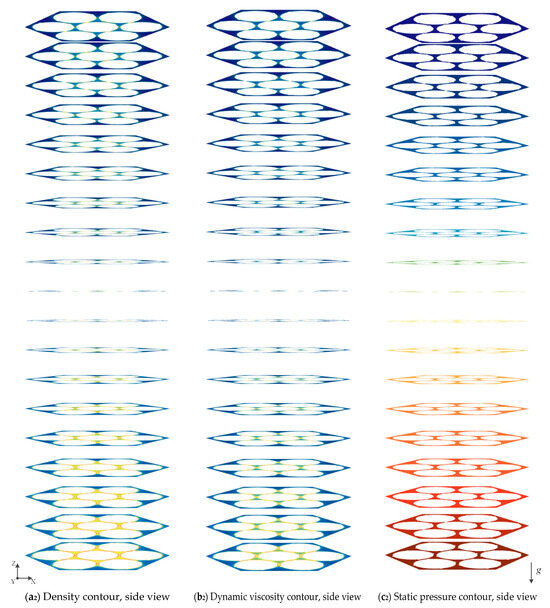
Figure 25.
Contours of different cross sections in the transition region.
5.2.3. Axial Frictional Resistance Characteristics in Turbulent Region
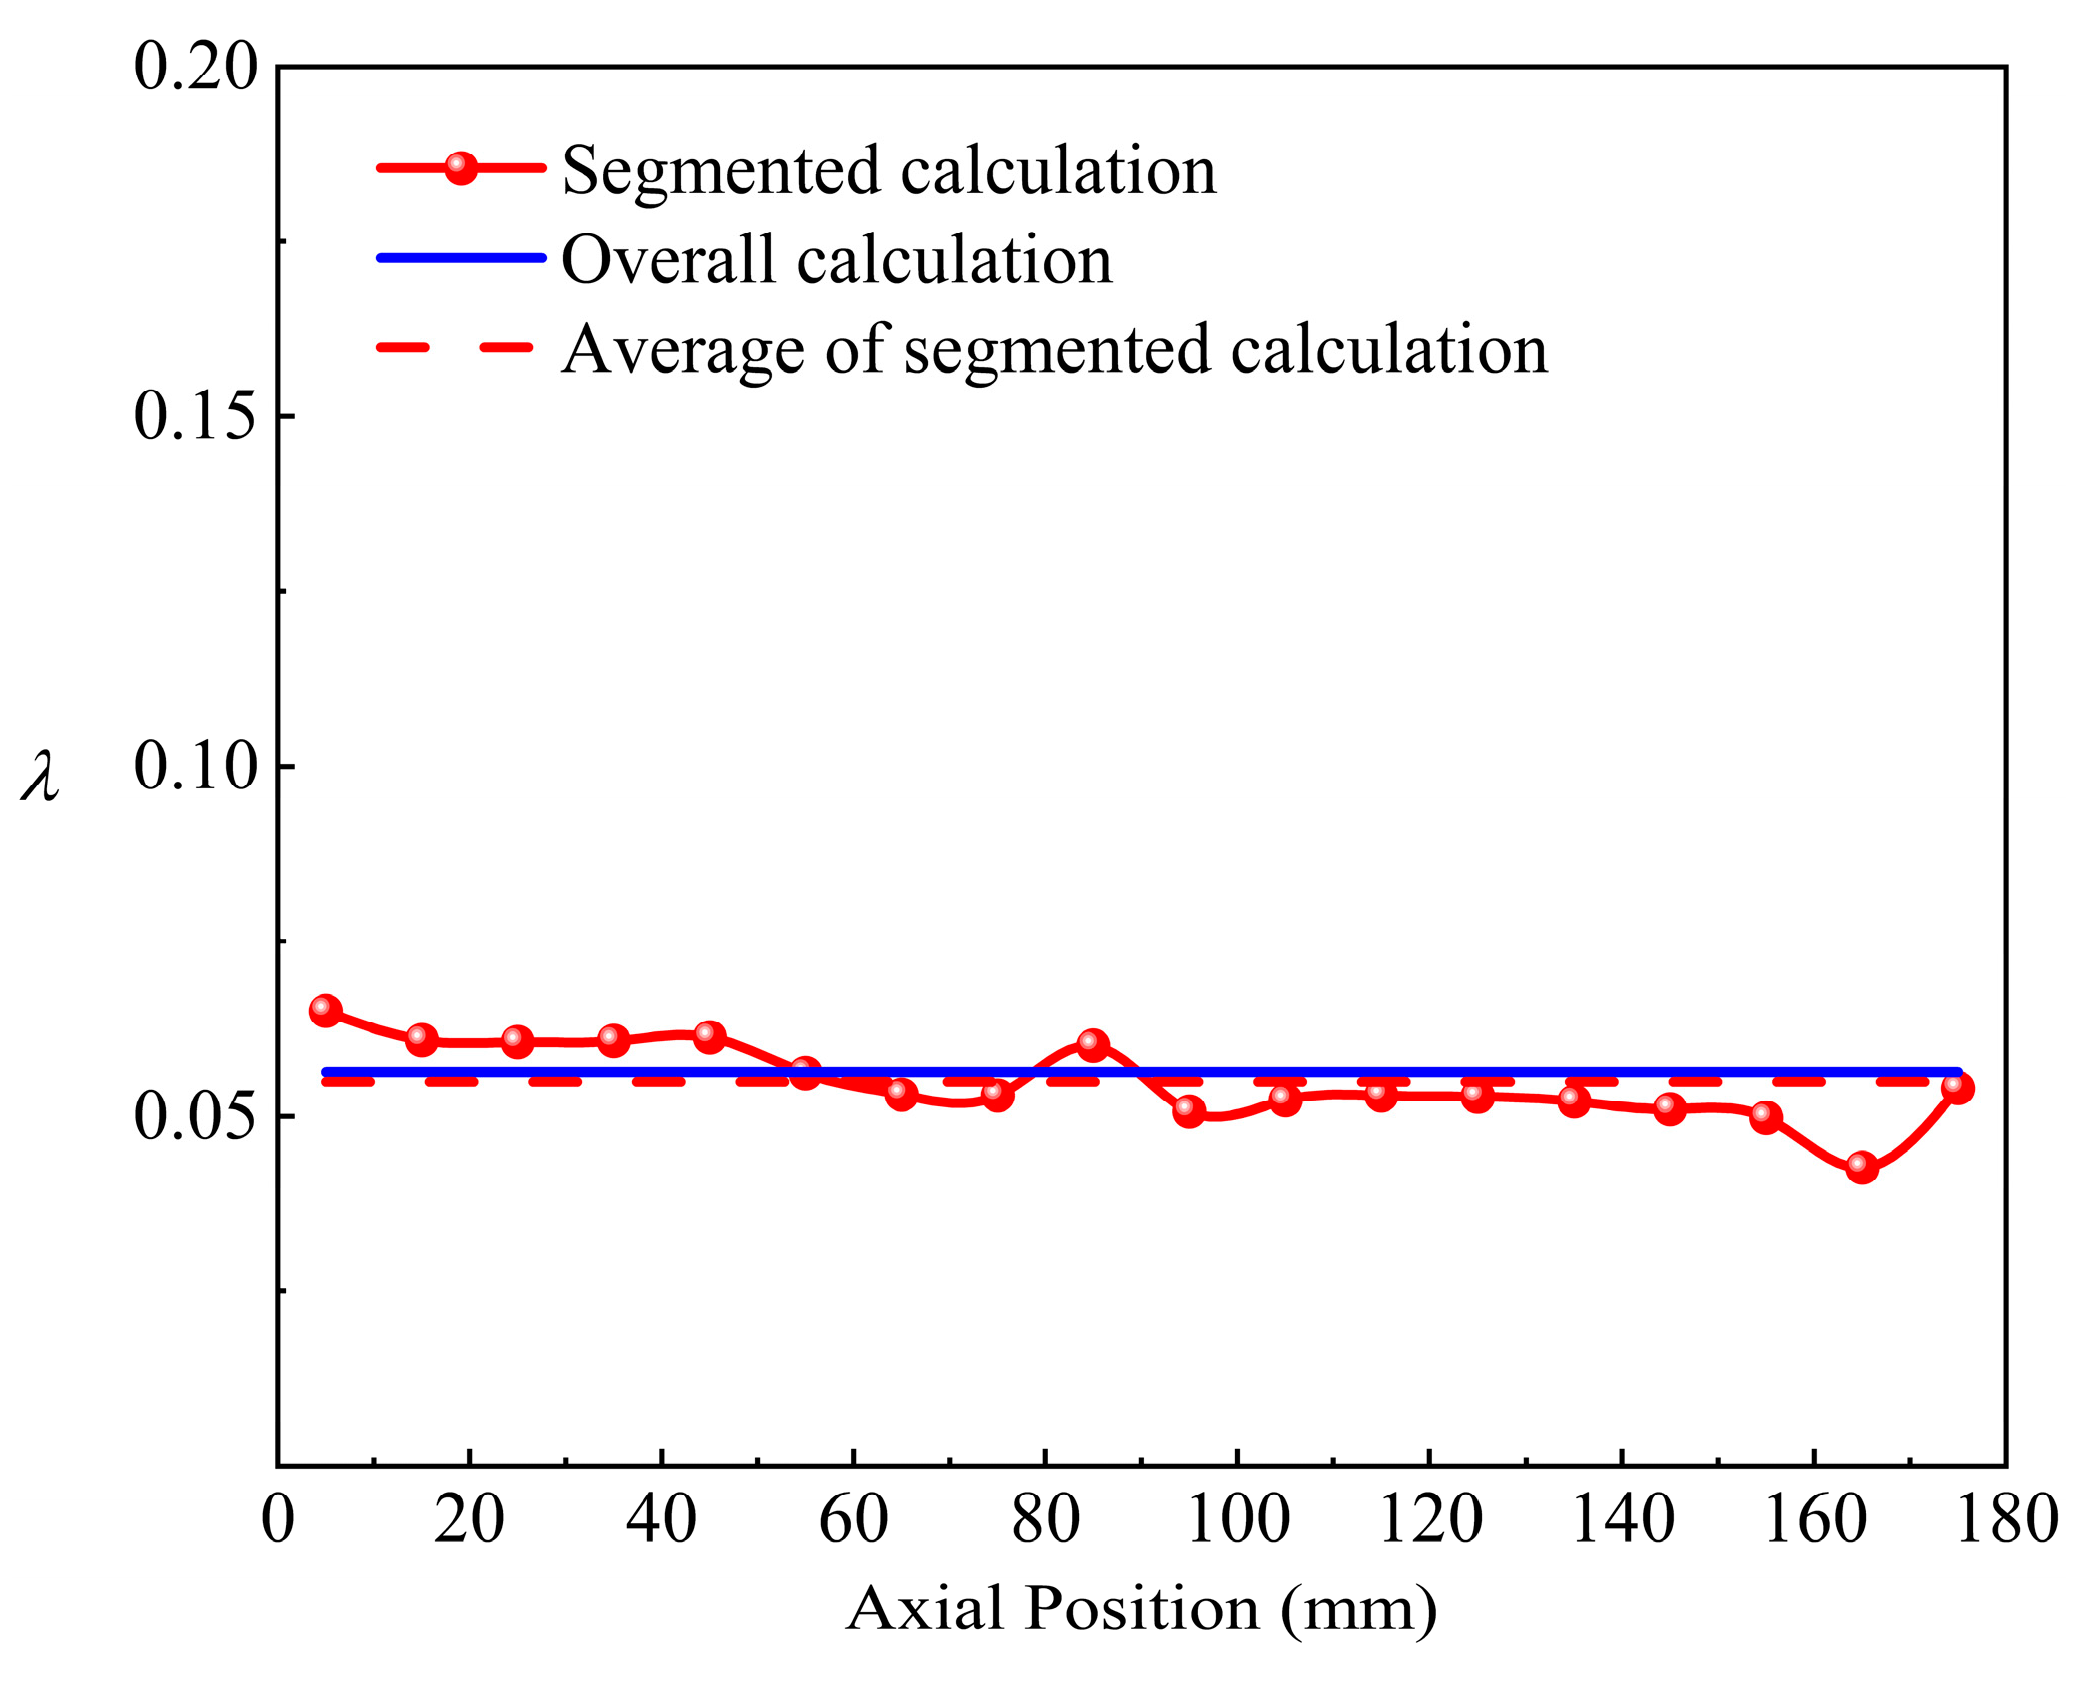
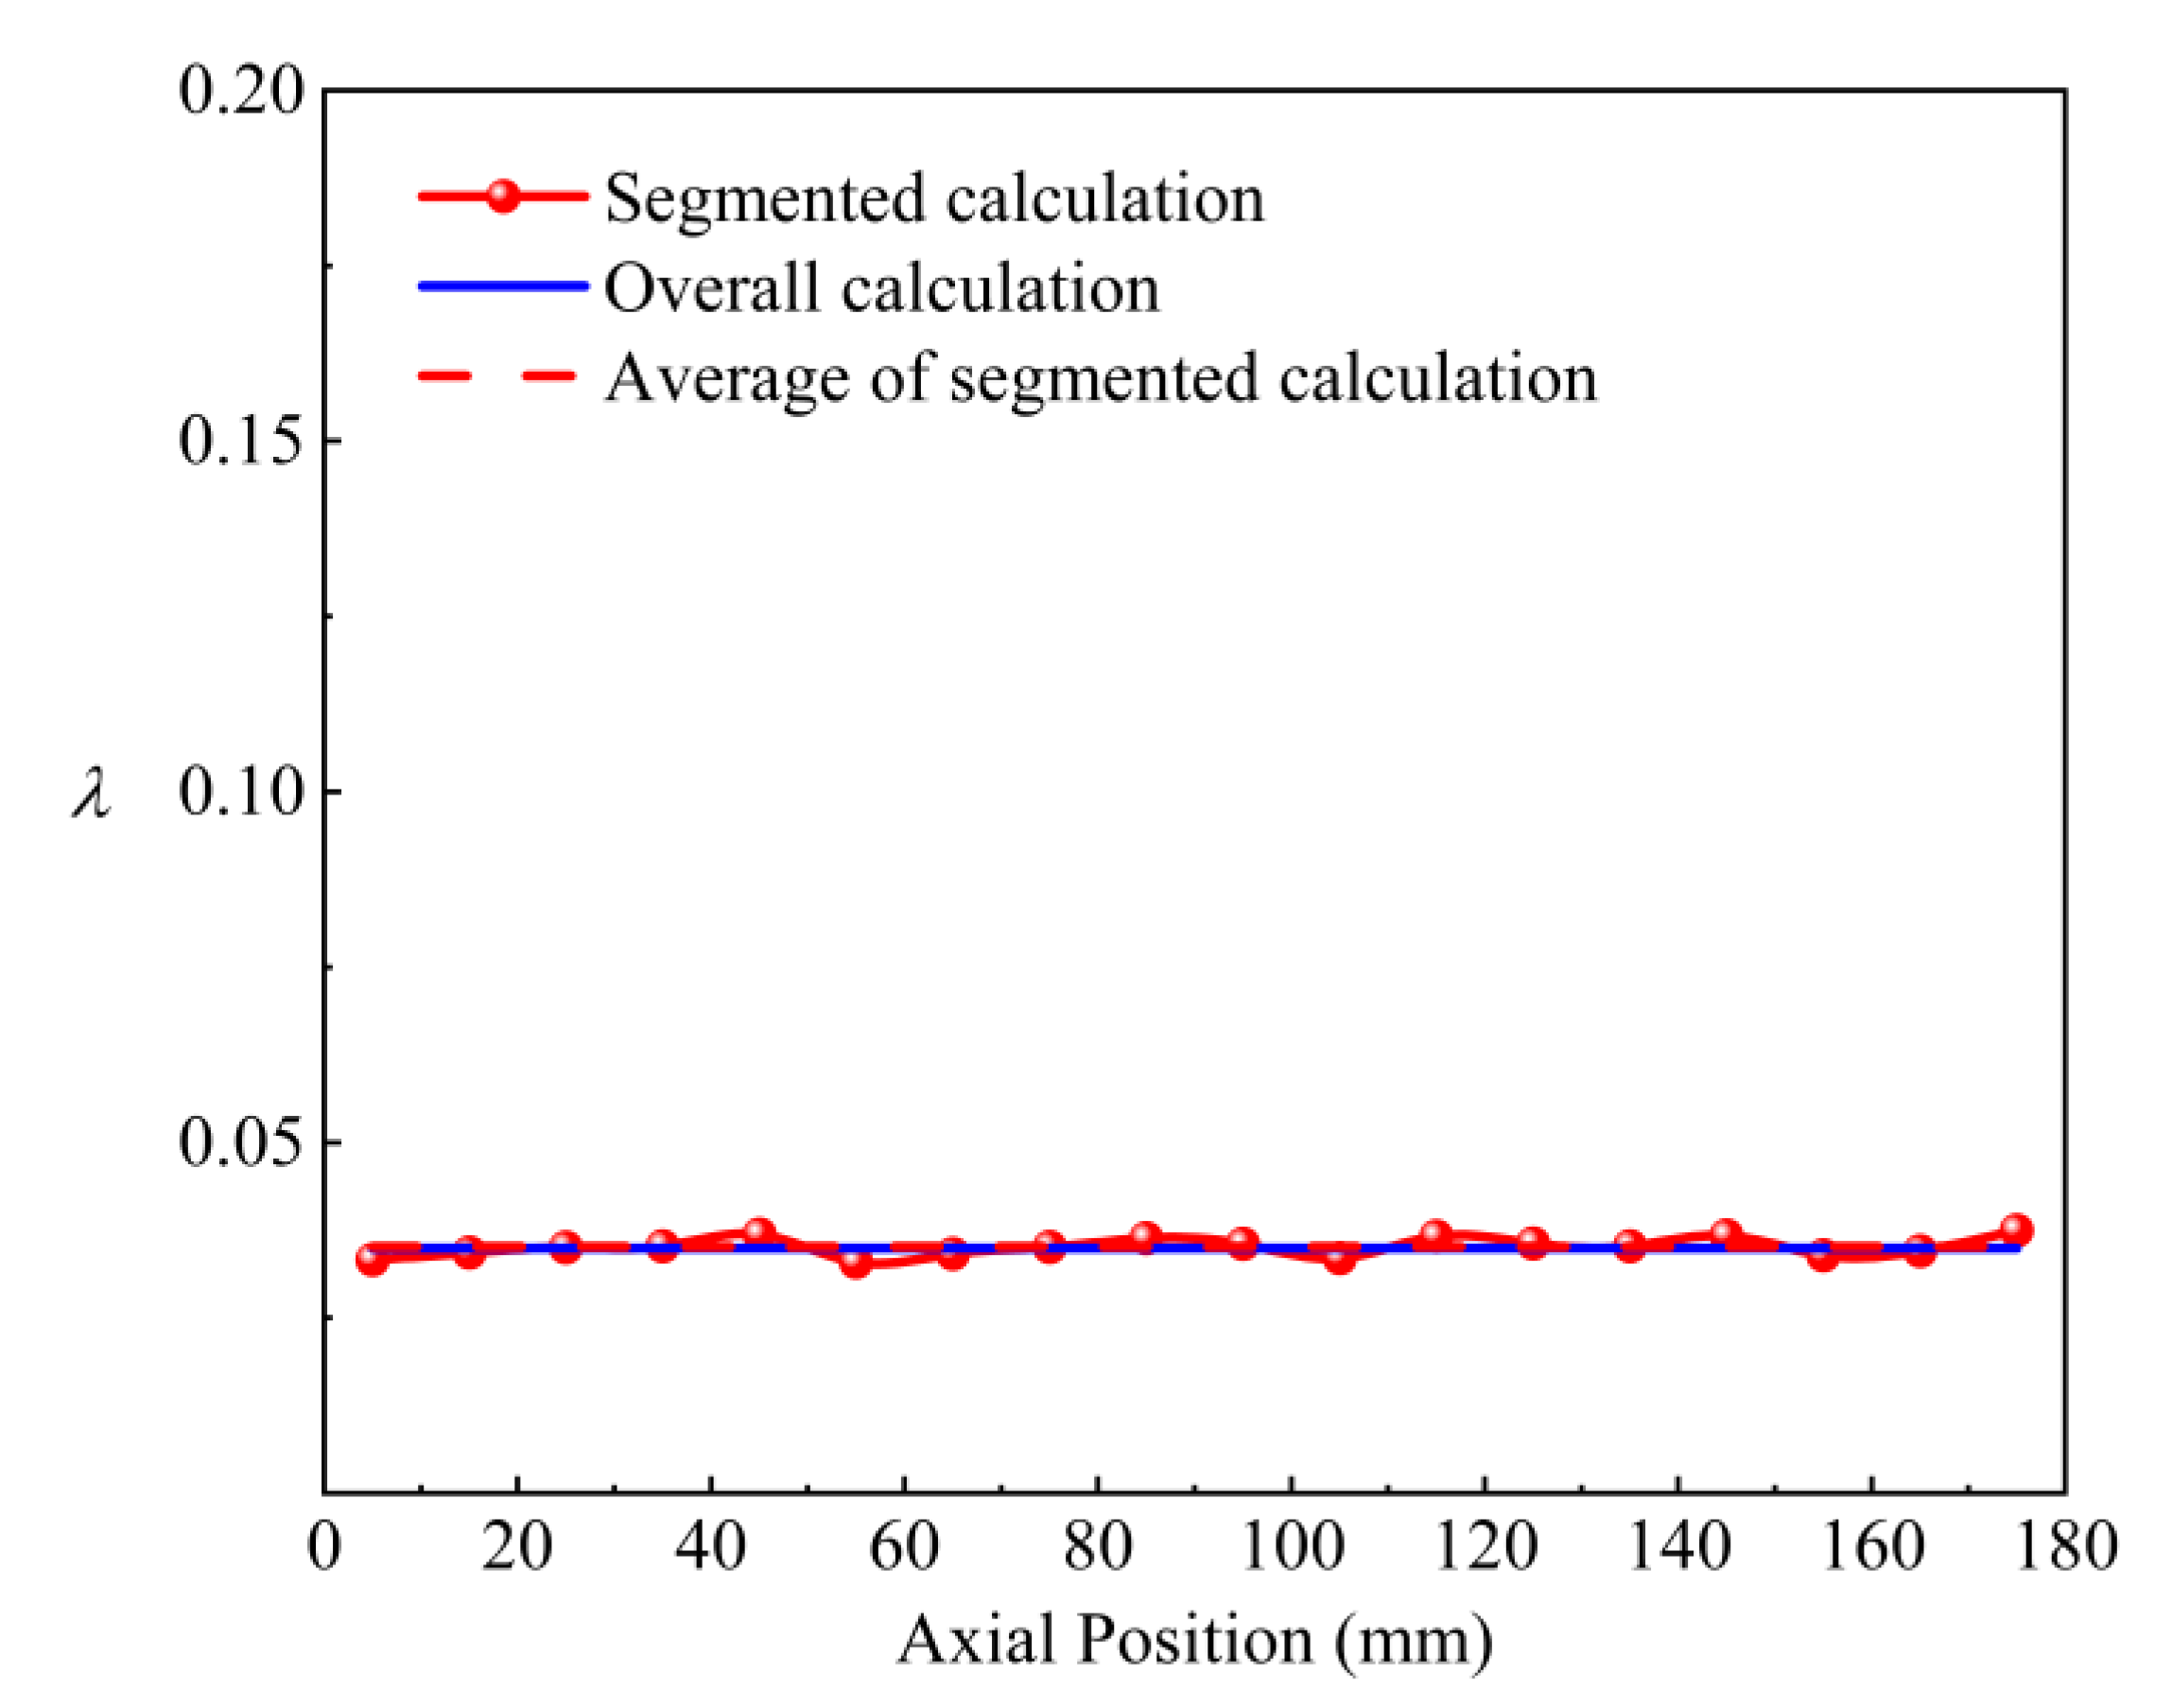
To analyze the axial frictional resistance characteristics in the turbulent region, this section selects the simulation results under the condition of Re = 11,270, as shown in Figure 26. The physical meanings and calculation methods in the figure are the same as those in the previous section. It can be observed that although the fluid velocity in the turbulent region is high, the frictional resistance coefficient distributed along the axial direction of the coiled wire spiral channel still exhibits minor fluctuations. Compared with the average value of the segmented calculations, the maximum fluctuation is only 6.7%. The overall calculation results are lower than the average value of the segmented calculations, with a difference of 0.5%. The fluid velocity in the turbulent region is the highest, and although the fluid properties change along the axial direction due to cooling, the fluctuations are minimal. As a result, compared with the laminar and transition regions, the fluctuations in the frictional resistance coefficient are the smallest in the turbulent region. In this region, the difference between the overall calculation method and the segmented calculation method is the smallest.
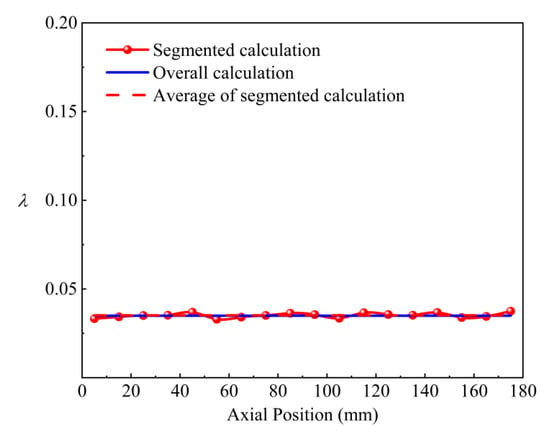
Figure 26.
Distribution of axial frictional resistance coefficient in the turbulent region.
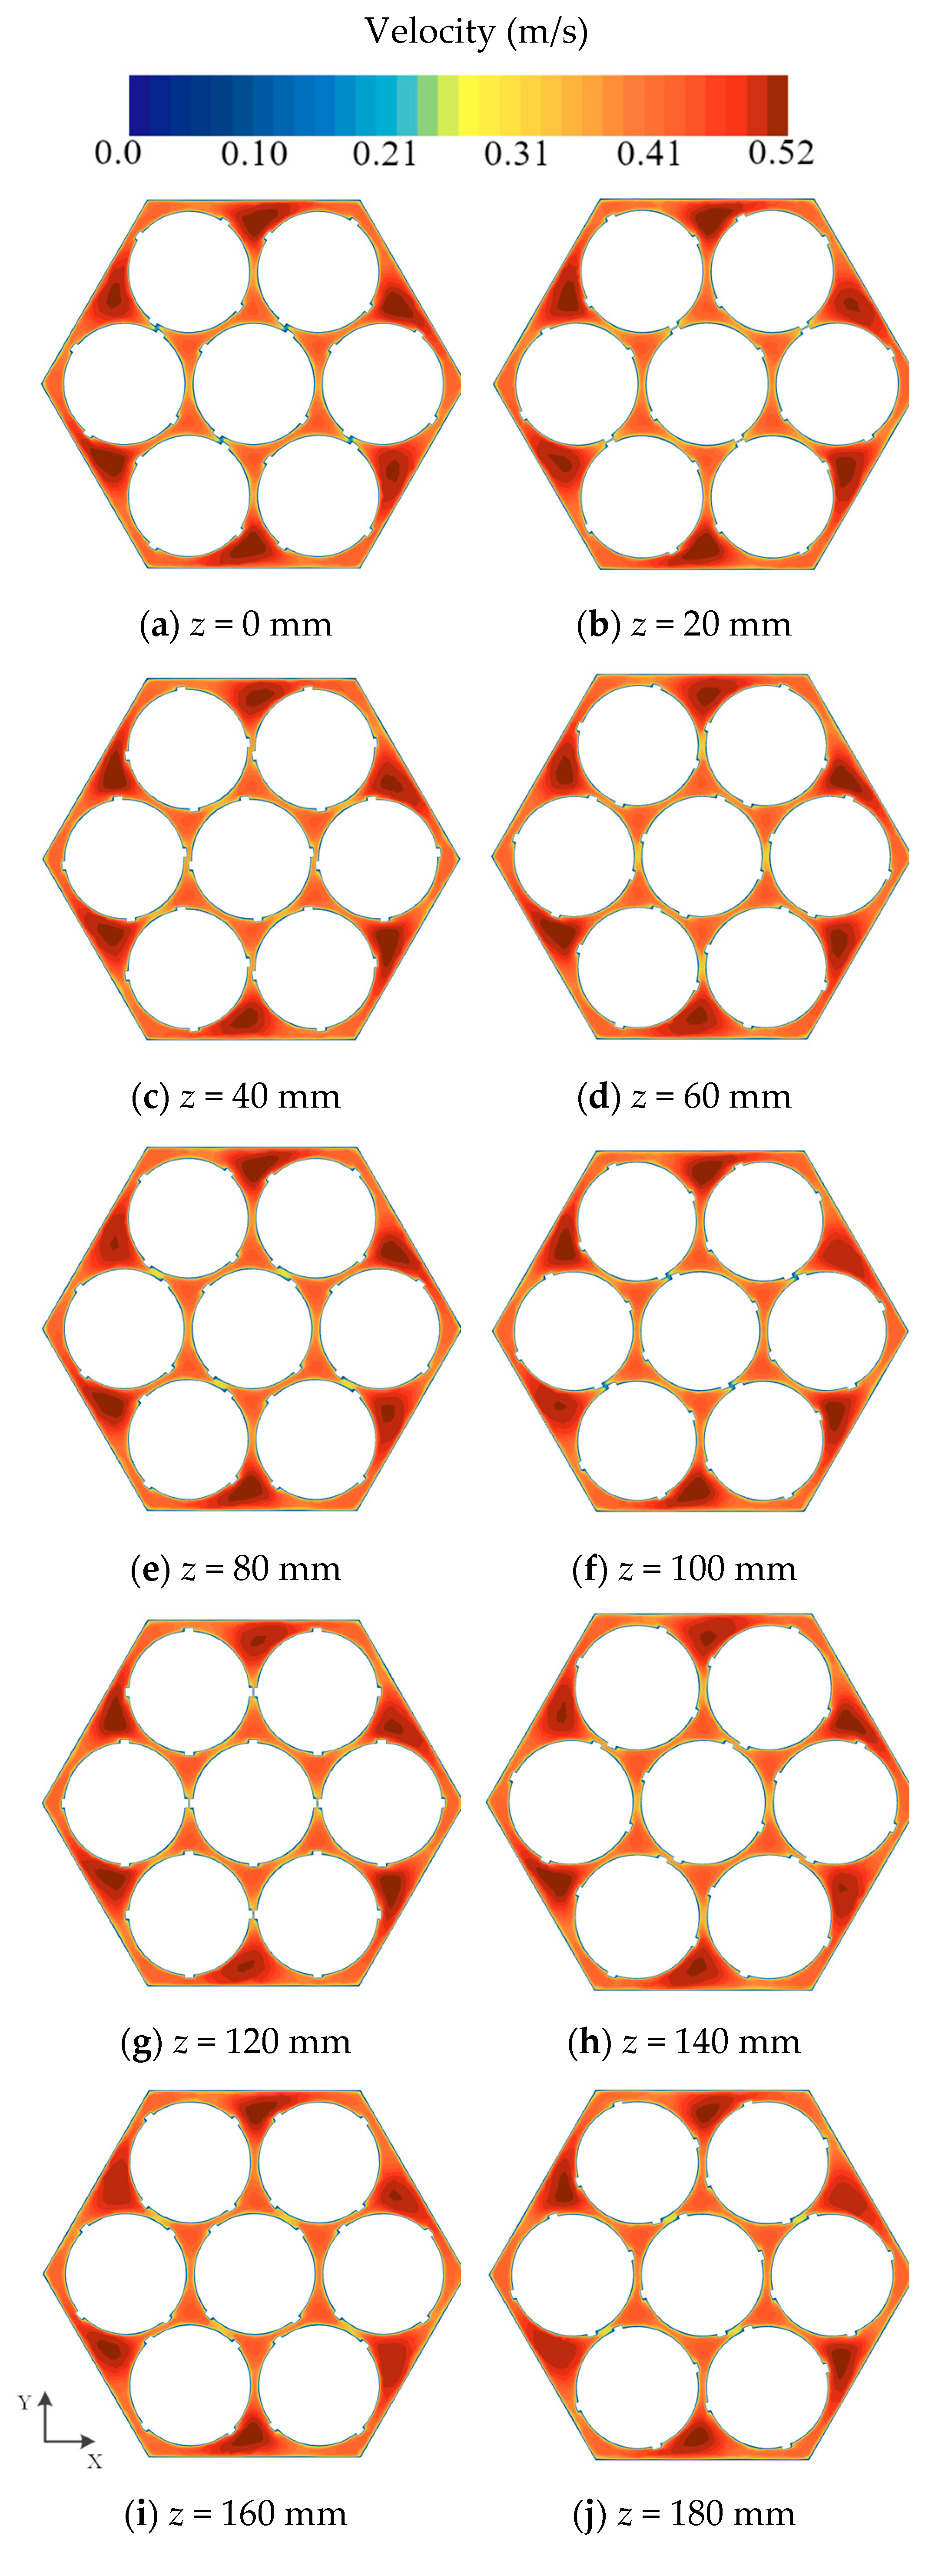
Similarly, the distribution of velocity and temperature fields at different cross-sections every 20 mm in the fully developed section is provided, as shown in Figure 27 and Figure 28. In the turbulent region, the fluid velocity is the highest. However, unlike the laminar and transition regions, the maximum velocity occurs in the boundary sub-channels rather than the central sub-channels. This is due to the special geometry of the coiled wire spiral channel, which causes the fluid to experience centrifugal force during flow, leading the fluid to move towards the wall and; thus, generating secondary flow perpendicular to the axial direction. When the fluid velocity is high, this secondary flow enhances the turbulence and mixing near the boundary sub-channels, resulting in a higher velocity region in the boundary sub-channels [31]. Therefore, a distribution is formed in the turbulent region where the boundary sub-channels have the highest velocity, followed by the central sub-channels, and the corner sub-channels have the lowest velocity.
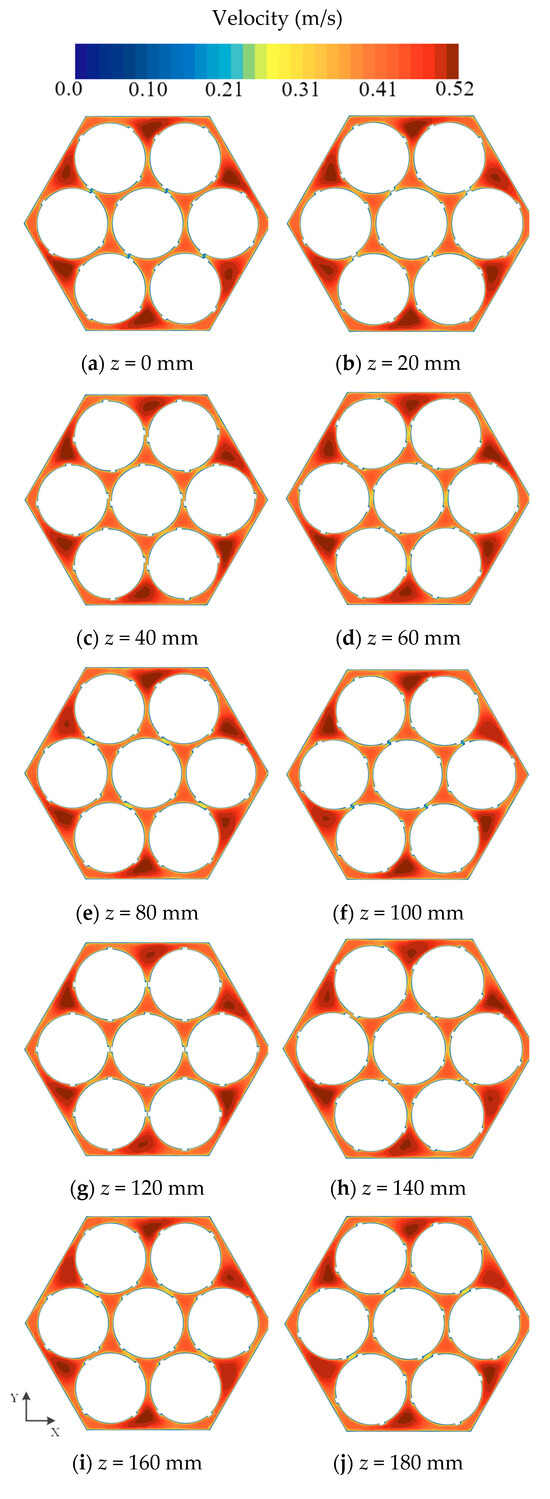
Figure 27.
Velocity contours of different cross sections in the fully developed section of the turbulent region.
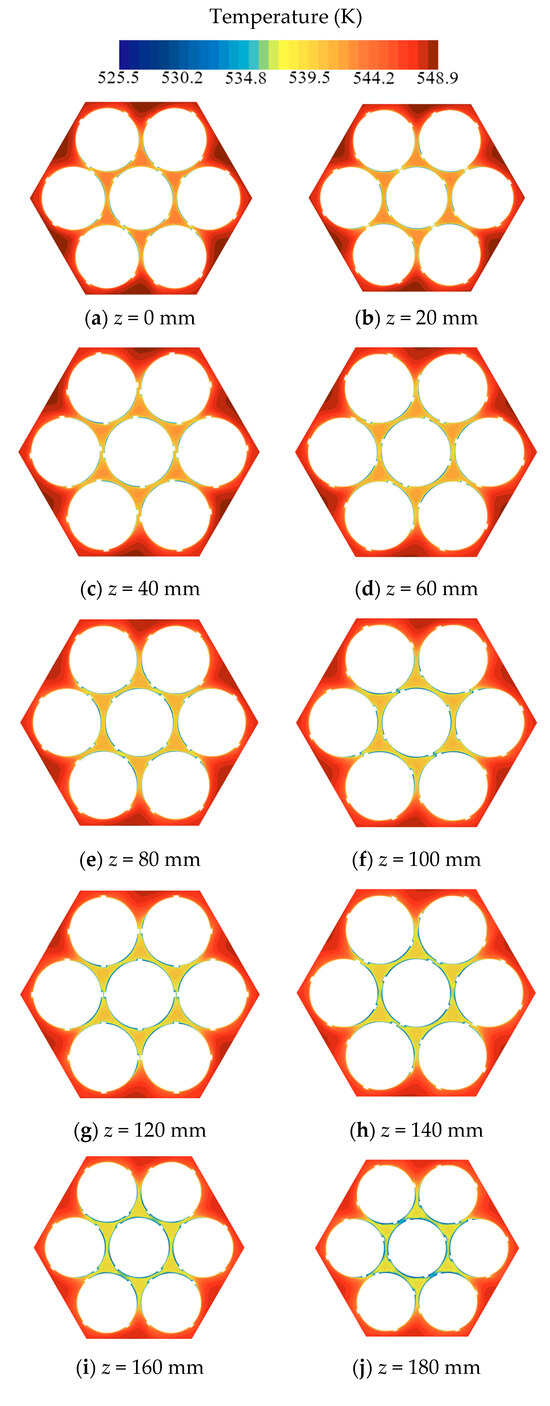
Figure 28.
Temperature contours of different cross sections in the fully developed section of the turbulent region.
Under the same heat transfer power conditions, the changes in fluid properties along the flow direction in the turbulent region are slower compared to the transition region. The temperature variation characteristics of the heat transfer channel can also be observed from the temperature field changes at different cross-sections, which are similar to those described in the previous section, so they are not repeated here.
Figure 29 shows the density, dynamic viscosity, and static pressure contour maps at different cross-sections from 0 to 180 mm along the fully developed section of the coiled wire spiral channel. It can be seen that the changes in fluid properties at different cross-sections are small, and the fluid is less affected by the cooling conditions, resulting in small changes in the frictional resistance coefficient along the axial direction.
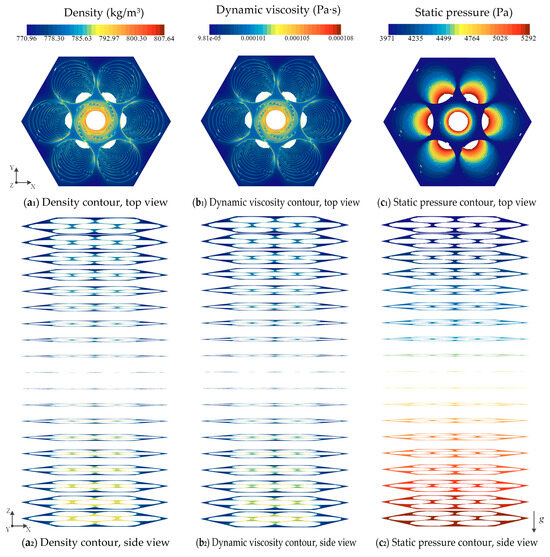
Figure 29.
Contours of different cross sections in the turbulent region.
By analyzing the axial flow along the coiled wire spiral channel in different regions under various conditions, it can be found that the frictional resistance coefficient along the cooling spiral channel varies continuously in all regions. Even in the turbulent region, where the fluid velocity is the highest, fluctuations in the frictional resistance coefficient still exist. This indicates that heat transfer conditions always have an impact on the resistance characteristics within the coiled wire spiral channel. As the fluid velocity increases, this impact gradually diminishes but cannot be completely ignored. Additionally, as the fluid velocity increases, the frictional resistance coefficient calculated by treating the fully developed section of the coiled wire spiral channel as a whole becomes increasingly close to the average value obtained from segmented calculations. This suggests that the frictional resistance coefficient of the cooling spiral channel calculated using the segmented method is more accurate than that obtained from traditional algorithms and better reflects the changes along the flow direction of the channel. When the fluid velocity is high, the traditional algorithm can also ensure the credibility of the frictional resistance coefficient calculation results to some extent. The segmented calculation results are more accurate than the overall calculation results, and the more segments used, the closer the results are to the actual conditions.
By analyzing the velocity fields in different regions, it can be found that the velocity distribution in the coiled wire spiral channel is different due to heat transfer conditions: in the laminar region, the fluid velocity in the central sub-channels gradually decreases as the fluid flows; in the transition region, the fluid velocity in the central sub-channels gradually increases as the fluid flows; in the turbulent region, the fluid velocity in the central sub-channels remains essentially unchanged as the fluid flows. The maximum velocity distribution at different cross-sections in the laminar and transition regions occurs at the center of the central sub-channels, while in the turbulent region, the maximum velocity distribution at different cross-sections occurs at the boundary sub-channels. By analyzing the temperature fields in different regions, it can be found that the temperature distribution in the channel is essentially consistent due to heat transfer conditions: the fluid temperature near the heat transfer wall decreases first, and when the wires meet, the heat transfer effect between the fluid and the channel wall is better, leading to a further decrease in fluid temperature. As the fluid continues to flow forward, the fluid mixing is more thorough under the influence of the coiled wire, further enhancing heat transfer and making the fluid temperature in the channel more uniform. The fluid temperature in the central sub-channels decreases overall, followed by a decrease in the fluid temperature in the corner and boundary sub-channels. This section elucidates the impact of heat transfer conditions on the flow patterns within the channel by analyzing the contour maps of different cross-sections of the coiled wire spiral channel, thereby revealing the flow variation patterns within the channel and further corroborating the analysis in Section 5.1.
6. Conclusions
This paper conducts an in-depth analysis of the flow characteristics within a coiled wire spiral channel through numerical research. The Reynolds stress transport turbulence model is selected to study the frictional resistance characteristics of the channel under vertical conditions. The paper provides a method for determining the fully developed section of the heat transfer channel and conducts a detailed study of the fully developed fluid within the coiled wire spiral channel. The frictional resistance characteristic curve of the coiled wire spiral channel is divided into three regions, and the variation patterns of the frictional resistance characteristics along the axial direction of the spiral channel under vertical conditions are explored. The main conclusions are as follows:
- By calculating the dimensionless velocities along two types of probe lines at different heights from the channel inlet and assessing the overlap of the dimensionless velocity curves at different heights, it is determined whether the fluid has reached full development. The variation of the velocity field along the axial direction of the channel is also considered to judge whether the fluid has fully developed. An evaluation criterion for the velocity distribution of fully developed fluid is provided. By calculating the ratio of the transverse fluctuating velocity to the mainstream velocity at different cross-sections from the channel inlet, it is concluded that full development is achieved when the ratio is below 11.5%. The study results show that for the coiled wire spiral channel on the primary side of the casing once-through steam generator, the inlet section length is L∗ = 80De.
- A numerical study under vertical conditions is conducted for a broad range of Reynolds numbers. The characteristic curve of the frictional resistance of the coiled wire spiral channel is divided into three regions based on the different characteristics of the frictional resistance under different Reynolds number ranges: laminar region, transition region, and turbulent region.
- The frictional resistance coefficient within the coiled wire spiral channel under vertical conditions is related to the fluid velocity, fluid property parameters, and channel structural parameters. Under the same heat transfer power, the frictional resistance coefficient of the coiled wire spiral channel decreases gradually with the increase of Reynolds number. By analyzing the data results under different heat transfer powers, a kinematic viscosity correction factor is introduced, and an expression for the frictional resistance coefficient of the channel is obtained. This predictive expression fits well with the frictional resistance characteristic curve of the coiled wire spiral channel, with a relative error within ±10%.
- It is found through the study of the frictional resistance coefficient along the axial direction of the coiled wire spiral channel under vertical conditions that, due to continuous heat transfer in the channel, the frictional resistance coefficient fluctuates at different positions along the channel. In the laminar condition, the fluid velocity is low, and the frictional resistance coefficient fluctuates significantly due to the strong influence of heat transfer conditions. The frictional resistance coefficient in the channel increases overall in the direction of fluid flow. In the transition condition, the fluid velocity is slightly higher, and the influence of heat transfer conditions is reduced, leading to smaller fluctuations in the frictional resistance coefficient, which decreases overall in the direction of fluid flow. In the turbulent condition, the fluid velocity is the highest, and the influence of heat transfer conditions is the smallest, resulting in the smallest fluctuations in the frictional resistance coefficient, which remains essentially constant in the direction of fluid flow. The frictional resistance coefficient of the heat transfer channel calculated using the segmented method is more accurate than that obtained from traditional algorithms and better reflects the changes along the flow direction of the channel. The more segments used in the calculation, the closer the results are to the actual conditions. When the fluid velocity is high, the traditional algorithm can ensure the credibility of the frictional resistance coefficient calculation results to some extent.
- Through the analysis of the flow field at different axial positions along the cooling channel, a deeper understanding of the variation patterns of flow along the axial direction of the heat transfer channel is achieved. As the fluid in the coiled wire spiral channel is continuously cooled, for the velocity field, the fluid velocity in the central sub-channels decreases gradually in the laminar condition, increases gradually in the transition condition, and remains essentially unchanged in the turbulent condition. The maximum velocity distribution at different cross-sections occurs at the center of the central sub-channels in the laminar and transition conditions, while it occurs at the boundary sub-channels in the turbulent condition. For the temperature field, the fluid temperature near the heat transfer wall decreases first. When the wires meet, the fluid temperature decreases further. Under the influence of the coiled wire, the fluid mixing is more thorough, and heat transfer is enhanced, making the fluid temperature in the channel more uniform. This leads to an overall decrease in the fluid temperature in the central sub-channels, followed by a decrease in the fluid temperature in the corner and boundary sub-channels.
Author Contributions
Conceptualization, S.F.; Data curation, A.L.; Formal analysis, P.L.; Investigation, J.J.; Methodology, Y.Z.; Project administration, Y.C.; Resources, L.F.; Software, X.L.; Supervision, S.F.; Validation, Q.C.; Visualization, Y.Z.; Writing—original draft, Y.Z.; Writing—review and editing, J.L. All authors have read and agreed to the published version of the manuscript.
Funding
This research received no external funding.
Data Availability Statement
The original contributions presented in this study are included in the article. Further inquiries can be directed to the corresponding author.
Conflicts of Interest
The authors declare that they have no known competing financial interests or personal relationships that could have appeared to influence the work reported in this paper.
Nomenclature
| A | cross-sectional flow area, m2 |
| C | constant |
| ct | kinematic viscosity correction coefficient |
| De | equivalent diameter, m |
| E | total energy per unit mass, kJ/kg |
| body force, N/m3 | |
| G | mass flux, kg/m2·s |
| unit tensor | |
| L | channel total length, m |
| L2 | second piezometric section length, m |
| L∗ | entrance length, m |
| Q | heat transfer power, kW |
| heat flux, kW/m2 | |
| p | pressure, Pa |
| Re | Reynolds number |
| heat source per unit volume, kW/m3 | |
| T | temperature, K |
| viscous stress tensor, kJ/m3 | |
| trace of the Reynolds stress tensor | |
| v | velocity, m/s |
| V | dimensionless velocity |
| w | uncertainty |
| ΔP | pressure drop, Pa |
| ΔPf | frictional pressure drop, Pa |
| Greek letters | |
| χ | wetted perimeter, m |
| ρ | density, kg/m3 |
| υ | kinematic viscosity, m2/s |
| λ | frictional resistance coefficient |
| second-order tensor, kJ/m3 | |
| ϕ | intermittency factor |
| Subscripts | |
| i | inlet |
| o | outlet |
| m | maximum |
| L | laminar |
| T | turbulent |
| w | wall |
| f | fluid |
| Abbreviations | |
| COTSG | Casing Once-Through Steam Generator |
| CFD | Computational Fluid Dynamics |
| RST | Reynolds stress transport |
| RANS | Reynolds-Averaged Navier-Stokes |
References
- Yang, C.; Fang, C.; Tong, J. Necessity of Developing Nuclear Energy in China. Nucl. Power Eng. 2014, 35 (Suppl. 1), 200–202. [Google Scholar]
- Cheng, S.K.; Todreas, N.E. Hydrodynamic models and correlations for bare and wire-wrapped hexagonal rod bundles—Bundle friction factors, subchannel friction factors and mixing parameters. Nucl. Eng. Des. 1986, 92, 227–251. [Google Scholar] [CrossRef]
- Gu, H. Study on Mechanism of Heat Transfer Enhancement of Vortex Flow in Complex Channels. Southeast University, 2021. Available online: https://cdmd.cnki.com.cn/Article/CDMD-10286-1022462780.htm (accessed on 23 February 2025).
- Ghobadi, M.; Muzychka, Y.S. Pressure drop in mini-scale coiled tubing. Exp. Therm. Fluid Sci. 2014, 57, 57–64. [Google Scholar] [CrossRef]
- Zhang, L.; Xing, Y.; Wu, J. Flow characteristics in helical duct with rectangular cross section. J. Chem. Ind. Eng. 2010, 61, 1089–1096. [Google Scholar]
- Nobari, M.R.H.; Shiniyan, B.; Mirzaei, M. Mixed convection in a vertical helical annular pipe. Int. J. Heat Mass Transf. 2014, 73, 468–482. [Google Scholar] [CrossRef]
- Liu, L.; Shen, C.; Liu, M.; Xiao, Y.; Cong, T.; Gu, H. Numerical simulation of the thermal-hydraulic characteristics of the liquid metal flow across the single-start helical coiled tube bundles. Prog. Nucl. Energy 2024, 173, 105270. [Google Scholar] [CrossRef]
- Wang, C.; Chen, S.; Tian, W.; Su, G.; Qiu, S. Thermal-hydraulic analysis of He–Xe gas mixture in 2×2 rod bundle wrapped with helical wires. Nucl. Eng. Technol. 2023, 55, 2534–2546. [Google Scholar] [CrossRef]
- Yang, Y. Thermal-hydraulic characteristics of FLiBe in annuli with helical wire. Int. J. Mech. Sci. 2023, 243, 108056. [Google Scholar] [CrossRef]
- Yuan, X.; Guo, Y.; Zhou, J.; Zhang, B.; Wei, J.; Tan, W.; Chen, Y.; Yang, S. Numerical study on the thermal hydraulic characteristics in mixed pattern of wire-wrapped bundle for fast reactor annular fuel assembly. Ann. Nucl. Energy 2023, 181, 109541. [Google Scholar] [CrossRef]
- Saha, G.; Paul, M.C. Investigation of the characteristics of nanofluids flow and heat transfer in a pipe using a single phase model. Int. Commun. Heat Mass Transf. 2018, 93, 48–59. [Google Scholar] [CrossRef]
- Saha, G.; Paul, M.C. Numerical analysis of the heat transfer behaviour of water based Al2O3 and TiO2 nanofluids in a circular pipe under the turbulent flow condition. Int. Commun. Heat Mass Transf. 2014, 56, 96–108. [Google Scholar] [CrossRef]
- Saha, G.; Paul, M.C. Heat transfer and entropy generation of turbulent forced convection flow of nanofluids in a heated pipe. Int. Commun. Heat Mass Transf. 2015, 61, 26–36. [Google Scholar] [CrossRef]
- Saha, G.; Paul, M.C. Analysis of Heat Transfer and Entropy Generation of TiO2-Water Nanofluid Flow in a Pipe under Transition. Procedia Eng. 2015, 105, 381–387. [Google Scholar] [CrossRef][Green Version]
- Islam, M.Z.; Saha, G.; Chin, Y.S.; Saha, S.C. Heat transfer intensification in a horizontal tube utilizing hexagonal perforated tube inserts. J. Nav. Archit. Mar. Eng. 2024, 21, 155–168. [Google Scholar]
- Golam, A.S. Experimental and Numerical Investigation of the Performance of Turbulent Heat Transfer in Tubes with Different Cross-Sectioned Wire Coils. Front. Heat Mass Transf. 2024, 22, 633–653. [Google Scholar] [CrossRef]
- Mousavi Ajarostaghi, S.S.; Basem, A.; Al-Mansoori, K.W.; Sultan, A.J.; Al-Yasiri, M.; Karouei, S.H.H.; Ahangaran, H. Numerical evaluation of the impact of using spiral innovative turbulator on improving the thermal performance of a helical double-pipe heat exchanger. Int. J. Thermofluids 2024, 24, 100830. [Google Scholar] [CrossRef]
- Ali, E.; Park, C.; Kim, D.; Park, H. Performance improvement of high voltage direct current devices by using a novel vortex generating heat sink design. Int. J. Therm. Sci. 2025, 210, 109624. [Google Scholar] [CrossRef]
- Jasim, D.J.; Mahdi, M.S.; Mahdy, O.S.; Basem, A.; Karouei, S.H.H.; Alinia-Kolaei, M. Hydrothermal analysis of hybrid nanofluid flow inside a shell and double coil heat exchanger; Numerical examination. Int. J. Thermofluids 2024, 23, 100770. [Google Scholar] [CrossRef]
- Elboughdiri, N.; Salih, S.Q.; Chauhan, B.S.; Albani, A.; Almujibah, H.; Islam, S.; Alturise, F.; El-Shorbagy, M.; Aouaini, F.; Deifalla, A. Numerical analysis of thermohydraulic and exergetic performance in corrugated spiral tubes with diverse arc corrugation configurations. Case Stud. Therm. Eng. 2023, 51, 103605. [Google Scholar] [CrossRef]
- Xu, H.; Liu, X.; Yu, W. Comparison study on thermo-hydraulic performance of circular and airfoil shaped wire-wrapped rod bundle. Nucl. Eng. Des. 2023, 414, 112651. [Google Scholar] [CrossRef]
- Zhang, Y.; Gao, P.; He, X.; Chen, C.; Wang, Q.; Tian, C. Numerical analysis of flow resistance characteristics in an inclined rod bundle channel. Prog. Nucl. Energy 2020, 122, 103247. [Google Scholar] [CrossRef]
- Cunningham, M.J. Measurement Errors and Instrument Inaccuracies; Springer: New York, NY, USA, 1990. [Google Scholar]
- Holman, J.P.; Gajda, W.J. Experimental Methods for Engineers; McGraw-Hill: New York, NY, USA, 2001. [Google Scholar]
- Cd-Adapco. STAR-CCM+, version 18.04; User Guide. Reynolds-Averaged Navier-Stokes (RANS) Turbulence Models; Siemens Digital Industries Software: Plano, TX, USA, 2023; pp. 8403–8407. [Google Scholar]
- Fan, X.; Peng, T.; Fan, D.; Zhu, Y.; Cai, Y.; Gu, L. Study on Periodicity of Cross Flow in Gaps of a Lead-based FastReactor Fuel Assembly. Nucl. Phys. Rev. 2018, 35, 216–223. [Google Scholar]
- Nivedita, N.; Ligrani, P.; Papautsky, I. Dean Flow Dynamics in Low-Aspect Ratio Spiral Microchannels. Sci. Rep. 2017, 7, 44072. [Google Scholar] [CrossRef] [PubMed]
- Cheng, L.; Gu, H.; Tang, W.; Chen, B.; Shi, Y. Experimental Study of Flow and Heat Transfer Characteristicsin Helically-coiled Tube and Evaluation of Empirical Formulas. At. Energy Sci. Technol. 2025, 59, 100–109. [Google Scholar]
- Ferraris, D.L.; Marcel, C.P. Two-phase flow frictional pressure drop prediction in helical coiled tubes. Int. J. Heat Mass Transf. 2020, 162, 120372. [Google Scholar] [CrossRef]
- Sieder, E.N.; Tate, G.E. Heat Transfer and Pressure Drop of Liquids in Tubes. Ind. Eng. Chem. Res. 1936, 28, 1429–1435. [Google Scholar] [CrossRef]
- Zhan, H.H. Research and Phenomenon of Secondary Flow. J. Zhuzhou Inst. Technol. 2001, 15, 27–29. [Google Scholar]
Disclaimer/Publisher’s Note: The statements, opinions and data contained in all publications are solely those of the individual author(s) and contributor(s) and not of MDPI and/or the editor(s). MDPI and/or the editor(s) disclaim responsibility for any injury to people or property resulting from any ideas, methods, instructions or products referred to in the content. |
© 2025 by the authors. Licensee MDPI, Basel, Switzerland. This article is an open access article distributed under the terms and conditions of the Creative Commons Attribution (CC BY) license (https://creativecommons.org/licenses/by/4.0/).

