Computational Identification and Characterization of Glycosyltransferase 47 (GT47) Gene Family in Sorghum bicolor and Their Expression Profile in Internode Tissues Based on RNA-Seq Data
Abstract
1. Introduction
2. Materials and Methods
2.1. Identification of Gene Family in Sorghum
2.2. Sequence Alignment Phylogenetic Analysis
2.3. Physiochemical Properties Production
2.4. Subcellular Localization Analysis
2.5. Protein–Protein Interaction Network Analysis
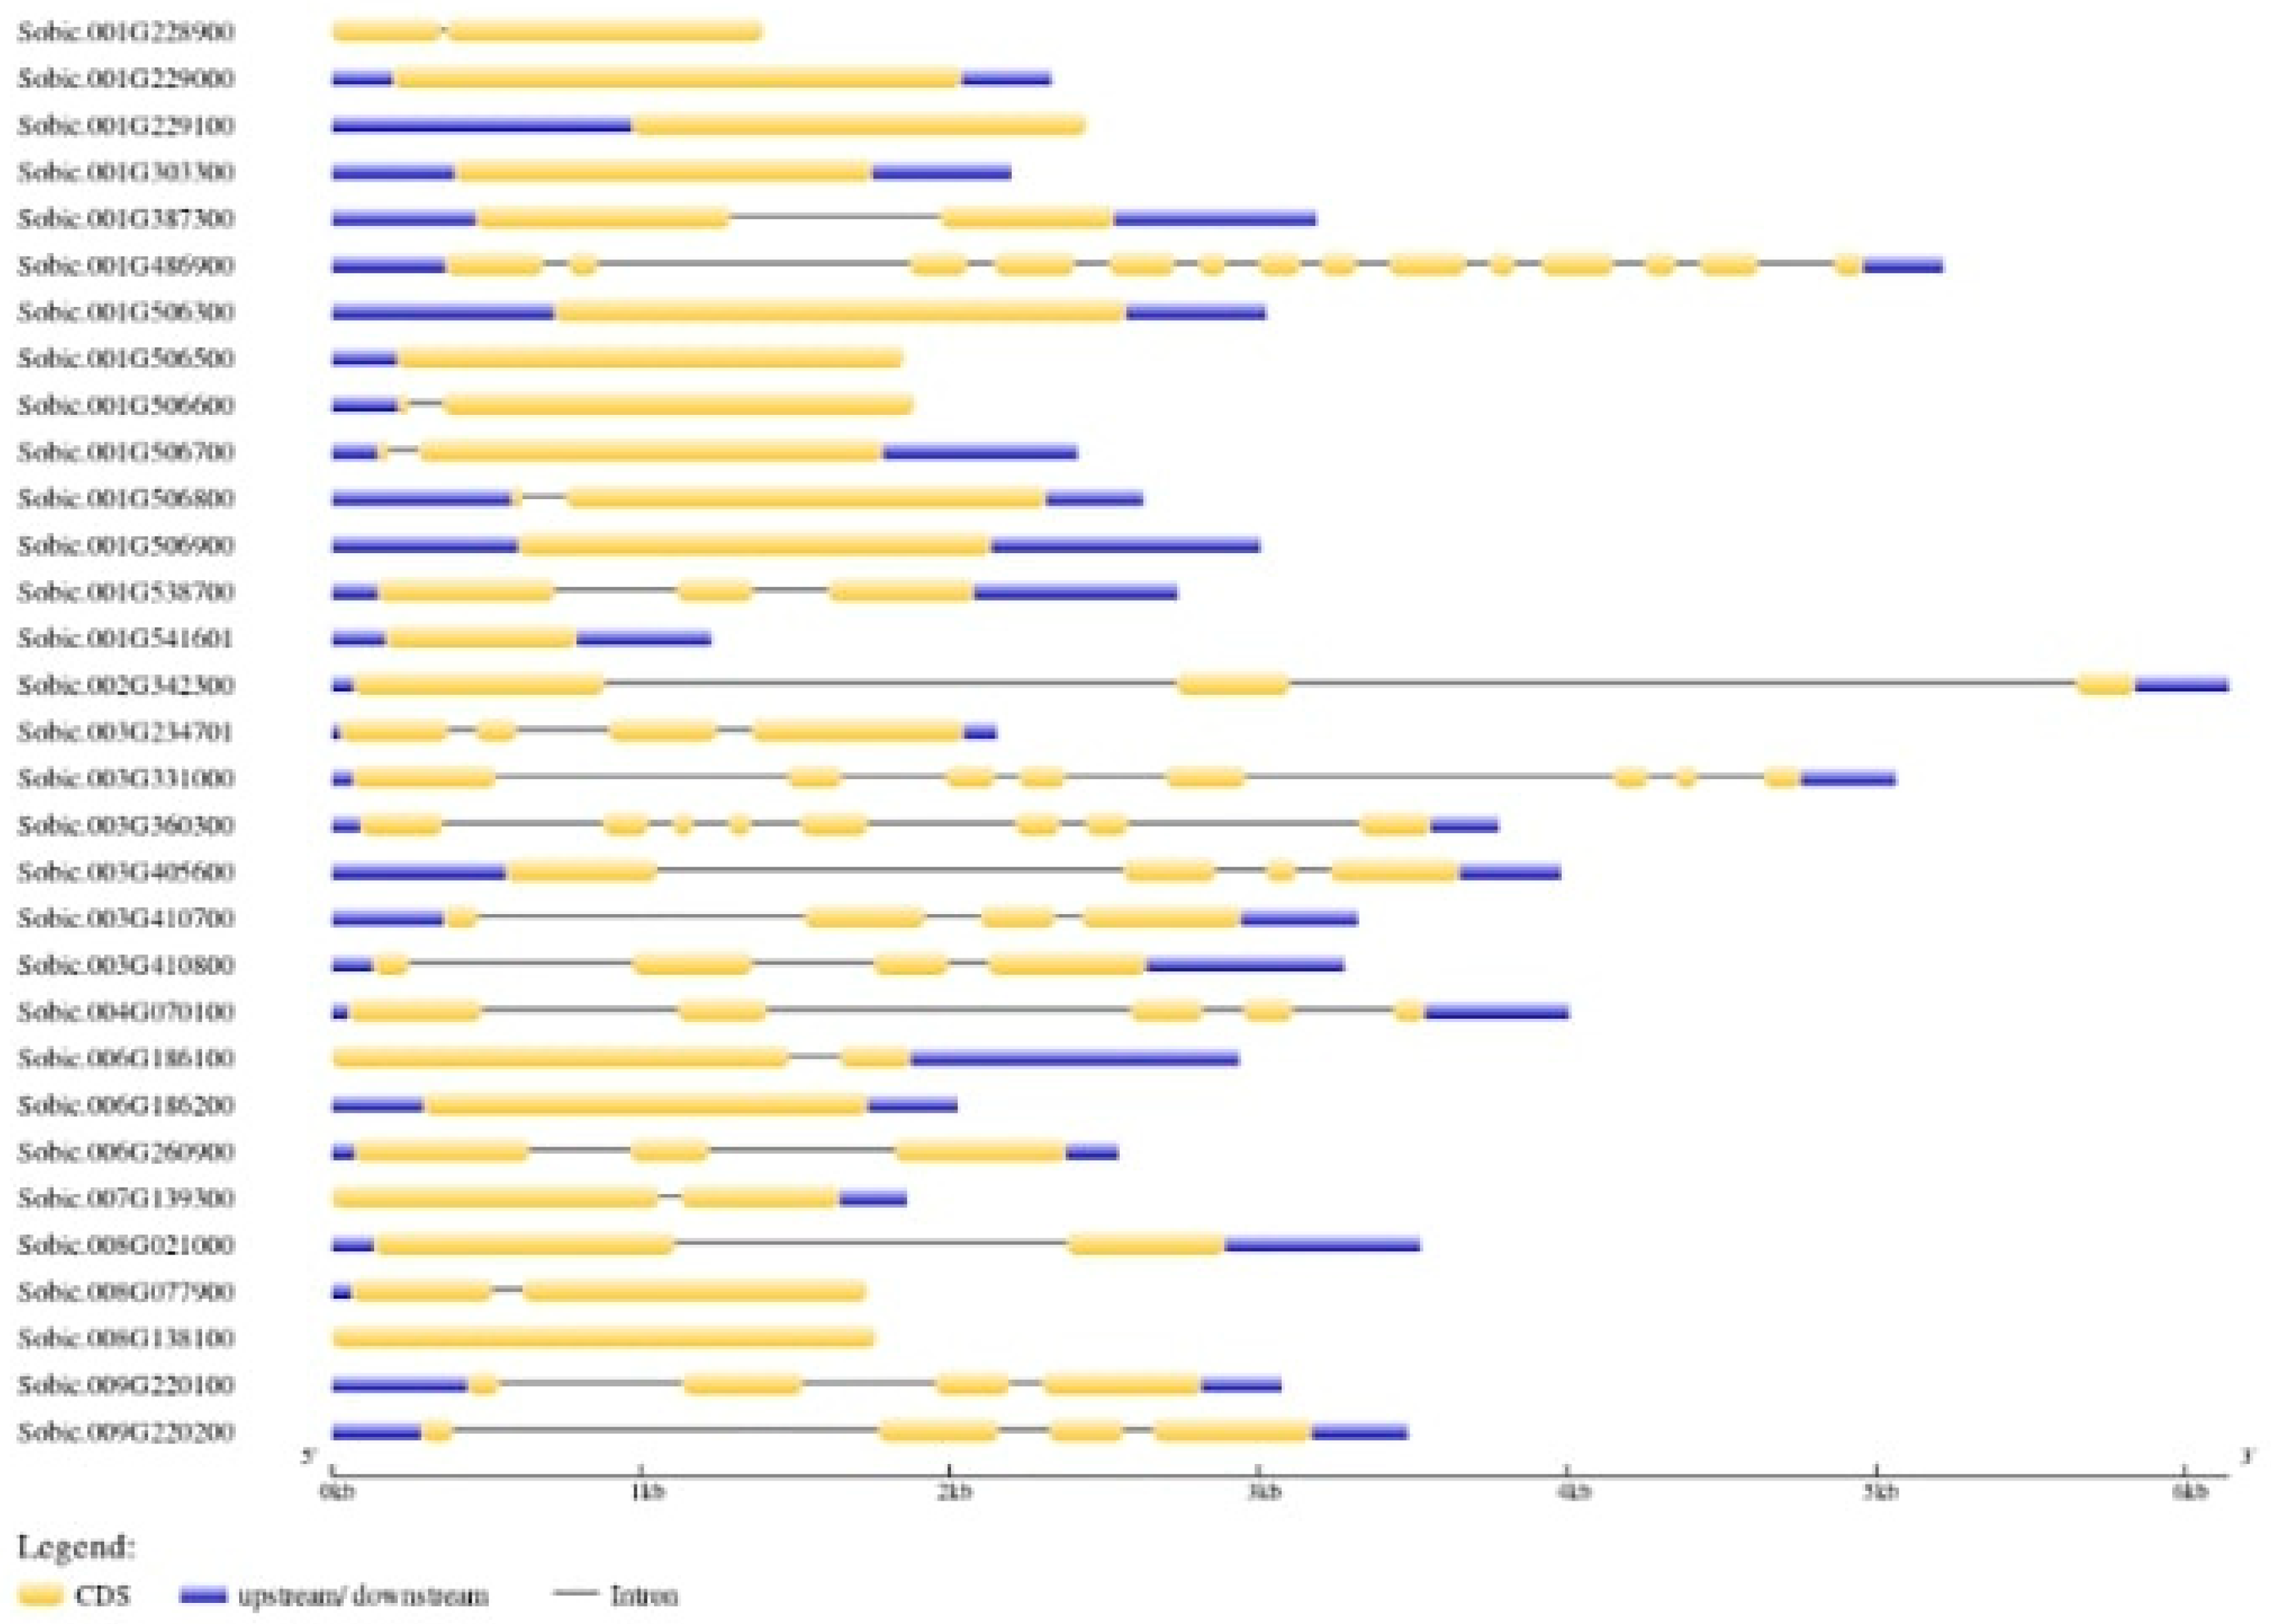
2.6. Gene Structure and Motif Analysis
2.7. Secondary Structure Prediction
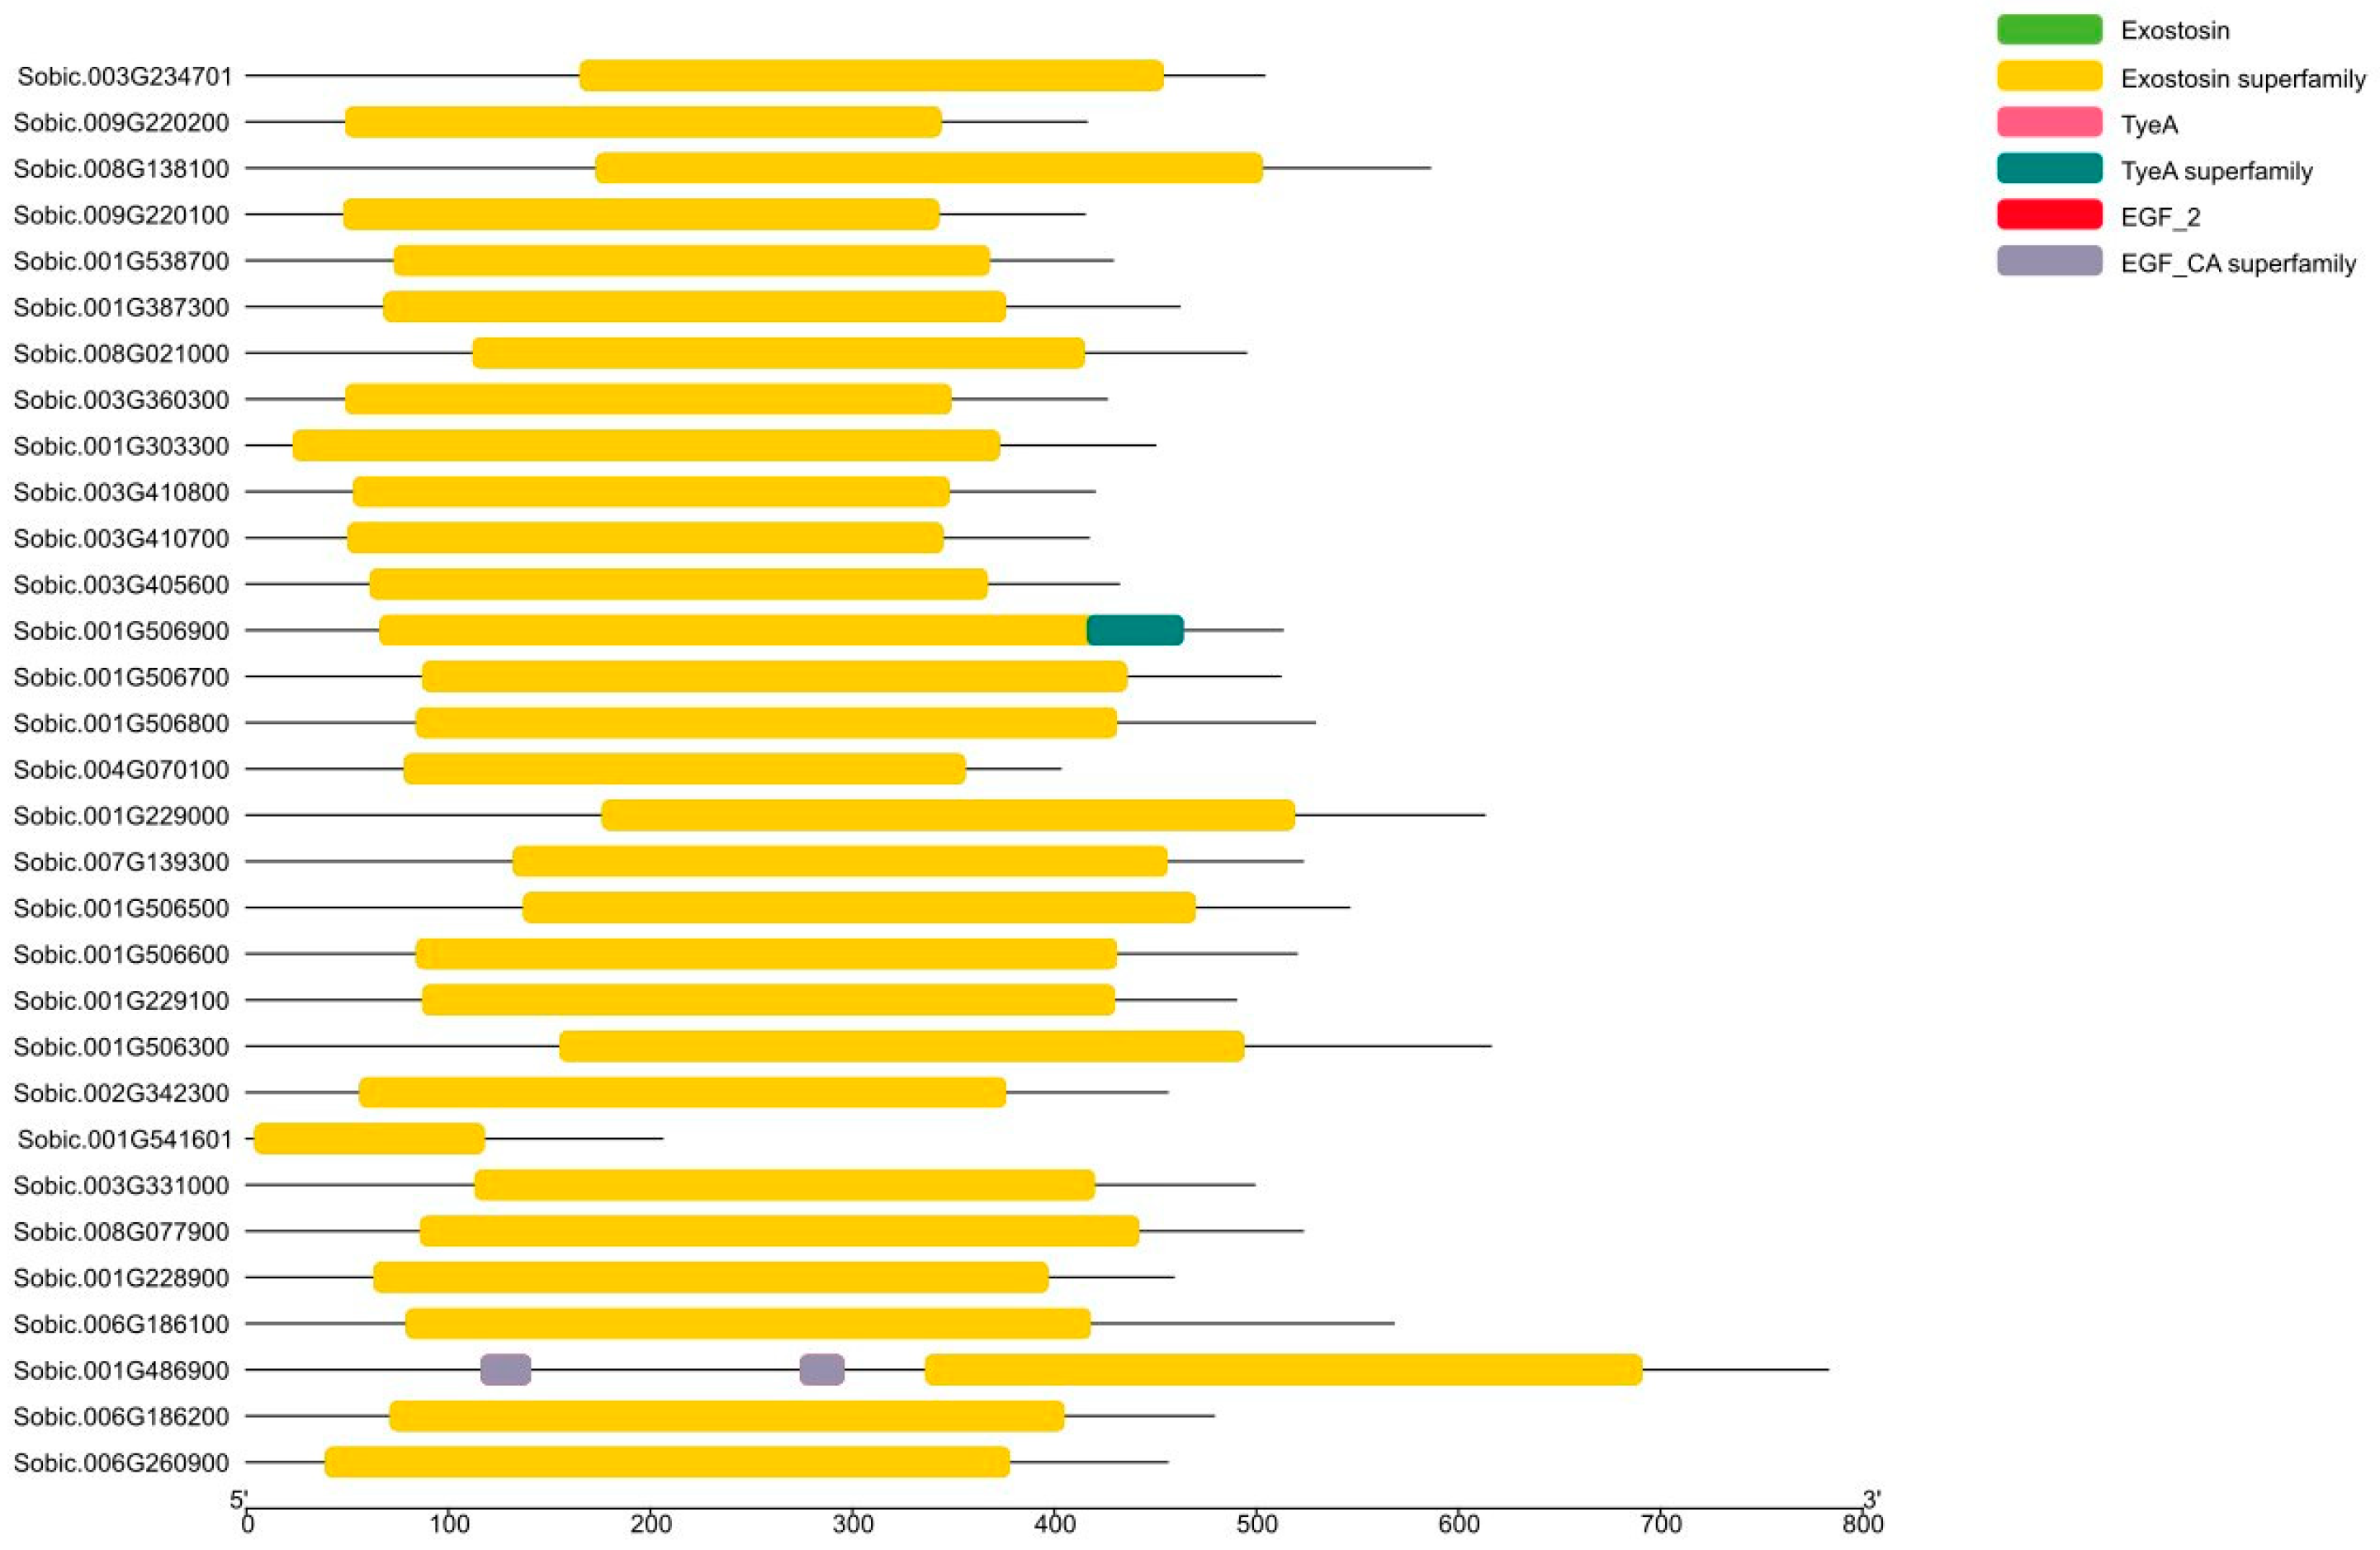
2.8. Prediction of Functional Domain
2.9. Gene Duplication Analysis
2.10. Cis-Acting Regulatory Element Analysis
2.11. Sequences Logos Analysis
2.12. Expression Profiles of RNA Sequence of Internode of GT47 Gene Family in Sorghum
3. Results and Discussion
3.1. GT47 Gene Family Identification in Sorghum Bicolor
3.2. Phylogenetic Tree Analysis
3.3. Physiochemical Properties of the GT47 Gene Family
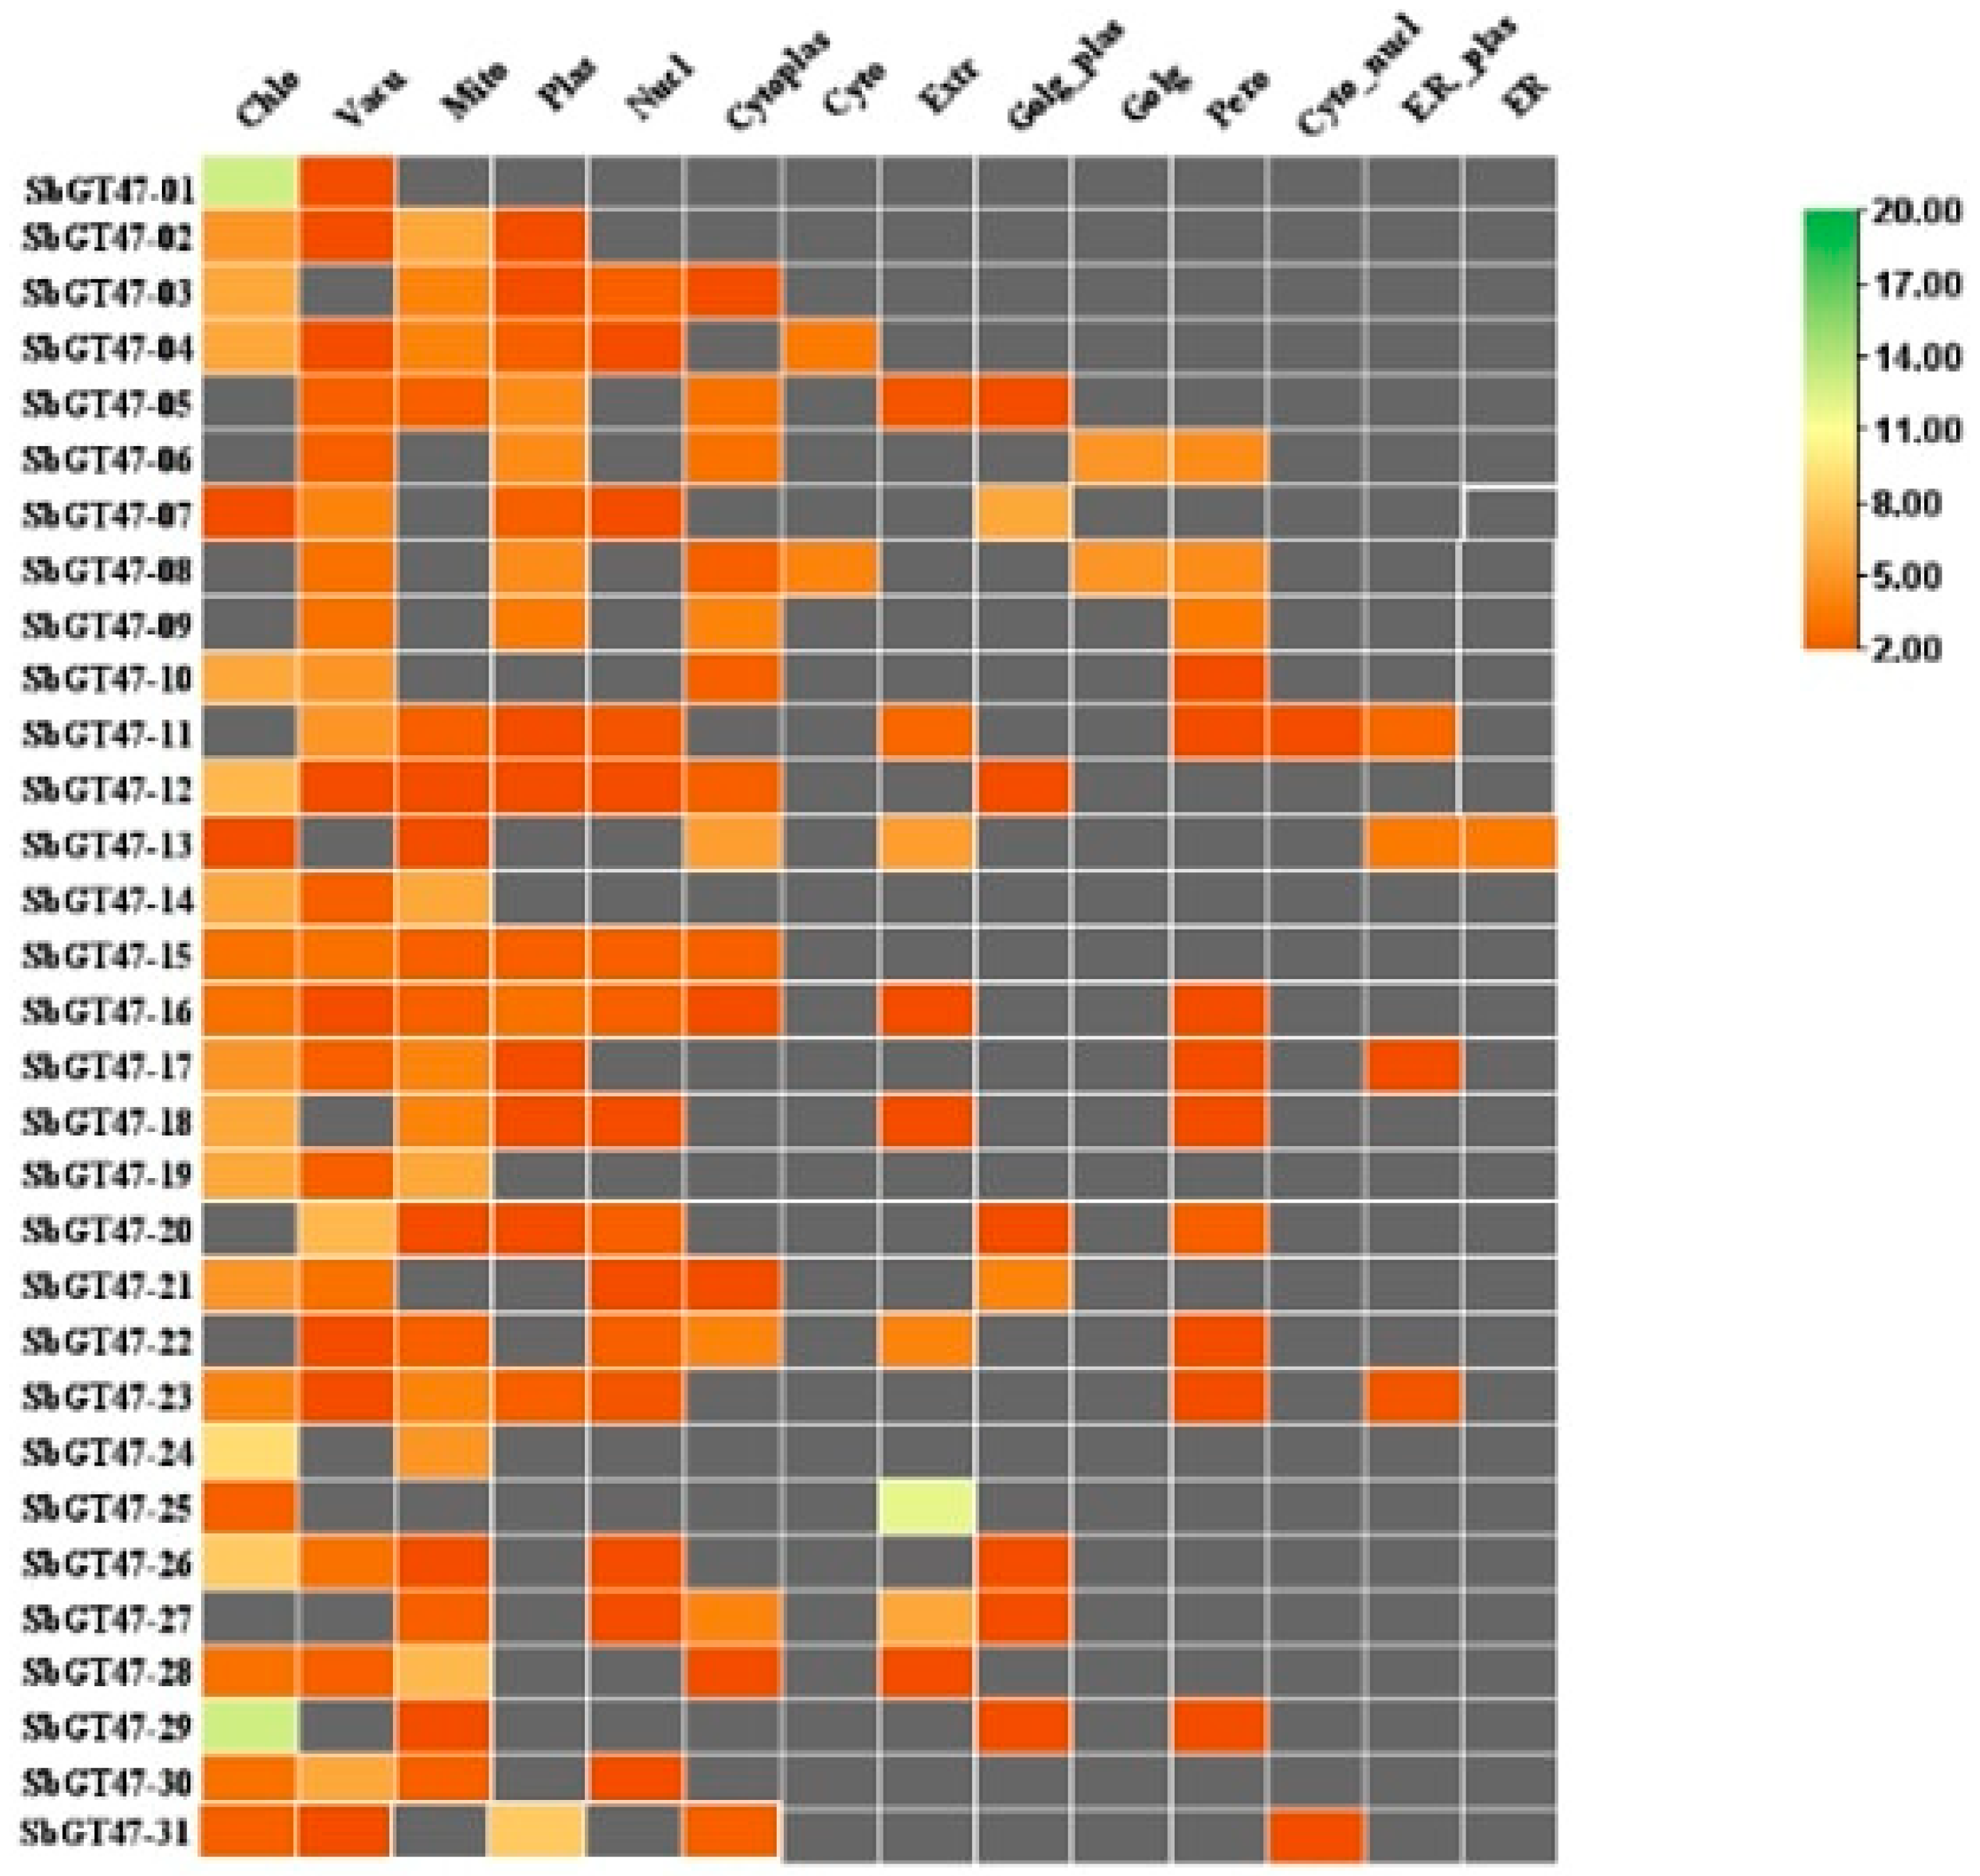
3.4. Subcellular Localization Analysis
3.5. Protein–Protein Interaction Network Analysis
3.6. Prediction of Functional Domain Analysis
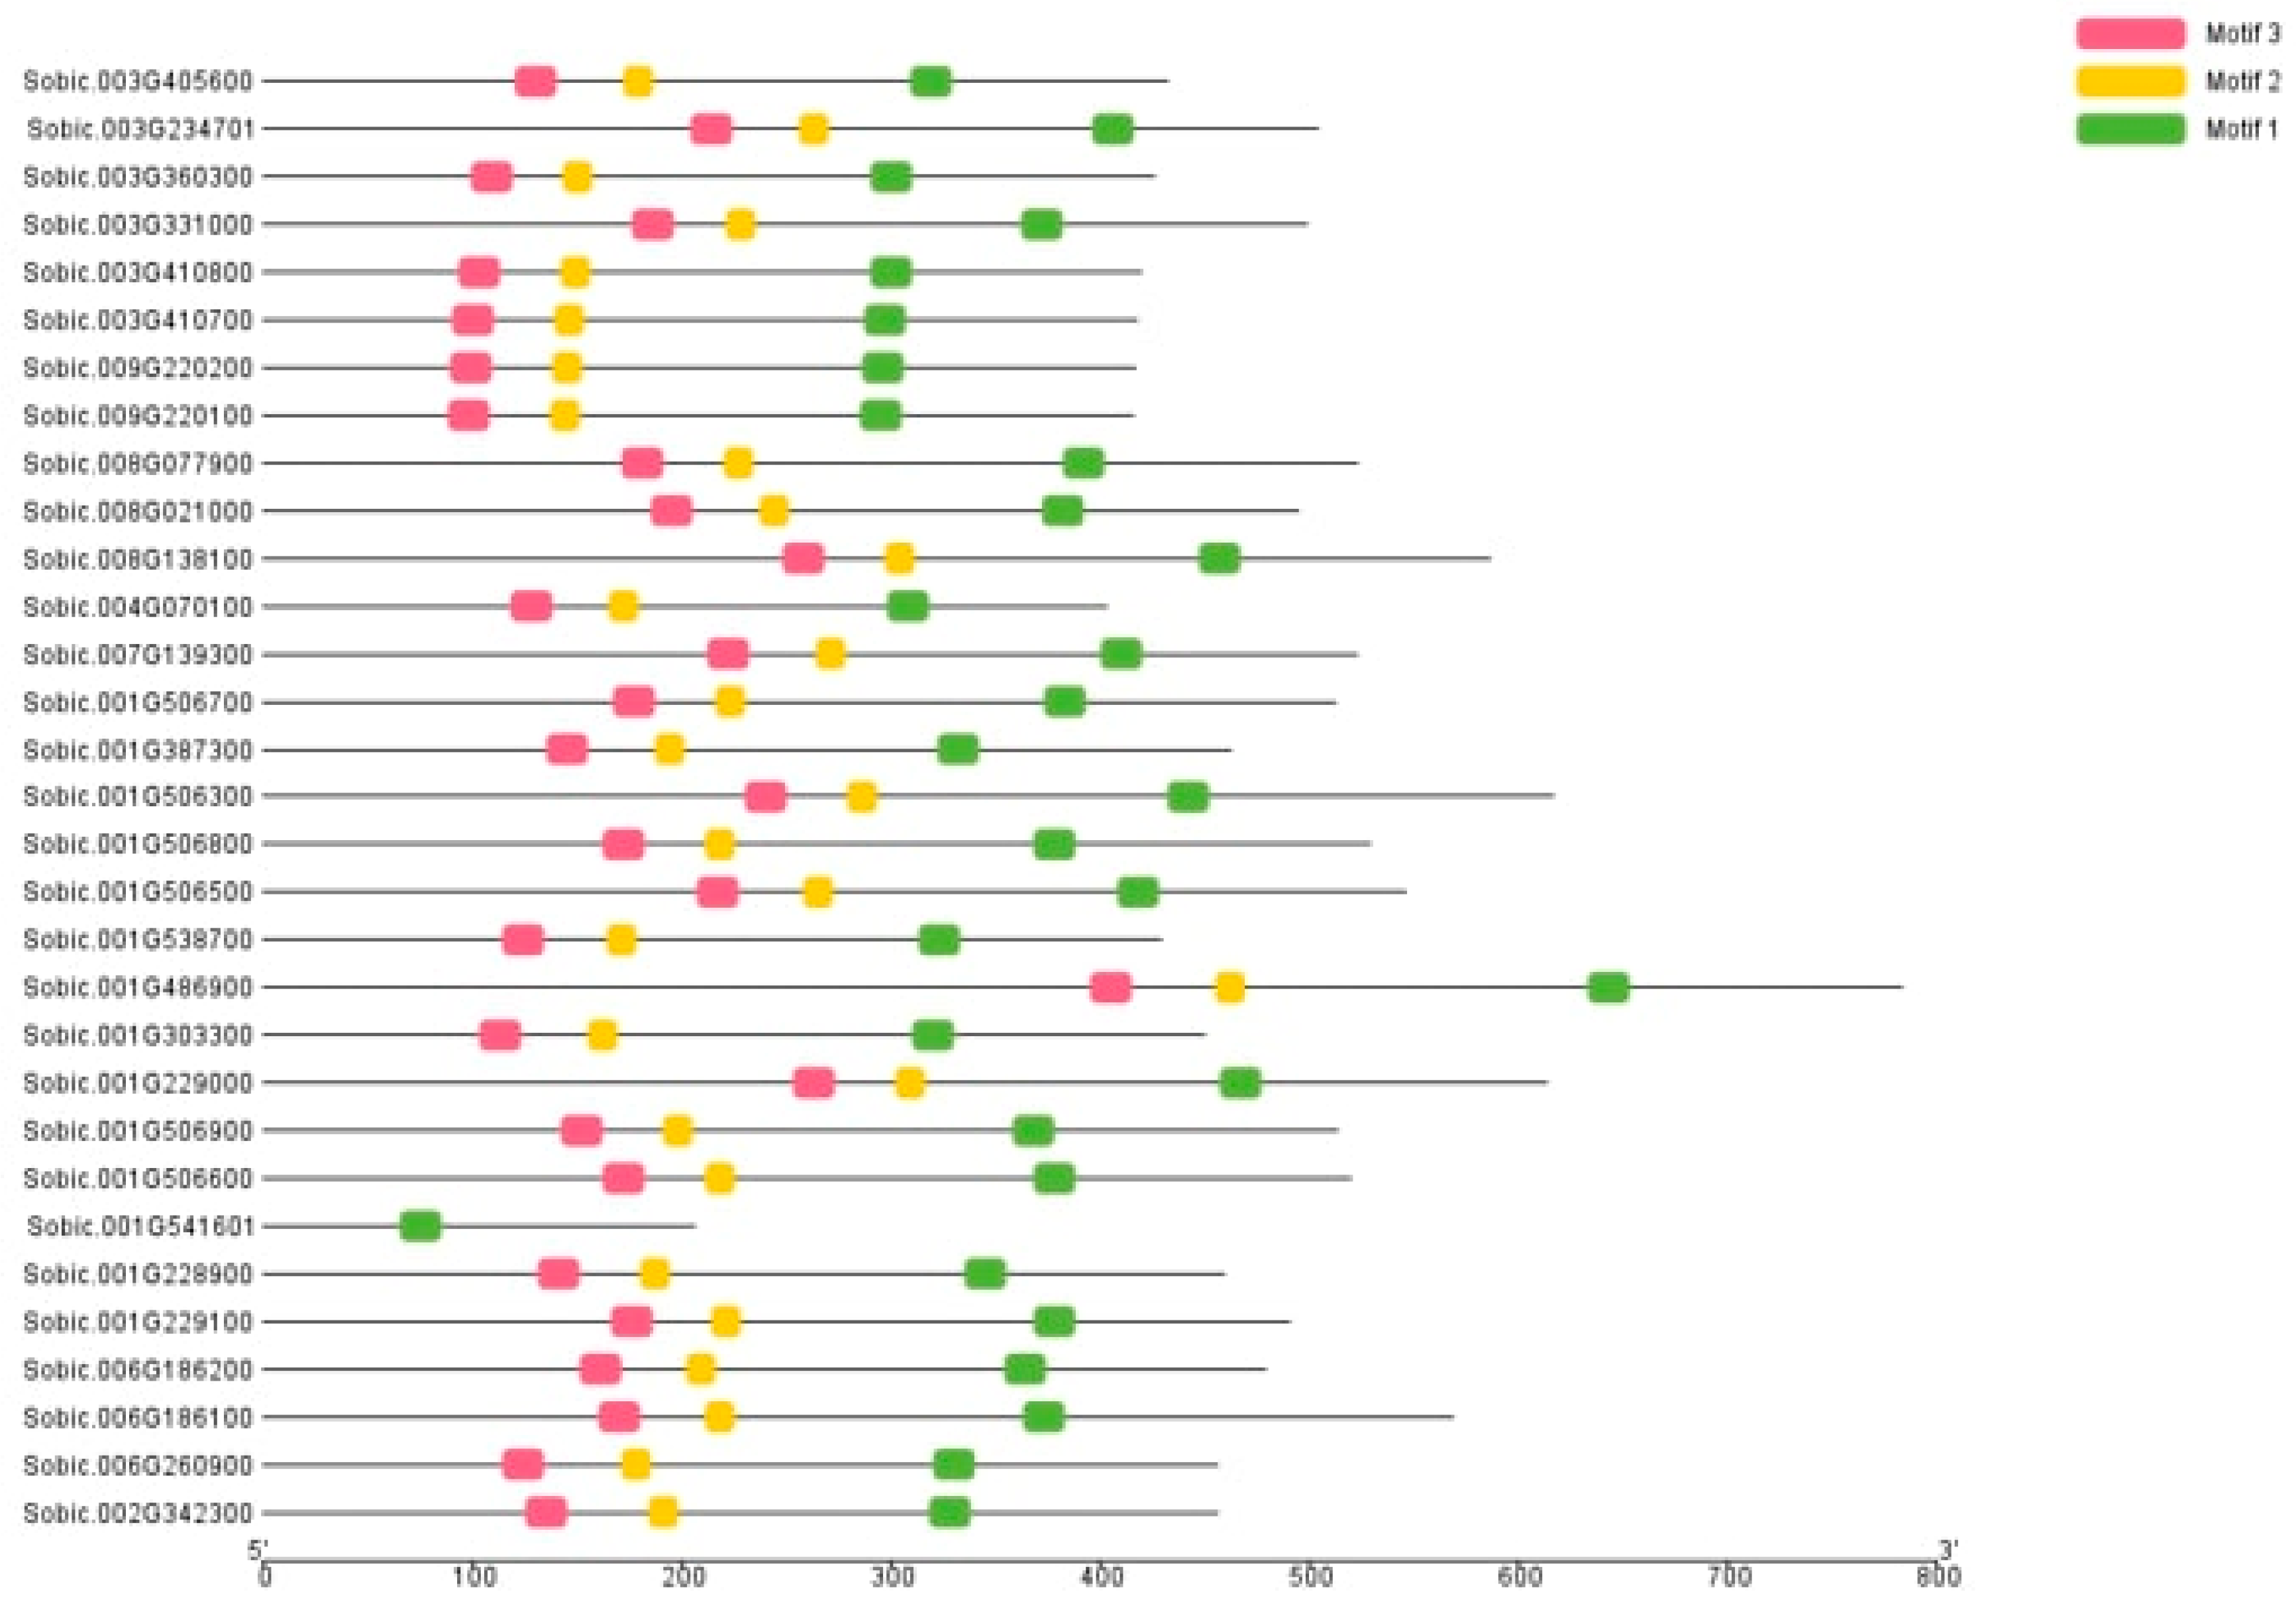
3.7. Gene Structure and Motif Analysis
3.8. Secondary Structure Analysis of the GT47 Proteins
3.9. Gene Duplication Analysis
3.10. Cis-Acting Elements in the Promoter Regions Analysis
3.11. Sequence Logos Analysis
3.12. Expression Profiles of RNA Sequence of Internode of GT47 Gene Family in Sorghum
4. Discussion
5. Conclusions
Author Contributions
Funding
Data Availability Statement
Acknowledgments
Conflicts of Interest
Abbreviations
| MW | Molecular weight |
| ARW | Average residue weight |
| PI | Isoelectric point |
| GRAVY | Grand average of hydropathicity |
| AI | Aliphatic index |
| GA | Gibberellin |
| SA | Salicylic acid |
| ABA | Abscisic acid |
| ER | Endoplasmic reticulum |
References
- Tvaroška, I. Glycosyltransferases as Targets for Therapeutic Intervention in Cancer and Inflammation: Molecular Modeling Insights. Chem. Pap. 2022, 76, 1953–1988. [Google Scholar] [CrossRef]
- Capurro, J.I.B.; Hopkins, C.W.; Sottile, G.P.; González Lebrero, M.C.; Roitberg, A.E.; Marti, M.A. Theoretical Insights into the Reaction and Inhibition Mechanism of Metal-Independent Retaining Glycosyltransferase Responsible for Mycothiol Biosynthesis. J. Phys. Chem. B 2017, 121, 471–478. [Google Scholar] [CrossRef] [PubMed]
- Davies, G.; Gilbert, H.; Henrissat, B.; Svensson, B.; Vocadlo, D.; Williams, S. Ten Years of CAZypedia: A Living Encyclopedia of Carbohydrate-Active Enzymes. Glycobiology 2018, 28, 3–8. [Google Scholar] [CrossRef]
- Xu, H.; Ding, A.; Chen, S.; Marowa, P.; Wang, D.; Chen, M.; Hu, R.; Kong, Y.; O’Neill, M.; Chai, G.; et al. Genome-Wide Analysis of Sorghum GT47 Family Reveals Functional Divergences of MUR3-like Genes. Front. Plant Sci. 2018, 871, 1773. [Google Scholar] [CrossRef]
- Burton, R.A.; Fincher, G.B. Evolution and Development of Cell Walls in Cereal Grains. Front. Plant Sci. 2014, 5, 456. [Google Scholar] [CrossRef]
- Brown, D.M.; Goubet, F.; Wong, V.W.; Goodacre, R.; Stephens, E.; Dupree, P.; Turner, S.R. Comparison of Five Xylan Synthesis Mutants Reveals New Insight into the Mechanisms of Xylan Synthesis. Plant J. 2007, 52, 1154–1168. [Google Scholar] [CrossRef]
- Wu, A.; Hao, P.; Wei, H.; Sun, H.; Cheng, S.; Chen, P.; Ma, Q.; Gu, L.; Zhang, M.; Wang, H.; et al. Genome-Wide Identification and Characterization of Glycosyltransferase Family 47 in Cotton. Front. Genet. 2019, 10, 824. [Google Scholar] [CrossRef]
- Harholt, J.; Jensen, J.K.; Sørensen, S.O.; Orfila, C.; Pauly, M.; Scheller, H.V. ARABINAN DEFICIENT 1 Is a Putative Arabinosyltransferase Involved in Biosynthesis of Pectic Arabinan in Arabidopsis. Plant Physiol. 2006, 140, 49–58. [Google Scholar] [CrossRef]
- Rai, K.M.; Thu, S.W.; Balasubramanian, V.K.; Cobos, C.J.; Disasa, T.; Mendu, V. Identification, Characterization, and Expression Analysis of Cell Wall Related Genes in (Sorghum bicolor (L.)) Moench, a Food, Fodder, and Biofuel Crop. Front. Plant Sci. 2016, 7, 1287. [Google Scholar] [CrossRef]
- Mariette, A.; Kang, H.S.; Heazlewood, J.L.; Persson, S.; Ebert, B.; Lampugnani, E.R. Not Just a Simple Sugar: Arabinose Metabolism and Function in Plants. Plant Cell Physiol. 2021, 62, 1791–1812. [Google Scholar] [CrossRef]
- Zhang, B.; Zhao, T.; Yu, W.; Kuang, B.; Yao, Y.; Liu, T.; Chen, X.; Zhang, W.; Wu, A.M. Functional Conservation of the Glycosyltransferase Gene GT47A in the Monocot Rice. J. Plant Res. 2014, 127, 423–432. [Google Scholar] [CrossRef] [PubMed]
- Tan, J.; Miao, Z.; Ren, C.; Yuan, R.; Tang, Y.; Zhang, X.; Han, Z.; Ma, C. Evolution of Intron-Poor Clades and Expression Patterns of the Glycosyltransferase Family 47. Planta 2018, 247, 745–760. [Google Scholar] [CrossRef] [PubMed]
- Urbanowicz, B.R.; Peña, M.J.; Moniz, H.A.; Moremen, K.W.; York, W.S. Two Arabidopsis Proteins Synthesize Acetylated Xylan in Vitro. Plant J. 2014, 80, 197–206. [Google Scholar] [CrossRef] [PubMed]
- Zhang, B.; Gao, Y.; Zhang, L.; Zhou, Y. The Plant Cell Wall: Biosynthesis, Construction, and Functions. J. Integr. Plant Biol. 2021, 63, 251–272. [Google Scholar] [CrossRef]
- Zhong, R.; Ye, Z.H. Secondary Cell Walls: Biosynthesis, Patterned Deposition and Transcriptional Regulation. Plant Cell Physiol. 2015, 56, 195–214. [Google Scholar] [CrossRef]
- Wu, A.; Rihouey, C.; Seveno, M.; Ho, E.; Singh, S.K.; Matsunaga, T.; Ishii, T.; Lerouge, P.; Marchant, A. The Arabidopsis IRX10 and IRX10-LIKE Glycosyltransferases Are Critical for Glucuronoxylan Biosynthesis during Secondary Cell Wall Formation. Plant J. 2009, 2, 718–731. [Google Scholar] [CrossRef]
- Vega-Mas, I.; Ascencio-Medina, E.; Menéndez, S.; González-Torralba, J.; González-Murua, C.; Marino, D.; González-Moro, M.B. Selecting an Optimal Sorghum Cultivar Can Improve Nitrogen Availability and Wheat Yield in Crop Rotation. J. Sci. Food Agric. 2024, 105, 1930–1940. [Google Scholar] [CrossRef]
- Kolozsvári, I.; Kun, Á.; Jancsó, M.; Palágyi, A.; Bozán, C.; Gyuricza, C. Agronomic Performance of Grain Sorghum (Sorghum bicolor). Agronomy 2022, 12, 1185. [Google Scholar] [CrossRef]
- Byrt, C.S.; Grof, C.P.L.; Furbank, R.T. C4 Plants as Biofuel Feedstocks: Optimising Biomass Production and Feedstock Quality from a Lignocellulosic Perspective. J. Integr. Plant Biol. 2011, 53, 120–135. [Google Scholar] [CrossRef]
- Taylor, S.H.; Hulme, S.P.; Rees, M.; Ripley, B.S.; Woodward, I.F.; Osborne, C.P. Ecophysiological Traits in C3 and C4 Grasses: A Phylogenetically Controlled Screening Experiment. New Phytol. 2010, 185, 780–791. [Google Scholar] [CrossRef]
- Hoang, N.V.; Furtado, A.; Botha, F.C.; Simmons, B.A.; Henry, R.J. Potential for Genetic Improvement of Sugarcane as a Source of Biomass for Biofuels. Front. Bioeng. Biotechnol. 2015, 3, 182. [Google Scholar] [CrossRef] [PubMed]
- Khalil, S.R.; Abdelhafez, A.A.; Amer, E.A.M. Evaluation of Bioethanol Production from Juice and Bagasse of Some Sweet Sorghum Varieties. Ann. Agric. Sci. 2015, 60, 317–324. [Google Scholar] [CrossRef]
- Wilson, L.F.L.; Dendooven, T.; Hardwick, S.W.; Echevarría-Poza, A.; Tryfona, T.; Krogh, K.B.R.M.; Chirgadze, D.Y.; Luisi, B.F.; Logan, D.T.; Mani, K.; et al. The Structure of EXTL3 Helps to Explain the Different Roles of Bi-Domain Exostosins in Heparan Sulfate Synthesis. Nat. Commun. 2022, 13, 3314. [Google Scholar] [CrossRef] [PubMed]
- Dien, B.S.; Sarath, G.; Pedersen, J.F.; Sattler, S.E.; Chen, H.; Funnell-Harris, D.L.; Nichols, N.N.; Cotta, M.A. Improved Sugar Conversion and Ethanol Yield for Forage Sorghum (Sorghum bicolor L. Moench) Lines with Reduced Lignin Contents. Bioenergy Res. 2009, 2, 153–164. [Google Scholar] [CrossRef]
- Sharma, R.; Liang, Y.; Lee, M.Y.; Pidatala, V.R.; Mortimer, J.C.; Scheller, H. V Agrobacterium—Mediated Transient Transformation of Sorghum Leaves for Accelerating Functional Genomics and Genome Editing Studies. BMC Res. Notes 2020, 13, 116. [Google Scholar] [CrossRef]
- Sezer, F. Identification and Gene Expression Analysis of TIR1 in Easy and Hard to Root Olive (Olea europaea L.) Cultivars. Int. J. Innov. Approaches Sci. Res. 2023, 7, 1–8. [Google Scholar] [CrossRef]
- Kozlova, L.V.; Nazipova, A.R.; Gorshkov, O.V.; Gilmullina, L.F.; Sautkina, O.V.; Petrova, N.V.; Trofimova, O.I.; Ponomarev, S.N.; Ponomareva, M.L.; Gorshkova, T.A. Identification of Genes Involved in the Formation of Soluble Dietary Fiber in Winter Rye Grain and Their Expression in Cultivars with Different Viscosities of Wholemeal Water Extract. Crop J. 2022, 10, 532–549. [Google Scholar] [CrossRef]
- Ge, H.; Xu, J.; Hua, M.; An, W.; Wu, J.; Wang, B.; Li, P.; Fang, H. Genome-Wide Identification and Analysis of ACP Gene Family in Sorghum bicolor (L.) Moench. BMC Genom. 2022, 23, 538. [Google Scholar] [CrossRef]
- Contreras-Moreira, B.; Saraf, S.; Naamati, G.; Casas, A.M.; Amberkar, S.S.; Flicek, P.; Jones, A.R.; Dyer, S. GET_PANGENES: Calling Pangenes from Plant Genome Alignments Confirms Presence-Absence Variation. Genome Biol. 2023, 24, 223. [Google Scholar] [CrossRef]
- Górecki, K.; McEvoy, M.M. Phylogenetic Analysis Reveals an Ancient Gene Duplication as the Origin of the MdtABC Efflux Pump. PLoS ONE 2020, 15, e0228877. [Google Scholar] [CrossRef]
- Zhou, T.; Xu, K.; Zhao, F.; Liu, W.; Li, L.; Hua, Z.; Zhou, X. Itol.Toolkit Accelerates Working with ITOL (Interactive Tree of Life) by an Automated Generation of Annotation Files. Bioinformatics 2023, 39, btad339. [Google Scholar] [CrossRef] [PubMed]
- Pereira, D.S.; Hilário, S.; Gonçalves, M.F.M.; Phillips, A.J.L. Diaporthe Species on Palms: Molecular Re-Assessment and Species Boundaries Delimitation in the D. arecae Species Complex. Microorganisms 2023, 11, 2717. [Google Scholar] [CrossRef]
- Basumatary, D.; Saikia, S.; Yadav, H.S.; Yadav, M. In Silico Analysis of Peroxidase from Luffa acutangula. 3 Biotech 2023, 13, 25. [Google Scholar] [CrossRef] [PubMed]
- Nash, B.; Gregory, W.F.; White, R.R.; Protasio, A.V.; Gygi, S.P.; Selkirk, M.E.; Weekes, M.P.; Artavanis-Tsakonas, K. Large-Scale Proteomic Analysis of T. Spiralis Muscle-Stage ESPs Identifies a Novel Upstream Motif for in Silico Prediction of Secreted Products. Front. Parasitol. 2023, 2, 1078443. [Google Scholar] [CrossRef] [PubMed]
- Yan, L.; Fang, Z.; Zhang, N.; Yang, L.; Zhang, Y.; Zhuang, M.; Lv, H.; Ji, J.; Wang, Y. Genome-Wide Identification, Characterization, and Expression Analysis of the Geranylgeranyl Pyrophosphate Synthase (GGPPS) Gene Family Reveals Its Importance in Chloroplasts of Brassica oleracea L. Agriculture 2023, 13, 1615. [Google Scholar] [CrossRef]
- Verma, R.N.; Malik, Z.; Singh, G.P.; Subbarao, N. Healthcare Analytics Identification of Key Proteins in Host—Pathogen Interactions between Mycobacterium Tuberculosis and Homo Sapiens: A Systematic Network Theoretical Approach. Healthc. Anal. 2022, 2, 100052. [Google Scholar] [CrossRef]
- Zhang, A.; Xu, J.; Xu, X.; Wu, J.; Li, P.; Wang, B.; Fang, H. Genome-Wide Identification and Characterization of the KCS Gene Family in Sorghum (Sorghum bicolor (L.) Moench). PeerJ 2022, 10, e14156. [Google Scholar] [CrossRef]
- Coff, L.; Chan, J.; Ramsland, P.A.; Guy, A.J. Identifying Glycan Motifs Using a Novel Subtree Mining Approach. BMC Bioinform. 2020, 21, 1–18. [Google Scholar] [CrossRef]
- Li, H.; Chapla, D.; Amos, R.A.; Ramiah, A.; Moremen, K.W.; Li, H. Structural Basis for Heparan Sulfate Co-Polymerase Action by the EXT1–2 Complex. Nat. Chem. Biol. 2023, 19, 565–574. [Google Scholar] [CrossRef]
- Song, N.; Liang, H.; An, Y.; Bai, S.; Ma, F.; Zhang, Z.; Li, H.; Zhou, Y.; Guo, G.; Song, C. Identification and Bioinformatics Analysis of KNOX Gene Family in Wheat (Triticum aestivum L.). Mol. Plant Breed. 2021, 12, 1–11. [Google Scholar] [CrossRef]
- Khan, W.; Liu, W.; Liu, Z.; Zhu, X.; Wu, J.; Wang, P. Genome-Wide Identification, Expression Analysis, and Functional Verification of the JMJ (Jumonji) Histone Demethylase Gene Family in Pear (Pyrus bretchneideri). Tree Genet. Genomes 2023, 19, 10. [Google Scholar] [CrossRef]
- Zhu, K.; Wu, Q.; Huang, Y.; Ye, J.; Xu, Q.; Deng, X. Genome-Wide Characterization of Cis-Acting Elements in the Promoters of Key Carotenoid Pathway Genes from the Main Species of Genus Citrus. Hortic. Plant J. 2020, 6, 385–395. [Google Scholar] [CrossRef]
- Wang, S.; Li, R.; Zhou, Y.; Fernie, A.R.; Ding, Z.; Zhou, Q.; Che, Y.; Yao, Y.; Liu, J.; Wang, Y.; et al. Pectin Methylesterase (MePME) Genes to Filter Candidate Gene Responses to Multiple Abiotic Stresses. Plants 2023, 12, 2529. [Google Scholar] [CrossRef] [PubMed]
- Yang, G. Genomic Analysis, Evolution and Characterization of E3 Ubiquitin Protein Ligase (TRIM) Gene Family in Common Carp (Cyprinus carpio). Genes 2023, 14, 667. [Google Scholar] [CrossRef]
- Qiu, C.; Chen, J.; Wu, W.; Liao, B.; Zheng, X.; Li, Y.; Huang, J.; Shi, J.; Hao, Z. Of COBRA-like Gene Family in Liriodendron chinense. Plants 2023, 12, 1616. [Google Scholar] [CrossRef]
- Ur Rehman, S.; Nadeem, A.; Javed, M.; Ul Hassan, F.; Luo, X.; Khalid, R.B.; Liu, Q. Genomic Identification, Evolution and Sequence Analysis of the Heat-Shock Protein Gene Family in Buffalo. Genes 2020, 11, 1388. [Google Scholar] [CrossRef]
- Sun, L.; Chen, Q.; Lu, H.; Wang, J.; Zhao, J.; Li, P. Electrodialysis with Porous Membrane for Bioproduct Separation: Technology, Features, and Progress. Food Res. Int. 2020, 137, 109343. [Google Scholar] [CrossRef]
- Sanjaya, R.E.; Dwi, K.; Putri, A.; Kurniati, A.; Rohman, A. In Silico Characterization of the GH5- Cellulase Family from Uncultured Microorganisms: Physicochemical and Structural Studies. J. Genet. Eng. Biotechnol. 2021, 19, 143. [Google Scholar] [CrossRef]
- Mo, F.; Li, L.; Zhang, C.; Yang, C.; Chen, G.; Niu, Y.; Si, J.; Liu, T.; Sun, X.; Wang, S.; et al. Genome-Wide Analysis and Expression Profiling of the Phenylalanine Ammonia-Lyase Gene Family in Solanum tuberosum. Int. J. Mol. Sci. 2022, 23, 6833. [Google Scholar] [CrossRef]
- Wang, X.; Tang, Q.; Zhao, X.; Jia, C.; Yang, X.; He, G.; Wu, A.; Kong, Y.; Hu, R.; Zhou, G. Functional Conservation and Divergence of Miscanthus Lutarioriparius GT43 Gene Family in Xylan Biosynthesis. BMC Plant Biol. 2016, 16, 102. [Google Scholar] [CrossRef]
- Li, Z.; Wang, X.; Yang, K.; Zhu, C.; Yuan, T.; Wang, J.; Li, Y.; Gao, Z. Identification and Expression Analysis of the Glycosyltransferase GT43 Family Members in Bamboo Reveal Their Potential Function in Xylan Biosynthesis during Rapid Growth. BMC Genom. 2021, 22, 876. [Google Scholar] [CrossRef] [PubMed]
- Boens, S.; Szekér, K.; Van Eynde, A.; Bollen, M. Interactor-Guided Dephosphorylation by Protein Phosphatase-1. In Phosphatase Modulators; Millán, J., Ed.; Methods in Molecular Biology Series 1053; Humana Press: Totowa, NJ, USA, 2013; ISBN 978-1-62703-561-3. [Google Scholar]
- Oliver, J.; Fan, M.; McKinley, B.; Zemelis-Durfee, S.; Brandizzi, F.; Wilkerson, C.; Mullet, J.E. The AGCVIII Kinase Dw2 Modulates Cell Proliferation, Endomembrane Trafficking, and MLG/Xylan Cell Wall Localization in Elongating Stem Internodes of Sorghum bicolor. Plant J. 2021, 105, 1053–1071. [Google Scholar] [CrossRef] [PubMed]
- Yamada, R.; Han, S.; Park, H. Complete Genome Analysis of Subtercola sp. PAMC28395: Genomic Insights into Its Potential Role for Cold Adaptation and Biotechnological Applications. Microorganisms 2023, 11, 1480. [Google Scholar] [CrossRef] [PubMed]
- Coutinho, P.M.; Stam, M.; Blanc, E.; Henrissat, B. Why Are There so Many Carbohydrate-Active Enzyme-Related Genes in Plants? Trends Plant Sci. 2003, 8, 563–565. [Google Scholar] [CrossRef]
- Tanwar, R.; Panghal, A.; Chaudhary, G.; Kumari, A.; Chhikara, N. Nutritional, Phytochemical and Functional Potential of Sorghum: A Review. Food Chem. Adv. 2023, 3, 100501. [Google Scholar] [CrossRef]
- Courtial, A.; Soler, M.; Rey-, M.; De Génétique, U.; Fourragères, P. Review Article Open Access Breeding Grasses for Capacity to Biofuel Production or Silage Feeding Value: An Updated List of Genes Involved in Maize Secondary Cell Wall Biosynthesis and Assembly. Maydica 2013, 58, 67–102. [Google Scholar]
- Ma, Y.; Han, Y.; Feng, X.; Gao, H.; Cao, B.; Song, L. Genome-Wide Identification of BAM (β-Amylase) Gene Family in Jujube (Ziziphus jujuba Mill.) and Expression in Response to Abiotic Stress. BMC Genom. 2022, 23, 438. [Google Scholar] [CrossRef]
- Wang, Q.; McArdle, P.; Wang, S.L.; Wilmington, R.L.; Xing, Z.; Greenwood, A.; Cotten, M.L.; Qazilbash, M.M.; Schniepp, H.C. Protein Secondary Structure in Spider Silk Nanofibrils. Nat. Commun. 2022, 13, 4329. [Google Scholar] [CrossRef]
- Wu, Z.; Fu, D.; Gao, X.; Zeng, Q.; Chen, X.; Wu, J.; Zhang, N. Characterization and Expression Profiles of the B-Box Gene Family during Plant Growth and under Low-Nitrogen Stress in Saccharum. BMC Genom. 2023, 24, 79. [Google Scholar] [CrossRef]
- Kinnaert, C.; Daugaard, M.; Nami, F.; Clausen, M.H. Chemical Synthesis of Oligosaccharides Related to the Cell Walls of Plants and Algae. Chem. Rev. 2017, 117, 11337–11405. [Google Scholar] [CrossRef]
- Herrmann, A.; Torii, K.U. Shouting out Loud: Signaling Modules in the Regulation of Stomatal Development. Plant Physiol. 2021, 185, 765–780. [Google Scholar] [CrossRef]


| Transcript ID | Gene Name | Genomic Sequence | Transcript Sequence | CDS (bep) | Peptide Length |
|---|---|---|---|---|---|
| Sobic.003G405600 | Sobic-GT47-01 | 5270 | 2190 | 1299 | 433 |
| Sobic.003G234701 | Sobic-GT47-02 | 2153 | 1649 | 1515 | 505 |
| Sobic.003G360300 | Sobic-GT47-03 | 3779 | 1592 | 1281 | 427 |
| Sobic.003G331000 | Sobic-GT47-04 | 5064 | 8174 | 1500 | 500 |
| Sobic.003G410800 | Sobic-GT47-05 | 3277 | 2035 | 1263 | 421 |
| Sobic.003G410700 | Sobic-GT47-06 | 3323 | 1997 | 1254 | 418 |
| Sobic.009G220200 | Sobic-GT47-07 | 3483 | 1848 | 1251 | 417 |
| Sobic.009G220100 | Sobic-GT47-08 | 3076 | 1947 | 1248 | 416 |
| Sobic.008G077900 | Sobic-GT47-09 | 1732 | 1634 | 1572 | 524 |
| Sobic.008G021000 | Sobic-GT47-10 | 3525 | 2256 | 1488 | 496 |
| Sobic.008G138100 | Sobic-GT47-11 | 1761 | 1761 | 1761 | 587 |
| Sobic.004G070100 | Sobic-GT47-12 | 4516 | 1515 | 1212 | 404 |
| Sobic.007G139300 | Sobic-GT47-13 | 1862 | 1790 | 1572 | 524 |
| Sobic.001G506700 | Sobic-GT47-14 | 2415 | 2317 | 1539 | 513 |
| Sobic.001G387300 | Sobic-GT47-15 | 3189 | 2510 | 1389 | 463 |
| Sobic.001G506300 | Sobic-GT47-16 | 3025 | 3025 | 1851 | 617 |
| Sobic.001G506800 | Sobic-GT47-17 | 2627 | 2486 | 1590 | 530 |
| Sobic.001G506500 | Sobic-GT47-18 | 5851 | 5851 | 1641 | 547 |
| Sobic.001G538700 | Sobic-GT47-19 | 2739 | 2097 | 1290 | 430 |
| Sobic.001G486900 | Sobic-GT47-20 | 5228 | 2977 | 2352 | 784 |
| Sobic.001G303300 | Sobic-GT47-21 | 2200 | 2200 | 1353 | 451 |
| Sobic.001G229000 | Sobic-GT47-22 | 2330 | 2330 | 1842 | 614 |
| Sobic.001G506900 | Sobic-GT47-23 | 3007 | 2822 | 1524 | 514 |
| Sobic.001G506600 | Sobic-GT47-24 | 1887 | 1777 | 1563 | 521 |
| Sobic.001G541601 | Sobic-GT47-25 | 1229 | 1229 | 621 | 207 |
| Sobic.001G228900 | Sobic-GT47-26 | 1395 | 1380 | 1380 | 460 |
| Sobic.001G229100 | Sobic-GT47-27 | 2443 | 1815 | 1473 | 491 |
| Sobic.006G186200 | Sobic-GT47-28 | 2028 | 2028 | 1440 | 480 |
| Sobic.006G186100 | Sobic-GT47-29 | 2937 | 2770 | 1707 | 569 |
| Sobic.006G260900 | Sobic-GT47-30 | 2576 | 1615 | 1371 | 457 |
| Sobic.002G342300 | Sobic-GT47-31 | 6143 | 1744 | 1371 | 457 |
| Z. mays | Barley (H. vulgare) | Arabidopsis thaliana | Wheat (T. aestivum) | Rice (O. sativa) | |||||
|---|---|---|---|---|---|---|---|---|---|
| Transcript ID | Gene Name | Transcript ID | Gene Name | Transcript ID | Gene Name | Transcript ID | Gene Name | Transcript ID | Gene Name |
| Zm00001d021821 | Zm-GT47-01 | HanXRQChr10g0315941 | HOR-GT47-01 | AT2G32750 | AT-GT47-01 | Traes_2BS_53D9472F2 | Traes-GT47-01 | LOC_Os10g32110 | LOC-GT47-01 |
| Zm00001d019053 | Zm-GT47-02 | HanXRQChr10g0318411 | HOR-GT47-02 | AT2G32740 | AT-GT47-02 | Traes_3AL_10E90321E | Traes-GT47-02 | LOC_Os10g10080 | LOC-GT47-02 |
| Zm00001d026580 | Zm-GT47-03 | HanXRQChr10g0280221 | HOR-GT47-03 | AT2G28110 | AT-GT47-03 | Traes_3B_80B4E7C02 | Traes-GT47-03 | LOC_Os10g40559 | LOC-GT47-03 |
| Zm00001d026066 | Zm-GT47-04 | HanXRQChr10g0280211 | HOR-GT47-04 | AT4G32790 | AT-GT47-04 | Traes_3B_90535BAF7 | Traes-GT47-04 | LOC_Os10g32170 | LOC-GT47-04 |
| Zm00001d023291 | Zm-GT47-05 | HanXRQChr16g0498961 | HOR-GT47-05 | AT4G13990 | AT-GT47-05 | Traes_2DL_72B1DF5D9 | Traes-GT47-05 | LOC_Os10g32160 | LOC-GT47-05 |
| Zm00001d002609 | Zm-GT47-06 | HanXRQChr07g0187251 | HOR-GT47-06 | AT4G16745 | AT-GT47-06 | Traes_3B_D46D8B6E7 | Traes-GT47-06 | LOC_Os08g34020 | LOC-GT47-06 |
| Zm00001d028980 | Zm-GT47-07 | HanXRQChr07g0206321 | HOR-GT47-07 | AT4G38040 | AT-GT47-07 | Traes_3B_58EF227AB | Traes-GT47-07 | LOC_Os04g48480 | LOC-GT47-07 |
| Zm00001d027642 | Zm-GT47-08 | HanXRQChr09g0270861 | HOR-GT47-08 | AT1G74680 | AT-GT47-08 | Traes_4DS_1153D0950 | Traes-GT47-08 | LOC_Os04g57510 | LOC-GT47-08 |
| Zm00001d027639 | Zm-GT47-09 | HanXRQChr09g0257441 | HOR-GT47-09 | AT1G21480 | AT-GT47-09 | Traes_3AS_A5635015A | Traes-GT47-09 | LOC_Os07g37960 | LOC-GT47-09 |
| Zm00001d027638 | Zm-GT47-10 | HanXRQChr09g0258371 | HOR-GT47-10 | AT1G34270 | AT-GT47-10 | Traes_3DL_2DFEC0902 | Traes-GT47-10 | LOC_Os01g69220 | LOC-GT47-10 |
| Zm00001d029862 | Zm-GT47-11 | HanXRQChr09g0273791 | HOR-GT47-11 | AT1G63450 | AT-GT47-11 | Traes_2AL_735F7F6411 | Traes-GT47-11 | LOC_Os01g70200 | LOC-GT47-11 |
| Zm00001d032797 | Zm-GT47-12 | HanXRQChr13g0403291 | HOR-GT47-12 | AT1G67410 | AT-GT47-12 | Traes_4AL_59C2F5FC5 | Traes-GT47-12 | LOC_Os01g70190 | LOC-GT47-12 |
| Zm00001d027287 | Zm-GT47-13 | HanXRQChr13g0396241 | HOR-GT47-13 | AT3G45400 | AT-GT47-13 | Traes_5DS_BE64352A2 | Traes-GT47-13 | LOC_Os01g59630 | LOC-GT47-13 |
| Zm00001d032791 | Zm-GT47-14 | HanXRQChr13g0394301 | HOR-GT47-14 | AT3G07620 | AT-GT47-14 | Traes_2AL_ECEE1A203 | Traes-GT47-14 | LOC_Os01g45350 | LOC-GT47-14 |
| Zm00001d032173 | Zm-GT47-15 | HanXRQChr12g0385411 | HOR-GT47-15 | AT3G42180 | AT-GT47-15 | Traes_2BL_15045A787 | Traes-GT47-15 | LOC_Os01g01780 | LOC-GT47-15 |
| Zm00001d032795 | Zm-GT47-16 | HanXRQChr12g0375441 | HOR-GT47-16 | AT3G57630 | AT-GT47-16 | Traes_4DL_9C5232C95 | Traes-GT47-16 | LOC_Os03g20850 | LOC-GT47-16 |
| Zm00001d032794 | Zm-GT47-17 | HanXRQChr14g0449671 | HOR-GT47-17 | AT3G03650 | AT-GT47-17 | Traes_2DL_5663CE72D | Traes-GT47-17 | LOC_Os03g05110 | LOC-GT47-17 |
| Zm00001d027643 | Zm-GT47-18 | HanXRQChr14g0455031 | HOR-GT47-18 | AT5G20260 | AT-GT47-18 | Traes_4AS_BF84B58601 | Traes-GT47-18 | LOC_Os03g07820 | LOC-GT47-18 |
| Zm00001d038905 | Zm-GT47-19 | HanXRQChr14g0444231 | HOR-GT47-19 | AT5G11130 | AT-GT47-19 | Traes_4AL_B613811A6 | Traes-GT47-19 | LOC_Os03g08420 | LOC-GT47-19 |
| Zm00001d042333 | Zm-GT47-20 | HanXRQChr14g0461921 | HOR-GT47-20 | AT5G25310 | AT-GT47-20 | Traes_2AS_0CDF65B63 | Traes-GT47-20 | LOC_Os03g05060 | LOC-GT47-20 |
| Zm00001d043134 | Zm-GT47-21 | HanXRQChr01g0019561 | HOR-GT47-21 | AT5G03795 | AT-GT47-21 | Traes_2DS_A06773E29 | Traes-GT47-21 | LOC_Os03g05070 | LOC-GT47-21 |
| Zm00001d042820 | Zm-GT47-22 | HanXRQChr03g0088471 | HOR-GT47-22 | AT5G19670 | AT-GT47-22 | Traes_2BL_9DABE98FB | Traes-GT47-22 | ||
| Zm00001d044663 | Zm-GT47-23 | HanXRQChr15g0491231 | HOR-GT47-23 | AT5G44930 | AT-GT47-23 | Traes_4DL_115811E21 | Traes-GT47-23 | ||
| Zm00001d041181 | Zm-GT47-24 | HanXRQChr02g0038921 | HOR-GT47-24 | AT5G11610 | AT-GT47-24 | Traes_3AS_8F70D84D1 | Traes-GT47-24 | ||
| Zm00001d042281 | Zm-GT47-25 | HanXRQChr02g0033091 | HOR-GT47-25 | AT5G16890 | AT-GT47-25 | ||||
| Zm00001d044094 | Zm-GT47-26 | HanXRQChr02g0049431 | HOR-GT47-26 | ||||||
| Zm00001d042276 | Zm-GT47-27 | HanXRQChr02g0052791 | HOR-GT47-27 | ||||||
| Zm00001d048298 | Zm-GT47-28 | ||||||||
| Zm00001d048387 | Zm-GT47-29 | ||||||||
| Gene Name | Chromosome Number | Intron | Exon | Residues | ARW | TPNC | Amino Acid Length | AI | PI | MW (kDa) | GRAVY/PWY |
|---|---|---|---|---|---|---|---|---|---|---|---|
| Sobic.003G405600 | 3 | 3 | 4 | 432 | 112.1 | 15 | 432 | 84.28 | 9.1 | 48.44 | −0.166 |
| Sobic.003G234701 | 3 | 3 | 4 | 504 | 113.4 | 39.5 | 504 | 85.36 | 10.06 | 57.1281 | −0.267 |
| Sobic.003G360300 | 3 | 7 | 8 | 426 | 114 | 20.5 | 426 | 88.56 | 9.52 | 48.56 | −0.268 |
| Sobic.003G331000 | 3 | 7 | 8 | 499 | 122.8 | 14 | 499 | 91.32 | 9.01 | 56.28 | −0.188 |
| Sobic.003G410800 | 3 | 3 | 4 | 420 | 112.3 | 2.5 | 420 | 85.29 | 6.42 | 47.15 | −0.0133 |
| Sobic.003G410700 | 3 | 3 | 4 | 417 | 1112 | 417 | 417 | 84.7 | 6.42 | 46.90 | −0.117 |
| Sobic.009G220200 | 9 | 3 | 4 | 416 | 113.4 | 3 | 416 | 85.6 | 6.47 | 47.18 | −0.142 |
| Sobic.009G220100 | 9 | 3 | 4 | 415 | 112 | 2 | 415 | 85.33 | 6.37 | 46.56 | −0.113 |
| Sobic.008G077900 | 8 | 1 | 2 | 523 | 112.1 | 3 | 523 | 72.98 | 5.78 | 58.62 | −0.279 |
| Sobic.008G021000 | 8 | 1 | 2 | 495 | 110.7 | 13.5 | 495 | 75.47 | 8.92 | 54.80 | −0.0338 |
| Sobic.008G138100 | 8 | 0 | 1 | 586 | 111.6 | 22 | 586 | 71.42 | 9.4 | 65.42 | −0.465 |
| Sobic.004G070100 | 4 | 4 | 5 | 403 | 114 | 15.5 | 403 | 87.84 | 9.15 | 45.95 | −0.168 |
| Sobic.007G139300 | 7 | 1 | 2 | 523 | 112.7 | 31.5 | 523 | 82.01 | 9.86 | 58.95 | −0.274 |
| Sobic.001G506700 | 1 | 1 | 2 | 512 | 111.4 | 27 | 512 | 80.45 | 9.66 | 57.03 | −0.139 |
| Sobic.001G387300 | 1 | 1 | 2 | 462 | 112.6 | 7 | 462 | 82.58 | 7.66 | 52.03 | −0.219 |
| Sobic.001G506300 | 1 | 0 | 1 | 616 | 113.2 | −6 | 616 | 67.47 | 5.67 | 69.75 | −0.499 |
| Sobic.001G506800 | 1 | 1 | 2 | 529 | 111.5 | 25 | 529 | 82.8 | 9.54 | 58.95 | −0.161 |
| Sobic.001G506500 | 1 | 0 | 1 | 546 | 113.6 | 16 | 546 | 74.87 | 9 | 62.023 | −0.412 |
| Sobic.001G538700 | 1 | 2 | 3 | 429 | 113.2 | 22.5 | 429 | 92.59 | 9.54 | 48.55 | −0.079 |
| Sobic.001G486900 | 1 | 13 | 14 | 783 | 1113 | 4.5 | 783 | 74.48 | 6.41 | 88.60 | −0.37 |
| Sobic.001G303300 | 1 | 0 | 1 | 450 | 112.2 | 12.5 | 450 | 85.47 | 8.54 | 50.49 | −0.278 |
| Sobic.001G229000 | 1 | 0 | 1 | 613 | 110.2 | 0.5 | 613 | 69.77 | 6.1 | 67.55 | −0.471 |
| Sobic.001G506900 | 1 | 0 | 1 | 513 | 111.4 | 14.5 | 513 | 73. 45 | 8,79 | 57.15 | −0.361 |
| Sobic.001G506600 | 1 | 1 | 2 | 520 | 112.6 | 15 | 520 | 75.81 | 8.69 | 58.53 | −0.306 |
| Sobic.001G541601 | 1 | 0 | 1 | 206 | 110.3 | 10.5 | 206 | 82.43 | 6.11 | 22.70 | −0.233 |
| Sobic.001G228900 | 1 | 1 | 2 | 459 | 111.4 | 11 | 450 | 76.36 | 8.83 | 51.11 | −0.121 |
| Sobic.001G229100 | 1 | 0 | 1 | 490 | 111.1 | 17 | 490 | 73.92 | 9.23 | 54.42 | −0.232 |
| Sobic.006G186200 | 6 | 0 | 1 | 479 | 110 | 15.5 | 479 | 88.52 | 9.21 | 52.70 | 0.042 |
| Sobic.006G186100 | 6 | 1 | 2 | 568 | 110.4 | 10.5 | 568 | 75.92 | 8.77 | 62.70 | −0.302 |
| Sobic.006G260900 | 6 | 2 | 3 | 456 | 113.9 | 14.5 | 456 | 87.87 | 9.1 | 51.94 | −0.299 |
| Sobic.002G342300 | 2 | 2 | 3 | 456 | 111.7 | 11.5 | 456 | 90.29 | 8.93 | 50.94 | −0.221 |
| Gene ID | Chol | Vacu | Mito | Plas | Nucl | E. R | Cyto_ plas | Cyto | Extr | Golg_pla | Golgi | Pero | Cyto-nucl | E.R._plas | Subcellular localization (Significant) |
|---|---|---|---|---|---|---|---|---|---|---|---|---|---|---|---|
| Sobic-GT47-01 | 13 | 1 | 0 | 0 | 0 | 0 | 0 | 0 | 0 | 0 | 0 | 0 | 0 | 0 | Chloroplast, Mitochondrial |
| Sobic-GT47-02 | 5 | 1 | 6 | 1 | 0 | 0 | 0 | 0 | 0 | 0 | 0 | 0 | 0 | 0 | Mitochondrial |
| Sobic-GT47-03 | 6 | 0 | 4 | 1 | 2 | 1 | 0 | 0 | 0 | 0 | 0 | 0 | 0 | 0 | Mitochondrial |
| Sobic-GT47-04 | 6 | 1 | 4 | 2 | 1 | 0 | 0 | 0 | 0 | 0 | 0 | 0 | 0 | 0 | Plasma membrane, Chloroplast |
| Sobic-GT47-05 | 0 | 2 | 2 | 4.5 | 0 | 3 | 3.5 | 1.5 | 1 | 0 | 0 | 0 | 0 | 0 | Plasma membrane |
| Sobic-GT47-06 | 0 | 2 | 0 | 4.5 | 0 | 3 | 0 | 0 | 0 | 5 | 4.5 | 0 | 0 | 0 | Mitochondrial |
| Sobic-GT47-07 | 1 | 4 | 0 | 2 | 1 | 0 | 0 | 0 | 6 | 0 | 0 | 0 | 0 | 0 | Plasma membrane |
| Sobic-GT47-08 | 0 | 3 | 0 | 4.5 | 0 | 2 | 0 | 0 | 0 | 5 | 4.5 | 0 | 0 | 0 | Lysosomal |
| Sobic-GT47-09 | 0 | 3 | 0 | 3.5 | 0 | 4 | 0 | 0 | 0 | 0 | 3.5 | 0 | 0 | 0 | Chloroplast, plasma membrane |
| Sobic-GT47-10 | 6 | 5 | 0 | 0 | 0 | 2 | 0 | 0 | 0 | 0 | 1 | 0 | 0 | 0 | Chloroplast |
| Sobic-GT47-11 | 0 | 5 | 2 | 1 | 1.5 | 0 | 0 | 2.5 | 0 | 0 | 1 | 1 | 2.5 | 0 | Nuclear |
| Sobic-GT47-12 | 7 | 1 | 1 | 1 | 1 | 2 | 0 | 0 | 1 | 0 | 0 | 0 | 0 | 0 | Mitochondrial, plasma membrane |
| Sobic-GT47-13 | 1 | 0 | 1 | 0 | 0 | 5.5 | 0 | 5.5 | 0 | 0 | 0 | 0 | 3.5 | 3.5 | Mitochondrial, chloroplast |
| Sobic-GT47-14 | 6 | 2 | 6 | 0 | 0 | 0 | 0 | 0 | 0 | 0 | 0 | 0 | 0 | 0 | Mitochondrial, plasma membrane |
| Sobic-GT47-15 | 3 | 3 | 2 | 2 | 2 | 2 | 0 | 0 | 0 | 0 | 0 | 0 | 0 | 0 | Plasma membrane |
| Sobic-GT47-16 | 3 | 1 | 2 | 3 | 2 | 1 | 0 | 1 | 0 | 0 | 1 | 0 | 0 | 0 | Chloroplast, cytoplasmic |
| Sobic-GT47-17 | 5 | 2 | 4 | 1 | 0 | 0 | 0 | 0 | 0 | 0 | 1 | 0 | 1 | 0 | Plasma membrane, Mitochondrial |
| Sobic-GT47-18 | 6 | 0 | 4 | 1 | 1 | 0 | 0 | 1 | 0 | 0 | 1 | 0 | 0 | 0 | Mitochondrial |
| Sobic-GT47-19 | 6 | 2 | 6 | 0 | 0 | 0 | 0 | 0 | 0 | 0 | 0 | 0 | 0 | 0 | Mitochondrial, plasma Membrane |
| Sobic-GT47-20 | 0 | 7 | 1 | 1 | 2 | 0 | 0 | 0 | 1 | 0 | 2 | 0 | 0 | 0 | Extracellular |
| Sobic-GT47-21 | 5 | 3 | 0 | 0 | 1 | 1 | 0 | 0 | 4 | 0 | 0 | 0 | 0 | 0 | Mitochondrial, nuclear |
| Sobic-GT47-22 | 0 | 1 | 2 | 0 | 2 | 4 | 0 | 4 | 0 | 0 | 1 | 0 | 0 | 0 | Chloroplast |
| Sobic-GT47-23 | 4 | 1 | 4 | 2 | 1.5 | 0 | 0 | 0 | 0 | 0 | 1 | 0 | 1.5 | 0 | Extracellular, mitochondrial |
| Sobic-GT47-24 | 9 | 0 | 5 | 0 | 0 | 0 | 0 | 0 | 0 | 0 | 0 | 0 | 0 | 0 | Mitochondrial |
| Sobic-GT47-25 | 2 | 0 | 0 | 0 | 0 | 0 | 0 | 12 | 0 | 0 | 0 | 0 | 0 | 0 | Chloroplast, nuclear |
| Sobic-GT47-26 | 8 | 3 | 1 | 0 | 1 | 0 | 0 | 0 | 1 | 0 | 0 | 0 | 0 | 0 | Plasma membrane |
| Sobic-GT47-27 | 0 | 0 | 2 | 0 | 1 | 4 | 0 | 6 | 1 | 0 | 0 | 0 | 0 | 0 | Chloroplast |
| Sobic-GT47-28 | 3 | 2 | 7 | 0 | 0 | 1 | 0 | 1 | 0 | 0 | 0 | 0 | 0 | 0 | Plasma Membrane |
| Sobic-GT47-29 | 13 | 0 | 1 | 0 | 0 | 0 | 0 | 0 | 1 | 0 | 1 | 0 | 0 | 0 | Plasma Membrane |
| Sobic-GT47-30 | 3 | 6 | 2 | 0 | 1 | 0 | 0 | 0 | 0 | 0 | 0 | 0 | 0 | 0 | Plasma Membrane, mitochondrial |
| Sobic-GT47-31 | 2 | 1 | 0 | 8 | 0 | 2 | 0 | 0 | 0 | 0 | 0 | 1 | 0 | 0 | Plasma membrane |
| No. Motifs | Sequences | Length | Description |
|---|---|---|---|
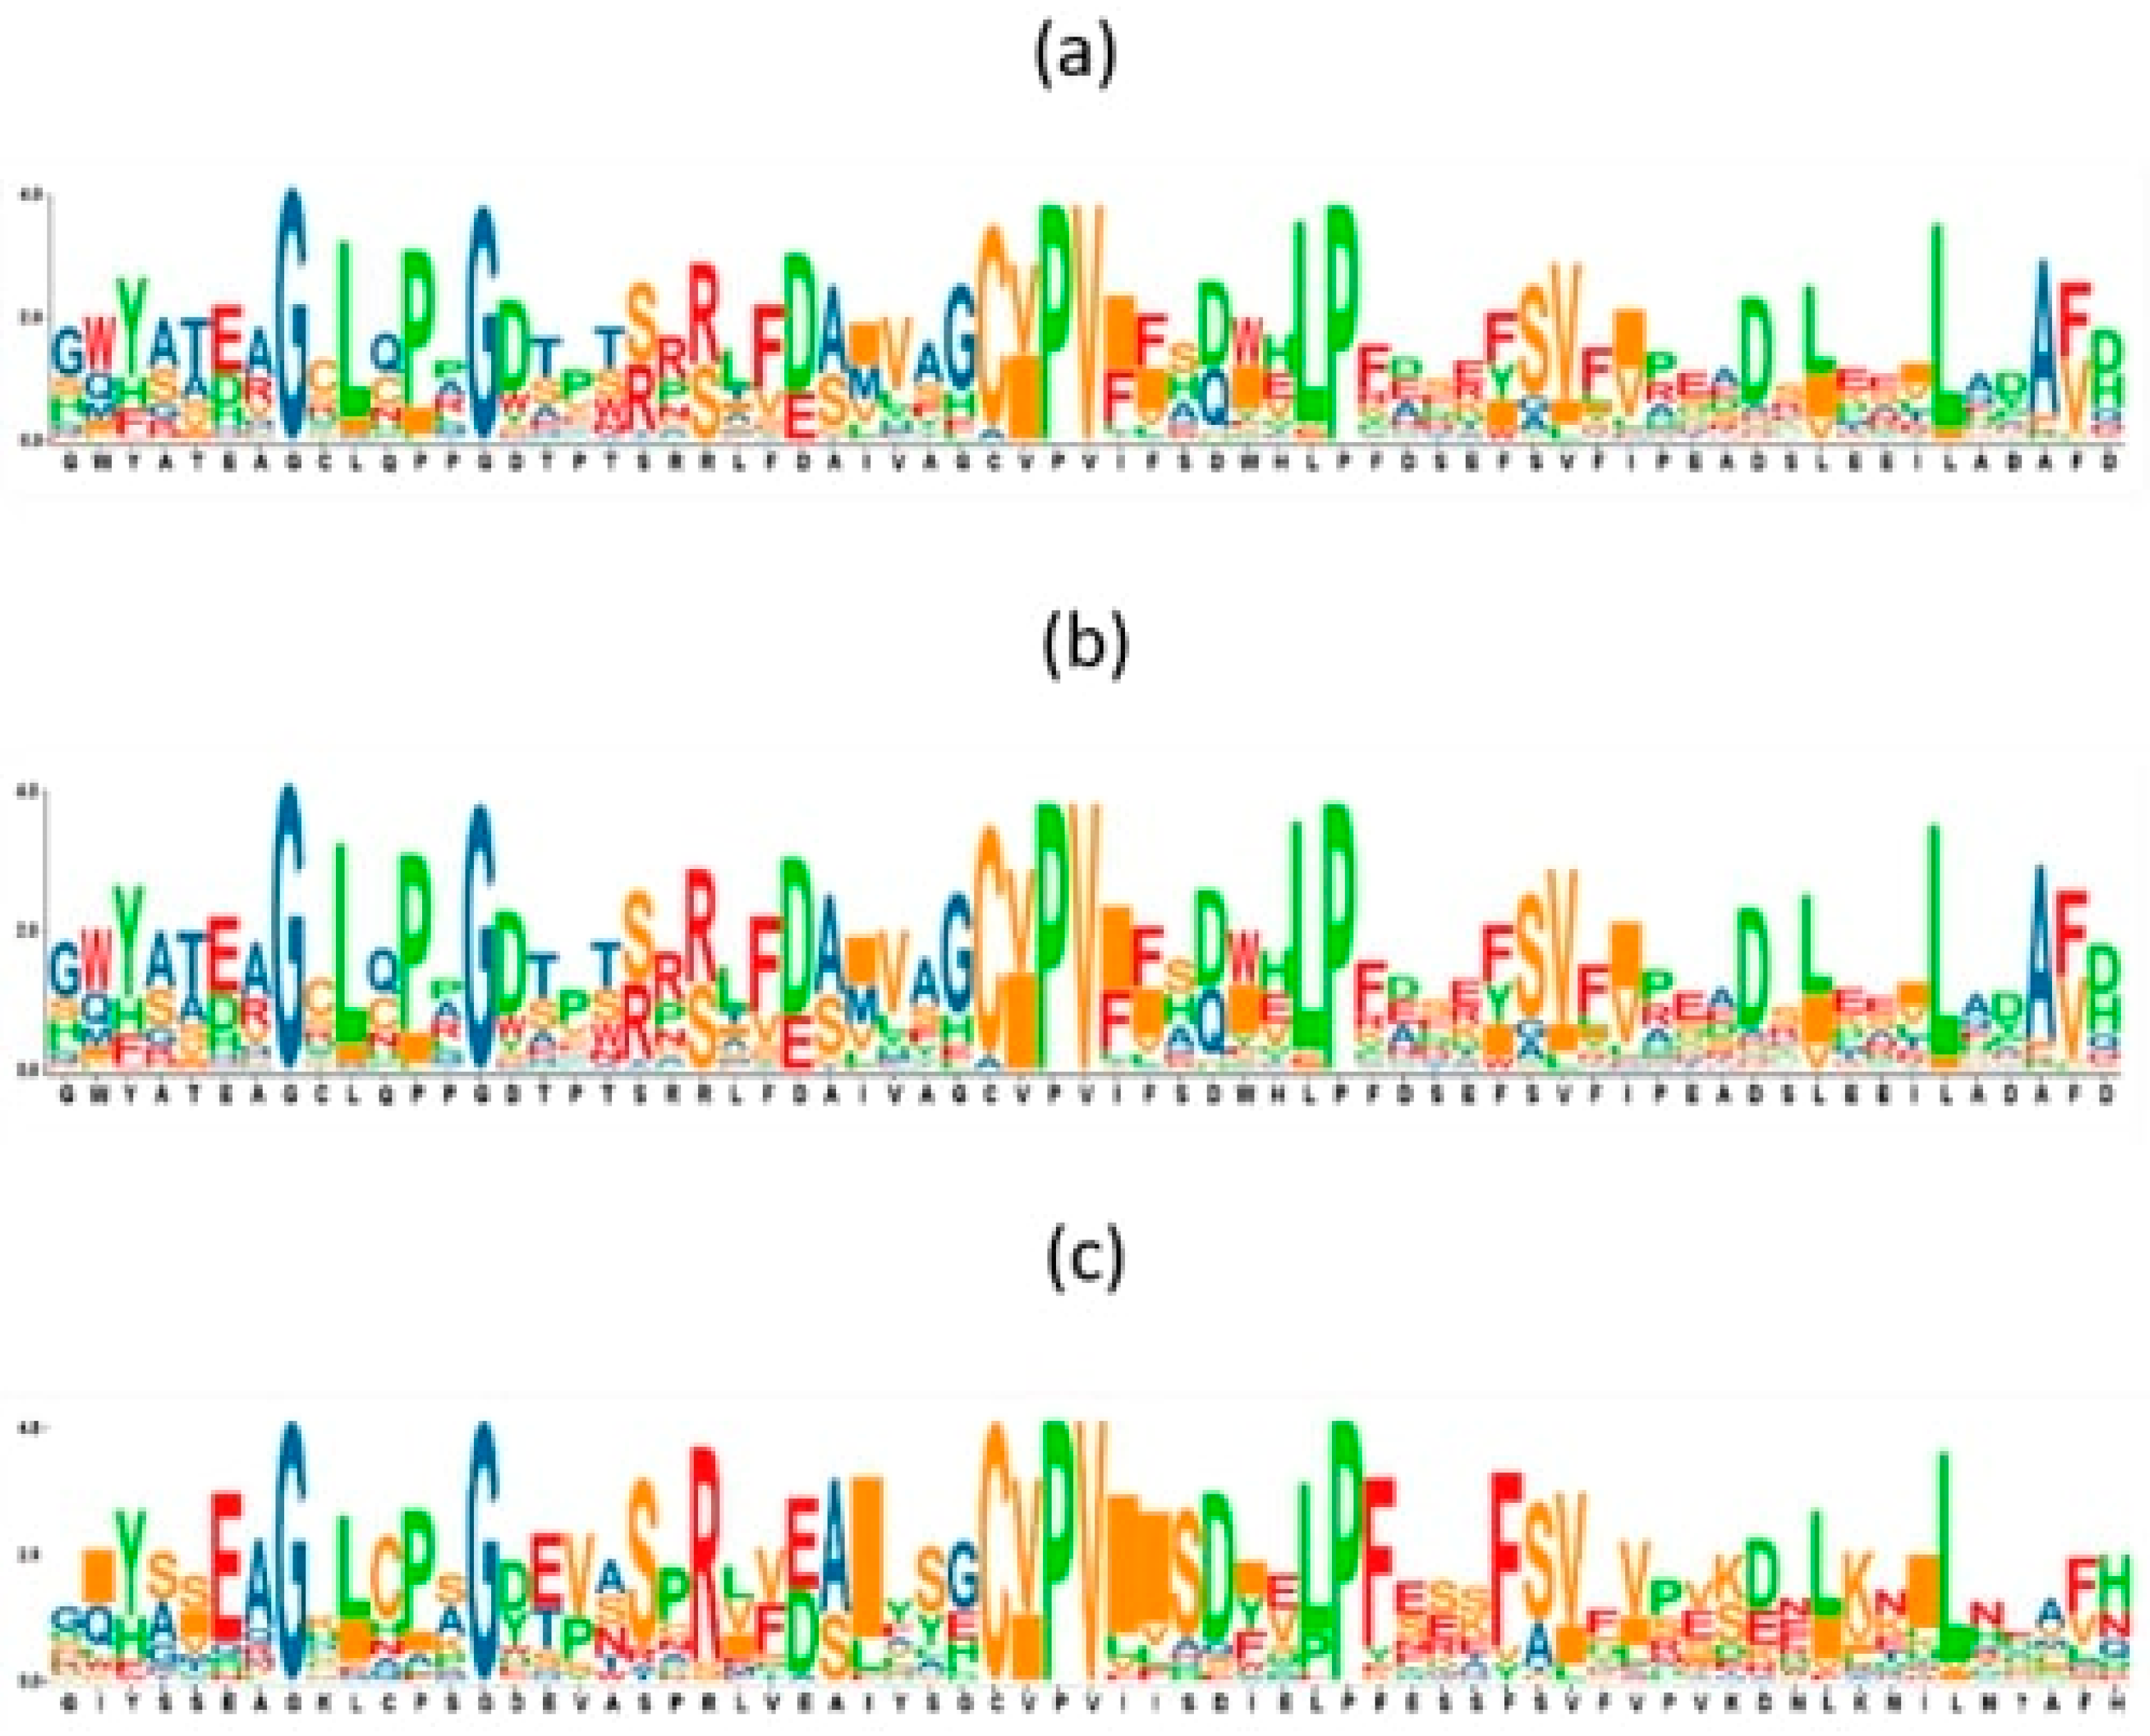
| 1 | GDTPTRRRLFDAIVAGCIPVI | 21 | Exostosin family |
| 2 | RPYWRRSGGRDHFFV | 15 | Exostosin family |
| 3 | YECRTNDPAEADAVFVPFYAG | 21 | Exostosin family |
| Protein | Alpha Helix (%) | Extended Strand (%) | Beta Turn (%) | Random Coil (%) |
|---|---|---|---|---|
| Sobic.003G405600 | 34.95% | 15.05% | 4.63% | 45.37% |
| Sobic.003G234701 | 33.93% | 12.10% | 4.76% | 49.21% |
| Sobic.003G360300 | 37.56% | 11.03% | 3.05% | 48.36% |
| Sobic.003G331000 | 34.67% | 14.43% | 3.81% | 47.09% |
| Sobic.003G410800 | 37.62% | 14.52% | 5.71% | 42.14% |
| Sobic.003G410700 | 32.85% | 15.35% | 5.04% | 46.76% |
| Sobic.009G220200 | 33.65% | 15.14% | 4.57% | 46.63% |
| Sobic.009G220100 | 34.94% | 15.90% | 5.30% | 43.86% |
| Sobic.008G077900 | 39.01% | 12.62% | 4.02% | 44.36% |
| Sobic.008G021000 | 29.09% | 15.56% | 4.85% | 50.51% |
| Sobic.008G138100 | 32.94% | 12.97% | 4.10% | 50.00% |
| Sobic.004G070100 | 36.72% | 13.65% | 3.97% | 45.66% |
| Sobic.007G139300 | 28.68% | 16.63% | 3.44% | 51.24% |
| Sobic.001G506700 | 35.94% | 14.26% | 4.10% | 45.70% |
| Sobic.001G387300 | 30.95% | 16.45% | 5.84% | 46.75% |
| Sobic.001G506300 | 37.66% | 10.23% | 4.71% | 47.40% |
| Sobic.001G506800 | 40.64% | 10.96% | 4.16% | 44.23% |
| Sobic.001G506500 | 37.73% | 13.37% | 4.03% | 44.87% |
| Sobic.001G538700 | 37.53% | 11.66% | 4.90% | 45.92% |
| Sobic.001G486900 | 25.42% | 11.37% | 3.70% | 59.51% |
| Sobic.001G303300 | 37.33% | 14.67% | 4.22% | 43.78% |
| Sobic.001G229000 | 34.42% | 9.79% | 5.38% | 50.41% |
| Sobic.001G506900 | 35.48% | 13.26% | 4.68% | 46.59% |
| Sobic.001G506600 | 39.23% | 12.50% | 3.08% | 45.19% |
| Sobic.001G541601 | 41.26% | 15.05% | 2.91% | 40.78% |
| Sobic.001G228900 | 36.17% | 12.42% | 3.27% | 48.15% |
| Sobic.001G229100 | 34.29% | 14.29% | 3.47% | 47.96% |
| Sobic.006G186200 | 38.83% | 13.36% | 4.59% | 43.22% |
| Sobic.006G186100 | 30.99% | 11.80% | 3.87% | 53.35% |
| Sobic.006G260900 | 34.21% | 13.16% | 5.04% | 47.59% |
| Sobic.002G342300 | 30.26% | 17.98% | 5.48% | 46.27% |
| Sr. No | Paralogs Gene Pairs | Ka | Ks | Ka/Ks | Duplication Types | Selection Pressure | Time (MYA) | |
|---|---|---|---|---|---|---|---|---|
| 1 | Sobic.003G410800 | Sobic.009G220100 | 0.042 | 0.508 | 0.083 | Segmental | purifying | 1.65 × 10⁻⁹ |
| 2 | Sobic.003G410700 | Sobic.009G220200 | 0.064 | 0.521 | 0.124 | Segmental | purifying | 1.69 × 10⁻⁹ |
| 3 | Sobic.003G234701 | Sobic.004G070100 | 0.579 | 2.376 | 0.244 | Segmental | purifying | 7.92 × 10⁻¹⁰ |
| 4 | Sobic.003G331000 | Sobic.002G342300 | 0.618 | 1.983 | 0.312 | Segmental | purifying | 6.44 × 10⁻⁹ |
| 5 | Sobic.008G021000 | Sobic.001G387300 | 0.239 | 1.230 | 0.195 | Segmental | purifying | 4.00 × 10⁻⁹ |
| 6 | Sobic.001G303300 | Sobic.001G541601 | 0.186 | 0.402 | 0.464 | Segmental | purifying | 1.31 × 10⁻⁹ |
| 7 | Sobic.006G186200 | Sobic.006G186100 | 0.302 | 0.445 | 0.678 | Tandem | purifying | 1.45 × 10⁻⁹ |
| 8 | Sobic.008G077900 | Sobic.008G138100 | 0.471 | 0.787 | 0.598 | Tandem | purifying | 2.56 × 10⁻⁹ |
| 9 | Sobic.001G506300 | Sobic.001G229000 | 0.391 | 1.531 | 0.256 | Tandem | purifying | 4.98 × 10⁻⁹ |
| 10 | Sobic.001G506700 | Sobic.001G506800 | 0.088 | 0.166 | 0.527 | Tandem | purifying | 5.41 × 10⁻¹⁰ |
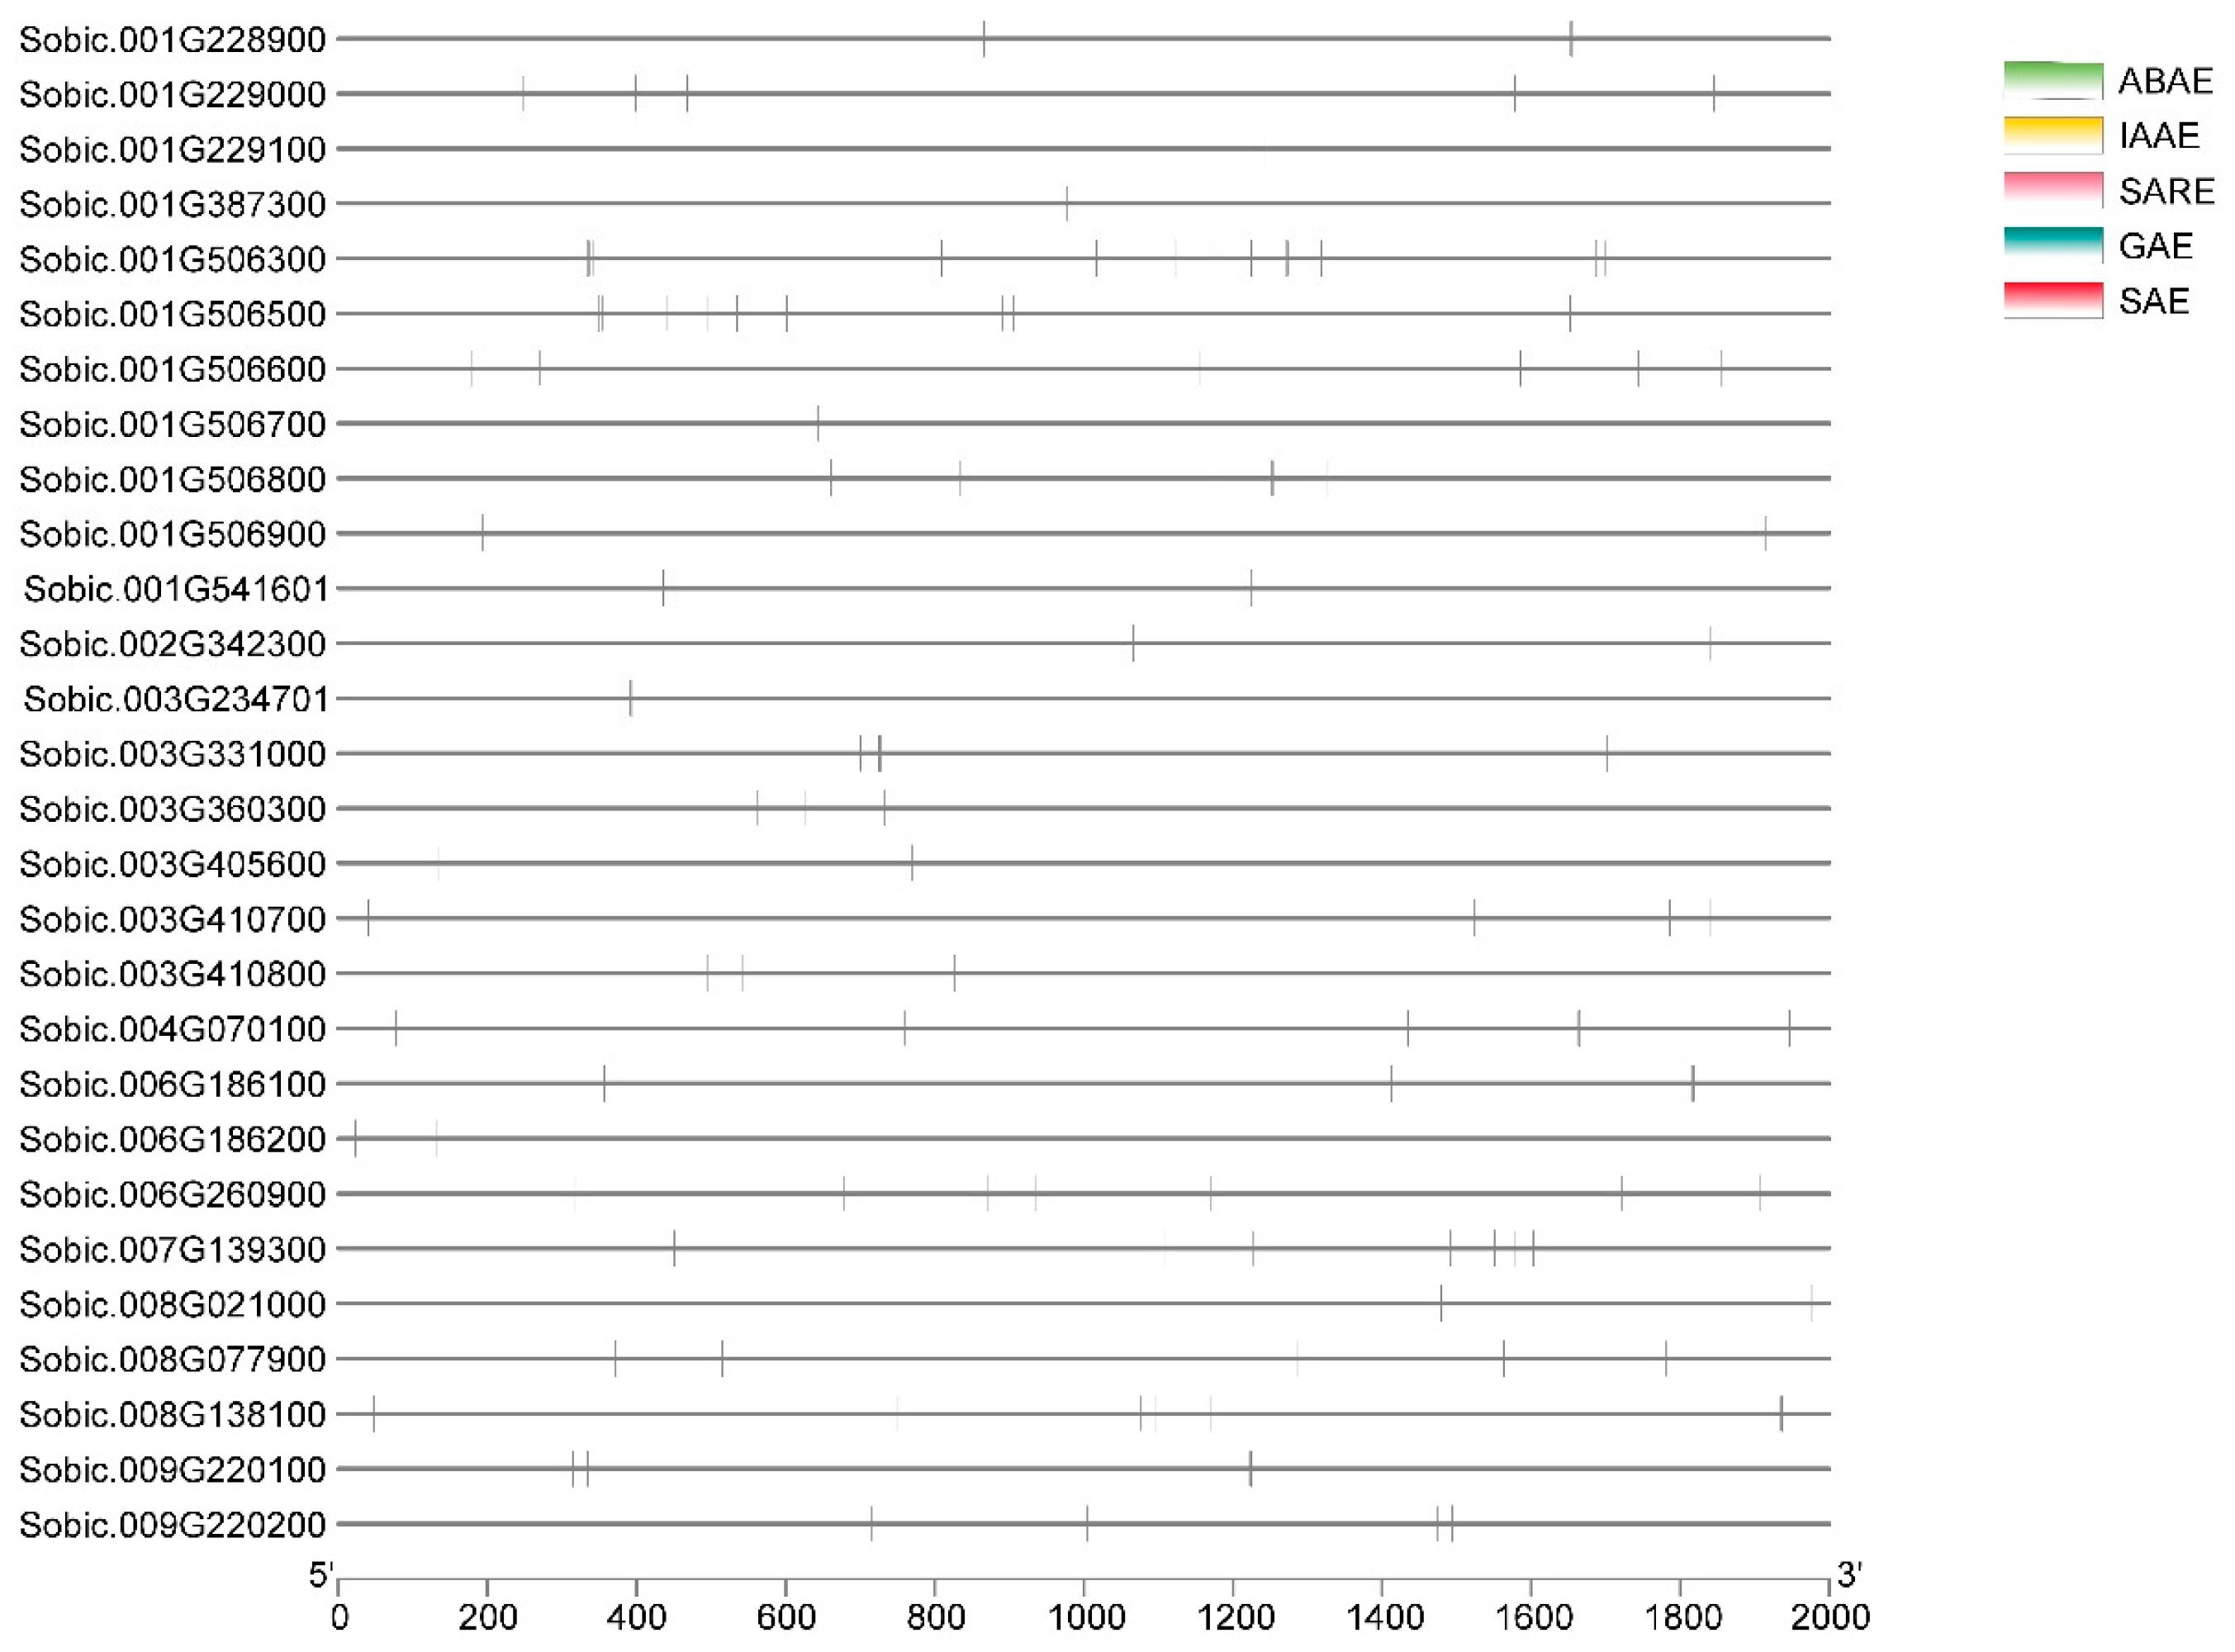
| Cis-Elements | Functions of Cis-Elements |
|---|---|
| ABAE | Involved in abscisic acid responsiveness element |
| IAAE | Involved in auxin responsiveness element |
| SAE | Involved in salicylic acid responsiveness element |
| GAE | Involved in gibberellin-responsiveness element |
| SARE | Involved in systemic required resistance element |
Disclaimer/Publisher’s Note: The statements, opinions and data contained in all publications are solely those of the individual author(s) and contributor(s) and not of MDPI and/or the editor(s). MDPI and/or the editor(s) disclaim responsibility for any injury to people or property resulting from any ideas, methods, instructions or products referred to in the content. |
© 2025 by the authors. Licensee MDPI, Basel, Switzerland. This article is an open access article distributed under the terms and conditions of the Creative Commons Attribution (CC BY) license (https://creativecommons.org/licenses/by/4.0/).
Share and Cite
Rehana, R.; Anwar, M.; Arshad, S.F.; Saleem, M.A. Computational Identification and Characterization of Glycosyltransferase 47 (GT47) Gene Family in Sorghum bicolor and Their Expression Profile in Internode Tissues Based on RNA-Seq Data. Processes 2025, 13, 628. https://doi.org/10.3390/pr13030628
Rehana R, Anwar M, Arshad SF, Saleem MA. Computational Identification and Characterization of Glycosyltransferase 47 (GT47) Gene Family in Sorghum bicolor and Their Expression Profile in Internode Tissues Based on RNA-Seq Data. Processes. 2025; 13(3):628. https://doi.org/10.3390/pr13030628
Chicago/Turabian StyleRehana, Rehana, Muhammad Anwar, Sarmad Frogh Arshad, and Muhammad Asif Saleem. 2025. "Computational Identification and Characterization of Glycosyltransferase 47 (GT47) Gene Family in Sorghum bicolor and Their Expression Profile in Internode Tissues Based on RNA-Seq Data" Processes 13, no. 3: 628. https://doi.org/10.3390/pr13030628
APA StyleRehana, R., Anwar, M., Arshad, S. F., & Saleem, M. A. (2025). Computational Identification and Characterization of Glycosyltransferase 47 (GT47) Gene Family in Sorghum bicolor and Their Expression Profile in Internode Tissues Based on RNA-Seq Data. Processes, 13(3), 628. https://doi.org/10.3390/pr13030628


