
The Development and Validation of a Novel HPLC-DAD Method for the Quantification of Icaridin in Insect Repellent Formulations
 , , , , , and
Abstract
1. Introduction
2. Materials and Methods
2.1. Chemicals and Reagents
2.2. Instrumentation
2.3. Chromatographic Conditions
2.4. Sample Preparation
2.5. Standard Solution Preparation
2.6. Validation Parameters
3. Results and Discussion
3.1. Method Development
3.2. Linearity
3.3. Precision (Repeatability, Intermediate Precision)
3.4. Accuracy
3.5. Selectivity
3.6. Limit of Quantification and Limit of Detection
3.7. Robustness
3.8. Applicability of Validated Method
4. Conclusions
Supplementary Materials
Author Contributions
Funding
Data Availability Statement
Conflicts of Interest
References
- Tavares, M.; da Silva, M.R.M.; de Oliveira de Siqueira, L.B.; Rodrigues, R.A.S.; Bodjolle-d’Almeida, L.; dos Santos, E.P.; Ricci-Júnior, E. Trends in insect repellent formulations: A review. Int. J. Pharm. 2018, 539, 190–209. [Google Scholar] [CrossRef] [PubMed]
- Vilar, W.T.S.; Sousa, E.S.; Pinto, L.; Ugulino De Araújo, M.C.; Coelho Pontes, M.J. Development and validation of a HPLC method to quantify DEET and IR3535 in insect repellents. Anal. Methods. 2018, 10, 1911–1917. [Google Scholar] [CrossRef]
- National Center for Biotechnology Information. Icaridin. Available online: https://pubchem.ncbi.nlm.nih.gov/compound/Icaridin (accessed on 5 August 2024).
- Departamento Científico de Dermatologia. Repelentes e Outras Medidas Protetoras Contra Insetos na Infância. In Guia Prático de Atualização SBP; SBP: Curitiba, PR, Brazil, 2020; pp. 1–11. [Google Scholar]
- de Cataldi, D.G. Icaridina Como Ativo Repelente de Insetos: Uma Revisão Sobre sua Toxicologia e Eficácia. Bachelor’s Thesis, FATEC Luigi Papaiz, Diadema, SP, Brazil, 2021. [Google Scholar]
- dos Santos, J.; Lourenço, R.L.; Rosa, P.; Adams, A.I.H. Development and Validation of a Simple HPLC-UV Method to Assay DEET Repellents and its Application to Different Commercial Forms. Curr. Pharm. Anal. 2020, 17, 1051–1059. [Google Scholar] [CrossRef]
- Charlton, N.P.; Murphy, L.T.; Parker Cote, J.L.; Vakkalanka, J.P. The toxicity of picaridin containing insect repellent reported to the National Poison Data System. Clin. Toxicol. 2016, 54, 655–658. [Google Scholar] [CrossRef]
- Antwi, F.B.; Shama, L.M.; Peterson, R.K.D. Risk assessments for the insect repellents DEET and picaridin. Regul. Toxicol. Pharmacol. 2008, 51, 31–36. [Google Scholar] [CrossRef] [PubMed]
- Knepper, T.P. Analysis and mass spectrometric characterization of the insect repellent Bayrepel and its main metabolite Bayrepel-acid. J. Chromatogr. A. 2004, 1046, 159–166. [Google Scholar]
- Chen, Z.F.; Ying, G.G.; Lai, H.J.; Chen, F.; Su, H.C.; Liu, Y.S.; Peng, F.Q.; Zhao, J.L. Determination of biocides in different environmental matrices by use of ultra-high-performance liquid chromatography-tandem mass spectrometry. Anal. Bioanal. Chem. 2012, 404, 3175–3188. [Google Scholar] [CrossRef] [PubMed]
- Sahu, P.K.; Ramisetti, N.R.; Cecchi, T.; Swain, S.; Patro, C.S.; Panda, J. An overview of experimental designs in HPLC method development and validation. J. Pharm. Biomed. Anal. 2018, 147, 590–611. [Google Scholar] [CrossRef] [PubMed]
- Jiménez-Díaz, I.; Zafra-Gómez, A.; Ballesteros, O.; Navalón, A. Analytical methods for the determination of personal care products in human samples: An overview. Talanta 2014, 129, 448–458. [Google Scholar] [CrossRef] [PubMed]
- Vilar, W.; Barbosa, M.; Pinto, L.; de Araújo, M.; Pontes, M. Determination of N, N-diethyl-3-methylbenzamide and ethyl-butyl-acetylaminopropionate in insect repellent using near infrared spectroscopy and multivariate calibration. Microchem. J. 2020, 152, 104285. [Google Scholar] [CrossRef]
- Araya-Sibaja, A.M.; Fandaruff, C. N,N-diethyl-meta-toluamide (DEET) in repellent solutions: Development and validation of an analytical method. Rev. Bras. Farm. 2013, 94, 273–278. [Google Scholar]
- Silva, D.I.O.; Vilar, W.T.S.; Pontes, M.J.C. Chemometric-assisted UV spectrophotometric method for determination of N, N- diethyl-3-methylbenzamide in insect repellents. Spectrochim. Acta. A. Mol. Biomol. Spectrosc. 2020, 241, 118660. [Google Scholar] [CrossRef]
- Validation of Analytical Procedures. ICH Harmonised Tripartite Guideline. ICH Q2(R2). Available online: https://database.ich.org/sites/default/files/ICH_Q2-R2_Document_Step2_Guideline_2022_0324.pdf (accessed on 18 November 2024).
- Sheskey, P.J.; Hancock, B.C.; Moss, G.P.; Goldfarb, D.J. Handbook of Pharmaceutical Excipients, 9th ed.; Pharmaceutical Press: Chicago, IL, USA, 2020; pp. 1–1400. [Google Scholar]
- Conte, E.; Gani, R.; Cheng, Y.S.; Ng, K.M. Design of formulated products: Experimental component. AIChE J. 2012, 58, 173–189. [Google Scholar] [CrossRef]
- Mass Bank-Icaridin Mass Spectrum. Available online: https://massbank.eu/MassBank/RecordDisplay?id=MSBNK-BAFG-CSL23111019052 (accessed on 5 October 2024).
- Nota Técnica No. 01/2018-GHCOS/DIARE/ANVISA. Available online: https://www.gov.br/anvisa/pt-br/setorregulado/regularizacao/cosmeticos/notas-tecnicas/esclarecimentos-para-o-registro-de-repelentes-de-insetos/view (accessed on 22 October 2024).
- Wluka, A.K.; Rüdel, H.; Pohl, K.; Schwarzbauer, J. Analytical method development for the determination of eight biocides in various environmental compartments and application for monitoring purposes. Environ. Sci. Pollut. Res. Int. 2016, 23, 21894–21907. [Google Scholar] [CrossRef] [PubMed]
- Schettgen, T.; Bertram, J.; Weber, T.; Kraus, T.; Kolossa-Gehring, M. Quantification of a mercapturate metabolite of the biocides methylisothiazolinone and chloromethylisothiazolinone (“M-12”) in human urine using online-SPE-LC/MS/MS. Anal. Methods 2021, 13, 1847–1856. [Google Scholar] [CrossRef] [PubMed]


| Function | Formulations’ Compositions | ||||||
|---|---|---|---|---|---|---|---|
| Lotion (L1) | Lotion (L2) | Gel (G1) | Gel (G2) | Spray (S1) | Spray (S2) | Spray (S3) | |
| Active ingredient | Icaridin (7.5% m/m) | Icaridin (10.0% m/m) | Icaridin (10.0% m/m) | Icaridin (10.0% m/m) | Icaridin (5.5% m/m) | Icaridin (9.98% m/m) | Icaridin (25.0% m/m) |
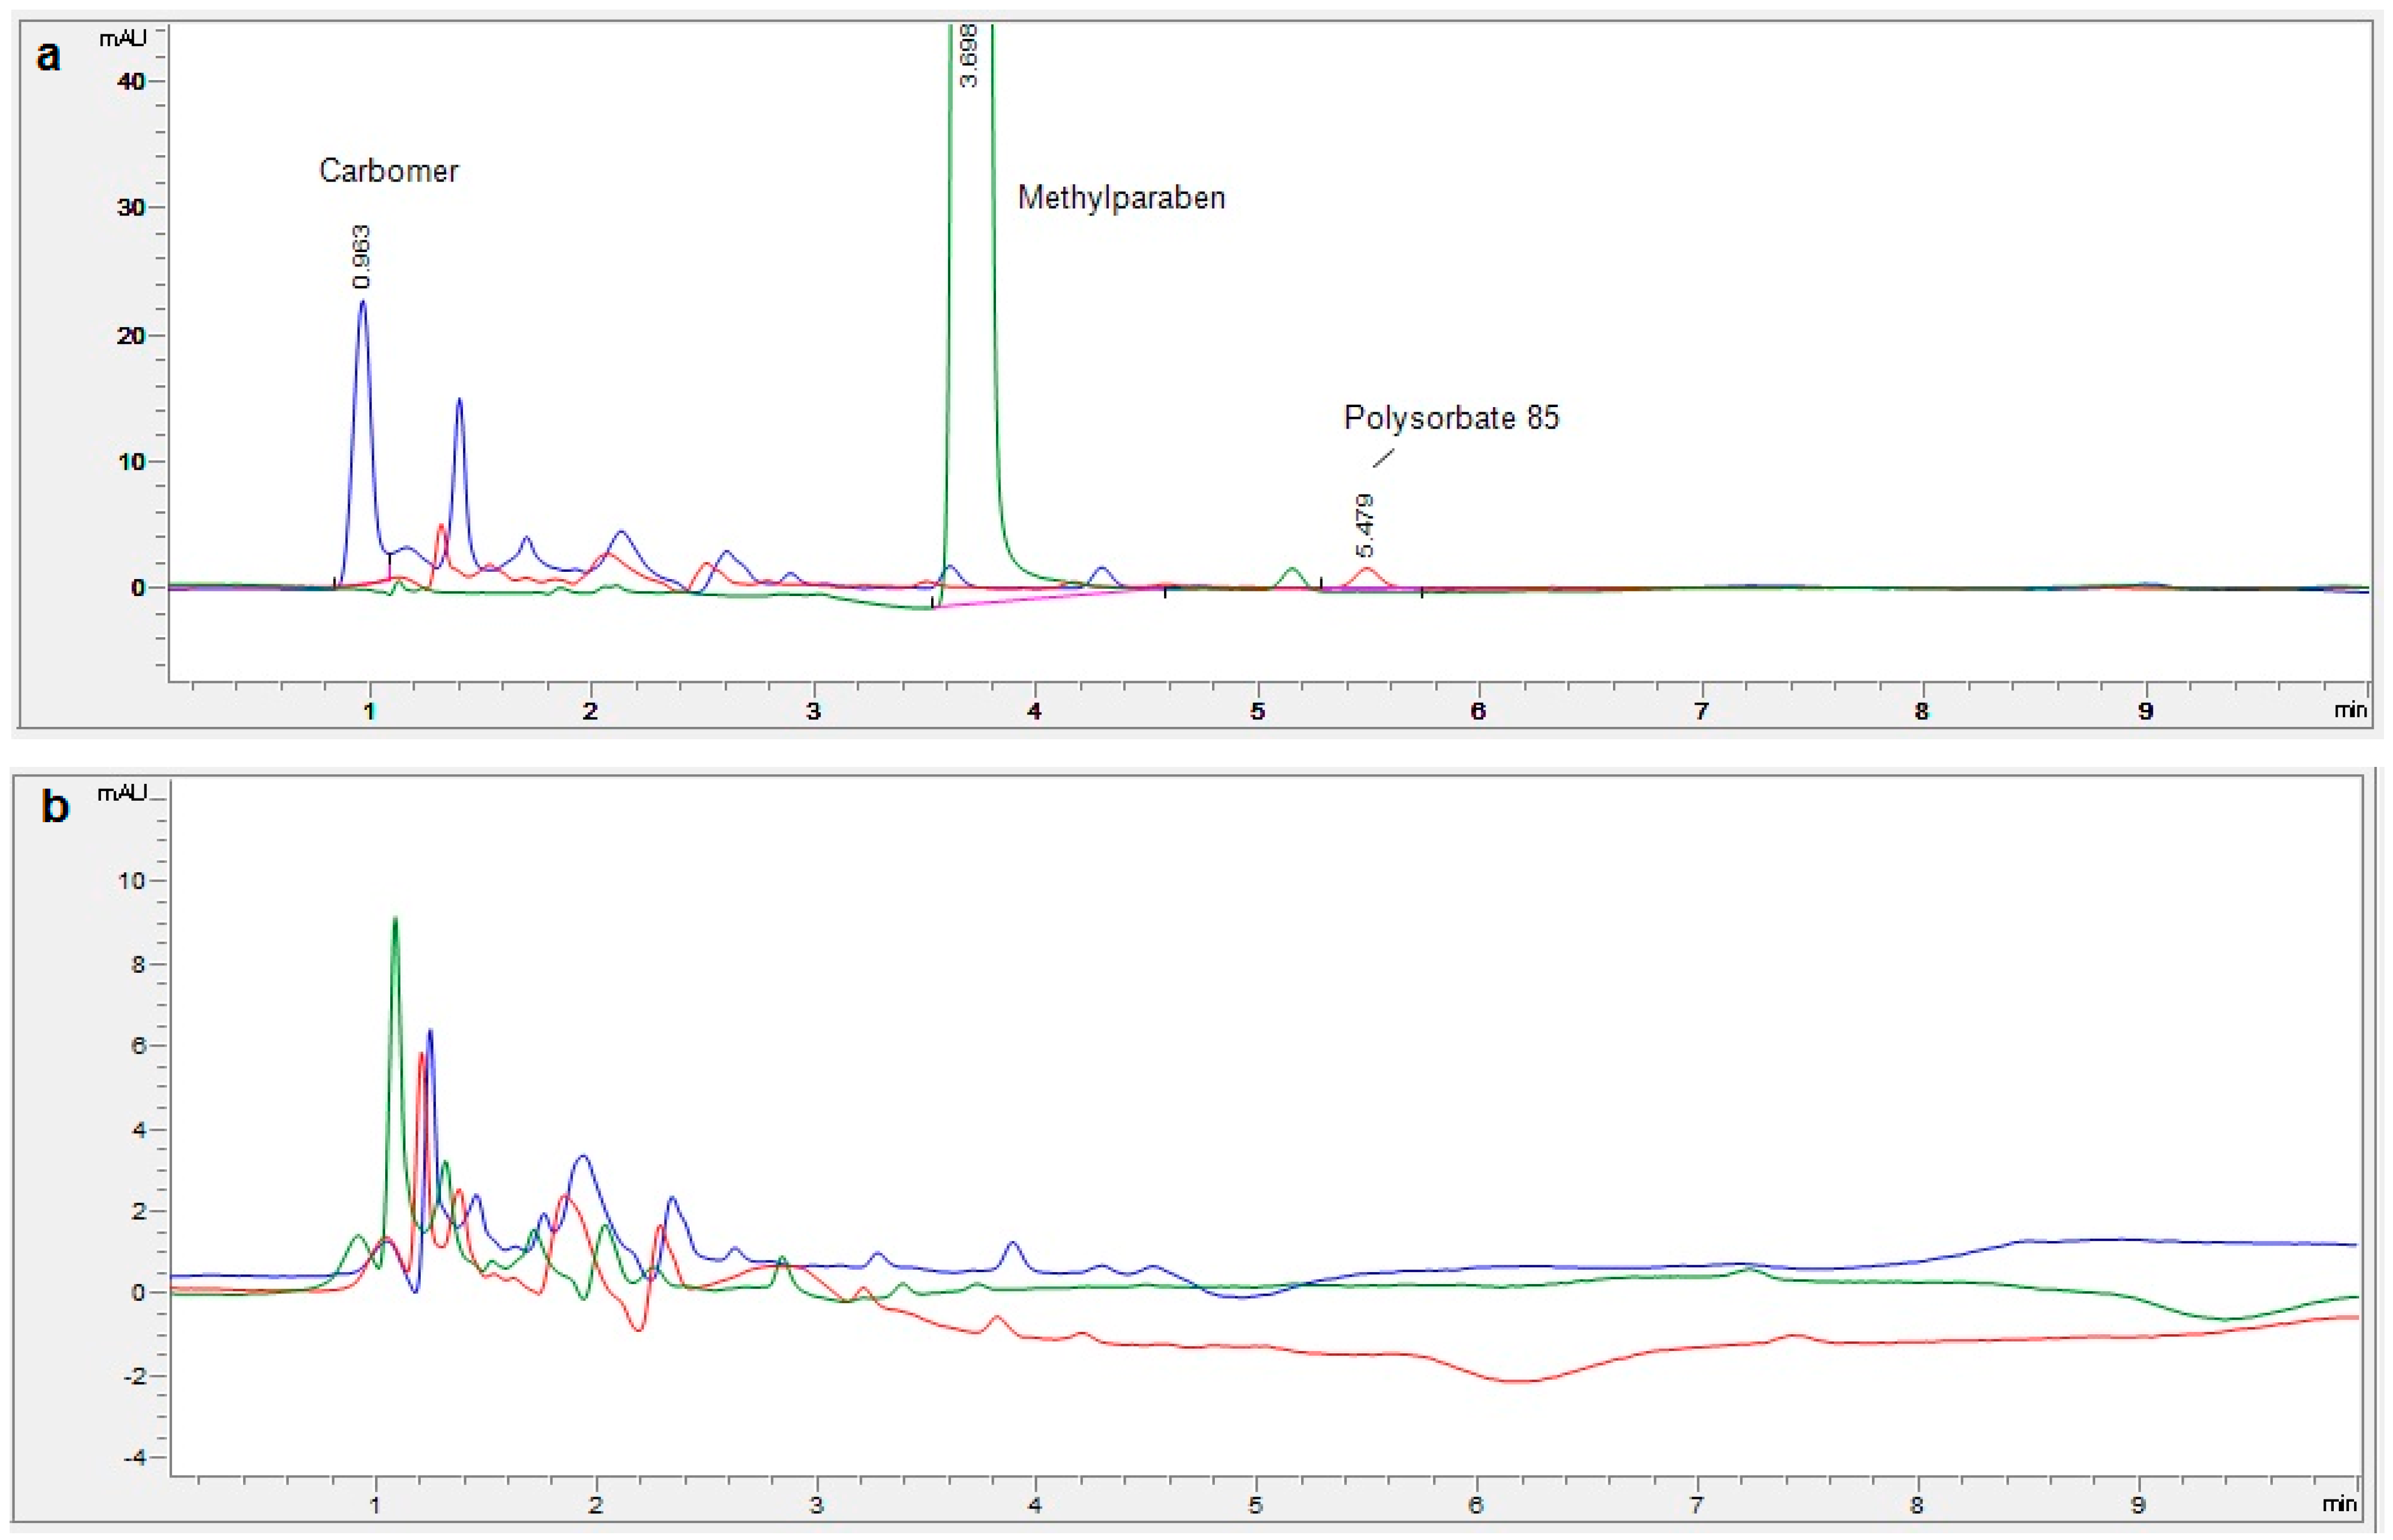
| Emulsifier | Triethanolamine | Polysorbate 85 | - | - | Polysorbate 80 Oleic acid Monostearyl propyleneglycol ether Cetearate 20 Stearate 2 Stearate 21 Palmitic acid | - | PEG 400 |
| Solvents | Water Ethyl Alcohol | Water | Water Alcohol | Water Alcohol | - | Water Alcohol | Water Alcohol |
| Polymers | - | Acrylamide | - | - | Poloxamero 407 | - | - |
| Viscosity agent | Carbomer | - | Polyacrylic Acid | Polyacrylic Acid | Docosanoic acid | - | - |
| Preservative | Methylparaben | - | - | - | Phenoxyethanol Capryliglycol | - | - |
| Emollient | Glycerol | Liquid Paraffin Ethylexyglycerin | Glycerol | Glycerol | Glycerol Caprylic triglycerol Cetyl palmitate Stearic acid | - | - |
| pH Regulator | Triethanolamine (alkalizing) | Sodium Hydroxide | Anhydrous Sodium Hydroxide | Anhydrous Sodium Hydroxide | - | - | - |
| Antioxidant | - | Tocopherol | - | - | Butylated hydroxytoluene | - | - |
| Fragrance | Essence Benzyl Salicylate Dextrolimonene Linalol Hydroxymethylpentyl Cycle Hexane Carboxaldehyde Citral | Benzyl alcohol | - | - | - | - | - |
| C18 | Phenyl | |
|---|---|---|
| Height | 310.36 | 430.28 |
| Symmetry | 0.94 | 0.97 |
| Plates | 8,161 | 12,707 |
| Width | 0.097 | 0.0642 |
| Concentration Levels (mg/mL) | Replicates | Results (mg/mL) | Descriptive Analysis | Grubbs Test with 99% Confidence | |||||
|---|---|---|---|---|---|---|---|---|---|
| Curve 1 | Curve 2 | Curve 1 | Curve 2 | Curve 1 | Curve 2 | ||||
| 0.2 | 1 | 0.2016 | 0.2037 | Mean | 0.2025 | 0.2037 | G critical | 1.973 | |
| 2 | 0.2025 | 0.2035 | SD | 0.0005 | 0.0001 | G maximum calculated | 0.920 | 1.297 | |
| 3 | 0.2029 | 0.2038 | RSD% | 0.2279 | 0.0696 | G minimum calculated | 1.901 | 1.297 | |
| 4 | 0.2026 | 0.2036 | |||||||
| 5 | 0.2024 | 0.2036 | |||||||
| 6 | 0.2027 | 0.2039 | |||||||
| 0.4 | 1 | 0.4039 | 0.4040 | Mean | 0.4038 | 0.4033 | G critical | 1.973 | |
| 2 | 0.4038 | 0.4040 | SD | 0.0003 | 0.0006 | G maximum calculated | 1.039 | 1.091 | |
| 3 | 0.4034 | 0.4033 | RSD% | 0.0765 | 0.1415 | G minimum calculated | 1.436 | 1.339 | |
| 4 | 0.4041 | 0.4028 | |||||||
| 5 | 0.4041 | 0.4034 | |||||||
| 6 | 0.4035 | 0.4026 | |||||||
| 0.6 | 1 | 0.6048 | 0.6055 | Mean | 0.6051 | 0.6026 | G critical | 1.973 | |
| 2 | 0.6047 | 0.6032 | SD | 0.0004 | 0.0019 | G maximum calculated | 1.117 | 1.552 | |
| 3 | 0.6053 | 0.6030 | RSD% | 0.0725 | 0.3157 | G minimum calculated | 0.945 | 1.215 | |
| 4 | 0.6047 | 0.6028 | |||||||
| 5 | 0.6056 | 0.6003 | |||||||
| 6 | 0.6056 | 0.6007 | |||||||
| 0.8 | 1 | 0.8042 | 0.8002 | Mean | 0.8034 | 0.7996 | G critical | 1.973 | |
| 2 | 0.8054 | 0.7995 | SD | 0.0018 | 0.0004 | G maximum calculated | 1.104 | 1.703 | |
| 3 | 0.8044 | 0.7994 | RSD% | 0.2287 | 0.0461 | G minimum calculated | 1.715 | 1.293 | |
| 4 | 0.8036 | 0.7991 | |||||||
| 5 | 0.8024 | 0.7997 | |||||||
| 6 | 0.8002 | 0.7997 | |||||||
| 1.0 | 1 | 1.0071 | 1.0087 | Mean | 1.0049 | 1.0094 | G critical | 1.973 | |
| 2 | 1.0047 | 1.0094 | SD | 0.0018 | 0.0009 | G maximum calculated | 1.258 | 1.552 | |
| 3 | 1.0020 | 1.0107 | RSD% | 0.1791 | 0.0846 | G minimum calculated | 1.572 | 1.331 | |
| 4 | 1.0037 | 1.0083 | |||||||
| 5 | 1.0059 | 1.0098 | |||||||
| 6 | 1.0057 | 1.0095 | |||||||
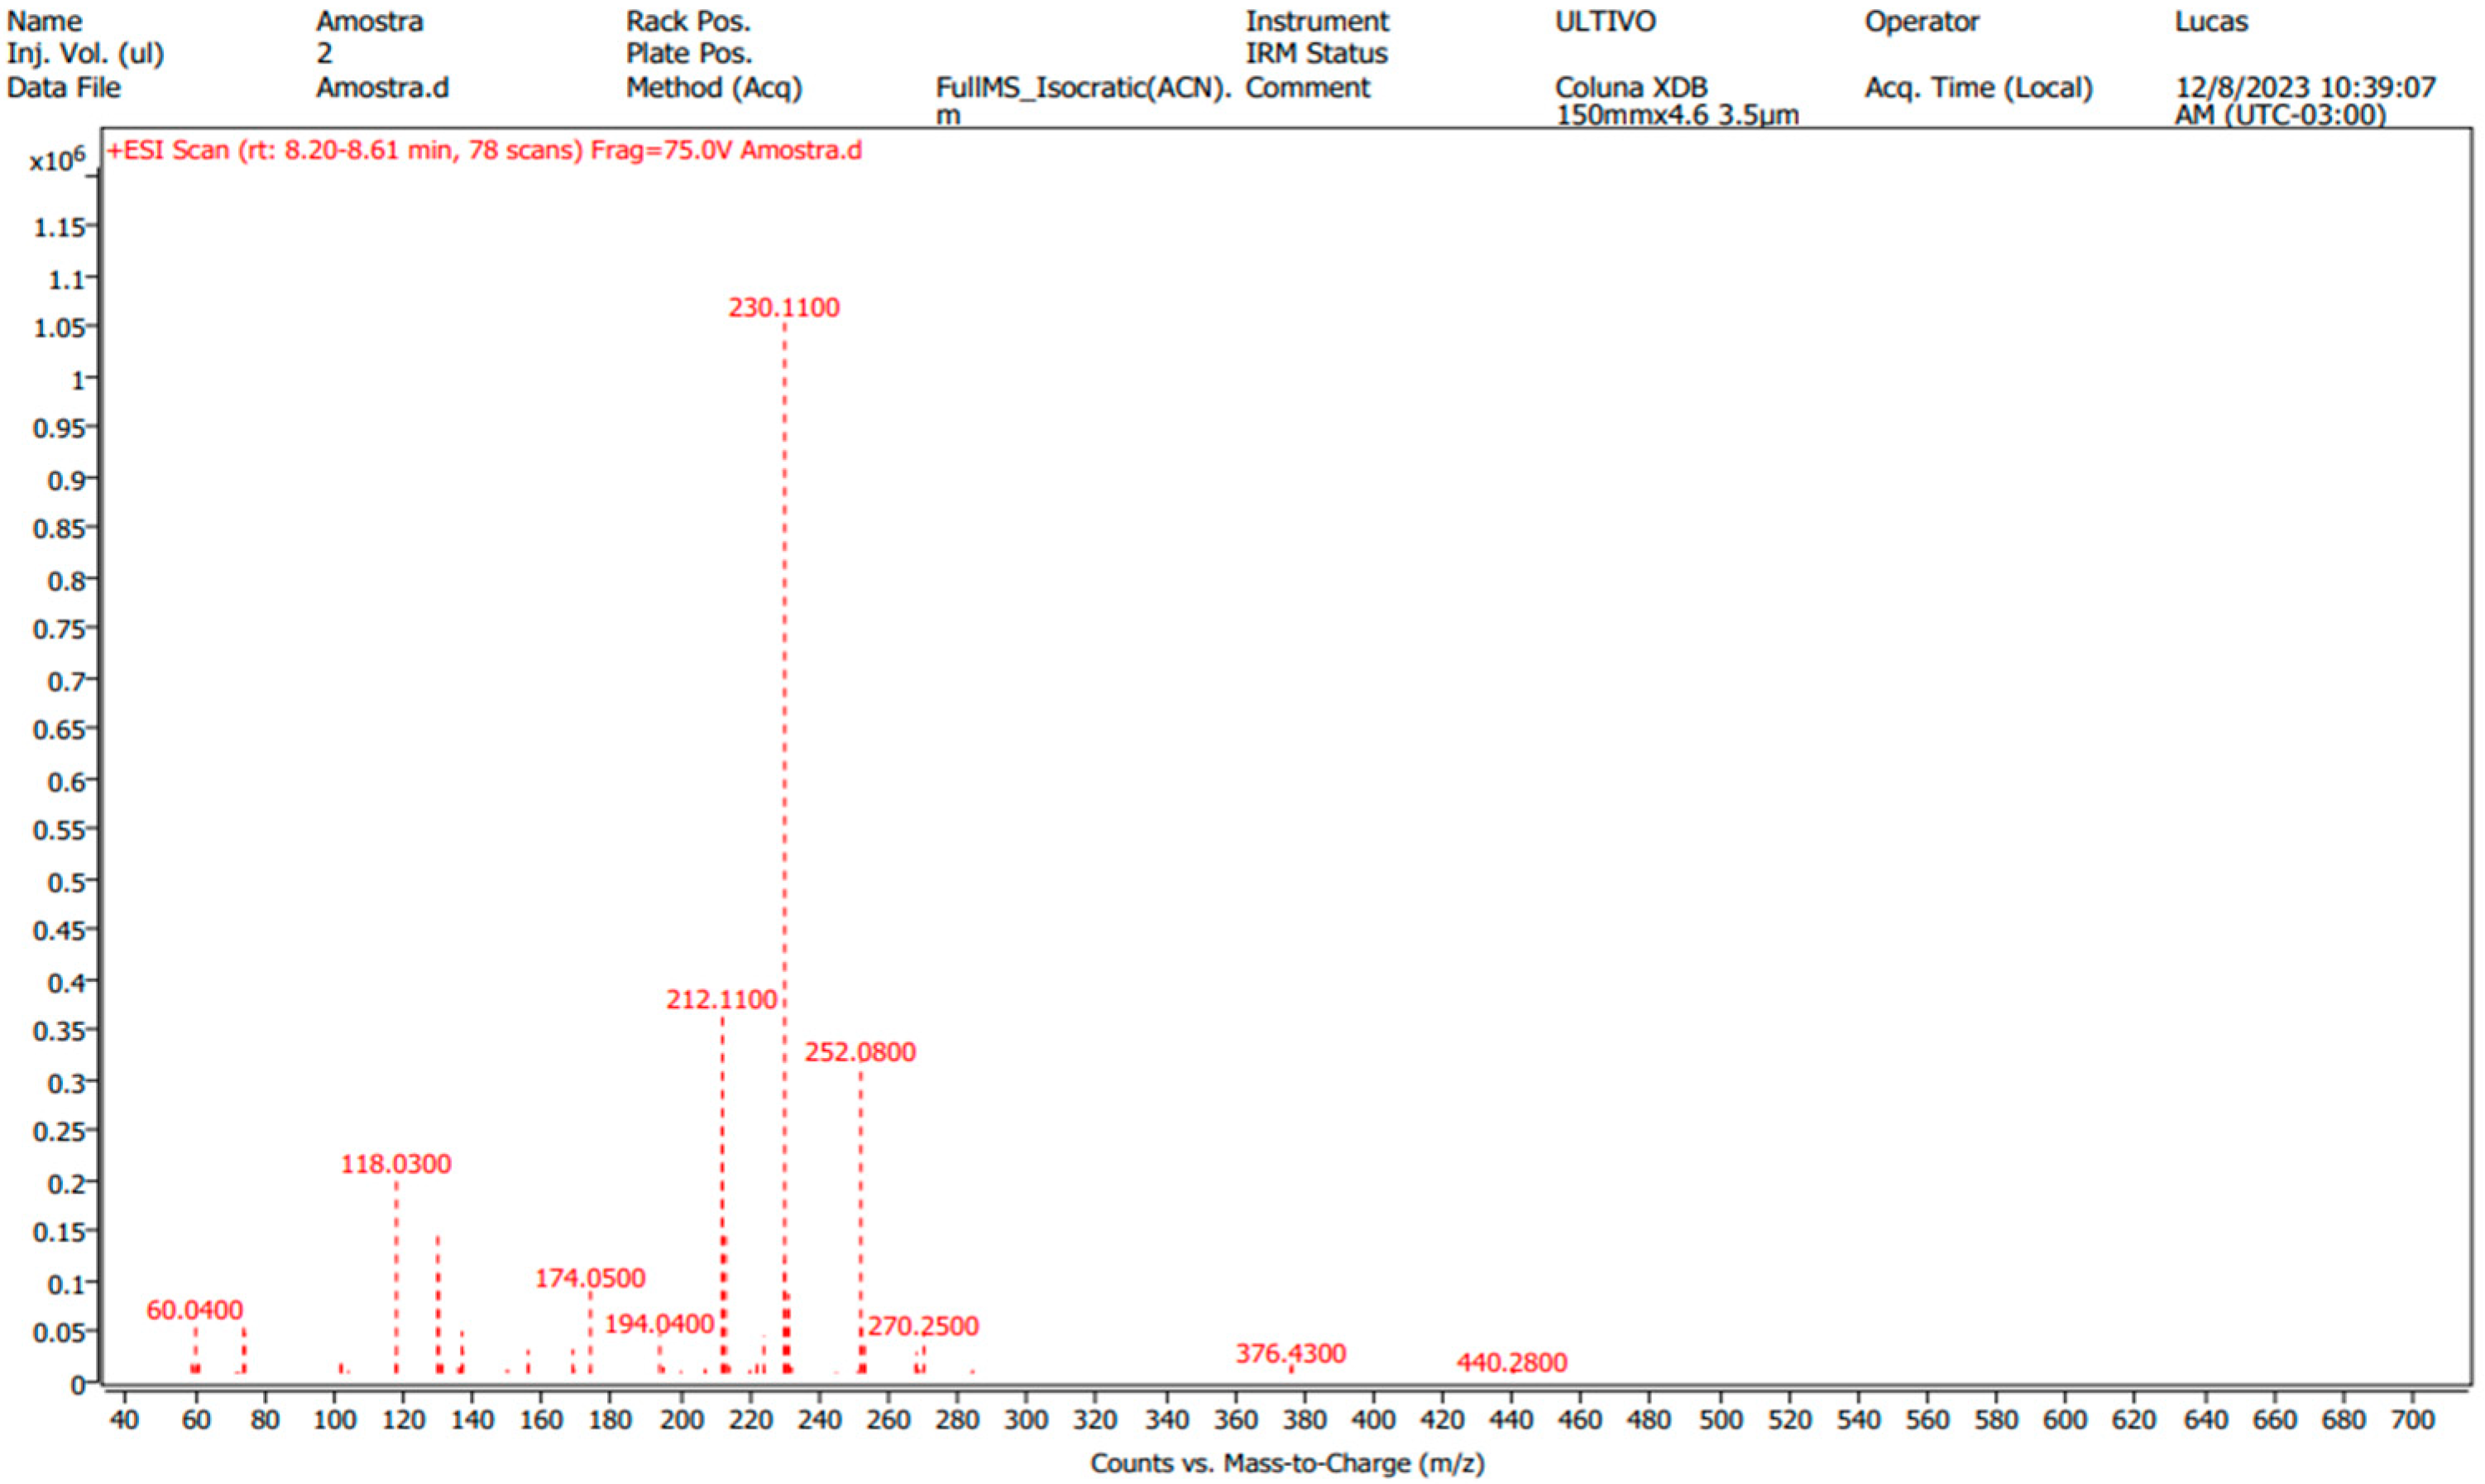
| Mass Spectometry Conditions | |
|---|---|
| Equipment | QQQ Mass Spectrometer |
| Ionization Mode | ESI |
| Polarity | + |
| Fragmentor (V) | 75 |
| Gas Temperature (°C) | 350 |
| Gas Flow (L/min) | 10 |
| Nebulizer (psi) | 35 |
| Start and End Mass (m/z) | 50–700 scan mode |
| Capilar Voltage (V) | 4000 |
| Sheath Gas Temperature (°C) | 400 |
| Sheath Gas Flow (L/min) | 12 |
| Nozzle Voltage (V) | 1500 |
| Parameter | Acceptance Criterion | Result |
|---|---|---|
| Linearity | r2 > 0.99 | r2 = 0.996 |
| Repeatability | RSD ≤ 2.0% | RSD = 1.80% |
| Intermediate precision | RSD ≤ 2.0% | RSD = 1.83% |
| Accuracy | 98.0 to 102.0% | Concentrations of 0.5; 0.6; 0.7 mg/mL Ranging from 98.2 to 101.1% |
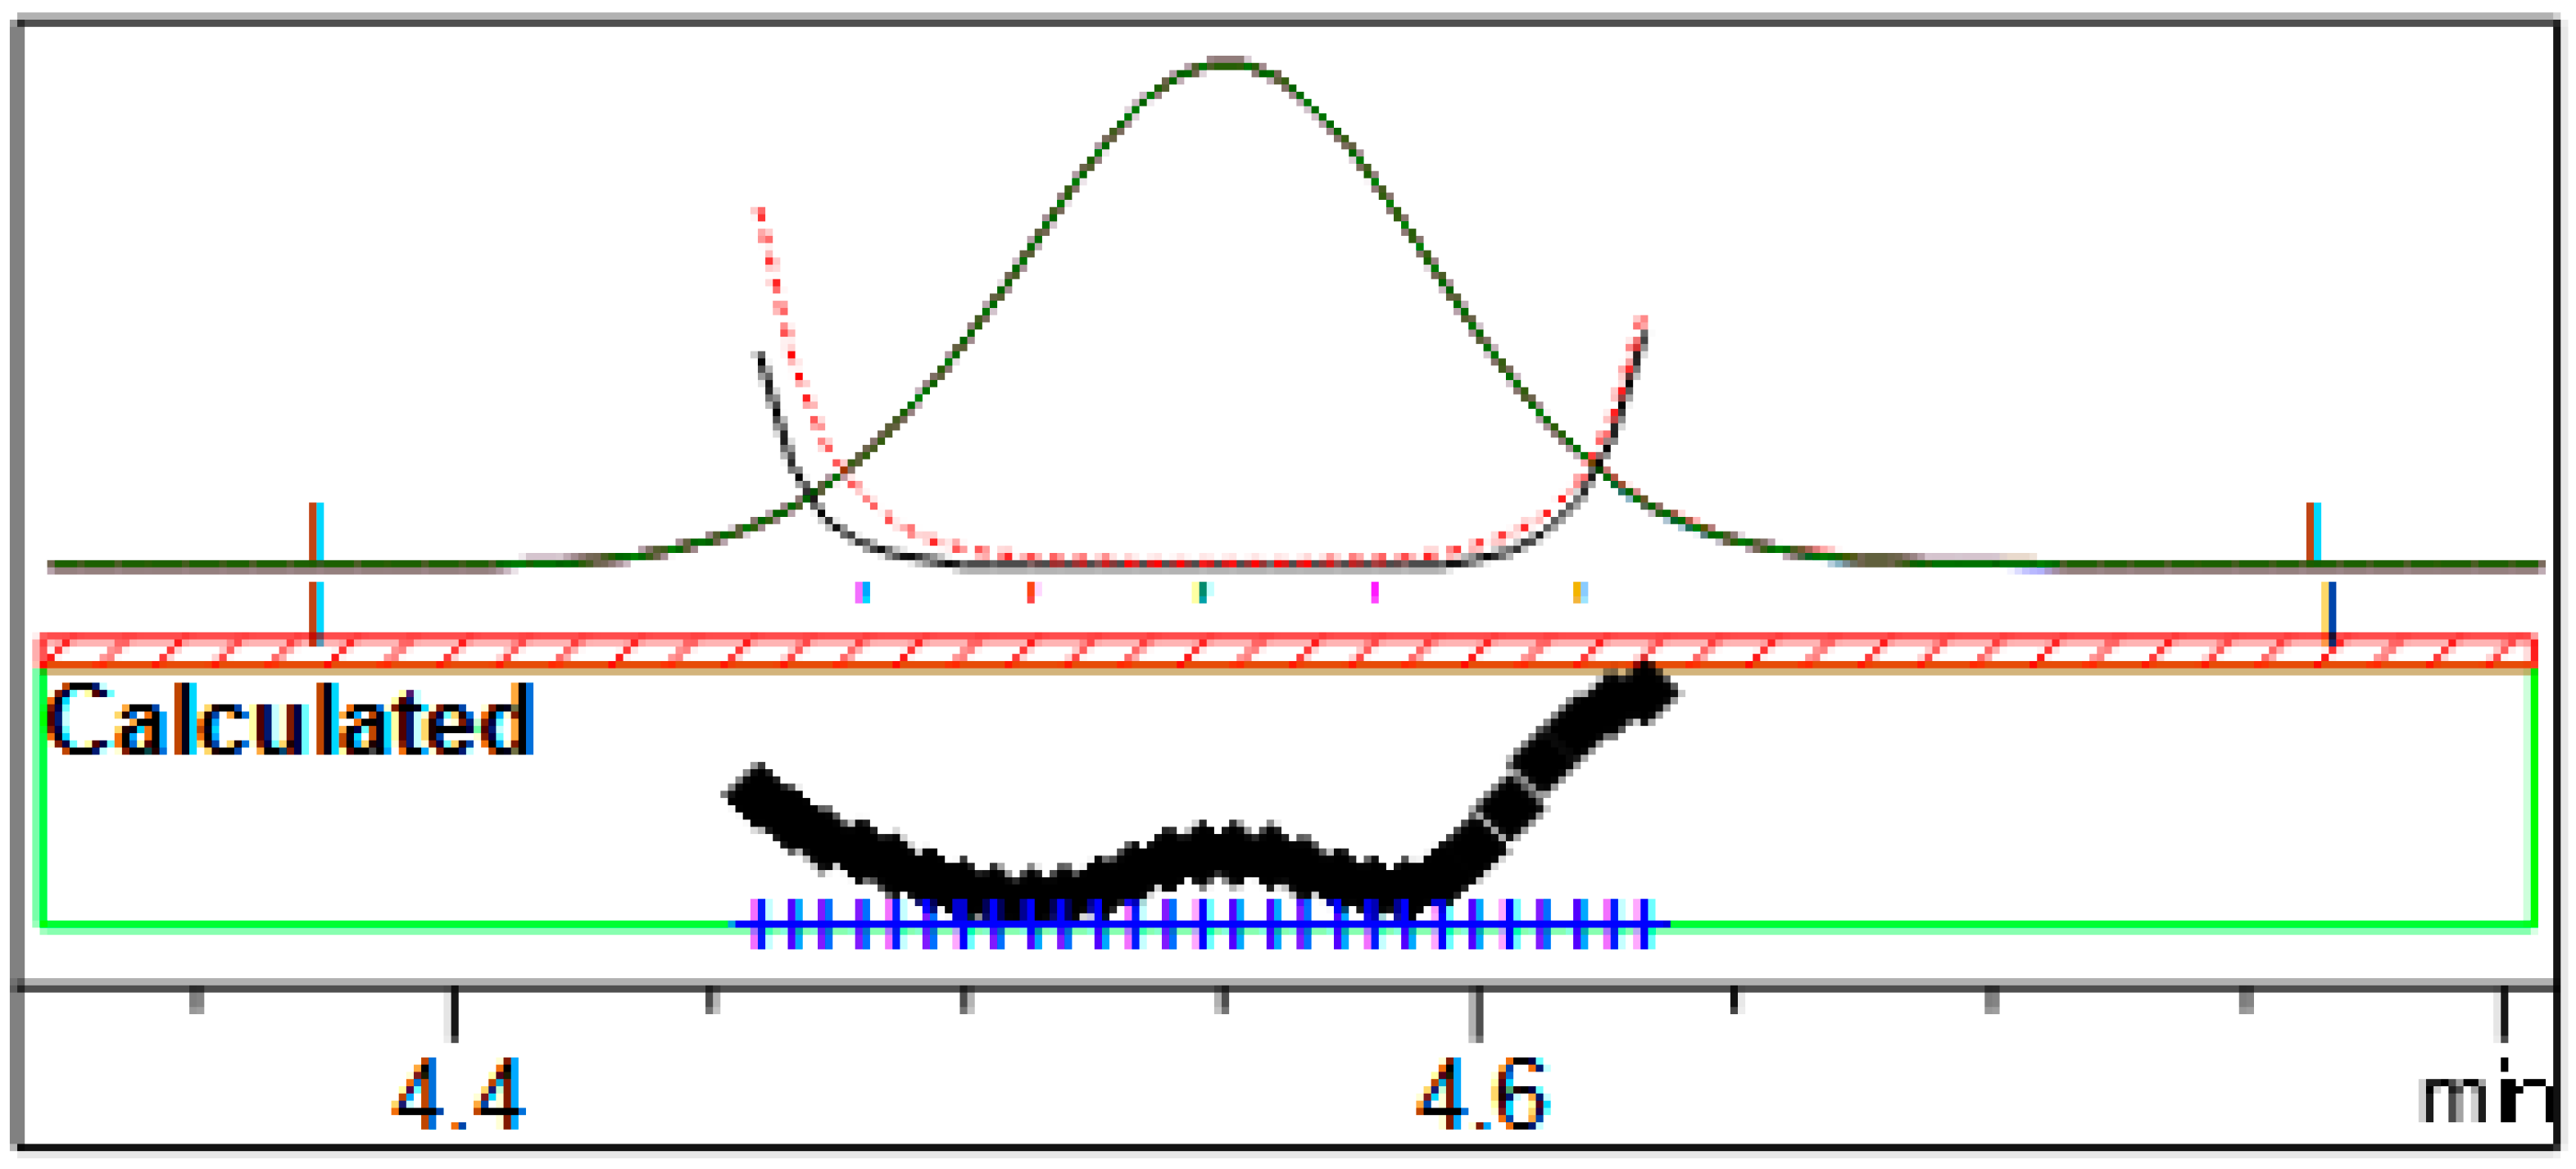
| Selectivity | Absence of matrix interference and chromatographic purity | Matrix did not interfere with sample reading Homogeneous slopes Pure peak |
| Limit of quantification | Lowest concentration that shows repeatability compliant | 0.1 mg/mL |
| Limit of detection | Lowest amount of analyte that can be detected in a sample | 0.03 mg/mL |
| Robustness | Variation in temperature, flow and wavelength | One-way ANOVA No significant differences Wavelength: p-value: 0.99 Flow: p-value: 0.37 Temperature: p-value: 0.48 |
| Formulation Type | Content Described | Content Observed | Variation Allowed |
|---|---|---|---|
| Lotion (L1) | 7.50% | 8.18% | 6.75–8.25% |
| Lotion (L2) | 10.00% | 10.93% | 9.00–11.00% |
| Gel (G1) | 10.00% | 9.87% | 9.00–11.00% |
| Gel (G2) | 10.00% | 9.92% | 9.00–11.00% |
| Spray (S1) | 5.50% | 5.84% | 4.95–6.05% |
| Spray (S2) | 9.98% | 10.85% | 8.98–10.98% |
| Spray (S3) | 25.00% | 25.96% | 22.50–27.50% |
Disclaimer/Publisher’s Note: The statements, opinions and data contained in all publications are solely those of the individual author(s) and contributor(s) and not of MDPI and/or the editor(s). MDPI and/or the editor(s) disclaim responsibility for any injury to people or property resulting from any ideas, methods, instructions or products referred to in the content. |
© 2025 by the authors. Licensee MDPI, Basel, Switzerland. This article is an open access article distributed under the terms and conditions of the Creative Commons Attribution (CC BY) license (https://creativecommons.org/licenses/by/4.0/).
Share and Cite
Farias, F.F.; Santa Bárbara, M.C.; Martins, V.A.P.; Silva, M.S.G.; Silva, V.C.M.; Andreo-Filho, N.; Lopes, P.S.; Leite-Silva, V.R. The Development and Validation of a Novel HPLC-DAD Method for the Quantification of Icaridin in Insect Repellent Formulations. Processes 2025, 13, 621. https://doi.org/10.3390/pr13030621
Farias FF, Santa Bárbara MC, Martins VAP, Silva MSG, Silva VCM, Andreo-Filho N, Lopes PS, Leite-Silva VR. The Development and Validation of a Novel HPLC-DAD Method for the Quantification of Icaridin in Insect Repellent Formulations. Processes. 2025; 13(3):621. https://doi.org/10.3390/pr13030621
Chicago/Turabian StyleFarias, Fernanda Fernandes, Maria Cristina Santa Bárbara, Valéria Adriana Pereira Martins, Mariana Sbaraglini Garcia Silva, Vanessa Cristina Martins Silva, Newton Andreo-Filho, Patricia Santos Lopes, and Vânia Rodrigues Leite-Silva. 2025. "The Development and Validation of a Novel HPLC-DAD Method for the Quantification of Icaridin in Insect Repellent Formulations" Processes 13, no. 3: 621. https://doi.org/10.3390/pr13030621
APA StyleFarias, F. F., Santa Bárbara, M. C., Martins, V. A. P., Silva, M. S. G., Silva, V. C. M., Andreo-Filho, N., Lopes, P. S., & Leite-Silva, V. R. (2025). The Development and Validation of a Novel HPLC-DAD Method for the Quantification of Icaridin in Insect Repellent Formulations. Processes, 13(3), 621. https://doi.org/10.3390/pr13030621