
Statistical Analysis of the Effect of Simulation Time on the Results of Molecular Dynamics Studies of Food Proteins: A Study of the Ara h 6 Peanut Protein


Abstract
1. Introduction
2. Materials and Methods
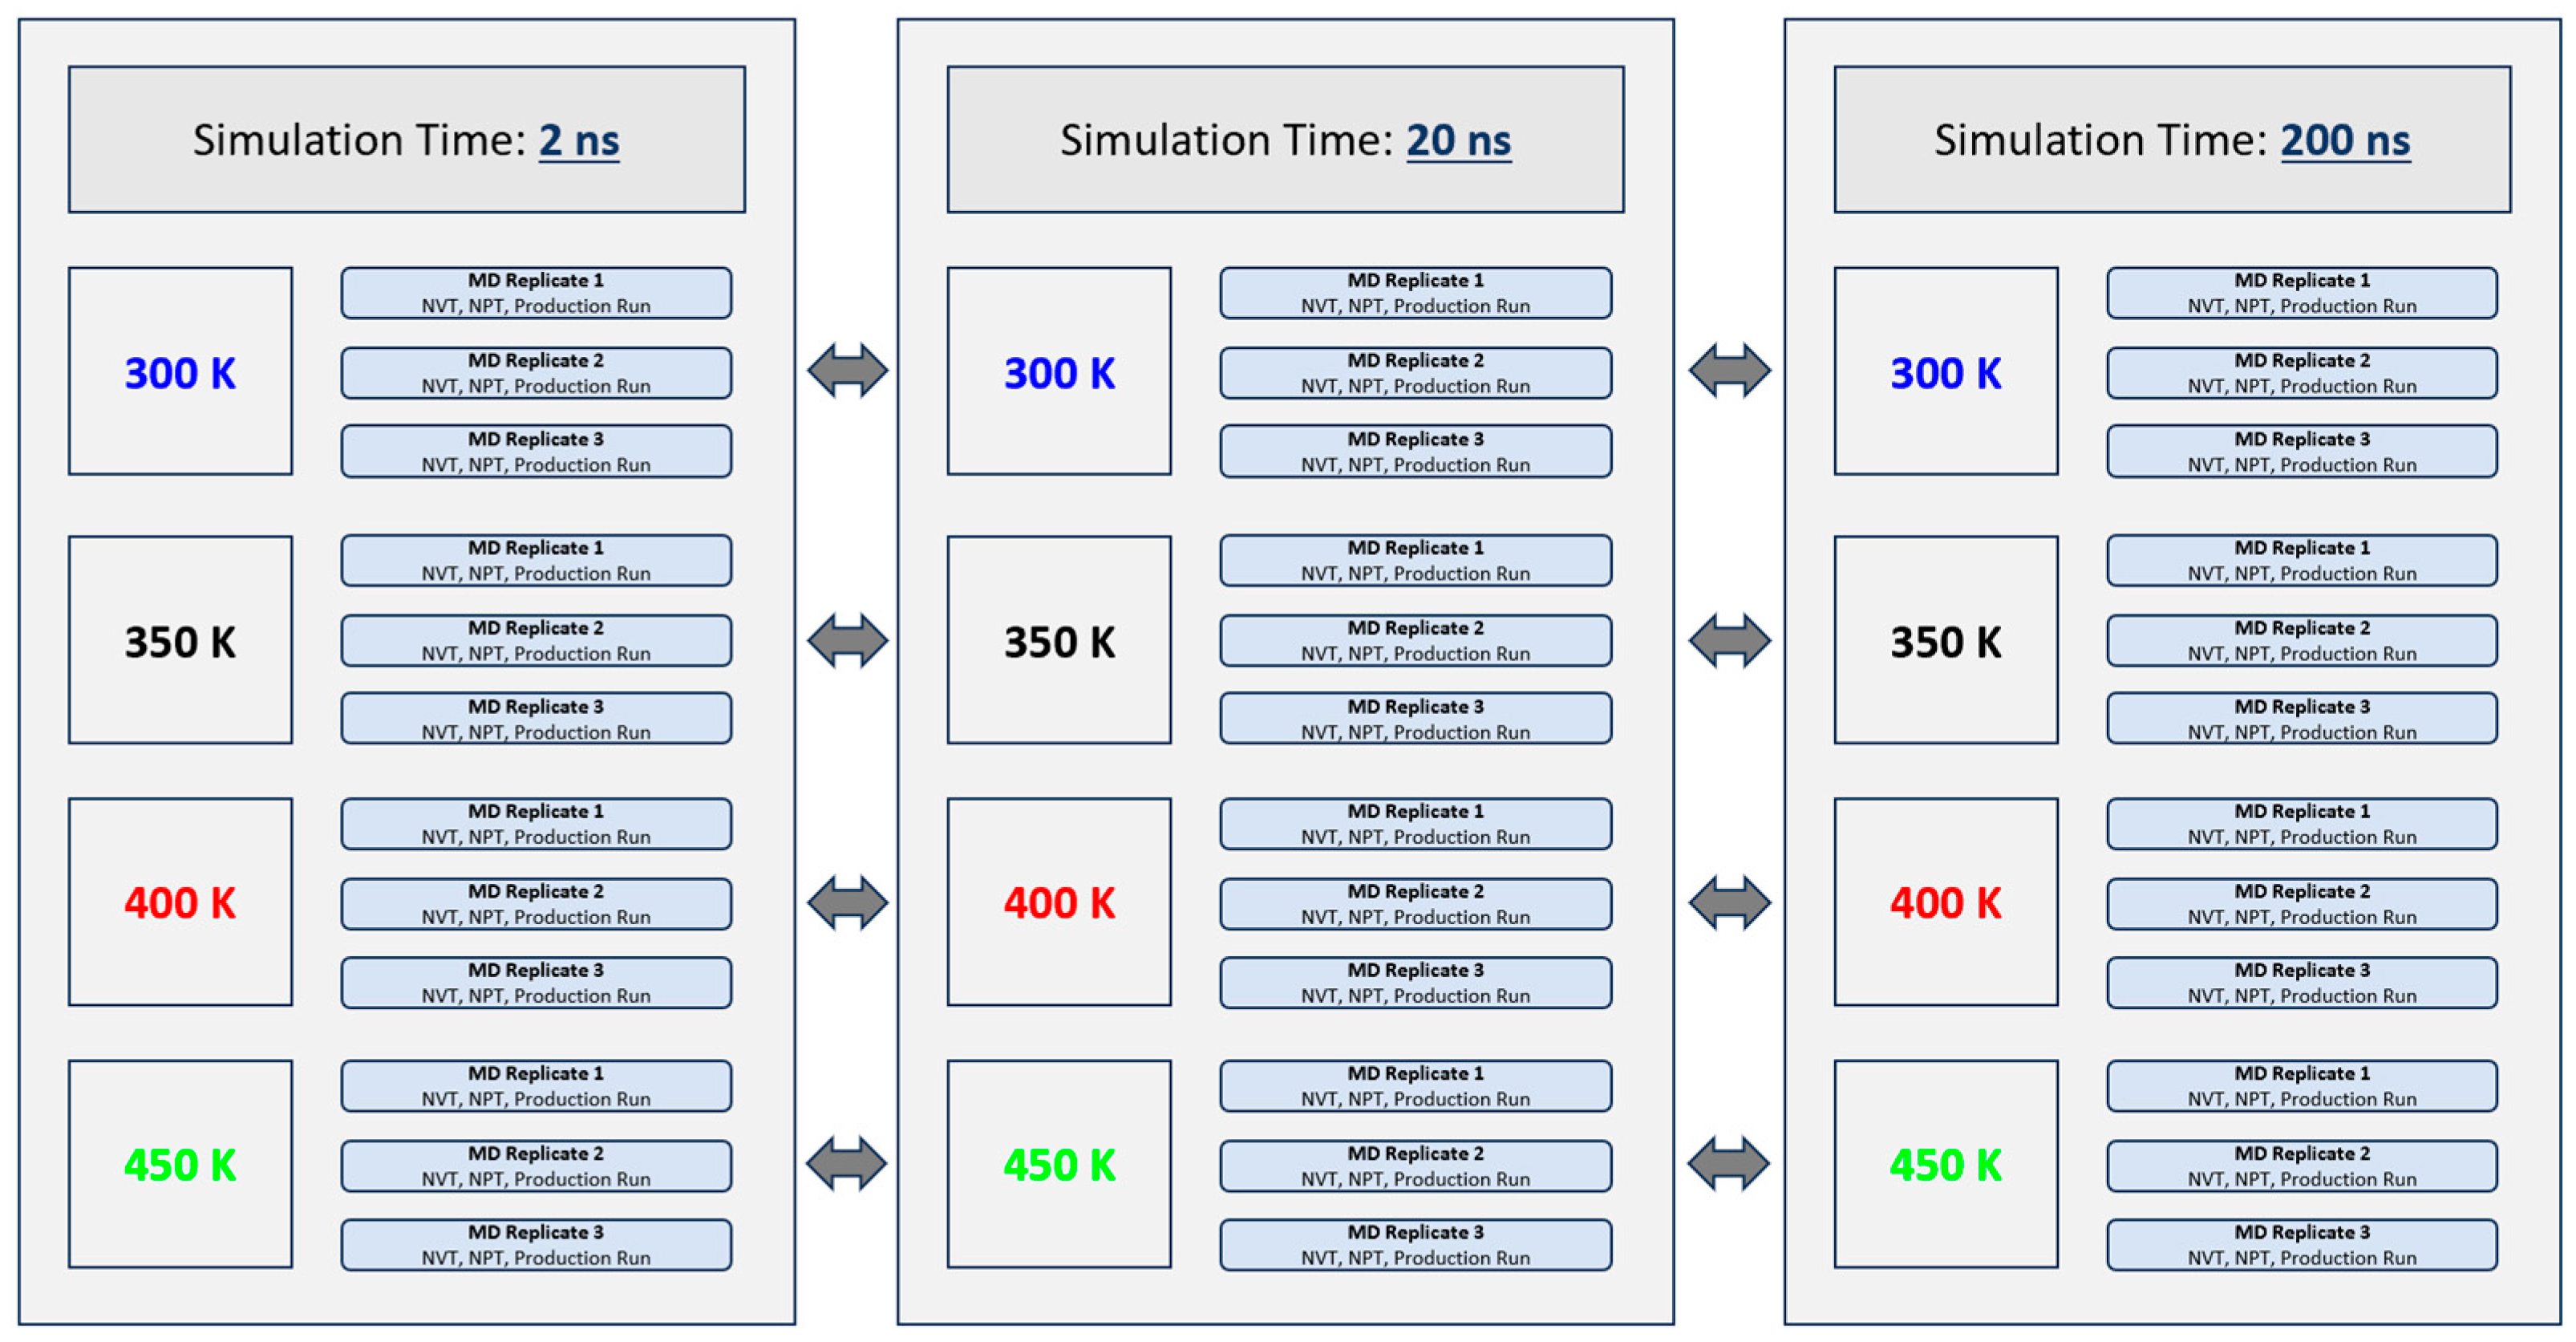
2.1. Molecular Dynamics (MD) Simulations
2.2. Analysis of Molecular Dynamics (MD) Simulations
3. Results and Discussion
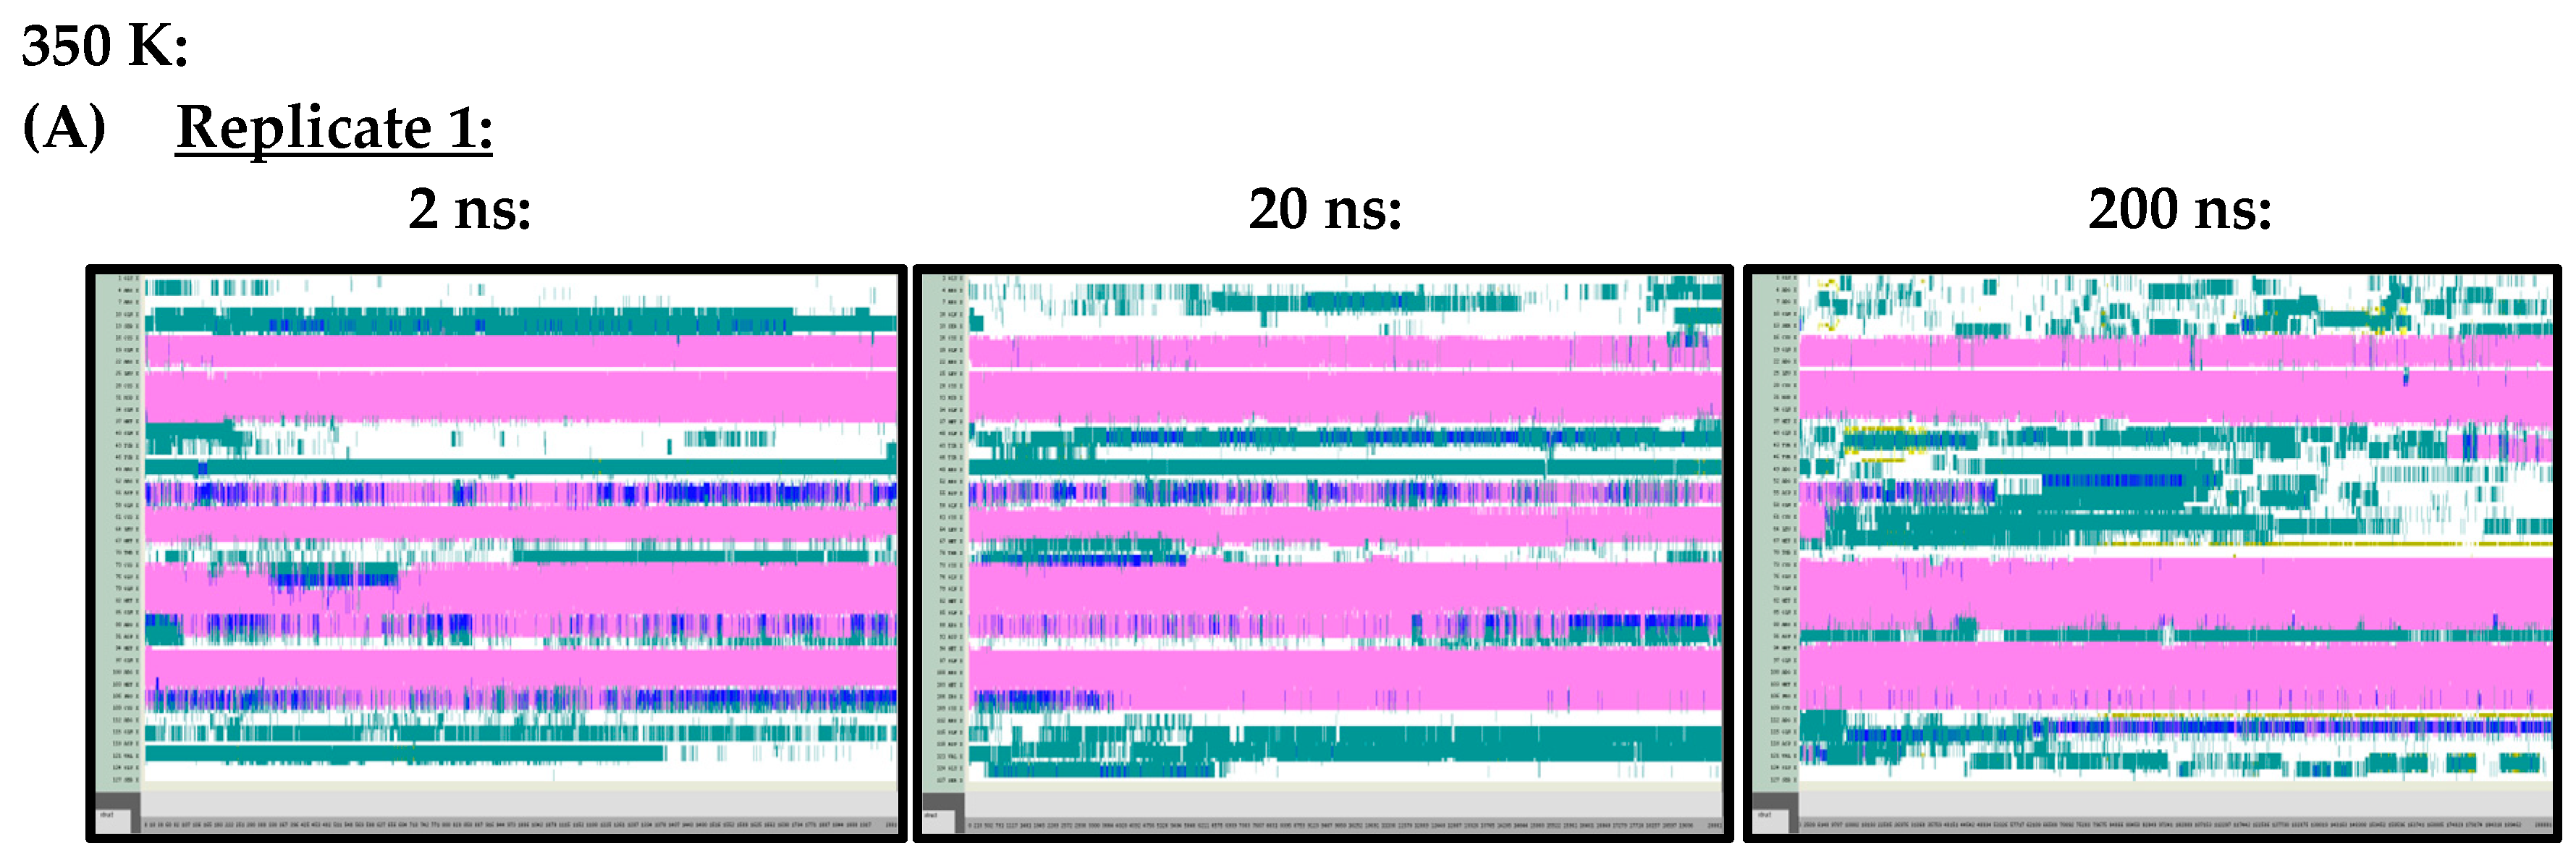
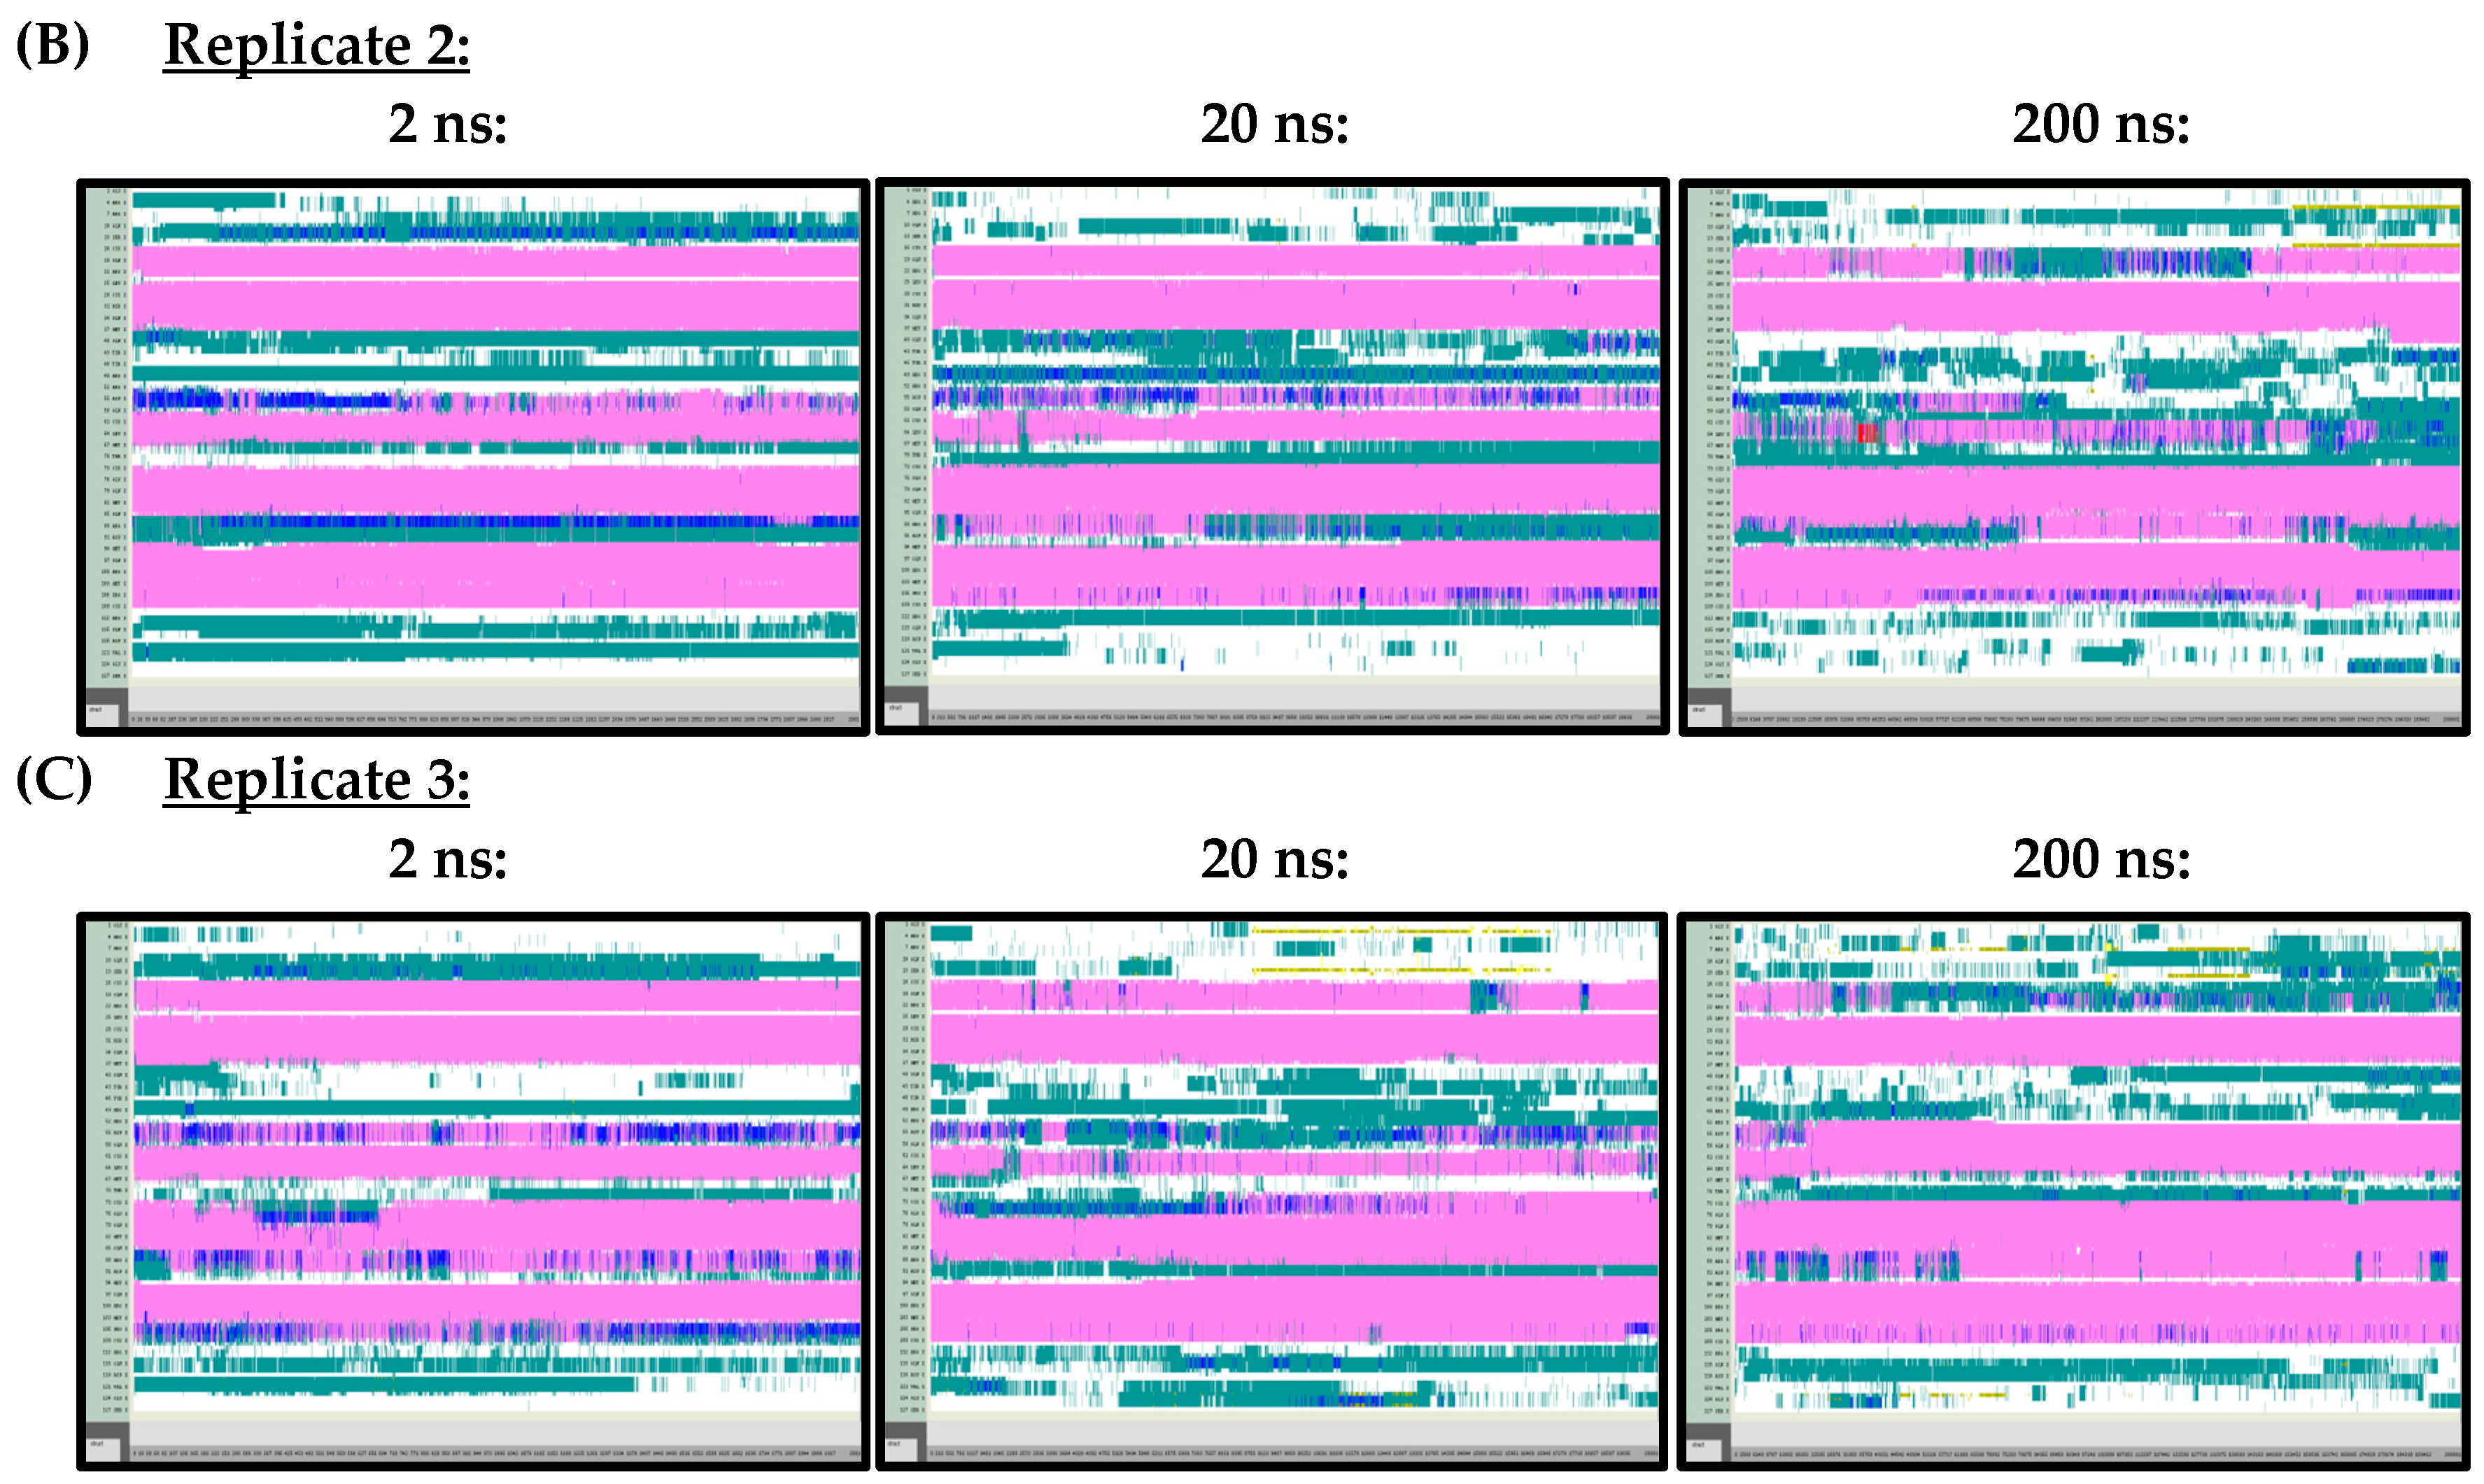
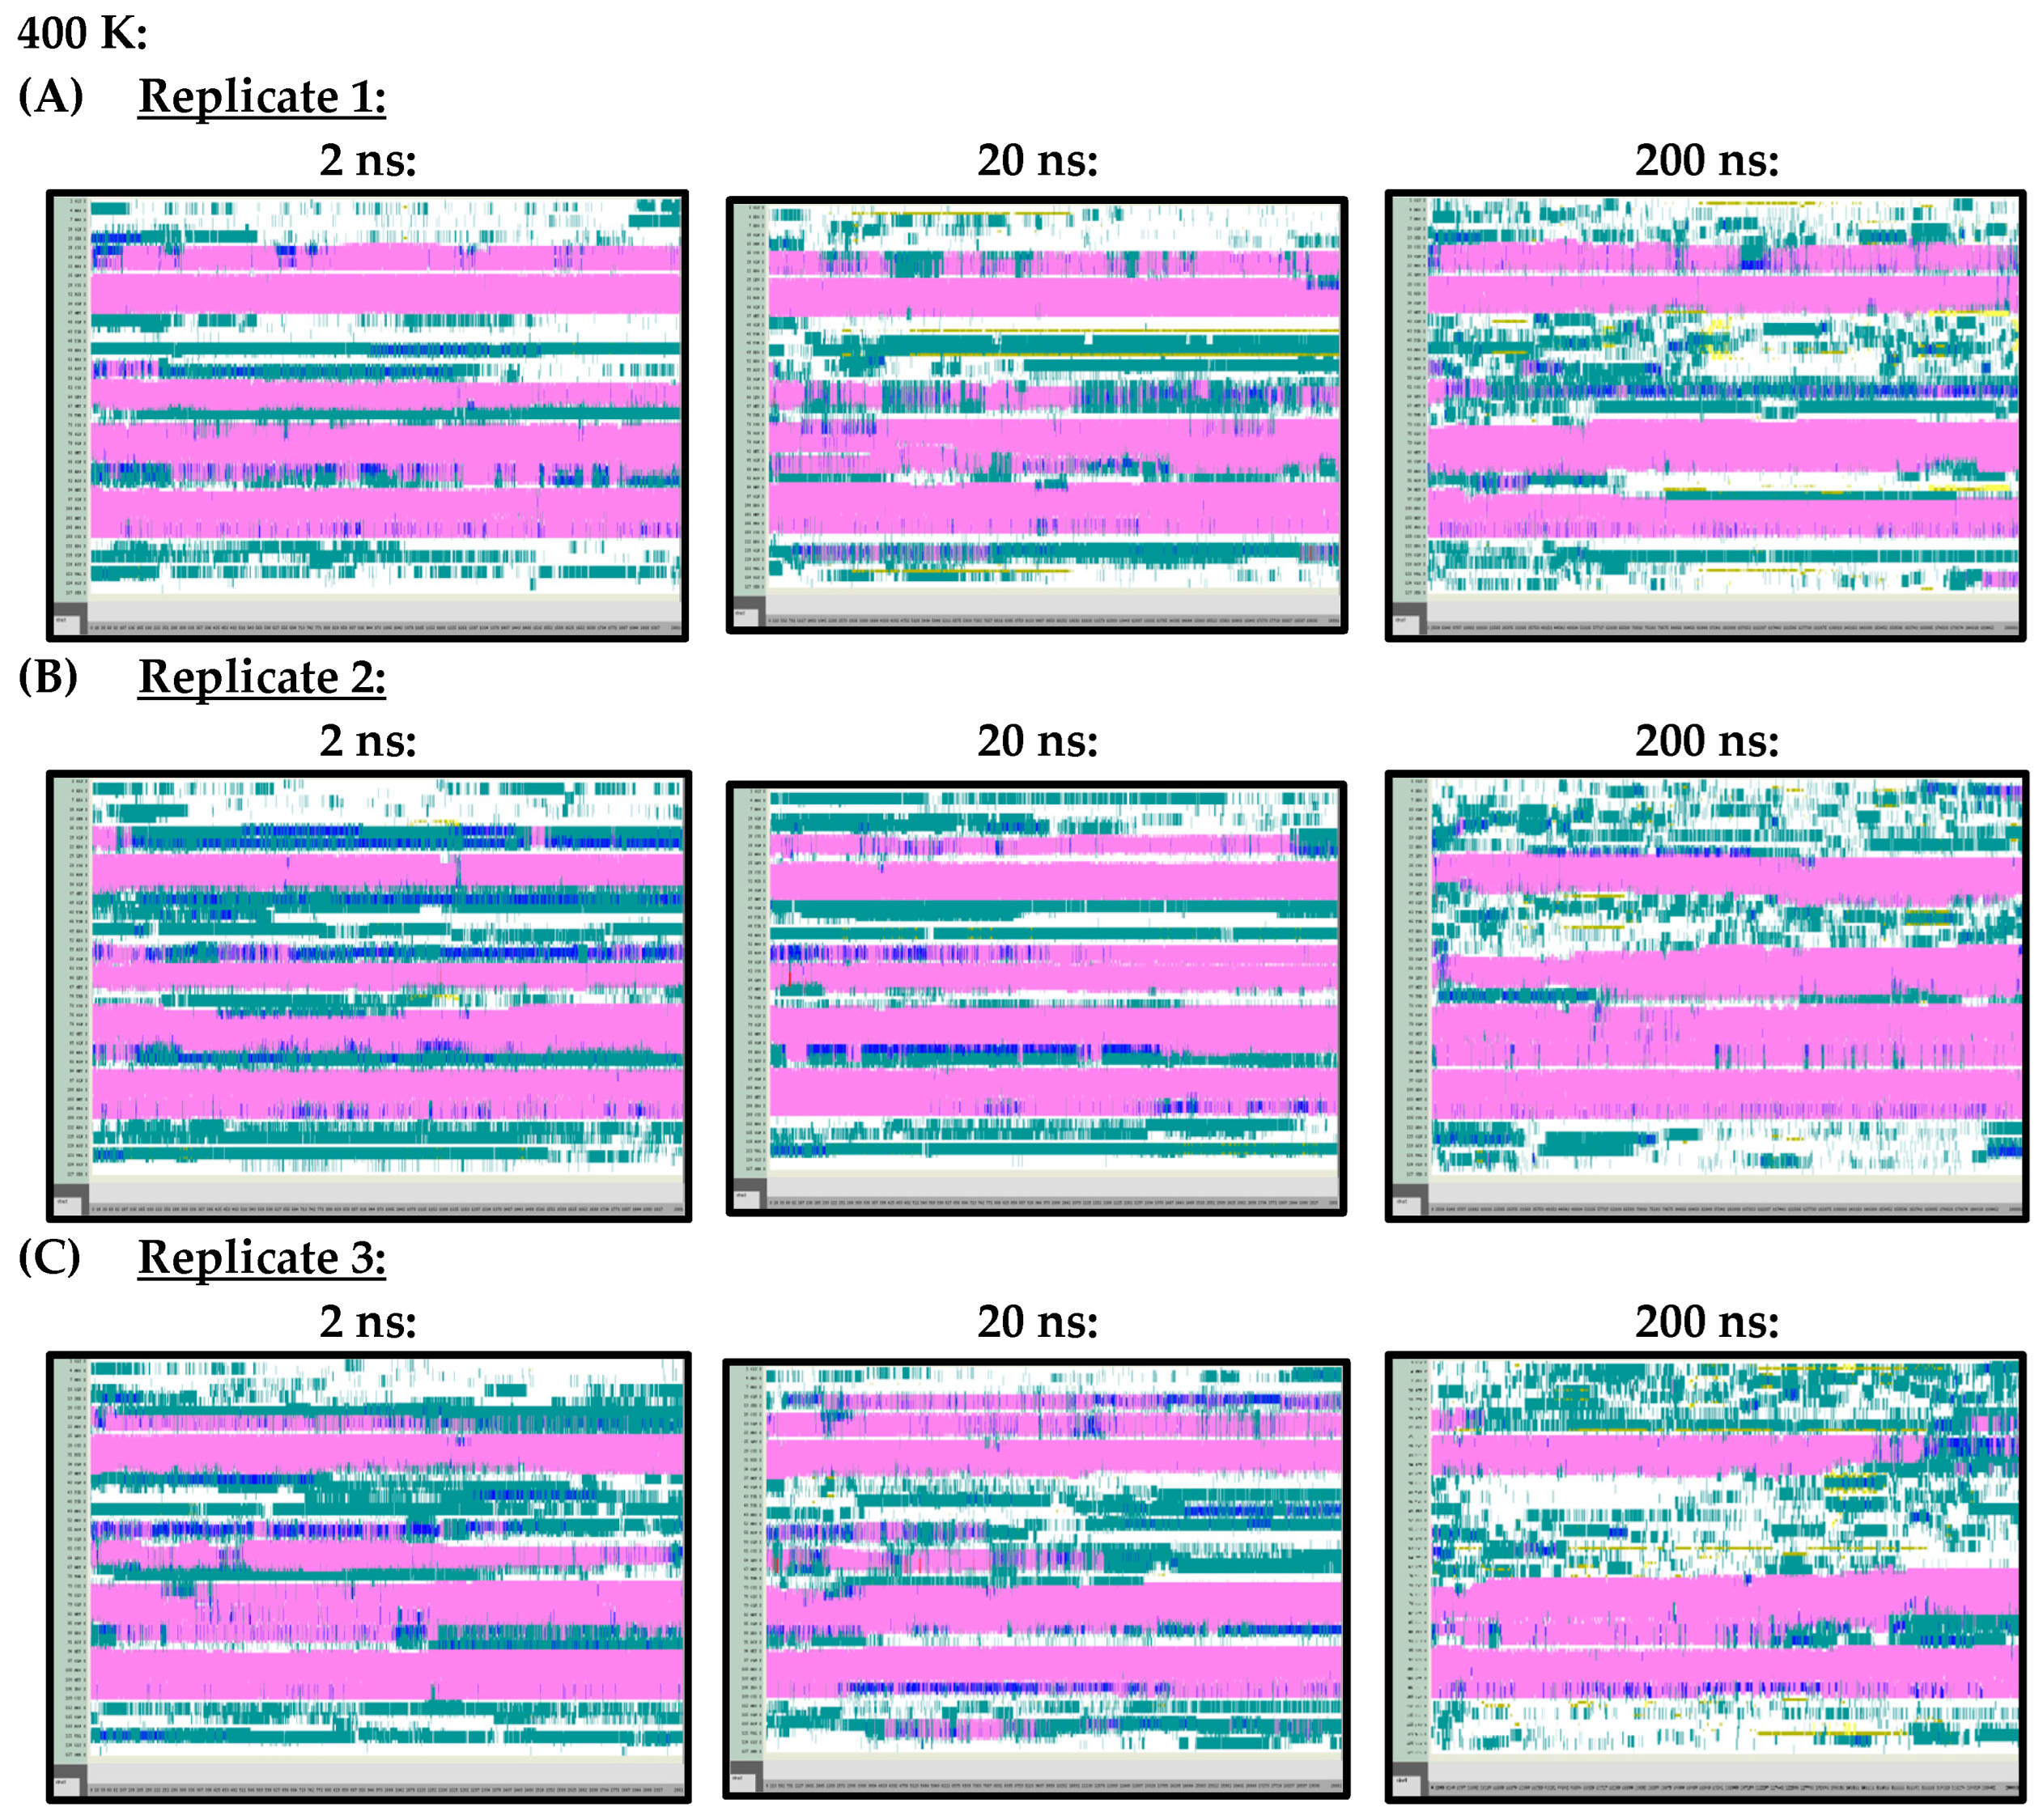
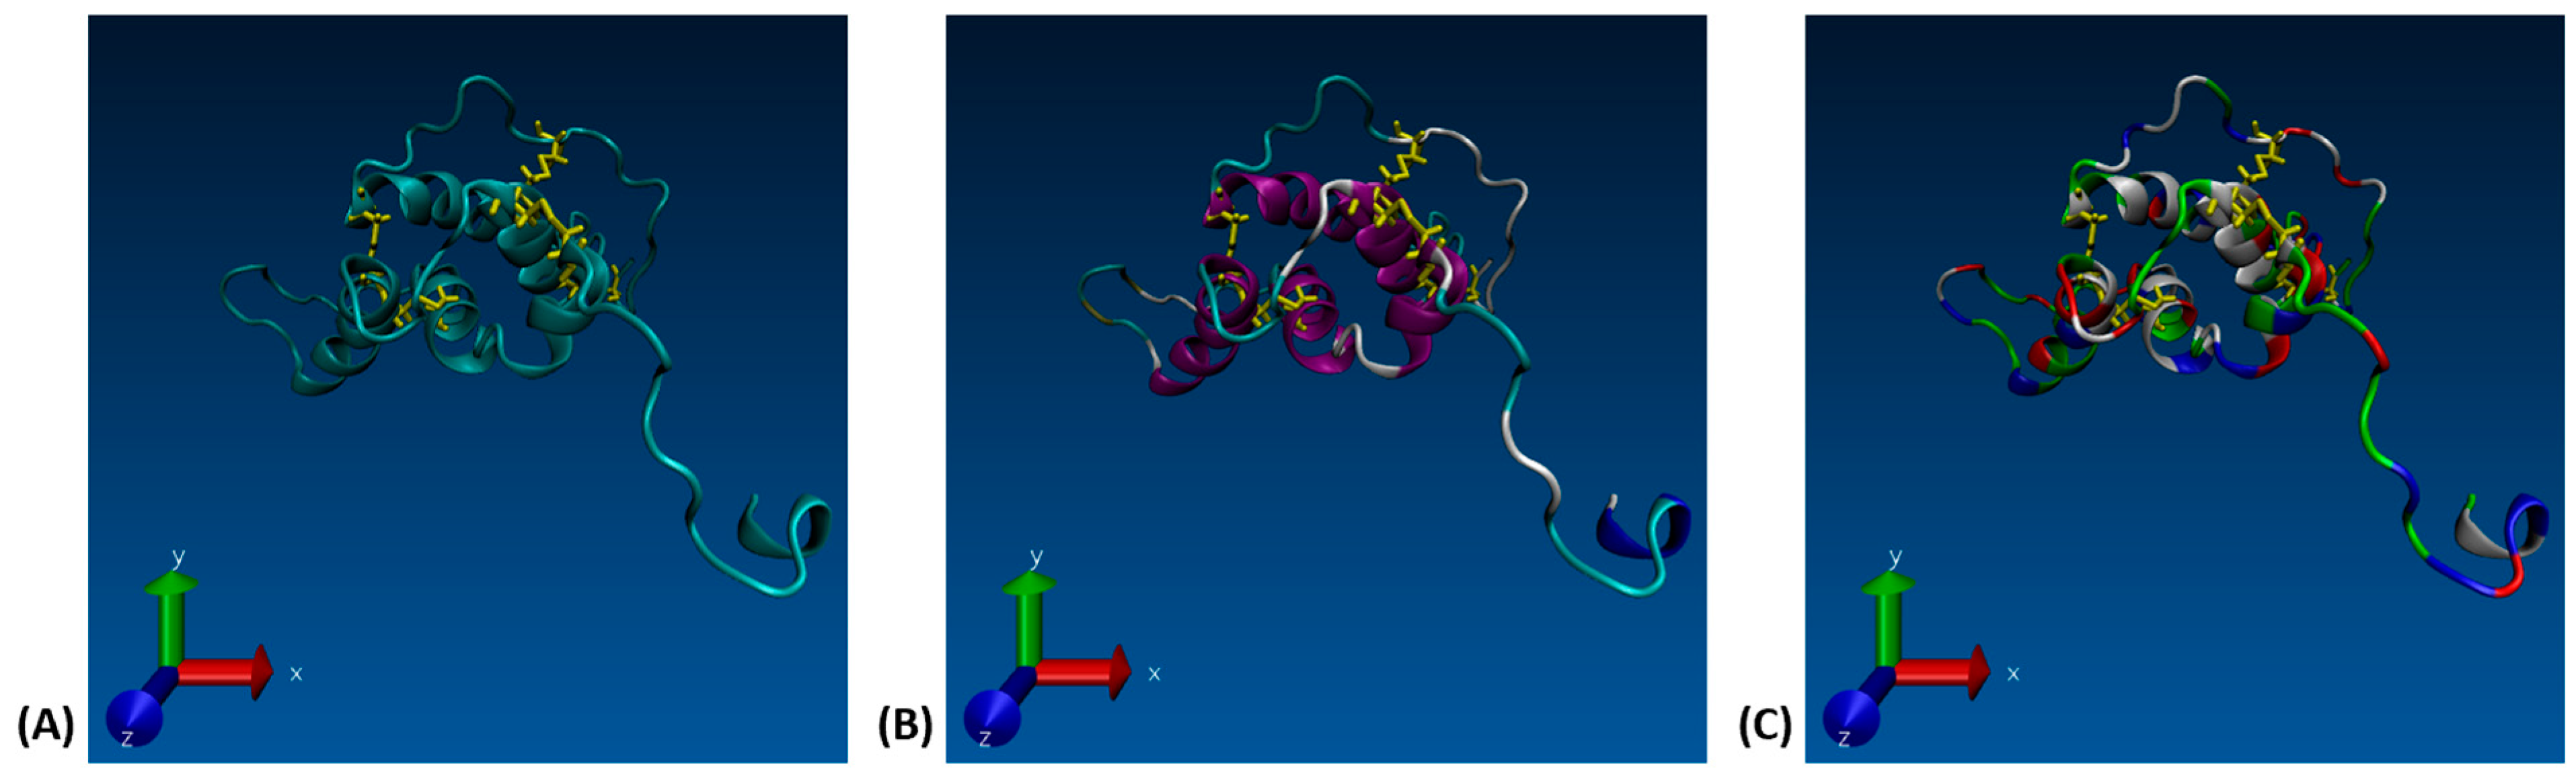
3.1. Secondary Structure Analysis
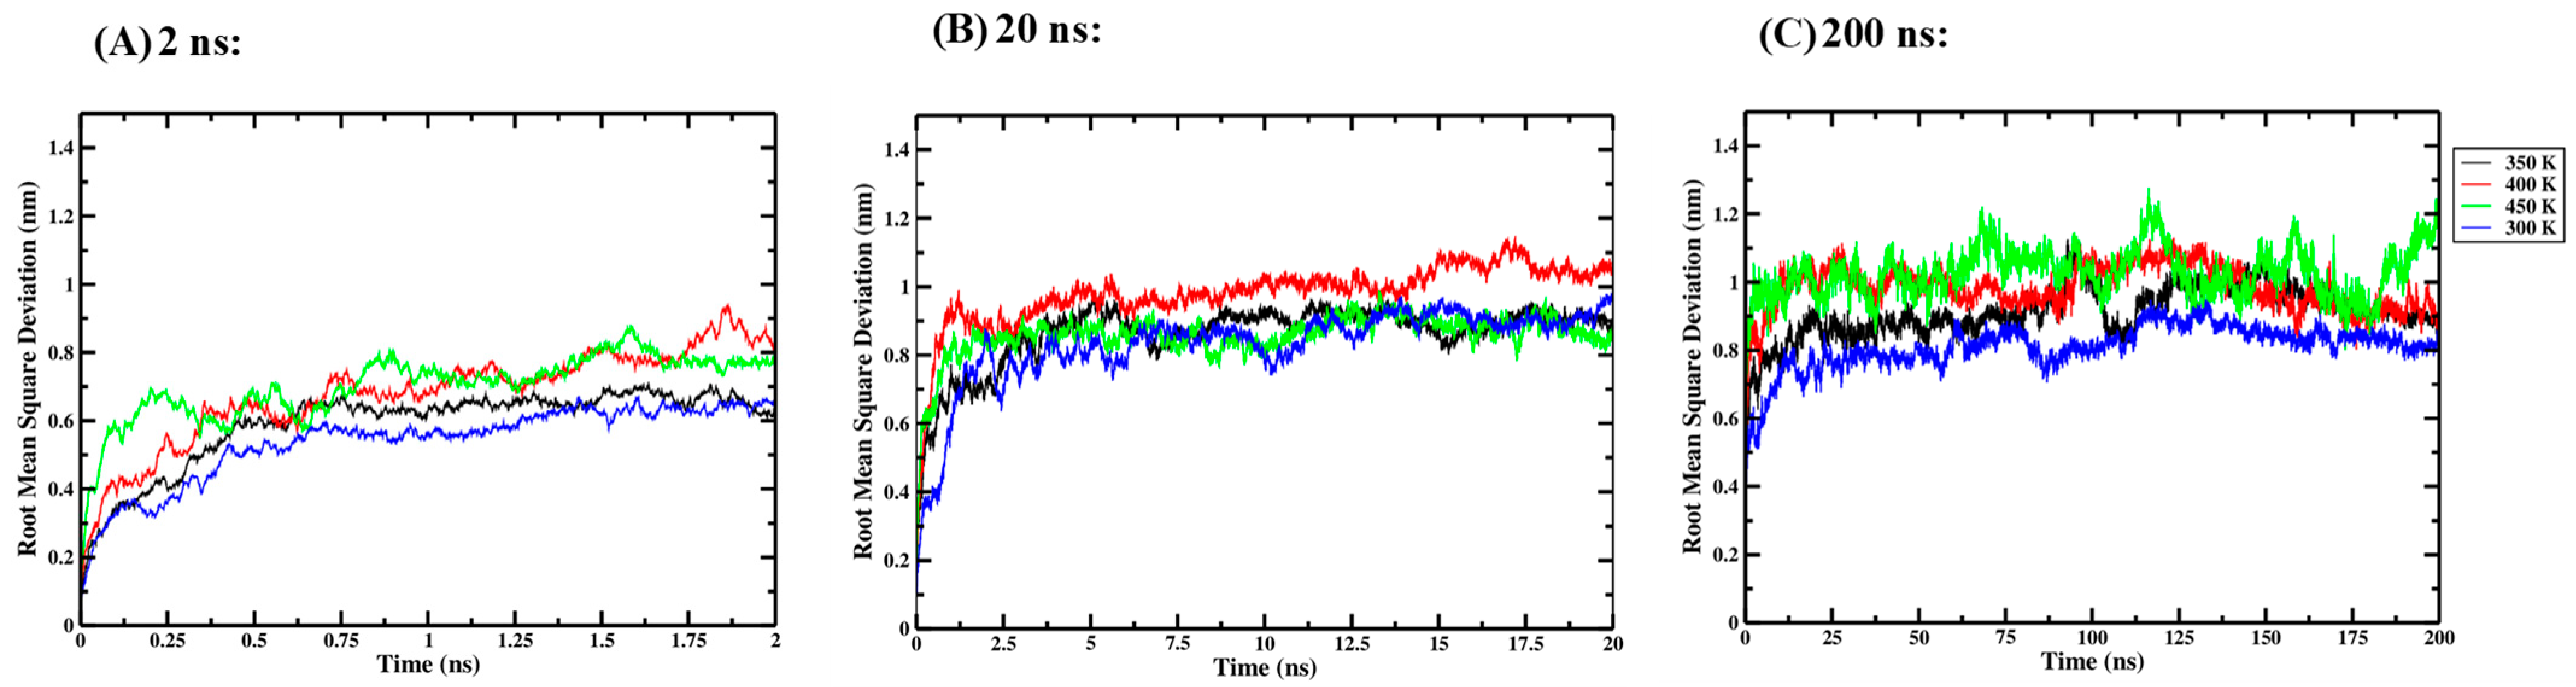
3.2. Root-Mean-Square Deviation (RMSD)
3.2.1. One-Way ANOVA
3.2.2. Two-Way ANOVA
3.3. Root-Mean-Square Fluctuation (RMSF)
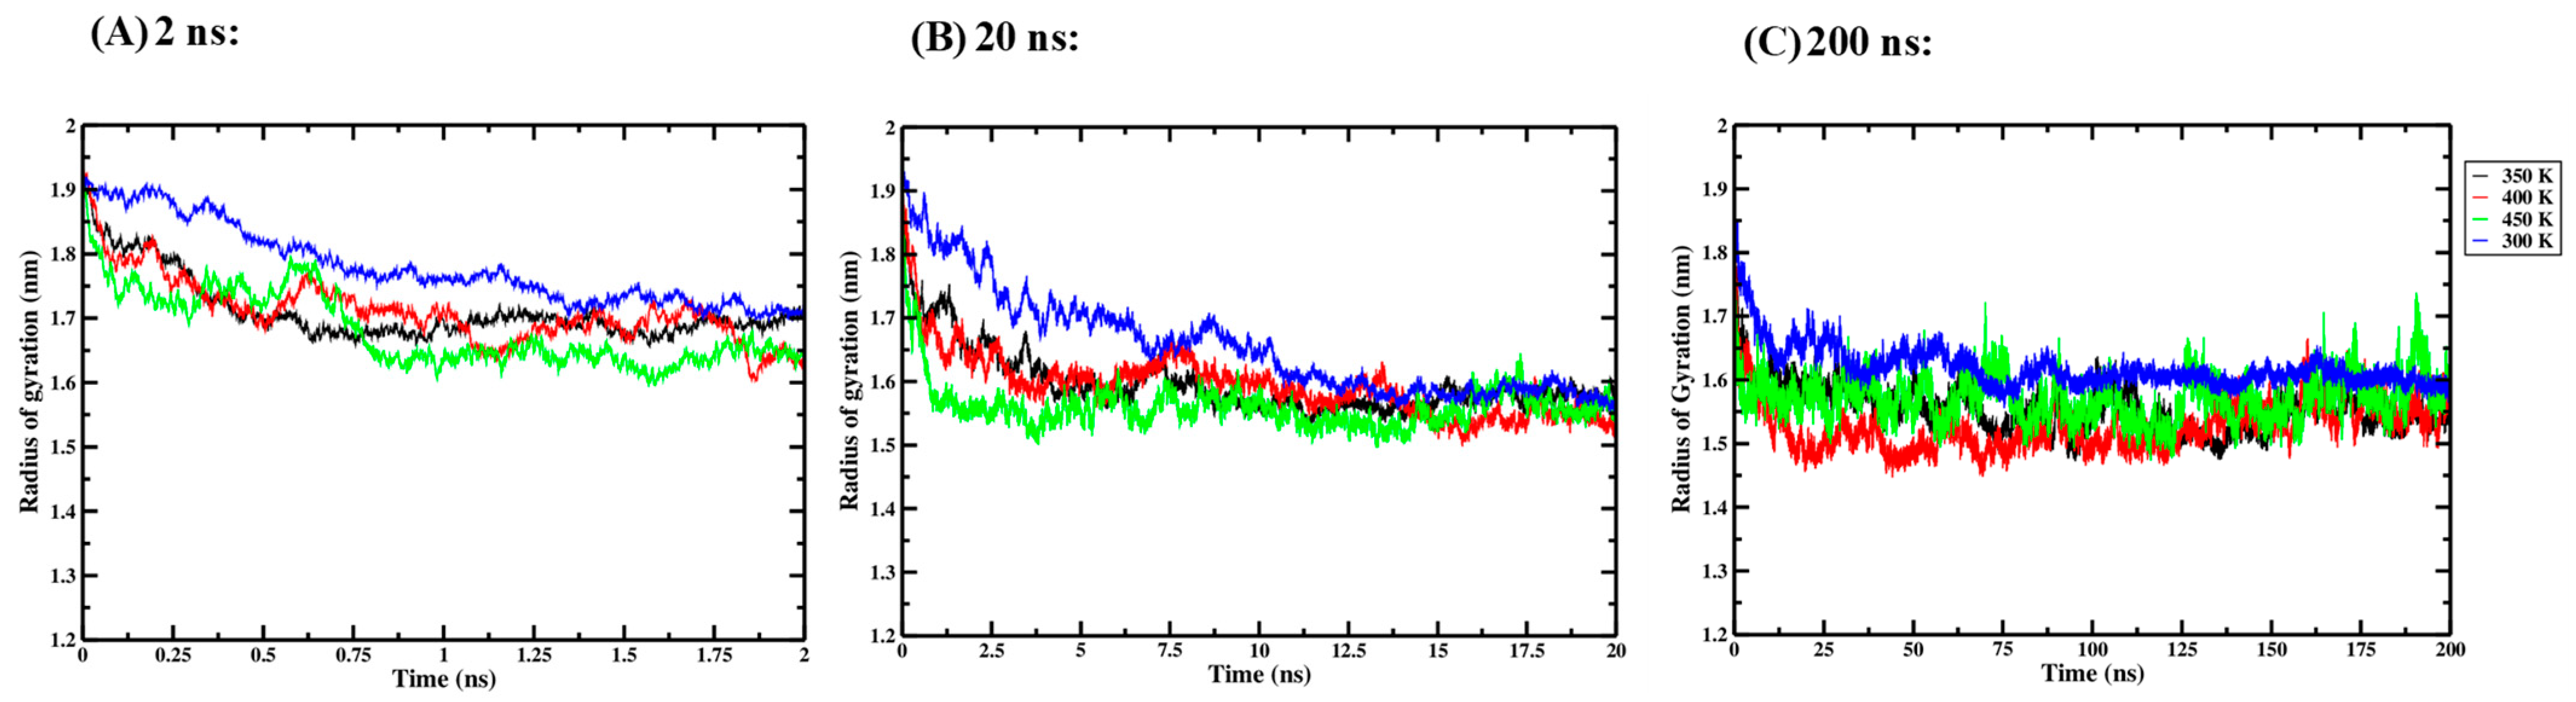
3.4. Radius of Gyration (Rg)
3.4.1. One-Way ANOVA
3.4.2. Two-Way ANOVA
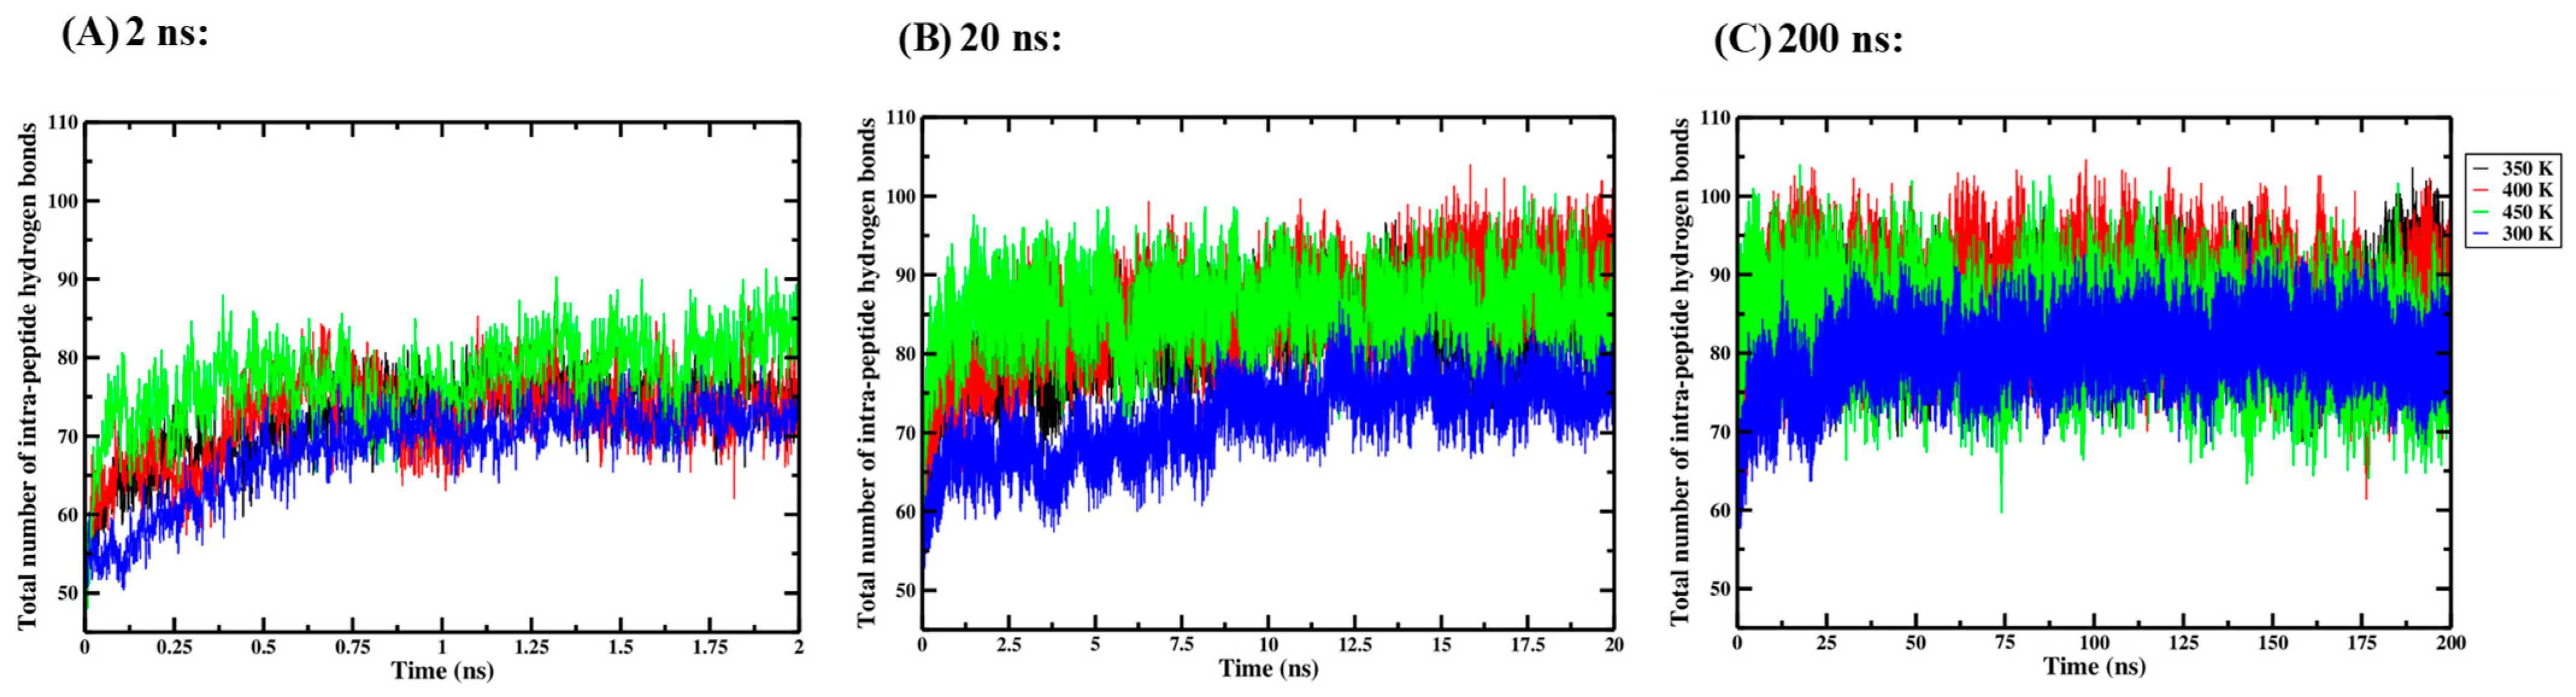
3.5. Intra-Peptide Hydrogen Bonds
3.5.1. One-Way ANOVA
3.5.2. Two-Way ANOVA
3.6. Solvent Accessible Surface Area (SASA)
3.6.1. One-Way ANOVA
3.6.2. Two-Way ANOVA
4. Conclusions
Author Contributions
Funding
Data Availability Statement
Conflicts of Interest
Appendix A

References
- De Vivo, M.; Masetti, M.; Bottegoni, G.; Cavalli, A. Role of molecular dynamics and related methods in drug discovery. J. Med. Chem. 2016, 59, 4035–4061. [Google Scholar] [CrossRef] [PubMed]
- Wan, S.; Sinclair, R.C.; Coveney, P.V. Uncertainty quantification in classical molecular dynamics. Philos. Trans. R. Soc. A Math. Phys. Eng. Sci. 2021, 379, 20200082. [Google Scholar] [CrossRef] [PubMed]
- Vanga, S.K.; Singh, A.; Raghavan, V. Effect of thermal and electric field treatment on the conformation of Ara h 6 peanut protein allergen. Innov. Food Sci. Emerg. Technol. 2015, 30, 79–88. [Google Scholar] [CrossRef]
- Vagadia, B.H.; Vanga, S.K.; Singh, A.; Raghavan, V. Effects of thermal and electric fields on soybean trypsin inhibitor protein: A molecular modelling study. Innov. Food Sci. Emerg. Technol. 2016, 35, 9–20. [Google Scholar] [CrossRef]
- Saxena, R.; Vanga, S.K.; Raghavan, V. Effect of thermal and microwave processing on secondary structure of bovine β-lactoglobulin: A molecular modeling study. J. Food Biochem. 2019, 43, e12898. [Google Scholar] [CrossRef]
- Wang, J.; Vanga, S.K.; Raghavan, V. Structural responses of kiwifruit allergen Act d 2 to thermal and electric field stresses based on molecular dynamics simulations and experiments. Food Funct. 2020, 11, 1373–1384. [Google Scholar] [CrossRef] [PubMed]
- Barazorda-Ccahuana, H.L.; Theiss-De-Rosso, V.; Valencia, D.E.; Gómez, B. Heat-stable hazelnut profilin: Molecular dynamics simulations and immunoinformatics analysis. Polymers 2020, 12, 1742. [Google Scholar] [CrossRef]
- Zhu, Y.; Wang, J.; Vanga, S.K.; Raghavan, V. Visualizing structural changes of egg avidin to thermal and electric field stresses by molecular dynamics simulation. LWT 2021, 151, 112139. [Google Scholar] [CrossRef]
- Dong, M.; Tian, H.; Xu, Y.; Han, M.; Xu, X. Effects of pulsed electric fields on the conformation and gelation properties of myofibrillar proteins isolated from pale, soft, exudative (PSE)-like chicken breast meat: A molecular dynamics study. Food Chem. 2021, 342, 128306. [Google Scholar] [CrossRef] [PubMed]
- Abraham, M.J.; Murtola, T.; Schulz, R.; Páll, S.; Smith, J.C.; Hess, B.; Lindahl, E. GROMACS: High performance molecular simulations through multi-level parallelism from laptops to supercomputers. SoftwareX 2015, 1–2, 19–25. [Google Scholar] [CrossRef]
- Lehmann, K.; Schweimer, K.; Reese, G.; Randow, S.; Suhr, M.; Becker, W.-M.; Vieths, S.; Rösch, P. Structure and stability of 2S albumin-type peanut allergens: Implications for the severity of peanut allergic reactions. Biochem. J. 2006, 395, 463–472. [Google Scholar] [CrossRef]
- Berman, H.M.; Westbrook, J.; Feng, Z.; Gilliland, G.; Bhat, T.N.; Weissig, H.; Shindyalov, I.N.; Bourne, P.E. The Protein Data Bank. Nucleic Acids Res. 2000, 28, 235–242. [Google Scholar] [CrossRef] [PubMed]
- Goddard, T.D.; Huang, C.C.; Meng, E.C.; Pettersen, E.F.; Couch, G.S.; Morris, J.H.; Ferrin, T.E. UCSF ChimeraX: Meeting modern challenges in visualization and analysis. Protein Sci. 2017, 27, 14–25. [Google Scholar] [CrossRef]
- Pettersen, E.F.; Goddard, T.D.; Huang, C.C.; Meng, E.C.; Couch, G.S.; Croll, T.I.; Morris, J.H.; Ferrin, T.E. UCSF ChimeraX: Structure visualization for researchers, educators, and developers. Protein Sci. 2020, 30, 70–82. [Google Scholar] [CrossRef]
- Jo, S.; Kim, T.; Iyer, V.G.; Im, W. CHARMM-GUI: A web-based graphical user interface for CHARMM. J. Comput. Chem. 2008, 29, 1859–1865. [Google Scholar] [CrossRef]
- Brooks, B.R.; Brooks, C.L.; MacKerell, A.D.; Nilsson, L.; Petrella, R.J.; Roux, B.; Won, Y.; Archontis, G.; Bartels, C.; Boresch, S.; et al. CHARMM: The biomolecular simulation program. J. Comput. Chem. 2009, 30, 1545–1614. [Google Scholar] [CrossRef] [PubMed]
- Jo, S.; Cheng, X.; Islam, M.S.; Huang, L.; Rui, H.; Zhu, A.; Lee, H.S.; Qi, Y.; Han, W.; Vanommeslaeghe, K.; et al. CHARMM-GUI PDB manipulator for advanced modeling and simulations of proteins containing non-standard residues. In Biomolecular Modelling and Simulations; KarabenchevaChristova, T., Ed.; Advances in Protein Chemistry and Structural Biology; Elsevier Academic Press Inc.: San Diego, CA, USA, 2014; Volume 96, pp. 235–265. [Google Scholar] [CrossRef]
- Lee, J.; Cheng, X.; Swails, J.M.; Yeom, M.S.; Eastman, P.K.; Lemkul, J.A.; Wei, S.; Buckner, J.; Jeong, J.C.; Qi, Y.; et al. CHARMM-GUI Input Generator for NAMD, GROMACS, AMBER, OpenMM, and CHARMM/OpenMM Simulations Using the CHARMM36 Additive Force Field. J. Chem. Theory Comput. 2016, 12, 405–413. [Google Scholar] [CrossRef] [PubMed]
- Park, S.-J.; Kern, N.; Brown, T.; Lee, J.; Im, W. Charmm-gui pdb manipulator: Various pdb structural modifications for biomolecular modeling and simulation. J. Mol. Biol. 2023, 435, 167995. [Google Scholar] [CrossRef] [PubMed]
- Bekker, H.; Berendsen, H.J.C.; Dijkstra, E.J.; Achterop, S.; van Drunen, R.; van der Spoel, D.; Sijbers, A.; Keegstra, H.; Reitsma, B.; Renardus, M.K.R. Gromacs: A parallel computer for molecular dynamics simulations. Phys. Comput. 1993, 92, 252–256. [Google Scholar]
- Berendsen, H.J.C.; Van Der Spoel, D.; Van Drunen, R. GROMACS: A message-passing parallel molecular dynamics implementation. Comput. Phys. Commun. 1995, 91, 43–56. [Google Scholar] [CrossRef]
- Van Der Spoel, D.; Lindahl, E.; Hess, B.; Groenhof, G.; Mark, A.E.; Berendsen, H.J.C. GROMACS: Fast, flexible, and free. J. Comput. Chem. 2005, 26, 1701–1718. [Google Scholar] [CrossRef] [PubMed]
- Huang, J.; Rauscher, S.; Nawrocki, G.; Ran, T.; Feig, M.; de Groot, B.L.; Grubmüller, H.; MacKerell, A.D. CHARMM36m: An improved force field for folded and intrinsically disordered proteins. Nat. Methods 2016, 14, 71–73. [Google Scholar] [CrossRef] [PubMed]
- Smith, A.; Dong, X.; Raghavan, V. An Overview of Molecular Dynamics Simulation for Food Products and Processes. Processes 2022, 10, 119. [Google Scholar] [CrossRef]
- McDaniel, K.A.; White, B.L.; Dean, L.L.; Sanders, T.H.; Davis, J.P. Compositional and Mechanical Properties of Peanuts Roasted to Equivalent Colors using Different Time/Temperature Combinations. J. Food Sci. 2012, 77, C1293–C1299. [Google Scholar] [CrossRef]
- Shi, X.; Dean, L.O.; Davis, J.P.; Sandeep, K.; Sanders, T.H. The effects of different dry roast parameters on peanut quality using an industrial belt-type roaster simulator. Food Chem. 2018, 240, 974–979. [Google Scholar] [CrossRef]
- Bussi, G.; Donadio, D.; Parrinello, M. Canonical sampling through velocity rescaling. J. Chem. Phys. 2007, 126, 014101. [Google Scholar] [CrossRef] [PubMed]
- Parrinello, M.; Rahman, A. Polymorphic transitions in single crystals: A new molecular dynamics method. J. Appl. Phys. 1981, 52, 7182–7190. [Google Scholar] [CrossRef]
- Darden, T.; York, D.; Pedersen, L. Particle mesh ewald: An n⋅log(n) method for ewald sums in large systems. J. Chem. Phys. 1993, 98, 10089–10092. [Google Scholar] [CrossRef]
- Hess, B.; Bekker, H.; Berendsen, H.J.C.; Fraaije, J.G.E.M. Lincs: A linear constraint solver for molecular simulations. J. Comput. Chem. 1997, 18, 1463–1472. [Google Scholar] [CrossRef]
- Humphrey, W.; Dalke, A.; Schulten, K. VMD: Visual molecular dynamics. J. Mol. Graph. 1996, 14, 33–38. [Google Scholar] [CrossRef] [PubMed]
- Grace Development Team. Grace User’s Guide (for Grace-5.1.25). Weizmann Institute of Science. Retrieved August 28, 2023. 2015. Available online: https://plasma-gate.weizmann.ac.il/Grace/ (accessed on 3 February 2025).
- Frishman, D.; Argos, P. Knowledge-based protein secondary structure assignment. Proteins 1995, 23, 566–579. [Google Scholar] [CrossRef] [PubMed]
- Levene, H. Robust Tests for Equality of Variances. In Contributions to Probability and Statistics; Olkin, I., Ed.; Stanford University Press: Palo Alto, CA, USA, 1960; pp. 278–292. [Google Scholar]
- Shapiro, S.S.; Wilk, M.B. An analysis of variance test for normality (complete samples). Biometrika 1965, 52, 591–611. [Google Scholar] [CrossRef]


| 300 K | 350 K | 400 K | 450 K | ||
|---|---|---|---|---|---|
| 2 ns | Replicate 1, 2 ns 1 | 0.58 ± 0.14 | 0.53 ± 0.10 | 0.60 ± 0.12 | 0.74 ± 0.10 |
| Replicate 2, 2 ns 1 | 0.59 ± 0.13 | 0.66 ± 0.15 | 0.72 ± 0.16 | 0.62 ± 0.10 | |
| Replicate 3, 2 ns 1 | 0.46 ± 0.09 | 0.58 ± 0.12 | 0.71 ± 0.18 | 0.74 ± 0.14 | |
| Shapiro–Wilk Test for Normality | 0.159 | 0.712 | 0.175 | 0.083 | |
| Outliers identified? | No | No | No | No | |
| Levene Test for Equality of Variances | Based on mean: 0.993 Based on median: 1.000 | ||||
| One-way ANOVA | p = 0.075, Not Significant | ||||
| Eta-squared 2 | 0.558 with a 95% C.I. [0.000, 0.708] | ||||
| Average of three replicates, 2 ns | 0.54 ± 0.11 | 0.59 ± 0.12 | 0.68 ± 0.14 | 0.70 ± 0.10 | |
| 20 ns | Replicate 1, 20 ns 1 | 0.90 ± 0.13 | 0.85 ± 0.09 | 0.82 ± 0.07 | 0.82 ± 0.07 |
| Replicate 2, 20 ns 1 | 0.89 ± 0.15 | 1.02 ± 0.16 | 1.20 ± 0.13 | 0.88 ± 0.10 | |
| Replicate 3, 20 ns 1 | 0.70 ± 0.13 | 0.72 ± 0.07 | 0.92 ± 0.12 | 0.88 ± 0.10 | |
| Shapiro–Wilk Test for Normality | 0.130 | 0.912 | 0.463 | 0.099 | |
| Outliers identified? | No | No | No | No | |
| Levene Test for Equality of Variances | Based on mean: 0.182 Based on median: 0.619 | ||||
| One-way ANOVA | p = 0.579, Not Significant | ||||
| Eta-squared 2 | 0.208 with a 95% C.I. [0.000, 0.432] | ||||
| Average of three replicates, 20 ns | 0.83 ± 0.12 | 0.86 ± 0.10 | 0.98 ± 0.10 | 0.86 ± 0.06 | |
| 200 ns | Replicate 1, 200 ns 1 | 0.81 ± 0.09 | 0.94 ± 0.12 | 0.98 ± 0.14 | 1.01 ± 0.11 |
| Replicate 2, 200 ns 1 | 0.83 ± 0.11 | 0.94 ± 0.11 | 0.95 ± 0.10 | 1.03 ± 0.17 | |
| Replicate 3, 200 ns 1 | 0.79 ± 0.07 | 0.84 ± 0.07 | 1.02 ± 0.09 | 1.04 ± 0.11 | |
| Shapiro–Wilk Test for Normality | 0.867 | 0.017 | 0.920 | 0.251 | |
| Outliers identified? | No | No | No | No | |
| Levene Test for Equality of Variances | Based on mean: 0.123 Based on median: 0.813 | ||||
| One-way ANOVA | p < 0.001, Significant | ||||
| Eta-squared 2 | 0.883 with a 95% C.I. [0.469, 0.922] | ||||
| Average of three replicates, 200 ns | 0.81 ± 0.07 | 0.91 ± 0.08 | 0.98 ± 0.07 | 1.03 ± 0.07 | |
| 300 K | 350 K | 400 K | 450 K | |
|---|---|---|---|---|
| Shapiro–Wilk Test for Normality—Time | 2 ns: 0.447 20 ns: 0.122 200 ns: 0.113 | |||
| Shapiro–Wilk Test for Normality—Temperature | 0.372 | 0.547 | 0.954 | 0.488 |
| Outliers identified? (Based on Time) | 2 ns: No 20 ns: 1 outlier 200 ns: No | |||
| Outliers identified? (Based on Temperature) | No | No | No | No |
| Levene Test for Equality of Variances | Based on mean: 0.011 Based on median: 0.685 | |||
| One-way ANOVA—Time | p < 0.001 (Significant), Partial Eta-squared = 0.760 | |||
| One-way ANOVA—Temperature | p = 0.006 (Significant), Partial Eta-squared = 0.398 | |||
| Two-way ANOVA—Time*Temperature | p = 0.632 (Not Significant), Partial Eta-squared = 0.154 | |||
| 300 K | 350 K | 400 K | 450 K | ||
|---|---|---|---|---|---|
| 2 ns | Replicate 1, 2 ns 1 | 1.76 ± 0.08 | 1.72 ± 0.04 | 1.68 ± 0.06 | 1.65 ± 0.04 |
| Replicate 2, 2 ns 1 | 1.78 ± 0.07 | 1.70 ± 0.06 | 1.76 ± 0.07 | 1.70 ± 0.05 | |
| Replicate 3, 2 ns 1 | 1.80 ± 0.05 | 1.71 ± 0.07 | 1.69 ± 0.09 | 1.69 ± 0.12 | |
| Shapiro–Wilk Test for Normality | 0.695 | 0.432 | 0.117 | 0.135 | |
| Outliers identified? | No | No | No | No | |
| Levene Test for Equality of Variances | Based on mean: 0.071 Based on median: 0.821 | ||||
| One-way ANOVA | p = 0.013, Significant | ||||
| Eta-squared 2 | 0.722 with a 95% C.I. [0.069, 0.816] | ||||
| Average of three replicates, 2 ns | 1.78 ± 0.06 | 1.71 ± 0.05 | 1.71 ± 0.05 | 1.68 ± 0.06 | |
| 20 ns | Replicate 1, 20 ns 1 | 1.61 ± 0.07 | 1.54 ± 0.06 | 1.60 ± 0.06 | 1.55 ± 0.04 |
| Replicate 2, 20 ns 1 | 1.67 ± 0.13 | 1.61 ± 0.06 | 1.61 ± 0.05 | 1.53 ± 0.05 | |
| Replicate 3, 20 ns 1 | 1.68 ± 0.09 | 1.65 ± 0.05 | 1.57 ± 0.08 | 1.60 ± 0.06 | |
| Shapiro–Wilk Test for Normality | 0.227 | 0.713 | 0.712 | 0.532 | |
| Outliers identified? | No | No | No | No | |
| Levene Test for Equality of Variances | Based on mean: 0.387 Based on median: 0.777 | ||||
| One-way ANOVA | p = 0.094, Not Significant | ||||
| Eta-squared 2 | 0.532 with a 95% C.I. [0.000, 0.690] | ||||
| Average of three replicates, 20 ns | 1.66 ± 0.08 | 1.60 ± 0.05 | 1.59 ± 0.05 | 1.56 ± 0.04 | |
| 200 ns | Replicate 1, 200 ns 1 | 1.64 ± 0.04 | 1.58 ± 0.06 | 1.51 ± 0.06 | 1.58 ± 0.06 |
| Replicate 2, 200 ns 1 | 1.57 ± 0.05 | 1.58 ± 0.07 | 1.53 ± 0.04 | 1.59 ± 0.07 | |
| Replicate 3, 200 ns 1 | 1.65 ± 0.04 | 1.51 ± 0.05 | 1.54 ± 0.10 | 1.55 ± 0.05 | |
| Shapiro–Wilk Test for Normality | 0.346 | 0.140 | 0.981 | 0.444 | |
| Outliers identified? | No | No | No | No | |
| Levene Test for Equality of Variances | Based on mean: 0.101 Based on median: 0.799 | ||||
| One-way ANOVA | p = 0.040, Significant | ||||
| Eta-squared 2 | 0.627 with a 95% C.I. [0.000, 0.753] | ||||
| Average of three replicates, 200 ns | 1.62 ± 0.03 | 1.56 ± 0.04 | 1.53 ± 0.04 | 1.57 ± 0.04 | |
| 300 K | 350 K | 400 K | 450 K | |
|---|---|---|---|---|
| Shapiro–Wilk Test for Normality—Time | 2 ns: 0.443 20 ns: 0.532 200 ns: 0.419 | |||
| Shapiro–Wilk Test for Normality—Temperature | 0.637 | 0.476 | 0.491 | 0.174 |
| Outliers identified? (Based on Time) | 2 ns: No 20 ns: No 200 ns: No | |||
| Outliers identified? (Based on Temperature) | No | No | No | No |
| Levene Test for Equality of Variances | Based on mean: 0.093 Based on median: 0.967 | |||
| One-way ANOVA—Time | p < 0.001 (Significant), Partial Eta-squared = 0.853 | |||
| One-way ANOVA—Temperature | p < 0.001 (Significant), Partial Eta-squared = 0.585 | |||
| Two-way ANOVA—Time*Temperature | p = 0.511 (Not Significant), Partial Eta-squared = 0.184 | |||
| 300 K | 350 K | 400 K | 450 K | ||
|---|---|---|---|---|---|
| 2 ns | Replicate 1, 2 ns 1 | 69.42 ± 7.53 | 73.98 ± 6.70 | 71.75 ± 8.37 | 79.27 ± 7.90 |
| Replicate 2, 2 ns 1 | 68.45 ± 7.46 | 71.06 ± 6.58 | 73.18 ± 7.09 | 76.69 ± 7.24 | |
| Replicate 3, 2 ns 1 | 67.15 ± 6.23 | 71.41 ± 6.13 | 71.96 ± 6.82 | 75.99 ± 8.18 | |
| Shapiro–Wilk Test for Normality | 0.844 | 0.212 | 0.255 | 0.389 | |
| Outliers identified? | No | No | No | No | |
| Levene Test for Equality of Variances | Based on mean: 0.374 Based on median: 0.899 | ||||
| One-way ANOVA | p < 0.001, Significant | ||||
| Eta-squared 2 | 0.892 with a 95% C.I. [0.499, 0.927] | ||||
| Average of three replicates, 2 ns | 68.34 ± 5.82 | 72.15 ± 4.98 | 72.30 ± 5.30 | 77.32 ± 5.38 | |
| 20 ns | Replicate 1, 20 ns 1 | 71.92 ± 6.30 | 82.18 ± 6.73 | 83.32 ± 9.00 | 90.34 ± 7.62 |
| Replicate 2, 20 ns 1 | 69.78 ± 5.96 | 81.48 ± 6.91 | 81.80 ± 7.74 | 84.84 ± 7.88 | |
| Replicate 3, 20 ns 1 | 73.33 ± 7.22 | 81.18 ± 7.62 | 90.98 ± 9.94 | 81.05 ± 7.25 | |
| Shapiro–Wilk Test for Normality | 0.771 | 0.567 | 0.296 | 0.797 | |
| Outliers identified? | No | No | No | No | |
| Levene Test for Equality of Variances | Based on mean: 0.083 Based on median: 0.485 | ||||
| One-way ANOVA | p = 0.004, Significant | ||||
| Eta-squared 2 | 0.792 with a 95% C.I. [0.202, 0.862] | ||||
| Average of three replicates, 20 ns | 71.68 ± 4.87 | 81.61 ± 4.96 | 85.37 ± 6.00 | 85.41 ± 4.56 | |
| 200 ns | Replicate 1, 200 ns 1 | 79.45 ± 6.68 | 82.45 ± 6.73 | 88.33 ± 7.77 | 84.12 ± 7.91 |
| Replicate 2, 200 ns 1 | 80.90 ± 6.20 | 83.40 ± 7.15 | 88.44 ± 8.25 | 80.26 ± 9.78 | |
| Replicate 3, 200 ns 1 | 79.72 ± 6.26 | 86.75 ± 6.74 | 81.94 ± 8.85 | 84.13 ± 8.50 | |
| Shapiro–Wilk Test for Normality | 0.335 | 0.404 | 0.028 | 0.002 | |
| Outliers identified? | No | No | No | No | |
| Levene Test for Equality of Variances | Based on mean: 0.068 Based on median: 0.850 | ||||
| One-way ANOVA | p = 0.077, Not Significant | ||||
| Eta-squared 2 | 0.555 with a 95% C.I. [0.000, 0.706] | ||||
| Average of three replicates, 200 ns | 80.02 ± 3.98 | 84.20 ± 4.18 | 86.24 ± 4.95 | 82.84 ± 4.82 | |
| 300 K | 350 K | 400 K | 450 K | |
|---|---|---|---|---|
| Shapiro–Wilk Test for Normality—Time | 2 ns: 0.954 20 ns: 0.258 200 ns: 0.259 | |||
| Shapiro–Wilk Test for Normality—Temperature | 0.125 | 0.103 | 0.179 | 0.703 |
| Outliers identified? (Based on Time) | 2 ns: No 20 ns: No 200 ns: No | |||
| Outliers identified? (Based on Temperature) | No | No | No | No |
| Levene Test for Equality of Variances | Based on mean: 0.008 Based on median: 0.797 | |||
| One-way ANOVA—Time | p < 0.001 (Significant), Partial Eta-squared = 0.827 | |||
| One-way ANOVA—Temperature | p < 0.001 (Significant), Partial Eta-squared = 0.715 | |||
| Two-way ANOVA—Time*Temperature | p = 0.009 (Significant), Partial Eta-squared = 0.481 | |||
| 300 K | 350 K | 400 K | 450 K | ||
|---|---|---|---|---|---|
| 2 ns | Replicate 1, 2 ns 1 | 107.68 ± 4.79 | 101.64 ± 3.50 | 101.91 ± 4.47 | 94.61 ± 4.25 |
| Replicate 2, 2 ns 1 | 106.11 ± 5.17 | 101.60 ± 6.14 | 102.88 ± 3.55 | 101.55 ± 4.12 | |
| Replicate 3, 2 ns 1 | 107.36 ± 3.64 | 101.70 ± 4.40 | 100.04 ± 5.47 | 103.09 ± 5.40 | |
| Shapiro–Wilk Test for Normality | 0.159 | 0.712 | 0.175 | 0.083 | |
| Outliers identified? | No | No | No | No | |
| Levene Test for Equality of Variances | Based on mean: 0.009 Based on median: 0.361 | ||||
| One-way ANOVA | p = 0.029, Significant Brown-Forsythe: p = 0.128, Not Significant | ||||
| Eta-squared 2 | 0.658 with a 95% C.I. [0.000, 0.774] | ||||
| Average of three replicates, 2 ns | 107.05 ± 4.12 | 101.64 ± 3.92 | 101.61 ± 3.36 | 99.75 ± 3.54 | |
| 20 ns | Replicate 1, 20 ns 1 | 99.27 ± 4.75 | 88.04 ± 4.60 | 91.22 ± 4.65 | 89.43 ± 4.86 |
| Replicate 2, 20 ns 1 | 99.26 ± 7.02 | 93.78 ± 4.66 | 93.98 ± 4.69 | 89.22 ± 4.44 | |
| Replicate 3, 20 ns 1 | 99.71 ± 5.36 | 96.78 ± 4.73 | 88.90 ± 5.81 | 92.62 ± 4.81 | |
| Shapiro–Wilk Test for Normality | 0.030 | 0.658 | 0.907 | 0.102 | |
| Outliers identified? | No | No | No | No | |
| Levene Test for Equality of Variances | Based on mean: 0.107 Based on median: 0.381 | ||||
| One-way ANOVA | p = 0.015, Significant | ||||
| Eta-squared 2 | 0.713 with a 95% C.I. [0.055, 0.810] | ||||
| Average of three replicates, 20 ns | 99.42 ± 4.93 | 92.86 ± 3.78 | 91.37 ± 3.99 | 90.42 ± 3.22 | |
| 200 ns | Replicate 1, 200 ns 1 | 94.30 ± 4.55 | 90.15 ± 4.67 | 86.79 ± 4.59 | 90.08 ± 4.82 |
| Replicate 2, 200 ns 1 | 92.67 ± 4.56 | 89.73 ± 4.97 | 86.85 ± 4.88 | 93.62 ± 6.77 | |
| Replicate 3, 200 ns 1 | 95.53 ± 3.45 | 85.75 ± 4.29 | 88.74 ± 5.94 | 91.76 ± 5.38 | |
| Shapiro–Wilk Test for Normality | 0.849 | 0.165 | 0.057 | 0.943 | |
| Outliers identified? | No | No | No | No | |
| Levene Test for Equality of Variances | Based on mean: 0.440 Based on median: 0.903 | ||||
| One-way ANOVA | p = 0.006, Significant | ||||
| Eta-squared 2 | 0.775 with a 95% C.I. [0.164, 0.850] | ||||
| Average of three replicates, 200 ns | 94.16 ± 3.31 | 88.54 ± 3.22 | 87.46 ± 3.21 | 91.82 ± 3.22 | |
| 300 K | 350 K | 400 K | 450 K | |
|---|---|---|---|---|
| Shapiro–Wilk Test for Normality—Time | 2 ns: 0.133 20 ns: 0.141 200 ns: 0.796 | |||
| Shapiro–Wilk Test for Normality | 0.243 | 0.171 | 0.091 | 0.060 |
| Outliers identified? (Based on Time) | 2 ns: No 20 ns: No 200 ns: No | |||
| Outliers identified? (Based on Temperature) | No | No | No | 2 outliers |
| Levene Test for Equality of Variances | Based on mean: 0.007 Based on median: 0.603 | |||
| One-way ANOVA—Time | p < 0.001 (Significant), Partial Eta-squared = 0.878 | |||
| One-way ANOVA—Temperature | p < 0.001 (Significant), Partial Eta-squared = 0.673 | |||
| Two-way ANOVA—Time*Temperature | p = 0.179 (Not Significant), Partial Eta-squared = 0.291 | |||
Disclaimer/Publisher’s Note: The statements, opinions and data contained in all publications are solely those of the individual author(s) and contributor(s) and not of MDPI and/or the editor(s). MDPI and/or the editor(s) disclaim responsibility for any injury to people or property resulting from any ideas, methods, instructions or products referred to in the content. |
© 2025 by the authors. Licensee MDPI, Basel, Switzerland. This article is an open access article distributed under the terms and conditions of the Creative Commons Attribution (CC BY) license (https://creativecommons.org/licenses/by/4.0/).
Share and Cite
Smith, A.; Raghavan, V. Statistical Analysis of the Effect of Simulation Time on the Results of Molecular Dynamics Studies of Food Proteins: A Study of the Ara h 6 Peanut Protein. Processes 2025, 13, 581. https://doi.org/10.3390/pr13020581
Smith A, Raghavan V. Statistical Analysis of the Effect of Simulation Time on the Results of Molecular Dynamics Studies of Food Proteins: A Study of the Ara h 6 Peanut Protein. Processes. 2025; 13(2):581. https://doi.org/10.3390/pr13020581
Chicago/Turabian StyleSmith, Andrea, and Vijaya Raghavan. 2025. "Statistical Analysis of the Effect of Simulation Time on the Results of Molecular Dynamics Studies of Food Proteins: A Study of the Ara h 6 Peanut Protein" Processes 13, no. 2: 581. https://doi.org/10.3390/pr13020581
APA StyleSmith, A., & Raghavan, V. (2025). Statistical Analysis of the Effect of Simulation Time on the Results of Molecular Dynamics Studies of Food Proteins: A Study of the Ara h 6 Peanut Protein. Processes, 13(2), 581. https://doi.org/10.3390/pr13020581