Article

Sustainable and Self-Sufficient Fresh Water Through MED Desalination Powered by a CPV-T Solar Hybrid Collector: A Numerical and Experimental Study

1
Institute of Electrical Measurement and Sensor Systems, Graz University of Technology, 8010 Graz, Austria
2
Institute of Thermal Engineering, Graz University of Technology, 8010 Graz, Austria
*
Author to whom correspondence should be addressed.
Processes 2024, 12(12), 2732; https://doi.org/10.3390/pr12122732
Submission received: 10 October 2024 / Revised: 22 November 2024 / Accepted: 27 November 2024 / Published: 2 December 2024
(This article belongs to the Special Issue Solar Technologies and Photovoltaic Systems)

Abstract

:
The effects of global warming are severely recognizable and, according to the OECD, 47% of the world’s population will soon live in regions with insufficient drinking water. Already, many countries depend on desalination for fresh water supply, but such facilities are often powered by fossil fuels. This paper presents an energy self-sufficient desalination system that runs entirely on solar power. Sunlight is harvested using parabolic trough collectors with an effective aperture area of 1.5 m × 0.98 m and a theoretical concentration ratio of 150 suns, in which a concentrator photovoltaic thermal (CPV-T) hybrid-absorber converts the radiation to electricity and heat. This co-generated energy runs a multi-effect distillation (MED) plant, whereby the waste heat of multi-junction concentrator solar cells is used in the desalination process. This concept also takes advantage of synergy effects of optical elements (i.e., mirrors), resulting in a cost reduction of solar co-generation compared to the state of the art, while at the same time increasing the overall efficiency to ~75% (consisting of an electrical efficiency of 26.8% with a concurrent thermal efficiency of 48.8%). Key components such as the parabolic trough hybrid absorber were built and characterized by real-world tests. Finally, results of system simulations, including fresh water output depending on different weather conditions, degree of autonomy, required energy storage for off-grid operation etc. are presented. Simulation results revealed that it is possible to desalinate around 2,000,000 L of seawater per year with a 260 m2 plant and 75 m3 of thermal storage.

1. Introduction

Our Earth is often referred to as the “Blue Planet”, but in fact only about 0.5% of the global water resources are usable fresh water [1]. As of 2015, 25% of the population had already been lacking secure access to drinking water and more than 80 countries faced water scarcity, posing a serious obstacle to their economic development [2]. According to a 2022 study published by the United Nations Convention to Combat Desertification (UNCCD), an estimated 55 million people globally are directly affected by droughts every year, making it the most serious hazard to livestock and crops in nearly every part of the world [3]. This situation is expected to even worsen in the coming years due to greenhouse gas–induced climate change, as meteorological variability increases and droughts also become more frequent [4]. In particular, oil-rich but fresh water-poor regions such as the Middle East (Saudi Arabia, the United Emirates and Kuwait) are already dependent on desalination plants for their drinking water supply. The main problem with the production of fresh water by desalination plants is the high specific energy consumption, which has so far been covered mainly by fossil fuels. Although this approach suits regions with little natural drinking water, but mostly rich in fossil fuel resources, it clearly counteracts current climate change targets. To make matters worse, many countries depend on energy imports, especially oil and gas, and are hence vulnerable to market fluctuation or severe political events, as the recent war between Russia and Ukraine demonstrates [5].

1.1. Motivation

Achieving independence from fossil fuels in energy generation is considered an imperative step for reaching climate change targets. Even though some Western industrialized countries such as Austria, for example, have a relatively high share of renewable sources for electricity generation with about 69% due to terrain well suited for hydro power [6], it is still not only necessary to further increase this percentage, but also to decarbonize domestic heating and industrial process heat.
Despite rapid technological advancements in the field of sustainable energy generation and rapid global population growth, global per capita CO2 emissions have been growing in nearly every sector in the last three decades, as shown in Figure 1 (left). Furthermore, the Austrian industry, for instance (and vast shares of the EU industry for that matter [7]), depend to around 80% on Russian gas imports [8]. Emancipating many countries from these dependencies while at the same time reducing greenhouse gas (GHG) emissions to achieve climate goals is a complex, yet pressing issue that needs to be tackled.
Numerous studies (e.g., [11] or [12]) have been conducted that are trying to predict the development of global CO2 and GHG emission and they all agree that, despite significant efforts undertaken to transition the energy supply to renewable sources, there will be an above linear increase. As a result of the ever-increasing emissions, weather phenomena are becoming more and more extreme and while some regions are hit by increasingly violent storms and rainfall, drought prevails in other areas of the planet [13] leading to a rising number of people in certain countries unable to access safely managed drinking water, as shown in Figure 1 (right). A thorough statistical study on clean water and sanitation [10] has concluded that:
  • Unsafe water is responsible for 1.2 million deaths each year;
  • 6% of deaths in low-income countries are the result of unsafe water sources;
  • One-in-four people do not have access to safe drinking water;
  • 6% of the world does not have access to an improved water source. (According to the World Health Organization (WHO), improved drinking-water sources are defined as those that are likely to be protected from outside contamination, and from fecal matter in particular.)
Prolonged periods of drought, sometimes lasting for years, affect not only the African continent, but also the Western World, as can be witnessed in regions such as California, Portugal or even Italy [14]. Intensified by extreme population growth, many regions of the world are already experiencing life-threatening drinking water shortages [15]. These two interlinked problems (i.e., water shortage and increasing GHG emissions) have led researchers to address the issue of increasing energy demand and CO2 emissions in desalination, as presented in [16] or [17].
As a partial solution to this problem, this paper presents a sustainable, energy self-sufficient way of generating fresh water from brackish or sea water by deploying a parabolic trough solar collector–based CPV-T hybrid technology in combination with a multi-effect distillation (MED) plant. The system, as sketched out in Figure 2, was developed and selected hardware was manufactured and tested within the project NEWSUN (Nexus of Electricity and Water Supply for Urban Needs) addressing the pressing issues of CO2 emissions and water scarcity simultaneously and accordingly. Furthermore, the proposed technology enables developing countries to reach higher living standards and industrial growth without putting an extreme burden on the environment.
  • Within this publication, the authors provide answers to the following research questions:
  • Can energy self-sufficiency of an MED plant be achieved?
  • What are the design requirements for the hybrid absorber if adjusted to the MED’s energetic needs?
  • What off-the-shelf components are available to design an efficient yet cost-effective system?
  • What thermal and electrical efficiencies can be achieved?
  • Which geographic locations are suitable to deploy this system from a metrological point of view?
  • What is the maximum achievable fresh water output per m2 collector area?
  • How do thermal and electrical energy storage affect these KPIs?
Note that the presented solar co-generation hybrid absorber technology can be used in numerous other industrial and domestic applications apart from desalination, allowing further decarbonization of many industrial sectors ranging from the food to the textile industry (also see Figure 7).

1.2. State of the Art

This chapter is divided into two sections. The Section 1.2.1 describes the state of the art in desalination technologies, while the Section 1.2.2 focuses on solar hybrid CPV-T systems as the main possible energy source for sustainable desalination plants. However, it must be noted that the emphasis of the project presented within this paper lies on the energy supply side, meaning the development of new technologies to provide heat and electricity for an existing MED system by means of solar co-generation.

1.2.1. State of the Art in Seawater Desalination

Desalination is the process of extracting minerals from saline water. Desalination plants have become increasingly important in recent years, as they are one of the few ways to provide drinking water regardless of the geomorphology, climate and weather of a region [18] The physical principle behind the most energy-efficient desalination plants is vacuum distillation. By reducing the ambient pressure, the boiling point of water is lowered and evaporation begins at lower temperatures. The more electrical energy is invested in operating the vacuum pumps, the less thermal energy is required for evaporation, and vice versa. However, there are also facilities based on mechanical filter processes, so the systems can essentially be divided into two categories:
  • Thermal processes, including multi-stage flash (MSF), multi-effect distillation (MED) and mechanical vapor compression (MVC).
  • Mechanical membrane processes, including reverse osmosis (RO) and electro-dialysis (ED), which are limited to brackish water.
According to a market analyses presented in [2], the most widely used process technologies for desalination plants are:
  • Multi-stage flash evaporation (MSF) [19].
  • Reverse osmosis (RO) [20].
  • Multi-effect distillation (MED).
While there are a number of other desalination processes, it is becoming apparent that those three described will have the greatest market opportunities in the future [19].
For a more detailed explanation of the first two processes, please refer to literature references such as [19,20]. The third method, MED, offers the highest thermodynamic efficiency, among other advantages [21], and was therefore selected for the proposed system.

1.2.2. Working Principle of the MED System

Multi-effect distillation (MED) is one of the oldest known desalination principles [21] and offers the highest thermodynamic efficiency [22]. The evaporation process takes place in a chain (series configuration) of evaporators (so-called effects) and also takes advantage of the idea of reducing the vapor pressure by deploying vacuum pumps, which lower the ambient pressure. This allows the saltwater to be evaporated several times in succession without the need to add heat after the first effect stage.
After being heated to around 65~90 °C, the saltwater is fed to the first effect where it reaches the boiling point. The saltwater is thereby sprayed on the surface of the evaporator tubes to accelerate the process. These evaporator tubes are heated by an external energy source, ideally waste heat from a process that generates mechanical or electrical energy, or a renewable energy source such as solar power. Figure 3 shows the first stage of an MED system (an “effect”, or single-effect MED).
It should be noted that only part of the (salt) water mass flow entering the first effect evaporates, the rest is passed on to the next effect stage. The heat of evaporation from the first stage is used to heat the second stage, with the overall efficiency depending on the number of effects (typically 4–20) [23]. The average specific electrical energy demand of MED desalination lies in the range of 1.5–2.5 kWh/m3 of produced fresh water [24]. Some MED systems are known to have been operating reliably for more than 40 years [11], underlining the reliability and robustness of this technology.
  • The general advantages of MED systems can be summarized as follows:
  • Low energy demand compared to other thermal desalination processes;
  • Does not require (chemical) water pretreatment;
  • Tolerant to quality and condition of water supply;
  • Highly reliable, simple system with good scalability;
  • Low operating and maintenance costs;
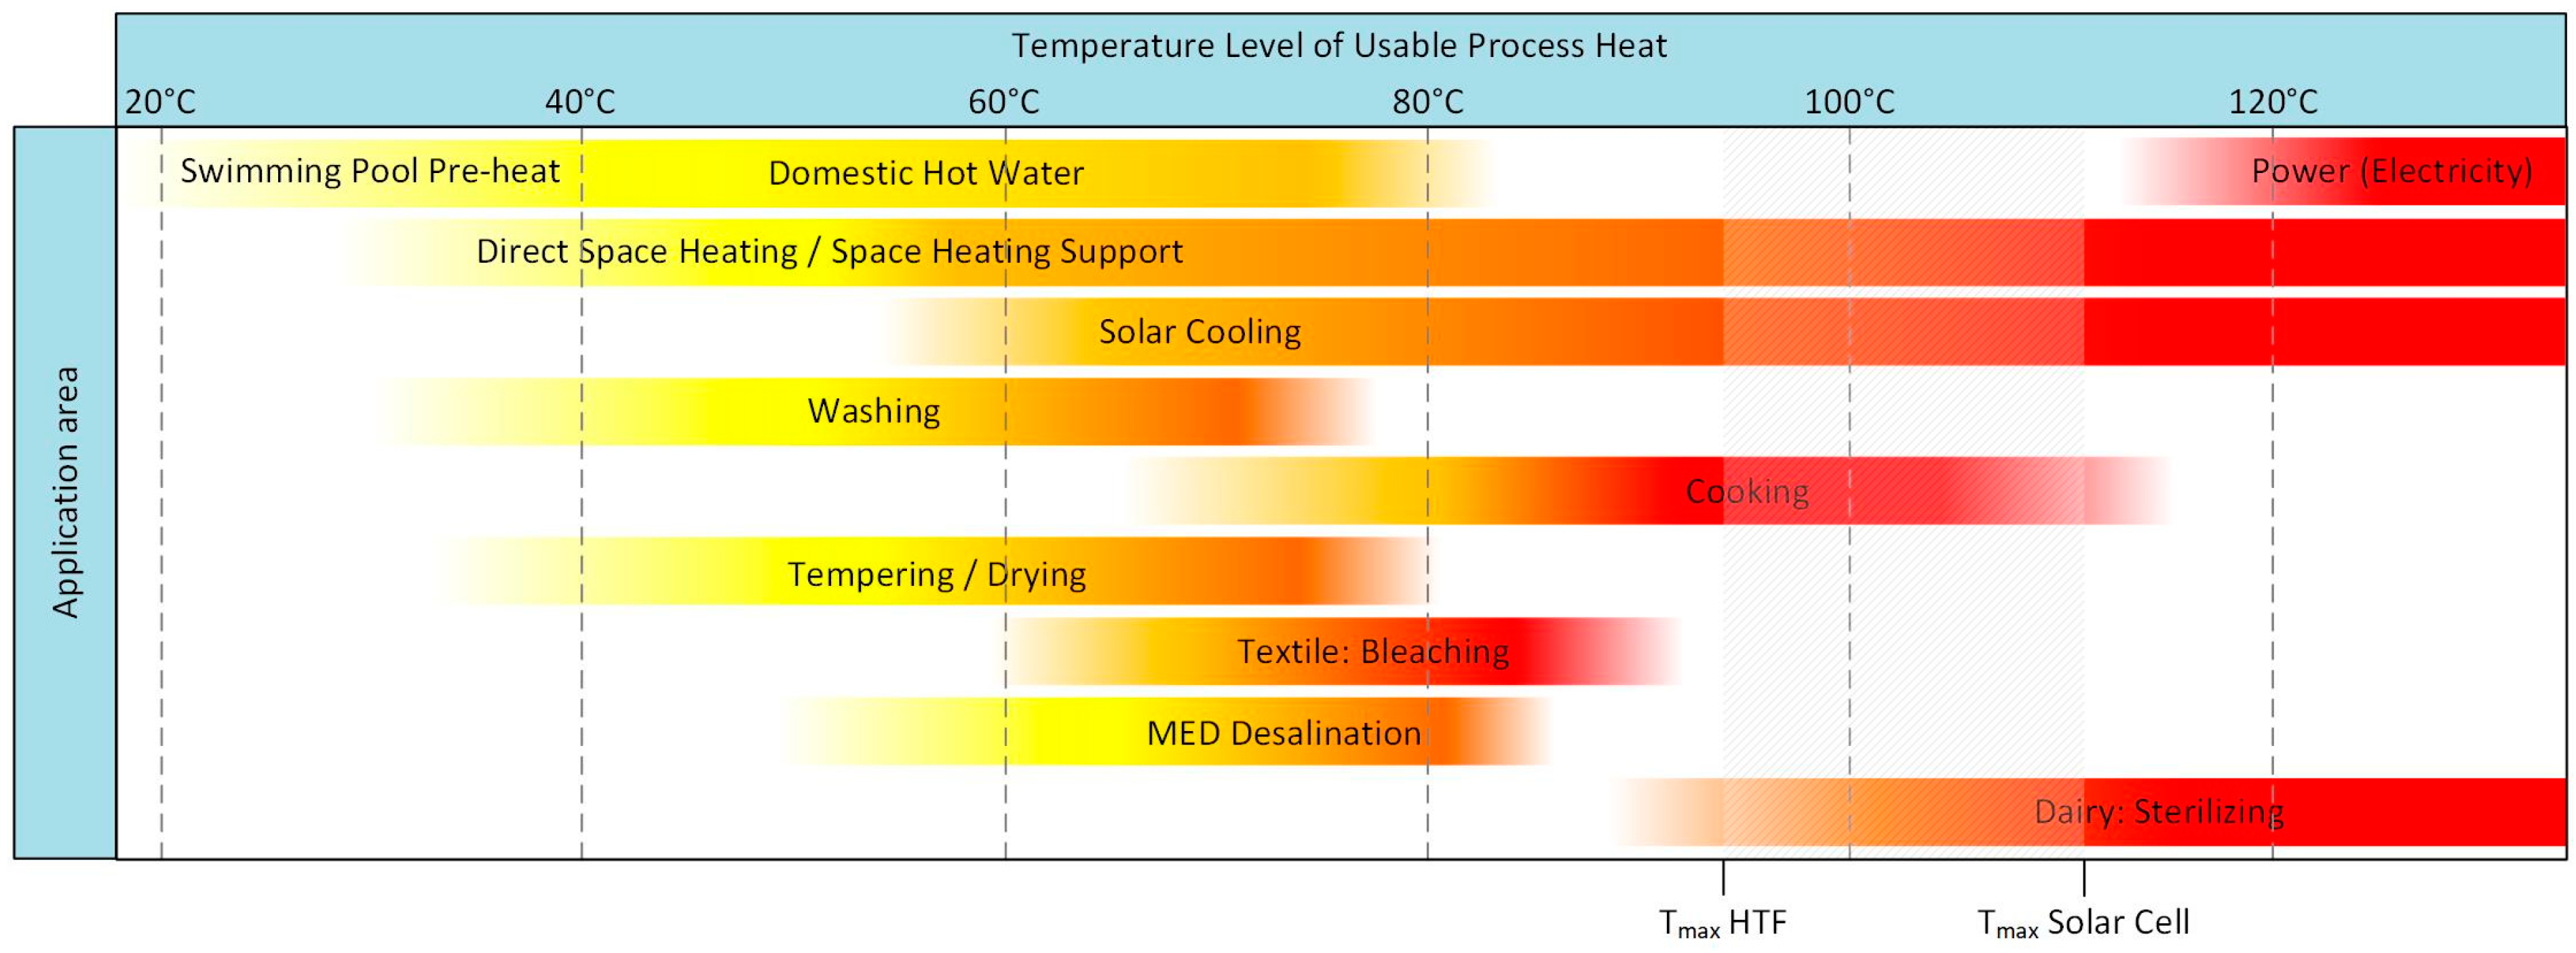
  • Process can be adapted to heat source (process waste heat, solar heat);
  • Advantage of low operating temperature:
    Avoids crust formation on the evaporator;
    Results in low thermal losses in general;
    Allows state of the art CPV-T systems to be used as primary energy source.

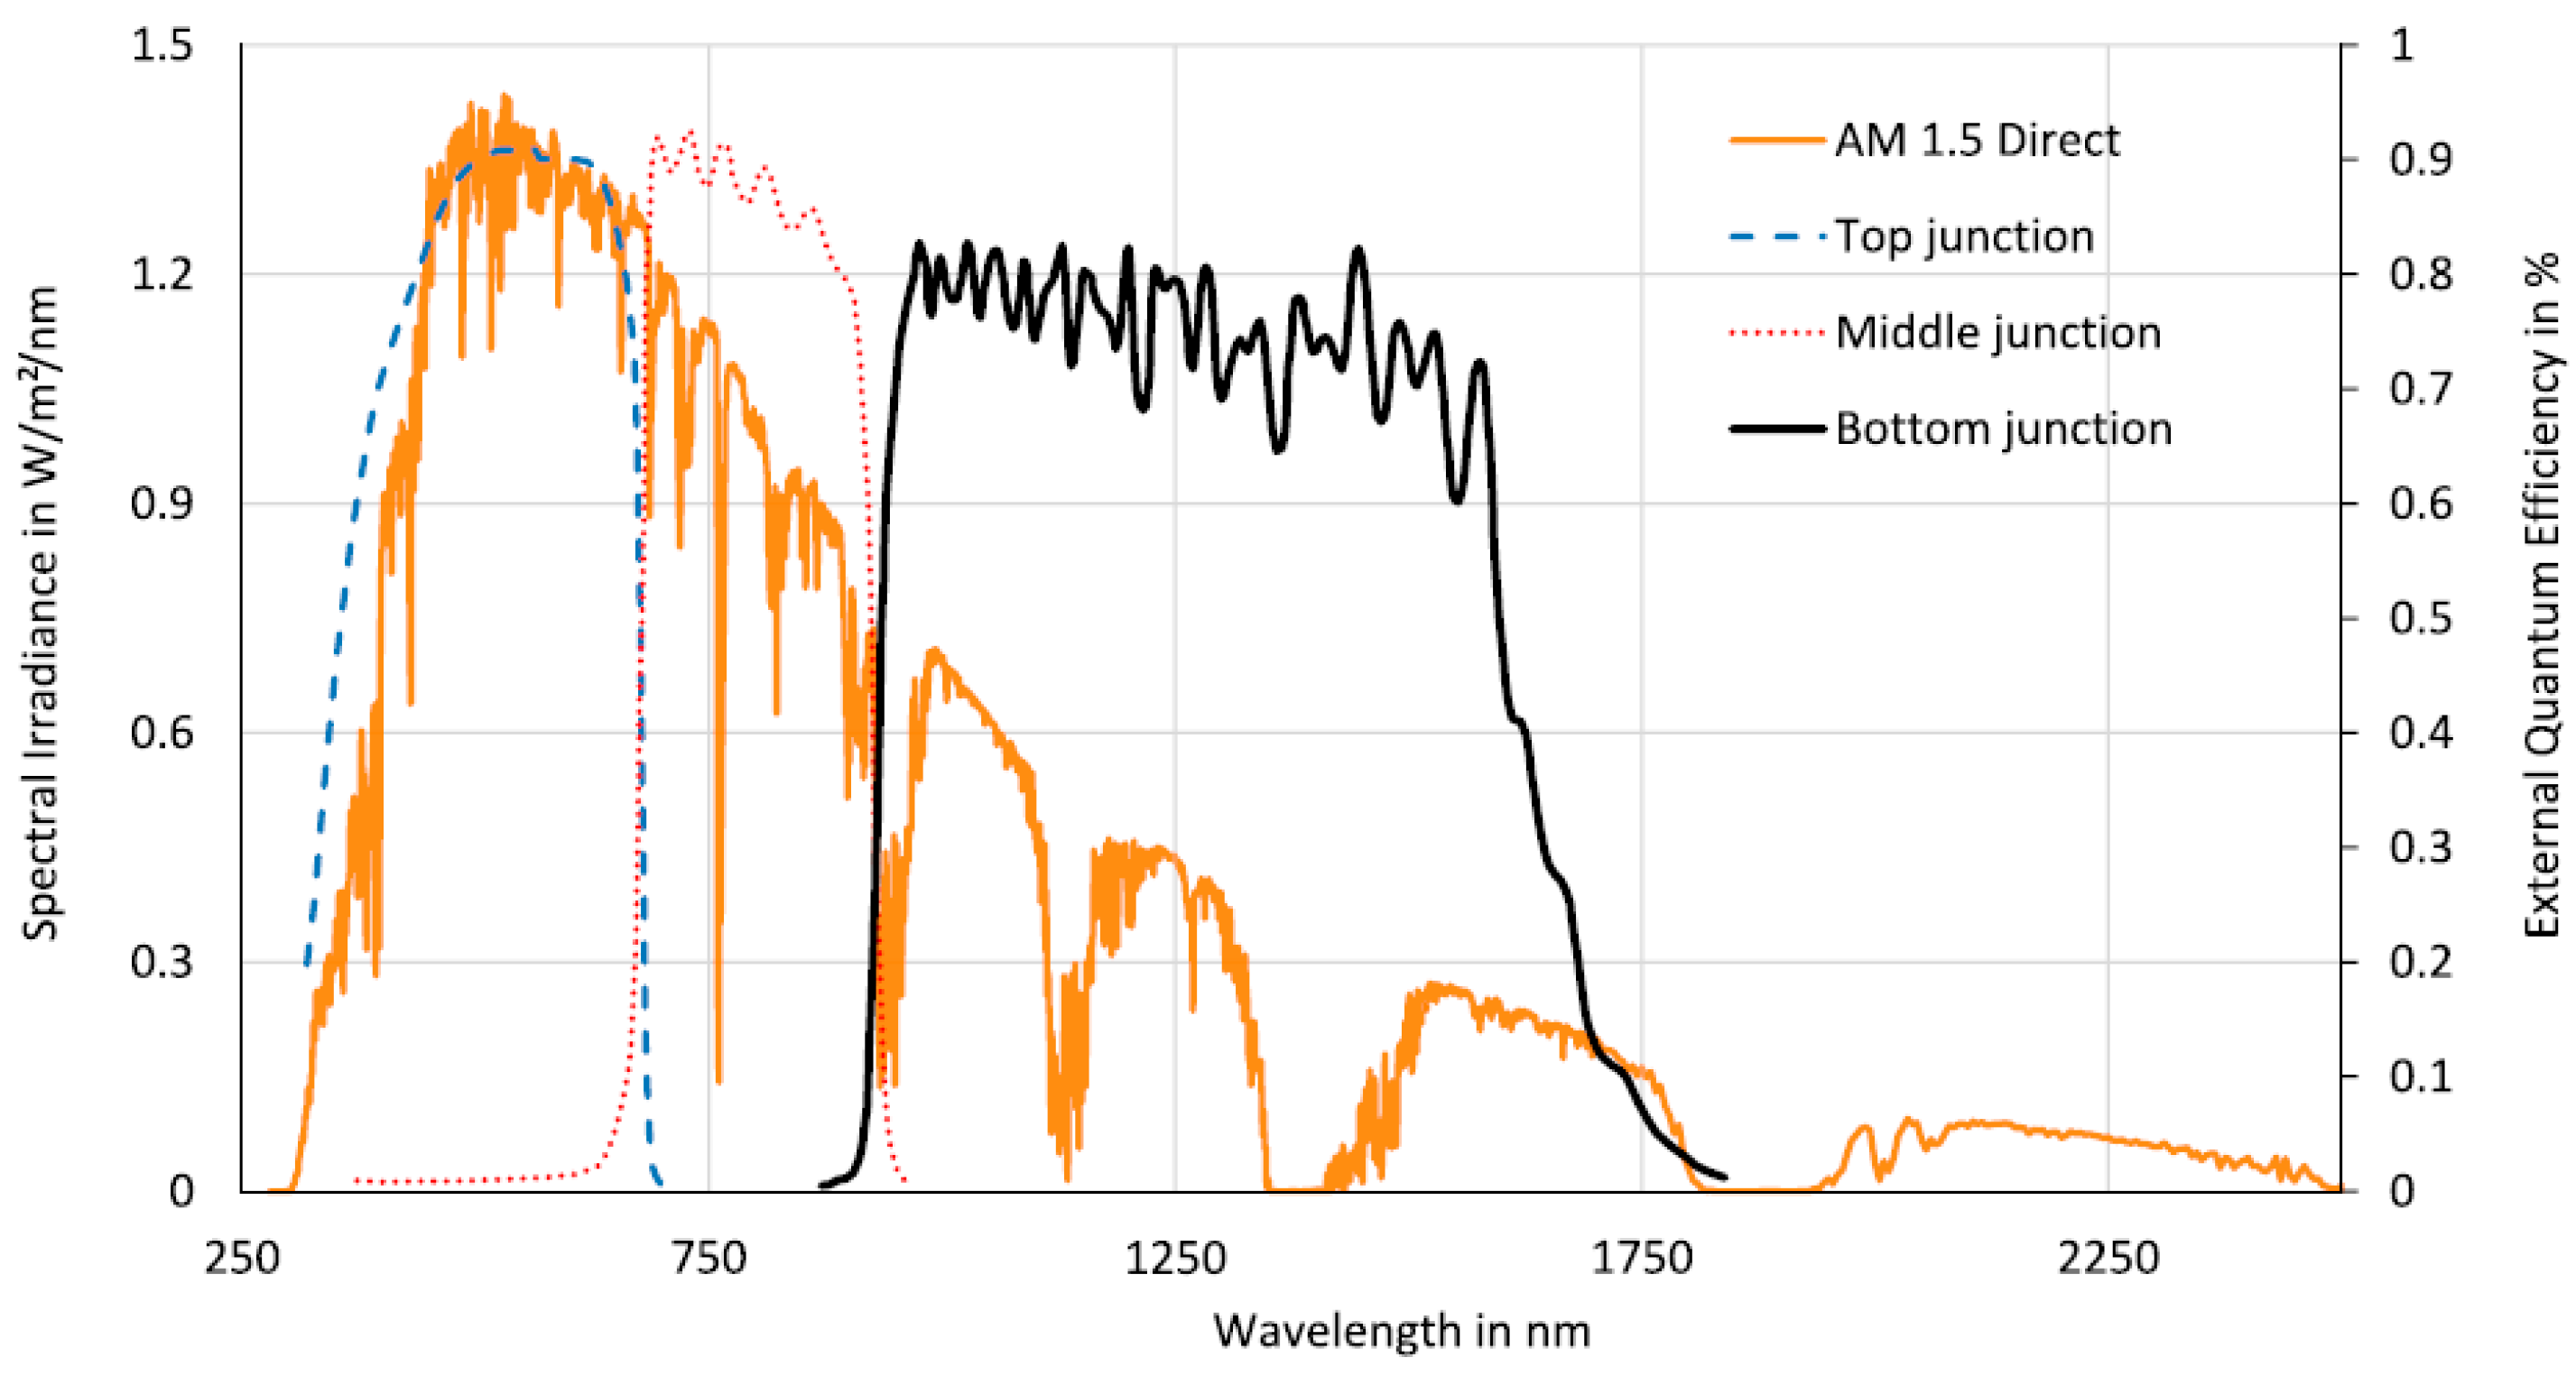
1.2.3. State of the Art in CPV-T Systems

The authors of this paper have previously published a state-of-the-art analysis of CPV-T systems in [25]. The most important findings and aspects relevant to powering the desalination plant are summarized in this section. In general, it must be distinguished between systems relying on highly efficient multi-junction solar cells (as the one presented in this publication) and ones that use crystalline silicon (c-Si) cells. The main difference lies in the electrical efficiencies of the cells. Due to the fact that multi-junction solar cells can utilize a wider range of the solar wavelength spectrum, they are significantly more efficient than crystalline silicon solar cells (up to 47.1% versus 27.6%, respectively) [26,27]. In Figure 4, the sun’s spectrum and the external quantum efficiency of a multi (triple)-junction solar cell is shown. For a more detailed explanation by the authors, please see [28].
The history of CPV-T systems started in the late 1970s as an evolution of flat plate PV-T systems. By adding optical concentrator elements (e.g., conical concentrators, parabolic troughs, spot Fresnel lenses, or linear Fresnel reflectors), the required PV surface area could be reduced while maintaining (or even increasing) power output [29].
Some of the earliest tests regarding CPV-T systems were conducted by Gibart [30] and Buffet [21] in the 1980s, when the first parabolic trough systems that allowed solar concentration factors of 10× to 40× were built. Their results showed lower electrical efficiencies than conventional flat PV panels, but higher overall efficiencies than flat plate thermal collectors. It also must be noted that electricity is more valuable from an exergetic point of view and hence underpins the benefit of co-generation systems.
In 1981, Rios et al. [31] were among the first to design a parabolic trough system, which was very cost-effective and demonstrated that CPV-T technology was potentially already cheaper than conventional natural gas technologies for electrical and thermal energy production at utility scale.
Figure 4. Comparison of the quantum efficiencies (data based on [32]) of an Azurspace 3C44 (10 mm × 10 mm) multi-junction cell shown in relation to the AM1.5 direct sunlight spectrum, which correlates to the left-hand ordinate.
Processes 12 02732 g004
Important research on parabolic trough–based CPV-T systems with crystalline silicon (c-Si) cells was then conducted by Coventry [33] in Australia. He performed tests on c-Si cells and stated that at a concentration of 30× suns, most silicon cells can reach electrical efficiencies of 20% when the operating temperature of the cell does not exceed 25 °C. He varied the concentration factor and investigated how different spatial flux distributions across the cell’s surface influence the cell’s efficiency. His experiments revealed that a homogeneous 30× concentration across the entire cell surface results in up to 20.6% electrical efficiency. Furthermore, he was able to show that an increased concentration factor of 90× suns across one-third of the cell’s surface resulted on only a slight efficiency decrease to 19.4% at 25 °C.
Col et al. have been working on parabolic trough cogeneration systems since 2012. One collector unit with a size of 3.45 m2 is supposed to hold 22 multi-junction 10 × 10 mm2 cells and is capable of producing up to 0.5 kW electrical and 1.25 kW thermal power (19% electrical system efficiency) [34]. This technology is now marketed by Greenetica Srl, but there is no price information on this relatively complex system available online [35].
Additional attempts to increase the share of electrical energy output of a CPV-T system have been conducted by Riahia et al. [36]. They combined mono-crystalline silicon cells with thermoelectric generators. A so called concentrated photovoltaic thermal thermoelectric (CPV-T-TE) system was developed, in which the total extracted electrical energy was increased by 7.46% compared to the initial CPV-T solar system. The economic feasibility of such systems using expensive Peltier elements is yet to be proven.
Fan Yang et al. [37] pursued an approach to reduce to the overall cost of CPV-T systems by deploying a quasi-parabolic concentrator with a low concentration factor and resorting to significantly less expensive silicon photovoltaic cells instead of multi-junction CPV cells. As in most CPV-T systems, the cooling channel for the Si-cells was mechanically attached to the rear side of the cells to gain the advantage of the higher overall efficiencies.
Since 2018, Graz University of Technology has been developing and testing CPV-T technologies [25,38] mainly within the scope of the project NEWSUN funded by the Austrian government. A prototype using multi-junction CPV cells has been built and successfully tested (as also described in more detail in Section 2.1). A low-cost variation using c-Si-based cells is currently being developed and tested by the research team within the framework of the successor project ECOSun (see Figure 5) and the novel technological approaches have been presented in [39].
Table 1 gives an overview of the most important characteristics and specifications of the CPV-T systems discussed above.
Since the scope of this work is to describe the design and performance of the entire solar powered MED desalination system and not the elaborate discussion of other CPV-T research projects, the reader is encouraged to resort to separate detailed studies of past and current research, such as [19].

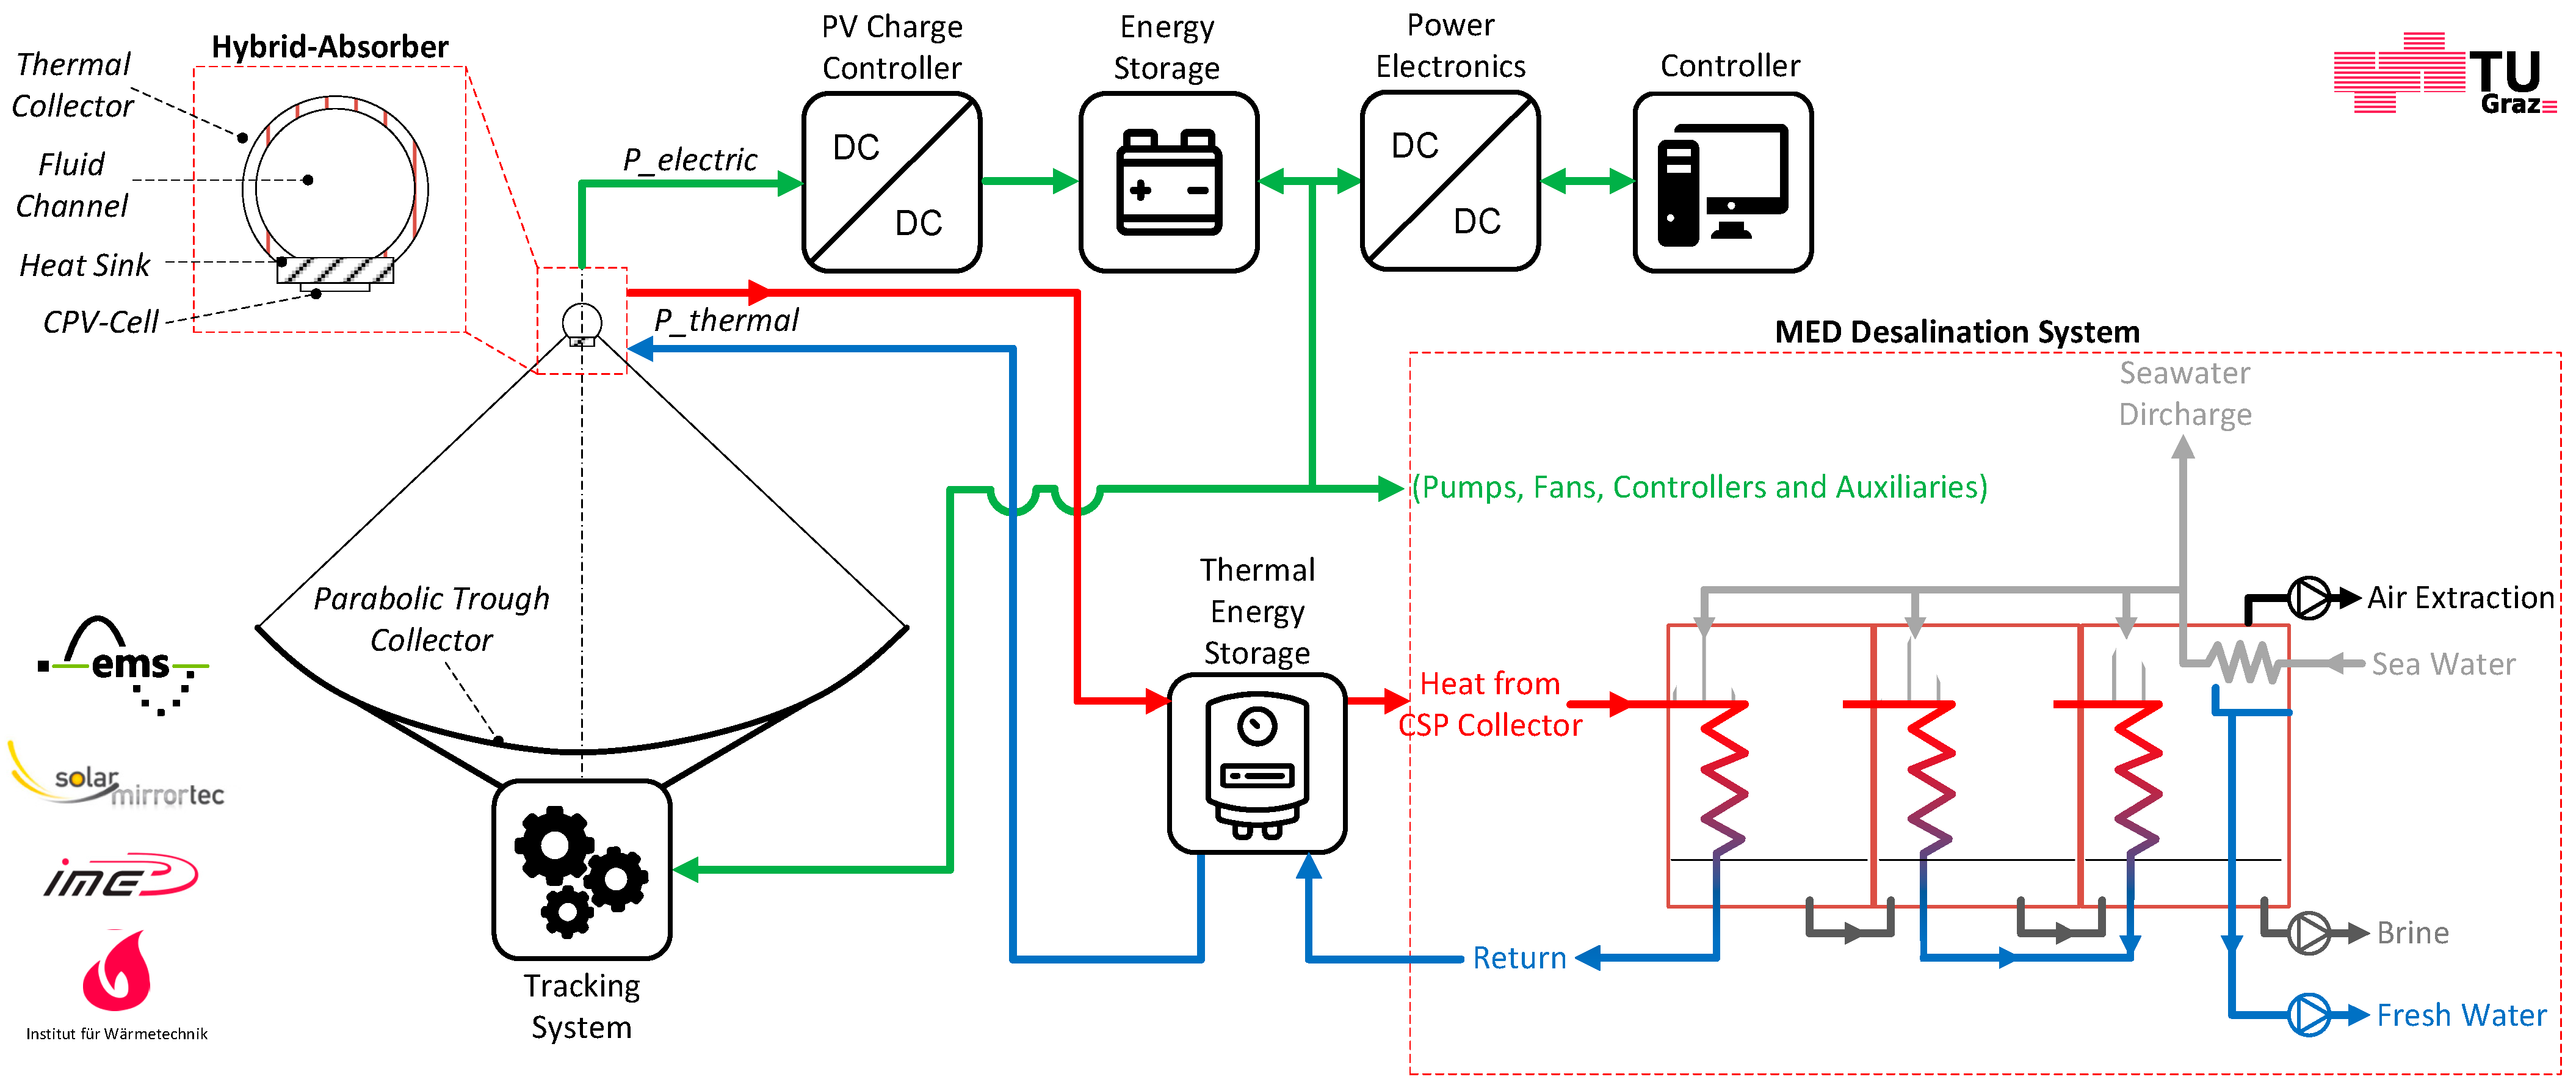
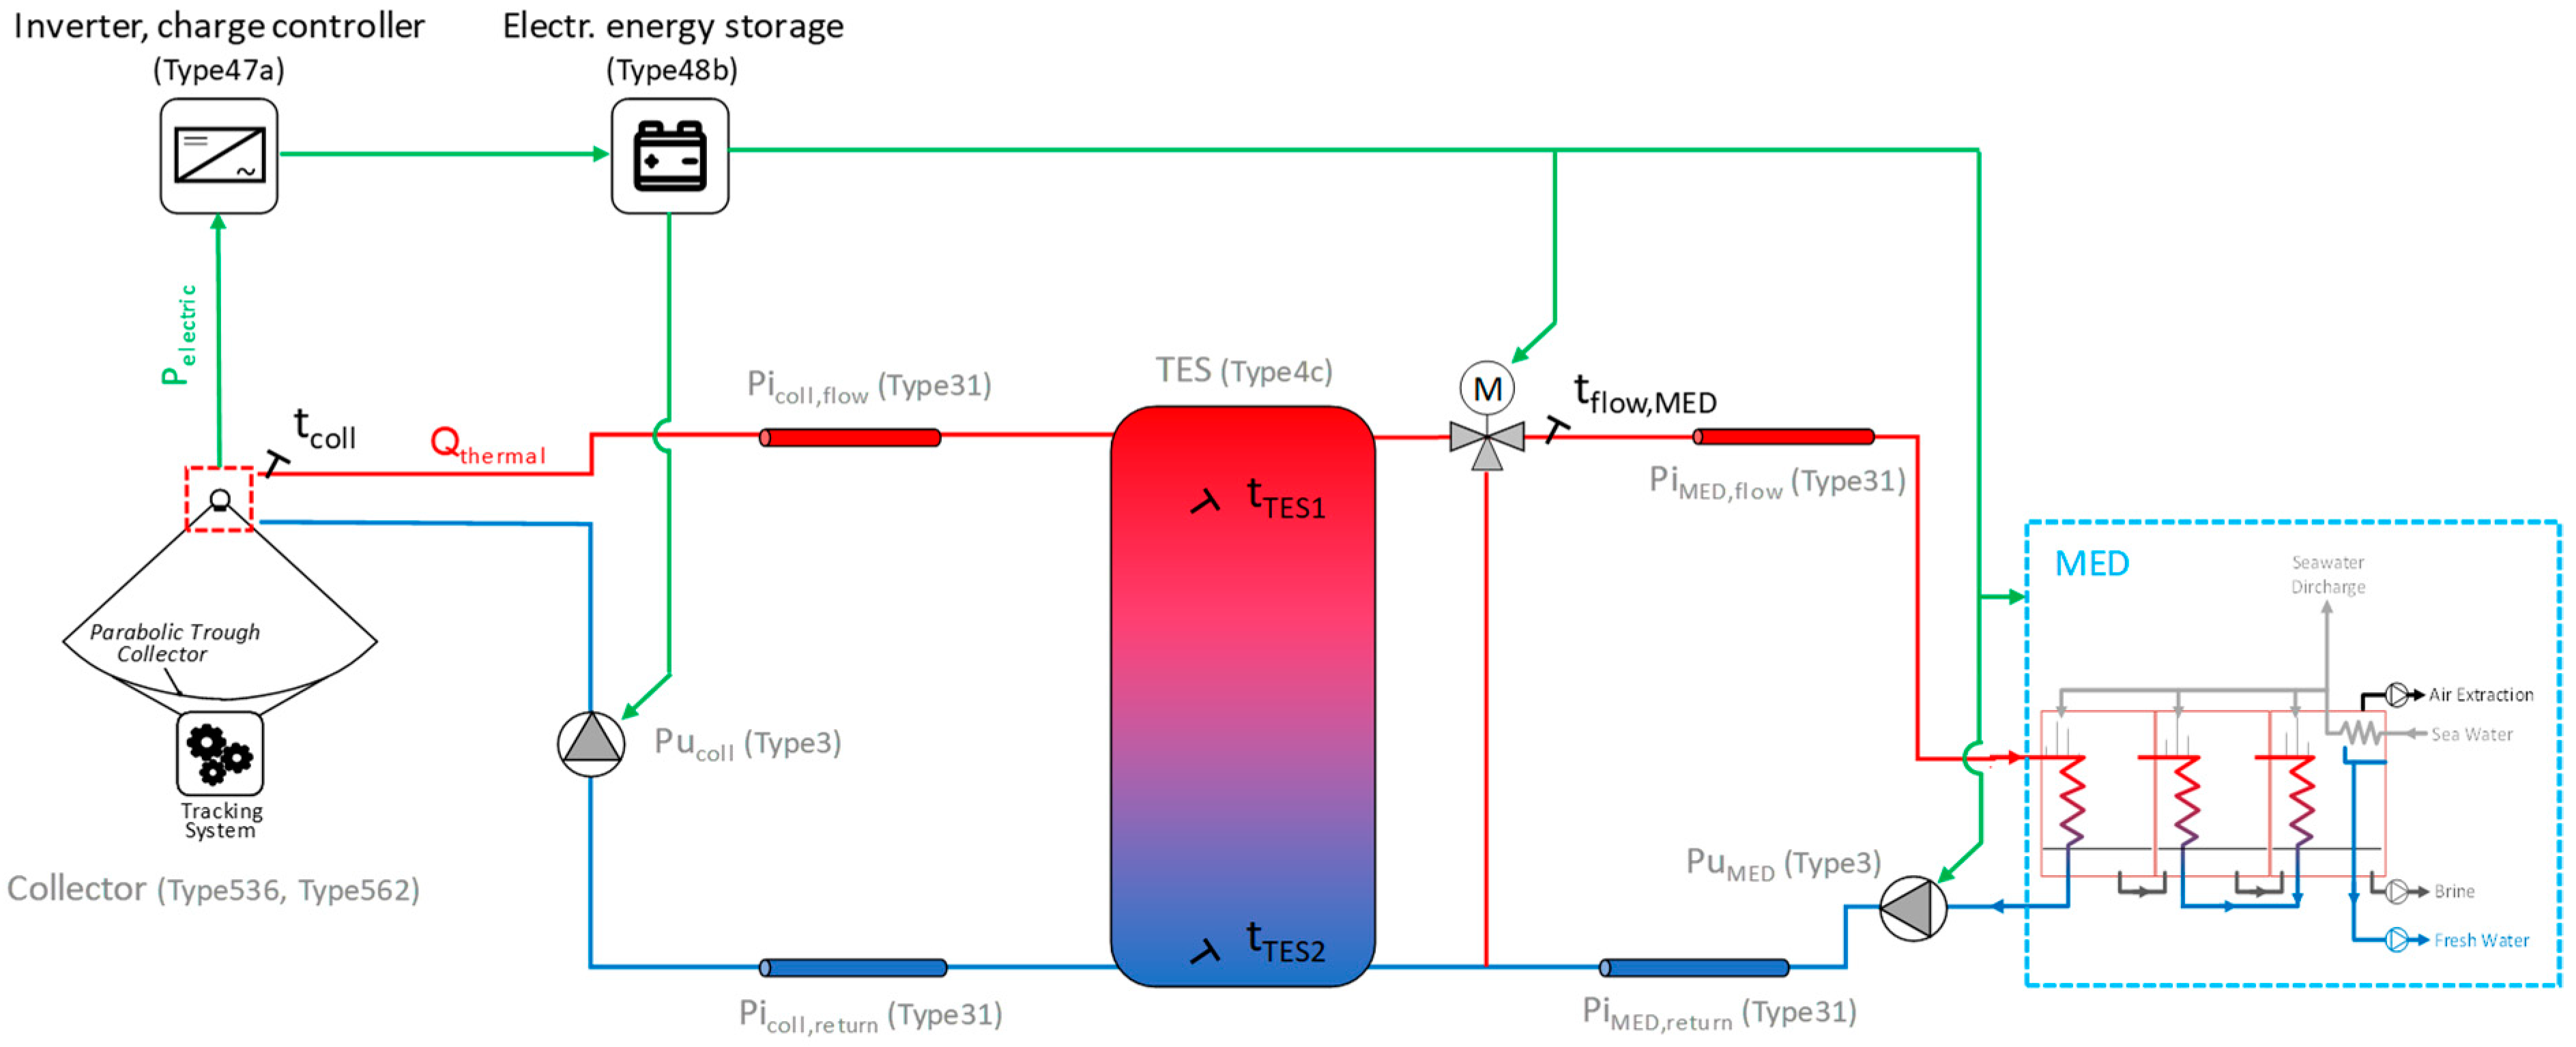
2. Hardware and Simulation System Description

The main goal of the proposed system is to provide fresh water by means of an entirely energy self-sufficient desalination plant powered by solar energy.
The simultaneous supply of electrical and thermal energy in an adequate ratio is provided by a so-called solar hybrid absorber (also referred to as a co-generation absorber module, or CAM, in this publication). As shown in Figure 6, the hybrid absorber, which consists of concentrator photovoltaic (CPV) cells for electricity generation mounted on a thermal absorber tube, is placed at the focal line of an array of parabolic trough collectors (PTCs). The cooling medium of the CPV modules is simultaneously used as the heat transfer fluid (HTF) for heat supply. A sun-tracking system ensures that the solar radiation is optimally exploited by constantly focusing on the cell during the course of the day. The electricity required for the MED system (electrical loads such as vacuum pumps, cooling systems, sun tracking etc.) can thus be provided in a CO2-neutral manner. The implementation of a battery and heat storage allows load point shifting and the operation of the system also during night hours. (The fresh water capacity is defined, among other parameters, by the properties of the plate heat exchanger of the MED system, which means that heat storage and nighttime operation will increase water output and hence overall profitability.) Feeding surplus energy into the power grid (if available) is also possible.
A separation of tasks (i.e., thermal vs. electric power generation) by using conventional stationary flat-plate PV panels in combination with solar thermal (flat) vacuum tube collectors would be an obvious alternative, but not necessarily a superior one. This configuration has some disadvantages such as lower system efficiency and therefore increased installation space requirement. See Section 4 (Discussion) for further information.
The high potential of multi-junction CPV cells in parabolic collectors has been confirmed not only by the authors of this publication, but also in literature in general (e.g., [33,40,41,42]).
  • The advantages of the NEWSUN concept can be summarized as follows:
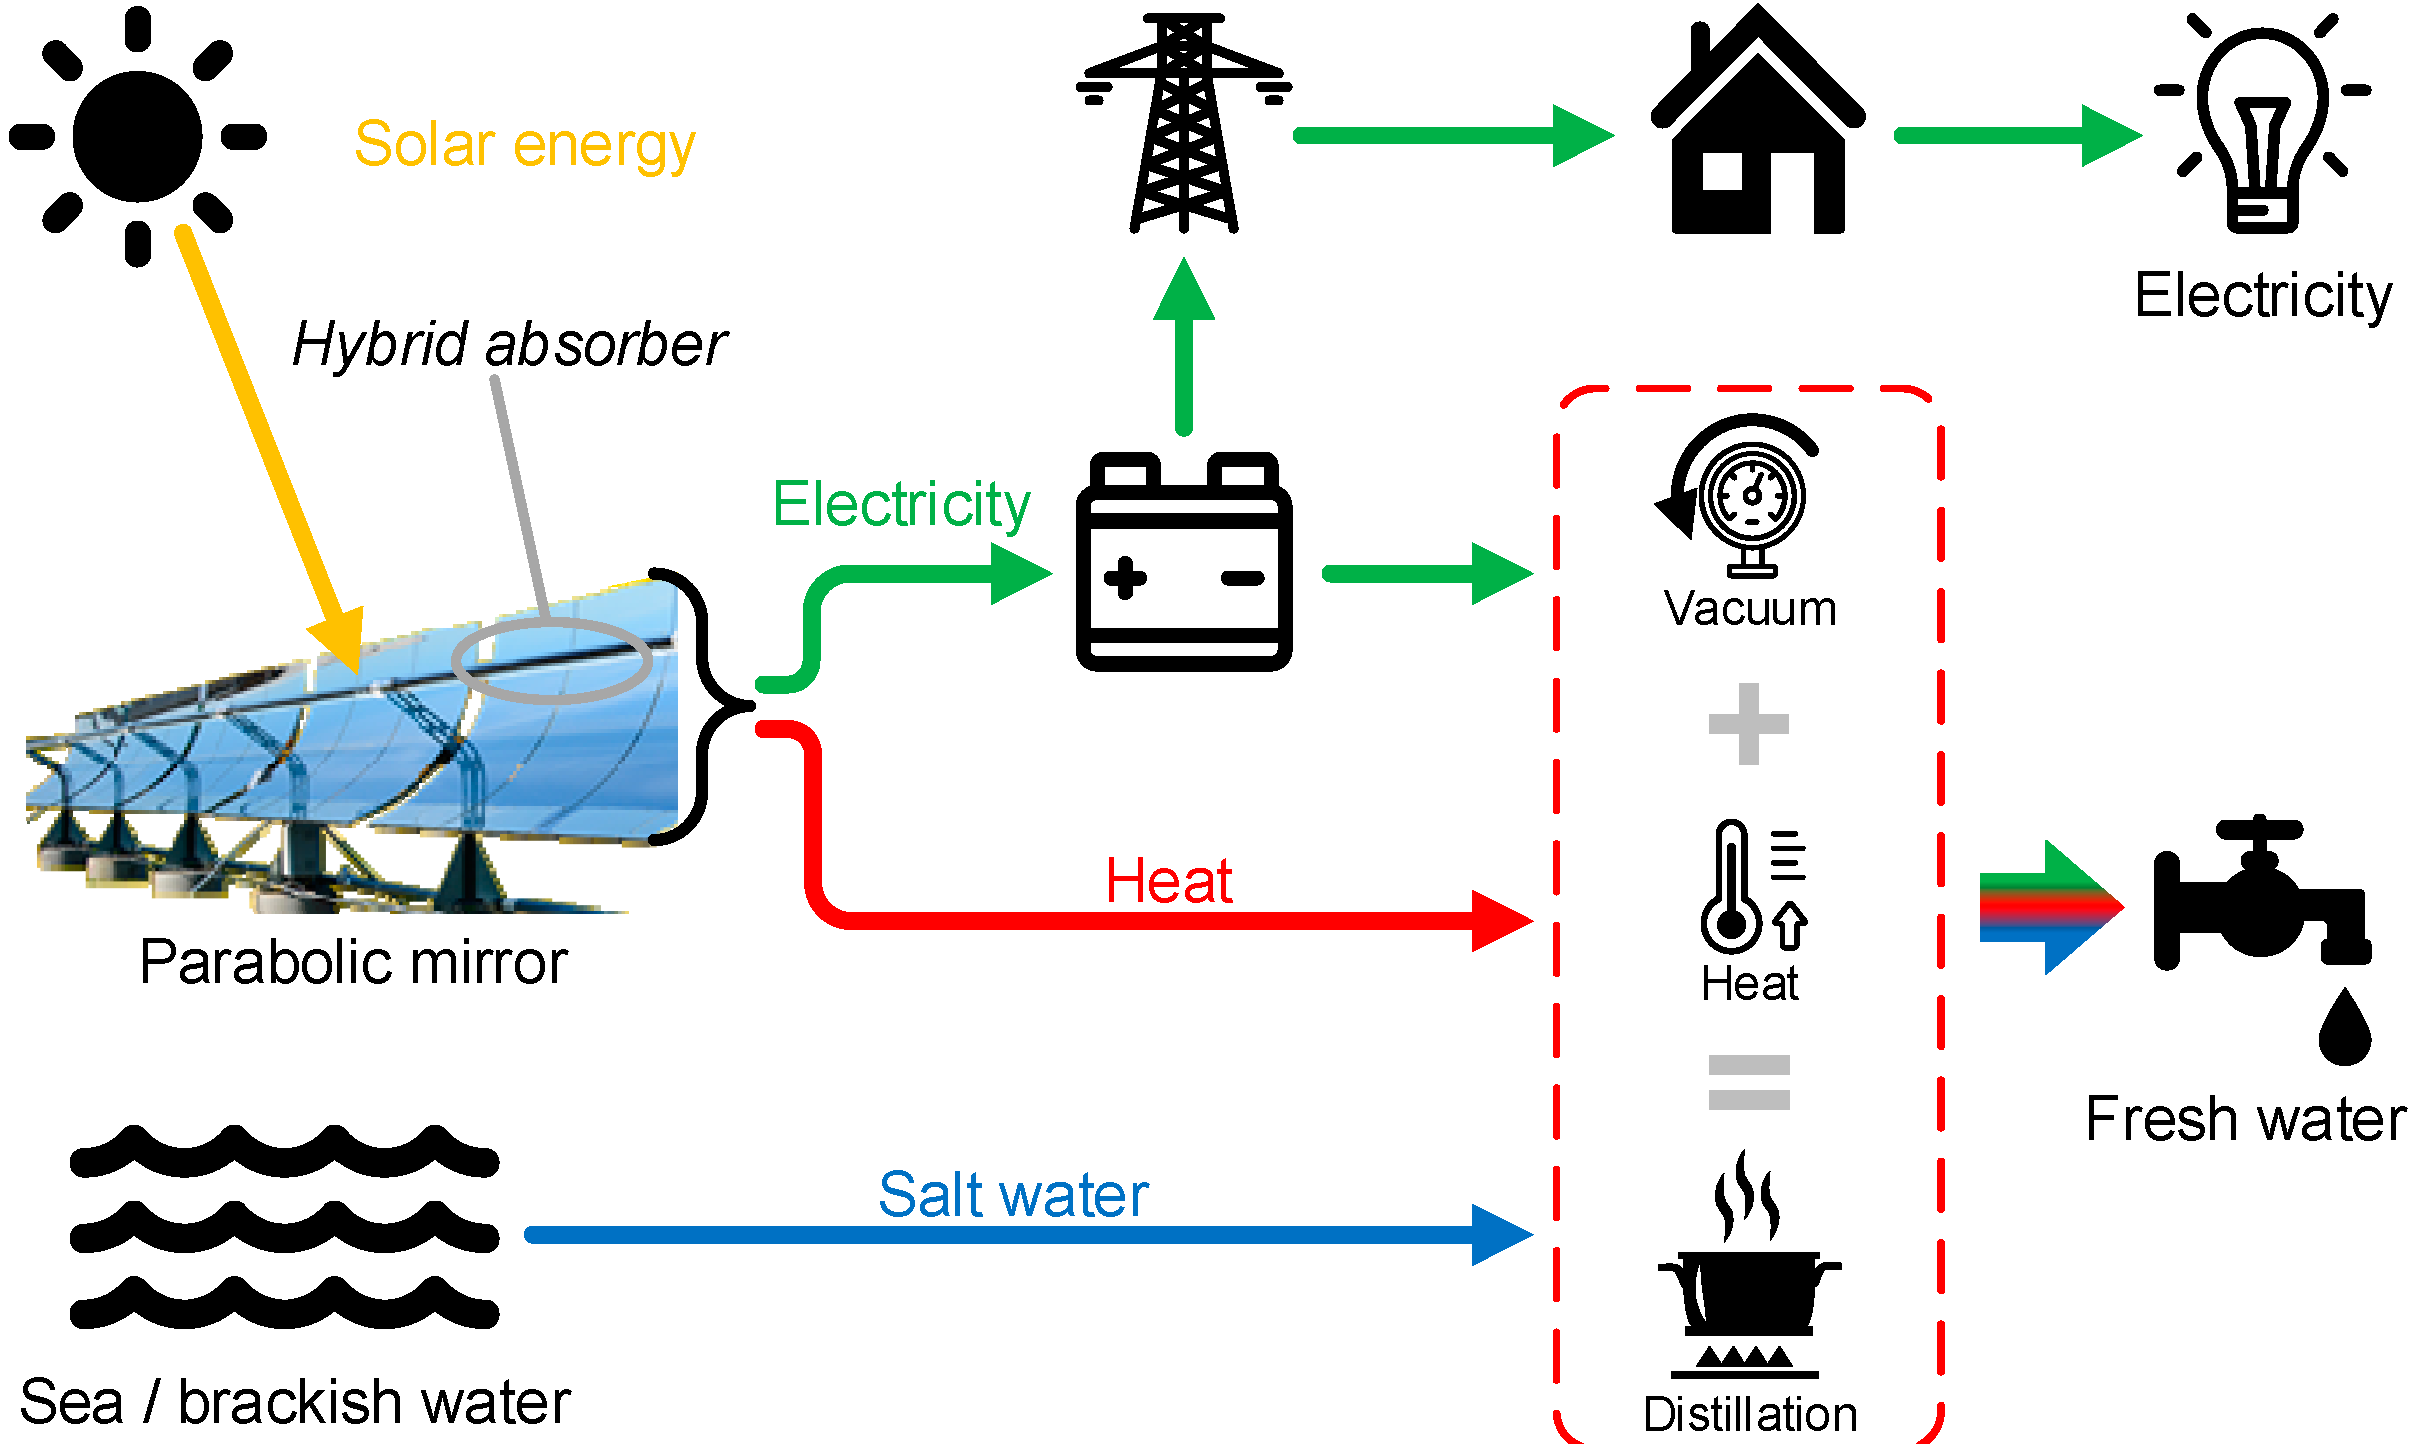
  • Use of the CPV cells’ waste heat as process heat for potable water production.
  • The optical elements (i.e., mirrors) experience a dual use (CSP and CPV), which leads to a significant cost reduction while increasing the overall system efficiency.
  • Highly efficient multi-junction concentrator cells can be implemented.
  • If the hybrid absorber is combined with a water treatment plant by multi-effect distillation (MED), an energy self-sufficient/energy generating system is created, which offers low operating costs at high overall efficiency.
  • In addition to the huge global market of desalination, the “co-generation absorber module” is of course also suitable for other applications, such as clinical water treatment, or industrial processes where electricity and heat are needed.
As will be shown in the subsequent Section 2.1, the overall high efficiency of the hybrid collector leads to space savings compared to thermal collectors and photovoltaics. However, the temperature level of the HTF is limited by the maximum permissible solar cell temperature recommended by the manufacturer [43]. These temperature limitations favor applications with low and medium temperature requirements. Still, according to [44] or [45], a great variety of industrial processes require heat below 120 °C as also can be concluded from Figure 7.
The two main parts of the NEWSUN system, the parabolic trough hybrid absorber (energy supply side) and the MED system (fresh water production side including energy storage, i.e., power load side), are described in Section 2.1 and Section 2.2, respectively.
NOTE: In this case, the proposed technology was developed in a “hybrid mode”, similar to a hardware in the loop system. This means that certain components or parts of the system (e.g., the parabolic trough hybrid absorber) were built and tested under real-world conditions in order to provide lookup table data for detailed numerical system simulation including the MED plant.

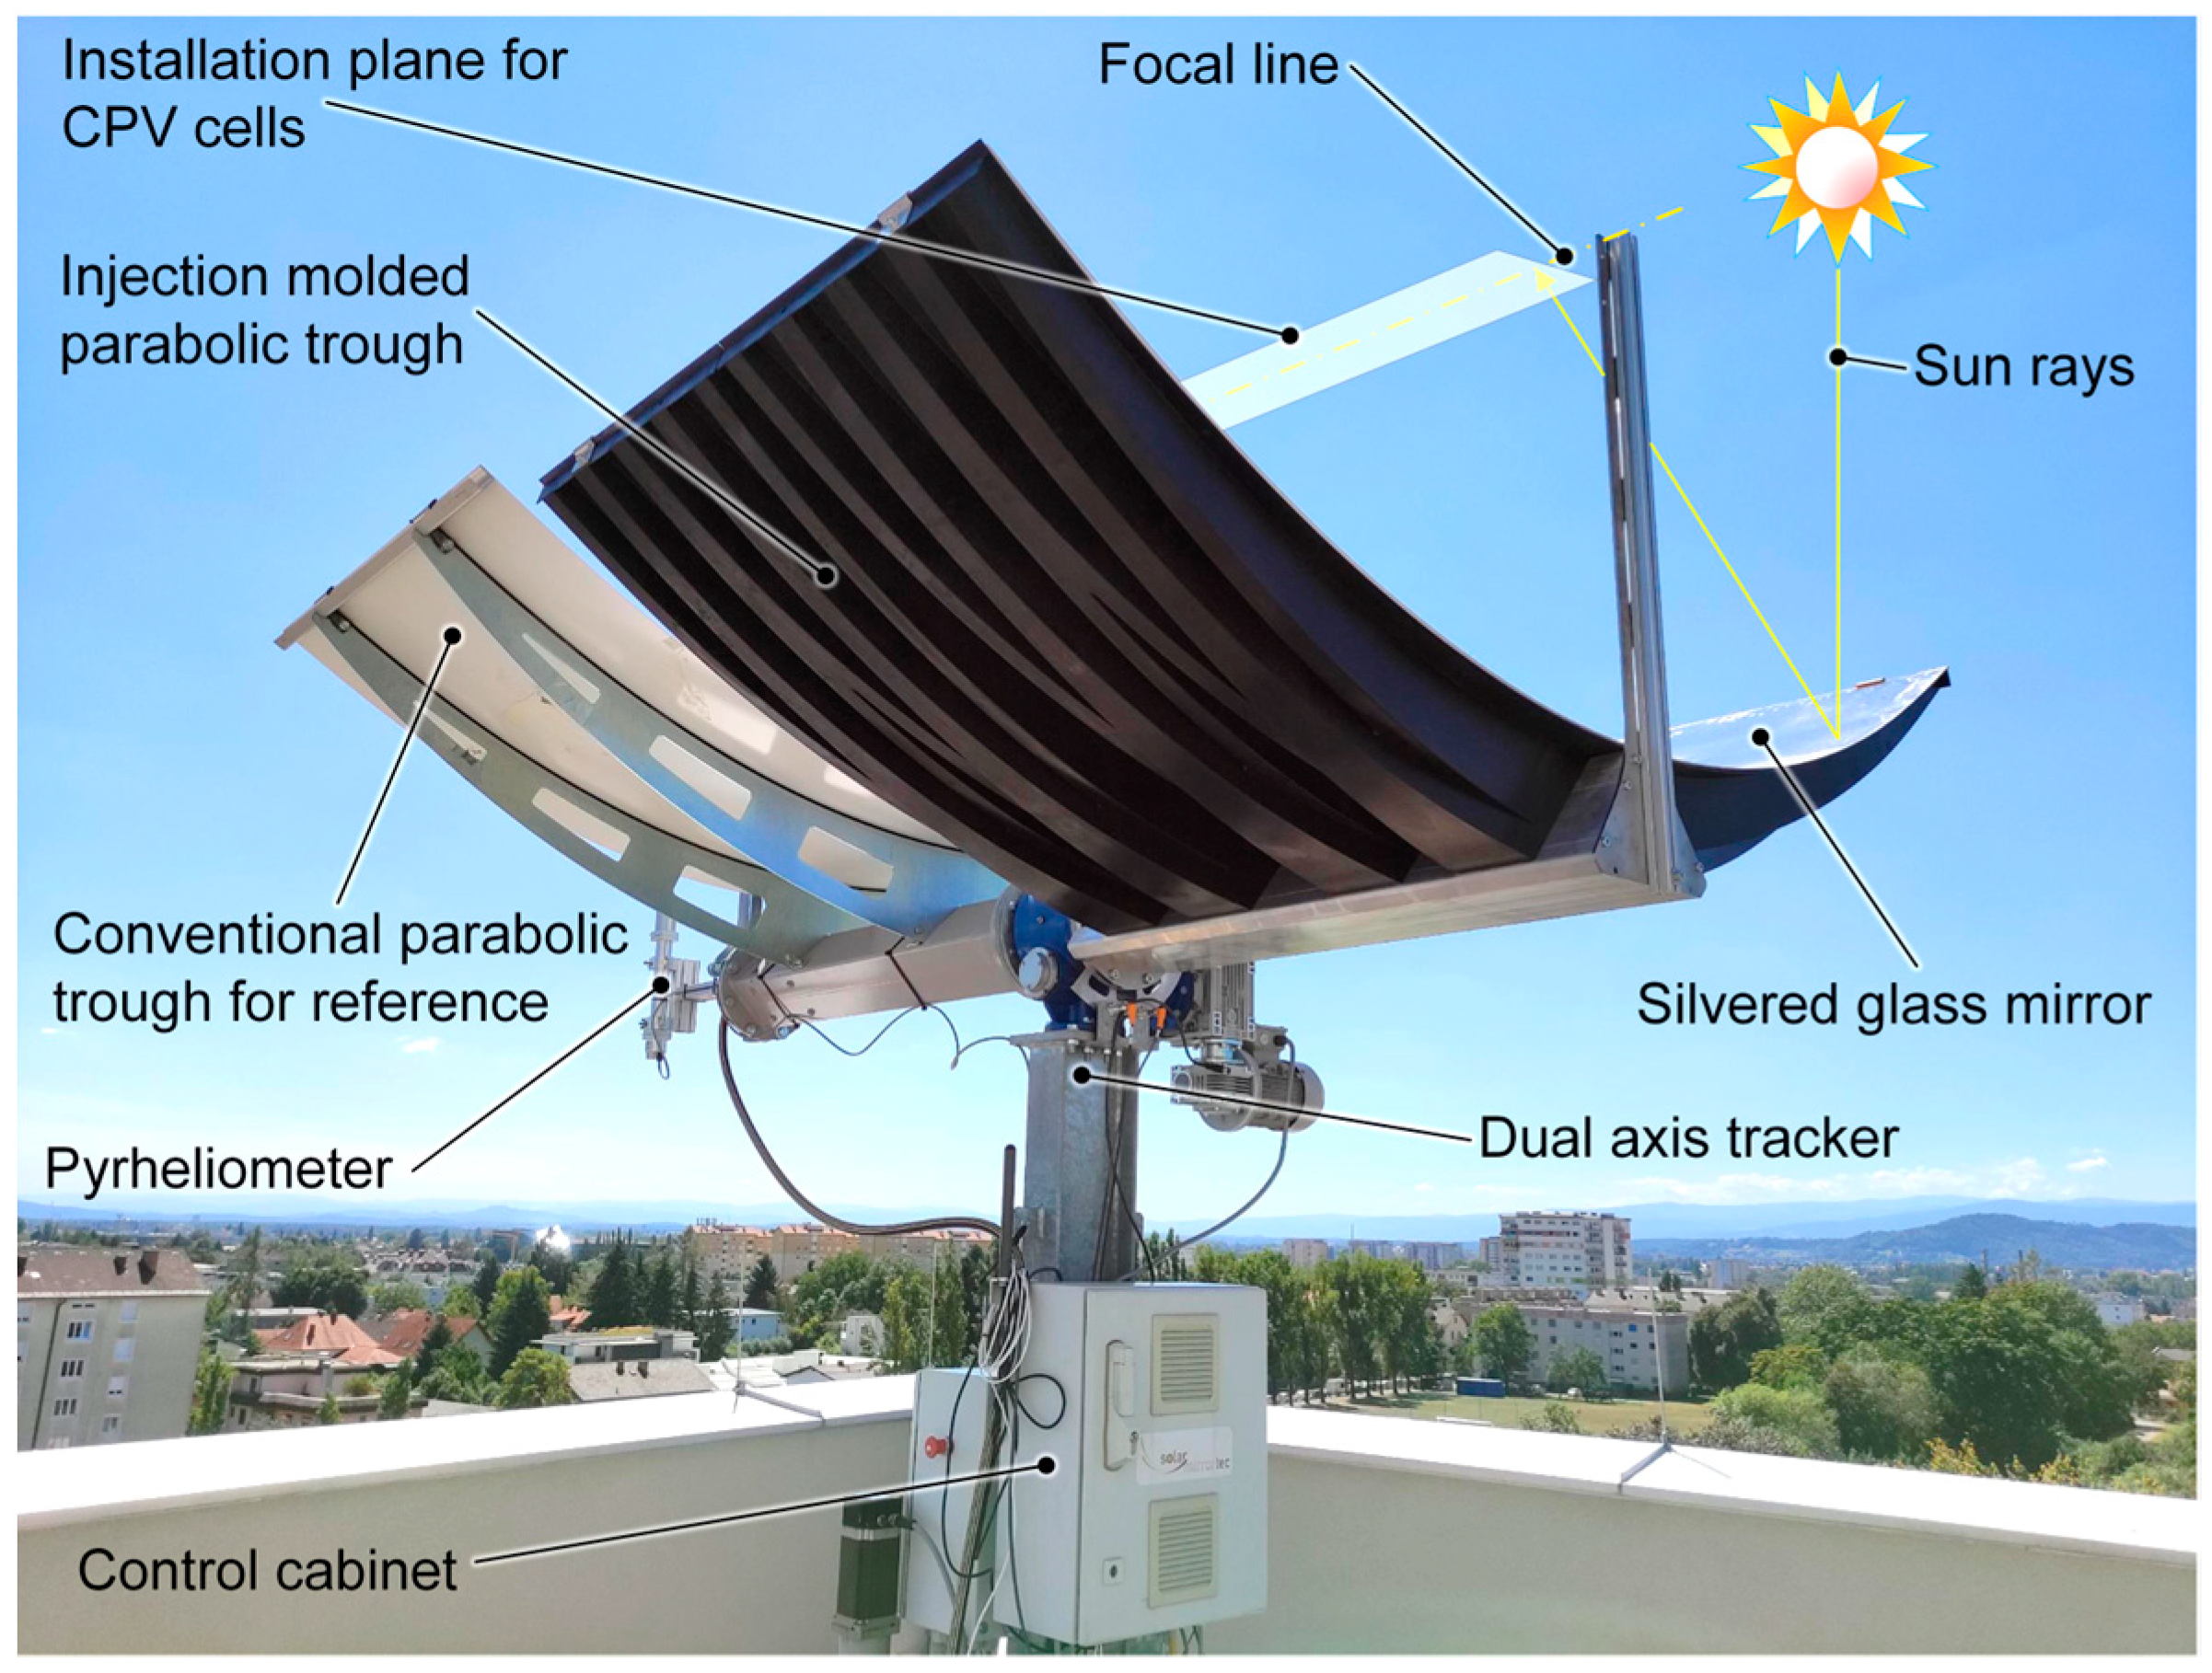
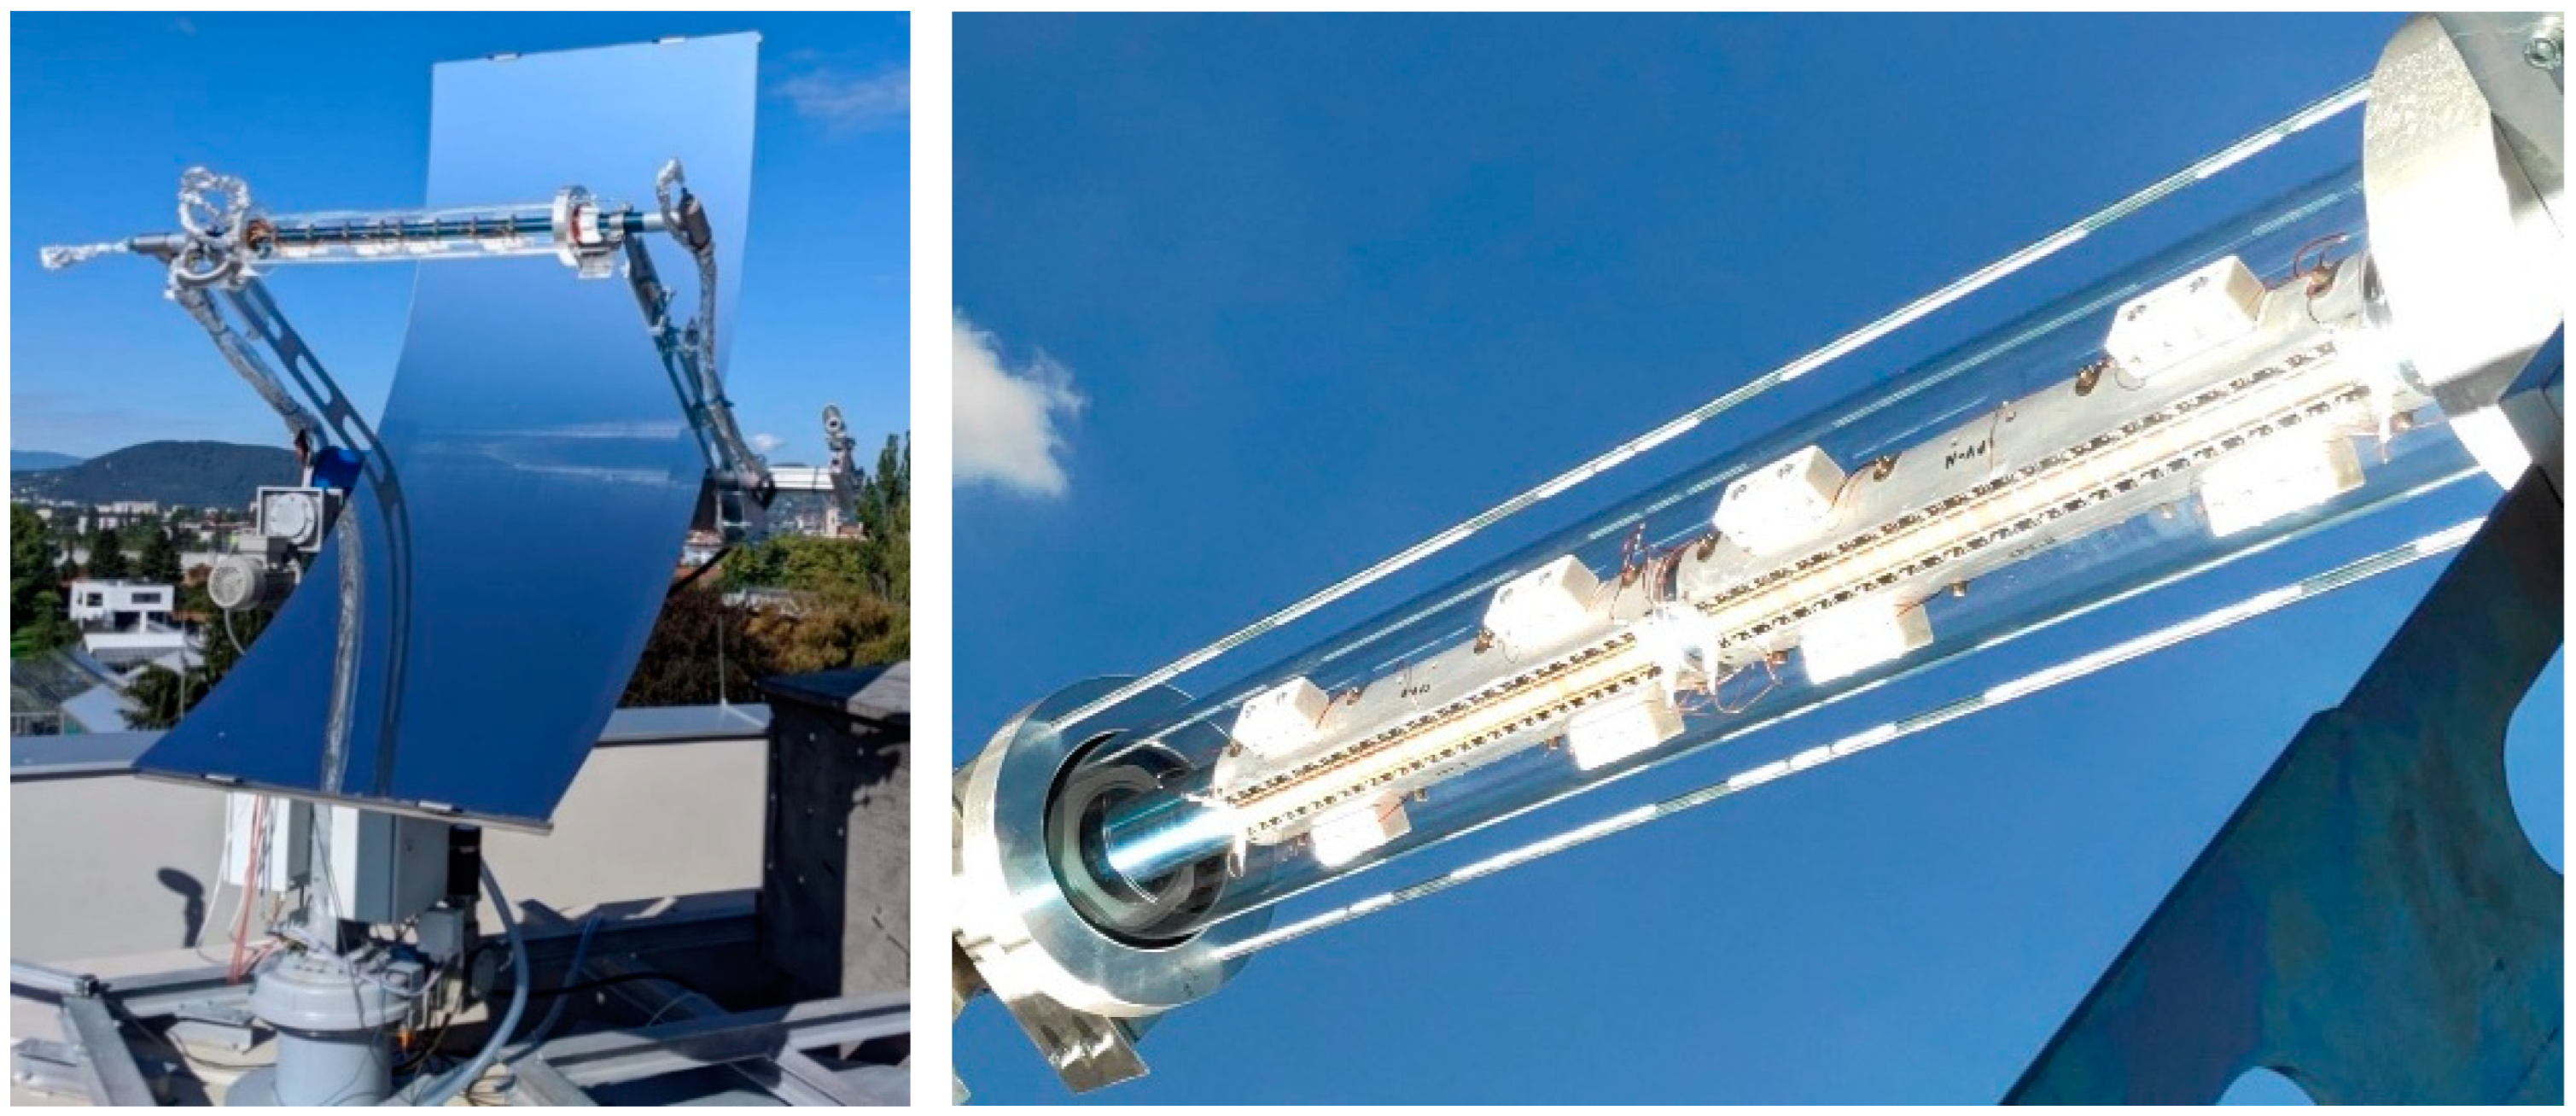
2.1. Parabolic Trough Hybrid Absorber

In order to perform accurate system simulations, the characteristics of the hybrid absorber (i.e., electrical and thermal efficiencies depending on different operating parameters) needed to be determined. For this reason, a laboratory-scale absorber was built and characterized, first in solar simulator tests [28] and finally in real-world outdoor measurements over the course of several months (Figure 8). The design process, test setup and results are presented in detail in [25,38,49], whereas the most relevant findings are also summarized and implemented in this section.

2.1.1. CPV Cell Selection

In the course of the project, a market analysis of currently commercially available solar cells suitable for operation in PTC hybrid absorbers was carried out. Since only solar cells for concentrated sunlight (up to approx. 150 suns according to the selected PTC) were considered, the majority of commercially available cells needed to be ruled out. The market for multi-junction cells, which are designed for concentrated sunlight, proved to be rather small but the multi-junction cell type 3C44 in the 10 × 10 mm2 version from Azurspace was eventually selected. This type is suitable for concentrated sunlight (1–1500×), and offers high electrical efficiencies of up to 42% in lab conditions. It was designed for the solar spectrum on Earth (AM 1.5), has a low temperature gradient and can be operated at temperatures of 110 °C [43]. For the discussed application, the cell was mounted on a specially designed PCB with optimized heat transfer properties for ideal cell cooling and maximum thermal yield as shown in Figure 9.

2.1.2. Hybrid Absorber Design

To attach the previously mentioned CPV board to an off-the-shelf cylindrical PTC thermal absorber tube with selective coating (industry standard for concentrating thermal systems), an aluminum adapter with maximized thermal conductivity was machined. To reduce convection thermal losses between the hybrid absorber and the ambient air, as well as to protect the CPV cells from environmental effects, the entire hybrid absorber was surrounded by an evacuated borosilicate glass envelope (a simple cylindrical glass tube without antireflective coating). Figure 10 (left) shows the cross section of the hybrid absorber design. Thermal paste was applied between the individual components (CPV board, aluminum adapter, absorber tube). A photo of the assembled hybrid absorber is shown in Figure 10 (right).

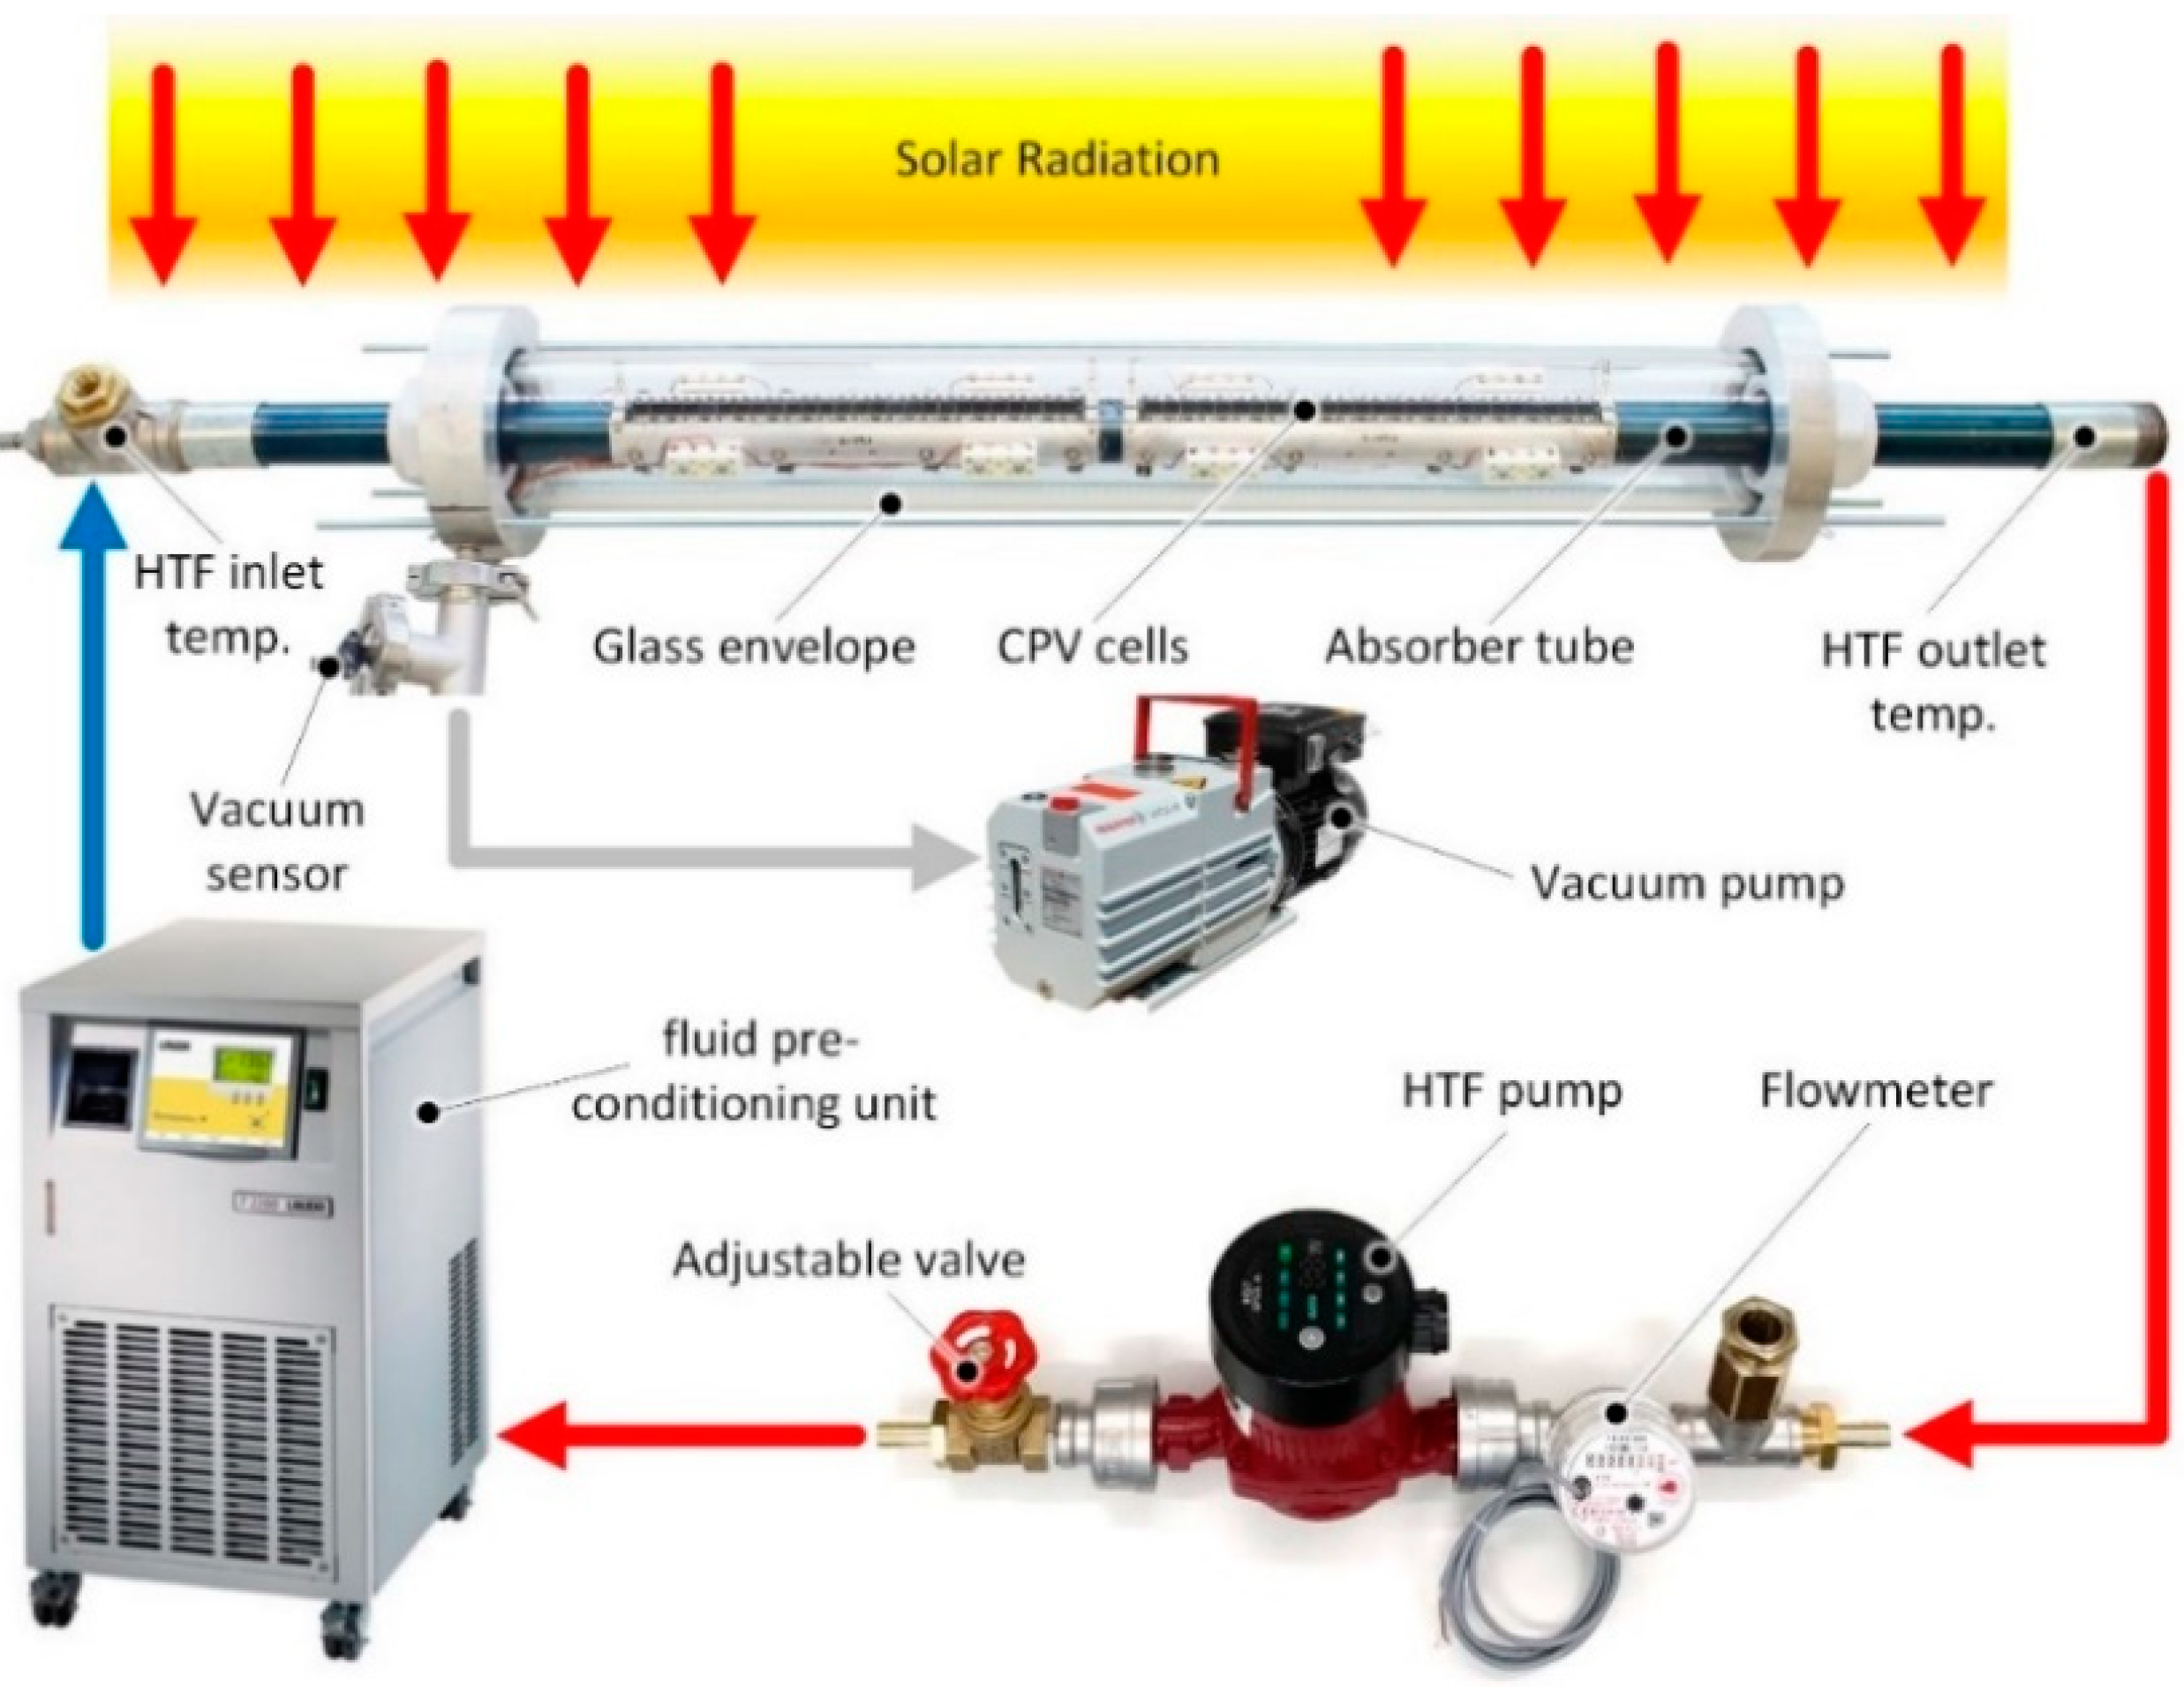
2.1.3. Experimental Characterization of the Hybrid Absorber

In order to test and characterize the developed hybrid absorber by measurements under real conditions, a prototype test facility was set up at Graz University of Technology (see Figure 8). For this purpose, a single-mirror module of a thermal parabolic trough collector model SMT-8 by the company IMK Solarmirrotec (Seitenstetten, Austria) was used. The sun tracking system was converted from an originally single-axis to a dual-axis system to ensure maximum solar yield and comparable measurements even during winter months in Austria, where the sun’s elevation angle does not exceed 25°. An induction motor with reduction gears was used for the elevation axis, while a stepper motor with a combination of hypoid and cylindrical gears was used and tested for the azimuth position.
The parabolic mirror has an effective aperture area of 1.5 m × 0.98 m and a theoretical geometric concentration ratio of 150 suns and automatically follows the sun. The system was optimized so that the concentrated light (line focus) falls precisely on the middle of the solar cells (see Figure 11). The hybrid absorber was successfully tested and KPIs, such as temperature ins and outs, flow rates as well as electrical performance were measured over several weeks using the hydraulic setup shown in Figure 12.

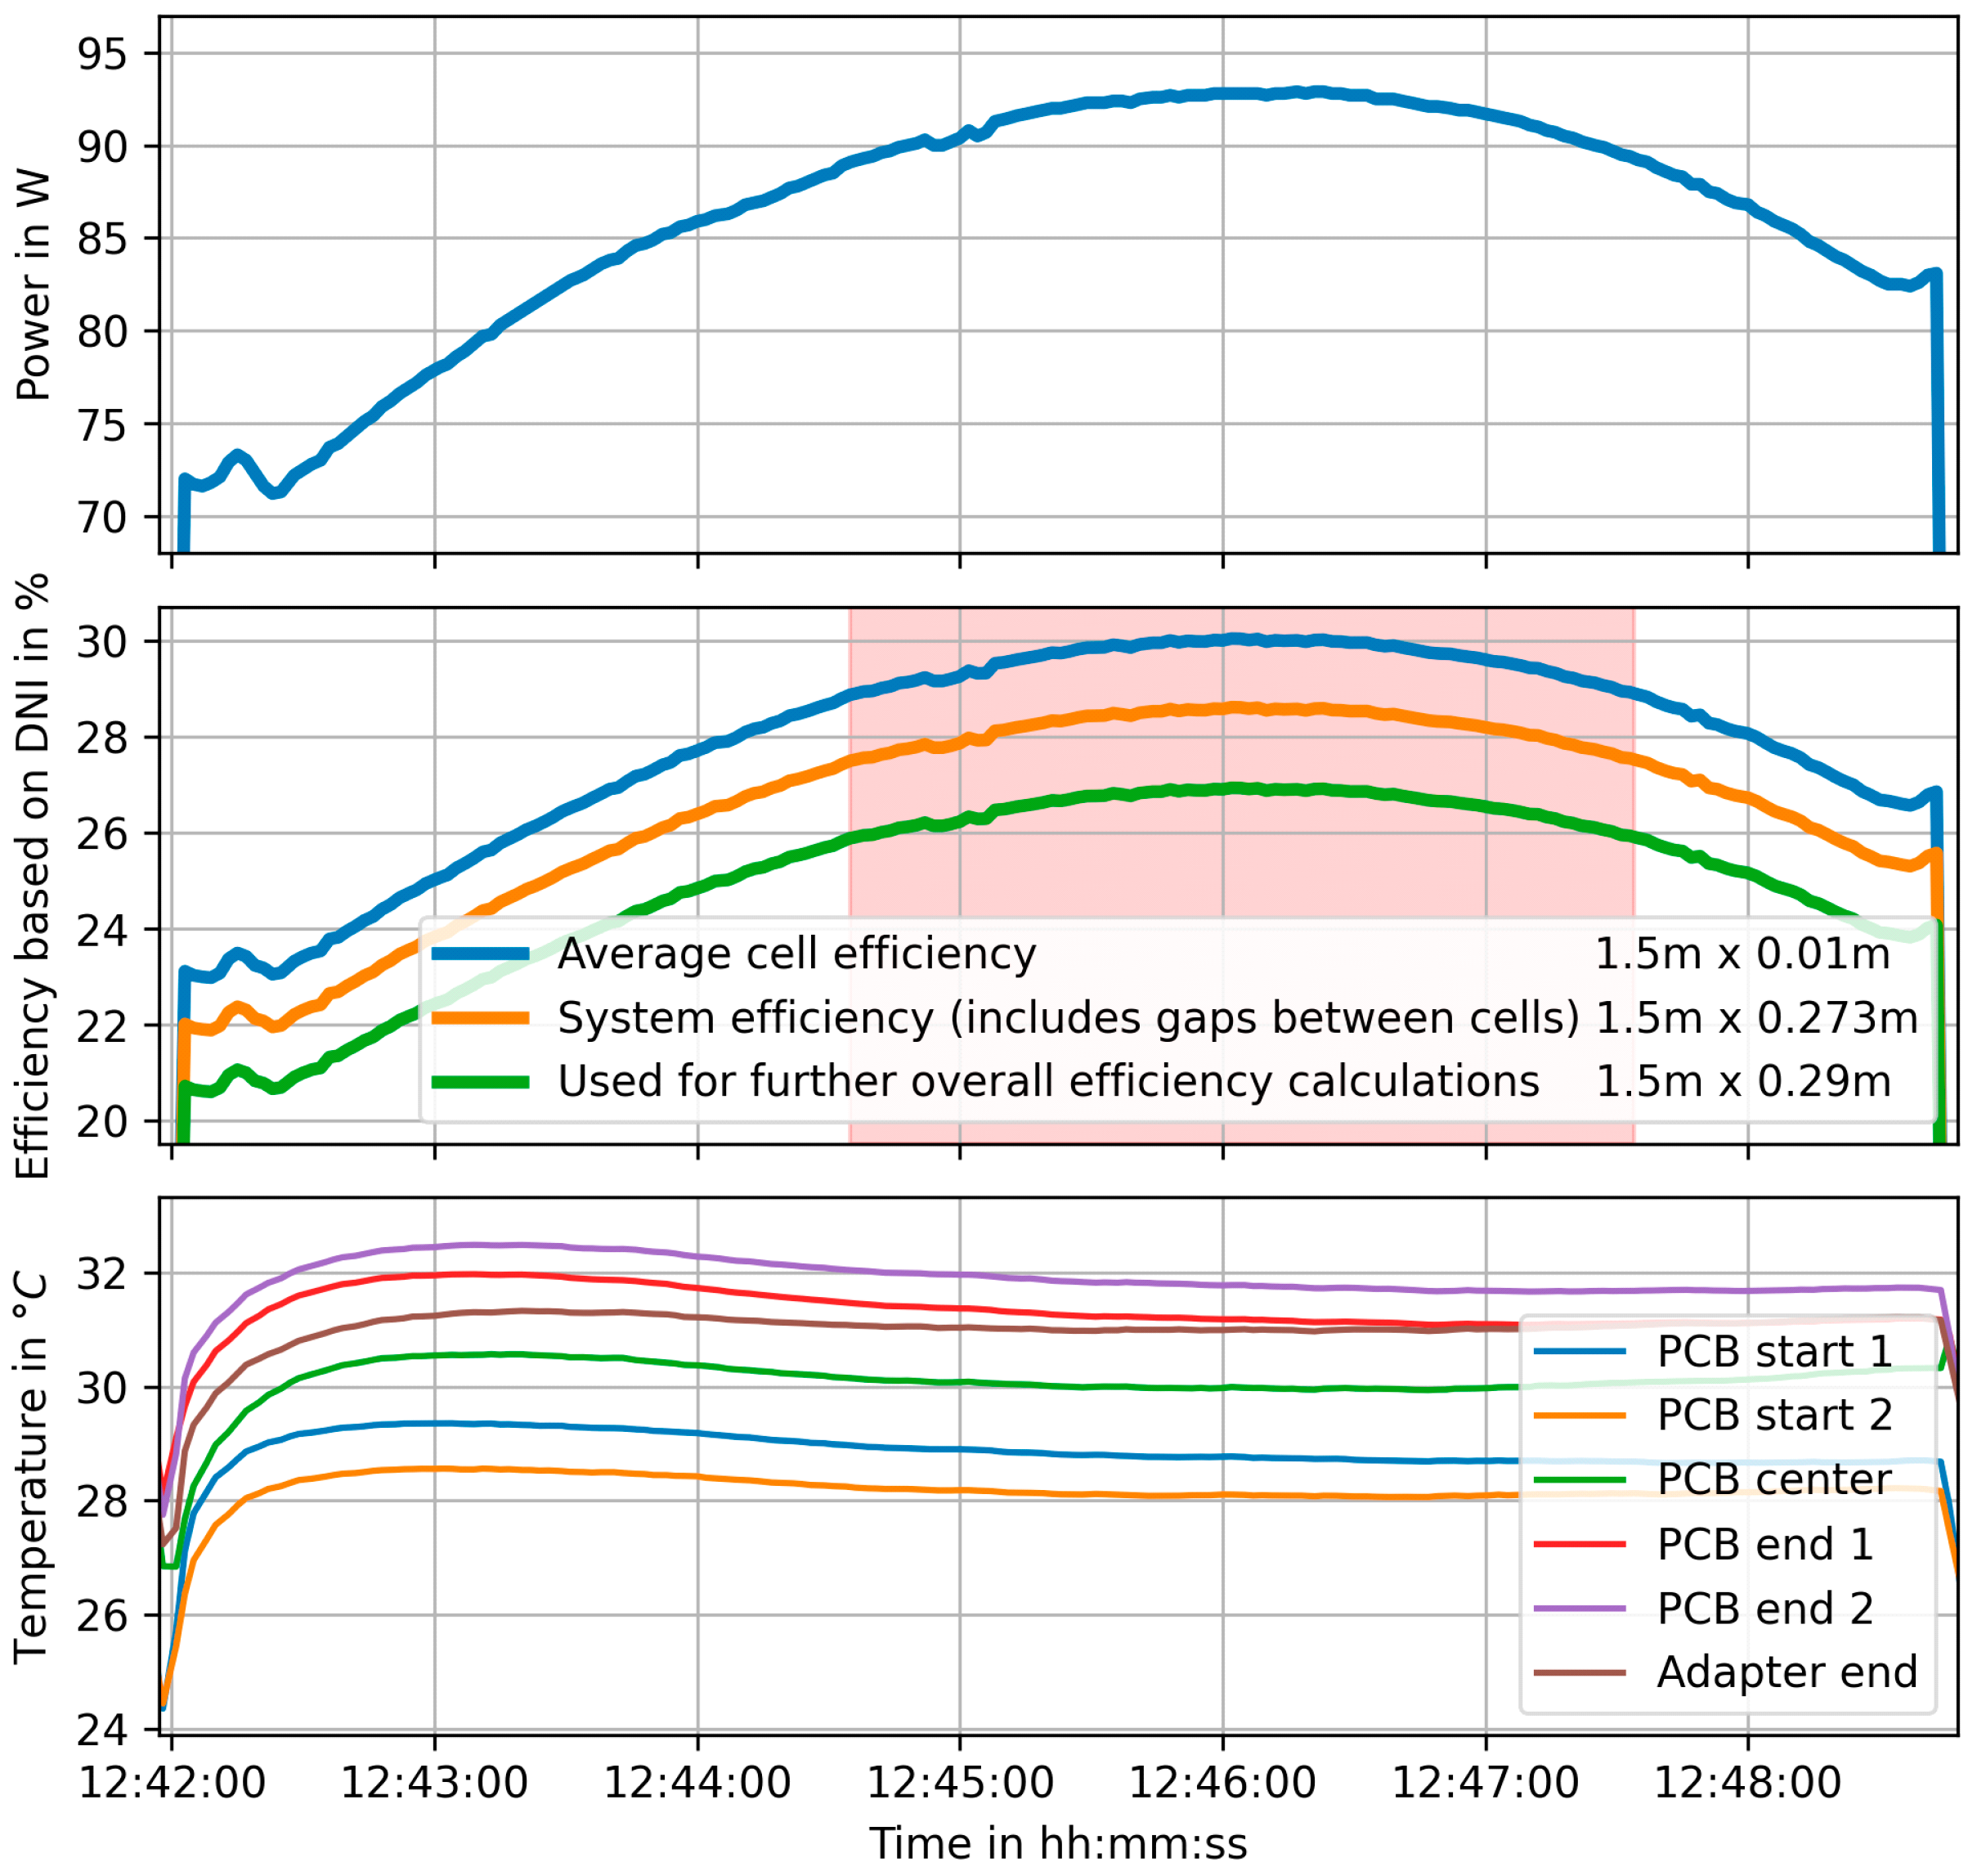
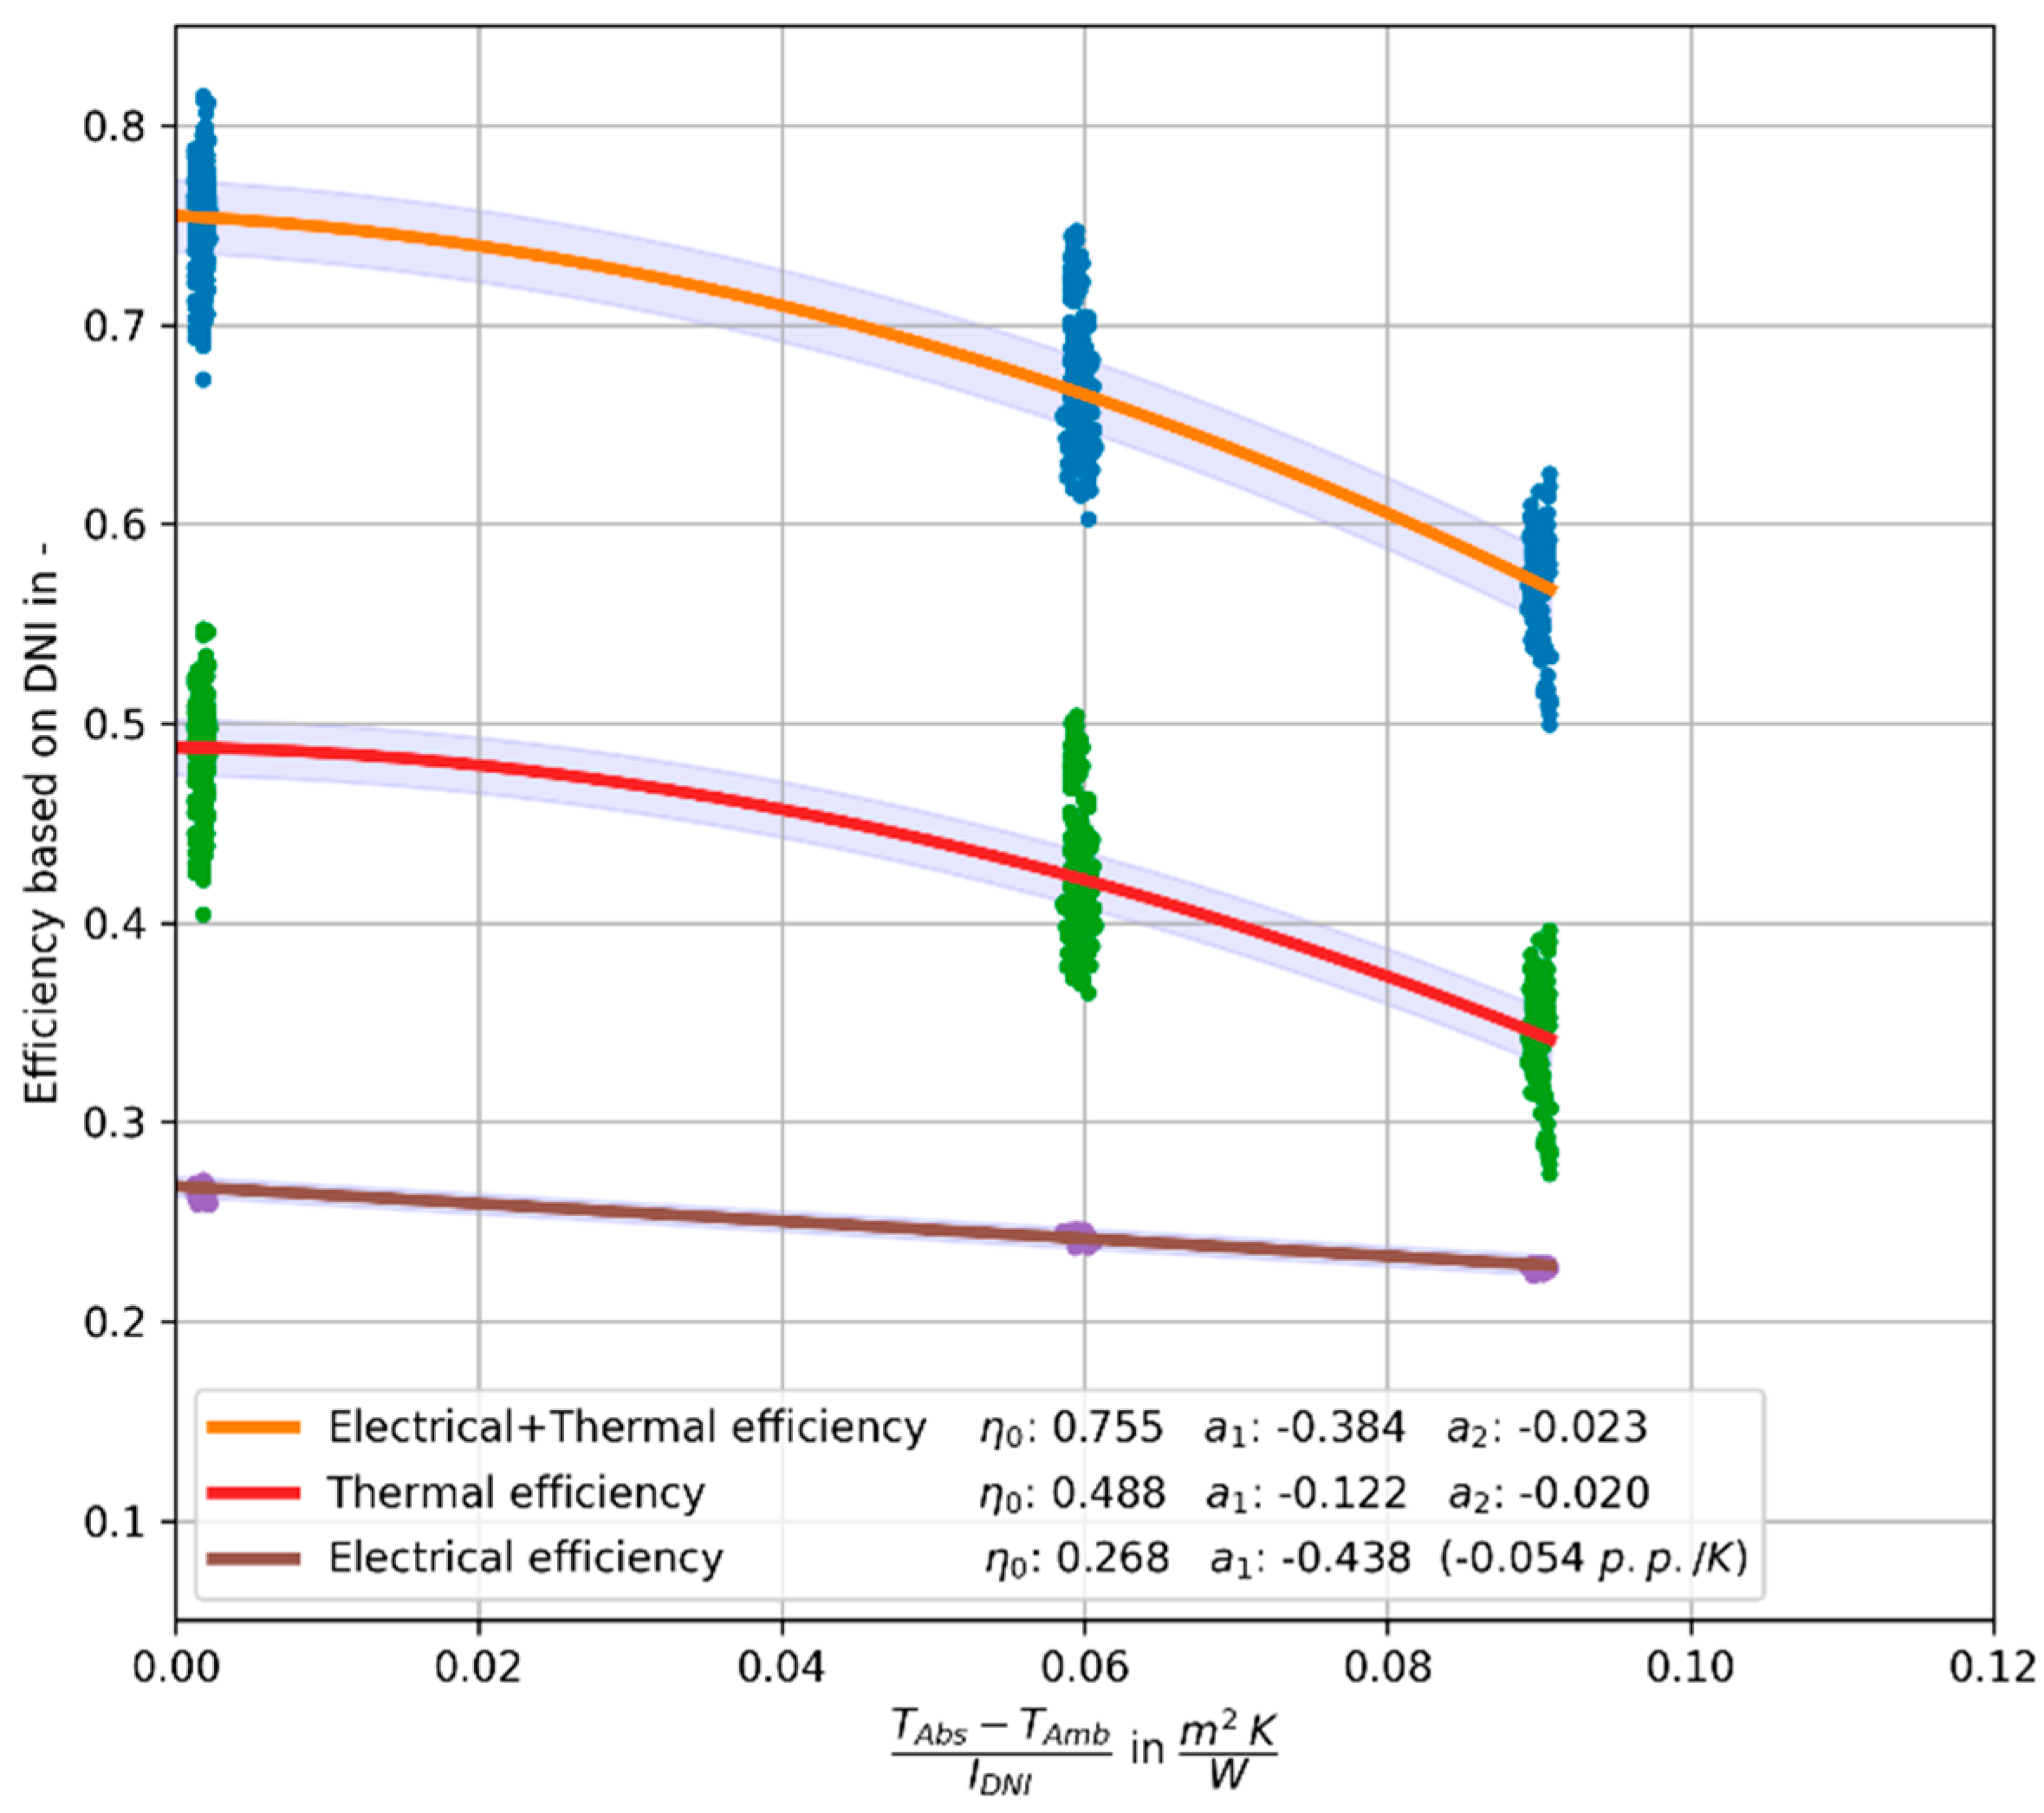
2.1.4. Thermal, Electrical and Total Efficiency

Electrical efficiency, like electrical power, is highly sensitive to exact positioning of the line focus on the solar cells. The graph in Figure 13 shows the electrical efficiency during a tracking cycle. (Due to design constraints and mechanical limits regarding the tracking motors’ gear ratio, the sun is tracked intermittently, not continuously. This means that the mirror is “bumped” into the correct position (pointing at the sun) every few minutes.) Three different efficiency measures were calculated:
(a)
The “average cell efficiency” is based on effective solar cell area, neglecting spaces between cells.
(b)
The “maximum cell efficiency” is 30%, if the parabolic mirror shape is ideally adjusted and the cells are positioned perfectly in the focal line.
(c)
The efficiency term “system efficiency” includes the unused spaces between the PV cells. The peak value is 28.5%.
In real-world operation, even with a more frequent tracking interval, it will be difficult to keep the solar cells always perfectly centered within the line focus. Therefore, a more realistic tracking scenario was chosen for the calculation of the electrical, thermal and total efficiencies and their coefficients (red area in Figure 13, corresponding to 95% of the maximum efficiency). Several of these tracking windows were measured at different HTF temperatures and irradiances, resulting in the electrical, thermal and overall efficiencies shown in Figure 14.
During the measurement, the CPV modules were kept at a constant manual operating point (close to MPP), resulting in constant electrical power dissipation and stable thermal output. Thermal power is less affected by tracking inaccuracies than electrical power due to the larger absorption area (i.e., the 40 mm diameter absorber tube is larger than the 10 mm wide solar cell). In the selected tracking interval, the thermal power remains nearly constant. All this resulted in an average electrical efficiency of 26.8% with a concurrent thermal efficiency of 48.8%, giving an overall average system efficiency of 75.6% (optical efficiency, HTF temperature close to the ambient temperature).
The thermal efficiency shows a stronger decrease at higher temperatures due to the suboptimal vacuum quality of 0.15 bar pressure inside the glass cylinder surrounding the absorber during the test phase, resulting in convective heat loss. The reason for this was leakage of the seals between the glass envelope and the absorber tube, which were necessary for assembly/disassembly of the lab prototype. This problem is not expected to occur in commercially produced PTC systems. Hence, the temperature-dependent coefficients (a1, a2) were taken from a test report of a very similar, yet purely thermal, parabolic trough collector to estimate the behavior of the hybrid absorber with a fully evacuated glass envelope [50]. The results can be seen in Figure 15, wherein TAmb is the ambient temperature and TAbs is the absorber temperature, which also corresponds to the mean HTF temperature between the inlet and outlet, Tmean.
The overall efficiency of the NEWSUN hybrid absorber is higher compared to the commercially available, purely thermal, collector (NEP polytrough 1800 [50]) and also generates approx. 27% exergetically higher-quality electrical energy. The area marked red in Figure 15 indicates the point from which proper cooling of the solar cells can no longer be guaranteed (irradiation dependent). The presented characteristic curve of the collector already includes a certain tracking tolerance (95% of optimum) and forms the basis for the overall system simulation model described in Section 2.2.

2.2. Overall Numerical Model (TRNSYS)

2.2.1. Selection of Geographic Locations and Climatic Conditions

Several criteria were used to define relevant locations for the application under consideration. For example, an installation of the plant in close proximity to the sea is advantageous, there should be a corresponding population density, and there should be as much direct solar radiation as possible. Figure 16 shows four selected locations on a world map, including the individual countries’ current water stress. As described in Section 1, this water stress results from climate change, economic development, urbanization and population growth, and thus has a massive impact on the local availability of fresh water.
All four selected sites, with their long-term, average climate data sets (see Table 2), meet the aforementioned criteria and are hence an initial representative selection, although the climate data do differ significantly with respect to the relevant parameter of direct normal radiation. While one can expect about 1100–1200 kWh/(m2a) in Austria, between 1500 and 2200 kWh/(m2a) are available at the selected locations, which means that an operation is more likely to be economically feasible.

2.2.2. Simulation Model Setup

As shown in the system diagram in Figure 17, the presented desalination system consists of two main components: the MED facility, representing the energy consumer; and the newly developed hybrid absorber, representing the energy source.
The collector is coupled with thermal energy storage (TES), which allows the heat generated by the collector to be used at a later time and thus operation of the MED system even during the night hours or during periods of bad weather. Likewise, an electric battery is implemented to store the PV energy yield.

2.2.3. Component Models

  • Parabolic Trough Hybrid Absorber
The parabolic trough hybrid absorber was simulated using a two-model approach, basically combining individual models for the thermal and the PV part of the collector. To take the mutual influence of the electrical and thermal part of the collector into account, the models were coupled as described later in this section. The solar collectors are assumed to be oriented in a way that the fluid passes through pipes, which run on a horizontal north–south axis (i.e., the focal line of the PTC the north–south axis coincide and have a slope of 0°). The collectors rotate around this axis in order to track the sun (i.e., single-axis tracking).
The thermal part of the collector was modeled with Type 536 [53], which was designed for the simulation of linear parabolic concentrating collectors. The parametrization of the model was based on the prototype measurements conducted within the presented project (as discussed in Section 2.2.2 and reference [38]) in order to achieve the best possible match with the actually manufactured hardware. The most important model parameters are listed in Table 3, including the longitudinal Incidence Angle Modifier (IAM) values for different incidence angles. It has to be mentioned that the first- and second-order loss coefficients of the collector have to be provided to the model based on the receiver area. Therefore, the values in Figure 15 were multiplied with the concentration ratio. The collector is operated with water as the heat transfer fluid (HTF) and flow rates are adjusted to meet the following criteria:
(a)
The maximum temperature of the CPV cell must be kept below 100 °C;
(b)
A turbulent flow regime must be achieved to guarantee optimal heat rejection [54];
(c)
HTF pump losses, which have been determined empirically in [38], shall be kept in a reasonable range.
These criteria and the specific HTF flow rate value of 30 kg/(m2h) have also been crosschecked with other findings in literature, such as in [55].
The PV-part of the collector was modeled using Type 562 [56], which is designed for conventional PV modules. Since the model cannot be provided with a concrete concentration factor, it was parameterized using the aperture area of the parabolic trough in order to correctly simulate the CPV cells in the hybrid absorber. The efficiency parameters were then set in such a way that the efficiency curve according to Figure 15 was obtained. Only the direct radiation (DNI) was given as input to the model. The model calculates the PV efficiency according to Equation (1) using linear modifiers for the cell temperature ( η T , c o e f ) and the incident radiation ( η I , c o e f )
η = 1 + η T , c o e f T P V T r e f 1 + η I , c o e f I T I T , r e f η r e f
It has to be noted that η r e f in Equation (1) and Table 4 cannot be directly compared to η 0 in Figure 15. The latter is related to Δt = 0 between HTF and ambient air, while η r e f is related to the reference cell temperature and radiation given in Table 4. Additionally, the absorption coefficient (compare Table 4) has to be considered. The cell temperature T P V is calculated by the model based on an energy balance, considering convective and radiative losses of the PV panel. For calculating the convective heat losses, the model requires the ambient temperature as an input parameter. In the presented use-case, the PV cells are mounted on the hybrid absorber tube as shown in Figure 10. Therefore, the average fluid temperature of the thermal collector model is used as the ambient temperature for the respective inputs of the model. The values provided in Table 4 are used for the resistance of heat transfer on the back and the bottom heat loss coefficient, which in this case are used to describe the thermal contact between the PV cells and the absorber tube. These values were identified in order to achieve a temperature difference of ~13 K between the PV cells and the HTF, as determined in the real-world CAM prototype measurements. Convective losses to the ambient air are neglected, as the cells are situated within an evacuated glass tube (compare Figure 10 in Section 2.1.2). Using the parametrization shown in Table 4, the model showed good agreement with the measured values presented in Section 2.1.
  • MED plant
For the simulation of the MED plant, a simplified black box model based on literature and manufacturer information was used. The thermal power consumption of the MED was determined to be 45 kW. The amount of distillate that can be produced by the MED was calculated based on a publication by Frantz and Seifert [57], who provided a correlation for the gained output ratio (GOR, Equation (2)) as a function of the heating steam temperature for an MED plant coupled with a Clausius Rankine Cycle. In our case, the MED is coupled with solar thermal collectors, using water as the heat transfer fluid, assuming a temperature spread of 7 K on the water side and a water mass flow rate of 553.0 kg/h. Based on the correlation for GOR in [57], the distillate mass flow m ˙ d i s t depending on the water inlet temperature to the MED ( t f l o w , M E D ) was calculated via Equation (3). As the GOR is defined using a steam mass flow, the heat of evaporation Δ h s t e a m was used to calculate an equivalent steam mass flow according to the used Q ˙ M E D . The resulting m ˙ d i s t as a function of the water inlet temperature is shown in Figure 18. In the simulation, tflow,MED was varied in a range from 65 to 85 °C to find out at which temperature the highest amount of distillate can be produced. For reasons of simplicity and since a relative performance assessment is the goal, the seawater salinity was assumed to be constant.
G O R = m ˙ d i s t m ˙ s t e a m = m ˙ d i s t Δ h s t e a m Q ˙ M E D
m ˙ d i s t t f l o w , M E D = Q ˙ M E D Δ h s t e a m G O R t f l o w , M E D
  • Thermal energy storage
The thermal energy storage (TES) was simulated with Type 4c [58]. In the model, it is assumed that the tank consists of N fully mixed, equal-volume segments. In this work, N was set to 10, meaning that the tank is subdivided into 10 vertical temperature levels. The heat loss rate UATES was calculated depending on the tank’s volume VTES according to Equation (4), which corresponds to “efficiency class B” according to [59]
U A T E S = 12 + 5.93 V T E S 1000 0.4 1 / 45
  • Electrical storage and inverter
For storage of electrical energy, a battery was modeled with Type 47a in combination with the inverter model Type 48b, both described in [58]. The battery’s capacity was determined to be sufficient at 60 kWh and its overall (round-trip) efficiency was set to 0.9. For the inverter, an efficiency of 0.94 was assumed, a high limit on fractional state of charge (FSOC) of 0.95 and a low limit on FSOC of 0.1 was set.
  • Pipes
The pipes connecting the TES with the collectors and with the MED were modeled with Type 31 [58], using the parameters provided in Table 5, depending on the collector’s aperture area Acoll. It is assumed that the pipes are thermally insulated on the outside, where the thickness of the insulation corresponds to the pipe diameter and the thermal conductivity is 0.04 W/(m*K).
  • Electricity consumption
The system contains several components that require electrical energy supply. The biggest consumer is the MED, which is equipped with nine trickle water pumps (60 W each), a brine and a distillate pump (265 W each), a vacuum pump (370 W), a pump for re-cooling (370 W) and a saltwater pump (370 W). When the MED is in operation, a total electrical power of 2.18 kW is required.
The pump in the collector circuit Pucoll (Figure 17) requires 1.33 W per m2 of collector aperture area and the pump in the MED circuit requires 200 W. A base load of 100 W is assumed for system control.

2.2.4. System Control

  • Collector circuit control strategy
The pump in the collector circuit (Pucoll, see Figure 17) is switched on when the HTF temperature at the outlet of the collector (tcoll) is 5 K higher than the temperature at the bottom of the heat storage tank (tTES2). It is switched off when tcoll drops below tTES2+1K. The pump is only switched on if the total solar radiation onto the collector is higher than 100 W/m2. As described in [38], the CPV cells have a maximum permissible operating temperature, which limits the HTF temperature in the solar collector to a maximum 95 °C. Therefore, the collector is rotated away from the sun (i.e., stow position), when tcoll reaches 95 °C.
  • MED circuit control strategy
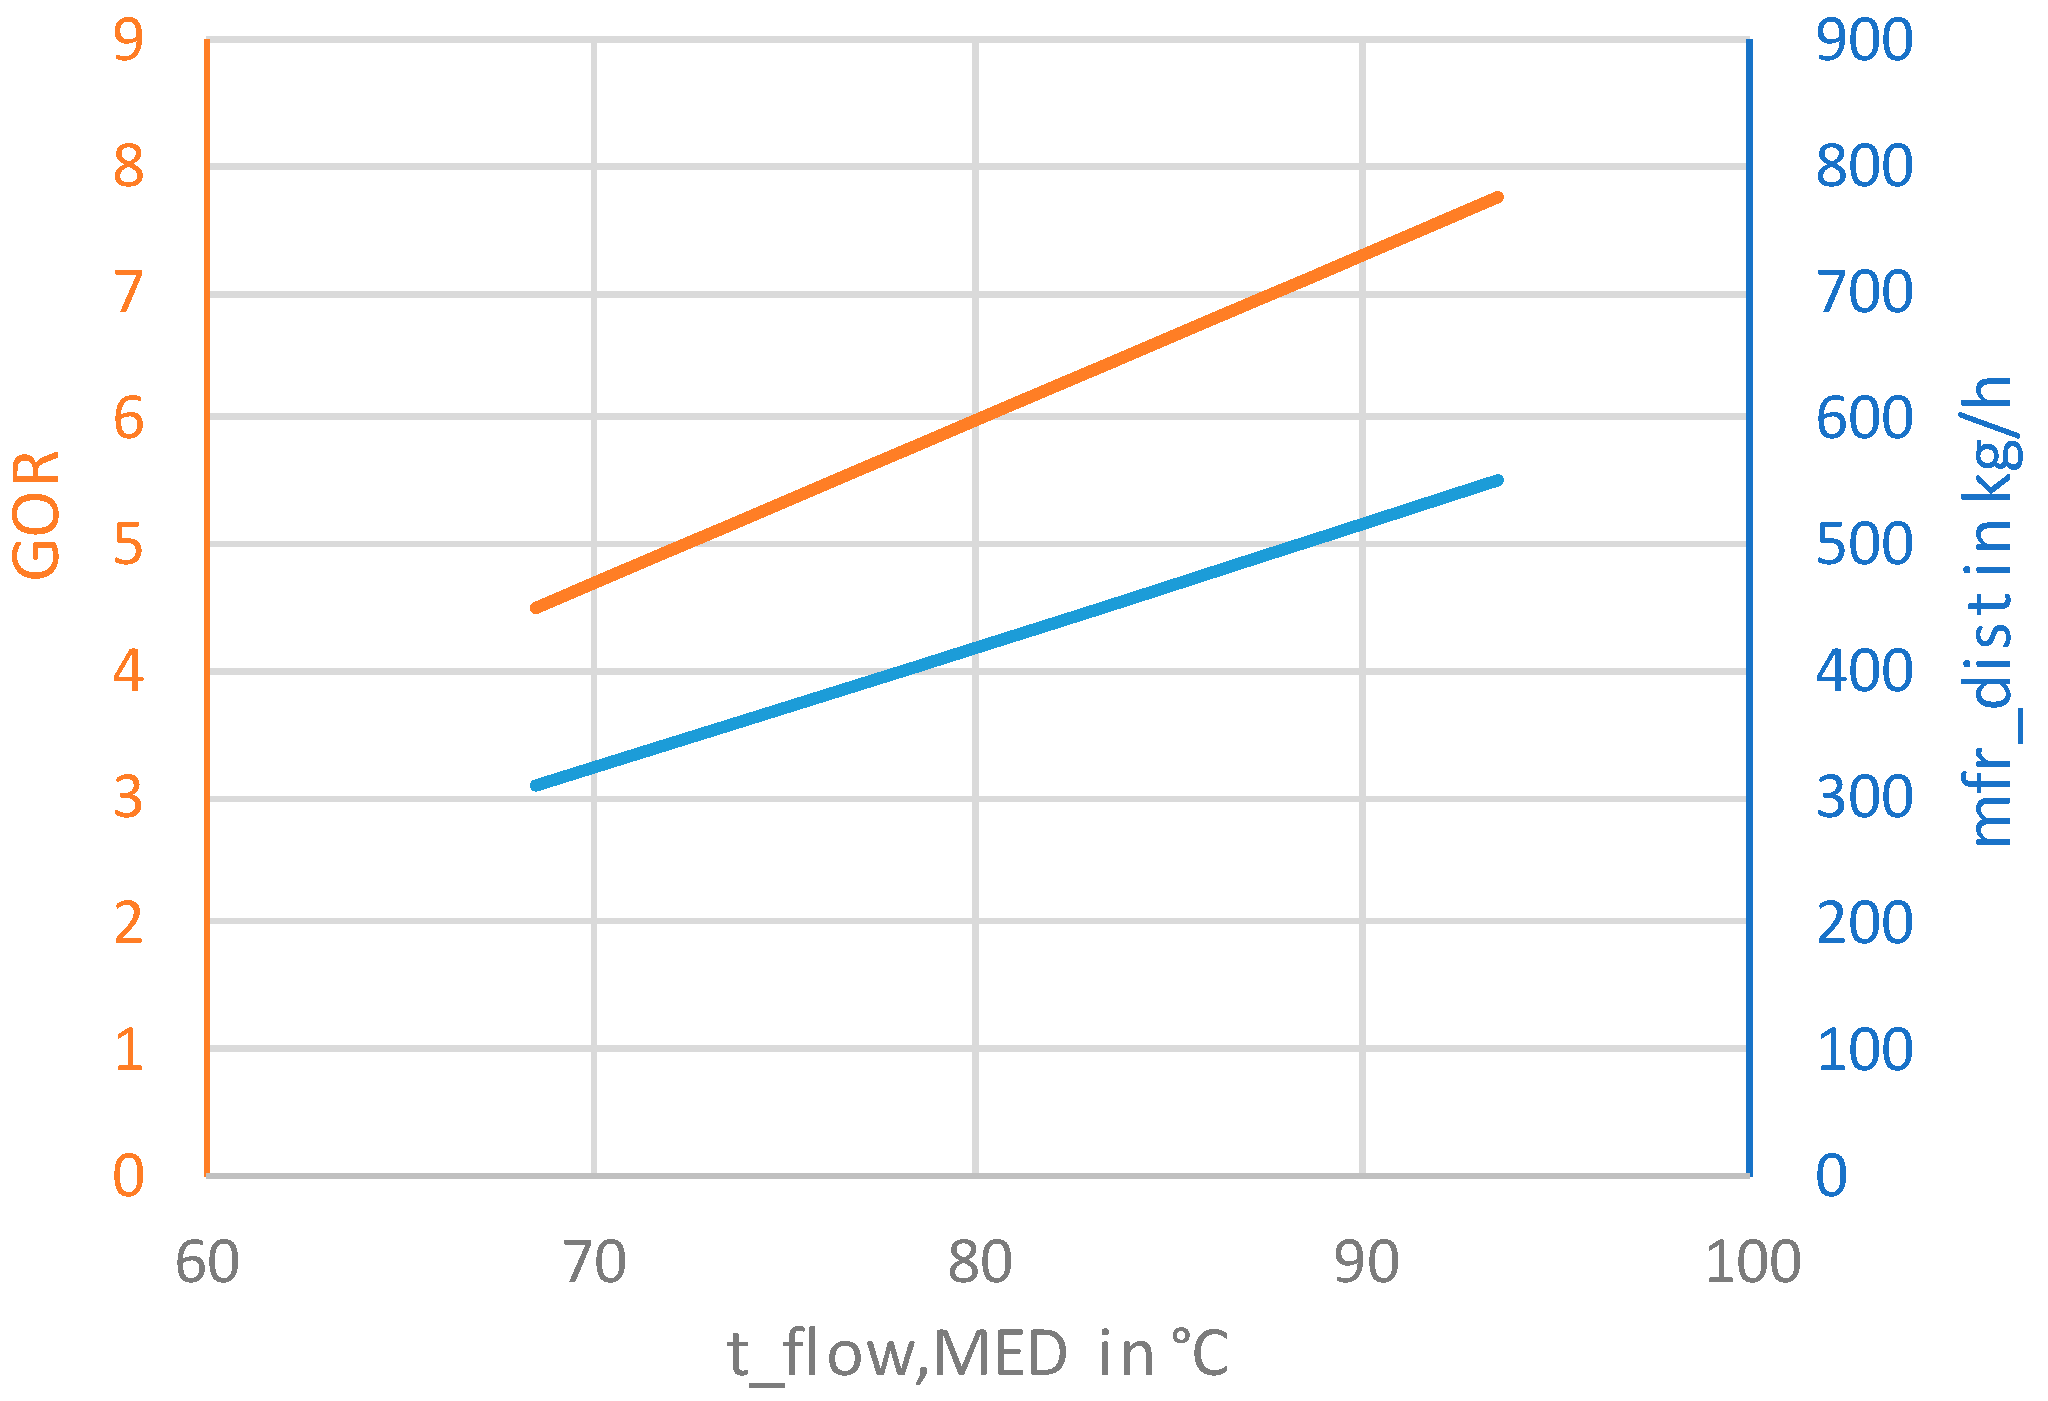
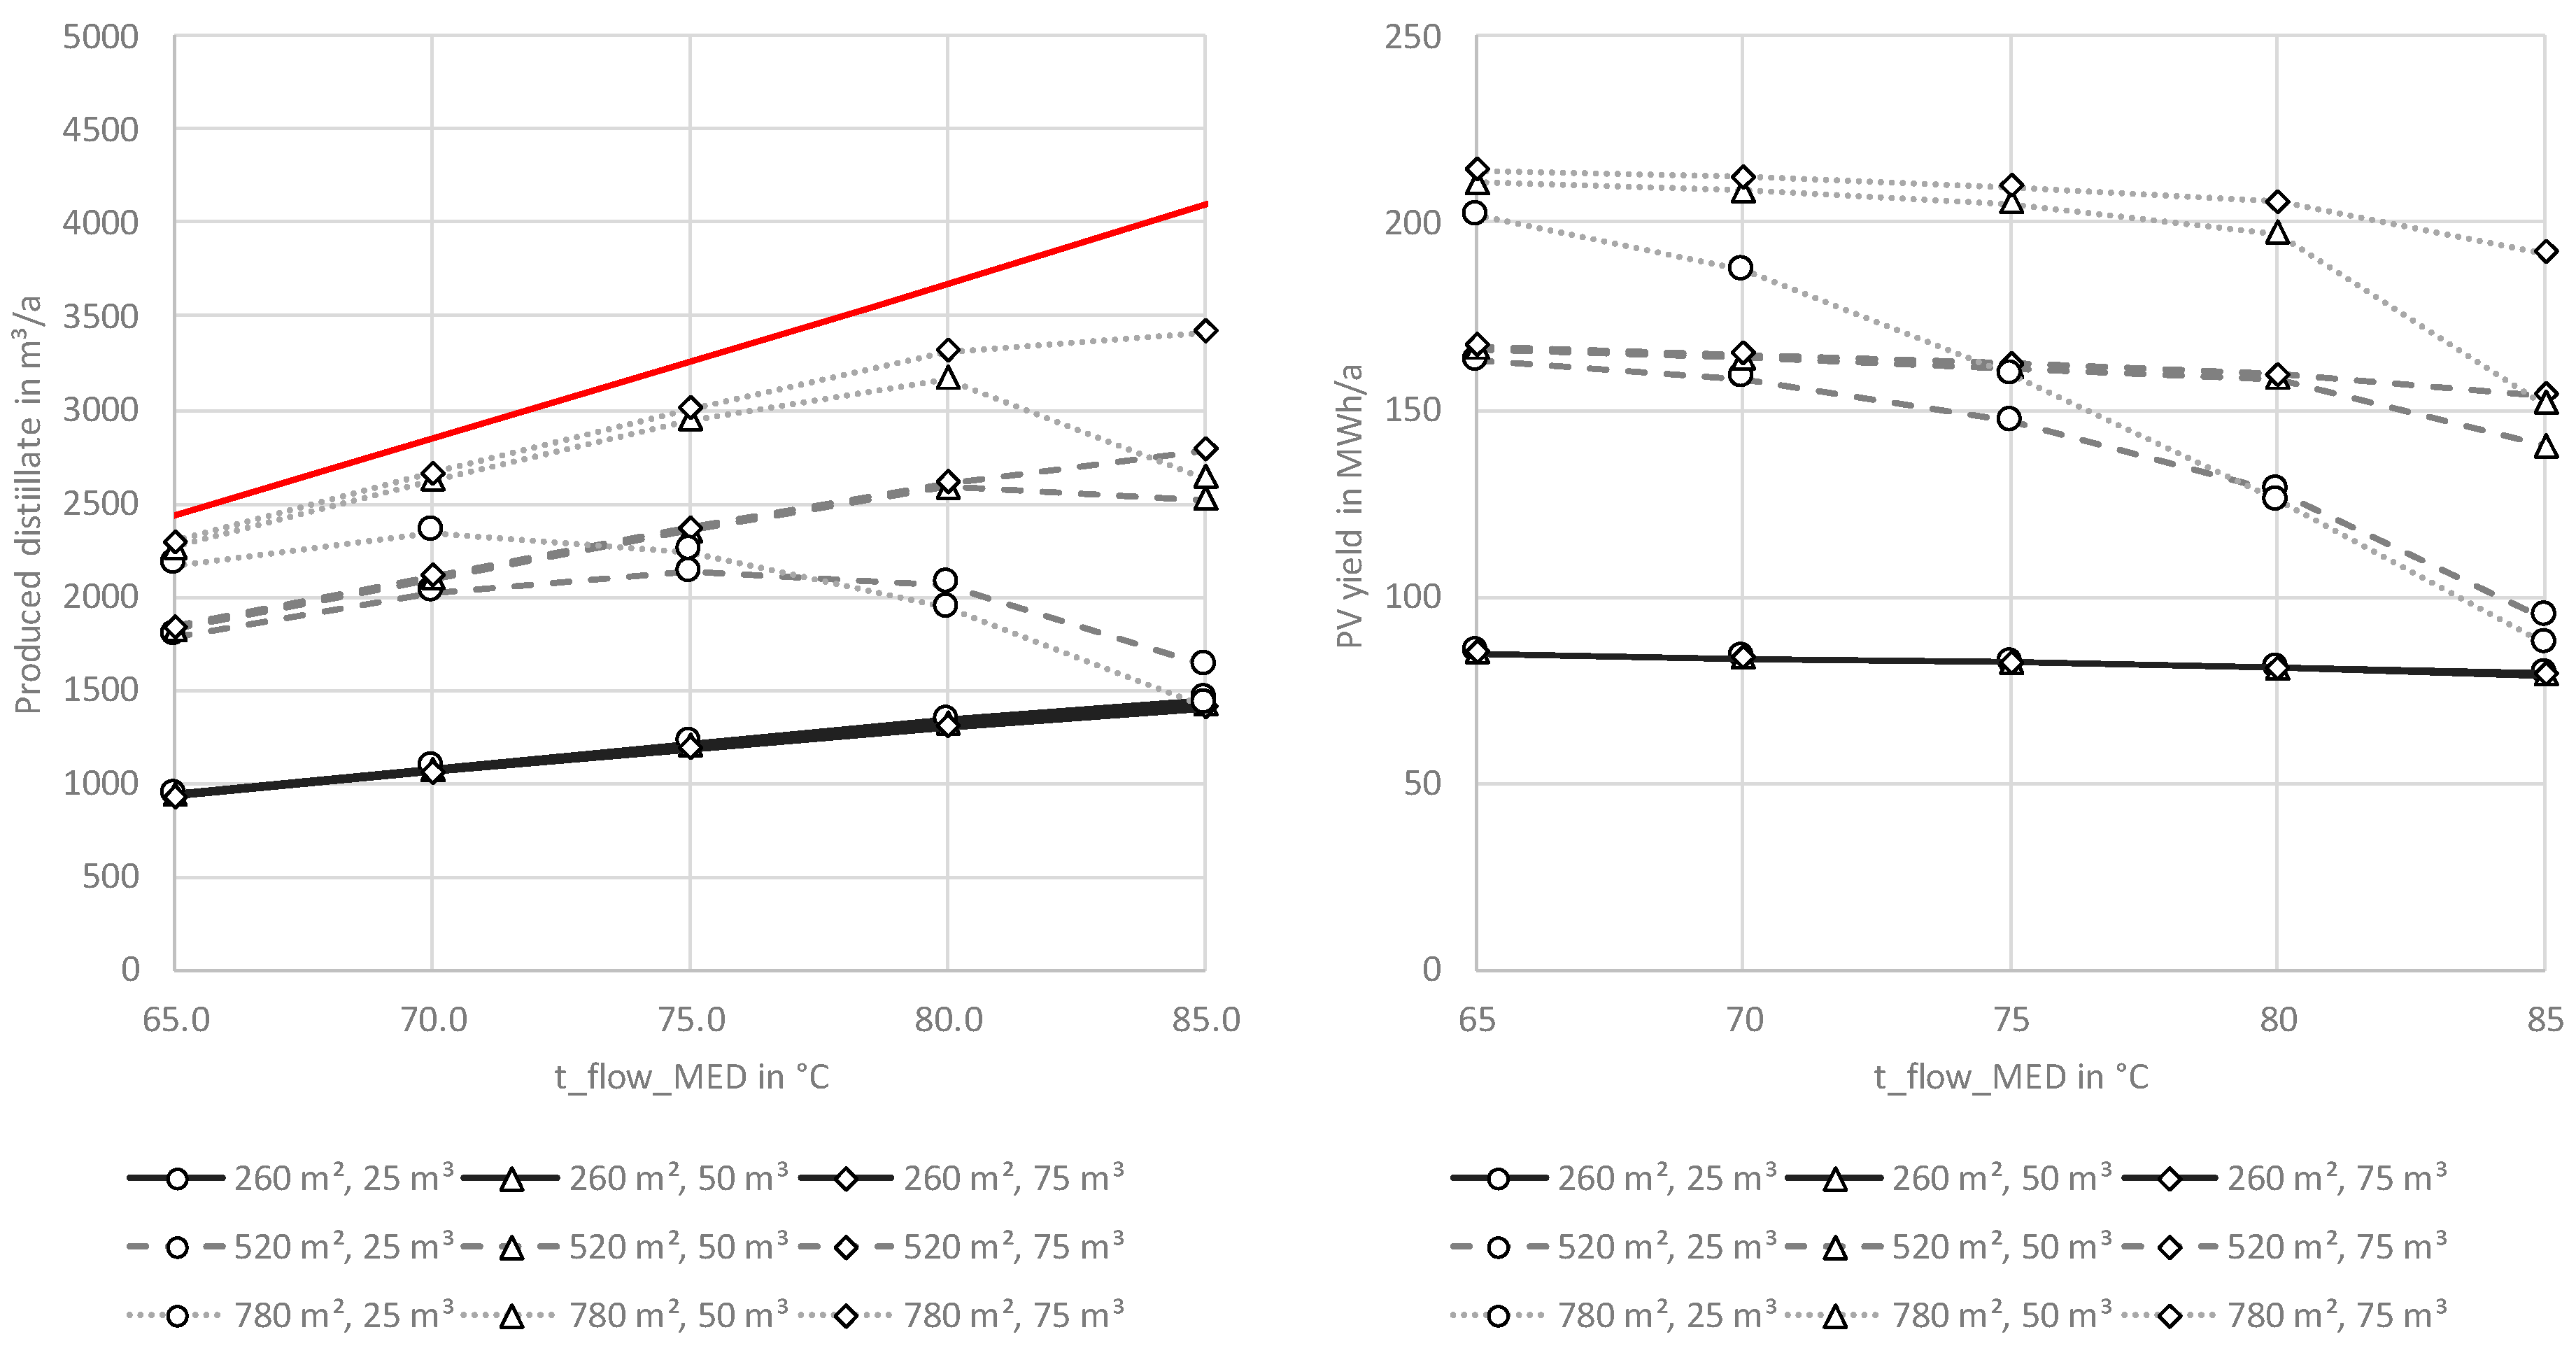
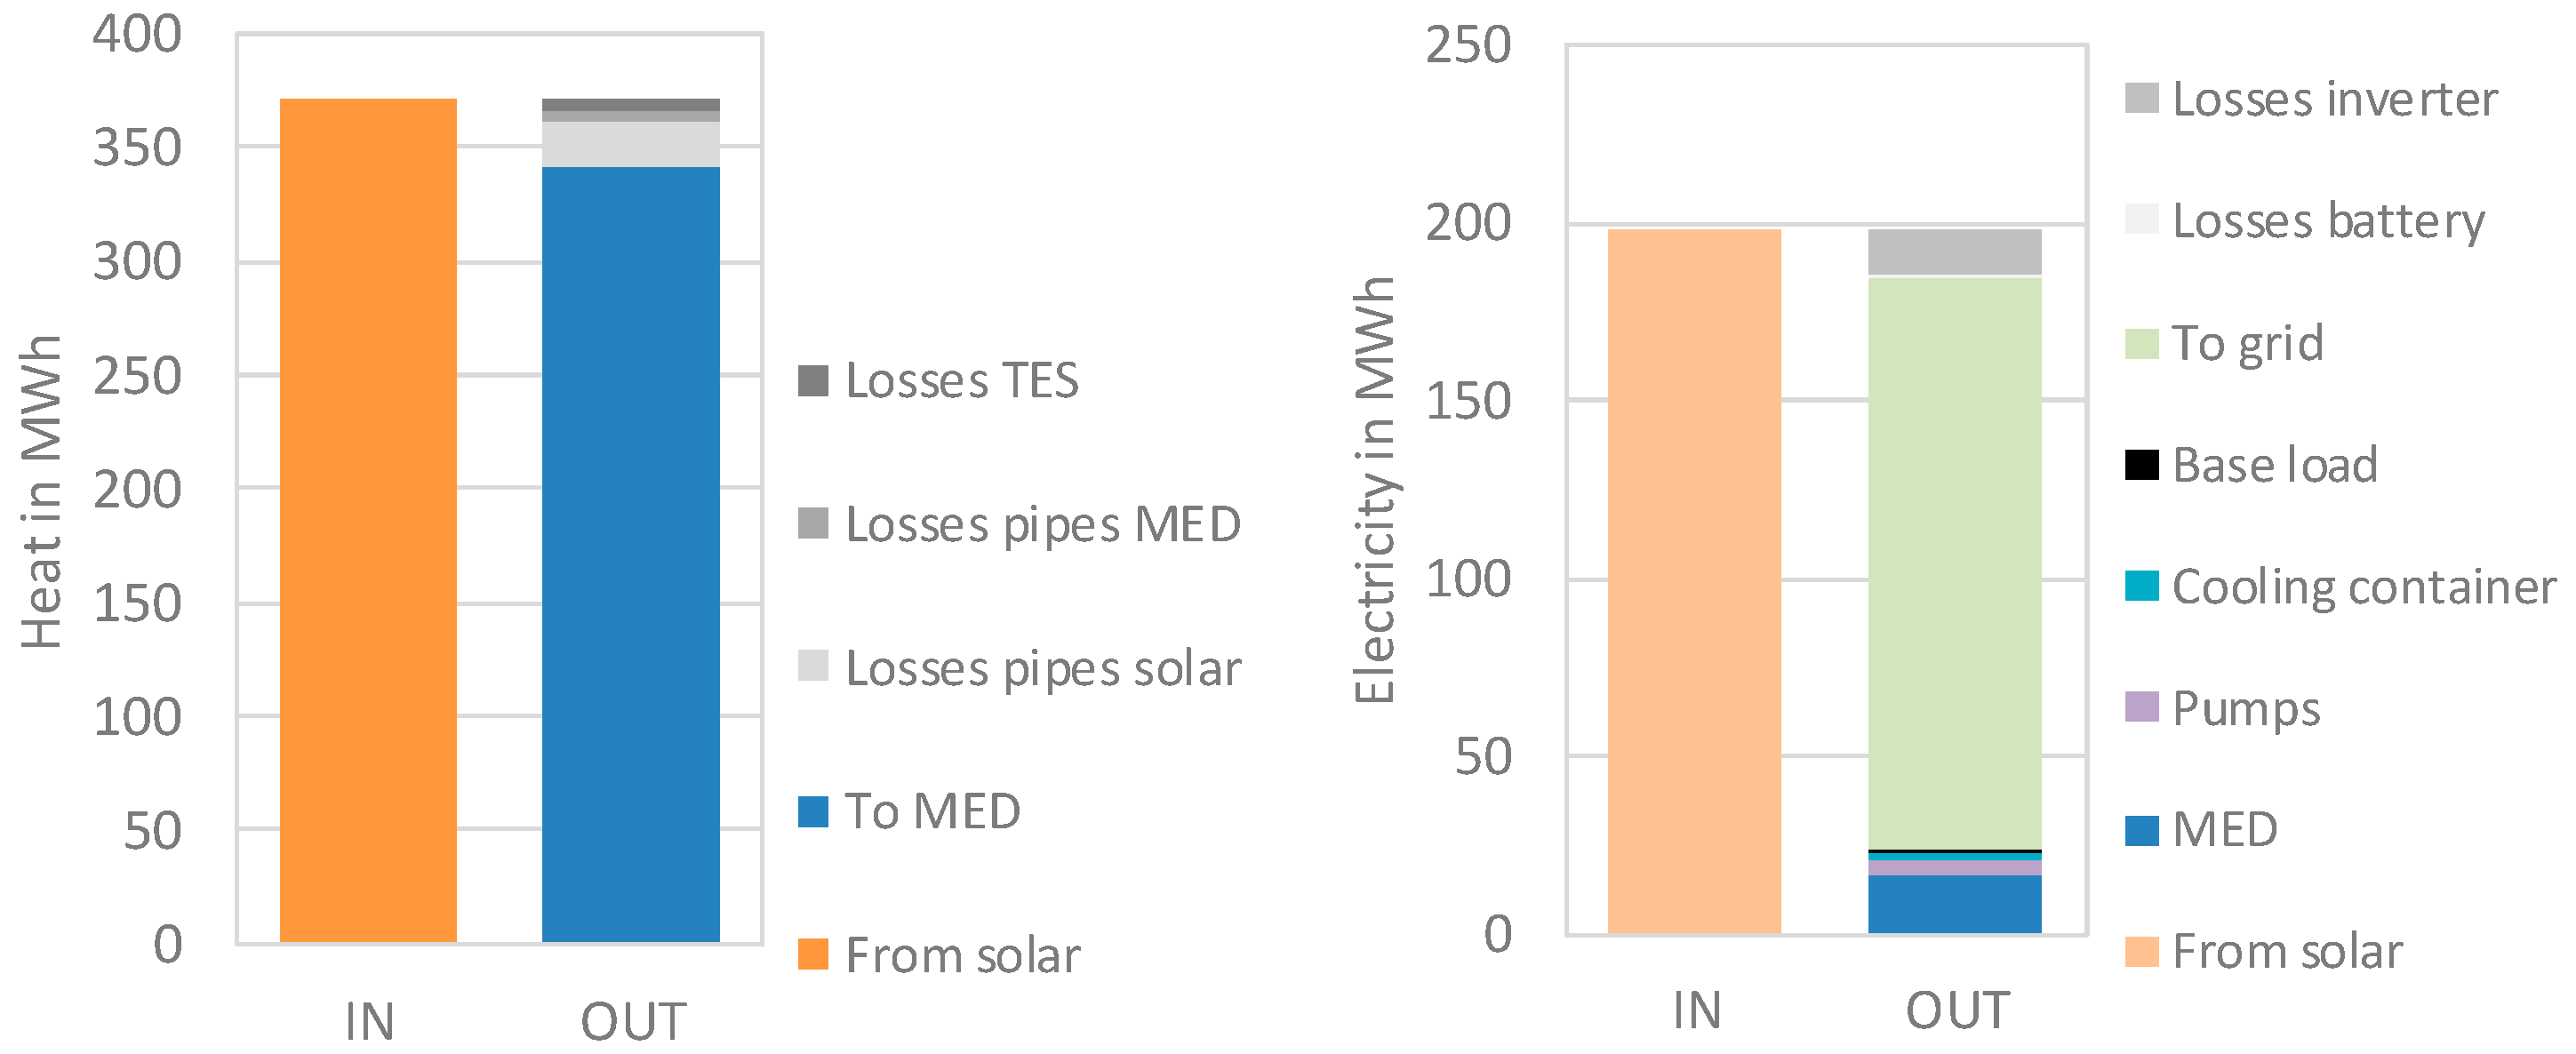
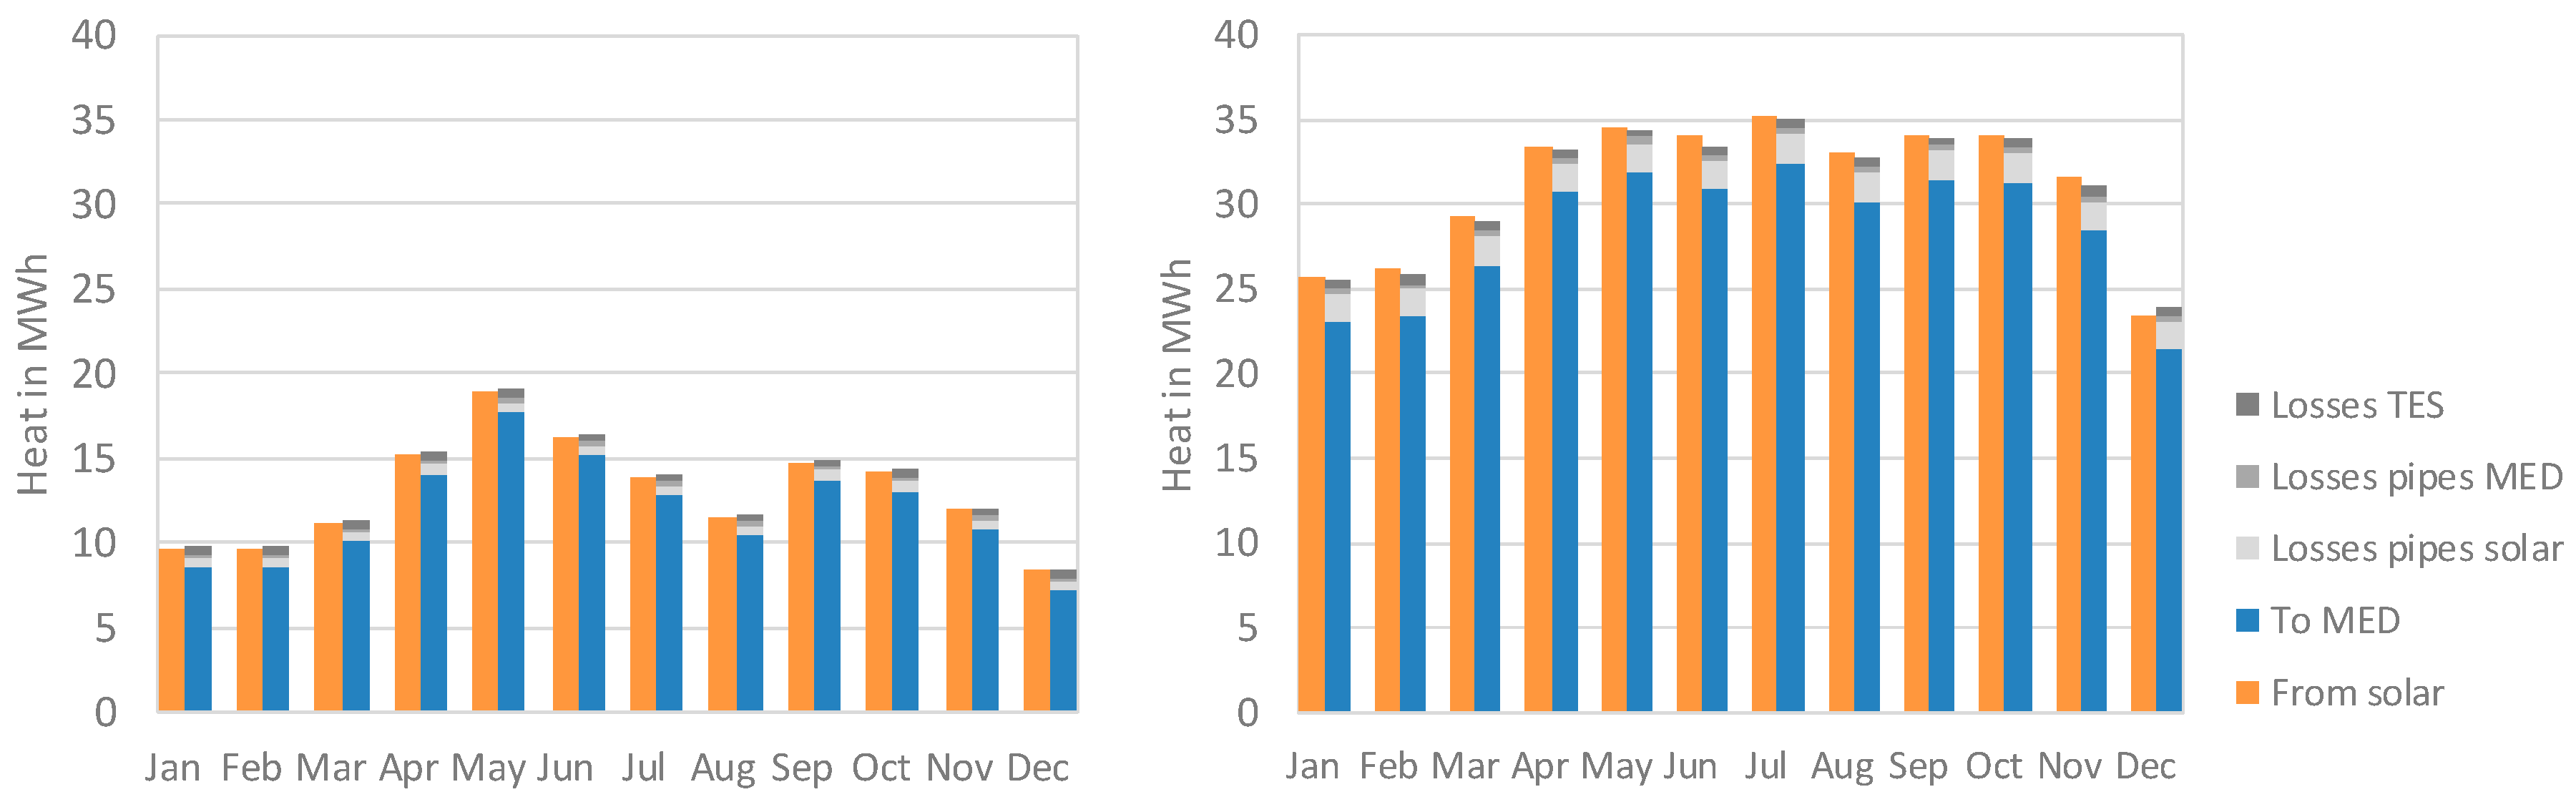
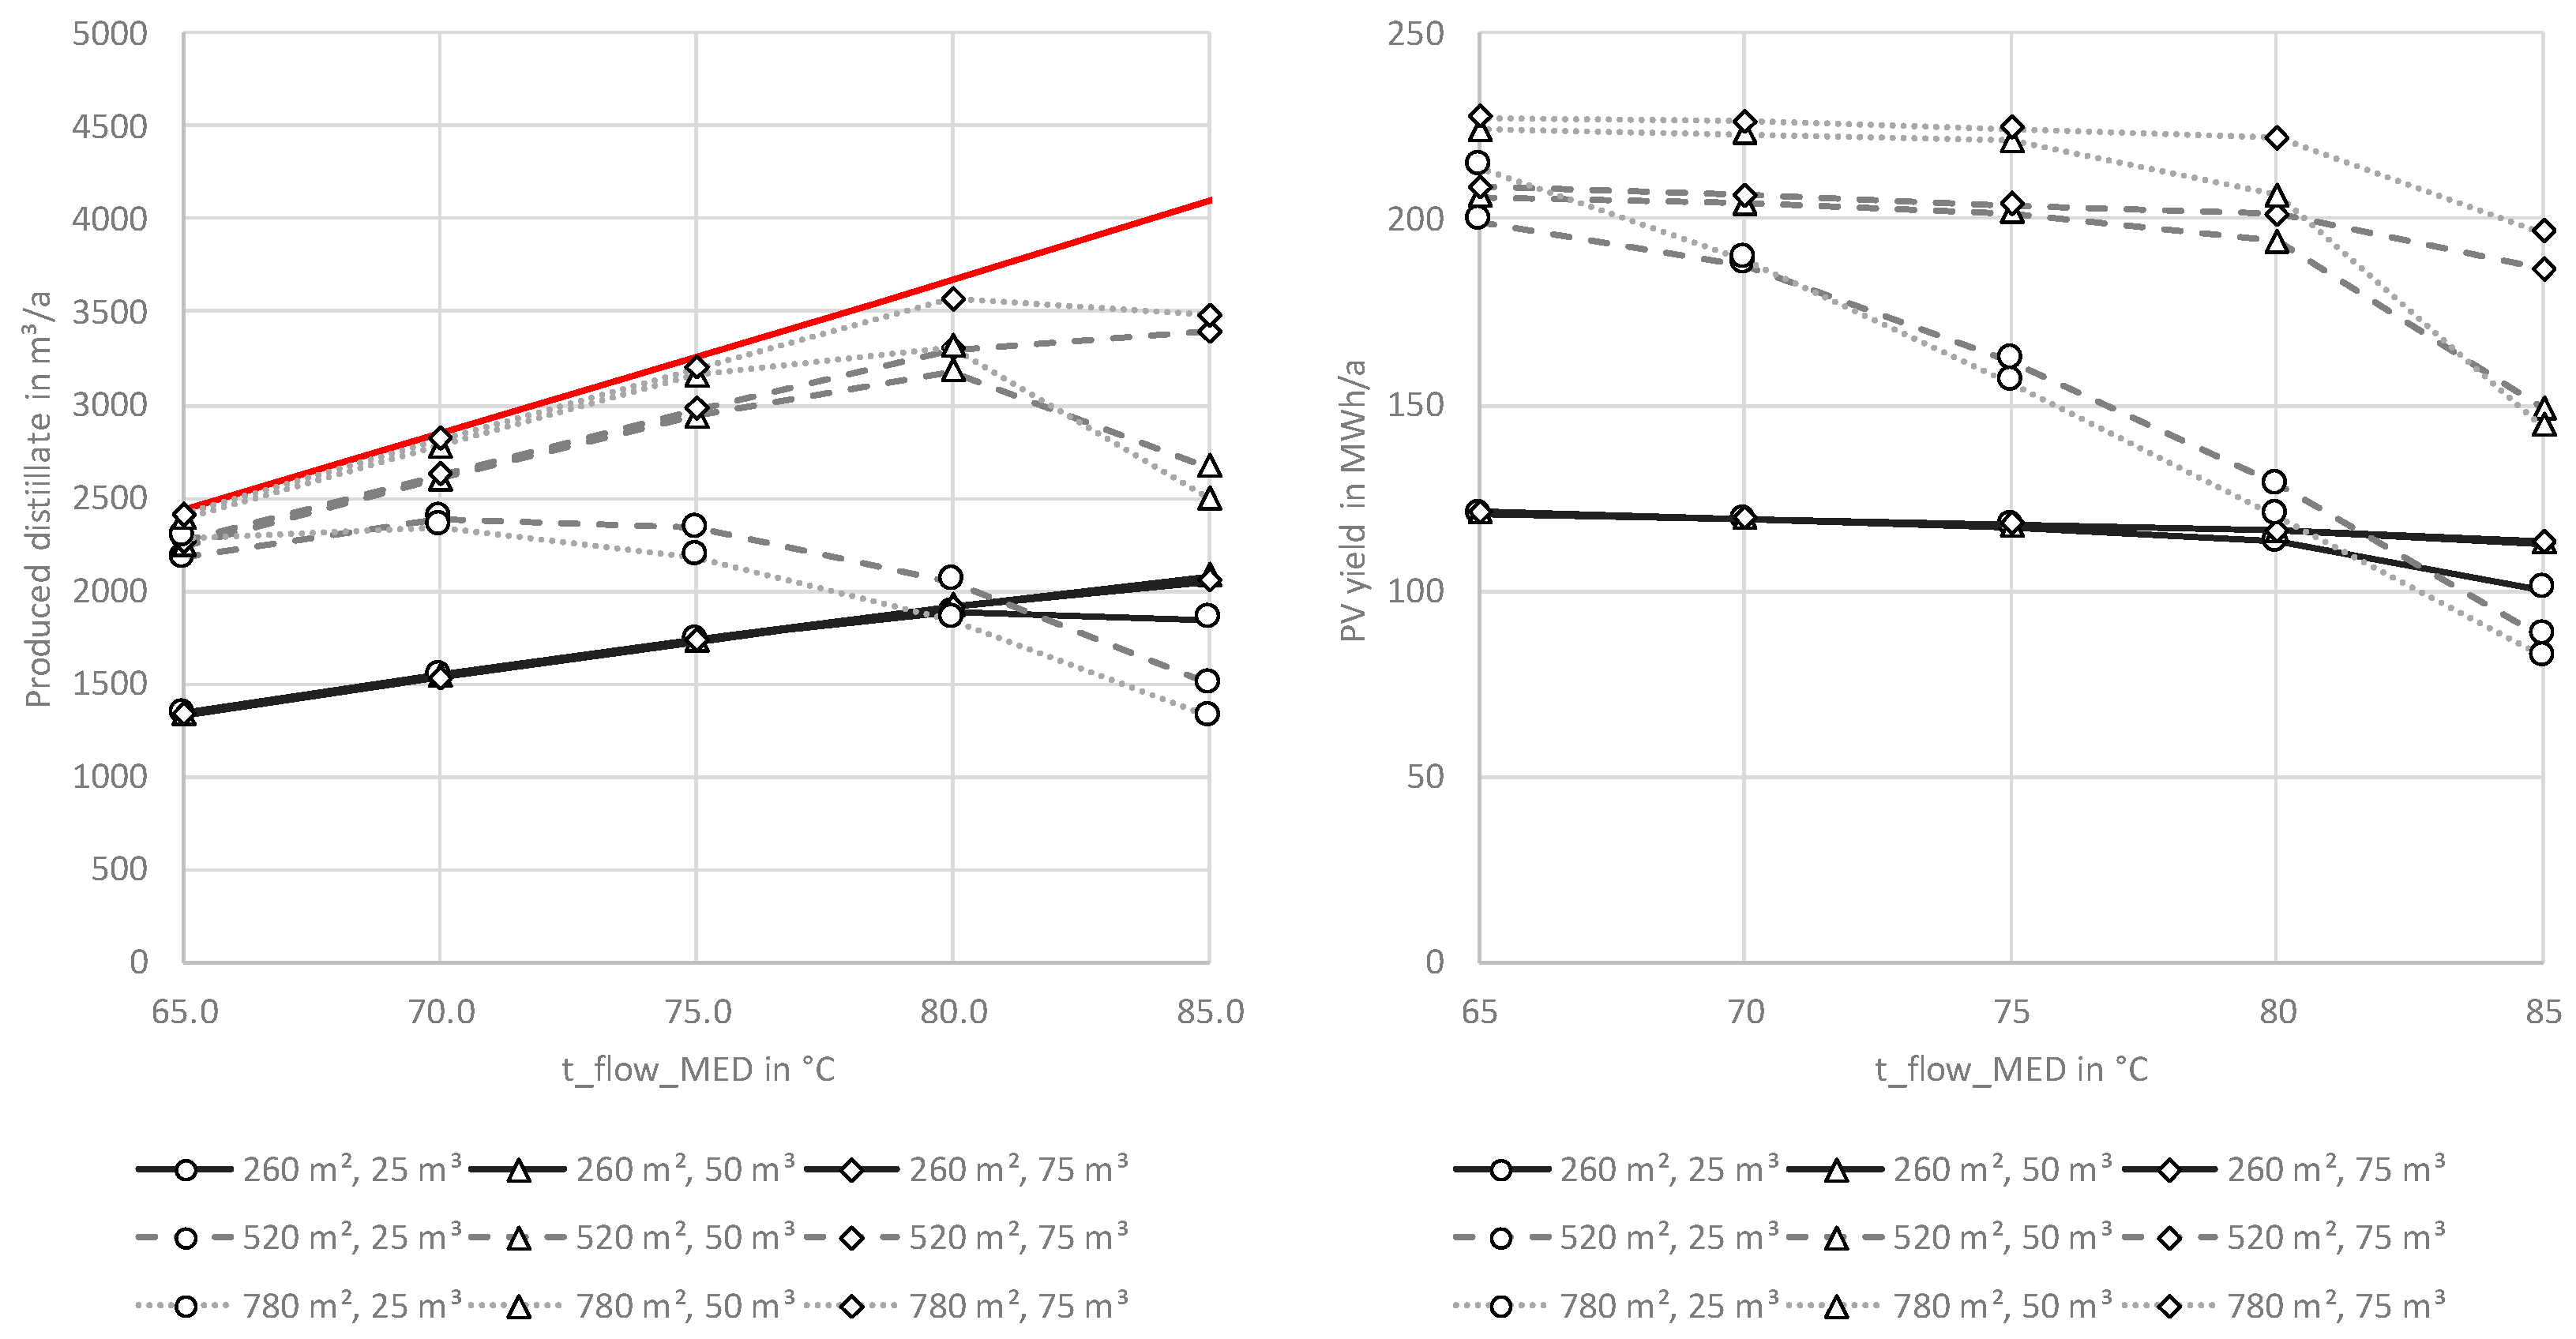
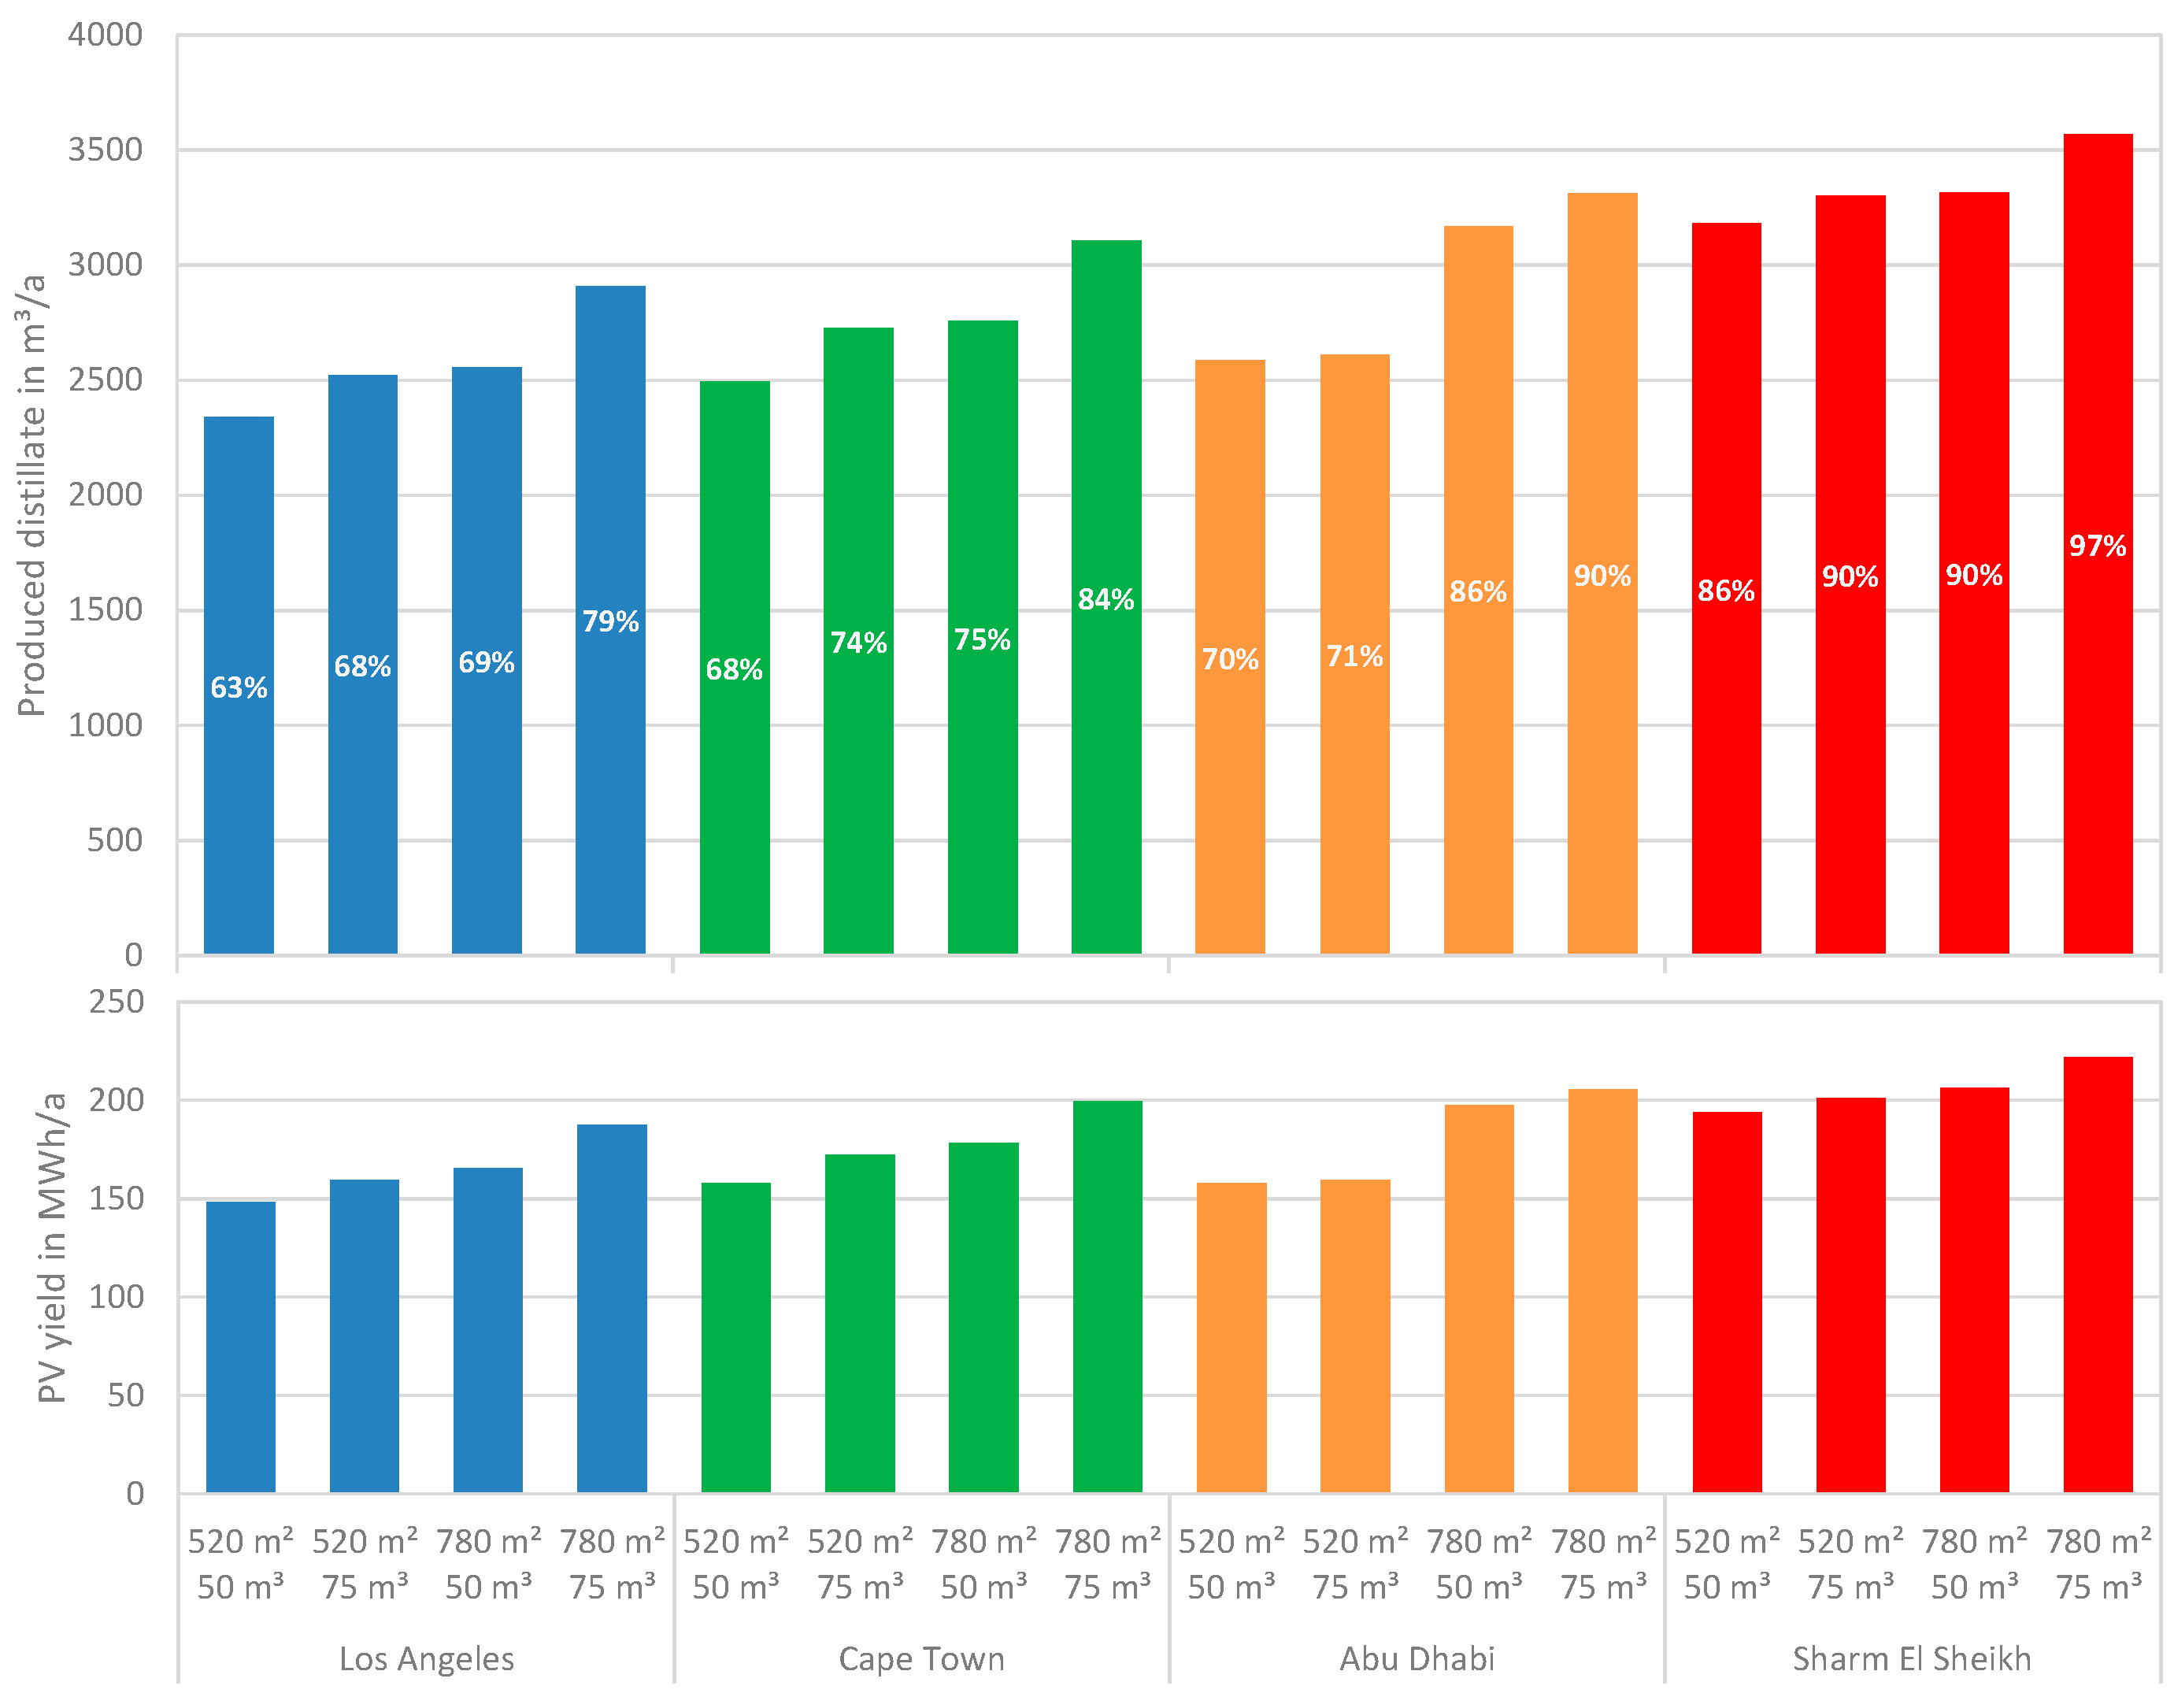
The MED is supplied with thermal energy from the TES. A mixing valve is used to set tflow,MED to the assumed flow temperature required by the MED (Figure 17) by partly mixing the return water from the MED to the flow from the TES. The MED is switched on if the TES temperature tTES1 is higher than the required tflow,MED+2K, and switched off when tTES1 drops below the required tflow,MED. Additionally, the MED can be operated only when the state of charge of the battery is higher than 0.1.

3. Results

Simulations were performed for three collector areas (260, 520 and 780 m2 aperture area) and three TES volumes (25, 50 and 75 m3). In addition, the source temperature (tflow,MED) at which the MED system is operated was varied to determine the temperature that yields the highest distillate volume. On the one hand, a higher source temperature allows a higher GOR of the MED plant, as shown in Figure 18. On the other hand, the overall temperature level in the plant is increased, so that the collectors have to be operated at higher temperatures, and also the temperature difference available for heat storage in the TES is reduced.
The influence of the geographic location was considered by simulations with different climate data sets (see Section 2.2.1). The distillate volume produced per year in m³ was used as a key performance indicator (KPI) for comparing the results.
The results for the Abu Dhabi site are shown in Figure 19. The red line shows the maximum possible distillate volume per year at different source temperatures of the MED. This refers to the quantity that results from uninterrupted operation over a whole year and on the basis of the respective GOR (Equations (2) and (3)) of the MED plant.
It can be seen that the possible distillate amount tends to increase with an increasing source temperature due to the better GOR of the MED, despite the decreasing collector efficiency. For most configurations, the highest values are reached at an MED HTF inlet temperature (tflow,MED) of 80 °C (Figure 19, left). Temperatures were increased in steps of 5 K, and at 85 °C, the distillate quantity decreases again for almost all configurations (i.e., TES and maximum permissible CPV cell operating temperature are limiting). For large collector areas and (too) small storage volumes, the distillate amount decreases already at lower temperatures. This is mainly due to the fact that at higher temperatures, it becomes increasingly necessary to point the PTC away from the sun due to the temperatures being too high for the PV cells (maximum HTF temperature 95 °C, see Section 2.2).
The PV yield (Figure 19, right) basically decreases at higher temperatures due to the lower efficiency of the PV cells. In addition, there is also a large reduction in yield at high tflow,MED and for large collector areas and small TES volumes because the collector must be rotated away from the sun more frequently.
The results in Figure 19 show that at the Abu Dhabi site, assuming a collector area of 780 m2 and a TES volume of 50 m3, more than 90% of the maximum possible distillate quantity can be produced when the MED source temperature is limited to 80 °C. However, it is also shown that the gain in distillate volume is much smaller when the collector area is increased from 520 to 780 m2 than from 260 to 520 m2. As in other applications, this is due to the decreasing utilization of the solar system with an increasing collector area. (Utilization of the solar system: Annual energy demand of the application per collector area in kWh/(m2a).) To this end, Figure 20 and Figure 21 show system energy balances for thermal and electrical energy for two different-sized collector areas. Although here the collector area triples from 260 to 780 m2, the heat generation of the solar system increases from 157 to 372 MWh/a and the PV yield increases from 81 to 198 MWh/a (i.e., by a factor of approximately 2.4). The electricity demand of the MED per m3 of produced distillate amounts to 5 kWh/m3 for the shown variants.
Figure 22 shows the monthly energy balances for the two variants just described. In the case of the variant with Acoll = 260 m2, the heat production is limited by the available collector area or available irradiation. With Acoll = 780 m2, a relatively even energy production is shown over the individual months in summer. Here, the MED system is operated continuously also during the nighttime. Due to the defined output of the MED, the heat production is limited to approx. 33–35 MWh. Only from December to March less heat than required is generated and the MED plant cannot be operated continuously.
The electrical energy balances in Figure 20 and Figure 21 show that much more electricity is produced by the hybrid absorber module than is required by the plant, including all the ancillary units considered. In all calculated scenarios, the electrical energy was provided exclusively by the CPV cells and there was no need to draw energy from the grid at any time. A large proportion of the CPV energy production occurs as surplus and could therefore also be fed into the grid if the NEWSUN system were connected to a supply network. If the system was intended for off-grid operation, it might therefore make sense to design only part of the collector area as hybrid absorbers with CPV cells and the rest as purely thermal collectors. The thermal part of the collector area could then also be operated at higher temperatures, since the restriction due to the maximum permissible operating temperature of the CPV cells (see Section 2.2.1) no longer applies. However, this idea was not investigated any further within the scope of this project.
Finally, the above described methods are applied to investigate different geographic locations. Figure 23 shows the results for the location Sharm El Sheikh in Egypt. Here, due to the significantly higher direct radiation (cf. Table 2), similar values for the distillate quantity and the PV yield are possible already with a collector area of 520 m2, for which 780 m2 are required in Abu Dhabi (Figure 19). With 780 m2, the maximum possible distillate quantity can be almost achieved in Sharm El Sheikh, depending on the storage tank size and the MED source temperature.
Figure 24 shows a comparison of the produced distillate amount and the PV yield for all considered locations and four system configurations with respect to the collector area and storage volume at an MED source temperature of 80 °C. The best results can be obtained in Sharm El Sheikh (3500 m3 distillate per year), which is also the location with the highest sum of direct radiation. In Cape Town, South Africa, where similarly high radiation values are present, significantly lower values can be achieved. This can mainly be attributed to the significantly lower average outdoor temperature and the less favorable angle of incidence of the radiation on the collectors due to the greater distance from the equator. In Los Angeles, USA, the energy yield (and water production for that matter) is still slightly lower, since the radiation values here are lower than in Cape Town at a similar mean outdoor temperature.

4. Discussion

While the presented study has gone into significant detail in specific aspects of CPV-T technology development and underlined the great potential of this technology regarding electrical and thermal efficiency, some aspects such as the overall system model and control strategy were subject to certain assumptions/simplifications. Furthermore, the presented technology requires a fairly high amount of engineering effort and features high complexity compared to competing technologies. This section shall touch upon some of these issues and discuss where further research is required.

4.1. Limitations of the Simulation Approach

The model used for the MED plant is a simplified “black-box model” relying on data found in scientific literature concerning the GOR depending on the source water inlet temperature to the MED. Detailed heat and mass transfer effects within the MED plant and also possible influences of the air humidity are therefore not considered. However, the objective of this work was to assess the general potential of the CPV-T hybrid absorber for the application of MED desalination rather than a detailed analysis of the MED plant itself. Also, a relative comparison between different geographic locations and plant setups (different collector and heat storage sizes) were possible.

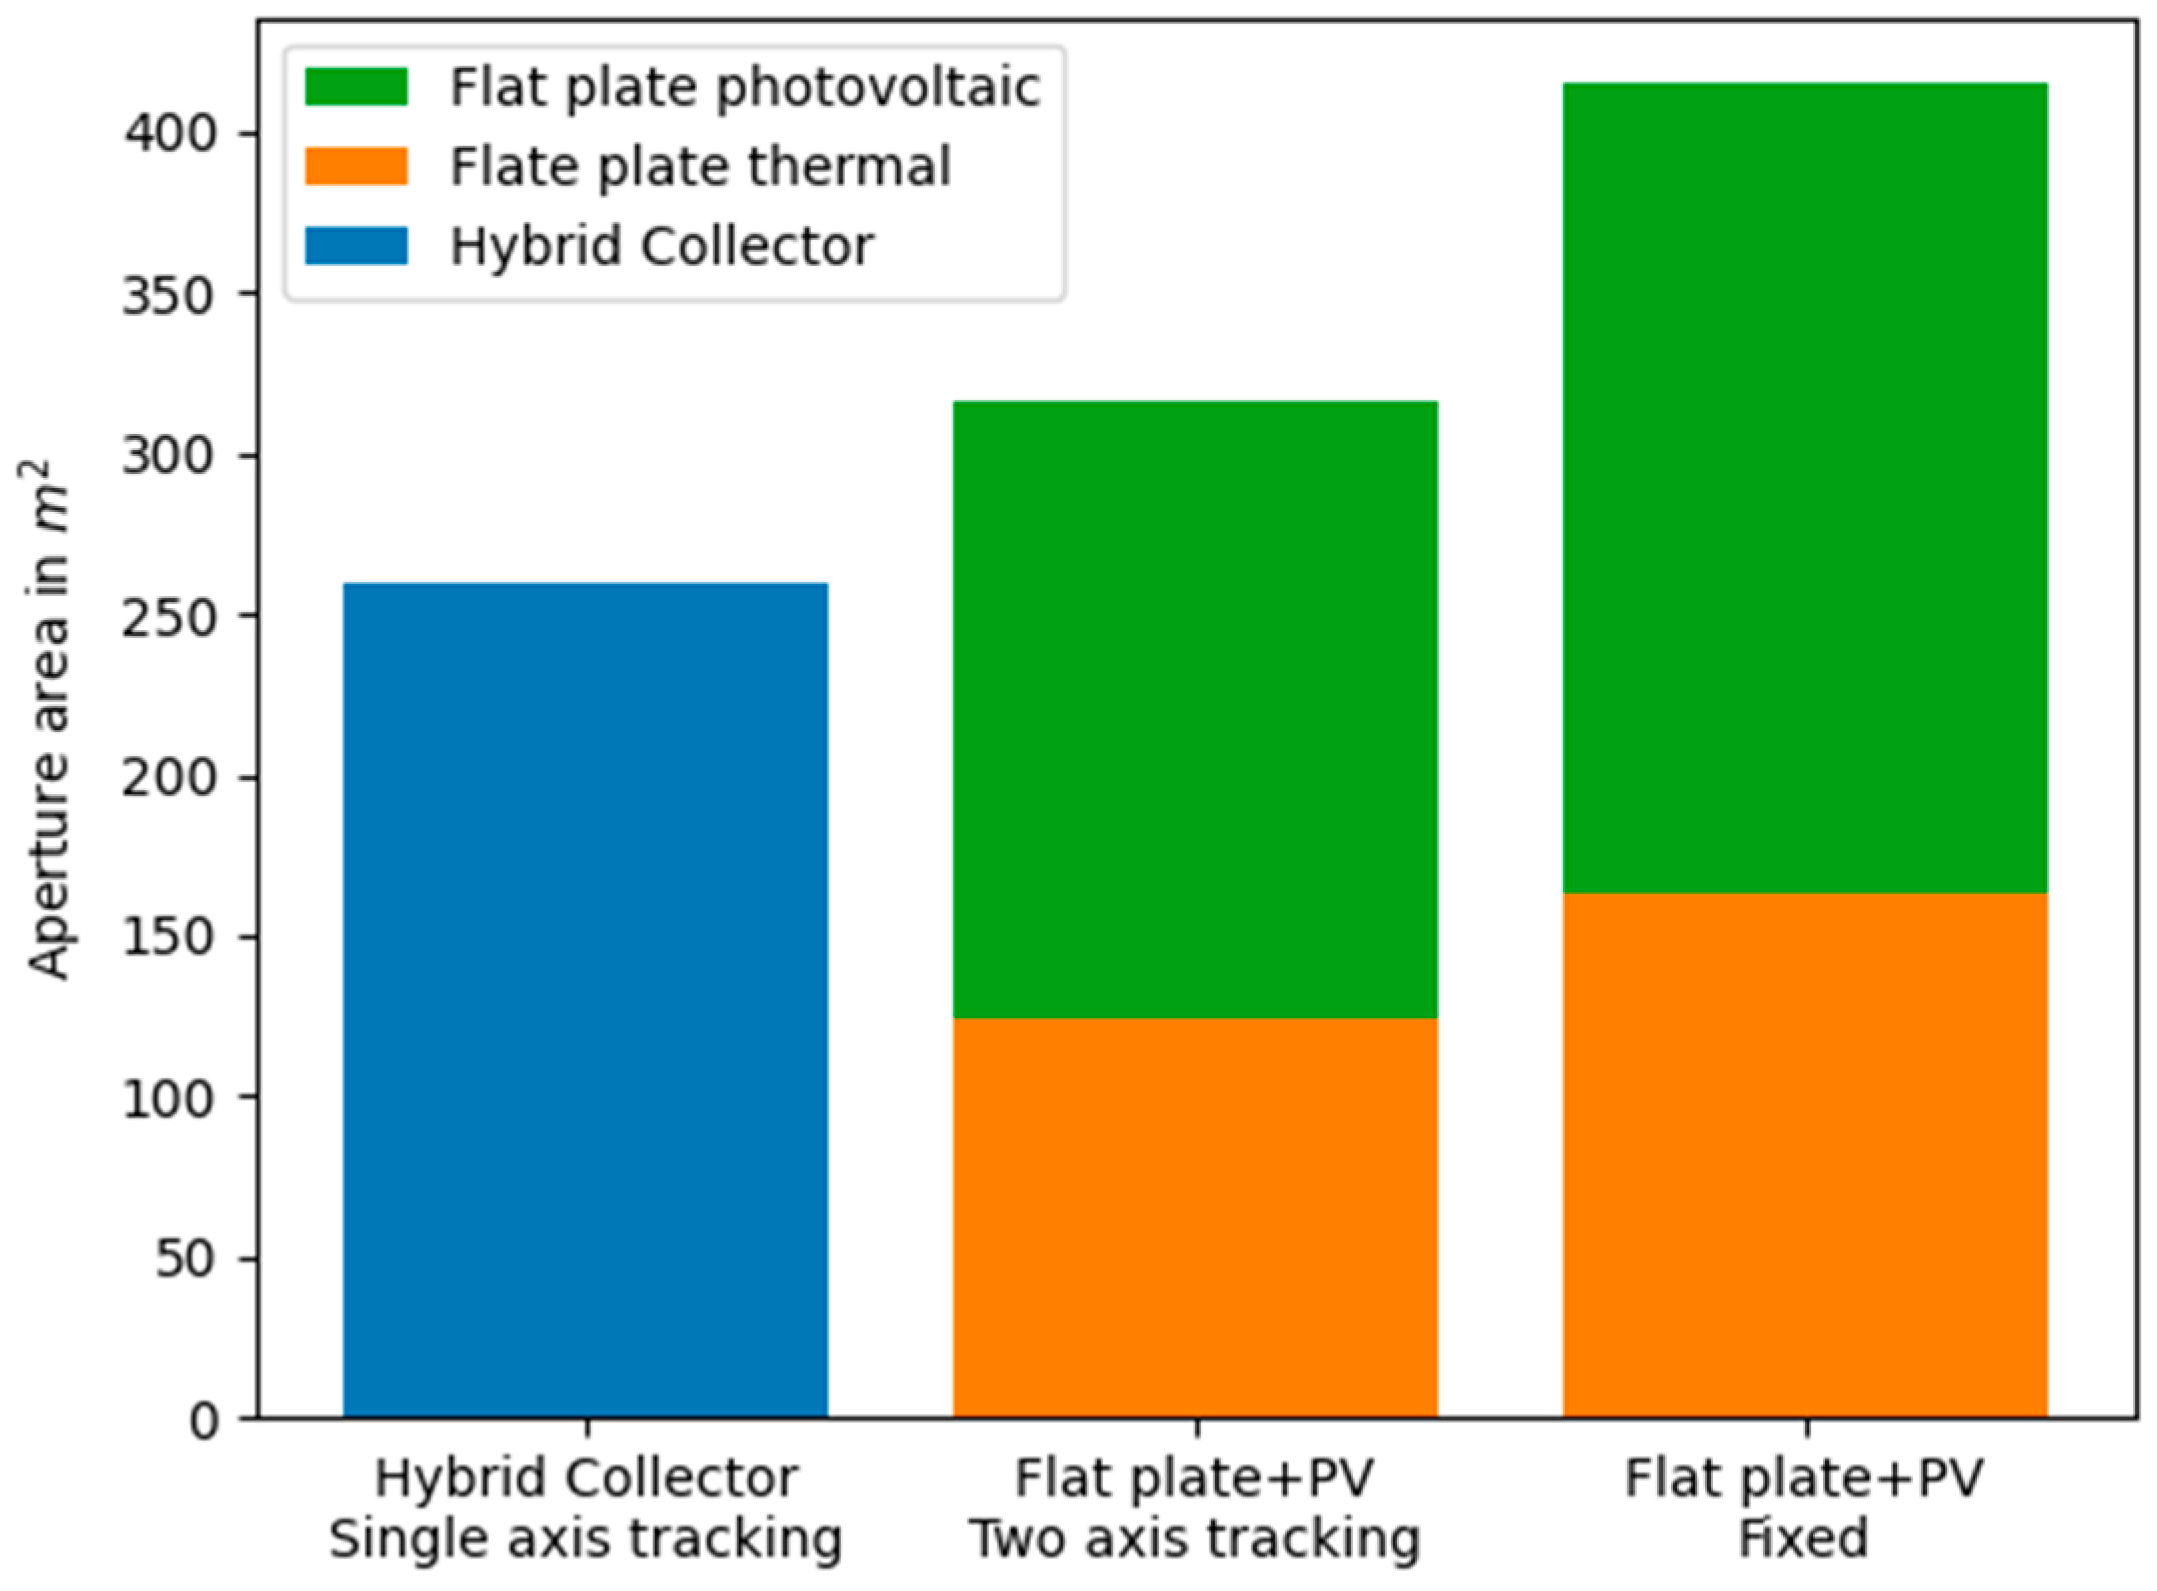
4.2. Comparison with Competing Technologies

While this publication did feature a state-of-the-art analysis of CPV-T technology, it did not focus on the evaluation of other renewable energy sources for MED operation (e.g., industrial waste heat, geo-thermal energy) in general or competing solar technologies in particular. Flat-plate collectors, that is standard c-Si-based solar PV modules for electricity generation and vacuum tube collector for heat generation, form an obvious alternative, but some less obvious properties need to be assessed.
The main advantage of a “separated architecture”, meaning the use of PV + solar thermal modules, lies in the simplicity of the approach since no tracking is needed and also diffuse radiation can be utilized. However, this advantage may be outweighed by the following two properties of the presented hybrid absorber technology:
(a)
Higher system efficiencies and lower installation space requirements.
As illustrated in Figure 25 below, the CPV-T approach leads to higher energy yield per m2. This is of critical importance when installation space is limited, for instance on rooftops of industrial buildings or in coastal regions or when land is expensive. However, it must be noted that the figure below neglects potentially necessary space between the collectors. This may depend on maintenance requirements, as well as the actual terrain and geographic locations as it influences possible shading. With respect to the results shown in Figure 25, please note that climate data was used for the Abu Dhabi site (see Table 2), electrical and thermal energy consumption is based on Figure 20 and an average DNI of 900 W/m2 and an average HTF temperature of 80 °C were assumed. Flat plate photovoltaic efficiency is based on NOCT—Nominal Operating (PV) Cell Temperature—values found in an industrial product datasheet [60]. The collector with the highest efficiency in this temperature range out of 370 collectors from the SPF database is used as a flat plate thermal collector [61,62]. To calculate the difference between fixed- and two-axis tracking, a paper from Jordan was used, which should also be sufficient for a rough estimation for Abu Dhabi [63].
(b)
Techno-economic considerations.
There are of course many factors (e.g., cost of electricity, property prices, maintenance cost of the PTC, etc.) that influence payback times, return of investment (ROI) and other techno-economic performance indicators. Hence, this rather complex task shall be touched upon in a short and concise manner, focusing on only the most relevant aspects and referring to other works described in the literature.
It must be noted that the energy market has proven to be highly volatile in recent years with prices for natural gas peaking at 8.68 EUR/MMBTU (euro per million metric British thermal unit) globally in August 2022, while the current price lies around 1.45 EUR/MMBTU. Also, severe regional differences in gas tariffs may occur, for instance, LNG prices in Dubai have recently been raised to about twice as high as for Abu Dhabi [64]. Furthermore, most governments set natural gas prices depending on the industrial sector. In Egypt, for instance, the unit price for natural gas used in the cement industry is 4 times as high as if it were used to generate electricity [65]. Consequently, it is nearly impossible to make a reliable statement on the payback time of the NEWSUN energy self-sufficient solar-powered desalination system presented in this paper. It is, however, evident that Los Angeles has the highest energy cost and would hence offer a shorter payback period. A more suitable way to assess the economic feasibility of the proposed system may thus be a comparison with competing/currently available parabolic trough collectors.
Commercial state-of-the-art PTCs like the UltimateTrough® (by Flabeg/sbp) deploy complex metal truss structures to support the mirror loads and torsional forces. A comprehensive cost analysis of such systems is given by NREL in [66], revealing a total installed cost of ~175 EUR/m2. According to the study, the mirror support structure including mirror panels contribute to more than half of the overall cost (approx. 100 EUR/m2). The study also highlights the strong sensitivity to steel or aluminum prices. A recent update of this study [67] reveals a slight cost reduction due to several technical improvements.
A successor project to NEWSUN, entitled ECOsun, has focused on economic manufacturing methods and cost reduction of the CPV-T/PTC system and was able to reach a specific price of 147 EUR/m2, as presented in the final project report [68]. These numbers are comparable to other purely thermal PTC systems [69,70]. Assuming a DNI of 1000 W/m2 and considering the conversion efficiencies presented in Section 2.1.3, electricity costs result in 0.55 EUR/W and costs for thermal energy 0.33 EUR/W. This is a significant cost reduction compared to the value of electricity cost of 2.37 USD/W and 8.7 USD/W for the total electrical and thermal costs reported in [71]. However, the same study points at electrical energy costs of ~0.15 EUR/kWh, which is lower than most grid-connected unit costs presented in Table 6.
For a deep dive into the techno-economic analyses of parabolic trough collectors, the authors recommend literature such as [72,73,74].
(c)
Geo-political and material resource related considerations.
Events like the recent war between Russia and Ukraine have in the past triggered (and still are triggering) significant efforts in many countries around the globe to foster the energy revolution and gain independence from energy imports. Since early 2022, Europe has tried to speed up solar PV installation, but has acutely experienced supply issues as almost all PV panels are manufactured in China [75]. This is not only an issue related to the aforementioned economic dependencies, but also an environmental one since c-Si wafer and solar cell production requires high energy expenditure [76], is usually located in Chinese provinces that use coal for electrical power generation [77] and recycling of PV panels has not been properly addressed yet [78,79].
Reducing the needed active PV cell area by a factor of 100 or more while at the same time achieving the same energy yield is hence beneficial.
Furthermore, the remaining technological modules and components of the hybrid absorber technology can be manufactured and assembled in the EU or almost any other part of the world as it requires rather wide-spread technologies such as mirror/glass production (e.g., Saint Gobain located in Courbevoie, France, or Rioglass located in Pola de Lena, Spain, etc.), metal structure design and simple mechatronic components. In other words, material and energy resources can be reduced by deploying smart engineering, which may represent a chance in particular for European countries to regain technological leadership in a certain field of solar power generation.

5. Summary and Outlook

In the course of the NEWSUN project, the plausibility of operating a multi-effect distillation (MED) plant for water desalination exclusively by renewable solar energy was demonstrated. In this context, a hybrid absorber for the provision of both electrical and thermal energy was successfully developed, manufactured and tested. To achieve this goal, a number of intermediate development methodological and technological steps were required, including the selection of the solar cell, the development of a cells’ printed circuit board, the unification into a hybrid absorber, the development of measurement equipment and real-world testing setups, etc., all of which have been described in this publication.
The measurement system and test rig were designed with the specific goal in mind to characterize the co-generation absorber module and generate the required input data for simulation of the entire MED system in TRNSYS. In order to do so, tests under real-world conditions were carried out over a period of several weeks, which provided valuable insights into the robustness and suitability for series production of the developed technology.
In summary, it can be stated that the hybrid absorber could be tested successfully. Prototype testing has demonstrated system efficiencies of 75.5% (48.8% thermal and 26.8% electrical), and some design details have been published in other scientific journals, e.g., [38,49]. The hybrid absorber system was operated at a maximum heat transfer fluid (HTF) temperature of 95 °C, which is quite a viable temperature level for subsequent process heat utilization in the investigated MED plant. It was also shown that due to the use of CPV cells placed in the line focus of a parabolic trough collector (PTC), the solar tracking accuracy requirements increase compared to a purely thermal setup. These increased tracking/accuracy requirements can theoretically be met without significant additional costs if a smart redesign of the collector can be realized by using large-scale manufacturing and assembly technologies. This approach has been investigated in more detail in the follow-up project ECOSun., with results published, for instance, in [39,80,81].
The results of the measurement series of the hybrid absorber were fed back into the overall simulation model of the MED desalination plant. Simulation results revealed that it is possible to desalinate around 2,000,000 L of seawater per year with a 260 m2 plant located in Sharm El Sheik with 75 m3 of thermal storage and to provide valuable drinking water in an energy-independent and sustainable manner. Other geographical locations have also been investigated and discussed.
Despite the high system efficiency, the critical reader may ask whether the increase in efficiency and the resulting gain in area justifies the higher complexity compared to ordinary flat PV modules and thermal flat plate collectors. The answer to this is that hybrid absorber technology is advantageous in those applications where land consumption is an issue (e.g., high land costs or installation on building roofs). Furthermore, it should be emphasized that the hybrid absorber requires significantly less active cell area per generated electrical energy compared to classic PV modules. This is of relevance, since PV cell manufacturing is also energy and resource intensive and takes place mostly in China based on coal-powered electric power plants. It should therefore be seen as a key strategic goal to further reduce the manufacturing costs of this technology in future research projects and by exploiting scaling effects.

Author Contributions

A.B.: conceptualization, writing—original draft, funding acquisition, project administration. A.H.: investigation, formal analysis, visualization, writing—original draft. R.F.: investigation, visualization, formal analysis. H.S.: methodology, investigation and writing—review and editing. R.H.: writing—review and editing, visualization. R.P.: writing—review and editing. H.W.: supervision, resources. All authors have read and agreed to the published version of the manuscript.

Funding

This research was funded by the Austrian Research Promotion Agency (FFG), Austria (grant number 865065) with the Energy Research Programs, 4th Call. The content related to the low-cost injection-molded PTC support structure was part of project ECOSun funded by the SOLAR-ERA.NET Co-fund 2nd Call, managed by the Austrian Research Promotion Agency (FFG), FFG grant number 873785. Open Access Funding by the Graz University of Technology, Austria.

Data Availability Statement

The original contributions presented in the study are included in thearticle, further inquiries can be directed to the corresponding author.

Acknowledgments

We would like to thank our industrial partner IMK GmbH for providing the dual-axis parabolic mirror tracker.

Conflicts of Interest

The authors declare no conflict of interest.

Nomenclature

AMair mass
CAMco-generation absorber module
c-Sicrystalline silicone
CPVconcentrator photovoltaics
CPV-Tconcentrator photovoltaic-thermal
CPV-T-TE concentrated photovoltaic-thermal-thermoelectric
CSPconcentrating solar power
DNIdirect normal irradiance
ECOSuneconomic co-generation of concentrated sunlight
EDelectro-dialysis
EUEuropean Union
FSOCfractional state of char
GHGgreenhouse gas
GORgained output ratio
HTFheat transfer fluid
IAMincidence angle modifier
KPIkey performance indicators
MEDmulti-effect distillation
MPPmaximum power point
MSF multi-stage flash
MCVmechanical vapor compression
NEWSUNNexus of Electricity and Water Supply for Urban Needs
NOCTnominal operating (PV) cell temperature
PCBprinted circuit board
Pipipe
PTCparabolic trough collectors
Pupump
PV-Tphotovoltaic-thermal
ROreverse osmosis
Sisilicone
TESthermal energy storage

References

  1. Parfit, M. Water—The Power, Promise, and Turmoil of North America’s Fresh Water; National Geographic Society: Washington, DC, USA, 1993. [Google Scholar]
  2. Palenzuela, P.; Alarcón-Padilla, D.-C.; Zaragoza, G. Concentrating Solar Power and Desalination Plants—Engineering and Economics of Coupling Multi-Effect Distillation and Solar Plants; Springer International Publishing: Cham, Switzerland, 2015. [Google Scholar]
  3. Tsegai, D.; Medel, M.; Augenstein, P.; Huang, Z. Drought in Numbers 2022—Restoration for Readiness and Resilience; United Nations Convention to Combat Desertification (UNCCD): Bonn, Germany, 2022. [Google Scholar]
  4. U.S. Department of Energy. Energy Demands on Water Resources: Report to Congress on the Interdependency of Energy and Water; U.S. Department of Energy: Washington, DC, USA, 2006. [Google Scholar]
  5. European Investment Bank. How Bad Is the Ukraine War for the European Recovery? EIB Economics Department: Luxembourg, 2022. [Google Scholar]
  6. Biermayr, P. Erneuerbare Energie in Zahlen 2016; Bundesministerium für Land- und Forstwirtschaft, Umwelt und Wasserwirtschaft: Vienna, Austria, 2016. [Google Scholar]
  7. Sharples, J.; Judge, A. Russian gas supplies to Europe: The likelihood, and potential impact, of an interruption in gas transit via Ukraine. The European Geopolitical Forum—EGF Energy Special Contribution. 20 March 2014. Available online: http://www.gpf-europe.com/upload/iblock/c52/egf_energy_special_contribution_pdf.pdf (accessed on 26 November 2024).
  8. Comoplexity Science Hub Vienna. Austria Without Russian Natural Gas? Expected Economic Impacts of a Drastic Gas Supply Shock and Mitigation Strategies. 24 May 2022. Available online: https://www.csh.ac.at/wp-content/uploads/2022/05/2022-05-24-CSH-Policy-Brief-Gas-Shock-Long-Version-EN.pdf (accessed on 31 August 2022).
  9. Our World in Data. Per Capita CO2 Emissions by Sector, World, 2019. 2020. Available online: https://ourworldindata.org/grapher/per-capita-co2-sector (accessed on 20 February 2023).
  10. Ritchie, H.; Roser, M. Clean Water and Sanitation. Our World in Data. 2021. Available online: https://ourworldindata.org/water-access (accessed on 20 February 2023).
  11. Nejat, P.; Jomehzadeh, F.; Taheri, M.M.; Gohari, M.; Abd, M.Z. A global review of energy consumption, CO2 emissions and policy in the residential sector (with an overview of the top ten CO2 emitting countries). Renew. Sustain. Energy Rev. 2015, 43, 843–862. [Google Scholar] [CrossRef]
  12. Akashi, O.; Hanaoka, T.; Matsuoka, Y.; Kainuma, M. A projection for global CO2 emissions from the industrial sector through 2030 based on activity level and technology changes. Energy 2011, 36, 1855–1867. [Google Scholar] [CrossRef]
  13. Le Houérou, H.N. Climate change, drought and desertification. J. Arid. Environ. 1996, 34, 133–185. [Google Scholar] [CrossRef]
  14. Polemio, M.; Casarano, D. Climate change, drought and groundwater availability in southern Italy. Geol. Soc. Lond. Spec. Publ. 2008, 288, 39–51. [Google Scholar] [CrossRef]
  15. Maddocks, A.; Young, R.S.; Reig, P. Ranking the World’s Most Water-Stressed Countries in 2040; World Resources Institute: Washington, DC, USA, 16 August 2015; Available online: http://www.wri.org/blog/2015/08/ranking-world%E2%80%99s-most-water-stressed-countries-2040 (accessed on 29 June 2017).
  16. Heihsel, M.; Lenzen, M.; Malik, A.; Geschke, A. The carbon footprint of desalination: An input-output analysis of seawater reverse osmosis desalination in Australia for 2005–2015. Desalination 2019, 454, 71–81. [Google Scholar] [CrossRef]
  17. Klaimi, R.; Sabla, Y. GHG Emission Reduction Assessment for Desalination Systems through Carbon Capture and Renewable Energy Options. In Computer Aided Chemical Engineering; Elsevier: Amsterdam, The Netherlands, 2020; pp. 1081–1086. [Google Scholar]
  18. Fischetti, M. Fresh from the Sea. Sci. Am. 2007, 297, 118–119. [Google Scholar] [CrossRef]
  19. Khawadji, A.D.; Kutubkhanah, I.K.; Wie, J.-M. Advances in seawater desalination technologies. Desalination 2008, 221, 47–69. [Google Scholar] [CrossRef]
  20. Henthorne, L.; Boysen, B. State-of-the-art of reverse osmosis desalination pretreatment. Desalination 2015, 356, 129–139. [Google Scholar] [CrossRef]
  21. Al-Shammiri, M.; Safar, M. Multi-effect distillation plants: State of the art. Desalination 1999, 126, 45–59. [Google Scholar] [CrossRef]
  22. Ophir, A.; Lokiec, F. Advanced MED process for most economical sea water desalination. Desalination 2005, 183, 187–198. [Google Scholar] [CrossRef]
  23. Michels, T. Recent achievements of low temperature multiple effect desalination in the western areas of Abu Dhabi, UAE. Desalination 1993, 93, 111–118. [Google Scholar] [CrossRef]
  24. Trieb, F.; Müller-Steinhagen, H. Concentrating solar power for seawater desalination in the Middle East and North Africa. Desalination 2008, 220, 165–183. [Google Scholar] [CrossRef]
  25. Felsberger, R.; Buchroithner, A.; Gerl, B.; Wegleiter, H. Conversion and Testing of a Solar Thermal Parabolic Trough Collector for CPV-T Application. Energies 2020, 13, 6142. [Google Scholar] [CrossRef]
  26. NREL. Best Research-Cell Efficiency Chart. Available online: https://www.nrel.gov/pv/cell-efficiency.html (accessed on 27 October 2022).
  27. Pérez-Higueras, P.; Eduardo, F. Fernández. High Concentrator Photovoltaics—Fundamentals, Engineering and Power Plants; Springer—Green Energy Technology: Berlin/Heidelberg, Germany, 2015. [Google Scholar]
  28. Buchroithner, A.; Gerl, B.; Felsberger, R.; Wegleiter, H. Design and operation of a versatile, low-cost, high-flux solar simulator for automated CPV cell and module testing. Sol. Energy 2021, 228, 387–404. [Google Scholar] [CrossRef]
  29. Omar, M.; Sharaf, Z. Concentrated photovoltaic thermal (CPVT) solar collectorsystems: Part I—Fundamentals, design considerations and current technology. Renew. Sustain. Energy Rev. 2015, 50, 1500–1565. [Google Scholar]
  30. Gibart, C. Study of and tests on a hybrid photovoltaic-thermal collector using concentrated sunlight. Sol. Cells 1981, 4, 71–79. [Google Scholar] [CrossRef]
  31. Rios, M.; Edenburn, M.W.; Allen, P.A. Cost effectiveness of concentrating photovoltaic-thermal (PVT) systems vs. side-by-side systems for two intermediate applications. In Proceedings of the IEEE 15th Photovoltaic Specialists Conference, Kissimmee, FL, USA, 11 May 1981. [Google Scholar]
  32. Pérez-Higueras, P.; Adame-Sánchez, C.; Hontoria-García, L.; Rus-Casas, C.; González-Rodríguez, A.; Aguilar-Peña, J.D.; Gallego-Álvarez, F.J.; González-Luchena, I. High-Concentrator Photovoltaic Power Plants: Energy Balance and Case Studies. In High Concentrator Photovoltaics; Green Energy and Technology; Pérez-Higueras, P.F.E., Ed.; Springer: Berlin/Heidelberg, Germany, 2015; pp. 443–477. [Google Scholar]
  33. Joe, S. Performance of a concentrating photovoltaic/thermal solar collector. Sol. Energy 2005, 78, 211–222. [Google Scholar]
  34. DelCol, D.; Bortolato, M.; Padovan, A.; Quaggia, M. Experimental and Numerical Study of a Parabolic Trough Linear CPVT System. Energy Procedia 2014, 57, 255–264. [Google Scholar] [CrossRef]
  35. Bellini, E. Concentrating Photovoltaic-Thermal System with 91% Efficiency. PV Magazine. 6 October 2020. Available online: https://www.pv-magazine.com/2020/10/06/concentrating-photovoltaic-thermal-system-with-91-efficiency/ (accessed on 31 August 2022).
  36. Riahi, A.; Ali, A.B.H.; Fadhel, A.; Guizani, A.; Balghouthi, M. Performance investigation of a concentrating photovoltaic thermal hybrid solar system combined with thermoelectric generators. Energy Convers. Manag. 2020, 205, 112377. [Google Scholar] [CrossRef]
  37. Yang, F.; Wang, H.; Zhang, X.; Tian, W.; Hua, Y.; Dong, T. Design and experimental study of a cost-effective low concentrating photovoltaic/thermal system. Sol. Energy 2018, 160, 289–296. [Google Scholar] [CrossRef]
  38. Felsberger, R.; Buchroithner, A.; Gerl, B.; Schweighofer, B.; Wegleiter, H. Design and testing of concentrated photovoltaic arrays for retrofitting of solar thermal parabolic trough collectors. Appl. Energy 2021, 300, 117427. [Google Scholar] [CrossRef]
  39. Buchroithner, A.; Felsberger, R.; Preßmair, R. Highly Efficient Solar Co-Generation in Parabolic Trough Collectors Using Hybrid Absorber Technologies: Potentials and Challenges. In Proceedings of the PVcon 2022, Ankara, Türkiye, 5–7 August 2022. [Google Scholar]
  40. Giannuzzi, A.; Sansoni, P.; Pierucci, G.; Francini, F.; Sani, E.; Mercatelli, L.; Jafrancesco, D.; Fontani, D. Development of a secondary collector for an existing solar trough. Trans. Eng. Sci. 2013, 88. Available online: https://www.researchgate.net/publication/269631728_Development_of_a_secondary_collector_for_an_existing_solar_trough (accessed on 26 November 2024).
  41. Srivastava, S.; Reddy, K.S. Simulation studies of thermal and electrical performance of solar linear parabolic trough concentrating photovoltaic system. Sol. Energy 2017, 149, 195–213. [Google Scholar] [CrossRef]
  42. Reddy, K.S.; Nikhilesh, R. Optical analysis and thermal management of 2-cell strings linear concentrating photovoltaic system. In AIP Conference Proceedings; AIP: Melville, NY, USA, 2016. [Google Scholar]
  43. AZUR SPACE Solar Power GmbH. Concentrator Triple Junction Solar Cell [Datasheet]. 2016. Available online: http://www.azurspace.com/images/products/0004355-00-01_3C44_AzurDesign_10x10.pdf (accessed on 10 October 2020).
  44. International Energy Agency. Solar Heat for Industrial Processes. Available online: http://task33.iea-shc.org/ (accessed on 14 November 2024).
  45. Vannoni, C.; Battisti, R.; Drigo, S. Potential for Solar Heat in Industrial Processes; IEA SHC Task 33 and SolarPaces Task IV: Solar Heat in Industrial Processes; CIEMAT: Madrid, Spain, 2008. [Google Scholar]
  46. Fortuin, S.; Stryi-Hipp, G. Solar Collectors, Non-concentrating. In Solar Energy; Richter, C.L.D.G., Ed.; Springer: New York, NY, USA, 2016. [Google Scholar]
  47. Kalogirou, S. The potential of solar industrial process heat applications. Appl. Energy 2003, 76, 337–361. [Google Scholar] [CrossRef]
  48. Mohammadi, K.; Saghafifar, M.; Ellingwood, K.; Powell, K. Hybrid concentrated solar power (CSP)-desalination systems: A review. Desalination 2019, 468, 114083. [Google Scholar] [CrossRef]
  49. Felsberger, R.; Buchroithner, A.; Gerl, B.; Schweighofer, B.; Preßmair, R.; Mitter, T.; Wegleiter, H. Optical performance and alignment characterization of a parabolic trough collector using a multi-junction CPV solar cell. Sol. Energy 2022, 239, 40–49. [Google Scholar] [CrossRef]
  50. SPF—Institute for Solar Technology. C1549—Solar Collector Factsheet NEP Polytrough 1800. 2021. Available online: https://eif-wiki.feit.uts.edu.au/_media/technical:renewables:111010_polytrough1200b_techspec_v10.pdf (accessed on 26 November 2024).
  51. Luo, T.; Young, R.; Reig, P. Aqueduct Projected Water Stress Country Rankings; World Resources Institute: Washington, DC, USA, 2015. [Google Scholar]
  52. Meteotest. Global Meteorological Database Version 8, Software and Data for Engineers, Planers and Education; Meteotest: Bern, Switzerland, 2020. [Google Scholar]
  53. TESS. TESSLibs 17—Component Libraries for the TRNSYS Simulation Environment, Volume 10: Solar Library Mathematical Reference; Thermal Energy System Specialists: Madison, WI, USA, 2012. [Google Scholar]
  54. Santos, D.; Azgın, A.; Castro, J.; Kizildag, D.; Rigola, J.; Tunçel, B.; Turan, R.; Preßmair, R.; Felsberger, R.; Buchroithner, A. Thermal and fluid dynamic optimization of a CPV-T receiver for solar co-generation applications: Numerical modelling and experimental validation. Renew. Energy 2023, 211, 87–99. [Google Scholar] [CrossRef]
  55. Hajjaj, M.; Tilioua, A.; Mellaikhafi, A.; Bouaaddi, A. Thermal Performance Analysis of Parabolic Trough Solar Collector System in Climatic Conditions of Errachidia city, Morocco. J. Adv. Sci. Technol. Eng. Syst. 2020, 5, 217–223. [Google Scholar] [CrossRef]
  56. TESS. TESSLibs 17—Component Libraries for the TRNSYS Simulation Environment, Volume 03: Electrical Library Mathematical Reference; Thermal Energy System Specialists: Madison, WI, USA, 2012. [Google Scholar]
  57. Frantz, C.; Seifert, B. Thermal Analysis of a Multi Effect Distillation Plant Powered by a Solar Tower Plant. Energy Procedia 2015, 69, 1928–1937. [Google Scholar] [CrossRef]
  58. TRNSYS. TRNSYS 17: A Transient System Simulation Program, Volume 4: Mathematical Reference; Solar Energy Laboratory, University of Wisconsin-Madison: Madison, WI, USA, 2014. [Google Scholar]
  59. EU. Amtsblatt L239 der Europäischen Union, DELEGIERTE VERORDNUNG (EU) Nr. 812/2013. 2013. Available online: https://eur-lex.europa.eu/legal-content/DE/TXT/PDF/?uri=OJ:L:2013:239:FULL&from=DE (accessed on 5 November 2018).
  60. Jinko Solar Co., Ltd. Tiger Neo N-type 54HL4-(V) 410-430 Watt MONO-FACIAL MODULE. August 2021. Available online: https://www.greenenergy4seasons.be/wp-content/uploads/2022/08/JKM425.pdf (accessed on 15 March 2023).
  61. OST—Ostschweizer Fachhochschule. SPF Institut für Solartechnik. 2023. Available online: https://www.ost.ch/de/forschung-und-dienstleistungen/technik/erneuerbare-energien-und-umwelttechnik/spf-institut-fuer-solartechnik (accessed on 15 March 2023).
  62. SPF Testing, Institut für Solartechnik SPF, Hochschule für Technik Rapperswil. Solar Collector Factsheet Savo-Solar SF500-15DG. 15 December 2016. Available online: https://meriauragroup.com/wp-content/uploads/archive/savosolar.com/products/collectors/index.html (accessed on 15 March 2023).
  63. Hammad, B.; Al-Sardeah, A.; Al-Abed, M.; Nijmeh, S.; Al-Ghandoor, A. Performance and economic comparison of fixed and tracking photovoltaic systems in Jordan. Renew. Sustain. Energy Rev. 2017, 80, 827–839. [Google Scholar] [CrossRef]
  64. Mills, R. Under a Cloud: The Future of Middle East Gas Demand; Center on Global Energy Policy at COLUMBIA SIPA: New York, NY, USA, 2020. [Google Scholar]
  65. GASREG—Gas Regulation Authority. Natural Gas Pricing. Egyptian Ministry of Petroleum. 2024. Available online: https://www.gasreg.org.eg/natural-gas-pricing/ (accessed on 22 November 2024).
  66. Kurup, P.; Turchi, C.S. Parabolic Trough Collector Cost Update for the System Advisor Model (SAM); NREL—National Renewable Energy Laboratory: Golden, CO, USA, 2015. [Google Scholar]
  67. Kurup, P.; Glynn, S.; Akar, S. Manufacturing Cost Analysis of Advanced Parabolic Trough Collector. In Proceedings of the SolarRPACES 2020: 26th International Conference on Concentrating Solar Power and Chemical Energy Systems, Freiburg, Germany, 28 September–2 October 2020; Volume 2445. No. 1. [Google Scholar]
  68. ERA LEARN. Project: Economic COgeneration by Efficiently COncentrated SUNlight. Austrian Research Promotion Agency—Österreichische Forschungsförderungsgesellschaft mbH (FFG). 2023. Available online: https://www.era-learn.eu/network-information/networks/solar-cofund-2/solar-cofund-2-joint-call/economic-cogeneration-by-efficiently-concentrated-sunlight (accessed on 22 November 2024).
  69. Weiss, W.; Rommel, M. Process Heat Collectors—State of the Art within Task 33/IV; Solar Heating and Cooling Executive Committee of the International Energy Agency (IEA): Paris, France, 2008. [Google Scholar]
  70. Krüger, D.R.; Fischer, S.; Fischer, S.; Nitz, P.; Labairu, J.I. Chancen für den Einsatz konzentrierender Kollektoren in Mitteleuropa. In Proceedings of the 31. Symposium Solarthermie und Innovative Wärmesysteme, online, 27–30 April 2021. [Google Scholar]
  71. Daneshazarian, R.; Cuce, E.; Cuce, P.M.; Sher, F. Concentrating photovoltaic thermal (CPVT) collectors and systems: Theory, performance assessment and applications. Renew. Sustain. Energy Rev. 2018, 81, 473–492. [Google Scholar] [CrossRef]
  72. Cortés, F.; Ibarra, M.; Moser, F.; Muñoz, I.; Crespo, A.; Murray, C. Techno-economical evaluation of parabolic trough collectors systems for steam processes in the Chilean industry. AIP Conf. Proc. 2018, 2033, 150003. [Google Scholar]
  73. Wang, Q.; Yao, Y.; Shen, Y.; Shen, Z.; Yang, H. A mutually beneficial system incorporating parabolic trough concentrating solar power system with photovoltaics: A comprehensive techno-economic analysis. Appl. Energy 2024, 360, 122834. [Google Scholar] [CrossRef]
  74. Simeu, C.T.; Njomo, D.; Chara-Dackou, V.S.; Babikir, M.H. Comparative study of thermal performance improvement of parabolic trough solar collector using different heat transfer fluids, economic and environmental analysis of power generation. Results Eng. 2024, 23, 102353. [Google Scholar] [CrossRef]
  75. Marsillac, E. COVID-19 effects on the global PV supply chain. In Proceedings of the 2021 IEEE 48th Photovoltaic Specialists Conference (PVSC), Fort Lauderdale, FL, USA, 20–25 June 2021; pp. 2630–2631. [Google Scholar]
  76. Fthenakis, V. How Long Does it Take for Photovoltaics To Produce the Energy Used? Communities Industry—The Magazine for Professional Engineers, Vol. January/February 2012. Available online: http://www.clca.columbia.edu/236_PE_Magazine_Fthenakis_2_10_12.pdf (accessed on 26 November 2024).
  77. International Energy Agency. Special Report on Silar PV Global Supply Chains; International Energy Agency: Paris, France, 2022. [Google Scholar]
  78. Liu, F.; van den Bergh, J.C.J.M. Differences in CO2 emissions of solar PV production among technologies and regions: Application to China, EU and USA. Energy Policy 2022, 138, 111234. [Google Scholar] [CrossRef]
  79. Duran, A.S.; Atasu, A.; Van Wassenhove, L.N. Cleaning after solar panels: Applying a circular outlook to clean energy research. Int. J. Prod. Res. 2021, 60, 211–230. [Google Scholar] [CrossRef]
  80. Aydin, E.; Buchroithner, A.; Felsberger, R.; Preßmair, R.; Azgın, A.; Turan, R.; Keçeci, A.E.; Bektaş, G.; Akinoglu, B. Development of low-cost c-Si-based CPV cells for a solar co-generation absorber in a parabolic trough collector. Energies 2024, 17, 2890. [Google Scholar] [CrossRef]
  81. Buchroithner, A.; Felsberger, R.; Mitter, T.; Preßmair, R. Mapping Solar Flux Distribution in Parabolic Trough Collectors to Assess Optical Performance. In Proceedings of the SolarPACES—Solar Power and Chemical Energy Systems, Albuquerque, NM, USA, 27–30 September 2022. [Google Scholar]
Figure 1. Global per capita CO2 emissions by sector from 1990 to 2019 (left) and the number of people without access to safe drinking water (Safely managed drinking water is defined as an “improved source located on premises, available when needed, and free from microbiological and priority chemical contamination”) (right) (data based on [9,10]).
Processes 12 02732 g001
Figure 2. Basic structure of the NEWSUN desalination plant concept.
Processes 12 02732 g002
Figure 3. Sketch of a single-effect distillation, based on information available in [2].
Processes 12 02732 g003
Figure 5. Setup for assessment of parabolic trough collectors (PTCs) for solar co-generation. The novel injection-molded low-cost PTC is installed on the right, the conventional steel truss design with thin glass mirror on the left.
Processes 12 02732 g005
Figure 6. Working principle of the NEWSUN system.
Processes 12 02732 g006
Figure 7. Overview of solar thermal applications based on their temperature requirements. The temperature limits for the hybrid absorber are indicated. Data based on [38,46,47,48].
Processes 12 02732 g007
Figure 8. PTC characterization test stand at Graz University of Technology in Austria.
Processes 12 02732 g008
Figure 9. Photo of the CPV circuit board (PCB) equipped with multi-junction solar cells. Bypass diodes can be seen next to the solar cells. (For further information see [38]).
Processes 12 02732 g009
Figure 10. Cross section (left) and photo (right) of the hybrid absorber module [38].
Processes 12 02732 g010
Figure 11. Optimally aligned parabolic mirror. The concentrated sunlight (line focus) falls centrally on the hybrid absorber, i.e., the CPV solar cells.
Processes 12 02732 g011
Figure 12. Schematics of the hydraulic test setup to characterize the NEWSUN hybrid absorber.
Processes 12 02732 g012
Figure 13. Electrical power, electrical efficiency and CPV board temperature plotted for the duration of a tracking interval. HTF temperature: 17 °C, DNI: approx. 780 W/m2 [38].
Processes 12 02732 g013
Figure 14. Electric, thermal and overall efficiency of the hybrid collector [38].
Processes 12 02732 g014
Figure 15. Hybrid collector characteristic curve based on real-world experiments [38].
Processes 12 02732 g015
Figure 16. Water stress—0.00 meaning lowest and 5.00 highest—of countries in 2020 according to the World Resources Institute (own representation based on data available in [51]) and location of four selected sites. (According to the European Environmental Agency (EEA), water stress occurs when the demand for water exceeds the available amount during a certain period or when poor quality restricts its use. Water stress causes deterioration of fresh water resources in terms of quantity (aquifer overexploitation, dry rivers etc.) and quality (eutrophication, organic matter pollution, saline intrusion etc.)
Processes 12 02732 g016
Figure 17. System and TRNSYS simulation setup. Green lines: electrical paths, light grey lines: sea water, dark grey lines: brine, black line: air extraction, red lines/areas: hot HTF, blue lines/areas: cold HTF, dashed light blue line: MED system boundaries. (HTF: heat transfer fluid, MED: multi-effect distillation.).
Processes 12 02732 g017
Figure 18. Gained output ratio (GOR) and distillate mass flow as a function of the water inlet temperature to the MED.
Processes 12 02732 g018
Figure 19. Produced distillate and PV yield per year for different collector areas and TES volumes as a function of tflow,MED for the location of Abu Dhabi. The red line shows the maximum possible distillate volume.
Processes 12 02732 g019
Figure 20. Annual system energy balances for thermal (left) and electric energy (right), AColl = 260 m2, VTES = 50 m3, tflow,MED = 80 °C, Abu Dhabi site.
Processes 12 02732 g020
Figure 21. Annual system energy balances for thermal (left) and electric energy (right), Acoll = 780 m2, VTES = 50 m3, tflow,MED = 80 °C, Abu Dhabi site.
Processes 12 02732 g021
Figure 22. Monthly heat balances of the variants Acoll = 260 m2 (left) and Acoll = 780 m2 (right), both with VTES = 50 m3, tflow,MED = 80 °C, location Abu Dhabi.
Processes 12 02732 g022
Figure 23. Produced distillate and CPV yield per year for different collector areas and TES volumes as a function of tflow,MED for the location of Sharm El Sheikh. The red line shows the maximum possible distillate volume.
Processes 12 02732 g023
Figure 24. Distillate produced and percent of maximum possible distillate (the maximum possible distillate volume that would result from uninterrupted operation over a whole year, according to the red line in Figure 19 and Figure 21) (top) and CPV yield (bottom) for the different sites and configurations (Acoll, VTES), MED source temperature 80 °C.
Processes 12 02732 g024
Figure 25. Approximate comparison of PTC hybrid absorber technology (co-generation) with conventional flat PV modules and solar thermal collectors in terms of required surface area for the same power output.
Processes 12 02732 g025
Table 1. Overview of important research and development activities in the CPV-T sector.
AuthorsYearConcentratorAbsorber TechnologyCell TypeElectrical + Thermal EfficiencyElectrical Efficiency
Gibart [30]1981Parabolic troughCPV-T---
Rios et al. [31]1981Parabolic troughCPV-T---
Coventry [33]2003Parabolic troughCPV-TSi75%12%
Col et al. [34]2014Parabolic troughCPV-TMulti-junction72%20%
Yang et al. [37]2018Quasi parabolic mirrorCPV-TSi57%
Riahia et al. [36]2020Parabolic troughCPV-T-TESi53%7%
Felsberger et al. [38]2021Parabolic troughCPV-TMulti-junction76%27%
Table 2. Climate data at the used locations (data source [52]).
LocationLongitudeLatitudeAltitudeavg. tAmbientmin tAmbientmax tAmbientGlobal Radiation on HorizontalDirect Normal RadiationDiffuse Radiation
[-][°][°][m][°C][°C][°C][kWh/(m2a)][kWh/(m2a)][kWh/(m2a)]
Abu Dhabi−54.524.4328.810.647.820151584931
Cape Town−18.6−34.04417.01.336.319202173623
Los Angeles118.433.93217.14.932.618231943658
Sharm El Sheik−34.428.05026.310.342.221152233695
Table 3. Parameters used for the thermal collector model Type 536.
DescriptionUnitValueIncident AngleIAML
Concentration ratio *-15001.00
Intercept efficiency c0-0.488151.00
First-order loss coefficientW/(m2K) **54.0300.98
Second-order loss coefficientW/(m2K2) **0.165450.96
Thermal capacity collectorkJ/(m2K) ***2.62600.90
HTF flow ratekg/(m2h) ***30750.71
900.00
* Aperture area divided by the receiver/absorber area of the collector; ** based on the receiver area; *** based on the aperture area.
Table 4. Parameters used for the PV model Type 562.
DescriptionUnitValue
Reference PV efficiency @ TPV = 25 °C, IDNI = 1000 W/m2-0.358
η T , c o e f °C−1−0.002145
η I , c o e f m2/W0.000196
Top emissivity-0.006 *
Absorption coefficient-0.9
Back resistance to heat transfer between the bottom of the absorber plate and the back of the collectorM2K/W0.05 *
Bottom heat loss coefficientW/m2K83 *
* Values based on aperture area.
Table 5. Modeling parameters used for the pipes.
PipeDiameter in mLength in m
Picoll,flow, Picoll,return 0.8   30   A c o l l / 1000 6 + 0.08   A c o l l
PiMED,flow, PiMED,return0.0615
Table 6. Overview of electricity and heat (from natural gas) costs at different relevant locations and derived drinking water cost, if MED were to be powered conventionally. Specific unit costs are based on quotes and/or information provided online by local supply companies.
LocationAvg. Cost of Electricity *Cost of Heat by Natural Gas **Resulting Cost of Drinking Water ***
[-][EUR/kWh][EUR/kWh][EUR/1000 L]
Abu Dhabi~0.200.023.14
Cape Town~0.120.0253.275
Los Angeles~0.290.078.94
Sharm El Sheik~0.280.034.61
* business rates may be higher than for residential electricity use. ** average price of natural gas (piped). Tariffs may vary greatly depending on industry/application. *** based on a specific energy demand of 5 kWh_el/m3H2O and 107 kWh_th/m3H2O @ 80 °C HTF.
Disclaimer/Publisher’s Note: The statements, opinions and data contained in all publications are solely those of the individual author(s) and contributor(s) and not of MDPI and/or the editor(s). MDPI and/or the editor(s) disclaim responsibility for any injury to people or property resulting from any ideas, methods, instructions or products referred to in the content.

