Article

Energy Characteristics of the Compressor in a Heat Pump Based on Energy Conversion Theory

1
College of Energy, Chengdu University of Technology, Chengdu 610059, China
2
Tianfu Yongxing Laboratory, Geothermal Exploration, Development and Comprehensive Utilization Research Center, Chengdu 610213, China
3
College of Mechanical and Electrical Engineering, Chengdu University of Technology, Chengdu 610059, China
4
College of Mechatronic Engineering, Southwest Petroleum University, Chengdu 610500, China
5
College of Management Science, Chengdu University of Technology, Chengdu 610059, China
*
Author to whom correspondence should be addressed.
Processes 2025, 13(2), 471; https://doi.org/10.3390/pr13020471
Submission received: 30 December 2024 / Revised: 23 January 2025 / Accepted: 4 February 2025 / Published: 8 February 2025
(This article belongs to the Section Energy Systems)

Abstract

:
The compressor in the heat pump is crucial for efficient geothermal energy utilization, but faces challenges in optimizing energy efficiency, especially under variable working conditions. This paper investigates the complex energy characteristics of the R134a refrigerant in centrifugal compressors using CFD, combining entropy generation and relative energy rotor enthalpy to analyze energy conversion theory. Key factors such as temperature and pressure are fully considered. The results indicate that energy loss in centrifugal compressors mainly occurs in the gap between the blade top and near the tongue, with a vortex tendency at the impeller’s tail edge. As the flow rate increases from 1.2 kg/s to 1.45 kg/s, the maximum total entropy generation in the impeller decreases by 161%, and the rotor enthalpy minimum value increases by about 90%. This energy conversion analysis method can identify changes in the location and extent of energy loss, offering a new perspective for optimizing the structure and energy-saving design of centrifugal impellers.

1. Introduction

With the development of the global economy, carbon emissions and per capita carbon emissions have increased significantly, and climate issues have gradually become a global consensus. Due to the use of oil, natural gas, and other fossil energy having produced high carbon emissions, the world’s energy structure began to transform, with clean energy gradually occupying the main position. The ground source heat pump industry has also been rapidly developed, and centrifugal compressors, as the most core component of the heat pump unit, are also one of the research focuses in the current clean energy development and utilization process [1]. At present, centrifugal compressors are mainly equipped with three-dimensional blades [2]. When the medium is compressed, the flow and energy transfer processes are complex and variable. It will face problems such as low compression efficiency. Consequently, studying the energy conversion characteristics of centrifugal compressors plays a crucial role in advancing heat pump technology.
Currently, researchers have carried out a lot of work on the fluid flow characteristics of centrifugal compressors under different working conditions and different structures [3,4,5,6]. Gao et al. analyzed the flow of R134a in the compressor through numerical simulation, and found the secondary flow phenomenon inside the impeller [7,8]. Zhou et al. employed numerical simulations to optimize the structure of the centrifugal compressor, resulting in a significant improvement in the aerodynamic performance of the optimized design [9]. Feng et al. utilized numerical simulations to investigate the impact of the shunt blade’s circumferential position on the compressor [10]. The results indicate that the compressor’s efficiency is greatly enhanced when the diverter blade is positioned closer to the suction surface of the main blade. Hung et al. analyzed the effects of different types of refrigerants on compressor performance through numerical simulations [11]. It provides a reference for the direct replacement of the working fluid of the refrigeration compressor. Shivani et al. optimized the aerodynamic performance of centrifugal compressors through the numerical analysis of blade geometry and turbulence models, achieving a 36% improvement in pressure distribution. The study considered the impact of blade count and hub diameter, using the Ansys CFX software with SST and K-epsilon models for simulations. These efforts aim to enhance efficiency, reliability, and maintainability, supporting engineers and manufacturers [12].
As impeller structure optimization continues to advance, an increasing number of researchers are linking compressor energy loss to fluid energy loss. As a result, traditional methods for evaluating losses fall short in identifying the specific regions and magnitudes of energy dissipation. Presently, scientists have discovered that the dissipation of energy within centrifugal compressors can be assessed by utilizing CFD technology in conjunction with entropy generation theory and the theory of relative energy rotor enthalpy. Meng et al. examined the primary flow characteristics and loss generation within the impeller of the air energy storage centrifugal compressor using entropy generation theory. They discovered that regions with higher energy loss and entropy generation were associated with higher synergy angles [13]. This study offers valuable design insights for the application of high-pressure, high-speed centrifugal impellers in air energy storage systems. Wang et al. believe that the entropy generation method is an effective means to observe energy loss, and verify the effectiveness of the multi-parameter optimization design method of the centrifugal compressor impeller used in fuel cells by analyzing the distribution of entropy generation [14]. Zhang et al. [15] derived the key influencing factors affecting the performance of centrifugal compressors and the design method of compressor flow control in plateau areas through the distribution of entropy generation. Liu et al. used the entropy generation theory and the static entropy distribution as a reference, and found that with the decrease in the blade top gap size, the flow loss decreased, and the functional force of the compressor increased [16]. Li et al. studied the influence of variable air inlet guide vanes on centrifugal compressors by numerical simulation combined with entropy generation theory, and improved the flow in the impeller by adjusting the air inlet guide vanes, thereby broadening the stable operating range of the compressor [17]. Li et al. conducted numerical simulations of subsonic and transonic centrifugal compressors at different Reynolds numbers to study the impact of the Reynolds number on internal energy losses under varying inlet conditions. They introduced the loss and dissipation coefficients to analyze energy losses, highlighting the flow mechanisms causing performance degradation at low Reynolds numbers [18].
In summary, in the existing literature, temperature, pressure, enthalpy, and entropy are commonly used to analyze the performance of centrifugal compressors. However, most studies primarily focus on one of these parameters or examine them as part of conventional thermodynamic laws. In contrast, this study employs fluid simulation software and introduces a novel analysis method based on numerical simulations. By integrating the theory of entropy generation with the concept of relative energy rotor enthalpy (Rothalpy), this approach enables a more comprehensive evaluation of the energy conversion process within the compressor impeller, fully considering the interactions between temperature, pressure, and energy loss that are typically studied separately. This study delves into the flow state of the R134a working fluid within the flow field and provides a quantitative assessment of energy loss. Numerical simulations are conducted on the working fluids of centrifugal compressors under various flow conditions to investigate the energy characteristics of these compressors. By comparing turbulent kinetic energy, entropy generation, and the relative energy rotor enthalpy, this research achieves a complete revelation of the energy loss distribution law within centrifugal compressors. The findings of this study will offer a fresh perspective on examining the energy efficiency traits of compressors and serve as guidance for enhancing the structural design of centrifugal compressors.

2. Methodology

2.1. Entropy Generation Theory

Entropy generation, as a concept from the second law of thermodynamics, is used to evaluate the energy characteristics of hydromechanical energy because it can quantify the energy loss resulting from viscous effects and Reynolds stresses during the energy conversion process in fluid machinery. In general, the centrifugal compressor compression process is between an isothermal compression and isentropic compression process [19], and in most cases it is a polytropic compression process, so during the operation of the centrifugal compressor, a variety of undesirable flows in the flow channel will produce energy loss, which will lead to an increase in entropy generation.
Usually, the flow inside the compressor is turbulent. Turbulence involves the generation of entropy, which primarily consists of two components. Firstly, there is the time-averaged entropy generation. Secondly, it is induced by fluctuations in the transient velocity. Therefore, the entropy generation rate per unit volume (EGR) can be expressed by the following formula:
S ˙ = S ˙ D ¯ + S ˙ D
In the formula, S ˙ D ¯ is the rate of entropy generation due to the time-averaged velocity, i.e.:
S ˙ 1 D = 2 μ T u ¯ 1 x 1 2 + u ¯ 2 x 2 2 + u ¯ 3 x 3 2 + μ T u ¯ 2 x 1 + u ¯ 1 x 2 2 + u ¯ 3 x 1 + u ¯ 1 x 3 2 + u ¯ 2 x 3 + u ¯ 3 x 2 2
In Formula (1), S ˙ D represents the rate of entropy generation caused by velocity pulsation, as expressed by:
S ˙ D = 2 μ e f f T u 1 x 1 2 + u 2 x 2 2 + u 3 x 3 2 + μ e f f T u 2 x 1 + u 1 x 2 2 + u 3 x 1 + u 1 x 3 2 + u 2 x 3 + u 3 x 2 2
In Formulas (1) and (2), μ is the dynamic viscosity, (Pa·s); T denotes the thermodynamic temperature of the fluid; and u ¯ 1 , u ¯ 2 , u ¯ 3 represent the components of the fluid’s average velocity in the directions of x 1 , x 2 , x 3 , respectively.
However, since the exact value of the pulsating velocity cannot be derived from the Reynolds-averaged equations, the entropy generation rate due to velocity fluctuations cannot be calculated directly. However, according to the ideas proposed by Kock [20] and Mathieu et al. [21], they believe that in the k-ω model, there is a connection between the pulsating entropy generation and the turbulent model, which is related to the turbulent energy dispersion rate ω and the temperature T. So, the rate of entropy generation caused by velocity pulsation S ˙   D is:
S ˙   D = β ρ ω k T
In the formula, β = 0.09; ρ is the density, (kg/cm3); ω is the turbulent dissipation rate, (s−1); and k represents the turbulent kinetic energy, (m2/s2).
At the same time, the entropy generation rate of S ˙ D ¯ and S ˙ D is integrated in the integration region, and the sum of the two is the total entropy generation of the entire computational domain.
S ˙ D ¯ = V S ˙ D ¯ d V
S ˙ D = V S ˙ D d V
S ˙ D = S ˙ D ¯ + S ˙ D

2.2. Relative Energy Rotor Enthalpy Theory

This study proposes the utilization of Lyman’s concept of relative energy rotor enthalpy (Rothalpy) [22], which is related to the first law of thermodynamics, to quantitatively analyze the energy fluctuation patterns of fluid micromasses across the entire flow channel of the centrifugal compressor impeller, from the inlet to the outlet. Based on the concept of Rothalpy, it can be derived that, in the absence of viscosity and heat conduction, the total energy per unit mass of the fluid remains constant along a given streamline, represented by a constant value denoted as I.
I = P ρ + 1 2 w 2 + e
In the formula, ρ is the density, (kg/m3); P represents the static pressure, (Pa); e is the volumetric potential energy; and w notes the relative velocity vector, (m/s).
Centrifugal force is the primary expression of the volumetric force of fluid particles in the high-speed rotation of the impeller flow channel. Next, the potential energy due to the force exerted on the body can be represented as,
e = l 2 f r = l 2 ω 2 r 2 = l 2 u 2
In the formula, r is the distance from the fluid mass point to the axis of rotation, (m); and ω is the rotational velocity of the fluid mass point, (rad/s).
By incorporating the body force potential energy e into Equation (8), Rothalpy can be expressed as:
R o t h a l p y = I = P ρ + 1 2 ( w 2 u 2 )
In the formula, w represents the relative velocity vector, (m/s). In a centrifugal compressor, this refers to the difference between the fluid velocity and the impeller’s circumferential velocity. It considers both the fluid’s velocity and the impeller’s velocity, reflecting the true motion of the fluid relative to the impeller; u is the circumferential velocity vector, (m/s). In a centrifugal compressor, it refers to the velocity at which the fluid rotates along with the impeller.

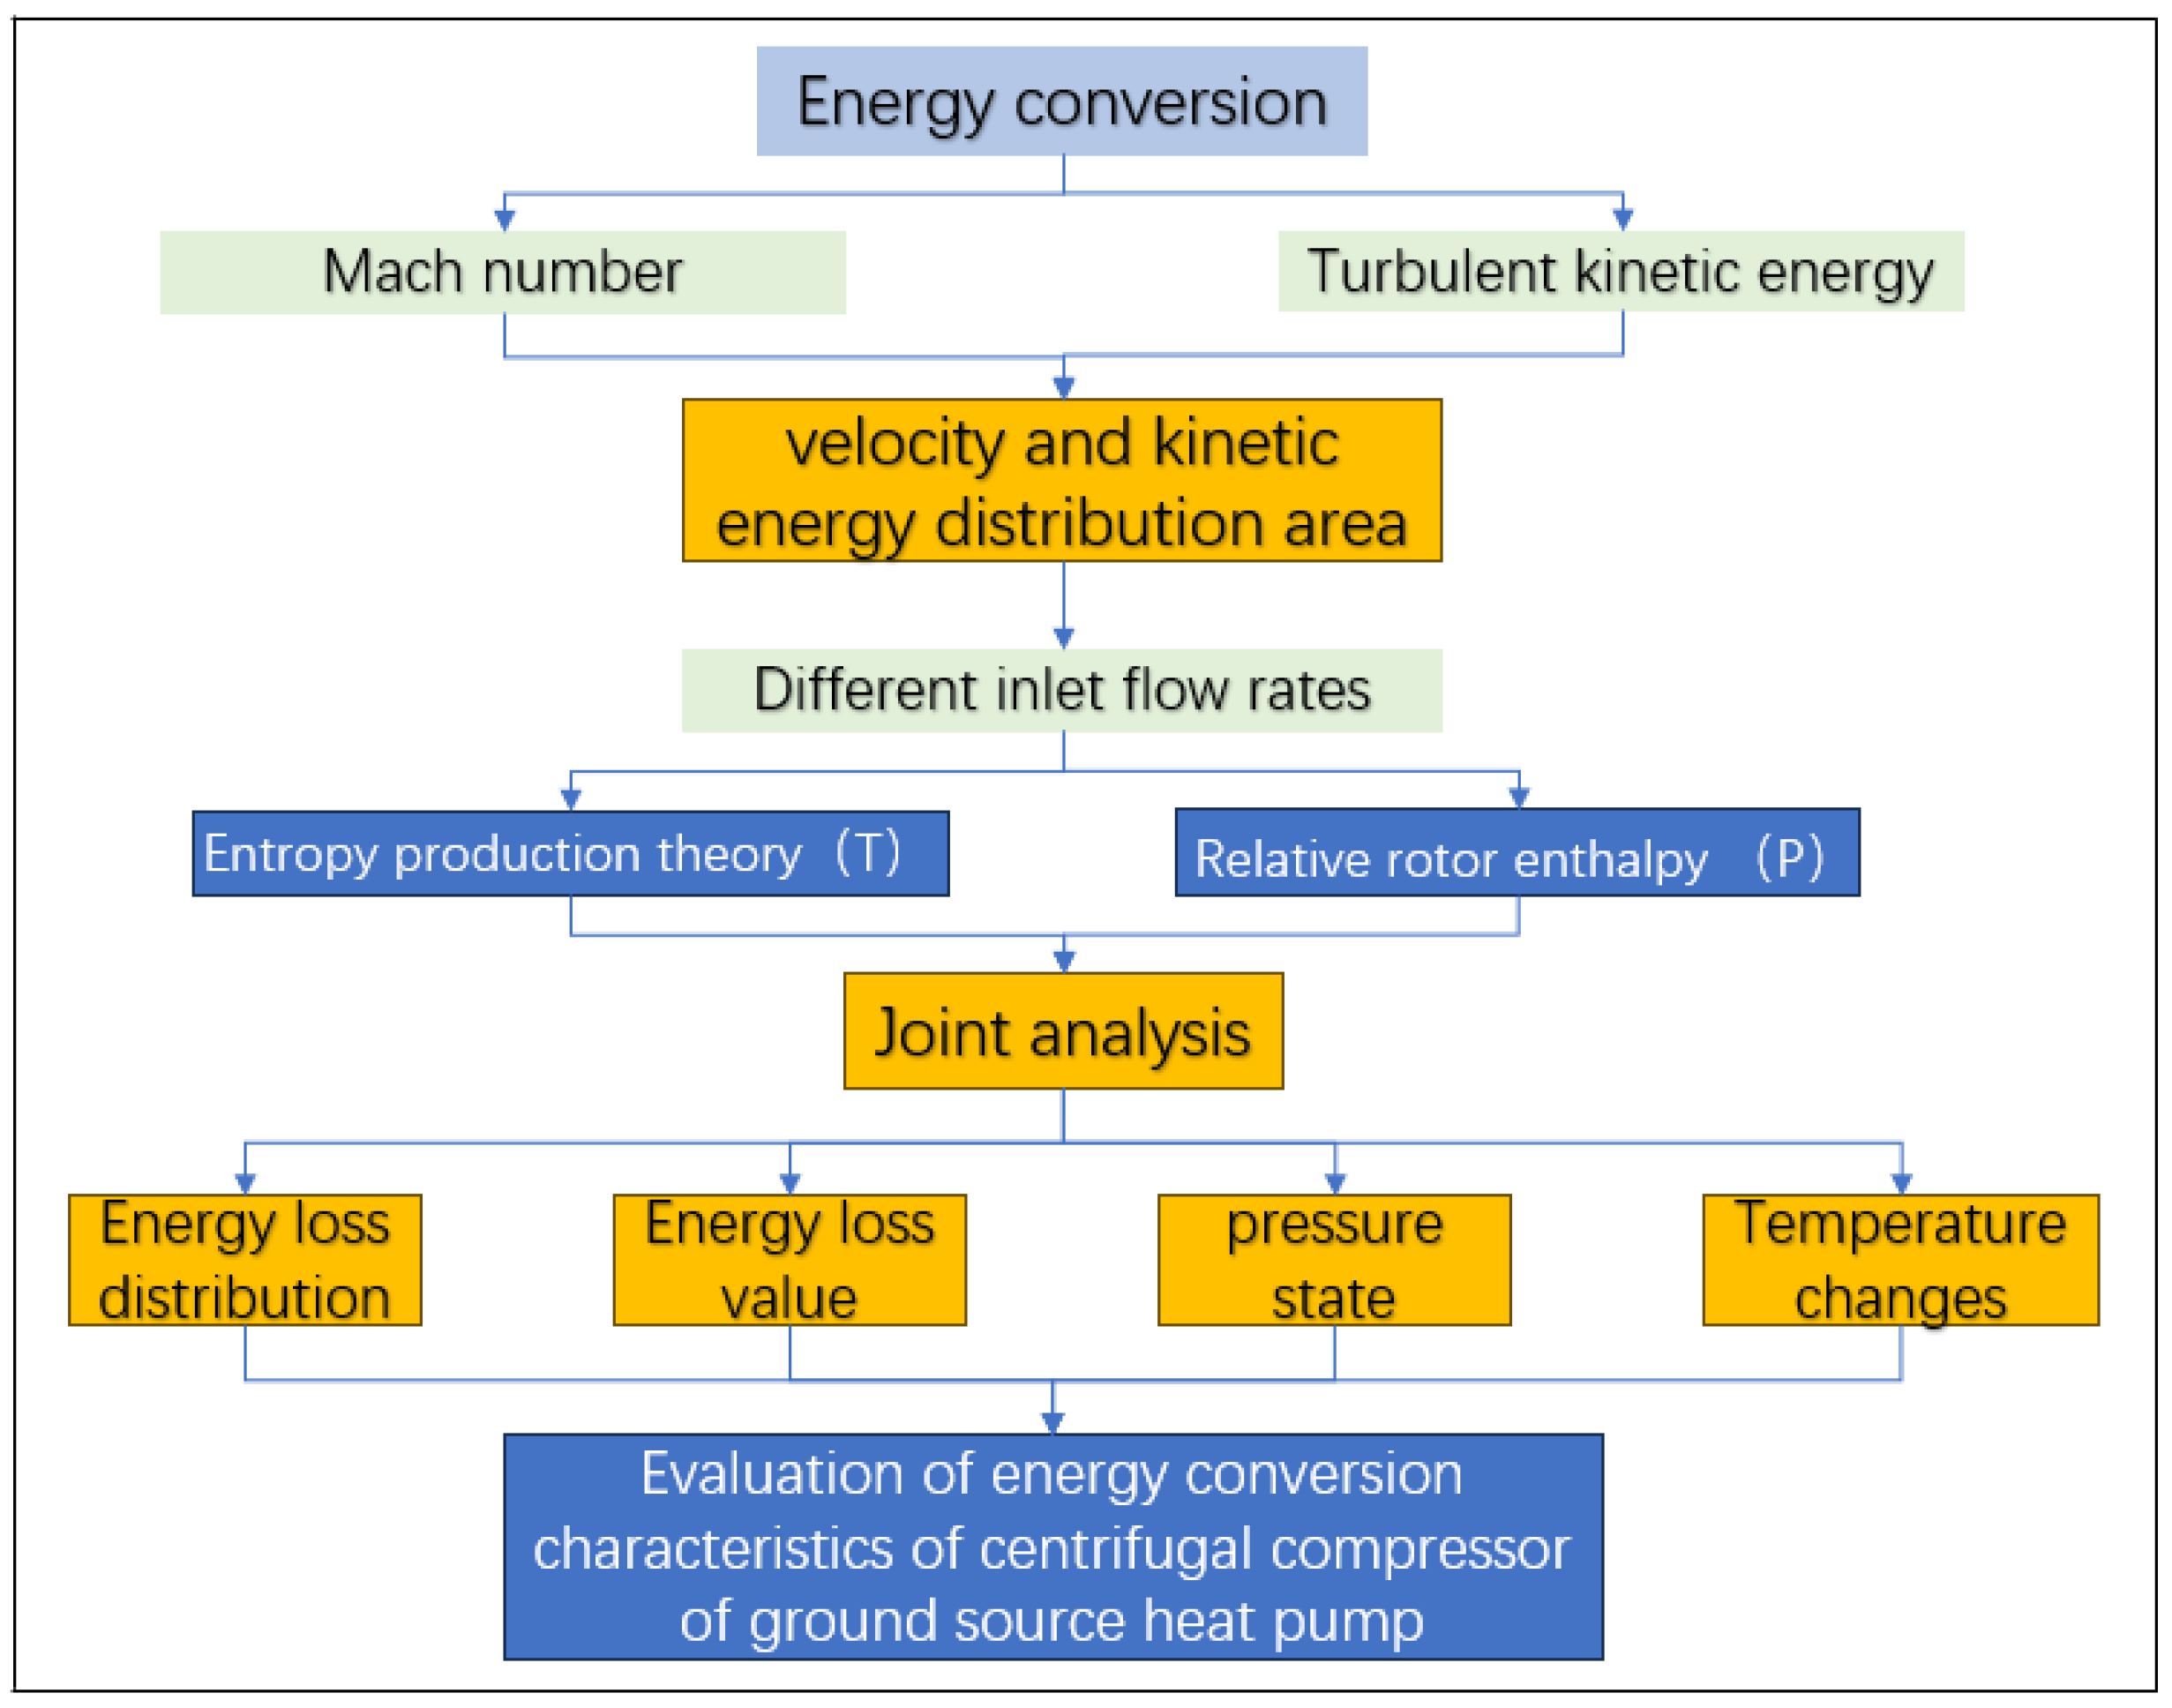
2.3. Energy Conversion Theory

The centrifugal compressor impeller was simulated under various flow conditions using the theories of turbulent kinetic energy and Mach number. A preliminary assessment was made regarding the area of energy loss. Combined with the above two theoretical methods and the corresponding post-processing methods, the area with the largest energy dissipation in the flow channel was analyzed by using the entropy generation theory, and its distribution law was studied and quantitatively evaluated. The relative energy rotor enthalpy was used to analyze the energy change trend of the working fluid throughout the entire flow channel. Based on the variation in Rothalpy, it was determined whether the fluid microgroup gains or loses energy. At the same time, according to the theory of entropy generation, entropy generation can reflect changes in temperature to a certain extent, and in thermodynamics, entropy and temperature are tied concepts. Temperature and pressure are key parameters for Rothalpy and entropy generation, respectively, which directly reflect compressor performance. Therefore, a combined analysis method integrating entropy generation and relative energy rotor enthalpy can be developed to assess the energy conversion in centrifugal compressor impellers used in ground source heat pumps. The specific research methodology is shown in Figure 1.

3. Physical Model and Numerical Method
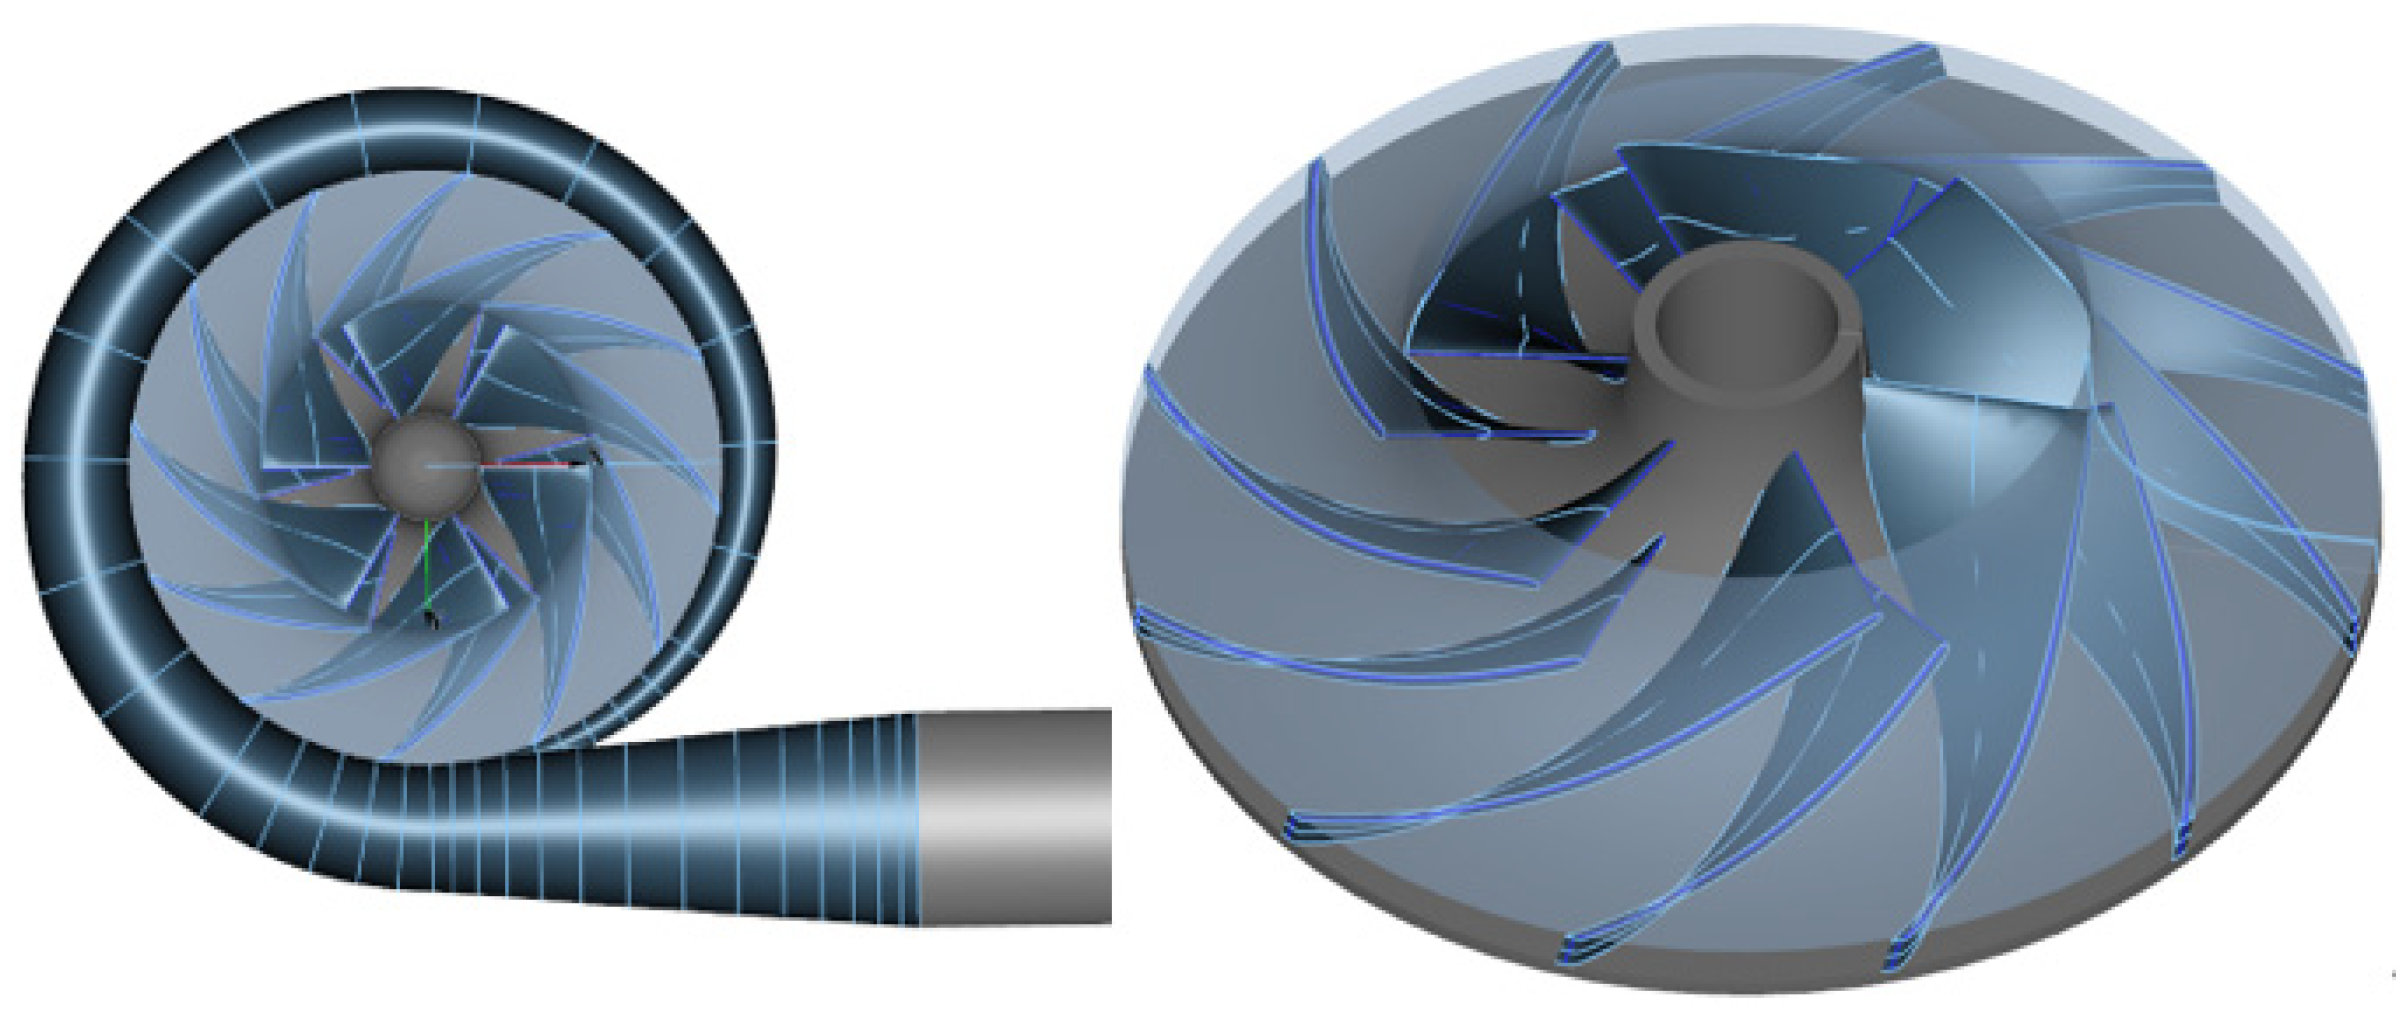
3.1. Physical Model

This study employs CFturbo (2020.1.0) to design the centrifugal compressor model, which includes four main components: the inlet extension section, impeller, volute, and outlet extension section. The specific design conditions are as follows: the total temperature at the inlet is 287 K, the total pressure at the inlet is 344,737 Pa, the mass flow rate is 1.36 kg/s, and the design speed is 36,000 r/min. Despite the availability of many newer and more environmentally friendly refrigerants, R134a is still widely used in certain types of equipment. Therefore, R134a is selected as the refrigerant working fluid in this model design. This study’s outcomes will assist in optimizing the design of and improving existing equipment. The impeller structure adopts a semi-open impeller with a long and short blade configuration. The physical model of the centrifugal compressor and its specific design parameters are presented in Figure 2 and Table 1, respectively.

3.2. Mesh and Irrelevance Verification

This study primarily concentrates on analyzing the flow characteristics and energy loss distribution within the impeller section using an unstructured mesh generated by ICEM (ANSYSY 2023 R1). To ensure the accuracy of the simulation results, local mesh refinement has been applied to the impeller blades. For the other sections, a low-density mesh was used wherever possible to maintain computational accuracy. The total number of grids was 3.34 million, with 1.64 million grids allocated to the impeller section. Following grid independence tests conducted at four different grid densities (2.41 million, 2.80 million, 3.34 million, and 3.76 million), it was determined that from 3.34 million grids onward, any increase in grid count resulted in less than a 3% change in the compressor’s efficiency characteristics. Moreover, under the current grid configuration, the maximum difference in mass flow rate between the inlet and outlet across various operating conditions was merely 0.083 kg. Consequently, the chosen grid count not only satisfies the computational requirements but also ensures the accuracy of the calculations. The overall compressor mesh model and the impeller mesh model are shown in Figure 3.

3.3. Numerical Method

3.3.1. Governing Equations

(1)
Continuity equation
The continuity equation, also referred to as the mass conservation equation, is expressed as:
ρ t + ( ρ u x ) x + ( ρ u y ) y + ( ρ u z ) z = 0
In the formula, u x , u y , and u z represent the velocity components in the x, y, and z directions, respectively. t is time, and ρ is the fluid density.
(2)
Momentum equation
The equations governing the conservation of momentum, which are also referred to as the equations of motion or the Navier–Stokes equations, can be formulated for the x, y, and z axes as follows:
( ρ u x ) t + d i v ( ρ u x u ) = p x + τ x x x + τ y x y + τ z x z + F x
( ρ u y ) t + d i ν ( ρ u y u ) = p y + τ x y x + τ y y y + τ z y z + F y
( ρ u z ) t + d i ν ( ρ u z u ) = p z + τ x z x + τ y z y + τ z z z + F z
In the formula, ρ is the fluid density; p is the pressure, τ x x , τ y x , τ z x are the components of the viscous stress tensor τ ; and F x , F y , and F z are the body forces acting on the fluid element.
(3)
Energy conservation equation
( ρ T ) t + ( T ρ u ) x + ( T ρ ν ) y + ( T ρ w ) z = γ c p div ( gradT ) + S T
In the formula, T denotes the temperature; γ stands for the convective heat transfer coefficient of the fluid, in units of W/(m2·K)W/(m2·K); c p indicates the specific heat at constant pressure, in units of J/(kg·K)J/(kg·K); div denotes the divergence; and S T is the viscous dissipation term.

3.3.2. Turbulence Model Selection

The SST k-ω model integrates the strengths of the k-ω approach for near-wall and low-Reynolds-number flows with the advantages of the k-ε method for extensive flow fields. This makes it particularly well suited for machinery featuring intricate flow dynamics, like those found in centrifugal compressors. This model can accurately capture flow separation, vortex generation, and high-shear flows, ensuring precise predictions of compressor performance. Additionally, compared to other turbulence models, the SST k-ω model exhibits better stability during numerical calculations, effectively avoiding the numerical instability commonly encountered at high rotational speeds.
(1)
turbulent kinetic energy equation (K equation)
( ρ k ) t + ( ρ U k ) = μ + μ t σ k k + P k ρ ϵ
In the formula, ρ represents the density of the fluid; U denotes the velocity vector field; μ stands for the dynamic viscosity at the molecular level; μ t indicates the viscosity associated with turbulence; σ k refers to the Prandtl number related to turbulent kinetic energy (commonly assumed to be 1); P k signifies the generation term for turbulent kinetic energy; and ϵ marks the dissipation rate of turbulent energy.
(2)
specific dissipation rate equation (ω equation)
( ρ ω ) t + ( ρ U ω ) = μ + μ t σ ω ω + P ω β ρ ω 2
In the formula, σ ω represents the Prandtl number associated with turbulent frequency, commonly set to 1.3; P ω denotes the generation term for turbulent frequency, which is generally derived from the production of turbulent kinetic energy and turbulent shear stresses; and β is a model constant, typically assigned a value of 0.09.
(3)
SST correction terms
ω = ω SST = min ( ω SST 1 , ω SST 2 )
In the formula, ω SST 1 and ω SST 2 are outputs based on different models. In this way, the SST k-ω model can select the most appropriate turbulence model for different flow regions, such as near the wall and away from the wall.

3.3.3. Boundary Conditions and Convergence Criteria

In this research, ANSYS Fluent (ANSYS 2023 R1) is utilized to conduct steady-state simulations on a fixed computational mesh for analyzing the flow field within a centrifugal compressor. For boundary conditions, the inlet is set as a total pressure boundary, whereas the outlet employs a mass flow rate specification. Turbulence is modeled using the SST k-ω approach, and the refrigerant R134a serves as the working fluid. The simulation invokes Fluent’s real gas model to accurately represent the behavior of the working fluid. Thermophysical properties are sourced from the National Institute of Standards and Technology (NIST) data. Due to the use of the real gas model, the computation becomes slow and difficult to converge. Therefore, it is necessary to monitor the residuals as well as the flow and pressure conditions at the inlet and outlet. Convergence is considered to be achieved when the values at the inlet and outlet stabilize and no longer change.

4. Results and Discussion

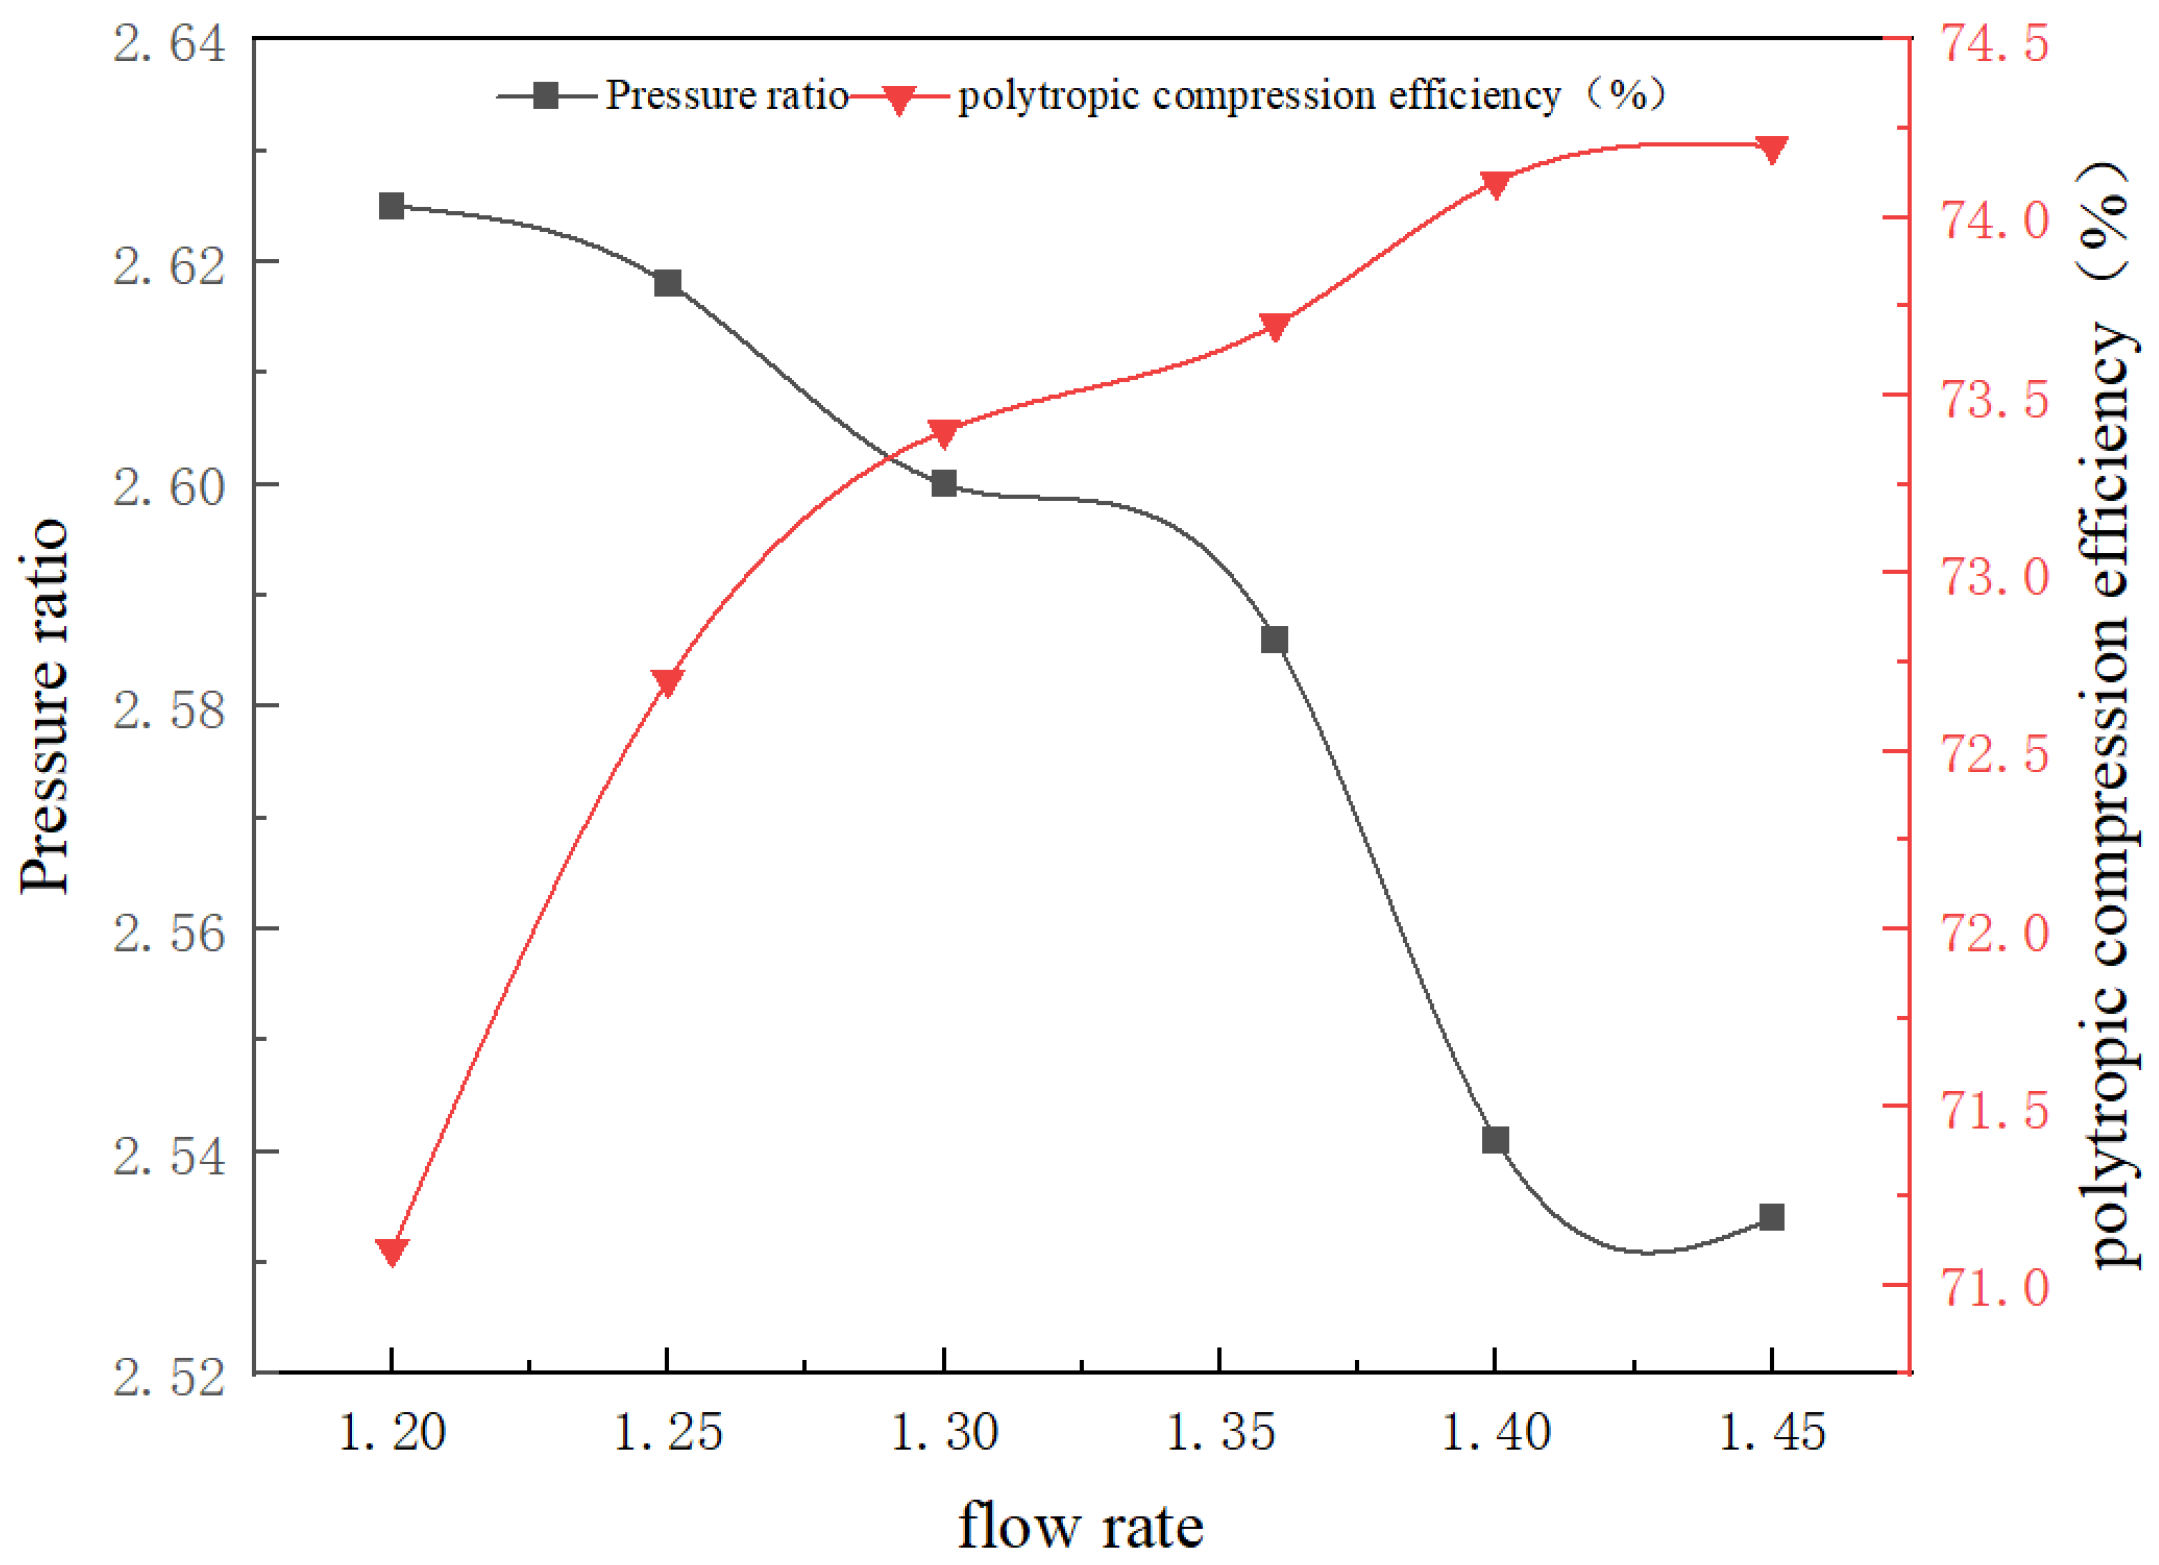
4.1. Aerodynamic Performance

Through six flow conditions, the parameters of polytropic efficiency and pressure ratio are calculated. The definitions of pressure ratio ε and polytropic efficiency η pol are as follows:
ε = p 2 p 1
η p o l = κ l κ l g p 2 p 1 l g T 2 T 1
In the formulae, the p 1 and p 2 are the total inlet and outlet pressures of the centrifugal compressor, the T 1 and T 2 are the inlet and outlet temperatures, and κ is the adiabatic index of R134a.
As illustrated in Figure 4, there is an inverse relationship between the compressor’s pressure ratio and flow rate; as the latter rises, the former declines. Conversely, the polytropic compression efficiency exhibits a positive correlation with the flow rate, showing an increase as the flow rate grows. It is crucial to maintain the pressure ratio of the centrifugal compressor within an appropriate range in the ground source heat pump, as excessively high or low values can adversely affect the system’s performance. An insufficient pressure ratio will result in excessive power consumption during the system operation. Conversely, an overly high pressure ratio will lead to a synchronous increase in the exhaust temperature, which can interfere with the normal operation of the ground source heat pump’s cooling and heating cycles. This will increase the compressor’s actual power consumption, reduce efficiency, and lower the coefficient of performance (COP). Based on the characteristics of the centrifugal compressor’s performance curve, it can be determined that the compression ratio and efficiency remain relatively stable when the flow rate ranges from 1.28 kg/s to 1.36 kg/s, indicating that the centrifugal compressor is operating at its optimal state.

4.2. Energy Characteristics of Internal Flow Field

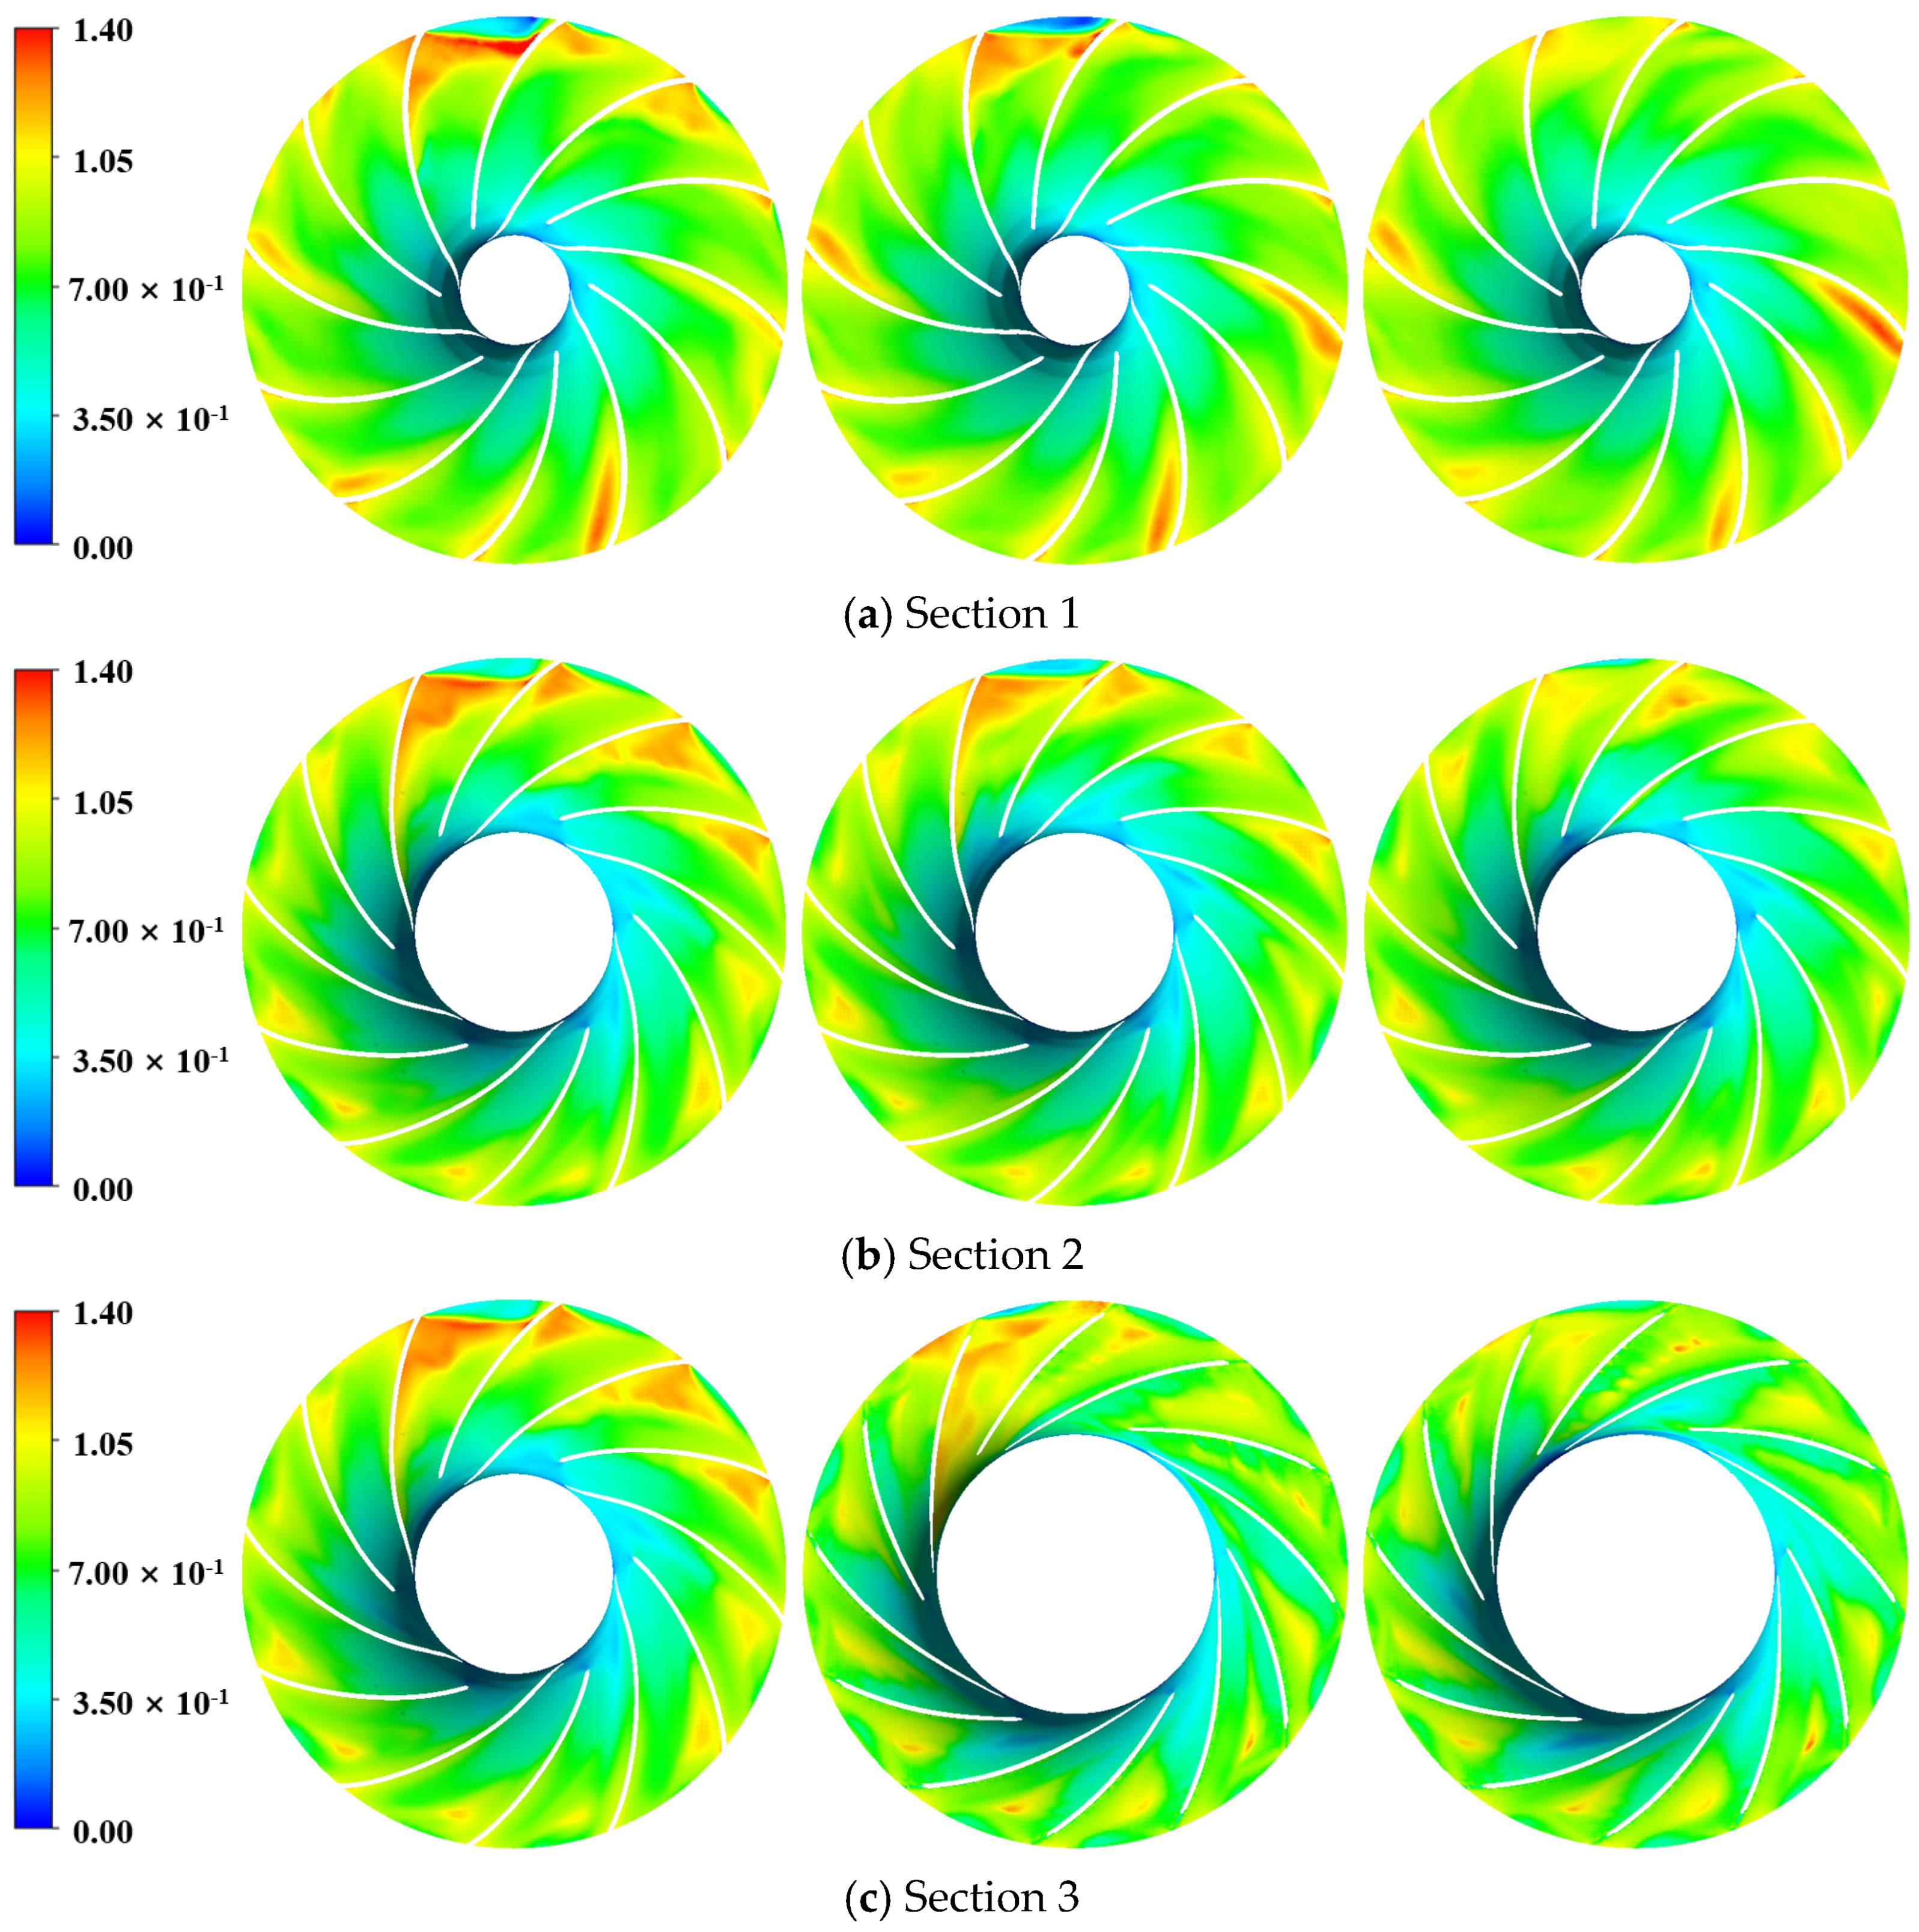
4.2.1. Turbulent Kinetic Energy Distribution

The flow rate of the compressor is modified based on the given simulation boundary conditions in order to investigate the impact of the flow rate on the turbulent kinetic energy of the fluid. Figure 5 and Table 2 display the highest values among the three cross-sections of the centrifugal impeller, represented by a column chart and a numerical table. (5%, 50%, and 90% blade height in cross-Sections 1, 2 and 3, respectively).
The concept of turbulent kinetic energy suggests that its magnitude serves as an indicator of fluid velocity fluctuations, reflecting both the intensity of turbulence and the strength of turbulent pulsations [23]. Based on the information provided in Figure 5 and Table 2, it is evident that the turbulent kinetic energy generally exhibits a gradual decline as the flow increases, except for a rise observed at a flow rate of 1.45 kg/s. The decrease in velocity fluctuations and turbulent kinetic energy is due to an increase in flow to a certain extent, which reduces the volume change rate of the fluid in the flow channel, making the compression of the working fluid more challenging. When the flow reaches 1.45 kg/s, the centrifugal compressor approaches the blocking point, leading to backflow, which in turn increases the velocity fluctuations and turbulent kinetic energy. Meanwhile, it is evident that the highest levels of turbulent kinetic energy are concentrated around 50% and 90% of the blade height. This phenomenon occurs because, as the working fluid enters the impeller at a relatively low velocity, it experiences a sudden acceleration while passing through the impeller, particularly near the blade tip clearances. This leads to significant velocity fluctuations, which in turn generate higher levels of turbulent kinetic energy.
Figure 6 and Figure 7 present cloud diagrams illustrating the distribution of turbulent kinetic energy under three representative flow conditions (from left to right: 1.25 kg/s, 1.36 kg/s, and 1.45 kg/s). These diagrams are depicted across three cross-sectional areas and in the inter-blade regions (viewed from the top down), aiding in the analysis of turbulent kinetic energy patterns within the flow passage.
As illustrated in Figure 6 and Figure 7, the pattern of turbulent kinetic energy distribution markedly expands with an increase in blade height from 5% to 90%. This indicates that the closer to the tip clearance, the more intense the fluid fluctuations become, leading to greater energy losses. Additionally, regardless of variations in flow rate, the peak values of turbulent kinetic energy consistently appear directly above the junction between the impeller and volute on various monitoring surfaces. This reaffirms that intense fluid fluctuations within the flow passage predominantly occur near the tongue area. The turbulent kinetic energy on the pressure side is notably lower than that on the suction side, indicating smaller velocity fluctuations on the pressure side. Furthermore, it is observed that the peak values of turbulent kinetic energy diminish progressively as the flow rate increases, aligning with the observations reported by Zhang et al. [24].
Based on its definition, turbulent kinetic energy indicates the intensity of velocity fluctuations and is intimately linked with the velocity field. Therefore, Figure 8 illustrates the Mach number profiles across different sections under three typical operating conditions. The impeller’s Mach number is determined by the ratio of the circumferential velocity at the impeller’s exit to the local speed of sound, acting as a critical design parameter for centrifugal compressors. The flow inside the compressor is generally considered compressible, meaning that gas density changes with variations in pressure and temperature. If the Mach number of the refrigerant within the impeller exceeds 1, the fluid will travel at supersonic speeds, causing wave drag losses. This occurs when the refrigerant’s velocity reaches the speed of sound, leading to overlapping transport waves and generating compression waves. These compression waves significantly impede the flow of the refrigerant, resulting in substantial flow losses.
Figure 8 illustrates the Mach number distribution across various monitoring surfaces at different flow rates. The figure reveals a notably steep gradient in the Mach number distribution. As the flow within the impeller region gradually increases under different flow rates, the area with high Mach number distribution gradually decreases. This phenomenon occurs as the rise in flow rate increases the internal resistance within the impeller, resulting in reduced flow velocities and, subsequently, lower Mach numbers. Specifically, at a flow rate of 1.25 kg/s, the maximum Mach number attains a value of 1.55917; however, this decreases to 1.35577 when the flow rate rises to 1.45 kg/s.
Wave resistance loss (which occurs where the Mach number exceeds 1) is primarily concentrated in the middle of the impeller flow channel and at 5% of the blade height. This phenomenon occurs as the working fluid traverses from the inlet to the outlet within the impeller, experiencing increases in both axial and tangential velocities. Consequently, this leads to elevated speeds in the vicinity of the blade root. Additionally, the resistance in the middle of the impeller channel is minimal, leading to higher velocities. Numerical simulations conclude that in these two regions, the Mach number exceeds 1, indicating that the flow velocity has surpassed the speed of sound. Therefore, it is determined that there will be wave resistance loss in these two regions.
Meanwhile, it is observed that the Mach number near the tongue decreases rapidly, with significant velocity fluctuations, and this change does not alter with variations in flow rate. Comparing this study with the research by Tian et al. [25], similarities are found in the trends of Mach number changes with flow rate and the distribution locations. Combining the findings of this study, it can be seen that these characteristics are highly consistent with the features of turbulent kinetic energy.

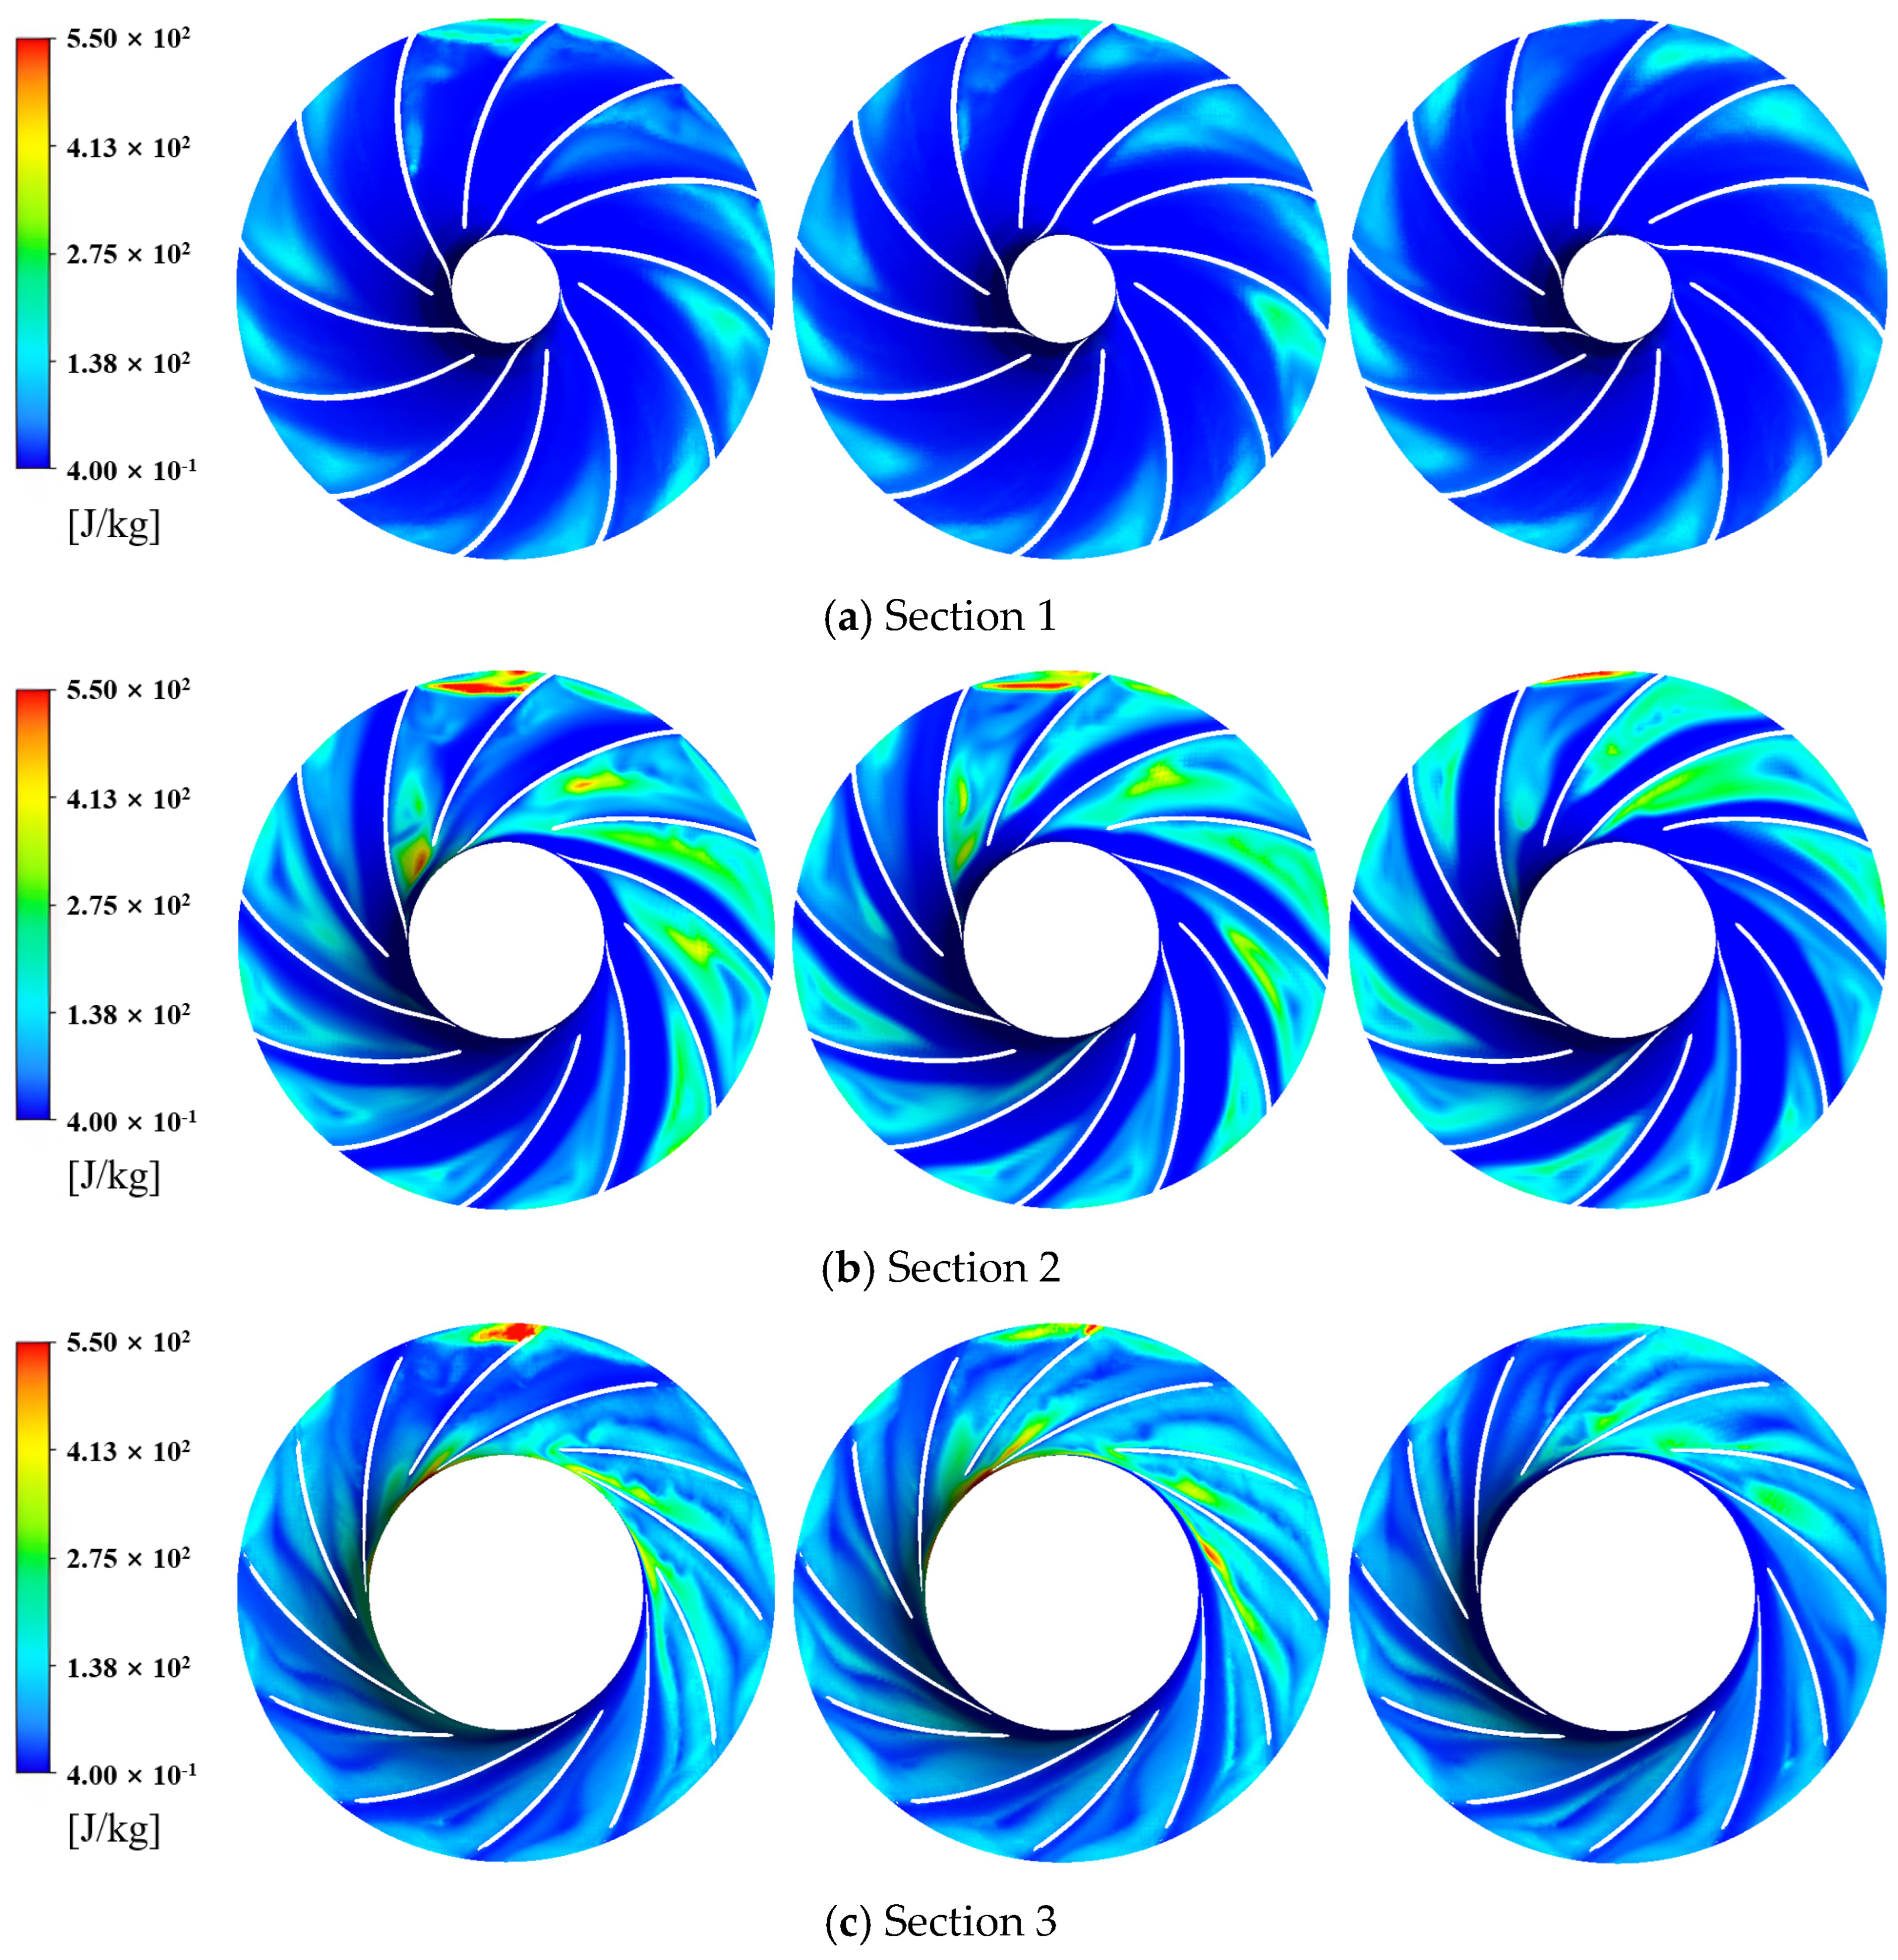
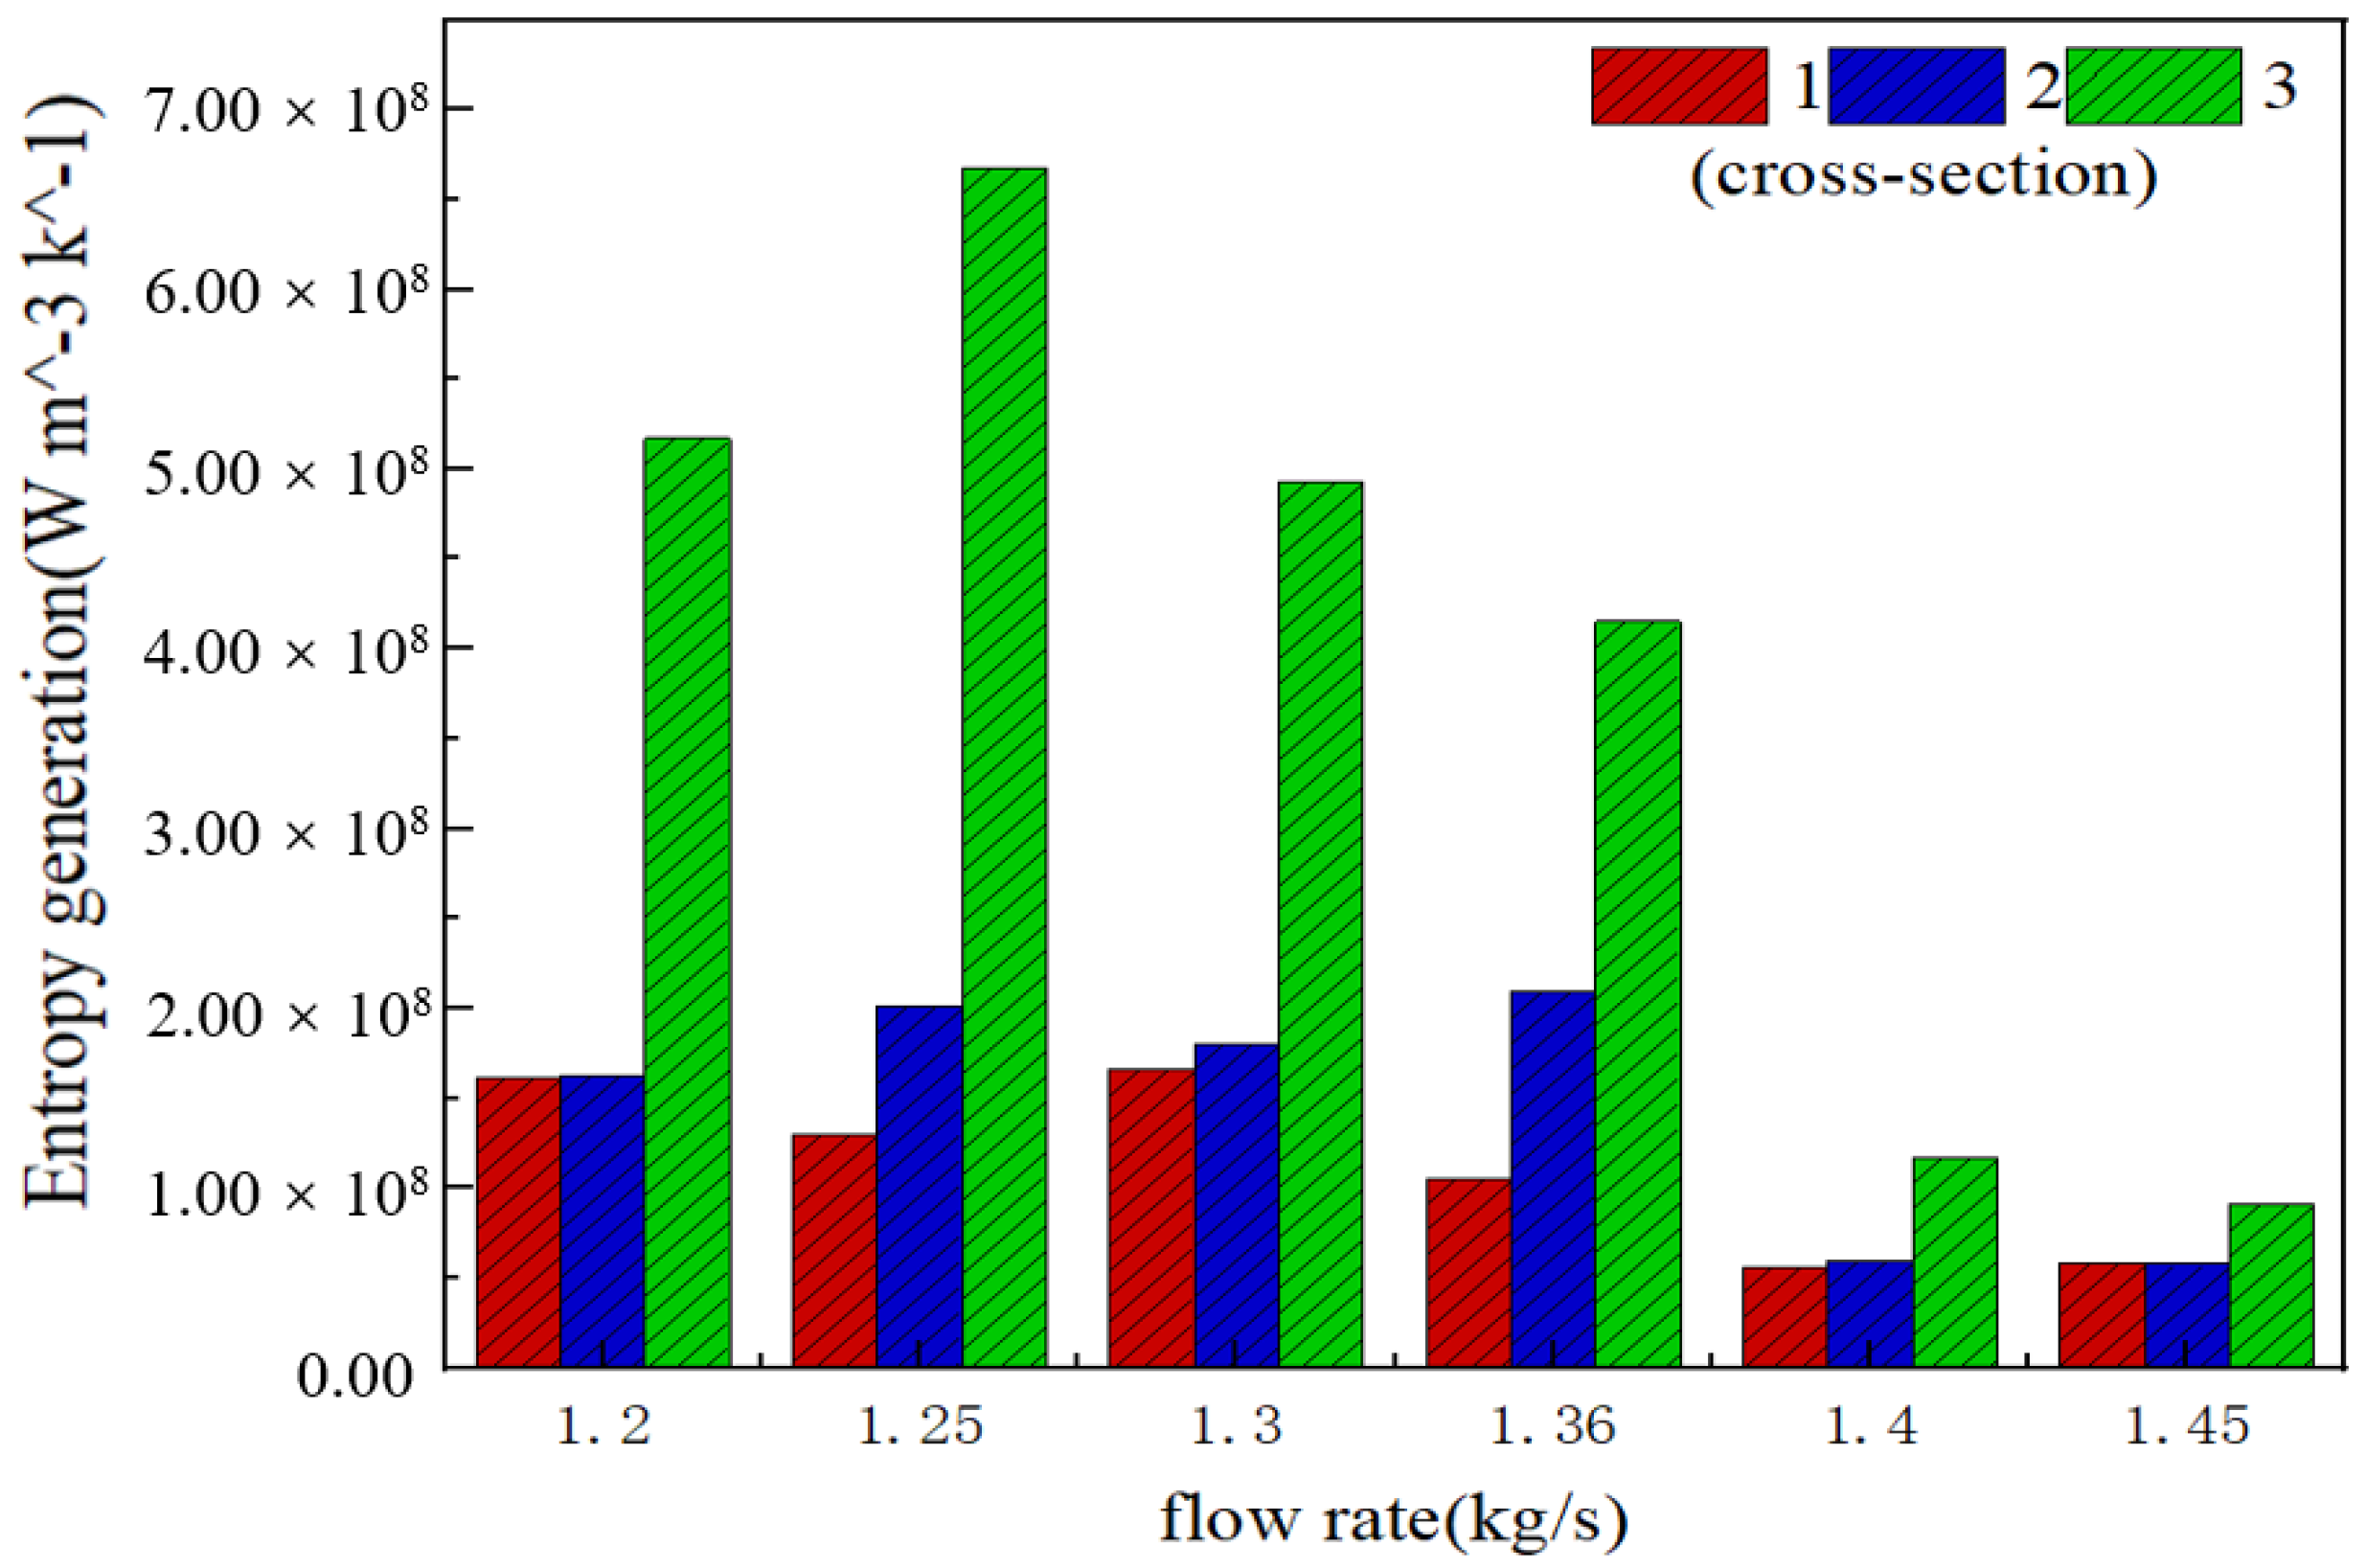
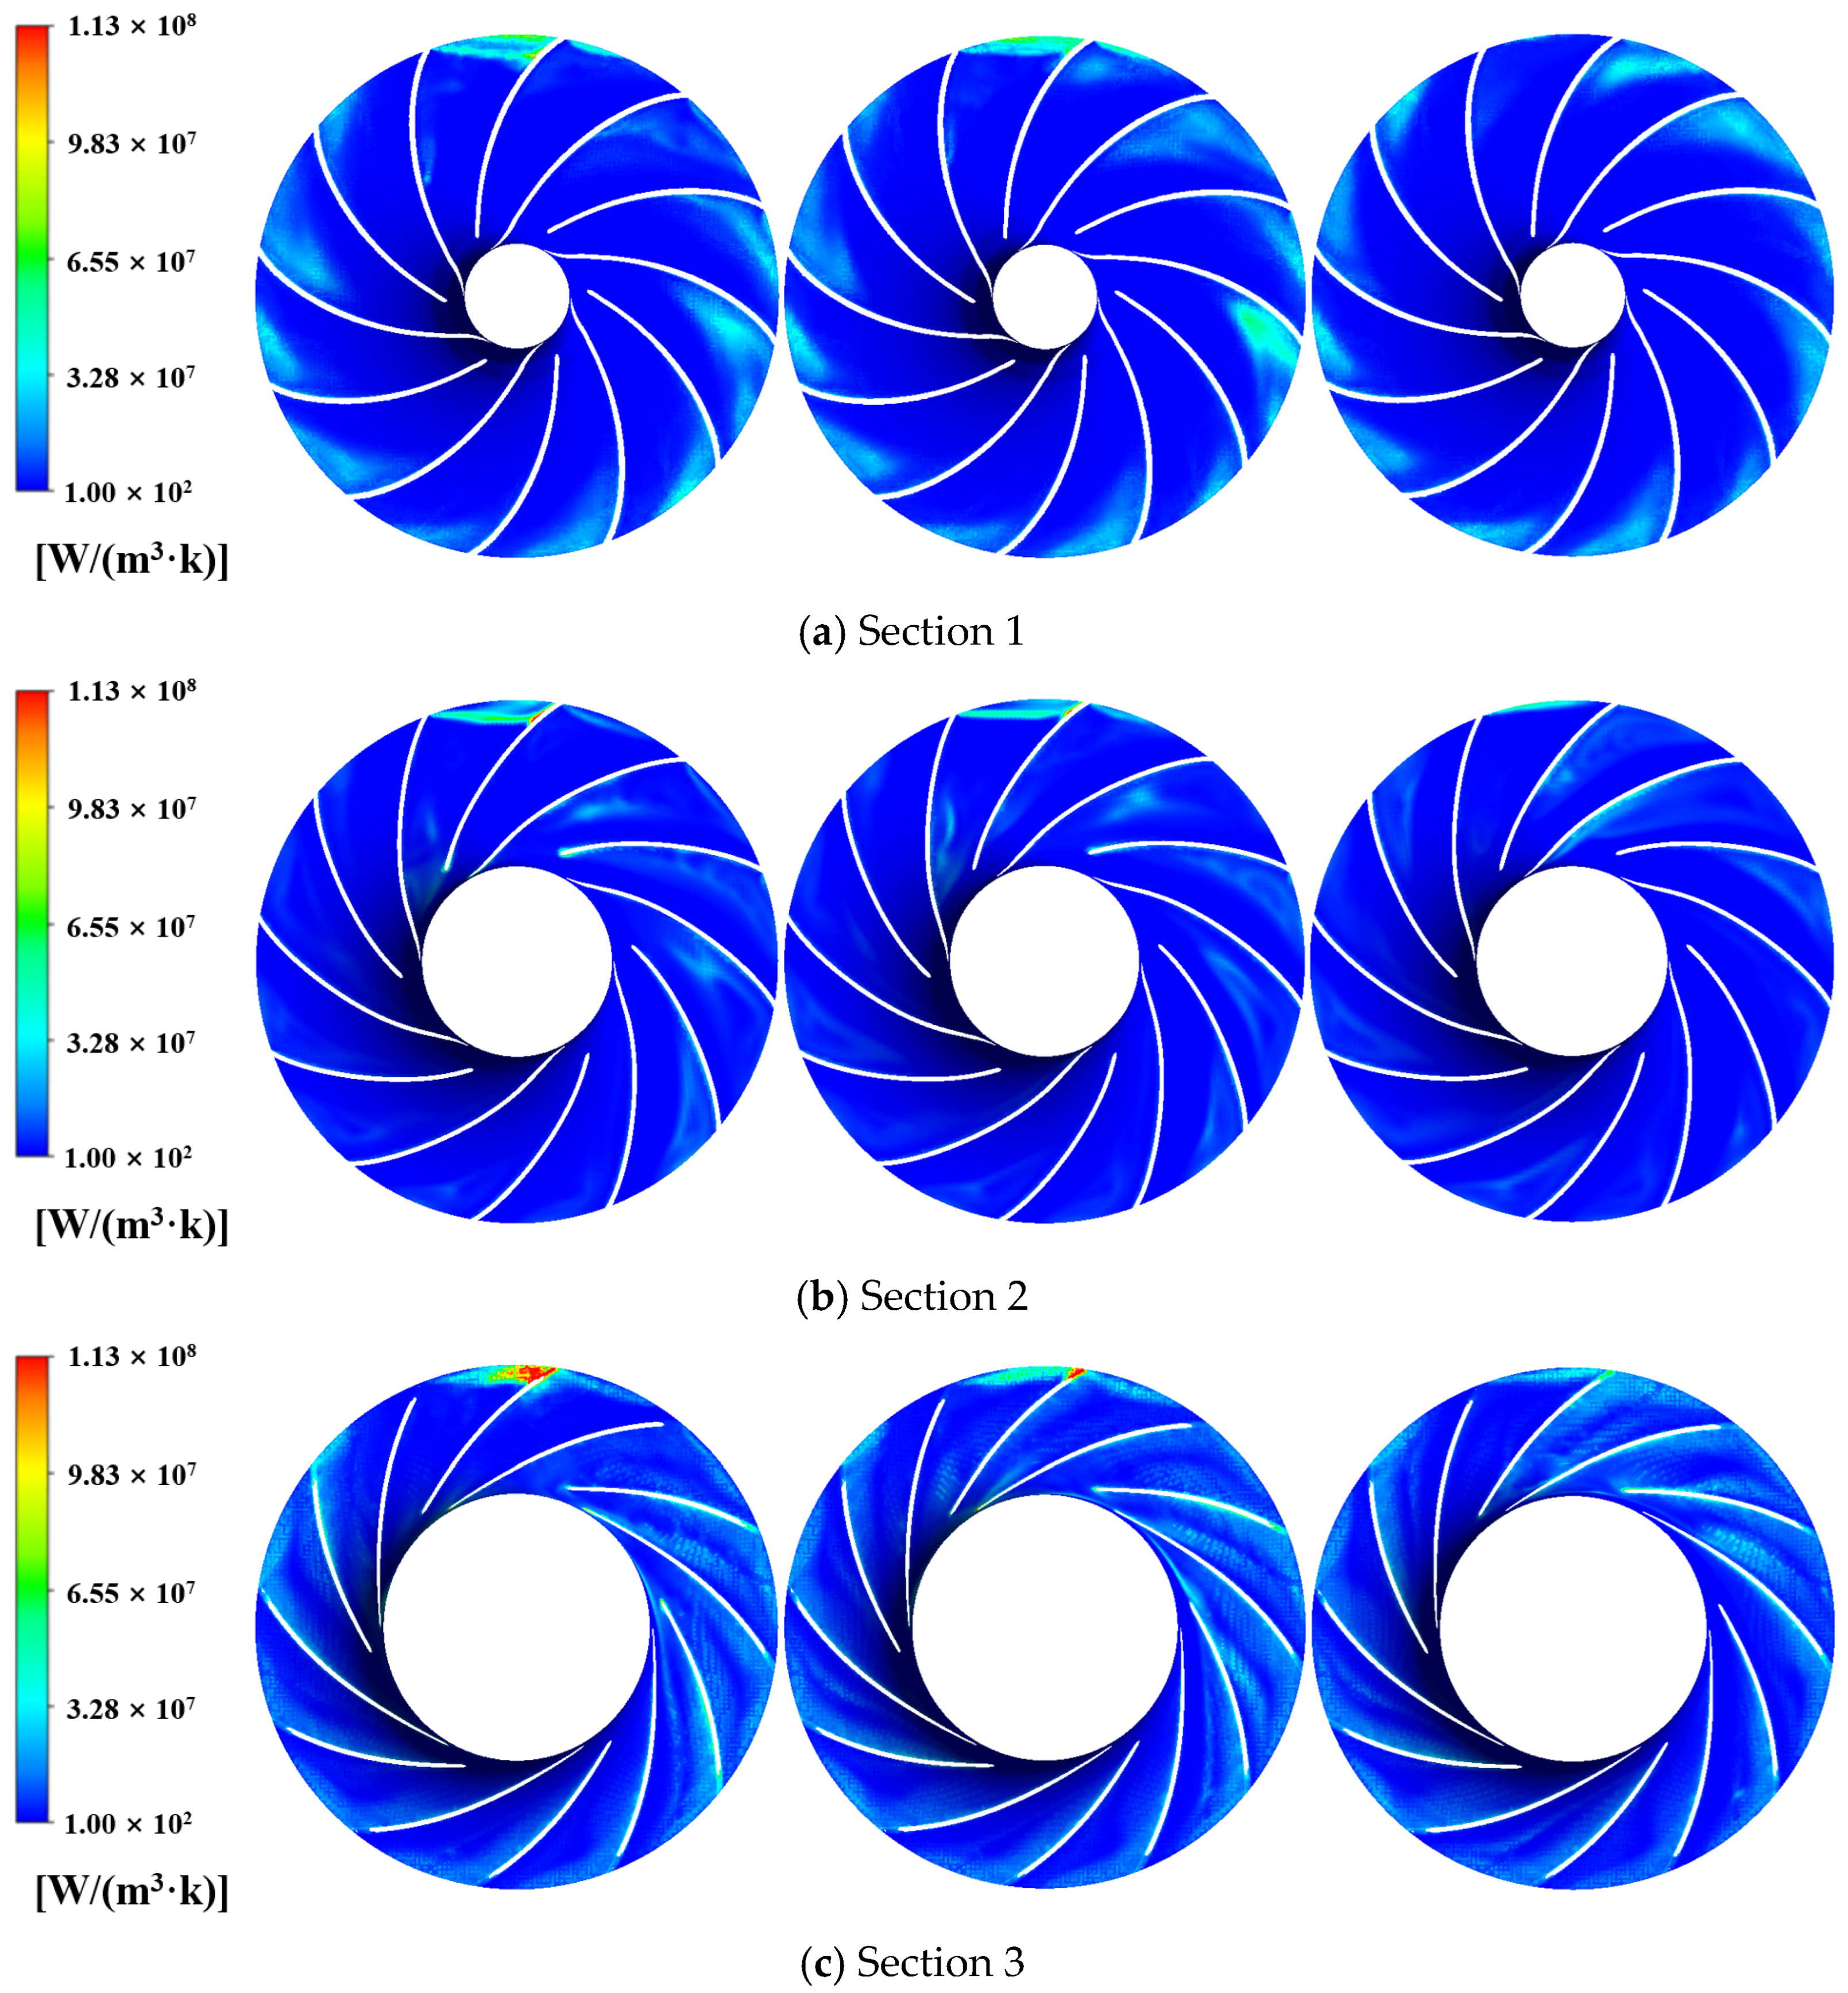
4.2.2. Entropy Generation Distribution

Figure 9 and Table 3 show the trend of the maximum entropy generation values and the specific values on three monitoring surfaces under six flow conditions. As shown in Figure 9, the maximum value of entropy generation first increases and then decreases. After the rated flow operating point, there is a significant decrease in entropy generation. This could be attributed to the observation that, as the flow rate reaches a certain threshold, the average fluid velocity significantly diminishes, leading to a reduction in the fluid’s turbulence or disorder. Additionally, under each flow condition, the entropy generation is always highest at 90% of the blade height near the top clearance of the blade, which is also where the greatest energy loss occurs.
Three cross-sections under three typical working conditions in the impeller domain of the centrifugal compressor were used as the analysis objects to obtain the entropy generation distribution.
As shown in Figure 10 and Figure 11, at a constant blade height, the increase in the flow rate leads to a less significant distribution of entropy generation loss. Simultaneously, a region of higher entropy can be observed on the suction side of the blade near the trailing edge, which is associated with the flow losses resulting from the impeller’s rotation. Additionally, consistent with the findings of Zhang et al. [15], the high-entropy zone at the same blade height remains consistently positioned directly above, i.e., near the tongue, and this does not change with variations in flow rate. This location aligns closely with the distribution of turbulent kinetic energy, providing a clearer indication of where energy losses occur within the impeller’s flow passage.
According to the definition of entropy generation, its distribution pattern also reflects, to some extent, the transformation of flow losses into internal energy and the resulting temperature changes. Compression machinery should strive to avoid local dramatic temperature changes, and in heat pump units, the increase in the temperature of the compression working fluid should be minimized as much as possible.

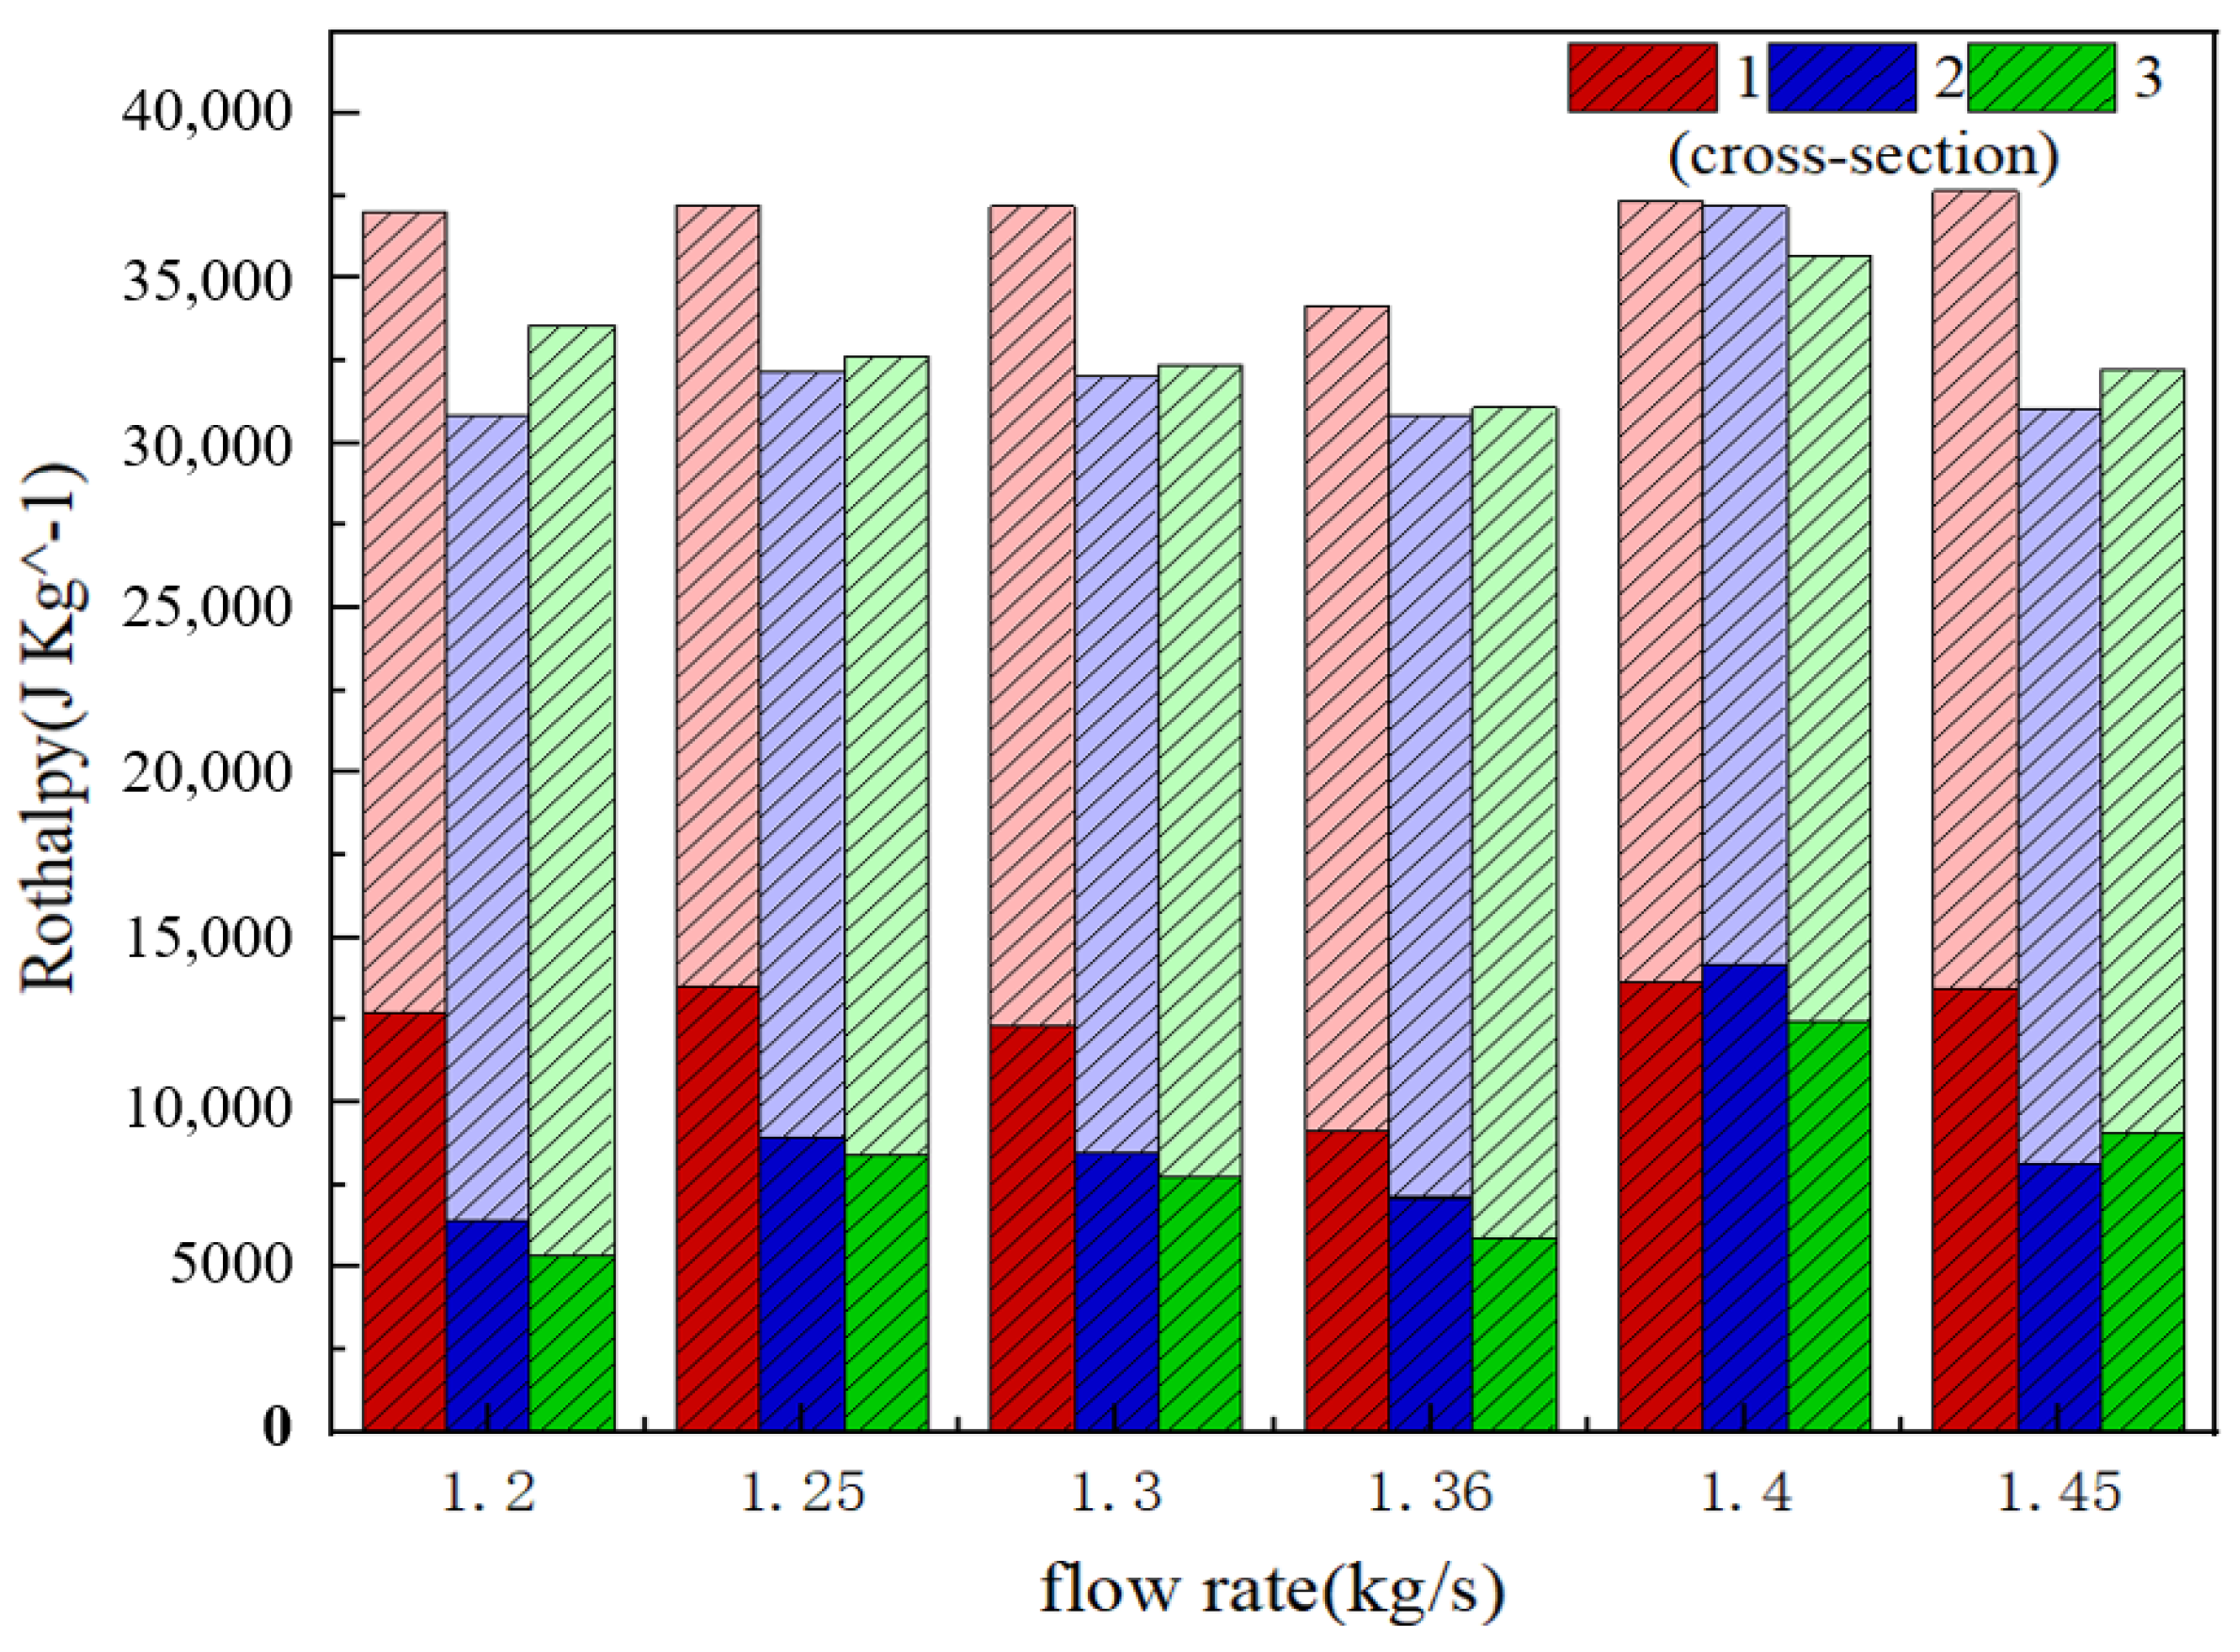
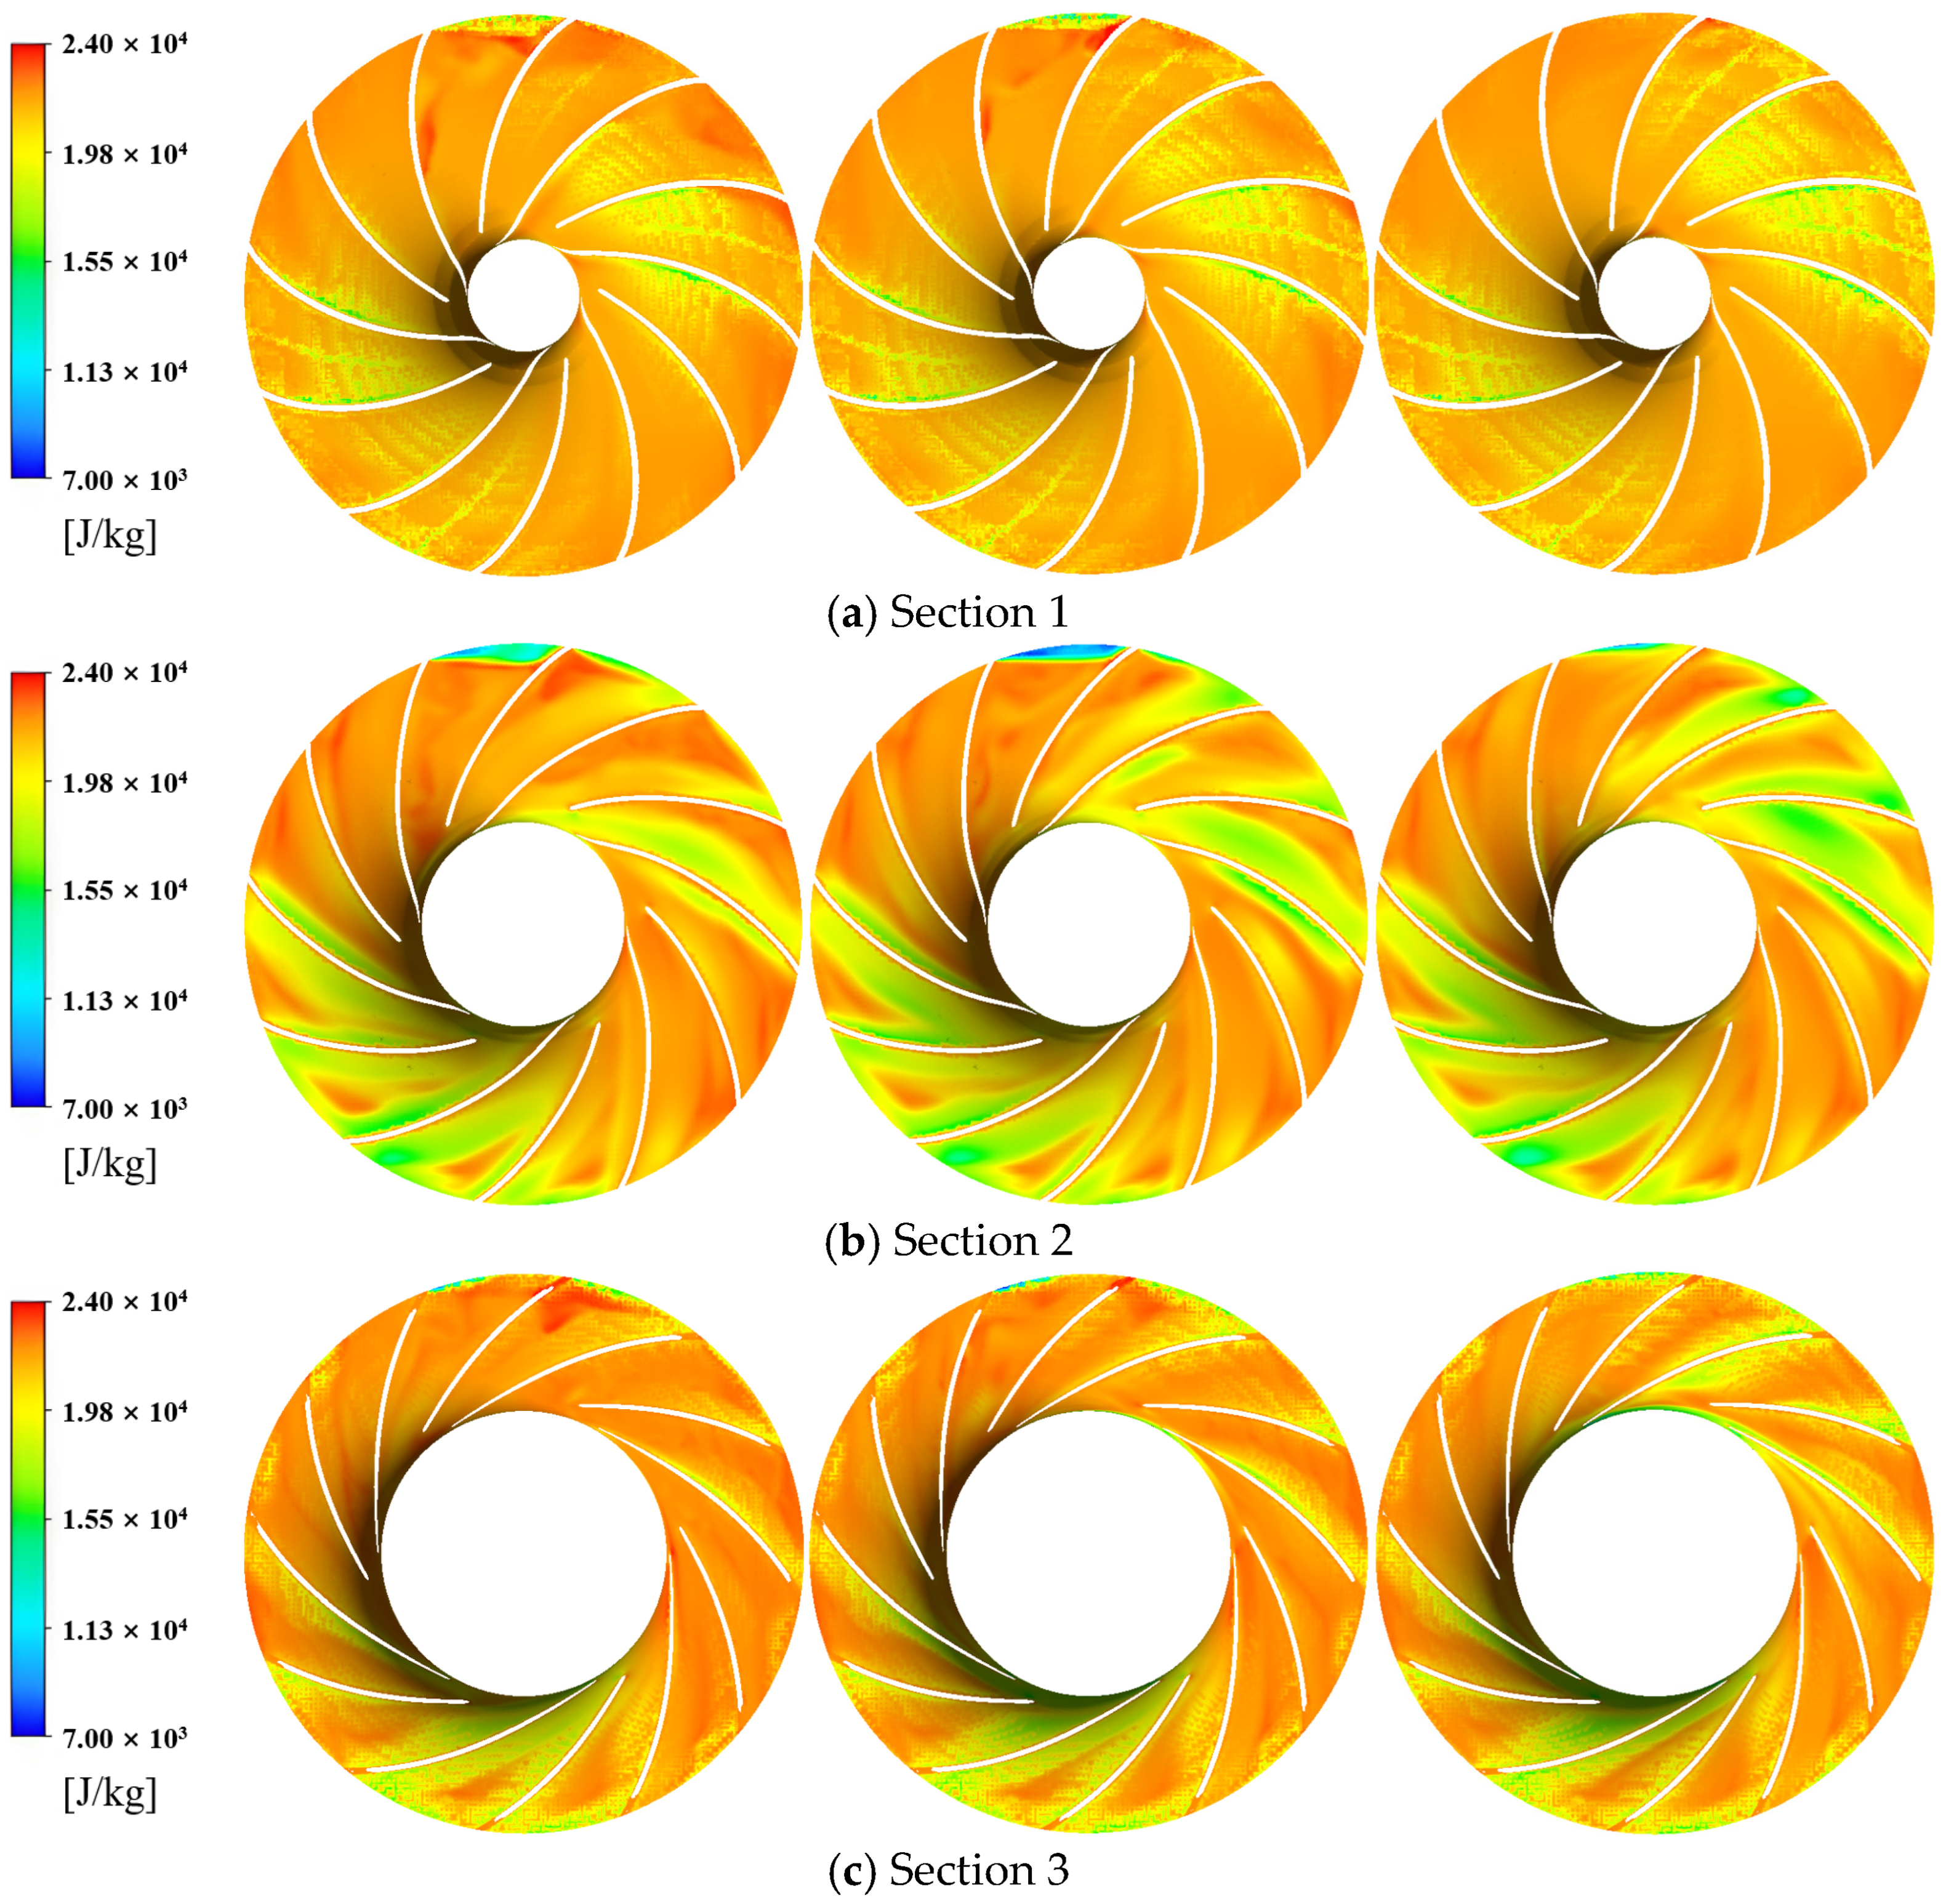
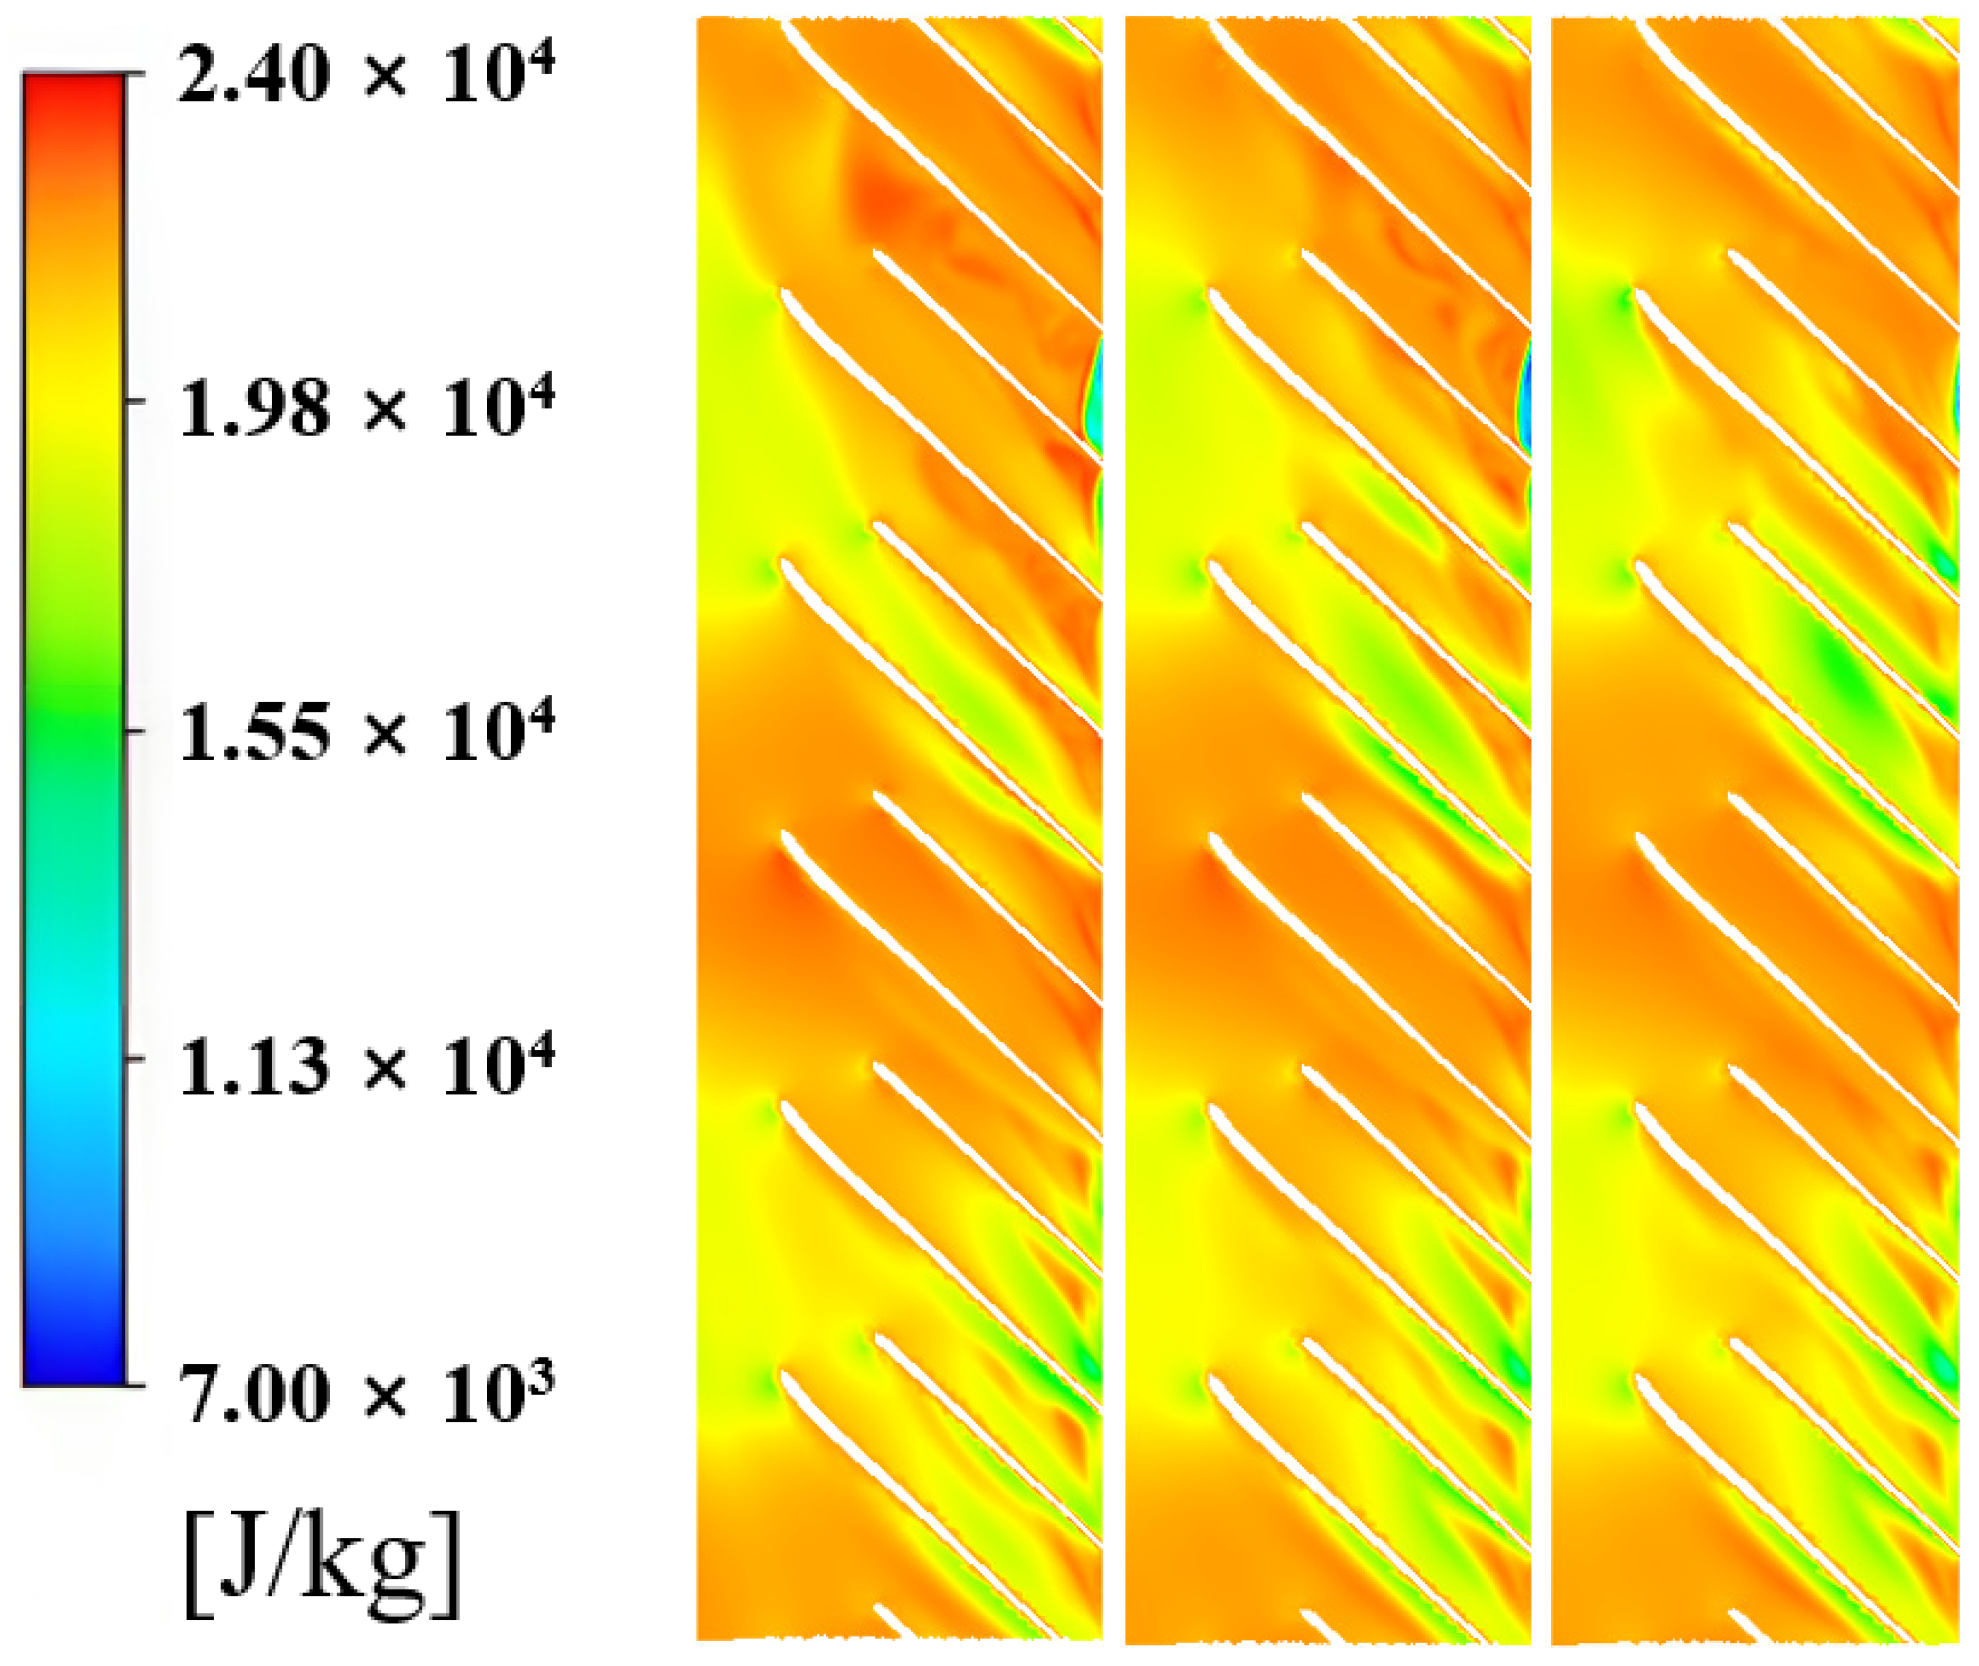
4.2.3. Rothalpy Distribution

Rothalpy signifies the relative enthalpy associated with the rotating frame of reference for a fluid element, serving as a tool to analyze the energy transformation within the centrifugal compressor’s impeller from inlet to outlet. As the Rothalpy value rises, the fluid micromass acquires energy, while as the Rothalpy value declines, the fluid micromass experiences energy depletion. The definition of relative rotor enthalpy indicates that as Rothalpy decreases, the fluid micromasses experience an increase in energy loss. The specific trend and values of Rothalpy are shown in Figure 12 and Table 4 below. The lower half of Figure 12 highlights the minimum value of Rothalpy under the current working conditions, while the upper half shows the maximum value.
It can be seen from Figure 12 and Table 4 that the size of the blade flow channel monitoring surface Rothalpy is similar under different flow rates, and there is no obvious trend of an increase or decrease. The minimum Rothalpy generally occurs at approximately 90% of the blade height, aligning with the distribution pattern of the high-entropy zone. This phenomenon stems from significant energy losses near the tip clearance, which is the underlying cause for both observations.
Figure 13 and Figure 14 show the distribution of rotor enthalpy in each section under three typical working conditions.
As can be seen from Figure 13 and Figure 14, the distribution trend of Rothalpy in the same monitoring surface of the lobe rotation channel under different flow rates is similar. Among the three cross-sections, the region with the lowest Rothalpy at 50% blade height exhibited the widest distribution, indicating that this area is responsible for the greatest extent of energy loss. The two sides of the blade also produce a low Rothalpy, which may be because the fluid moves under centrifugation, fluctuates violently on both sides of the impeller, and the flow state is disordered, causing a large energy loss. Usually, according to the definition of relative energy rotor enthalpy, the area near the low Rothalpy of the blade can reflect the pressure situation near the blade to a certain extent, which is usually manifested as negative pressure, and the pressure distribution on the blade surface also affects the service life of the compressor. At the same time, observing Figure 13, it can be found that the distribution area of low Rothalpy is mainly concentrated near the blade and near the tongue, which is similar to the distribution law of turbulent kinetic energy and entropy generation, and the cause of this phenomenon is the same.

5. Conclusions

Based on the principles of energy conversion, a systematic analysis was conducted on the flow and energy characteristics of R134a within the centrifugal compressor’s flow path. Extensive research was also carried out to examine these characteristics under various operating conditions. Here are the key findings.
(1)
In the flow range of 1.2–1.45 kg/s, the turbulent flow energy first decreases and then rises with the increase in flow, and the maximum value is concentrated at the tongue, mainly distributed in the impeller inlet and middle. The wave resistance loss reflected by the Mach number is mainly concentrated between the blades and near the blade root, and the Mach number drops sharply near the exit. Simultaneously, as the flow rate increases, the resistance within the impeller rises, leading to a decrease in the Mach number. The Mach number can be used to confirm the relationship between turbulent flow energy and velocity fluctuations from the side;
(2)
Across various flow rates, the primary areas of energy loss within the compressor are concentrated at the blade tips and in the vicinity of the tongue. When the flow rate increases from 1.2 kg/s to 1.45 kg/s, the maximum total entropy area decreases by 161%, and the minimum Rothalpy increases by about 90%. As the flow increases, the entropy generation initially rises and then falls, with the Rothalpy at the design operating point reaching its minimum. However, no clear trend is observed overall;
(3)
According to the analysis of the energy conversion theory, the high-entropy area can indicate a sharp change in temperature to a certain extent, which will not only lead to energy dissipation, but also affect the life of the device. The low Rothalpy can reflect the pressure situation in the area to a certain extent, which is usually manifested as negative pressure, which affects the compression efficiency.
The theoretical analysis method of energy conversion, combining entropy generation and relative energy rotor enthalpy, can fully consider the effects of temperature and pressure and can comprehensively identify the locations of energy loss. These research results can lay the foundation for compressor structure optimization and energy-saving design.
The methods adopted in this study, however, have certain limitations. In this study, analysis based on the theory of entropy generation assisted in identifying locations and quantifying the extent of energy losses. The concept of relative energy rotor (Rothalpy) was used to quantitatively assess the patterns of energy fluctuations. Nevertheless, the applicability and reliability of these methods under non-steady flow conditions and with novel media remain to be further validated. The findings of this study offer valuable guidance for optimizing the design aspects and operating conditions of centrifugal compressors. Future research can optimize the geometric structure of centrifugal compressors, such as by reducing blade tip clearance and improving blade design, to decrease energy dissipation and enhance performance. Additionally, carefully controlling the operating conditions, such as maintaining flow within the optimal range and avoiding excessively high rotational speeds, can further reduce entropy generation and improve the efficiency of the compressor.

Author Contributions

Conceptualization, Y.P. and Z.X.; methodology, Y.P. and Z.X; software, Z.X. and L.Z.; validation, Z.X. and X.L.; formal analysis, Z.X.; investigation, X.L. and X.X.; resources, X.L. and X.X.; data curation, L.K.; writing—original draft preparation, Z.X.; writing—review and editing, Z.X. and L.K.; visualization, L.Z.; supervision, Y.P. and X.L.; project administration, Y.P., X.L. and X.X.; funding acquisition, Y.P., X.X. and H.X. All authors have read and agreed to the published version of the manuscript.

Funding

This research was funded by the National Natural Science Foundation of China Youth Fund (grant number 52304004), Key R&D projects in Sichuan Province (grant number 2023YFG0093), International Science and Technology Innovation Cooperation funded projects (Sichuan Province) (grant number 2023YFH0033), Central Guiding Local Science and Technology Development Special Project in Sichuan Province (grant number 2024ZYD0122, 2024ZYD0142), Chengdu Soft Science Research Project (grant number 2023-RK00-00017-ZF), and Tianfu Emei Plan Youth Talent Project (grant number Sichuan Emei No. 1949).

Data Availability Statement

The original contributions presented in this study are included in the article. Further inquiries can be directed to the corresponding author.

Acknowledgments

We sincerely thank the National Natural Science Foundation, Sichuan Provincial Department of Science and Technology, and other funding bodies for their support. Special thanks to the Chengdu Soft Science Research Project and Tianfu Emei Plan Youth Talent Project. We also appreciate the invaluable help from colleagues, friends, and family, as well as the insightful feedback from anonymous reviewers.

Conflicts of Interest

The authors declare no conflicts of interest.

References

  1. Widiatmojo, A.; Chokchai, S.; Takashima, I.; Uchida, Y.; Yasukawa, K.; Chotpantarat, S.; Charusiri, P. Ground-Source Heat Pumps with Horizontal Heat Exchangers for Space Cooling in the Hot Tropical Climate of Thailand. Energies 2019, 12, 1274. [Google Scholar] [CrossRef]
  2. Wang, P.L.; Dong, F.; Jia, H.D.; Jiang, J.; Chen, S.; Hu, S.; Rao, J.; Huang, W. Influences of Centrifugal Compressor Impeller Design Based on Streamline Curvature Method. Fluid Mach. 2013, 41, 27–32. [Google Scholar] [CrossRef]
  3. He, X.; Gong, W.; Deng, J.; Li, J.; Liang, L. Influence of Impeller Tip Clearance on the Performance of Centrifugal Refrigeration Compresser. J. Xian Jiaotong Univ. 2019, 53, 30–37. [Google Scholar] [CrossRef]
  4. Li, S.; Ma, S.; Zhang, J. Characteristic Analysis of Flow Field in Centrifugal Impeller of High Temperature Heat Pump with Variable Blade Numbers. Fluid Mach. 2008, 10, 15–18+62. [Google Scholar] [CrossRef]
  5. Xu, C.; Amano, R.S. Effects of Asymmetric Radial Clearance on Performance of a Centrifugal Compressor. J. Energy Resour. Technol. 2018, 140, 052003. [Google Scholar] [CrossRef]
  6. Xu, C.; Amano, R.S. Centrifugal Compressor Performance Improvements Through Impeller Splitter Location. J. Energy Resour. Technol. 2018, 140, 051201. [Google Scholar] [CrossRef]
  7. Gao, F.; Zhu, D.; Pan, X. CFD Analysis of Stage Flow in Small Flow Centrifugal Refrigeration Compressor. Fluid Mach. 2017, 45, 78–82+57. [Google Scholar] [CrossRef]
  8. Gao, F.; Pan, X.; Zhu, D. Simulating Flow in Pump Impeller of Airborne Centrifugal Refrigeration Compressor. Mech. Sci. Technol. 2019, 38, 963–969. [Google Scholar] [CrossRef]
  9. Zhou, Y.; Sun, Y.; Hu, F.; Tan, J.; Yang, S.; Liu, X. Parameters Optimization and Performance Investigation of Centrifugal Compressor with Bionic Impeller Inspired by Owl Wing. J. Xian Jiaotong Univ. 2023, 7, 1–8. [Google Scholar] [CrossRef]
  10. Feng, R.; Lian, J.; Li, J. Analysis on influence of circumferential deviation of splitter blade on internal flow field and performance of high-speed centrifugal compressor. J. Mech. Des. 2022, 39, 85–91. [Google Scholar] [CrossRef]
  11. Hung, K.-S.; Ho, K.-Y.; Hsiao, W.-C.; Kuan, Y.-D. The Characteristic of High-Speed Centrifugal Refrigeration Compressor with Different Refrigerants via CFD Simulation. Processes 2022, 10, 928. [Google Scholar] [CrossRef]
  12. Shivani, S.; Amar Murthy, A.; Srinivas, G. Aerodynamic performance enhancement of centrifugal compressor using numerical techniques. F1000Research 2024, 13, 480. [Google Scholar] [CrossRef]
  13. Meng, C.; Zuo, Z.; Sun, J.; Guo, W.; Liang, Q.; Chen, H. Internal Inflow Study on a High-Pressure Centrifugal Compressor with Shroud and Backside Cavity in a Compressed Air Energy Storage System. Proc. Inst. Mech. Eng. A J. Power Energy 2022, 236, 1418–1432. [Google Scholar] [CrossRef]
  14. Wang, Y.; Liu, X.; Zhou, Y.; Fan, H.; Chen, Y.; Zhang, Z. Performance Analysis and Multi-Parameter Optimization of Centrifugal Impeller Configuration for the Centrifugal Compressor Used in Fuel Cells. J. Xian Jiaotong Univ. 2022, 56, 164–174. [Google Scholar] [CrossRef]
  15. Zhang, H.; Zhang, H.; Wang, Z. Effect on Vehicle Turbocharger Exhaust Gas Energy Utilization for the Performance of Centrifugal Compressors under Plateau Conditions. Energies 2017, 10, 2121. [Google Scholar] [CrossRef]
  16. Liu, S.; Wang, Q.; Ren, Y.; Zhang, K.; Jin, R. Simulation Analysis of Compressor Flow Field in Turbocharger. Fluid Mach. 2018, 46, 23–27+12. [Google Scholar] [CrossRef]
  17. Li, S.; Liu, Y.; Omidi, M.; Zhang, C.; Li, H. Numerical Investigation of Transient Flow Characteristics in a Centrifugal Compressor Stage with Variable Inlet Guide Vanes at Low Mass Flow Rates. Energies 2021, 14, 7906. [Google Scholar] [CrossRef]
  18. Li, Z.; Wu, Y.; Li, L.; Lu, X.; Han, G. Numerical Investigation of Low Reynolds Number Effects on Energy Loss inside Centrifugal Compressor with Different Inlet Conditions. Aerosp. Sci. Technol. 2024, 146, 108923. [Google Scholar] [CrossRef]
  19. Zhang, F.; Dong, Q.; Wang, P. Entropy Analysis of Thermodynamic Process for Centrifugal Compressors. Chin. J. Turbomach. 2011, 6, 29–31+43. [Google Scholar] [CrossRef]
  20. Kock, F.; Herwig, H. Local Entropy Production in Turbulent Shear Flows: A High-Reynolds Number Model with Wall Functions. Int. J. Heat Mass Transf. 2004, 47, 2205–2215. [Google Scholar] [CrossRef]
  21. Mathieu, J.; Scott, J. An Introduction to Turbulent Flow; Cambridge University Press: Cambridge, UK, 2000. [Google Scholar]
  22. Lyman, F.A. On the Conservation of Rothalpy in Turbomachines. ASME J. Turbomach. 1993, 115, 520–525. [Google Scholar] [CrossRef]
  23. Shao, D.W. Influence of Tip Clearance with Different Width on the Performance and Internal Fluid Flow of Centrifugal Impeller. J. Eng. Therm. Energy Power 2017, 32, 29–36+146. [Google Scholar] [CrossRef]
  24. Zhang, C.; Shi, J. Aerodynamic Design and Analysis of 20MW Class S-CO2 Cycle Centrifugal Compressor. J. Gas Turbine Technol. 2023, 65, 327–330+334. [Google Scholar] [CrossRef]
  25. Tian, Y.; Li, Y.; Hao, J.; Liu, J.; Kai, Y.; Yang, J.; Zhang, Z. Analysis of the Impact of Structural Parameters on the Performance of CO2 Centrifugal Compressor. Cryog. Eng. 2024, 5, 21–31. [Google Scholar] [CrossRef]
Figure 1. Energy conversion theory flowchart.
Processes 13 00471 g001
Figure 2. Centrifugal compressor’s physical model.
Processes 13 00471 g002
Figure 3. Centrifugal compressor mesh.
Processes 13 00471 g003
Figure 4. Polytropic compression efficiency and compression ratio characteristic curves.
Processes 13 00471 g004
Figure 5. Trend of maximum turbulent kinetic energy.
Processes 13 00471 g005
Figure 6. Contours of turbulent kinetic energy.
Processes 13 00471 g006
Figure 7. Contours of turbulent kinetic energy between blades.
Processes 13 00471 g007
Figure 8. Contours of Mach numbers.
Processes 13 00471 g008
Figure 9. The trend of maximum entropy generation.
Processes 13 00471 g009
Figure 10. Contours of entropy generation.
Processes 13 00471 g010
Figure 11. Contours of entropy generation between blades.
Processes 13 00471 g011
Figure 12. Rotor enthalpy change trends.
Processes 13 00471 g012
Figure 13. Contours of relative rotor enthalpy.
Processes 13 00471 g013
Figure 14. Contours of relative rotor enthalpy between blades.
Processes 13 00471 g014
Table 1. The parameters of the impeller.
ItemParameters
Number of blades (main vane/shunt vane)6/6
Blade outlet mounting angle40.1°
Impeller outlet width4 mm
Impeller outlet diameter110 mm
Tip clearance0.4 mm
Impeller inlet blade root diameter20 mm
Impeller inlet blade top diameter60 mm
Table 2. Turbulent kinetic energy values of each section under variable working conditions.
Flow Rate (kg/s)Section 1 Section 2 Section 3
Min (J/kg)Max (J/kg)Min (J/kg)Max (J/kg)Min (J/kg)Max (J/kg)
1.20.27982456.4160.018914842.7541.063741063.06
1.250.294949309.6350.020035786.4790.417929793.432
1.30.306096343.7970.019535707.7020.433244587.146
1.360.3441290.1320.020008609.0210.435938600.269
1.40.285608182.0470.019188405.9690.435021429.342
1.450.376257220.1740.019894617.0680.470167315.719
Table 3. Entropy generation values of each section under variable working conditions.
Flow Rate (kg/s)Section 1 Section 2 Section 3
Min [W/(m3·k)]Max [W/(m3·k)]Min [W/(m3·k)]Max [W/(m3·k)]Min [W/(m3·k)]Max [W/(m3·k)]
1.21202.141.61 × 10833.90841.62 × 1082960.065.17 × 108
1.251352.121.30 × 10834.60372.01 × 108855.9656.68 × 108
1.31435.81.66 × 10838.43181.80 × 1081012.054.93 × 108
1.361428.871.05 × 10838.15032.09 × 108938.5774.15 × 108
1.41439.555.59 × 10734.06385.91 × 1071000.31.17 × 108
1.451910.045.78 × 10743.3375.75 × 1071092.429.08 × 107
Table 4. Enthalpy values of rotors of each cross-section under variable working conditions.
Flow Rate (kg/s)Section 1 Section 2 Section 3
Min (J/kg)Max (J/kg)Min (J/kg)Max (J/kg)Min (J/kg)Max (J/kg)
1.212,725.224,322.86436.2124,429534528,228.2
1.2513,52123,707.3893023,222.48396.9324,231.1
1.312,29024,914.8843623,633.7774224,621.2
1.36915125,027.1710623,742.3589025,197.4
1.413,66823,690.614,18323,008.112,44323,240.3
1.4513,43624,230.3816222,873.5907223,148.4
Disclaimer/Publisher’s Note: The statements, opinions and data contained in all publications are solely those of the individual author(s) and contributor(s) and not of MDPI and/or the editor(s). MDPI and/or the editor(s) disclaim responsibility for any injury to people or property resulting from any ideas, methods, instructions or products referred to in the content.

