Abstract
The hydrogen plasma smelting reduction process has the potential to drastically reduce the CO2 emissions of the steel industry by using molecular, atomic and ionized hydrogen as a reducing agent for iron ores. To increase the hydrogen and thermal efficiency of the process, a pre-reduction and pre-heating stage should be incorporated in a future upscaling of an existing HPSR demonstration plant within the scope of the “SuSteel follow-up” project to a target capacity of 200 kg/h of iron ore. The determination of the optimal process parameters is followed by a review of possible reactor types. A fluidized bed cascade, a cyclone cascade and a rotary kiln are compared for this purpose. Their applicability for the hydrogen plasma smelting is discussed, based on their fundamental design and operational procedures. Additionally, critical features of the different reactor types are outlined. A cyclone cascade with at least 3 stages is proposed to be the optimal reactor for pre-heating and pre-reducing the input material for the upscaled hydrogen plasma smelting reduction demonstration plant, based on the assessment.
1. Introduction
The steel industry emits around 7% of the total annular CO2 emissions worldwide [1]. To counteract climate change, those emissions need to be reduced [2]. One possible future technology for green steel production is the hydrogen plasma smelting reduction (HPSR) process, which has been under development since the beginning of the 1990s at the Chair of Ferrous Metallurgy at Montanuniversität Leoben, Austria [3]. It uses molecular, atomic and ionized hydrogen to directly produce molten crude steel from iron ore fines, thereby generating environmentally friendly water vapor [4]. The plasma, stabilized by argon, burns between the molten bath as anode and the hollow graphite cathode, through which the oxidic input material and the gases are charged continuously [5]. The schematics of the process are shown in Figure 1.

Figure 1.
Overview of the HPSR process. The green marked area indicates the pre-heating and pre-reduction stage, for which its reactor selection is the topic of this work.
The detailed fundamentals of the process have already been described multiple times by other researchers, to which the reader is referred to [6,7,8,9]. Besides hardly emitting any CO2, its main advantages include more favorable thermodynamics and faster reaction kinetics compared to conventional hydrogen-based direct reduction processes [10]. Furthermore, the direct processing of low-grade iron ore fines is possible since impurities like phosphorus or sulfur can be removed by operating certain process conditions [4]. A first study estimates the specific production costs for hot strip based on the HPSR process to be around 20% lower compared to conventional integrated steel mills [11]. The status of the process development is currently at technology readiness level 5, as a demonstration plant with a capacity for 200 kg ore per trial has been built [12]. Basically, it is a gas-tight direct-current electric arc furnace, operated at a slight overpressure, with hydrogen introduction through a hollow graphite cathode. A process feature is, that the injected hydrogen is heated to very high temperatures and hot unreacted hydrogen is still contained in the off-gas. This can be used for pre-reducing iron ores as well as pre-heating the charge. In principle, any hydrogen direct reduction plant can be used for this purpose.
To be able to conduct experiments which such a setup, the previous batch-wise operation is currently being transformed within the scope of the “SuSteel follow-up” project into a fully continuous one with the ability to reduce 200 kg/h of ore [13]. The pre-heating and pre-reduction of the input material should be done solely with the off-gas of the HPSR reactor to increase the process’ hydrogen utilization and thermal efficiency. Additionally, because of the lower residence time of pre-reduced ore in the plasma reactor, the refractory wear and electrode consumption also decrease [14]. This work aims to compare possible reactor types and propose the most suitable one for the pre-heating and pre-reduction of iron ores with HPSR off-gas. Firstly, a short summary of the ideal process parameters from thermodynamic and kinetics considerations is given, followed by the requirements for the reactor. After comparing different reactor types, the optimal one is selected based on a thorough assessment of their advantages and disadvantages.
2. Ideal Parameters for Iron Ore Pre-Reduction with Hydrogen
To select a suitable reactor for the desired process, the operating parameters need to be defined beforehand. Therefore, a study on the most optimal conditions for the pre-reduction of iron ores in hydrogen has to be conducted. Since a multitude of literature exists on this topic, including some review papers [15,16,17], only the most important findings are summarized in the following. For the optimal reduction of iron oxides with hydrogen containing gas in a pre-reduction reactor, the following conditions should be satisfied:
- The pre-reduction process should be operated at the highest possible temperature [15].
- The reducing gas should contain as much hydrogen as possible and few other components like H2O, Ar, CO and CO2 [18,19]. However, the water vapor concentration in the pre-reduction stage will be high at good hydrogen utilization in the proceeding HPSR process. For the benefit of the latter, the contents of carbon monoxide, carbon dioxide and argon in the off-gas are desired to be low. CO and CO2 originate from the cathode wear [20], which ideally is minimized. While argon acts as plasma stabilizer [5], increased contents lead to a higher energy consumption for the heating of the reducing gas to reaction temperature.
- The input material should be very fine to facilitate fast reactions also at lower temperatures during heating [15]. A particle size of <500 µm is suggested for the reduction to FeO with carbon monoxide at 1000 °C [21]. Due to the better diffusivity of hydrogen [15], the reduction should also happen fast below this threshold. The grain sizes and distributions of iron ore concentrates vary between producers. Some provide the whole fraction below 0.1 mm, while others target the spectrum of 0.1–1 mm with only around 15% below 0.1 mm [22]. The typical pellet feed, however, consists of grains up to 0.15 mm [23]. This means that it can be used directly for pre-reduction in the HPSR process without further pre-treatment.
- Higher porosity of the iron ore benefits the reduction because of the decreased gas diffusion resistance and higher specific surface area [15].
- The effects of morphology are intertwined with the ones of porosity, since denser microscopical structures reduce the mass transfer in the gas phase. Therefore, the preferential input materials for the HPSR process are limonitic and porous hematitic ores, while magnetitic and dense hematitic ones are less beneficial regarding their slow reduction kinetics. From the viewpoint of carbon direct avoidance [24], siderite cannot be used because of its carbonatic nature, although it is easily reducible due to its high specific surface area [25].
- The presence of gangue elements can affect the reducibility positively and negatively. On the one hand, they can facilitate micro-cracking, which increases the reduction rate. However, dense compounds can also raise the resistance of the interfacial chemical reaction, thereby hindering the reduction process. Those effects are not necessarily specific for a given gangue element but depend on the actual conditions. For example, alumina forms hercynite, which can aid the reduction process by introducing micro-cracks. Nevertheless, this phase can also decrease the reduction rate for magnetite [16].
3. Definition of the Scenario Parameters
Before selecting a reactor type, its use case must be defined. First of all, it is operated as a pre-heating and pre-reduction step solely with the off-gas of the HPSR process. This means that the reducing gas flow rate is dictated by thermodynamic limits and increasing it would lead to decreased efficiencies in the HPSR process. Namely, raising the amount of hydrogen leads to a lower hydrogen utilization degree in the HPSR reactor and adding another gas lowers its partial pressure, yielding unfavorable reducing conditions. However, putting more hydrogen through the HPSR reactor than theoretically needed does not necessarily lower the overall hydrogen utilization degree of the HPSR process combined with the pre-reduction stage. If the excess hydrogen reacts in the pre-reduction facility accordingly, then the overall hydrogen efficiency is conserved and only the distribution of the reduction extend between the two stages is changed. For simplification, this behavior is not included in the following assessments. On the other hand, decreasing the hydrogen supply means that too little reducing agent is provided, which would lead to an accumulation of iron oxides in the HPSR reactor and is therefore not allowed for a continuous operation.
As input material a typical hematitic iron ore with around 95 wt.-% Fe2O3 (extracted from data provided in [22]) and a maximum grain size of 150 µm is used, so that the direct processing of pellet feed is enabled as stated above. In the pre-reduction step the hematite gets fully reduced to stochiometric FeO for simplification, which then is charged in the HPSR reactor, where the reduction process to metallic iron is finished. If the HPSR reactor operates at the thermodynamically maximum possible hydrogen utilization of around 40 vol.-% (see the Baur-Glässner diagram shown in Figure 2 for the transformation of liquid wustite into liquid iron), then the mass balance reveals that the normal specific HPSR off-gas rate
is 0.9 Nm3/kg iron ore charged. This is under the assumption that 25 vol.-% of argon need to be added to the plasma gas for arc stabilization [26] and neglects the cathode gasification for simplification. Therein, means the volume flow rate of the HPSR off-gas at normal conditions, the iron ore mass flow rate charged in the pre-reduction and pre-heating reactor, the molar flow rate of the plasma gas supply, the molar volume of an ideal gas at normal conditions, the molar flow rate of hydrogen for the complete reduction of FeO, the molar fraction of argon in the plasma gas input, the molar flow rate of hematite, its mass fraction in the ore and g/mol [27] its molar mass. If the targeted value for the ore throughput is 200 kg/h for the purpose described in the introduction, a of around 180 Nm3/h is obtained.

Figure 2.
Baur-Glässner diagram, calculated with the software FactSage 8.3 [28], databases FactPS, FToxid and FSstel 2023.
Measurements during trials at the demonstration plant as currently configured give off-gas temperatures of usually around 1000 °C. However, since this reactor is basically a scaled-up version of the laboratory setup referred to in the introduction (Section 1), it is not efficiently insulated. Additionally, the upper vessel provides a relatively large surface for heat transfer until the gas reaches the exhaust port. As those problems have been identified, countermeasures will be implemented in the upgraded setup. Further, the cathode unit will be redesigned to feature lower heat losses. Therefore, it can be assumed that higher off-gas temperatures will be attainable, which benefits the pre-reduction and pre-heating stage.
Since the off-gas of the HPSR reactor is in contact with the melt, it can be estimated to leave the reactor at a similar temperature. To keep the produced iron liquid, a minimum temperature of around 1600 °C is required, accounting for local thermal imbalances and some heat losses in the reactor since the melting point of pure iron is 1536 °C [29] and there are not many impurities present [11]. The melting point of wustite is slightly below 1400 °C according to Figure 2. To safely prevent the melting of the material, the target operating temperature is set to 1300 °C. The heat balance [30] of the input materials for a counter-current flow reactor
allows an estimation of whether this is theoretically possible. If heat losses in the reactor are neglected, an exhaust gas temperature of 240 °C is obtained. The exchanged heat energy is 1.2 MJ/kg solids. For this rough estimation, the initial temperature of the ore was set to 25 °C. The determination of the standard enthalpy changes [27] for the ore is based on the assumption of pure Fe2O3, while the one for the reducing gas was superimposed according to its composition, which is 45 vol.-% H2, 30 vol.-% H2O and 25 vol.-% Ar under the given scenario parameters. denotes the standard enthalpy of reaction at temperature and is obtained from the software FactSage 8.3 [28] with the database FactPS 2023 to 31,524.8 J/mol. If the absolute operating pressure is assumed to be 1.1 bara, the adapted HPSR off-gas rate is calculated with the ideal gas law [31]
to 4.7 m3/kg. The off-gas volume flow rate at operating conditions is then 940 m3/h.
For many of the calculations in the following sections, some gas and material properties need to be known. They are summarized here to provide a better overview of the assumed and calculated quantities. From the composition of the HPSR off-gas, a molar mass of 16.299 g/mol and a density at operating conditions of 0.137 kg/m3 results with the treatment as an ideal gas. The kinematic viscosity of the off-gas mixture at operating conditions is calculated to 4.89·10−4 m2/s according to the mixing method of Wilke as presented in [30] together with the polynomial description of the temperature dependent properties of the components. From the data provided in [22], the apparent density of the ore is assumed to be 5000 kg/m3, while its bulk density is set to 2200 kg/m3.
The complete reaction of hematite to FeO corresponds to a reduction degree [32]
of 33%. Therein, denotes the initial and the change in the mass of oxygen. means the mass fraction of the iron species . The water vapor content in the gas entering the pre-reduction reactor is around . From the Baur-Glässner diagram (Figure 2) the equilibrium H2O fraction at 1300 °C for the reaction of magnetite to wustite can be determined as approximately . The following equation provides a rough empirical correlation between the time to reach a certain reduction degree for the reduction of iron oxides [33]:
This allows the estimation of the necessary residence time of particles with in the pre-reduction reactor at to reach the required 33% reduction degree. For simplification, the heating time of the ore to reaction temperature is neglected since the particles are small.
4. Overview of Reactor Types for Non-Catalytic Gas-Solid Reactions
There are several options for classifying chemical reactors. The most fundamental one is according to the operating mode into continuous and discontinuous reactors. For optimal productivity and due to the continuous operation of the HPSR vessel itself, a continuous pre-reduction of the input materials should be implemented. Another classification criterion is the energetic operating mode. The basic types are the isotherm, adiabatic and polytropic reactors. They feature a timely and locally constant temperature profile, the absence of heat transfer through the reactor walls, and the presence of heating or cooling facilities to control the temperature profile, respectively. The desired reactor ideally features adiabatic conditions because the iron ores should only be pre-heated by the sensible heat contained in the HPSR off-gas. Chemical reactors also can be classified according to the phases present. In this case, only two phases exist, namely the iron ores and the HPSR off-gas, which make a gas-solid reactor necessary. Since the chemical reaction is activated thermally, a catalysator is not needed. Non-catalytic gas-solid flow reactors can be classified based on their arrangement into co-current, counter-current and cross-current flow. The counter-current flow reactor is the most energy efficient, making it ideal for an optimal pre-heating stage [34].
To summarize, the optimal reactor for a pre-reduction and pre-heating stage in the HPSR process can be classified as a continuous, counter-flow, adiabatic, non-catalytic, gas-solid reactor.
4.1. The Reh Diagram
Before describing the specific reactor types, another classification system of continuous gas-solid reactors must be explained according to their fluid dynamics. Those are the moving (MBR) and fluidized bed (FBR) as well as the transport reactors (TR). In the MBR, the bed is moved through the reactor either mechanically or gravitationally with a limitation on the gas flow to retain a bulk. The FBR utilizes higher gas velocities to detach the particles from each other and obtain a fluidized state. In a TR, the reactions between the phases happen during the pneumatic conveying of the solids [35].
The operating range of those reactor types can be visualized with the Reh diagram, given in Figure 3. Its derivation according to the procedure described originally in [36] with minor modifications is summarized in Appendix A of this paper, together with an explanation and definition of the symbols used in the following formulas. The equations necessary for the description of the most important lines are [36,37]:
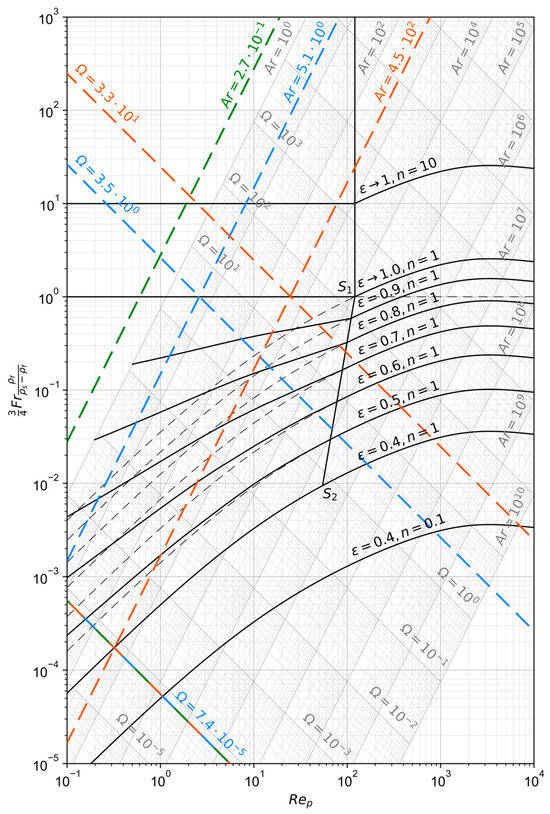
Figure 3.
Reh diagram calculated as described in Appendix A according to the procedure presented in [36].
To aid the practical use of the Reh diagram, two auxiliary parameters can be defined, namely the Archimedes number
and the number
In contrast to and , which both depend on the particle diameter as well as the superficial fluid velocity , besides material properties is only a function of and only of . Their relationship to and is as follows [38]:
Depending on the load factor, three different cases are possible [39]:
- : The fluid velocity is too small to lift the particles and the bulk remains packed at its minimal relative void volume of around 40 vol.-%.
- : The fluid velocity is balanced with the bed weight to keep the bulk in a floating state and the bed fluidizes and expands.
- : The fluid velocity is too large and pneumatic conveying occurs due to the entrainment of the bulk by the flow.
4.2. Fluidized Bed Reactor Cascades
An FBR is a vertical retort, where the gas flows upwards through the bed of solids with a certain velocity at which fluid-like behavior of the whole charge is obtained. For illustrative purposes, a schematic drawing of an FBR for the drying of solids is shown in Figure 4. The gas velocity and particle size distribution need to be carefully balanced to maintain the material in a fluidized state, as can be seen in the derivations of the Reh diagram above. A gas distribution system is used to provide a constant stream of reducing gas over the whole reactor cross section. This can range from simple plates with regularly spaced holes to more complex bubble-cap tuyere distributors, which also prevent the backflow of solids in the gas supply pipes if the gas flow rate is too low. The gas outlet must be equipped with a gas-solid separator, like a cyclone or electrostatic precipitator, to minimize dust discharge. The solids outlet is usually designed as an overflow of the fluidized bed. Many variations of reactors which feature a fluidized bed exist, including circulating or multi-stage processes. The latter are necessary for the scenario assumed in this work to approximate a counter-current reactor system, since a single FBR alone behaves like a continuously stirred tank. However, for simplicity the following derivations of the reactor dimensions and critical parameters only consider the most basic FBR, consisting of one single fluidized bed in a cylindrical retort without solids recirculation [40].
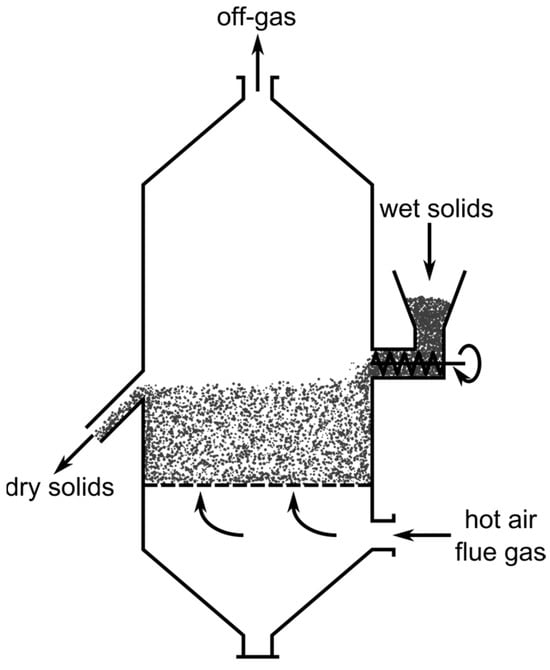
Figure 4.
Schematic drawing of a fluidized bed reactor used for the drying of solids, modified with permission of Elsevier Science & Technology Journals from [40]; permission conveyed through Copyright Clearance Center, Inc.
The advantages of FBRs include the excellent heat and mass transfer due to the good mixing behavior of the phases and the adjustable solids retention time during engineering when defining the reactor dimensions [41]. Disadvantageous are the agglomeration and sintering of the solids due to the high temperatures, leading to larger particles which cannot be kept fluidized above a certain point. This results in the deposition of those lumps at the bottom of the reactor. The easiest ways to overcome this phenomenon are the decrease of the operating temperature and the increase in the gas velocity. However, the first measure usually lowers the conversion rate while the second one facilitates the discharge of fine particles [42].
Problems can occur also at the gas distributing system when using dust-loaded gas as input. Because of the high temperatures, sticking of particles at holes and baffles is possible [40].
One of the most important parameters of a chemical reactor is its reactant residence time. For an FBR, the average residence time
of particles with constant size results from a mass balance of the solids over the bed and models elutriation of each particle size with a kinetic parameter . This parameter is the ratio of the mass flow of particles of a specific size entrained in the off-gas to the mass of those particles in the bed. In the formula above, and denote the mass flows through the gas and the product outlet respectively. The mass fractions of the particle size in the bed as well as in the flow through the gas outlet are denoted by and . indicates the total mass of the bed. If the elutriation is neglected, the average residence time becomes the ratio of the bed’s mass to the solids charging rate. Rearranging allows the calculation of the bed’s mass to 0.23 kg for the given scenario parameters. Besides the average residence time its distribution is also important. Since a single fluidized bed is constantly mixed, each particle has the same possibility to leave it at every moment, assuming a uniform particle size distribution. This behavior is best described by an exponential function. However, when incorporating more stages, the residence time distribution approximates the one of a plug flow reactor, since the probabilities equalize [40].
The maximum reactor diameter can be obtained graphically from the Reh diagram (Figure 3). The Archimedes number , which corresponds to the required maximum particle diameter of 150 µm, is calculated to 5.1. The crossing point of this line with the minimum fluidization curve () defines the lowest possible number and, therefore, the necessary operating velocity as well as the maximum reactor diameter. However, since the particle size threshold is small, it lies outside the chart’s validity range. When extrapolating, a minimum number of 1.2·10−8 is obtained, corresponding to a minimum fluidization velocity of 0.038 m/s. This allows for the calculation of the maximum reactor diameter from the principle of continuity to 3.0 m. Another method for the calculation of is based on the Ergun correlation [38], with which the fluidization starting line (, ) in the Reh diagram can also be described, as explained during its derivation. It has to be noted, that the real design number needs to be higher than the theoretical minimum to ensure the fluidization of small agglomerates with some margin. The quotient of two Archimedes numbers for a particle diameter ratio grows cubically, meaning that if a particle agglomerates to a ratio of 10:1 its original size the corresponding Archimedes number increases 103:1. On the other hand, if the design number gets too high, the entrainment of fines by the gas is increased. An FBR is therefore only applicable to narrow grain size distributions [43]. For further sizing of the reactor, the desired relative void volume needs to be defined. If it is set to 0.6, the design number of 7.4·10−5 is obtained graphically from the Reh diagram as the intercept between the fanned-out line for and the one for . This allows the calculation of the design gas velocity to 0.23 m/s which yields a reactor diameter of 1.2 m. The diameter of the smallest operatable particles is approximately 6 µm, which is obtained from the Archimedes number at the intercept between the design number and the extrapolated fanned-out line for . Above this threshold the elutriation by the gas phase becomes more significant and hinders the operation of dense fluidized beds, introducing the need of a solids recirculation system [40]. Similarly, the maximum fluidizable particle diameter of around 670 µm can be obtained from the crossing with the line for and . This means, that an agglomeration of up to 4.5-fold the maximum particle diameter would be possible for this proposed system.
The bed’s height
can be obtained from the definition of the relative void fraction combined with the volume formula of a cylinder and the number of contained mono-sized particles. For the given scenario, the bed would have a height of just 0.1 mm, which of course, is not practical. This value results from the relatively low ore feed rate and solids retention time, which in turn requires only a small bed mass, together with the relatively large diameter necessary to prevent solids elutriation. This behavior shows that for small grain sizes, a solids separation and recirculation system is inevitable. Another possibility to obtain higher beds is to increase the actual residence time above the minimum required one for reduction. For every 10 cm of height, the residence time of the solids is around 4000 s, corresponding to a mass of approximately 220 kg.
The problem of exposure to high temperatures for elongated times is especially the formation of agglomerates, which can grow too large for fluidization [42]. As mentioned, this phenomenon can be counteracted to a certain degree by increasing the gas velocity. However, this is not desired since it increases the entrainment of solids by the reactor’s off-gas. The operation of pure, homogeneous fluidized bed reactors under the required conditions is only possible with low gas velocities as well as a high dead bed volume and is prone to be influenced by sticking effects.
Alternatively, a cascade of circular fluidized bed reactors (CFBR) could be used to overcome some of the presented limitations. However, since a solids recirculation system is necessary, it is more complex [40].
4.3. Transport Reactor Cascades
When a high proportion of solids discharge is expected in FBR operation anyway and only short residence times are required, a logical step would be to increase the gas velocity vastly to eject all particles deliberately. With the pre-heating and pre-reduction then happening in a transport pipe, the reactor is transformed into a TR. An advantage over the FBR is the ability to operate without a gas distribution system [35]. This mitigates the sticking-problem with the hot, dust-loaded off-gas and allows particles or agglomerates to drop down instead of accumulating in the pre-reduction reactor. Therefore, the TR is best implemented in a vertical off-gas pipe directly over the gas outlet of the HPSR reactor, enabling the unhindered fall of unconveyable particles into the melt. However, the gas flow rate needs to be above a certain threshold to operate with reasonably sized pipes. If the reactor diameter is too small, sticking of particles to the walls can occur. Further disadvantages of using a TR include the low residence times, which lead to a high pre-reduction reactor and its inflexibility [35]. It must always be operated with the specified gas flow rate to maintain a constant velocity for the given reactor diameter, which cannot be changed after construction. Additionally, like a one-stage FBR, a single TR is also a co-current reactor. Therefore, to achieve counter-current flow behavior, it must be operated in multiple stages. The TR also needs some kind of gas-solid separation system, e.g., a cyclone, to separate the output stream into the pre-reduced solids and the off-gas [40].
While a TR provides good heat and mass transfer between phases, reaction kinetics need to be fast to reach the desired conversion because of the low particle residence time. These depend on the reactor’s length and are highest in vertically upwards directed flows due to the effect of gravity at otherwise equal conditions [35].
Although higher heat transfer rates are achieved in TRs than in pure FBRs, both are inferior to CFBRs due to the effect of the solids recirculation [44].
The dimensions of the TR are calculated in the following paragraph according to the derivations presented in [35]. The equation
gives the height for a given reaction time necessary to reach a certain conversion . Therein, indicates the velocity of the particles and the growth rate of the product layer into the inside of a dense spherical particle. The particle’s velocity needs to be corrected by the slip velocity as follows:
It is positive in downwards directed, gravitational flows and negative in upwards directed, counter-gravitational ones. The terminal velocity of a sphere in a non-moving atmosphere can be calculated for laminar flow with the Stokes’ law
and is equal to its slip velocity for dilute flows. For increased solids loadings, interactions between the particles themselves and with the wall can increase the slip velocity manyfold. When considering the two cases of co- and counter-gravitational flows the following equations are obtained for their minimum reactor heights and , respectively:
In the first case, besides , is used for eased comparison between the two types. In the latter case the distribution of the reactor height for different particle diameters for a constant must be considered. Small particles are converted fast, which leads to low reactor heights. Big particles need longer residence times for the reaction, but move slower with the flow, which also results in low reactor heights. The critical diameter is obtained from
and is described as
Solving
for gives
Combining the last two relations results in
Considering the reactor height for particles with the critical diameter in a flow with a velocity high enough to lift all particles yields the presented minimum reactor height for counter-gravitational flow (Equation (20)). It can be observed that counter-gravitational TRs can be by a factor of shorter than co-gravitational ones due to the influence of gravity. A general disadvantage of the derived relations for the minimum reactor heights is that they assume chemical reaction control. The diffusion resistance of the reactants and products through the particle’s shell is not considered in the presented kinetic model. However, this could be implemented by using modified expressions for .
The minimum number for the entrainment of particles with by the gas flow can also be obtained graphically from Figure 3 as the intersection of the line for with the one for and is 3.5. This results in a minimum gas velocity of 8.5 m/s, which equals a maximum reactor diameter of 0.2 m. Considering agglomerates up to 4.5 times the maximum particle size as in the FBR case, the maximum reactor diameter decreases to 0.14 m. The reactor heights for the two cases can be calculated with Equation (20) and the definition [33,35]
to 6 m as well as 380 m, respectively. With the latter being unpractical, the severe influence of the grain size on the reactor height is clearly visible.
However, this actually only applies to a single TR. Since multiple stages are needed, the residence times in the gas-solid separators cannot be neglected. Vertically arranged cyclone cascades with four to six stages are widely used in the cement industry for pre-heating raw meal with the off-gas of the rotary kiln for clinker production, as shown schematically in Figure 5 [45]. They achieve high solids temperatures by approximating a counter-current heat exchanger with a stage-wise co-current operation [46]. Pendulum flaps are commonly used to prevent the short-circuiting of the gas flow up through the dust chambers [47]. The stages are usually numbered according to the flow direction of the solids, which are charged before the first separation stage. Since this stage is essential for the process efficiency, it consists of two parallel cyclones with a high separation degree. The other cyclones possess the same diameter and a low profile to minimize the pressure drop and increase the residence time. The separation efficiency is less important in the later stages since the entrained material gets recycled [48].
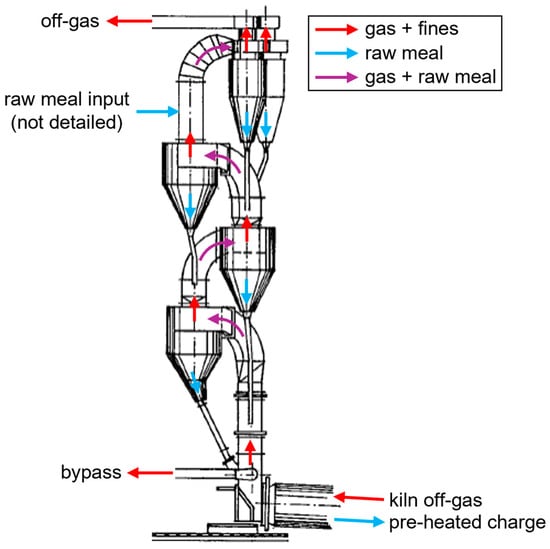
Figure 5.
Schematic drawing of a four-stage cyclone cascade for pre-heating of raw meal in the cement industry, adapted from [48].
A typical cyclone is shown schematically in Figure 6. It consists of a vortex finder through which the cleaned gas exits, a cylindrical section in the vicinity of the tangential rectangular raw gas inlet duct, a conical separation chamber and a dust chamber where the solids are collected. Between the two chambers is an insert which prevents the pick-up of already separated solids by the gas vortex. The flow patterns inside cyclones are very complex, and the analytical description focuses mainly on separation efficiency and pressure drop, not retention times. In most cases, it is used as a gas-solid separator and not a reactor [49].
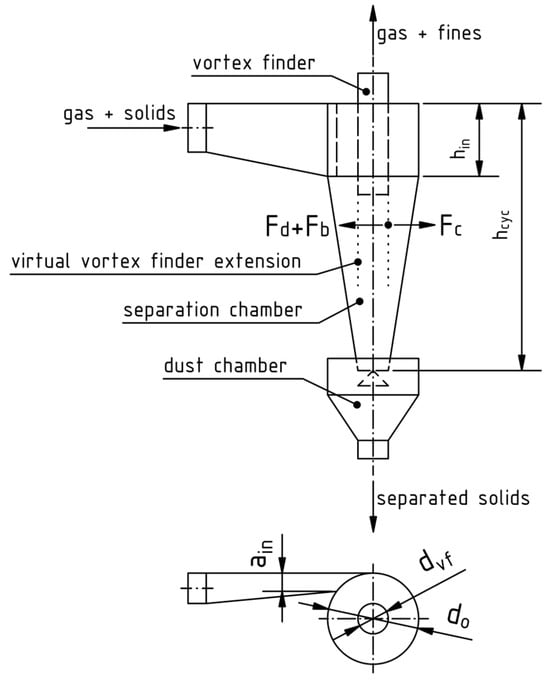
Figure 6.
Dimensions of a cyclone separator and visualization of the force balance on an exemplary particle (Equation (29)), modified from [49] with permission from Elsevier.
When considering the heat transfer, most of it will happen in the cylindrical part of the cyclone, because of the higher relative velocities between the solids and the gas than in the conical section, even at the longer solids residence times in the latter. Additionally, it is recommended that the solids mass loading of the gas
does not exceed 3, which applies for the given case. It is basically the inverse of the previously introduced coefficient with the conversion of the gas volume flow into its mass equivalent and equates to 1.5. At increased gas mass loadings the solids cannot be conveyed by the gas flow anymore, so they are deposited as strands at the cyclone’s wall and slide thereon into the dust collection chamber [50].
An important measure for a gas-solid reactor is its solids retention time [34]. However, for the average particle residence time mainly empirical relations or computational fluid dynamics (CFD) models exist since the analytical description is very complex because of the three-dimensional flow pattern. The residence time of the solids in cyclone reactors is distributed relatively narrowly, like in a plug-flow reactor [51]. For rounded sand particles with a density of 2260 kg/m3 and an average grain size of 100 µm can be described as [52]:
This yields an average solids residence time of 2 s for the given scenario, meaning that the material needs to pass 3 cyclones to reach the desired pre-reduction degree of the iron oxides. However, the time the solids are in contact with the gas in the transport pipes between the cyclones also must be considered. Therefore, a rough knowledge of the cyclone’s dimensions is required.
In the following four paragraphs, the basic design factors of a cyclone separator after [49] with minor modifications to consider the system in this work are summarized. The dimensioning is based on the concept of optimal cyclones, which follow empirical guidelines for geometric ratios. An optimal cyclone balances the separation efficiency, expressed in terms of the critical size diameter, operating expenses, defined by the pressure drop, and construction expenses, described by the volume of the cyclone. The critical size diameter is the theoretical cut-size and obtained by a force-balance
on the vortex finder pipe diameter’s virtual downwards extension. A visualization is given in Figure 6. The revolving particles with a tangential velocity at this location are pushed outwards by the centrifugal force
which gets countered by the buoyancy force
as well as the drag force
of the inwards moving flow with a radial velocity of . If either of these dominates, the particles leave their revolution path, which means that bigger particles move outwards and separate, while smaller ones are pushed further inwards and leave the cyclone with the cleaned gas through the vortex finder pipe. When considering that the small, inwards moving particles possess low Reynolds numbers, Stokes’s law can be applied. Together with the knowledge that around 10% of the gas flow leave the cyclone directly and bypass the separator along its top boundary,
is obtained for the critical size diameter. Another important design parameter is the pressure drop
It depends on the axial velocity in the vortex finder and the cyclone’s pressure drop coefficient . The latter is a combination of the pressure drop coefficient of the vortex finder with an auxiliary one considering the inlet and walls of the cyclone. and must be pre-defined to dimension the cyclone according to the optimization principle. Therefore, further explanations of their calculations for a given geometry are omitted in this work.
The relevant ratios for the dimensioning of an optimal cyclone are the following:
Furthermore, two characteristic dimensionless numbers are introduced, namely the pressure drop coefficient
and the Barth number
Those definitions use the velocity
and the frictionless outer diameter
From the combination of the two dimensionless numbers and the terminal velocity of a particle with the critical diameter (Equation (18)) the characteristic cyclone number
can be determined. This first step in obtaining the cyclone dimensions from performance and operating conditions is followed by the determination of and from Figure 7 under an initial assumption of a friction coefficient , usually 0.2. The correlations plotted originate from a numerical study on optimal cyclones.
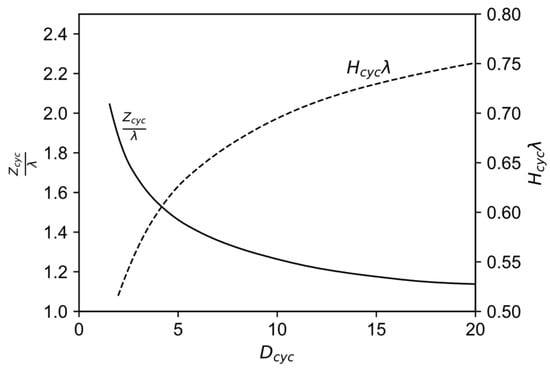
Figure 7.
Correlation between the characteristic cyclone number as well as the diameter and height-diameter ratios for optimal cyclones, modified from [49] with permission from Elsevier.
With the two geometric ratios known, the area ratio
allows for the calculation of the inlet ratio
in which is usually set to 0.15. Therin, and indicate the cross-sectional area of the inlet as well as the vortex finder while and denote the width and height of the rectangular inlet duct, respectively. The optimal value of the Barth number to achieve a minimization of the pressure loss coefficient is always obtained for a velocity ratio . With this knowledge, and can now be obtained in this order from the Equations (39) and (42), respectively. Then, the definition of the vortex finder pressure drop
together with Equation (38) allows the calculation of the axial velocity
Its relationship to the vortex finder diameter is determined by the principle of continuity as
This enables finally the calculation of the other cyclone dimensions with the definitions of the geometric ratios.
However, the wall friction coefficient was just assumed initially and, therefore, needs to be calculated using the obtained dimensions according to
The dependence on the Reynolds number
with
accounts for changes in the gas properties at different temperatures. Therein, denotes the frictionless tangential velocity at the wall. With the updated wall friction coefficient, the calculations presented above can be repeated. This procedure yields iteratively the main dimensions of an optimized cyclone.
Unfortunately, if the targeted critical size diameter is set to 2 µm and a pressure drop of 5 mbar is assumed according to measurements [49], the procedure does not converge to a single value for . It oscillates between 0.016 and 0.019, therefore, to obtain exemplary dimensions of the cyclone, their average is taken. This leads to the following values for the given scenario: , , , and . As a simplification for the determination of the riser pipes lengths, all cyclones in the cascade are assumed to have the same dimensions. When assuming an arrangement like the one shown in Figure 5, the length of the riser pipe between two cyclones can roughly be approximated as the cyclone height. The cross-section of the riser pipe is limited on the one hand by the gas velocity necessary for transporting the particles upwards, and on the other hand must not exceed the vortex finder diameter to allow for loo large agglomerates to fall straight down through it and prevent accumulation below the particle charging section. In the given scenario, the vortex finder diameter is dominating the determination of the cross-section of the riser pipe. A time
of 0.05 s for conveying the particles through the riser is obtained. However, even with the adaption of the average residence time of a cyclone to 2.05 s, there are still 3 cyclones necessary to achieve the desired reduction time, resulting in a total height of 5.6 m for the cyclone cascade. In this calculation, the time for accelerating the particles to the gas velocity is neglected, meaning that the real conveying time is higher.
Since the presented method relies on many assumptions, simplifications and empirical correlations, it provides only rough estimates. In addition, the only factor that is included in the residence time correlation is the solids loading, thereby neglecting other influences like cyclone geometry, grain size distribution or gas flow rate. Furthermore, it was developed based on material properties different from those in this scenario. More exact values can either be obtained by using improved mathematical models or incorporating CFD simulations to gain knowledge about the complex three-dimensional flow patterns [53]. However, even with sophisticated CFD simulations, significant deviations can occur in some cases between the modeled and real cyclone behavior [54].
Additionally, it should be noted that there exists a multitude of different cyclone types with their own characteristics. These can range from different inlet geometries over varying inserts in the vortex finder for flow pattern optimization to the complete abandonment of a vortex finder in refractory lined cyclones and many more. The positioning of a scraper in the vortex finder is also possible to periodically remove material that stuck to the pipe’s wall. It is mainly used when operating with sticky material at higher temperatures [55].
To summarize, a cascade of 3 cyclones in series is necessary for the required task, totaling around 5.6 m in height. For increased residence times and a decreased pressure loss, the cyclones after the first stage can be equipped with a wider cone for the required task, although this reduces their separation efficiency. A parallel arrangement is common for the first stage to increase the overall separation efficiency of the cascade. The solids are heated quickly and then react over some timespan with the reducing gas. The problem of sticking can be mitigated by using mechanical scraping devices. However, for small cyclones space constraints exist which limit or inhibit their usage. Additionally, larger particles and agglomerates charged from a lower staged cyclone can just fall through the vortex finder pipe of the next one into its dust collection chamber, repeatedly until the HPSR reactor is reached. The operation of the cyclone cascade at higher temperatures should therefore be possible, even at increased sticking effects. However, it has to be noted that those agglomerates then do not get pre-heated and pre-reduced to the desired degree due to the decreased residence time and limited heat and mass transfer. The application of this reactor type possesses the advantage of a relatively simple construction with few moving parts, the absence of a gas-distribution system, minimal heat losses due to its compact arrangement and longer residence times than in a vertical transport pipe alone.
4.4. Moving Bed Reactors
Another typical reactor type for gas-solid reactions is the moving bed reactor [56]. Due to the relatively small grain sizes and wide distributions thereof considered in this study, a setup with the gas flow through the bed is not possible because the bulk must possess a certain gas permeability, similar to a shaft furnace [57]. This means that the gas has to flow over the bed. Possible reactors therefore include the rotating hearth furnace (RHF) and the rotary kiln (RK) [58]. Since RHFs are typically heated by multiple burners positioned over the bed, the heat transfer to the bottom of the bulk is not optimal [59]. In directly heated RKs, the energy source is positioned at an end for counter-current operation at the material’s outlet. A principal drawing of a RK is shown in Figure 8. The heating occurs not only by the burner directly, but also indirectly from the furnace’s walls because of their rotation. The uncovered sections get heated by the burner and provide this energy to the bulk when positioned under it. Additionally, through the kiln’s rotation the solids get mixed, thereby minimizing thermal gradients [56].

Figure 8.
Basic schematic of a RK, re-illustrated after [60].
There are different movement patterns which the bulk can form, depending on characteristics like material properties, the friction between the charge and the wall, and the rotational speed of the kiln. These patterns include slipping, slumping, rolling, cascading, cataracting and centrifuging. The last two mentioned are avoided for the operation of RKs. Slumping means the periodical occurrence of avalanches when the gravitational forces exceed the frictional ones in an upwards-moving bulk near the wall. With increasing rotational speed, the slumping starts to transform into a continuous rolling motion. For low speeds, a constant incline of the bed’s surface is obtained, while for even higher velocities a kidney-shaped cross-section forms. This is characterized as cascading movement. For the latter two, the bed can be split into two regions. In the active layer the particles move downwards on top of the passive layer. The material in the active zone mixes with the gas, increasing heat and mass transfer in this region. It gets thicker with rising rotational speed and deeper beds, thereby favoring reaction kinetics under these conditions [61].
The obtained transverse movement pattern can be visualized with the bed behavior diagram. It is a representation of the flow pattern depending on the bed depth or the filling degree as well as the revolution frequency for a given material and kiln geometry. An exemplary one for nickel oxide can be seen in Figure 9. It can be clearly seen that for a constant filling degree there exists a range of Froude numbers
where rolling and cascading occur, which should be targeted for good heat and mass transfer. Therein, the kiln’s angular velocity is defined as [62]
Figure 9.
Exemplary bed behavior diagram for nickel oxide, modified with permission of Springer Nature BV from [62]; permission conveyed through Copyright Clearance Center, Inc.
During the transverse motion of the particles through the kiln segregation occurs between the finer and coarser fractions. This effect exists in three different kinds, namely in a radial, banding longitudinal and end longitudinal segregation. In the first one, the coarse fraction is at the bottom and the top of the bulk, enclosing the fines in its center. In the second one, bands of coarser and finer material move in an alternating pattern axially through the kiln. The last type is a variation of the radial segregation with fines accumulating at the kiln’s ends. While the radial segregation always occurs to some extent, the other kinds require special criteria to be met [63].
In addition to the solids flow pattern, the effect of the gas velocity on the dust discharge must also be considered during the sizing of a RK. In industrial operations [64], off-gas dust loads of 0.01 kg/m3 are often occurring, representing usually between 1–10% and in extreme cases up to 36% of the feed. Its most influential parameter is the gas velocity. The higher it gets, the more dust is discharged. Other values like the rotational speed and the concentration of fines in the bed also provoke dust discharge but are of minor importance, comparatively [65].
One problem which also occurs in RKs, as in all other presented reactors, is the effect of sticking. When heated, low-melting phases form rings normal to the rotation axis. Those buildups act basically as dams in the middle of the kiln and introduce back-mixing of the charge before them if they grow big enough so that the effective kiln incline in this region is too little. This leads to uncontrolled residence times and introduces variance in the process [66].
However, the overall process is relatively robust against the problem of grains growing many times their initial size. Those large particles are also simply transported through the kiln by its rotation and discharged at the end.
On the other hand, another major problem with RKs for the given task is the sealing of the rotating drum at its ends against the stationary housings. Industrial kilns usually operate at a slight underpressure, so that ambient air will leak in but no explosive or toxic furnace gases can get out [48]. This is not an option for hydrogen-containing kilns since the introduced oxygen could react explosively with the unused hydrogen [67]. For this reason, the sealing design gets very complicated since it needs to account for misalignment as well as movement of the kiln due to thermal elongation [68].
The design of RKs is mostly based on empirical correlations and engineering experience. The filling degree of the kiln, defined as the cross-sectional area taken up by the material to that of the whole drum, is usually between 5–17%. A higher filling degree increases the solids throughput at otherwise constant conditions. A rise in the filling degree can be achieved by reducing the kiln’s slope. The incline of RKs is mostly in the range of 2–6%, whereas longer kilns are less steep. The latter require higher rotational speeds to convey the charge, which leads to better mixing of the solids. However, higher filling degrees reduce the heat transfer from the gas to the bed. It is therefore suggested that the filling degree does not exceed 13% in practice. Operational experience indicates that the corresponding slope for this filling degree should be 2.5%. Recommendations also provide estimates for the rotational speed. The circumferential velocity should be around 0.35 m/s, meaning that thinner kilns are rotating at higher revolutions than thicker ones [48].
The exact calculation of the solids’ residence times in RKs is difficult since it depends on the flowing properties of the material, which itself can change during the process. The bed also gets thinner in the vicinity of the outlet, leading to the acceleration of the solids. Therefore, the residence times are best determined experimentally for the given operating conditions. However, there exist some models which use simplifications and empirical correlations to provide estimates of the real solids’ residence times. The most basic ones use the principle of continuity for the bulk [56].
A simple formula for the estimation of the solids residence times in a RK for sponge iron production with length and incline is
Therein, indicates the dynamic angle of repose of the material and
the volumetric charging rate. However, the use of exit dams severely influences the residence time by altering the filling degree for a constant mass flow rate, which is neglected in the provided correlation [69].
Such empirical correlations strongly depend on the material properties. Measurements with e.g., charcoal, olive nuts and sand yielded 0.38 instead of 0.1026 as proportionality coefficient. This nearly four-fold bigger value indicates that for these materials the average residence time is underestimated when using Equation (54) [70].
The solids residence times are distributed similarly to a plug-flow reactor [71], likewise to the cyclone cascade above. An increased feed rate narrows the residence time distribution, regarding the kiln’s inclination and rotation rate are mixed behaviors observable for cohesive particles [72].
Practical insights reveal that exit gas velocities are as low as 2 m/s for industrial kilns to prevent excessive dust discharge [64]. If this value is targeted,
can be derived for the kiln’s diameter when considering the principle of continuity as well as the definition of the filling degree [48]
as the ratio between the cross-sectional areas of the bulk and the empty kiln. When exit dams are present, must consider the cross-section of the dam. However, since the mechanisms of particle pick-up by the gas from the charge are complicated, significant dust discharge may also occur at these low gas velocities due to the dominance of other effects like material properties, inserts and geometric relations [65]. The determination of the kiln’s diameter for a desired filling degree would then allow for further design of the kiln. With the knowledge of the bed behavior diagram for the given material and geometric conditions, the rotational speed could then be estimated from the kiln’s Froude number so that the targeted movement pattern is achieved. When determining the kiln’s incline based on its filling degree empirically as mentioned above, Equation (54) allows the calculation of the length of the RK. Nevertheless, the obtained dimensions would only be initial estimates for further experimental investigations to find the optimal design parameters in the multitude of influential factors.
For the application of this sizing procedure to the given scenario, a filling degree of 10 vol.-% is assumed for good heat transfer conditions. With the gas velocity limited to 2 m/s a kiln diameter of 0.43 m is calculated. In the absence of better data, from the bed behavior diagram for nickel oxide a Froude number of 0.1 is selected to achieve a relatively fast-rolling pattern near the cascading border for a good mixing behavior. This yields an angular velocity of 2.1 s−1, which corresponds to a revolution frequency of 20 min−1 and a maximum tangential velocity
of 0.46 m/s. It shows good agreement with the recommended circumferential tangential velocity of 0.35 m/s stated above. Since the conditions in a RK are vastly different from the ones used for calculating the ore residence time in Section 3 a new estimation has to be made. Experiments show that the time required to reach the desired conversion degree of 33% for the reduction of hematite fines in a rotary drum furnace at 900 °C with a gas mixture of 50 vol.-% H2 and 50 vol.-% N2 is approximately 150 s [73]. The desired filling degree corresponds empirically to an incline of 2.3° [48]. is estimated to be 30° according to measurements with ilmenite powder due to the unavailability of better data [74]. With this information, the length of the kiln is calculated to 8 m. This value can be decreased by incorporating an exit dam or other inserts to either increase the bed’s mass or improve the mixing behavior [48].
5. Reactor Comparison and Selection
Based on the provided information in the sections above, in the following the reactor most suitable for the stated requirements shall be selected. To aid this process, Table 1 summarizes and compares the key facts of the respective reactor types.

Table 1.
Comparison between the three different reactor types (summarized from Section 4).
The proposed reactor for the implementation of a pre-reduction step in the HPSR process at an existing demonstration plant is the cyclone cascade because of its overall lowest complexity and sufficient flexibility regarding the process parameters. The rotary kiln performs well too but is more complex due to the presence of many moving parts. Since usually the simpler system is more cost-effective, the cyclone cascade is prioritized. Sticking is also only a minor problem in this process. Although it must be designed for an operating point, slight deviations in the gas velocity just decrease its separation efficiency or alter the pressure drop, which is not a huge problem for the process at demonstration scale. Upscaling should also be possible since industrial plants generally do not vary their parameters as much compared to the development phase. There, the design for a specific operating point should be sufficient. Furthermore, the cyclone cascade is a wide-spread technology used in cement production.
Figure 10 shows schematically the proposed reactor concept. Future calculations with more detailed parameters might show the necessity of longer residence times than currently estimated. The most significant influencing factor is the implementation of more cyclones. To a certain extent, they can be stacked onto the planned ones. If the required time is not reachable within a reasonable number of stages, one of the other proposed technologies must be implemented due to the lack of alternatives. To keep the charge solid at all times during pre-reduction, some gas cooling is necessary after the HPSR-reactor’s off-gas outlet. In the provided schematic, its location is indicated with the blue lines. Whether the length of the water-cooled pipe for sufficient cooling is within a reasonable limit needs to be calculated. For simplicity, this is omitted in this concept paper since other cooling options exist. To give an example, the mixing of the HPSR off-gas with another cold gas is also a possible solution. This can either be an inert gas like nitrogen or a reducing gas mixture with adjustable composition, in principal even cooled and recycled off-gas of the cyclone cascade. The advantage of the gas-injection method is that the temperature of the off-gas gets lowered but its enthalpy is conserved, while during water-cooling it is removed from the system. Furthermore, the cooling power can be easily adjusted by controlling the input flow rate of the cold gas. Due to the small dimensions of the vortex finder and riser pipes compared to industrial scale cyclone cascades, having a pipe-in-pipe charging system is susceptible to clogging. To mitigate this problem, the collection chamber’s discharge pipe needs to end directly at the elbow of the next cyclones inlet duct instead of reaching downwards into it. In this case, the time the material remains in the riser is shortened, but for the given scenario there are still 3 cyclones sufficient, even when neglecting the residence time in the riser completely.
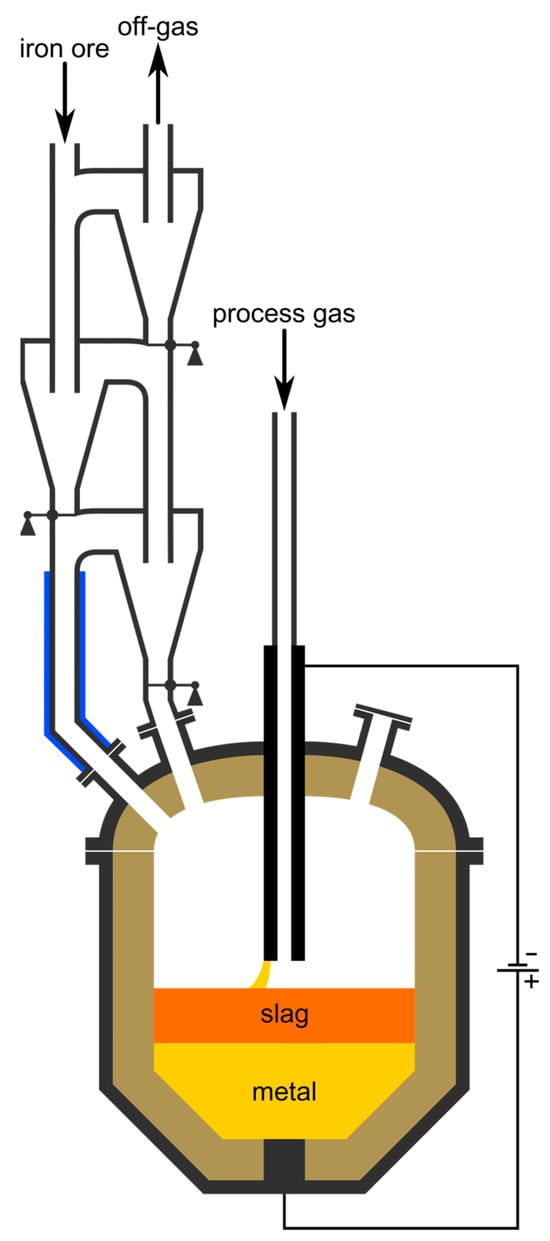
Figure 10.
Schematic of the proposed concept for the HPSR process including a pre-heating and pre-reduction step.
6. Summary and Conclusions
The following key takeaways can be summarized:
- In principle, any hydrogen-based direct-reduction process can be used for a pre-heating and pre-reduction stage in the HPSR process, depending mainly on the grain size of the iron ores. In addition, the pre-reduction does not need to stop at wustite. The ores could be reduced nearly completely in the first stage and only melted for slag-metal separation in the HPSR reactor. In this case, the latter is used as an efficient electric hydrogen heating and smelting unit. The optimal reduction degree for the interlinked operation of the two processes needs to be determined in the future.
- The pre-reduction reactor operates with the off-gas of the HPSR process. Therefore, it must possess some robustness against dust-loaded reducing gas. This can lead to agglomeration and clogging when the solids get sticky because of the presence of some low-melting phases. Furthermore, the melting point of wustite must not be exceeded to keep the charge solid. Therefore, cooling of the off-gas from the HPSR reactor’s exit temperature to the maximum allowable operating temperature before contacting the pre-heated and pre-reduced solids is necessary.
- The most critical component of an FBR is its gas distribution system. Additionally, the gas velocity needs to be carefully controlled to maintain a fluidized state. Agglomeration can further lead to a dead bed, since too big particles cannot be discharged and interfere with the gas distribution in the reactor. Furthermore, with the given mass flow ratios in combination with the desired particle sizes, an FBR is not operatable at the minimum solids residence time.
- The hydrogen-tight sealings of the rotating drum against the stationary housings are the most critical components of a rotary kiln, especially at the hot discharge end. Otherwise, it would be the least prone to sticking effects of the presented reactors.
- A cyclone cascade with at least 3 stages is proposed due to its overall lowest complexity, robustness of the process and sufficient flexibility. Agglomeration up to a certain degree will not hinder the operation, since the bigger particles can fall straight down from their charging point through the vortex finder pipe of the cyclone beneath. Additionally, there are no moving sealings with large diameters and only few moving parts required, lowering its complexity.
Finally, it needs to be emphasized that the stated sizing procedures are based on empirical correlations. Therefore, they only provide rough estimations for the design parameters. Practical experience is scarce, since to the knowledge of the authors, cyclone cascades are currently not used for the reduction of iron ores. First of all, the exact residence times necessary under the prevailing conditions need to be determined experimentally. On this basis, a show-case cyclone reactor should then be built to optimize it for its use case, in combination with more exact sizing calculations, CFD simulations or both methods. With the knowledge gained about the material behavior, the trial reactor can then be designed in detail, constructed, and incorporated into the existing HPSR demonstration plant.
Supplementary Materials
The following supporting information can be downloaded at https://www.mdpi.com/article/10.3390/pr13020420/s1: Figure S1: Reh diagram.
Author Contributions
Conceptualization, B.A. and M.A.Z.; methodology, B.A.; validation, J.S.; investigation, B.A.; resources, M.A.Z.; writing—original draft preparation, B.A.; writing—review and editing, M.A.Z., F.H. and J.S.; visualization, B.A. and F.H.; supervision, M.A.Z. and J.S.; project administration, M.A.Z.; funding acquisition, M.A.Z. All authors have read and agreed to the published version of the manuscript.
Funding
This research is part of the “Sustainable Steelmaking follow-up” project (no. 894616), funded by the Klima- und Energiefonds (www.klimafonds.gv.at, accessed on 28 January 2025) within the scope of the program “Vorzeigeregion Energie” through the Austrian Research Promotion Agency (www.ffg.at, accessed on 28 January 2025), K1-MET GmbH (www.k1-met.com, accessed on 28 January 2025), voestalpine Stahl GmbH (www.voestalpine.com/stahl/Gesellschaften/voestalpine-Stahl-GmbH, accessed on 28 January 2025), voestalpine Stahl Donawitz GmbH (www.voestalpine.com/stahldonawitz, accessed on 28 January 2025), Pirhofer-Automation e.U. (www.pirhofer-automation.at, accessed on 28 January 2025), the Chair of Ferrous Metallurgy at Montanuniversität Leoben (www.metallurgy.at/chair-of-ferrous-metallurgy, accessed on 28 January 2025), and WIVA P&G—Hydrogen Flagship Region Austria Power & Gas (www.wiva.at, accessed on 28 January 2025).
Data Availability Statement
No new data was created or analyzed in this study. Data sharing is not applicable to this article.
Conflicts of Interest
Author Bernhard Adami and Michael Andreas Zarl were employed by the company K1-MET GmbH. The remaining authors declare no conflicts of interest. The funders had no role in the design of the study; in the collection, analyses, or interpretation of data; in the writing of the manuscript; or in the decision to publish the results.
List of Symbols
| Base | |
| … inclination | |
| … area ratio | |
| … specific gas flow rate | |
| … drag coefficient of a particle collective | |
| … difference | |
| … relative void volume | |
| … utilization | |
| … height ratio | |
| … dynamic angle of repose | |
| … friction coefficient | |
| … kinematic viscosity | |
| … pressure drop coefficient | |
| … density | |
| … filling degree | |
| … Ergun parameter | |
| … angular velocity | |
| … Omega number | |
| … width | |
| … cross-sectional area | |
| … Archimedes number | |
| … Barth number | |
| … particle drag coefficient | |
| … mass loading | |
| … diameter | |
| … diameter ratio | |
| … revolution frequency | |
| … force | |
| … Froude number | |
| … extended Froude number | |
| … gravitational acceleration, | |
| … height | |
| … enthalpy | |
| … kinetic parameter | |
| … length | |
| … mass | |
| … mass flow rate | |
| … molar mass | |
| … load factor | |
| … molar flow rate | |
| … absolute pressure | |
| … ideal gas constant, | |
| … reduction degree | |
| … Reynolds number | |
| … time | |
| … absolute temperature | |
| … velocity | |
| … superficial velocity | |
| … velocity ratio | |
| … volume | |
| … volume flow rate | |
| … mass fraction | |
| … molar fraction | |
| … characteristic cyclone number | |
| Sub- and superscripts | |
| … frictionless | |
| … normal conditions ( and ) | |
| … axial | |
| … buoyancy | |
| … bed | |
| … bulk | |
| … centrifugal | |
| … co-gravitational flow | |
| … counter-gravitational flow | |
| … critical | |
| … cyclone | |
| … drag | |
| … end | |
| … elutriation | |
| … equilibrium | |
| … fluid | |
| … gas outlet | |
| … fluidized bed reactor | |
| … gravitation | |
| … hydrogen plasma smelting reduction | |
| … initial | |
| … cyclone inlet | |
| … molar | |
| … maximum | |
| … minimum | |
| … cylindrical part of the cyclone | |
| … operating conditions | |
| … particle | |
| … plasma gas | |
| … reaction | |
| … radial | |
| … reduction degree | |
| … riser | |
| … rotary kiln | |
| … solids | |
| … slip | |
| … solids outlet | |
| … tangential | |
| … terminal | |
| … total | |
| … transport reactor | |
| … vortex finder | |
| … virtual extension of the vortex finder pipe into the cyclone | |
| … indexing variable | |
Appendix A
This section describes the calculation of the Reh diagram stated in Figure 3. Additionally, since it might be useful to some reader, a high-quality version without annotations is provided as Supplementary Materials (Figure S1).
The Reh diagram is derived from basic fluid mechanical correlations of a bed with a specific height of solid spheres with constant size under an upwards directed fluid flow in a vertical pipe with cylindrical cross-section. Which contacting pattern is obtained depends on the superficial fluid velocity (i.e., the velocity in the empty pipe), the kinematic viscosity of the fluid, the density of the fluid, the density of the solids, the relative void volume
and the grain size distribution of the particles. Hereby, is the volume of the voids between the particles taken up by the fluid, is the volume of the solid fraction, and denotes the overall volume of the mixed phase. When starting with a packed bed and increasing the superficial fluid velocity, three states can be distinguished. At first, the bed remains as it is, then it begins to expand, and a fluidized bed is obtained. When further increasing the fluid velocity, it expands even more until the particles get entrained by the flow. The forces acting on the bed are the gravitational force
the buoyancy force
and the force of the flow by the pressure drop
with denoting the gravitational acceleration. The force balance
becomes
when all terms are inserted and rearranged. The load factor
is introduced as the ratio of the acting forces to describe the three different contacting patterns [36].
In the packed bed state, the relative void volume is at its minimum of around 0.4. The pressure drop over the height of a packed bed can be described with the Ergun correlation
Therein, the parameter is defined as
with the particle Reynolds number
Combined with the definition of the extended Froude number
is obtained for the region [36,38].
The forces acting on a single particle in a fluid stream are the same as on the whole bulk, except that the force of the flow on the particle can also be expressed as the drag force
with being the drag coefficient and the cross-sectional area of the particle. To simplify the expression, instead of the relative velocity between the particle and the fluid, only the fluid’s velocity is considered. Additionally, the virtual mass force of the entrained particle is also neglected. With the volume of the particle
inserted in the relations for the gravitational and buoyancy forces,
for is obtained from the definition of the load factor (Equation (A7)) [36].
The given derivations result in equations for the conditions necessary for the start of the fluidization as well as the beginning of the discharge of the solids. In the fluidized state (), lines for a constant relative void volume can be derived when relating the drag coefficient of a single particle with the one of a particle collective
This equation is valid for liquid-solid and low-expanded gas-solid fluidized beds () with Reynolds numbers less than 10. As a result, for and
is obtained. For the construction of the Reh diagram, this equation is extrapolated to higher Reynolds numbers and bigger bed expansions for simplicity [36].
When defining the drag coefficient as a function of the Reynolds number as in Formula (9), the Equations (A12), (A15) and (A17) can be plotted in terms of over and the Reh diagram is obtained. Since the expression provides approximately the same values as for a constant in the range of , instead of drawing Equation (A12) the validity area of Equation (A17) is expanded into the packed bed with . Furthermore, the calculation of the Reh diagram can be summarized by Equation (10) for the respective values of and [36].
In contrast to liquid-solid fluidized beds, channels form at low particle diameters in gas-solid ones. The gas in those channels is not participating in fluidizing the solids, therefore, more gas is needed to obtain the same bed expansion. This results in a shift of the lines for a constant to higher numbers for the same particle diameters, hence numbers. It is constructed geometrically as a shift along the lines according to the ratio between the fluidization and discharge line for liquid-solid fluidized beds and a new discharge line at
Point is calculated from the intersection of the two discharge lines for the different types of fluidized beds. for Point is obtained from the comparison of Equations (A12) and (A15), which gives the relation
The differences between the particulate and aggregative fluidization regimes occur to the left of the line connecting the points and . In the given Reh diagram, the lines for particulate fluidization are drawn dashed and the ones for aggregative fluidization solid [36].
For aggregative fluidization at higher bed expansions, the solids are constantly expelled from the reactor. This is the operating region of a circulating fluidized bed reactor, where the solids are then separated from the gas and charged back into the reactor [75].
However, contrary to what was stated by Reh originally [36], the lines for a specific for the different fluidization regimes do not start deviating from each other at the − line when carrying out the described scheme. Instead, they provide equal values regardless of their fluidization regime above the Archimedes number of point . Therefore, to obtain a similar looking diagram, the curves between and the line are interpolated in Figure 3. This is done since the one described originally by Reh is still used widely [30], and the differences are relatively minor, considering the underlying assumptions and simplifications.
References
- Somers, J. Technologies to Decarbonise the EU Steel Industry; JRC127468; European Union: Luxembourg, 2022. [Google Scholar] [CrossRef]
- Cavaliere, P. Clean Ironmaking and Steelmaking Processes: Efficient Technologies for Greenhouse Emissions Abatement; Springer Nature: Cham, Switzerland, 2019. [Google Scholar] [CrossRef]
- Bäck, E.; Badr, K.; Plaul, J.F.; Sormann, A. Überblick über die Entwicklung der Wasserstoff-Schmelzreduktion am Lehrstuhl für Metallurgie. Berg Hüttenmännische Monatshefte 2009, 154, 6–9. [Google Scholar] [CrossRef]
- Adami, B. Untersuchung des Verhaltens von Phosphor, Schwefel und Kupfer Während des Wasserstoffplasma-Schmelzreduktionsprozesses. Master’s Thesis, University of Leoben, Leoben, Austria, 2023. [Google Scholar] [CrossRef]
- Zarl, M.A.; Ernst, D.; Cejka, J.; Schenk, J. A New Methodological Approach to the Characterization of Optimal Charging Rates at the Hydrogen Plasma Smelting Reduction Process Part 1: Method. Materials 2022, 15, 4767. [Google Scholar] [CrossRef] [PubMed]
- Bäck, E. Schmelzreduktion von Eisenoxiden mit Argon-Wasserstoff-Plasma. Ph.D. Thesis, University of Leoben, Leoben, Austria, 1998. [Google Scholar]
- Badr, K. Smelting of Iron Oxides Using Hydrogen Based Plasmas. Ph.D. Thesis, University of Leoben, Leoben, Austria, 2007. [Google Scholar]
- Plaul, J.F. Schmelzreduktion von Hämatitischen Feinerzen im Wasserstoff-Argon-Plasma. Ph.D. Thesis, University of Leoben, Leoben, Austria, 2005. [Google Scholar]
- Naseri Seftejani, M. Reduction of Hematite Using Hydrogen Plasma Smelting Reduction. Ph.D. Thesis, University of Leoben, Leoben, Austria, 2020. [Google Scholar]
- Behera, P.R.; Bhoi, B.; Paramguru, R.K.; Mukherjee, P.S.; Mishra, B.K. Hydrogen Plasma Smelting Reduction of Fe2O3. Metall. Mater. Trans. B 2019, 50, 262–270. [Google Scholar] [CrossRef]
- Hiebler, H.; Plaul, J.F. Hydrogen plasma smelting reduction—An option for steelmaking in the future. Metalurgija 2004, 43, 155–162. [Google Scholar]
- Ernst, D. Strategies for Optimizing Process Parameters of Hydrogen Plasma Smelting Reduction Plants. Ph.D. Thesis, University of Leoben, Leoben, Austria, 2023. [Google Scholar]
- Hydrogen Plasma Smelting Revolution: Green Steel for a Sustainable Future. Available online: https://www.k1-met.com/fileadmin/user_upload/Publications/Success_stories/2024_Success_Story_EN_Area_2.pdf (accessed on 6 September 2024).
- Souza Filho, I.R.; Springer, H.; Ma, Y.; Mahajan, A.; Da Silva, C.C.; Kulse, M.; Raabe, D. Green steel at its crossroads: Hybrid hydrogen-based reduction of iron ores. J. Clean. Prod. 2022, 340, 130805. [Google Scholar] [CrossRef]
- Spreitzer, D.; Schenk, J. Reduction of Iron Oxides with Hydrogen—A Review. Steel Res. Int. 2019, 90, 1900108. [Google Scholar] [CrossRef]
- Heidari, A.; Niknahad, N.; Iljana, M.; Fabritius, T. A Review on the Kinetics of Iron Ore Reduction by Hydrogen. Materials 2021, 14, 7540. [Google Scholar] [CrossRef]
- Zare Ghadi, A.; Valipour, M.S.; Vahedi, S.M.; Sohn, H.Y. A Review on the Modeling of Gaseous Reduction of Iron Oxide Pellets. Steel Res. Int. 2020, 91, 1900270. [Google Scholar] [CrossRef]
- Kim, W.-H.; Lee, S.; Kim, S.-M.; Min, D.-J. The retardation kinetics of magnetite reduction using H2 and H2–H2O mixtures. Int. J. Hydrogen Energy 2013, 38, 4194–4200. [Google Scholar] [CrossRef]
- Zuo, H.; Wang, C.; Dong, J.; Jiao, K.; Xu, R. Reduction kinetics of iron oxide pellets with H2 and CO mixtures. Int. J. Miner. Metall. Mater. 2015, 22, 688–696. [Google Scholar] [CrossRef]
- Ernst, D.; Zarl, M.A.; Cejka, J.; Schenk, J. A New Methodological Approach on the Characterization of Optimal Charging Rates at the Hydrogen Plasma Smelting Reduction Process Part 2: Results. Materials 2022, 15, 4065. [Google Scholar] [CrossRef] [PubMed]
- Corbari, R.; Fruehan, R.J. Reduction of Iron Oxide Fines to Wustite with CO/CO2 Gas of Low Reducing Potential. Metall. Mater. Trans. B 2010, 41, 318–329. [Google Scholar] [CrossRef]
- Legemza, J.; Findorák, R.; Fröhlichová, M.; Džupková, M. Advances in Sintering of Iron Ores and Concentrates. In Iron Ores; Shatokha, V., Ed.; IntechOpen: Rijeka, Croatia, 2021. [Google Scholar] [CrossRef]
- Nomura, T.; Yamamoto, N.; Fujii, T.; Takiguchi, Y. Beneficiation Plants and Pelletizing Plants for Utilizing Low Grade Iron Ore. Kobelco Technol. Rev. 2015, 33, 8–15. [Google Scholar]
- Kolbe, N.; Cesário, F.; Ahrenhold, F.; Suer, J.; Oles, M. Carbon Utilization Combined with Carbon Direct Avoidance for Climate Neutrality in Steel Manufacturing. Chem. Ing. Tech. 2022, 94, 1548–1552. [Google Scholar] [CrossRef]
- Skorianz, M. Classification of Iron Ores Regarding Their Reduction Behavior in Fluidized Bed Technologies. Ph.D. Thesis, University of Leoben, Leoben, Austria, 2012. [Google Scholar]
- Zarl, M.A.; Farkas, M.A.; Schenk, J. A Study on the Stability Fields of Arc Plasma in the HPSR Process. Metals 2020, 10, 1394. [Google Scholar] [CrossRef]
- NIST Chemistry WebBook, NIST Standard Reference Database 69. Available online: https://webbook.nist.gov/chemistry/ (accessed on 6 September 2024).
- FactSage Software and Databases. Available online: www.factsage.com (accessed on 7 November 2024).
- Degner, M.; Fandrich, R.; Endemann, G.; Ghenda, J.T.; Letz, K.; Lüngen, H.B.; Steller, I.; Wieland, H.-J.; Winkhold, A.; Bartos, R.; et al. Stahlfibel; Verlag Stahleisen: Düsseldorf, Germany, 2011. [Google Scholar]
- Stephan, P.; Kabelac, S.; Kind, M.; Mewes, D.; Schaber, K.; Wetzel, T. VDI-Wärmeatlas; Springer: Berlin/Heidelberg, Germany, 2019. [Google Scholar] [CrossRef]
- Atkins, P.W.; de Paula, J. Physical Chemistry, 9th ed.; W. H. Freeman and Company: New York, NY, USA, 2010. [Google Scholar]
- Qu, Y.; Yang, Y.; Zou, Z.; Zeilstra, C.; Meijer, K.; Boom, R. Reduction Kinetics of Fine Hematite Ore Particles with a High Temperature Drop Tube Furnace. ISIJ Int. 2015, 55, 952–960. [Google Scholar] [CrossRef]
- Themelis, N.J.; Gauvin, W.H. Reduction of iron oxide in gas-conveyed systems. Am. Inst. Chem. Eng. J. 1962, 8, 437–444. [Google Scholar] [CrossRef]
- Hertwig, K.; Martens, L.; Hamel, C. Chemische Verfahrenstechnik: Berechnung, Auslegung und Betrieb Chemischer Reaktoren, 3rd ed.; Walter de Gruyter: Berlin, Germany, 2018. [Google Scholar] [CrossRef]
- Yannopoulos, J.C.; Themelis, N.J.; Gavvin, W.H. An evaluation of the pneumatic transport reactor. Can. J. Chem. Eng. 1966, 44, 231–235. [Google Scholar] [CrossRef]
- Reh, L. Das Wirbeln von Körnigem Gut im Schlanken Diffusor als Grenzzustand Zwischen Wirbelschicht und Pneumatischer Förderung. Ph.D. Thesis, Technische Hochschule Karlsruhe, Karlsruhe, Germany, 1961. [Google Scholar]
- Haider, A.; Levenspiel, O. Drag Coefficient and Terminal Velocity of Spherical and Nonspherical Particles. Powder Technol. 1989, 58, 63–70. [Google Scholar] [CrossRef]
- Stieß, M. Mechanische Verfahrenstechnik 2; Springer: Berlin/Heidelberg, Germany, 1997. [Google Scholar] [CrossRef]
- Reh, L. Verbrennung in der Wirbelschicht. Chem. Ing. Tech. 1968, 40, 509–515. [Google Scholar] [CrossRef]
- Kunii, D.; Levenspiel, O. Fluidization Engineering, 2nd ed.; Butterworth-Heinemann: Boston, MA, USA, 1991. [Google Scholar] [CrossRef]
- Reh, L. The circulating fluid bed reactor—Its main features and applications. Chem. Eng. Process. Process Intensif. 1986, 20, 117–127. [Google Scholar] [CrossRef]
- Guo, L.; Bao, Q.; Gao, J.; Zhu, Q.; Guo, Z. A Review on Prevention of Sticking during Fluidized Bed Reduction of Fine Iron Ore. ISIJ Int. 2020, 60, 1–17. [Google Scholar] [CrossRef]
- Sun, M.; Pang, K.; Jiang, Z.; Meng, X.; Gu, Z. Development and Problems of Fluidized Bed Ironmaking Process: An Overview. J. Sustain. Metall. 2023, 9, 1399–1416. [Google Scholar] [CrossRef]
- Reh, L. Auswahlkriterien für Nichtkatalytische Gas/Feststoff-Hochtemperaturreaktoren. Chem. Ing. Tech. 1977, 49, 786–795. [Google Scholar] [CrossRef]
- Chatterjee, A.K. Cement Production Technology: Principles and Practice; CRC Press: Boca Raton, FL, USA, 2018. [Google Scholar]
- Alsop, P.A. The Cement Plant Operations Handbook: The Concise Guide to Cement Manufacture, 7th ed.; Tradeship Publications: Dorking, UK, 2019. [Google Scholar]
- Pendulum Flap. Available online: https://atec-ltd.com/images/Pendulum_Flap_Produktblatt_05_2016_v2.pdf (accessed on 6 September 2024).
- Duda, W.H. Cement Data Book, 3rd ed.; Bauverlag: Berlin, Germany, 1985. [Google Scholar]
- Bohnet, M.; Gottschalk, O.; Morweiser, M. Modern design of aerocyclones. Adv. Powder Technol. 1997, 8, 137–161. [Google Scholar] [CrossRef]
- Zhang, H.; Dewil, R.; Degrève, J.; Baeyens, J. The design of cyclonic pre-heaters in suspension cement kilns. Int. J. Sustain. Eng. 2014, 7, 307–312. [Google Scholar] [CrossRef]
- Zhang, Y.; Wang, Z.; Jin, Y.; Li, Z.; Yi, W. CFD simulation and experiment of residence time distribution in short-contact cyclone reactors. Adv. Powder Technol. 2015, 26, 1134–1142. [Google Scholar] [CrossRef]
- Chan, C.W.; Seville, J.P.K.; Fan, X.; Baeyens, J. Particle Motion in CFB Cyclones as Observed By Positron Emission Particle Tracking. Ind. Eng. Chem. Res. 2009, 48, 253–261. [Google Scholar] [CrossRef]
- Wozniak, G.; Schade, K.-P.; Wozniak, K.; Shalaby, H.H. Über die Auslegung und den Entwicklungsstand von Zyklon-Abscheidern. Forsch. Ingenieurwesen 2007, 71, 171–180. [Google Scholar] [CrossRef]
- Dimitrijević, D.; Schmid, M.; Harasek, M.; Bösenhofer, M. Comparison of experimental, empirical, and CFD pressure losses of lab-scale sampling cyclones. Sep. Purif. Technol. 2025, 354, 128992. [Google Scholar] [CrossRef]
- Brauer, H. Handbuch des Umweltschutzes und der Umweltschutztechnik: Band 3: Additiver Umweltschutz: Behandlung von Abluft und Abgasen; Springer: Berlin/Heidelberg, Germany, 1996. [Google Scholar] [CrossRef]
- Reschetilowski, W. Handbuch Chemische Reaktoren; Springer: Berlin/Heidelberg, Germany, 2020. [Google Scholar] [CrossRef]
- Seetharaman, S.; McLean, A.; Guthrie, R.; Sridhar, S. (Eds.) Treatise on Process Metallurgy: Industrial Processes; Elsevier: Oxford, UK, 2014. [Google Scholar]
- Runkana, V. Model-Based Optimization of Industrial Gas-Solid Reactors. KONA Powder Part. J. 2015, 32, 115–130. [Google Scholar] [CrossRef]
- Kumari, V.; Roy, G.G.; Sen, P.K. Mathematical Model to Estimate the Rate Parameters and Thermal Efficiency for the Reduction of Iron Ore–Coal Composite Pellets in Multi-layer Bed at Rotary Hearth Furnace. Trans. Indian Inst. Met. 2015, 68, 109–116. [Google Scholar] [CrossRef]
- Brough, D.; Jouhara, H. The aluminium industry: A review on state-of-the-art technologies, environmental impacts and possibilities for waste heat recovery. Int. J. Thermofluids 2020, 1–2, 100007. [Google Scholar] [CrossRef]
- Henein, H.; Brimacombe, J.K.; Watkinson, A.P. Experimental study of transverse bed motion in rotary kilns. Metall. Trans. B 1983, 14, 191–205. [Google Scholar] [CrossRef]
- Henein, H.; Brimacombe, J.K.; Watkinson, A.P. The modeling of transverse solids motion in rotary kilns. Metall. Trans. B 1983, 14, 207–220. [Google Scholar] [CrossRef]
- Henein, H.; Brimacombe, J.K.; Watkinson, A.P. An experimental study of segregation in rotary kilns. Metall. Trans. B 1985, 16, 763–774. [Google Scholar] [CrossRef]
- Tackie, E.N. Elutriation of Particles from Rotary Kilns. Ph.D. Thesis, University of British Columbia, Vancouver, BC, Canada, 1987. [Google Scholar] [CrossRef]
- Tackie, E.N.; Watkinson, A.P.; Brimacombe, J.K. Experimental study of the elutriation of particles from rotary kilns. Can. J. Chem. Eng. 1989, 67, 806–817. [Google Scholar] [CrossRef]
- Chatterjee, A.; Mukhopadhyay, P.K. Flow of materials in rotary kilns used for sponge iron manufacture: Part III. Effect of ring formation within the kiln. Metall. Trans. B 1983, 14, 393–399. [Google Scholar] [CrossRef]
- Park, S.W.; Kim, J.H.; Seo, J.K. Explosion Characteristics of Hydrogen Gas in Varying Ship Ventilation Tunnel Geometries: An Experimental Study. J. Mar. Sci. Eng. 2022, 10, 532. [Google Scholar] [CrossRef]
- EagleBurgmann. DRO Drehrohrofen-Dichtsystem: Spezialprodukte; EagleBurgmann: Wolfratshausen, Germany, 2024; Available online: www.eagleburgmann.com/de/produkte/spezialprodukte/dro-br-drehrohrofen-dichtsystem/datasheet_popup (accessed on 11 November 2024).
- Chatterjee, A.; Sathe, A.V.; Mukhopadhyay, P.K. Flow of materials in rotary kilns used for sponge iron manufacture: Part II. Effect of kiln geometry. Metall. Trans. B 1983, 14, 383–392. [Google Scholar] [CrossRef]
- Haeldermans, T.; Lataf, M.A.; Vanroelen, G.; Samyn, P.; Vandamme, D.; Cuypers, A.; Vanreppelen, K.; Schreurs, S. Numerical prediction of the mean residence time of solid materials in a pilot-scale rotary kiln. Powder Technol. 2019, 354, 392–401. [Google Scholar] [CrossRef]
- Dinesh, L.; Sai, P.S.T. A Model for Residence Time Distribution of Solids in a Rotary Kiln. Can. J. Chem. Eng. 2004, 82, 392–398. [Google Scholar] [CrossRef]
- Paredes, I.J.; Yohannes, B.; Emady, H.; Glasser, B.J.; Borghard, W.G.; Muzzio, F.; Cuitiño, A.M.; Beeckman, J.; Ilias, S.; Podsiadlo, P.; et al. The effect of operating conditions on the residence time distribution and axial dispersion coefficient of a cohesive powder in a rotary kiln. Chem. Eng. Sci. 2017, 158, 50–57. [Google Scholar] [CrossRef]
- Wei, Z.; Zhang, J.; Qin, B.; Dong, Y.; Lu, Y.; Li, Y.; Hao, W.; Zhang, Y. Reduction kinetics of hematite ore fines with H2 in a rotary drum reactor. Powder Technol. 2018, 332, 18–26. [Google Scholar] [CrossRef]
- Lumay, G.; Boschini, F.; Traina, K.; Bontempi, S.; Remy, J.-C.; Cloots, R.; Vandewalle, N. Measuring the flowing properties of powders and grains. Powder Technol. 2012, 224, 19–27. [Google Scholar] [CrossRef]
- Reh, L. Strömungs- und Austauschverhalten von Wirbelschichten. Chem. Ing. Tech. 1974, 46, 180–189. [Google Scholar] [CrossRef]
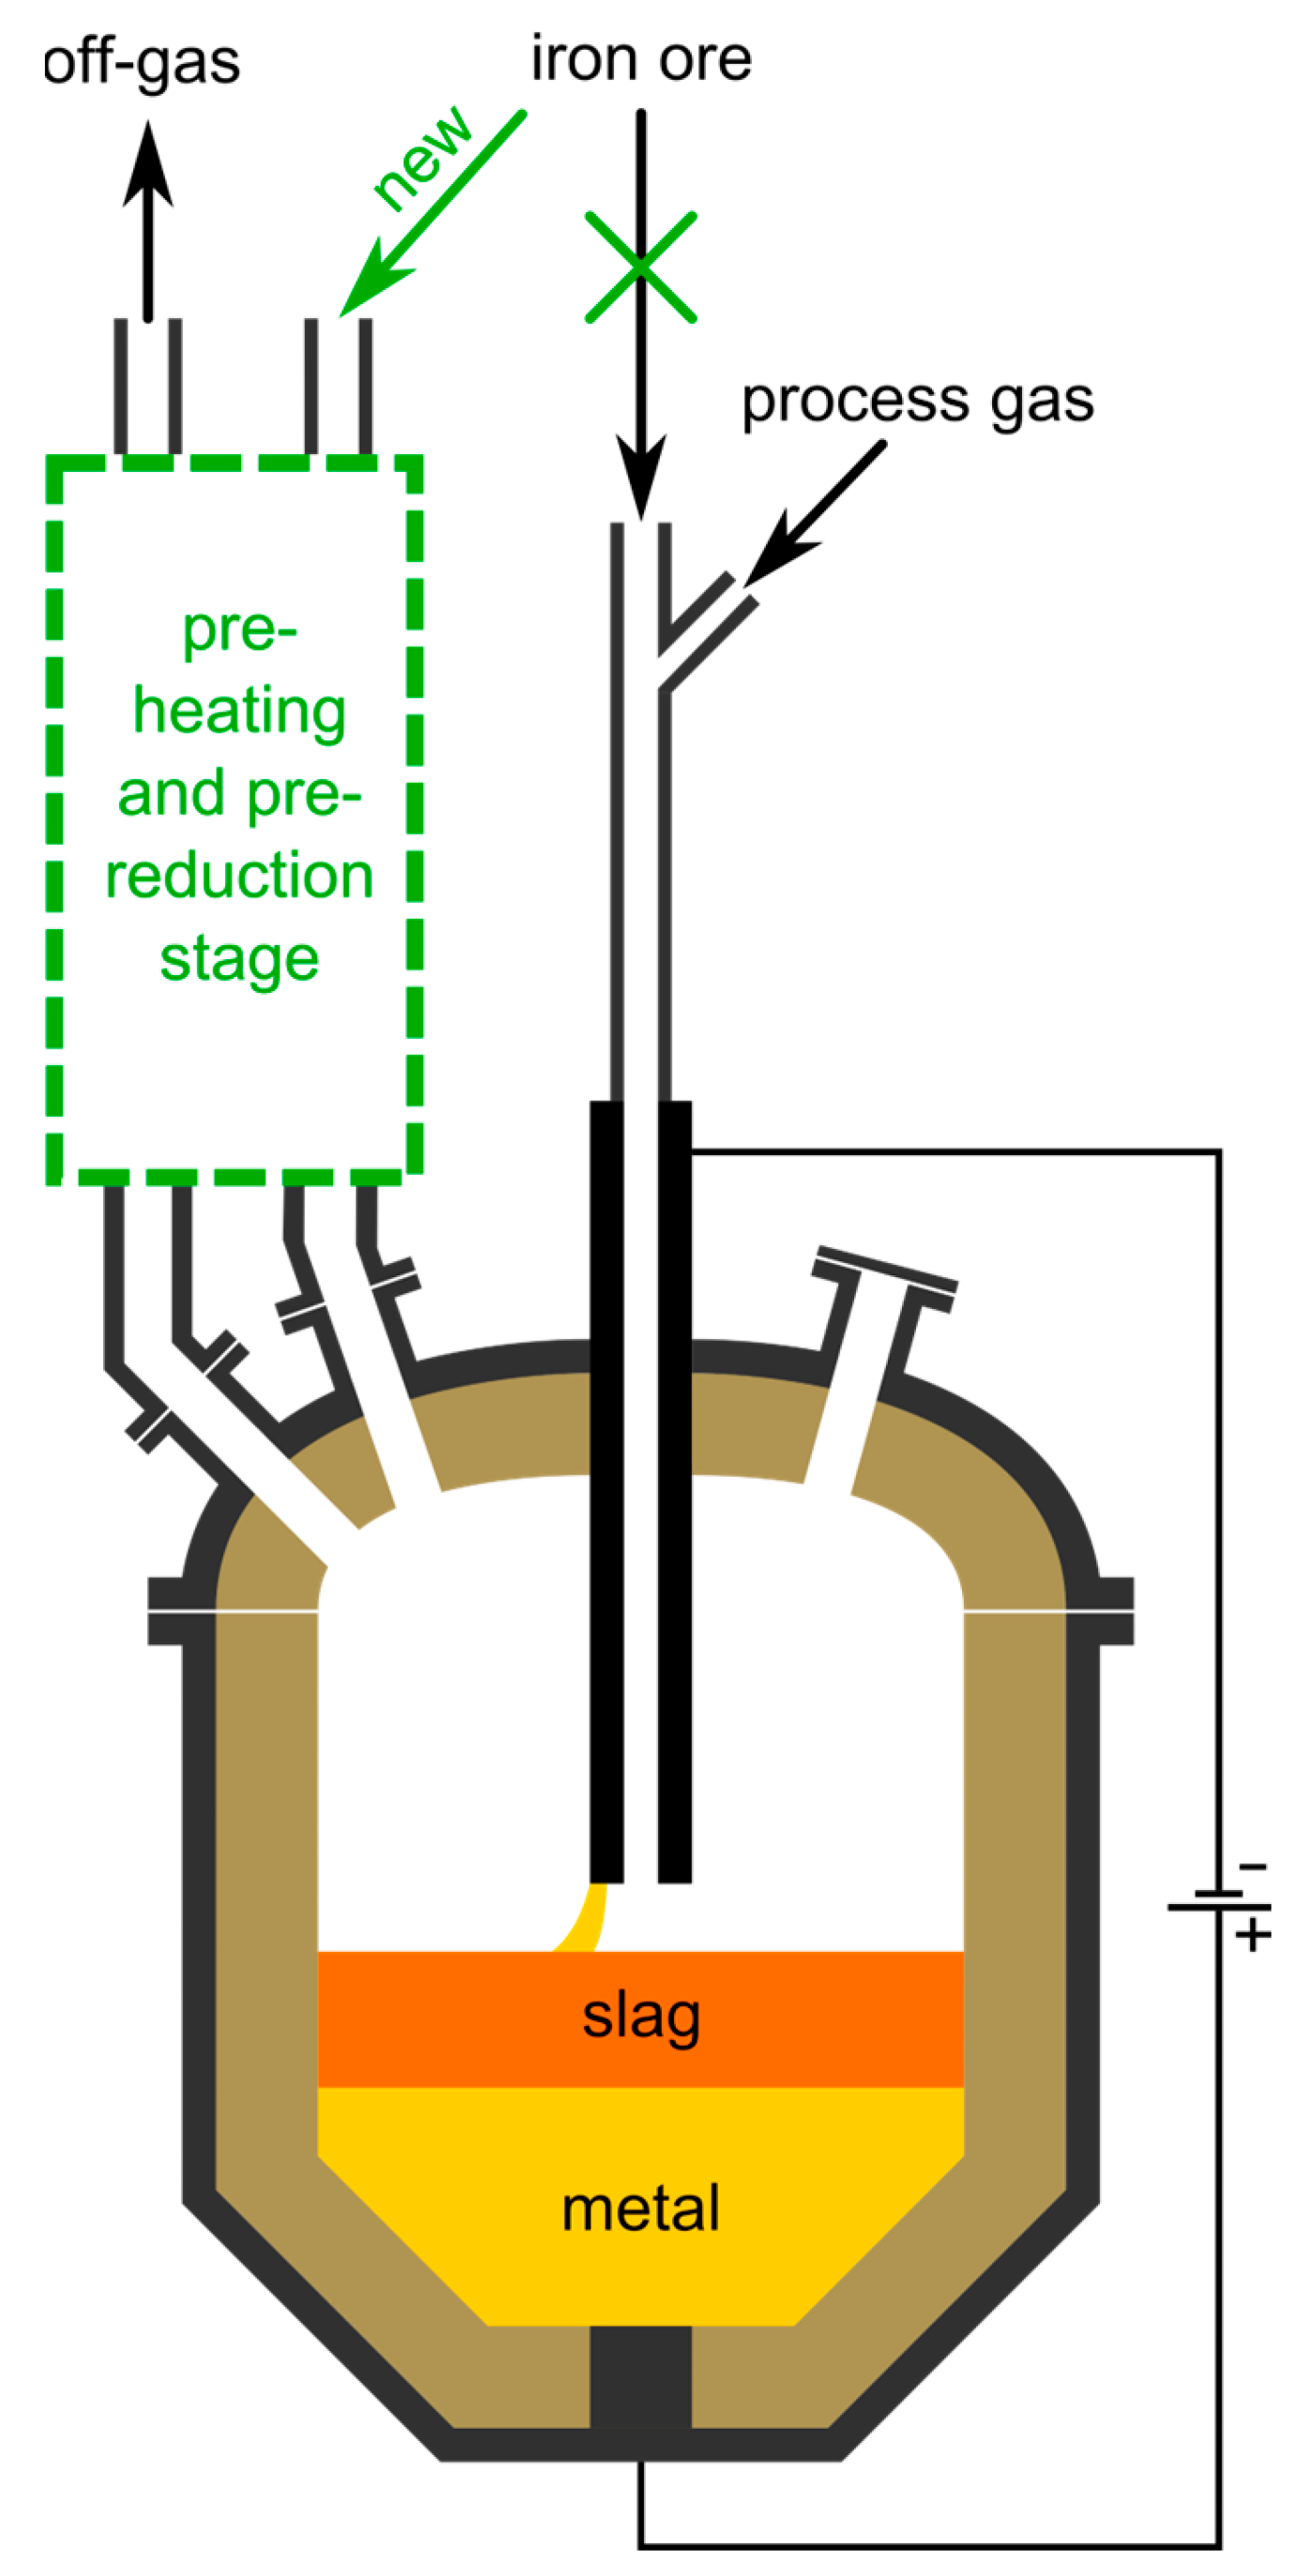
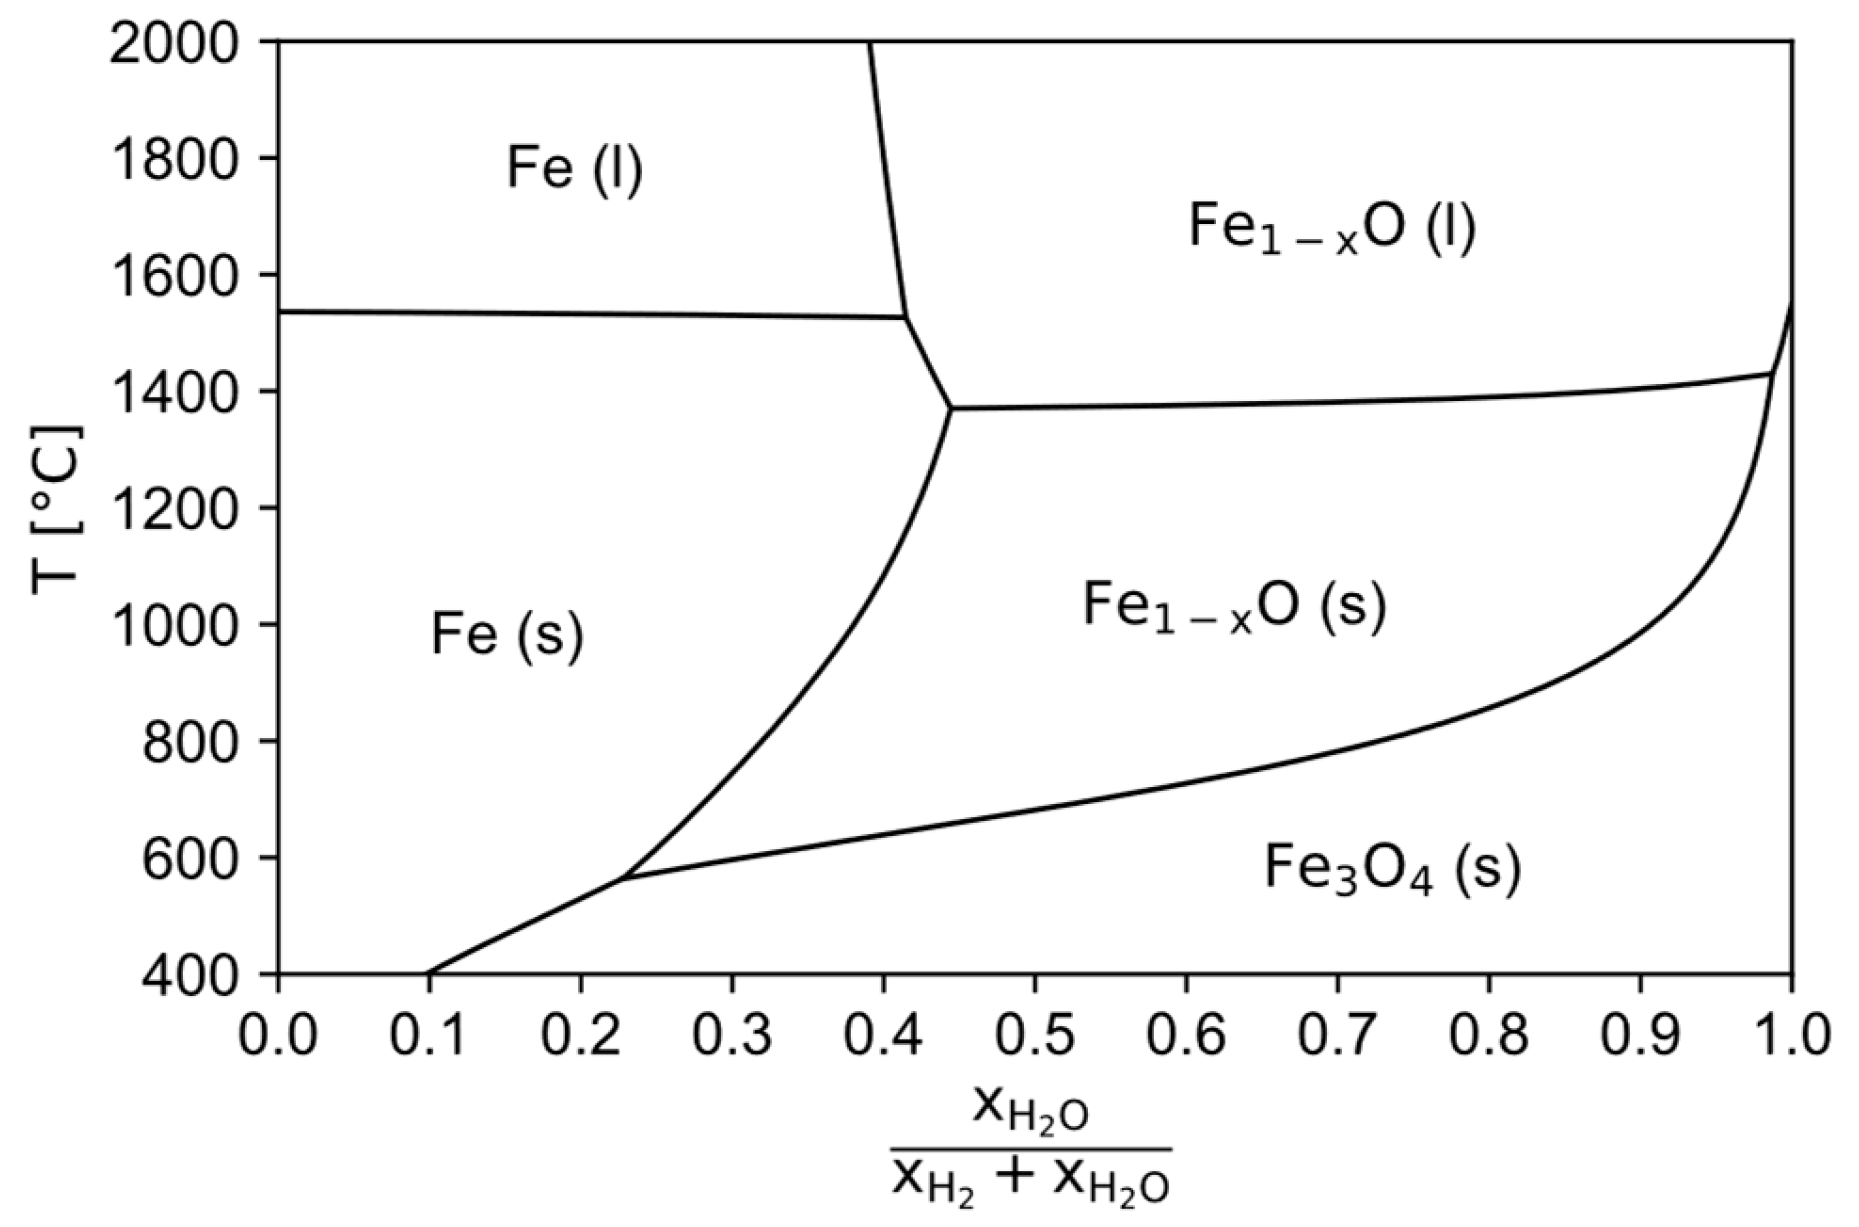
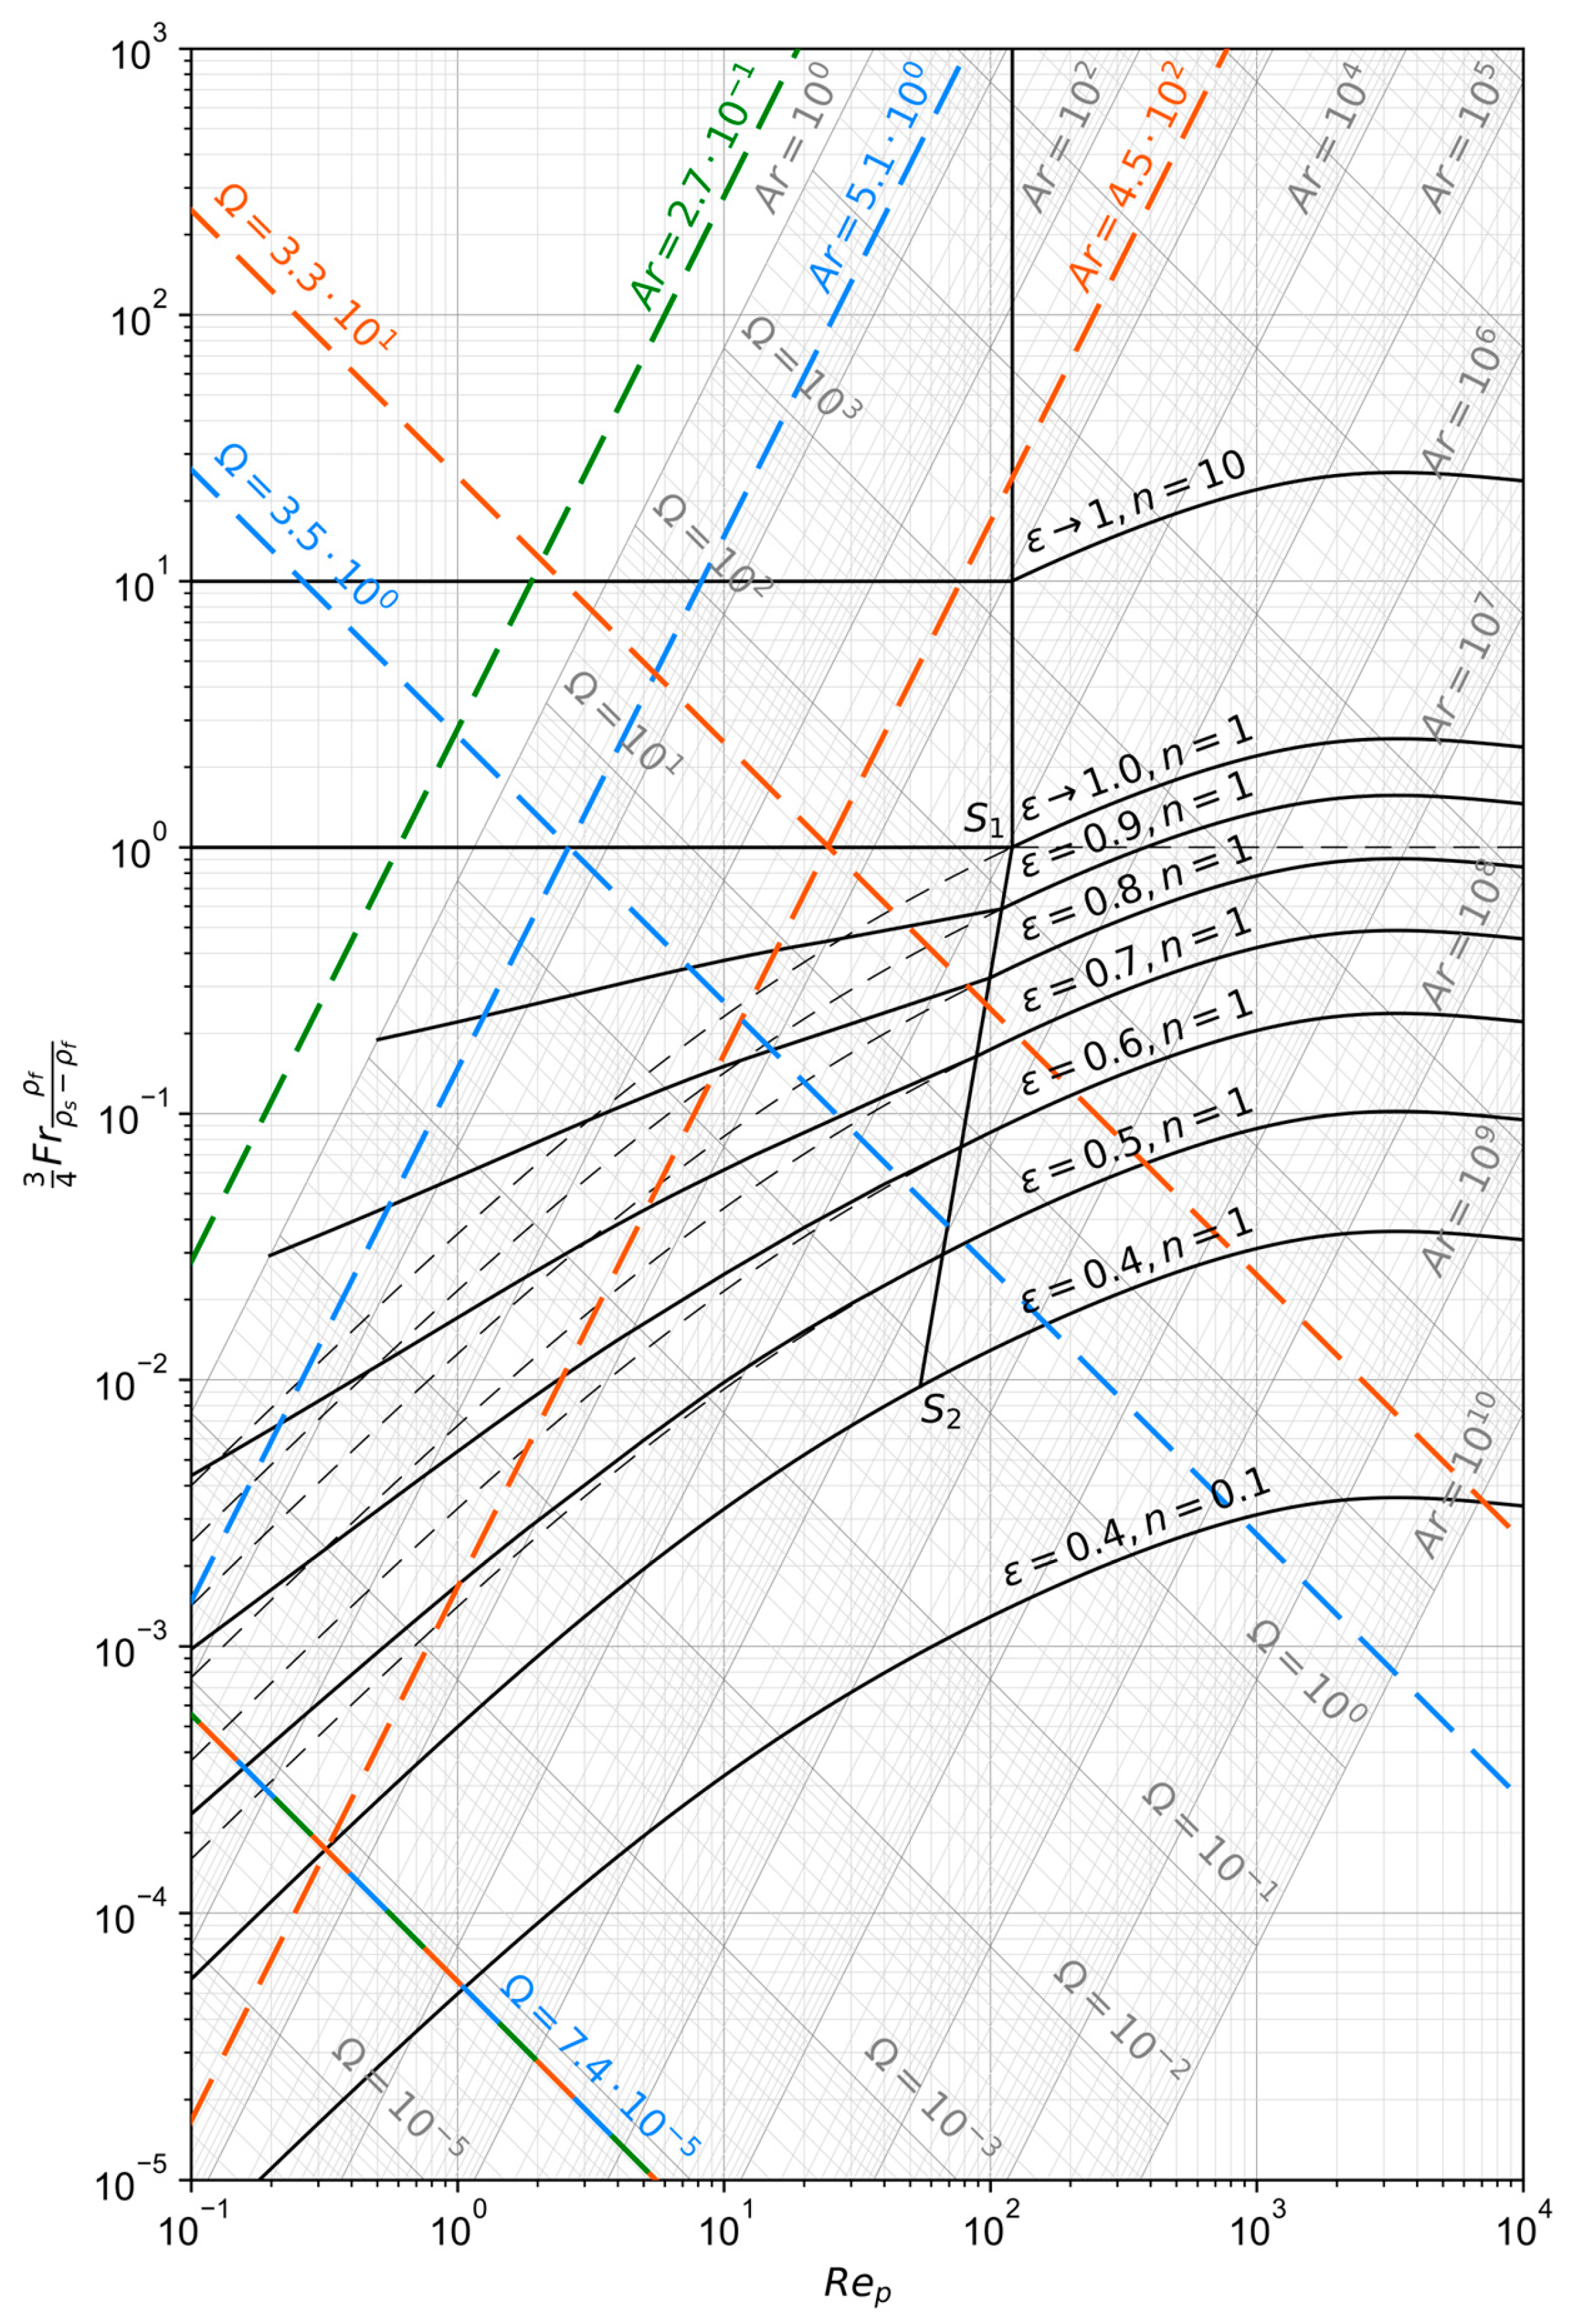

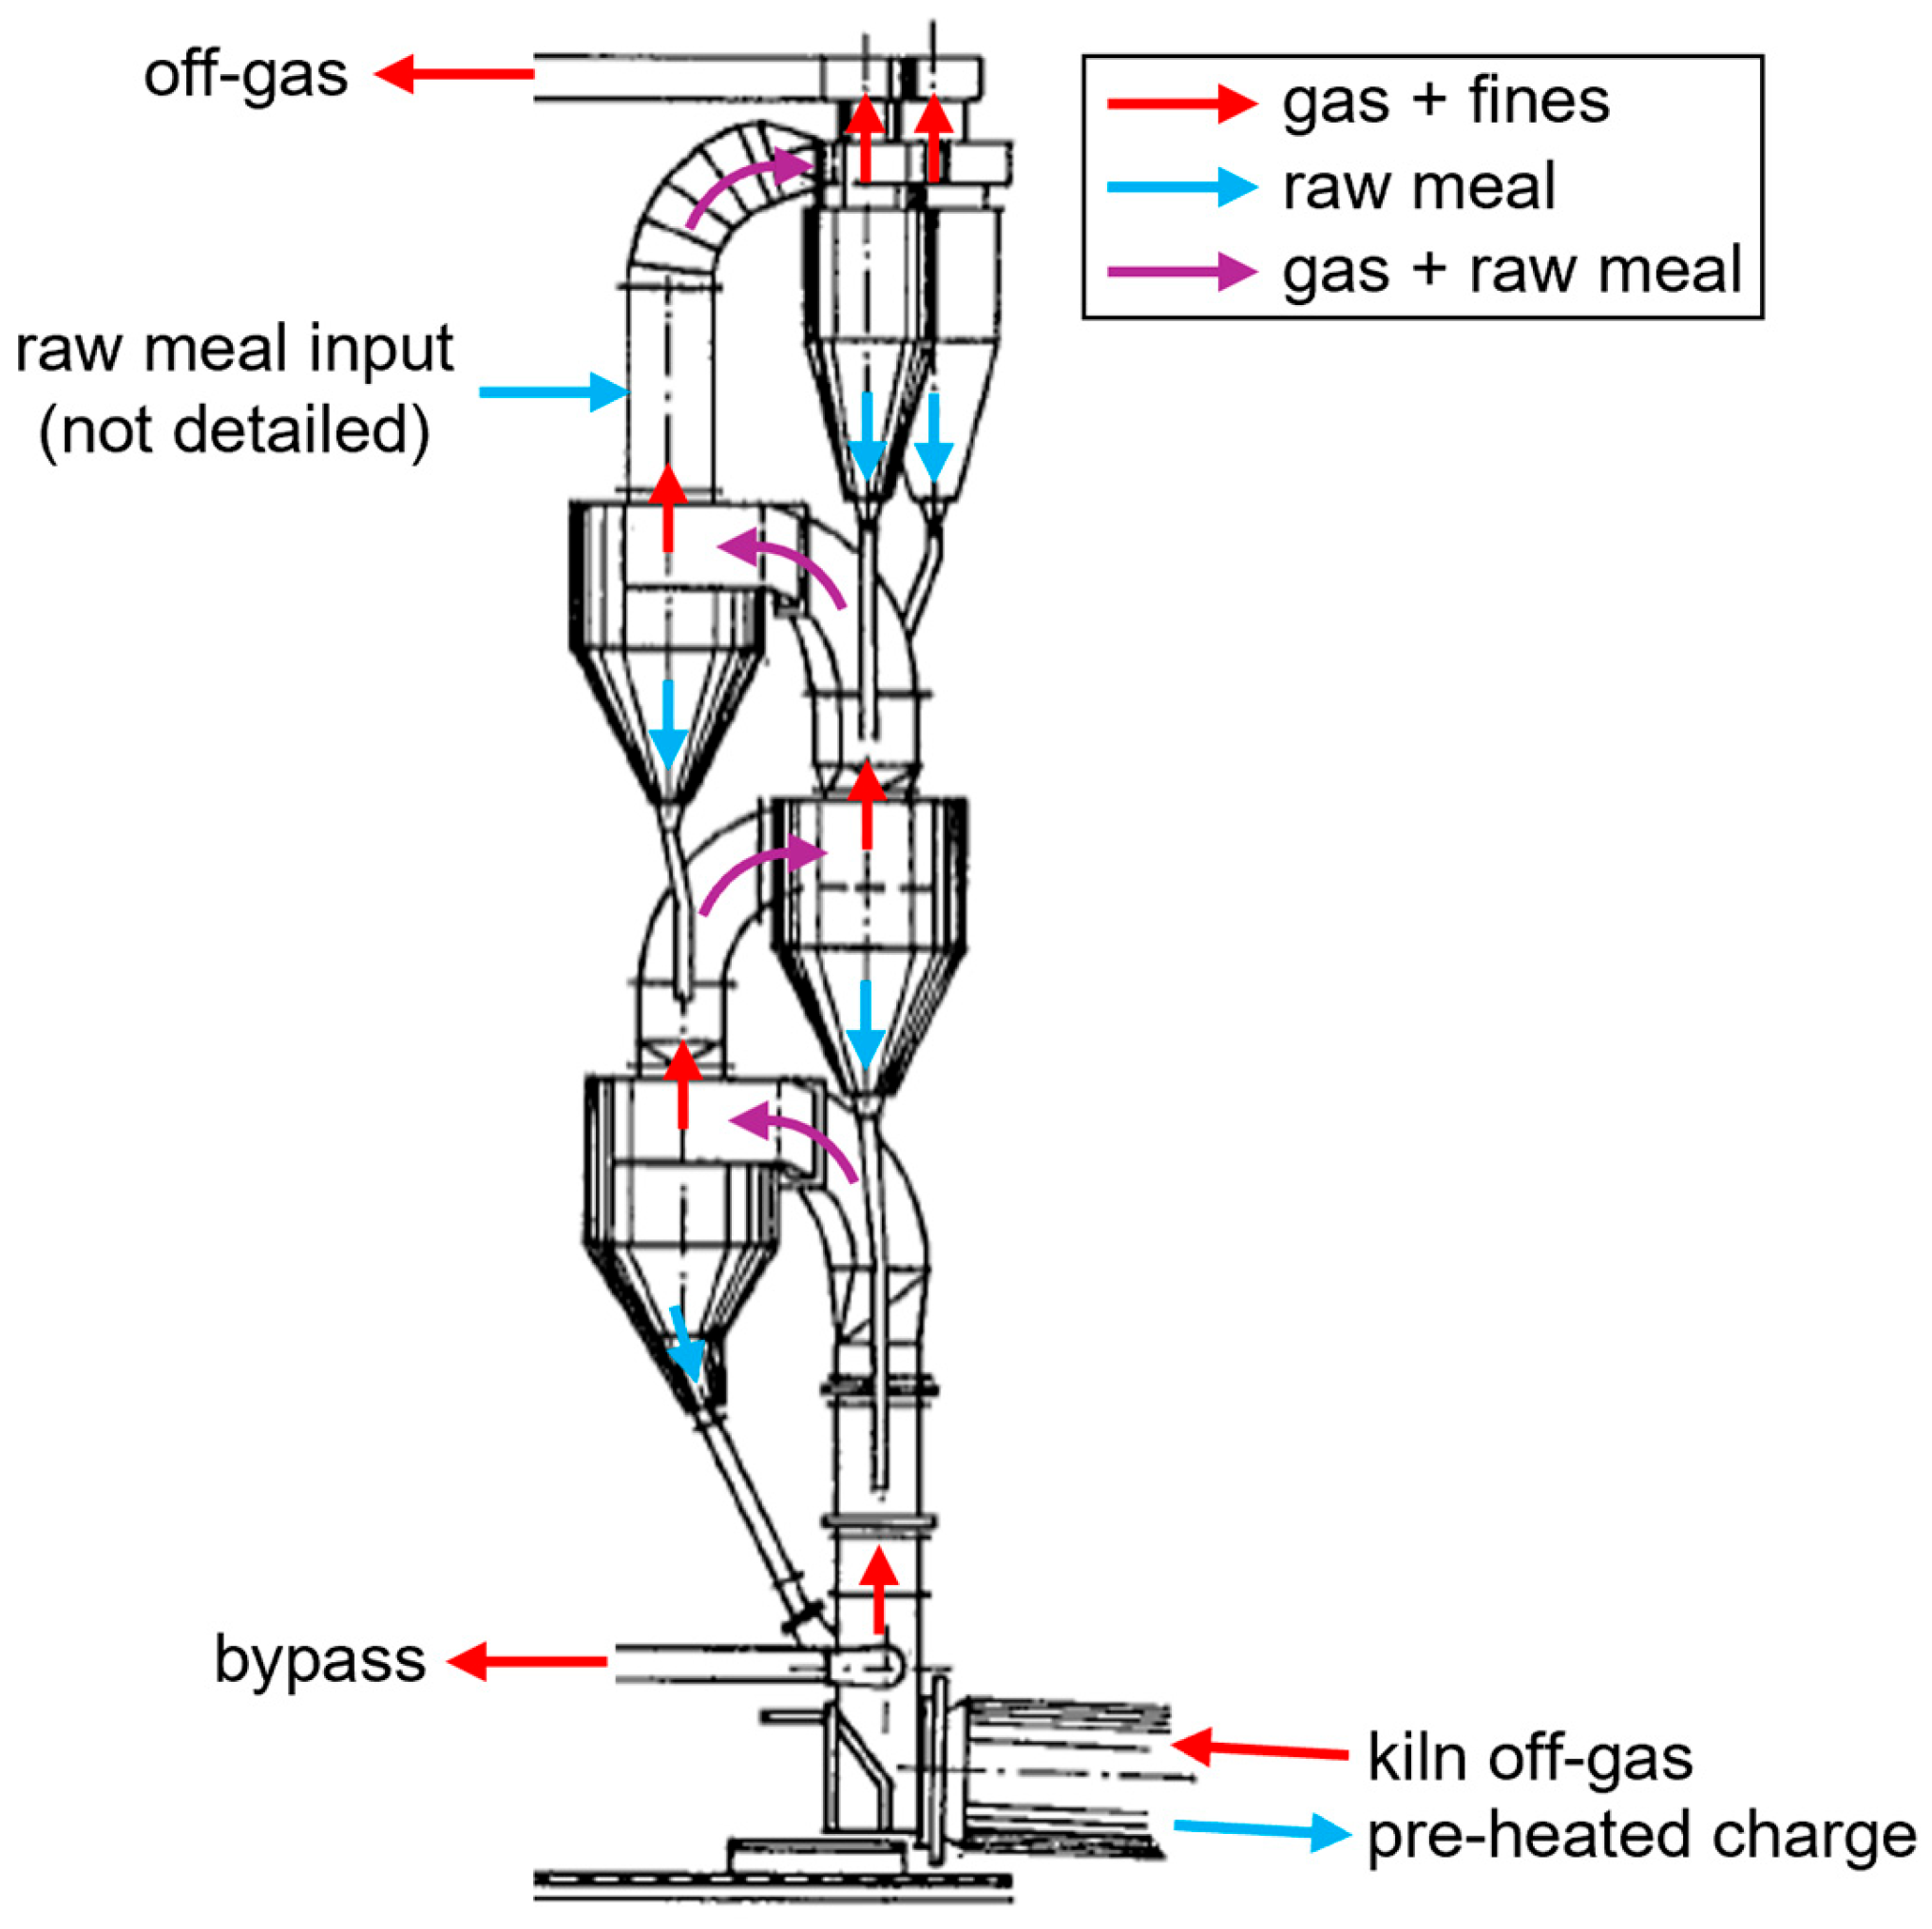

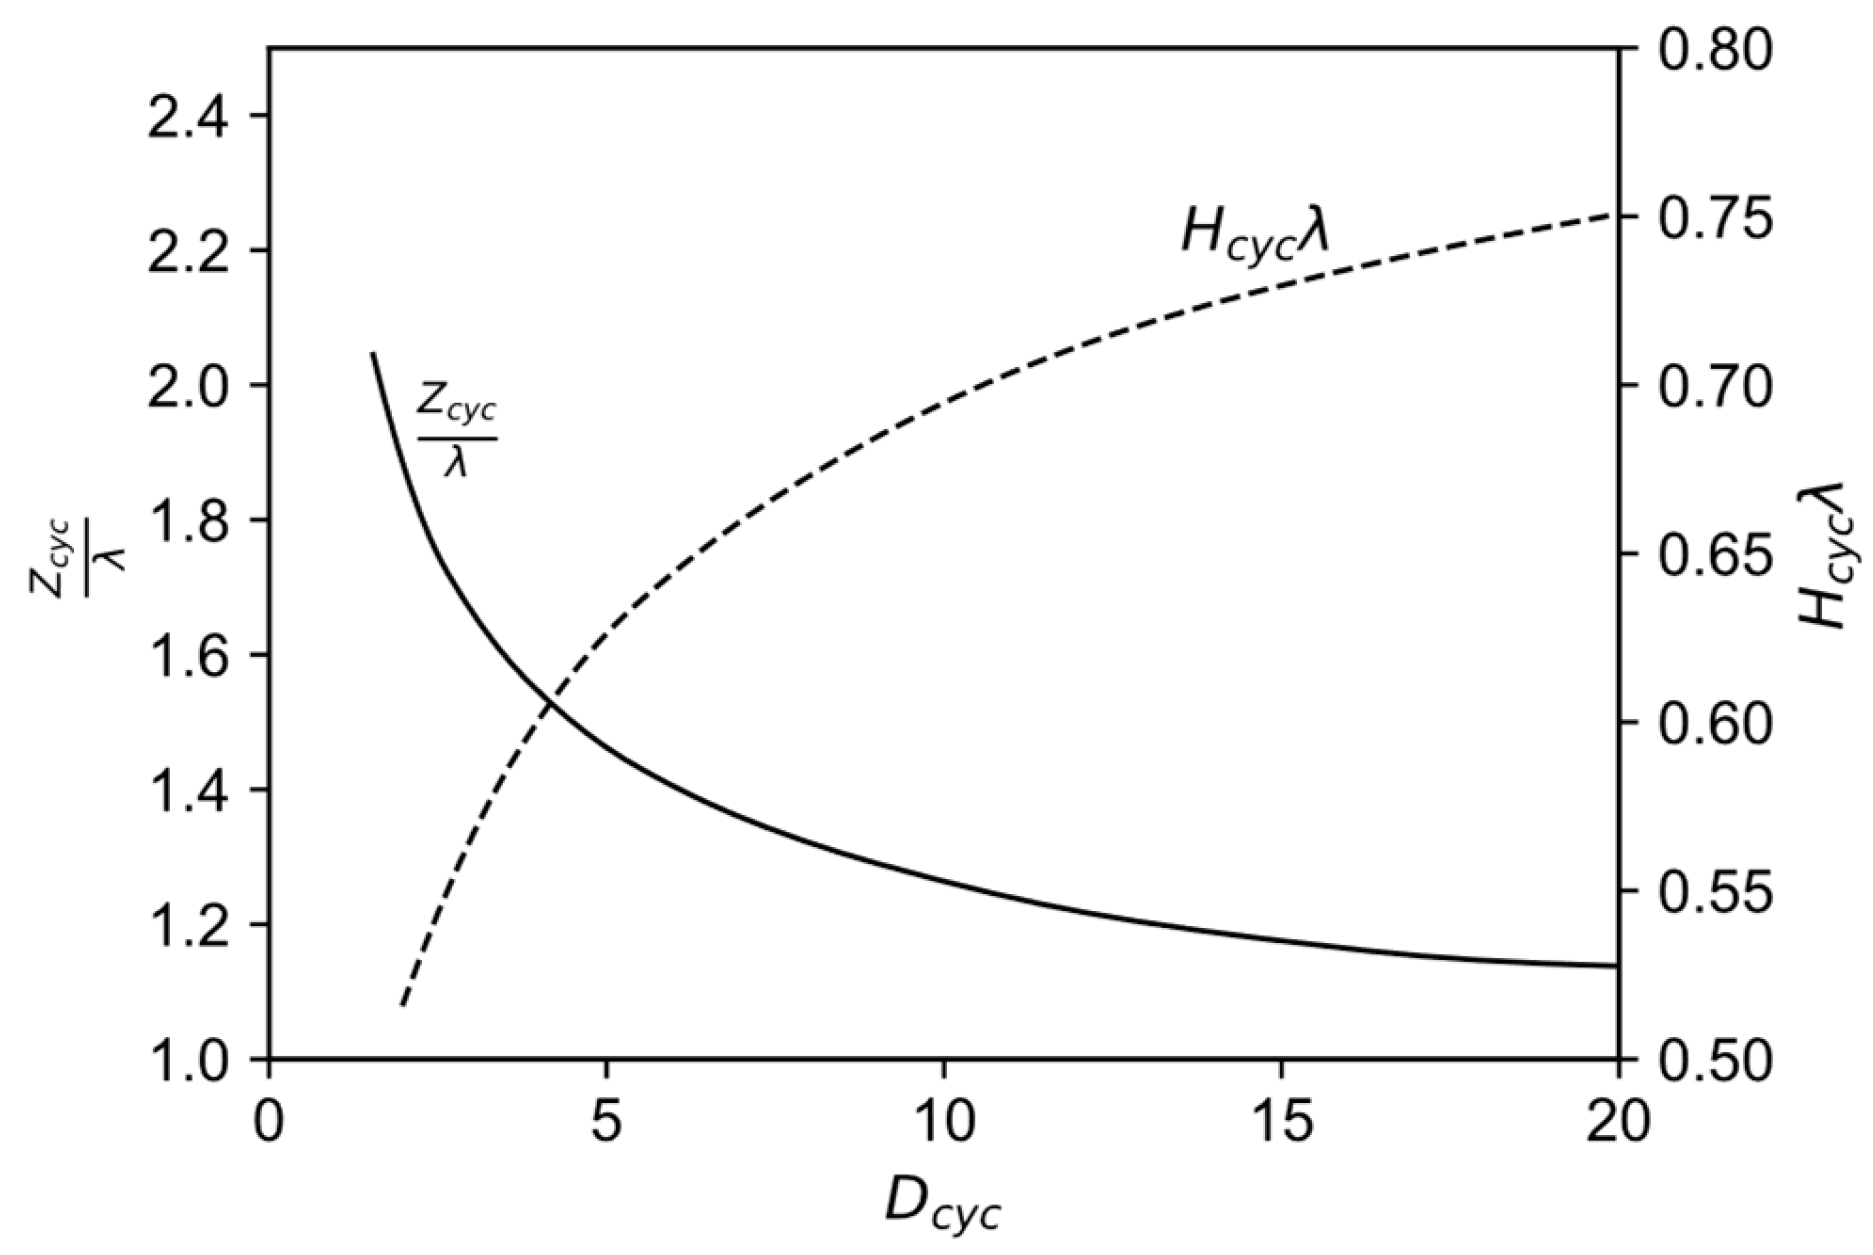
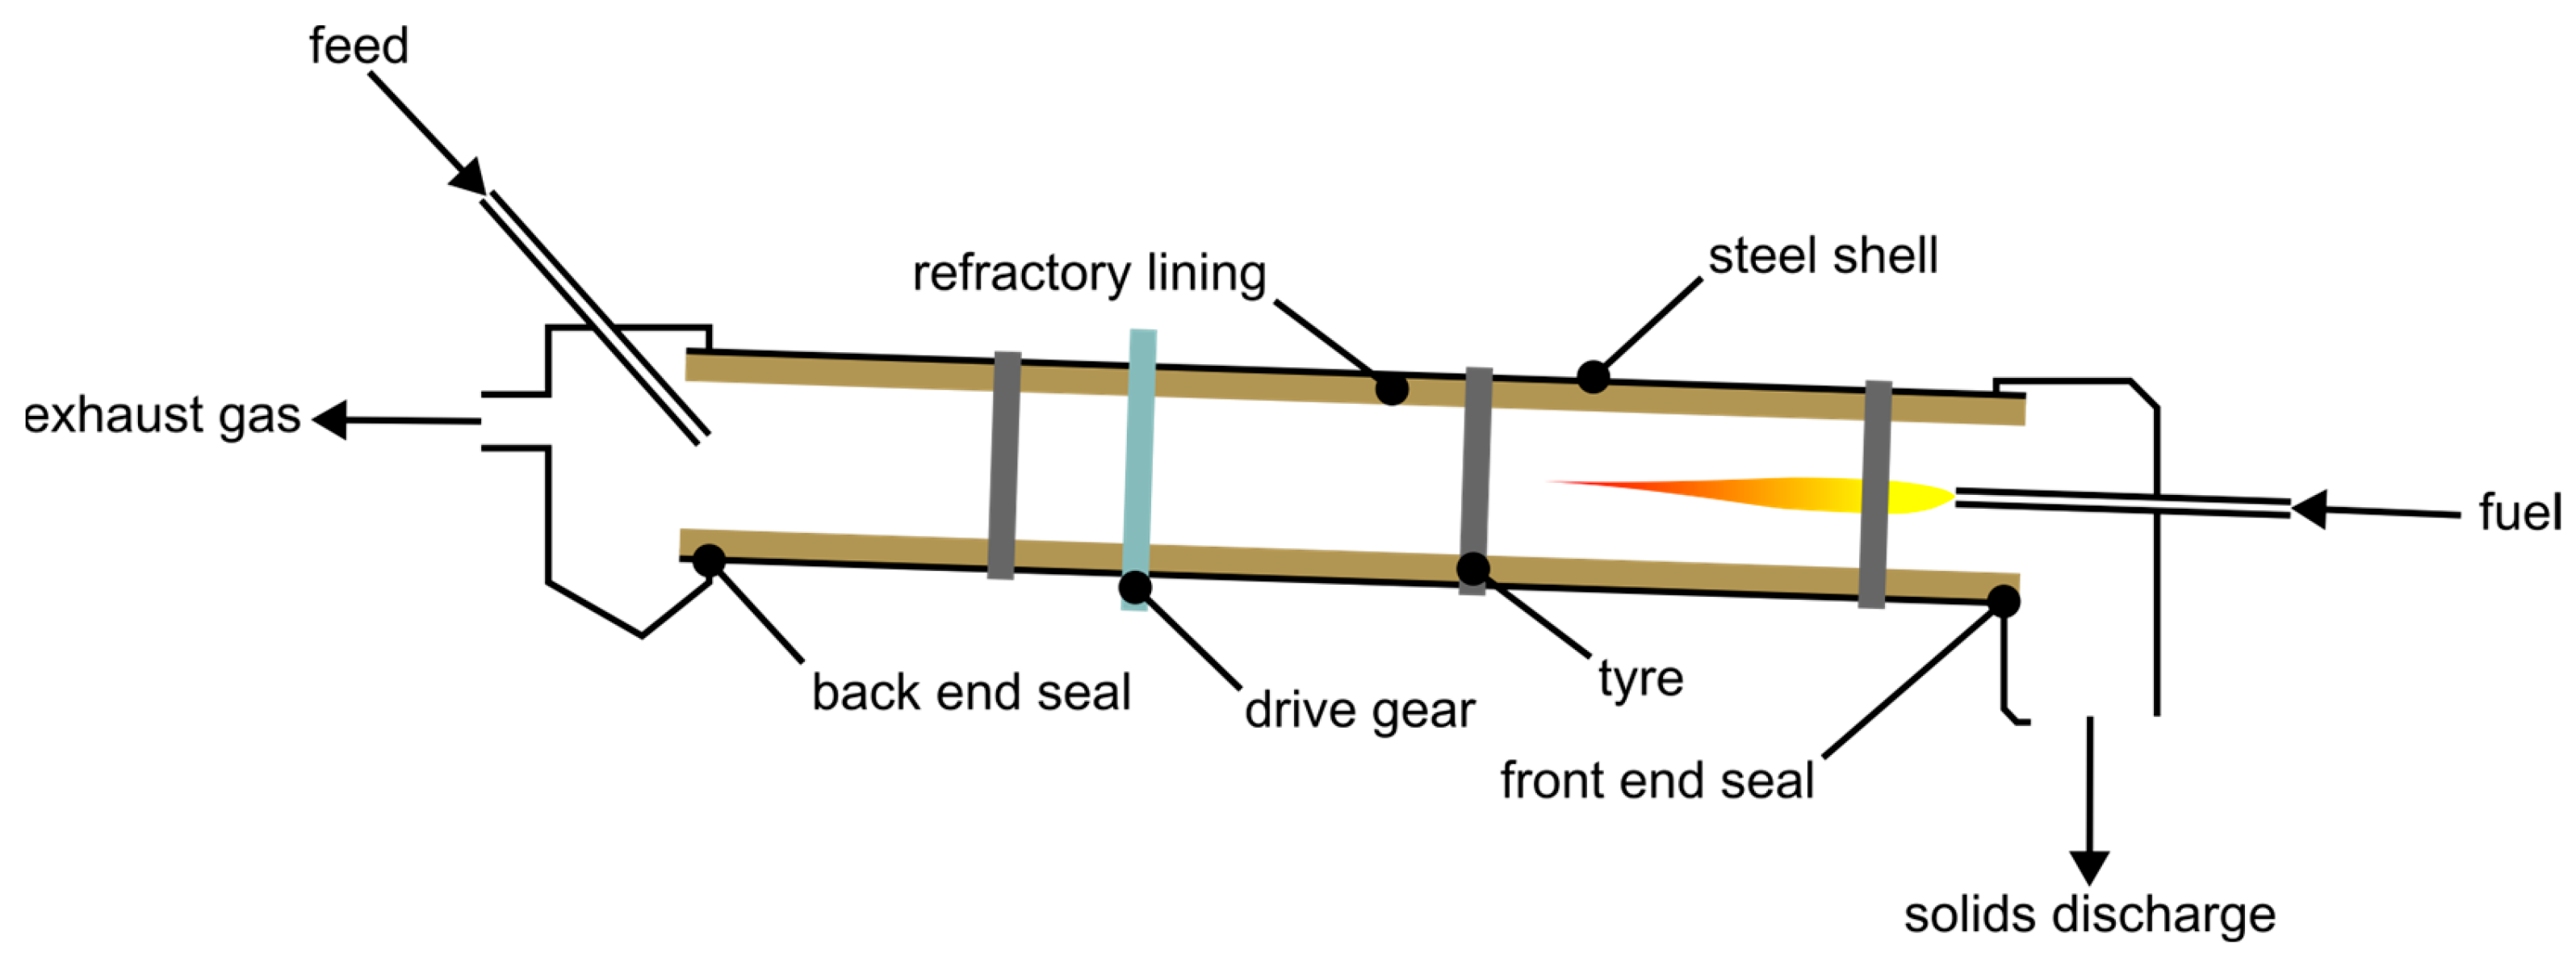

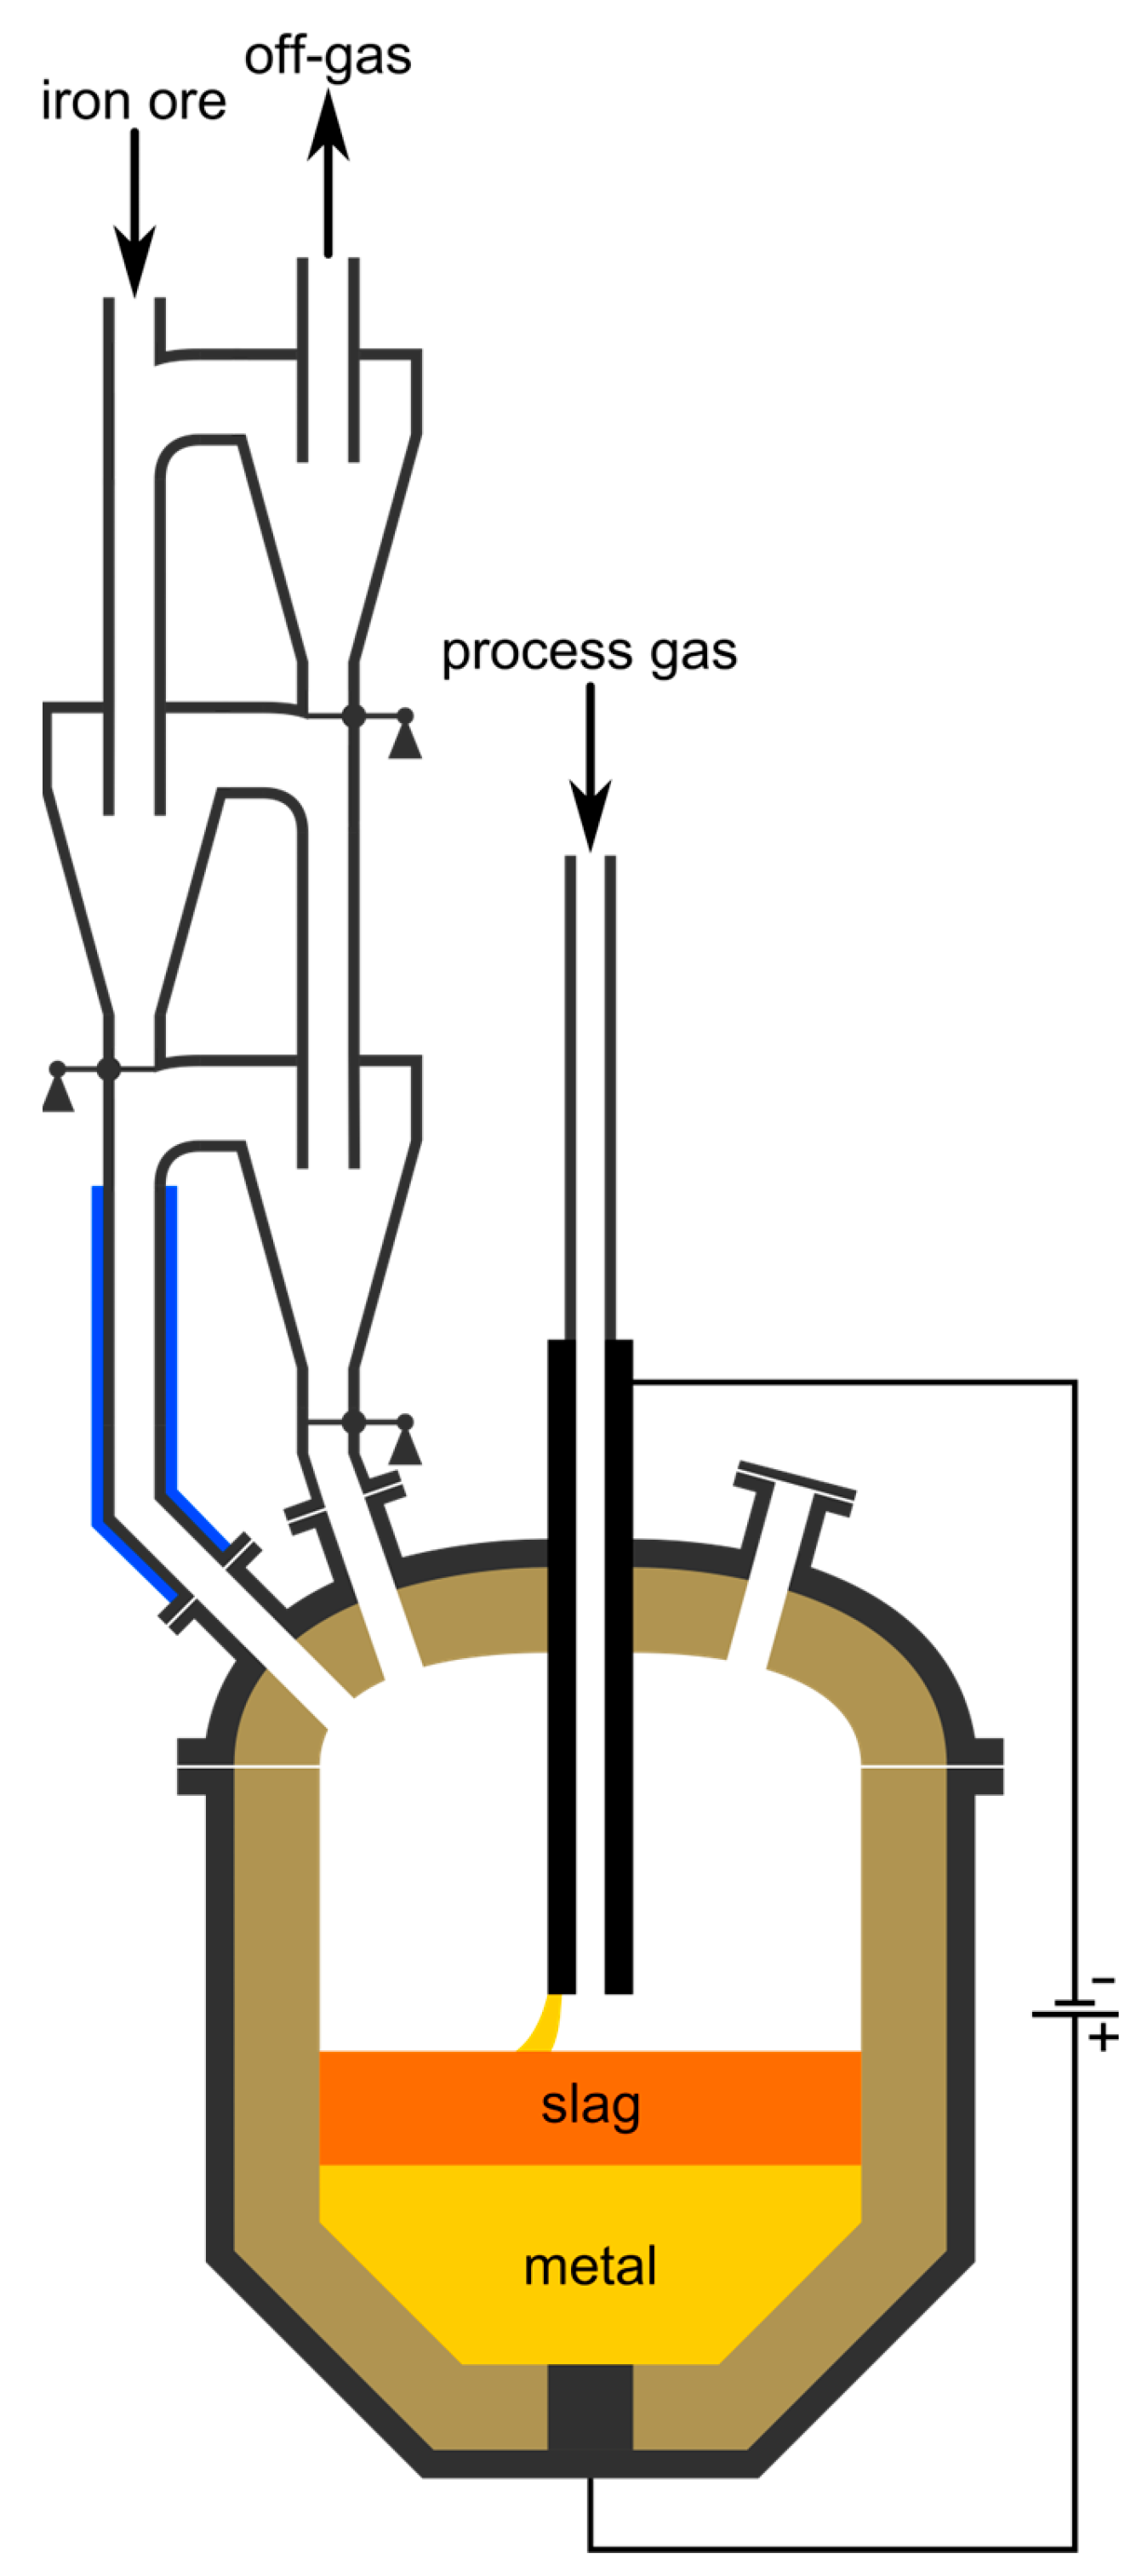
Disclaimer/Publisher’s Note: The statements, opinions and data contained in all publications are solely those of the individual author(s) and contributor(s) and not of MDPI and/or the editor(s). MDPI and/or the editor(s) disclaim responsibility for any injury to people or property resulting from any ideas, methods, instructions or products referred to in the content. |
© 2025 by the authors. Licensee MDPI, Basel, Switzerland. This article is an open access article distributed under the terms and conditions of the Creative Commons Attribution (CC BY) license (https://creativecommons.org/licenses/by/4.0/).