Article

Structural Engineering of π-Linker Aromaticity in Anthanthrene-Based Dyes with D–π–A Configuration: DFT Investigation to Enhance Charge Transfer in DSSCs

Chemistry Department, Faculty of Science, King Abdulaziz University, P.O. Box 42805, Jeddah 21589, Saudi Arabia
Processes 2025, 13(2), 418; https://doi.org/10.3390/pr13020418
Submission received: 21 December 2024 / Revised: 8 January 2025 / Accepted: 13 January 2025 / Published: 5 February 2025
(This article belongs to the Special Issue Modeling, Operation and Control in Renewable Energy Systems)

Abstract

:
The development of efficient dyes for photon harvesting in dye-sensitized solar cells (DSSCs) is a critical area of research with the potential to enhance renewable energy technologies. This manuscript presents a novel approach to engineering dye structures (abbreviated as D2 dye features, an anthanthrene core with a resonance energy of ER = 694 kJ/mol and a reported power conversion efficiency (η) of 5.27%) by systematically replacing an anthanthrene core with various aromatic cores, aiming to understand the influence of resonance energy on molecular performance. By designing seven new dyes with resonance energies ranging from 255 to 529 kJ/mol, we conducted in-depth computational studies using Density Functional Theory (DFT) and Time-Dependent Density Functional Theory (TDDFT) to explore the effects of π-aromatic linkers on their electronic properties. Our findings reveal key insights into intermolecular charge-transfer (ICT) mechanisms and how they relate to the resonance energy of dye cores, highlighting the significance of balanced charge mobilities in optimizing optoelectronic characteristics, as shown by the D9 dye with a naphthacene core.

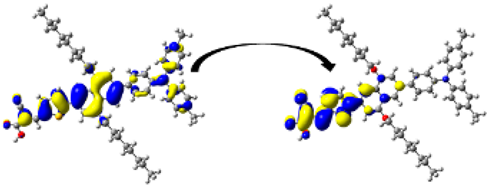
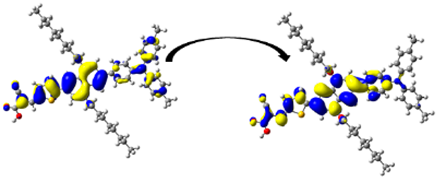
Graphical Abstract

1. Introduction

Technologies based on solar energy have remarkably developed during the last few decades. This is because of global concerns regarding the cost and availability of fossil fuels and the harmful effects on the worldwide climate due to the use of fossil fuels [1]. Regarding energy resources, the sun is considered the largest renewable source of energy. The sun provides the earth with 173,000 TW of energy per year [2], which means that one hour of the sun’s energy is more than what the human population consumes in one year. For 30 years, Grätzel and O’Regan 1991 developed solar cells with a new design known as Grätzel’s cells or dye-sensitized solar cells (DSSCs) [3]. A DSSC joins nanoparticles and molecular systems in a device like when a photosynthesis process takes place, and this device can convert sunlight into reliable, low-cost, and renewable energy [4]. In a DSSC device, the photosensitizer/dye (the light harvester) plays a crucial role. The dye used for this application must meet the following criteria: (i) captures visible/near-infrared light (Vis/NIR); (ii) absorbs light intensely, i.e., its molar absorption coefficient should be high; (iii) the appropriate alignment of its frontier molecular orbitals (FMOs), i.e., the energy of its LUMO (lowest unoccupied molecular orbital), is positioned above the semiconductor’s conduction band (CB) edge, and its energy of HOMO (highest occupied molecular orbital) is positioned lower than the redox shuttle for the effective regeneration of it; and (iv) a rendering of its aggregation on the TiO2 surface is required [5]. A dye based on Ruthenium could be used [6,7]. However, Ruthenium-based dyes are not available in nature, usually come with high production costs, and are toxic. Among the other types of dyes are those based on porphyrins [8]. Porphyrin-based dyes have the advantage of good absorption in the Vis region [5]. Lastly, dyes can be metal-free (MF) photosensitizers. MF-based dyes are promising candidates. They are low in production cost, are associated with high molar absorption coefficients, and are environment-friendly [9]. Most MF dyes are push–pull configured, which means an electron-donor unit (D) is connected to an electron-acceptor unit by a core forming a π-bridge. Since the choice of the π-bridge core is a vital factor in the potential performance of DSSC devices, researchers have investigated, experimentally and theoretically, the effects of various π-linker cores on the optoelectronic characteristics of the resultant dyes [10,11,12,13]. Such π-bridge cores are thiophene cores [10], azo cores [11], and cyanovinyl cores [12]. It is uncommon to find experimental and theoretical studies of dyes based on anthanthrene cores in the literature [14,15,16]. These dyes possess unique structural and electronic properties that may lead to improved performance in DSSCs and other optoelectronic applications.
Our study aims to explore these properties in the context of dye–semiconductor interactions. In materials science, naphtho[7,8,1,2,3-nopqr]tetraphene (anthanthrene) represents a promising building block. A series of anthanthrene-based photosensitizers have been investigated in DSSCs experimentally by Geng et al. [15]. Also, Wazzan [14] tried to interpret this work by detailed DFT calculations. The four synthesized dyes have a donor unit (triphenylamine); an anthanthrene unit, which serves as a conjugated π-linker; and one or two cyanoacrylic acid groups, which substitute 3-ethylheptane or nonane alkyl chains into the anthanthrene core and serve as anchoring groups. The performance of DSSC devices has been evaluated based on how many anchoring groups are present and the type of alkyl substitution used. Among the four investigated dyes, D2, (E)-2-cyano-3-(5-(10-(4-(di-p-tolylamino)phenyl)-6,12-bis(octyloxy)naphtho[7,8,1,2,3-nopqr]tetraphen-4-yl)thiophen-2-yl)acrylic acid, a dye-based device, exhibits the largest short-circuit current ( J s c ) , which equals 10.4 mA cm−2, offers a top overall power conversion efficiency ( η ) of 5.27% (the fill factor (FF) equals 0.73 and the open-circuit voltage ( V o c ) equals 690 mV).
In an effort by the group of Venkatraman et al. [17], various dyes have been designed in which the triphenylamine group acts as the donor unit, and cyanoacrylic acid unit acts as the anchoring group, and a number of aromatic rings with different resonance energies (benzene (36 kcal/mol), pyridine (32 kcal/mol), furan (16 kcal/mol), pyrrole (21 kcal/mol), and thiophene (29 kcal/mol)), act as π-linkers. The aromaticity of π-linkers on the configurational, electro-optical, photovoltaic, and charge-transfer properties have been investigated and analyzed. A conclusion was drawn in such a way that a complex relationship has been found to exist between aromaticity and photovoltaic properties. As described by Pino-Rios et al. [18], porphyrin cores have been modified to gain improved behavior as light harvesters in the UV, Vis, and NIR regions. A moiety of oxazolone has replaced the imine ring, resulting in redshifts and an enhanced Q-band intensity with respect to reference compounds. Moreover, aromaticity was explained using delocalization and magnetic criteria. Descriptors of aromaticity and Q bands show a qualitative relationship, and thus, as concluded, this has potential in the rational design of photosensitizers. In a theoretical investigation by Obasuyi et al. [9], using functional MN12SX with a 6-311+G(d,p) basis set, two series of anthocyanidin and betalain families were studied. Aromaticity, the open-circuit voltage ( V o c ), the rate constant of the injection ( G i n j ), and the rate constant of the dye regeneration ( G r e g ) values were found to play important roles in determining which dye is most efficient. In another theoretical effort by Borges-Martínez et al. [5], BODIPY and oxasmaragdyrin photosensitizers were studied using 11 bridging functional groups on their aromatic, charge transport, and photophysical properties. At the GIAO/B3LYP/6-311G(d,p) level, the aromaticity index ,NICS(0), is calculated at the macrocycle center-ring critical point, and all these systems can be classified as aromatic (between −10.7 and −12.4 ppm).
Historically, one of the first energy-based quantities used to quantify the degree of aromaticity is the resonance energy ( E R ).
Based on a comparison of the energy values of the localized Lewis structure and the delocalized “real” compound, the E R value is determined. Electronic configurations representing a localized Lewis structure can be calculated and compared using a restraint-free calculation that allows for full delocalization. Aromaticity increases as this difference rises [19]:
E R = E d e l E L e w i s
where E d e l is the electronic energy of the fully delocalized structure, and E L e w i s is the electronic energy of the most representative Lewis structure.
To compensate for the spectral engineering of DSSCs for new applications such as greenhouse-oriented applications, developments of DSSCs that employ newly designed dyes have been considered a lot in the literature [20]. Greenhouses typically utilize sunlight, but their spectral composition can vary based on the time of day and season. The sunlight that reaches plants in a greenhouse includes a range of wavelengths—primarily, visible light, with some near-infrared (NIR) and ultraviolet (UV) components. The first step in spectral engineering involves designing dyes that have specific absorption characteristics that can complement or optimize the light available in a greenhouse.
This study addresses a significant challenge in the field of DSSCs—the need for improved light-to-current efficiency through the strategic optimization of dye structures. As mentioned in the above refs. [5,9,17,18], current research highlights a promising correlation between aromaticity and photovoltaic performance, but there remains a gap in understanding how different resonance energies within dye molecules can influence their effectiveness in energy conversion. By focusing on the superior capabilities of the D2 dye, as substantiated in ref. [15], this work presents novel dyes designed by substituting the anthanthrene linker with various aromatic rings, each characterized by distinct resonance energies. This innovative approach aims not only to enhance optical and photovoltaic properties but also to provide valuable insights into the structure–property relationships that govern the performance of DSSCs. The significance of this study lies in its potential to bridge existing knowledge gaps, and it offers a systematic investigation into how modifications at the molecular level can lead to enhanced energy conversion efficiencies.
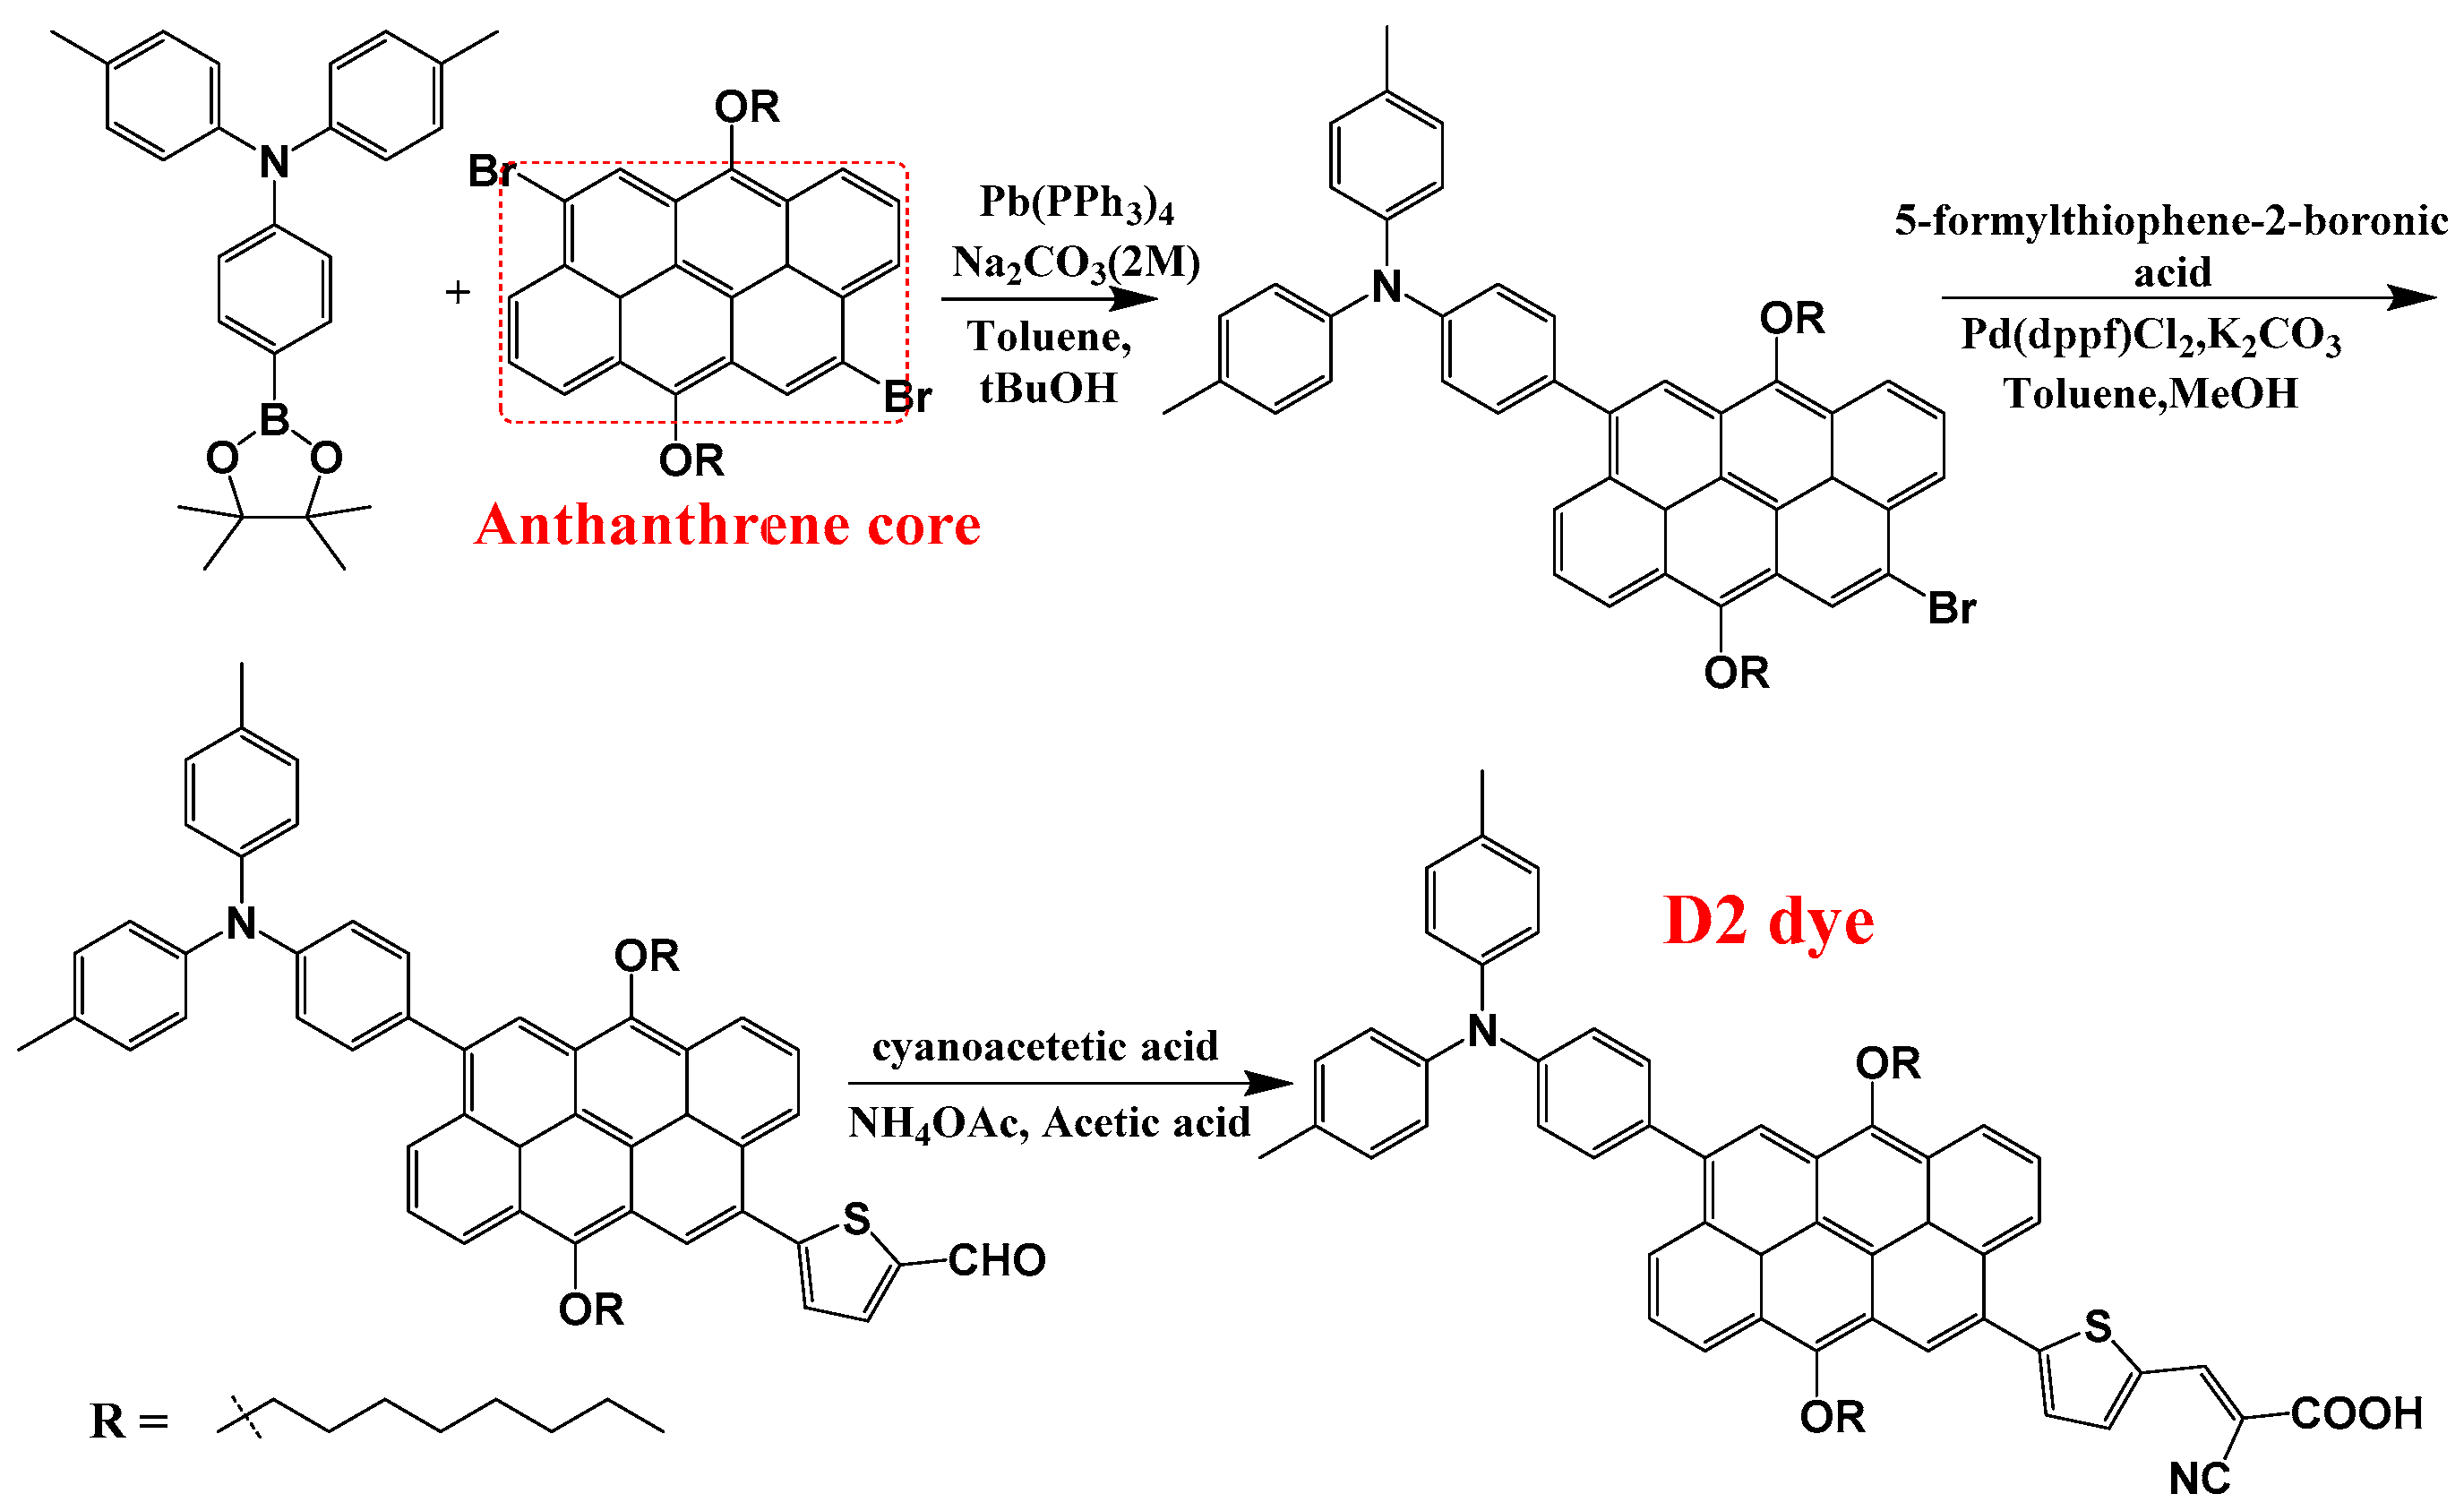
The molecular structures of the seven designed dyes are illustrated in Figure 1. Abbreviations and IUPAC names of the designed dyes are as follows: D5: (E)-2-cyano-3-(5-(6-(4-(diphenylamino)phenyl)-4,8-bis(octyloxy)anthracen-2-yl)thiophen-2-yl)acrylic acid; D6: (E)-2-cyano-3-(5-(6-(4-(diphenylamino)phenyl)-3,8-bis(octyloxy)phenanthren-1-yl)thiophen-2-yl)acrylic acid; D7: (E)-2-cyano-3-(5-(6-(4-(diphenylamino)phenyl)-3,8-bis(octyloxy)phenanthren-1-yl)thiophen-2-yl)acrylic acid; D8: (E)-2-cyano-3-(5-(8-(4-(diphenylamino)phenyl)-1,6-bis(octyloxy)pyren-4-yl)thiophen-2-yl)acrylic acid; D9: (E)-2-cyano-3-(5-(8-(4-(diphenylamino)phenyl)-4,10-bis(octyloxy)tetracen-2-yl)thiophen-2-yl)acrylic acid; D10: (E)-2-cyano-3-(5-(1-(4-(diphenylamino)phenyl)-3,9-bis(octyloxy)chrysen-6-yl)thiophen-2-yl)acrylic acid; and D11: (E)-2-cyano-3-(5-(9-(4-(diphenylamino)phenyl)-5,11-bis(octyloxy)perylen-3-yl)thiophen-2-yl)acrylic acid. In this work, by critically analyzing both the well-performing D2 dye and its seven newly designed derivatives, we aim to furnish the field with a deeper understanding of how structural variations impact the performance of photosensitizers in DSSCs. Ultimately, our findings could pave the way for the development of more efficient solar energy materials, contributing to advancements in renewable energy technologies and addressing global energy challenges. The synthesis procedure of the D2 dye, as described in ref. [15], along with the suggested synthesis procedures for the newly designed dyes are illustrated in Figure 2.

2. Methods

Regarding DFT theory, a series of dyes based on anthanthrene were optimized with no structural constraints imposed on the optimization. An M06-2x hybrid functional from the Truhlar group was used for DFT calculations [21], using the standard basis set of 6-31+G(d,p) [22,23]. The M06-2x functional was selected due to its proven reliability and accuracy in describing non-covalent interactions, which are particularly relevant for the system under investigation. Numerous studies have highlighted its capacity to effectively handle dispersion interactions, making it suitable for systems involving dye–semiconductor interactions [24]. Furthermore, the M06-2x functional has shown favorable performance in comparison to other functionals, such as B3LYP and PBE0 [25], particularly in terms of predicting reaction energies and geometries in similar material systems [26,27]. The adopted basis set (6-31+G(d,p)) offers a balanced trade-off between computational efficiency and the accuracy of electronic structure calculations. 6-31+G(d,p) is a double ζ basis set with one diffuse function and two polarizable functions. Since the experimental testing of the reference dye (D2) was carried out in a THF solvent, the Conductor-like Polarizable Continuum Model (CPCM) was utilized to replicate the appearance of this solvent (THF, ε = 7.58 ). The choice of the CPCM model is supported by various studies in the literature that investigate dye behavior in DSSC applications. It has shown a good ability to describe the interactions that influence photovoltaic performance [15,28,29]. A simulation of dye adsorption on the TiO2 surface has also been conducted. Considering the cost of computation and the reliability of the system, the cluster (TiO2)6 was selected to model anatase TiO2. Anatase (TiO2)6 has an optimal cluster size in terms of computational cost/efficiency negotiation to simulate the electronic and optical properties of the complex system [17,30]. Hydrogenated TiO2 clusters are more stable than dehydrogenated ones, as previously demonstrated [31], so the (TiO2)6H3 cluster was used. No structural constraints were applied to dye complexation geometries with TiO2, using 6-31+G(d,p) for C, O, N, S, and H. In addition, the Los Alamos National Laboratory DZ quality and the overall combination of ECP and valence basis sets (LANL2DZ) for Ti atoms were used [32]. With only real frequencies, all optimized geometries reach a minimum. Typically, exchange functionals have too-short non-coulomb parts that die off too quickly and become very inaccurate with distance. Thus, they cannot be used to model electron excitations in high orbitals. TDDFT with a coulomb-attenuating functional (CAM-B3LYP) and the same basis set has been used to calculate the absorption of 12 excited states and emission to 3 excited state transitions using the optimal geometry in the ground state [33]. The Gaussian 09 software suite was used to perform all calculations [34]. Visualizations of molecular structures were performed by using GaussView (version 5.0.8) [35]. The molecular electrostatic potential maps (MESPs) were drawn using the Avogadro package [36]. Finally, the comprehensive equations employed for estimating various parameters, along with their respective references, are presented in the computational details section of the Supplementary Data (SD).

3. Results and Discussion

Based on the experimental results of [15] and fully supported and interpreted by the theoretical calculations of the present author [14], the D2 dye performed better than the other three dyes tested. The D2 dye’s configuration was modified by replacing the π-spacer (Naphtho[7,8,1,2,3-nopqr]tetraphene) with aromatic rings of smaller and different resonance energies, and seven dyes were designed as a result, see Figure 1. Therefore, the eight investigated dyes consist of a donor group (triphenylamine unit (TPA)) and an anchoring group (a cyanoacrylic acid unit) attached at the 6,12 positions to a thiophene unit (TPH) and are substituted with two nonane alkyl chains (ALKY1/ALKY2) attached to different aromatic cores. The resonance energies ( E R ) of the designed dyes and the D2 dye decrease in the following order: D2 (anthanthrene; E R = ~ 694 kJ/mol) > D11 (perylene; E R = 529 kJ/mol) > D10 (chrysene; E R = 487 kJ/mol) > D9 (naphthacene; E R = 460 kJ/mol) > D8 (pyrene; E R = 456 kJ/mol) > D7 (phenanthrene; E R = 381 kJ/mol) > D6 (anthracene; E R = 347 kJ/mol) > D5 (naphthalene; E R = 255 kJ/mol).

3.1. Dyes Before Adsorption

3.1.1. Degree of Planarity

As a result of the coplanarity of the dye’s D–π–A configuration, intramolecular charge transfer (ICT) can be ensured from one side to the other [17]. On the other side, an increase in the non-planarity of the donor unit of a dye is favorable, since self-aggregation can be significantly rendered [37]. Table 1 provides some of the major dihedral angles at different positions within the eight dyes. The dihedral angles (DA1) between the TPA units and the aromatic cores are in the range of 35.19 to 52.43°; the change in the DA2 represents the angle of rotation between the thiophene units; and the aromatic rings fall in a similar range, i.e., from 25.21 to 56.90°. These two ranges indicate a deviation from the planarity of these two regions within the molecules.
On the other hand, the dihedral angles between the alkyl substituents and the aromatic cores show some variation, which can be attributed to the difference in the resonance energies of the aromatic cores since the alkyl chain in all molecules is the same (nonane). The degree of planarity is higher in three dye molecules, D7 (phenanthrene; E R = 381 kJ/mol); D10 (chrysene; E R = 487 kJ/mol); and D11 (perylene; E R = 529 kJ/mol). Since in these three dyes, DA3 and DA4 are very close to 180°, note that DA4 in D7 is 88.77°. All other dyes show an increase in out-of-plane distortion. It is worth mentioning that there is no direct relationship between the overall planarity of the molecule and resonance energies of the core aromatic rings.
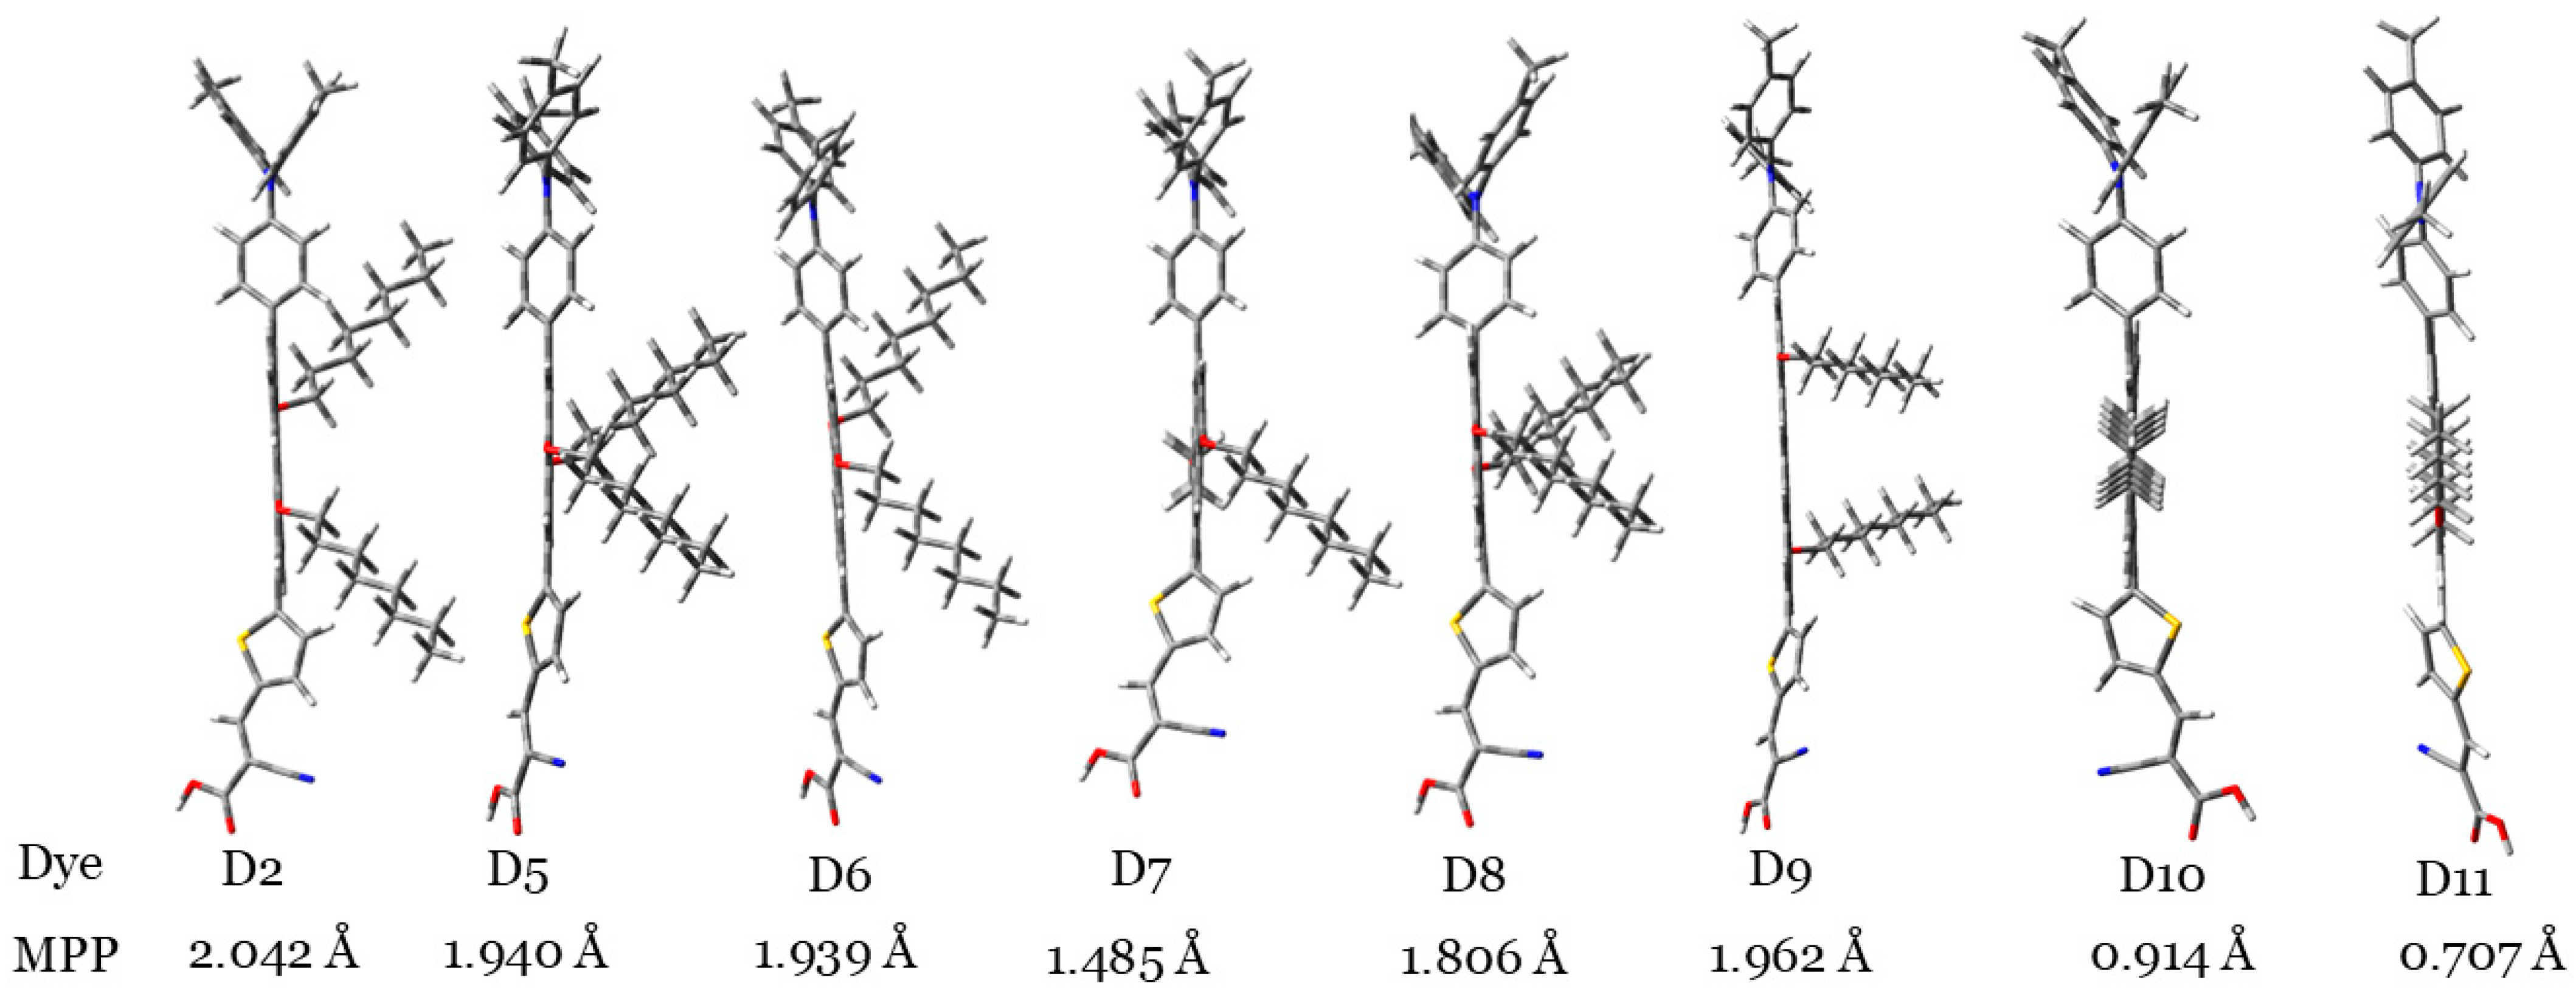
To illustrate the degree of planarity of dye molecules, Figure 2 shows the dye molecules vertically. By looking at the orientations of the two alkyl groups in this figure, we can judge planarity. Figure 3 indicates that the D10 and D11 dye molecules showed more planarity compared to those of other dyes, since, in these two dyes, the two alkyl groups are coplanar with the aromatic cores. Also, to confirm this result, the molecular planarity parameter (MPP) was calculated [38]. MPP estimates the deviation of the whole molecular structure from the plane. Lower MPP values signify larger planarity. It is calculated utilizing the Multiwfn software (version 3.8) [39]. Accordingly, the planarity of the investigated dyes can be ordered as follows: D11 > D10 > D7 > D8 > D6 > D5 > D9 > D2.

3.1.2. Frontier Molecular Orbitals (FMOs)

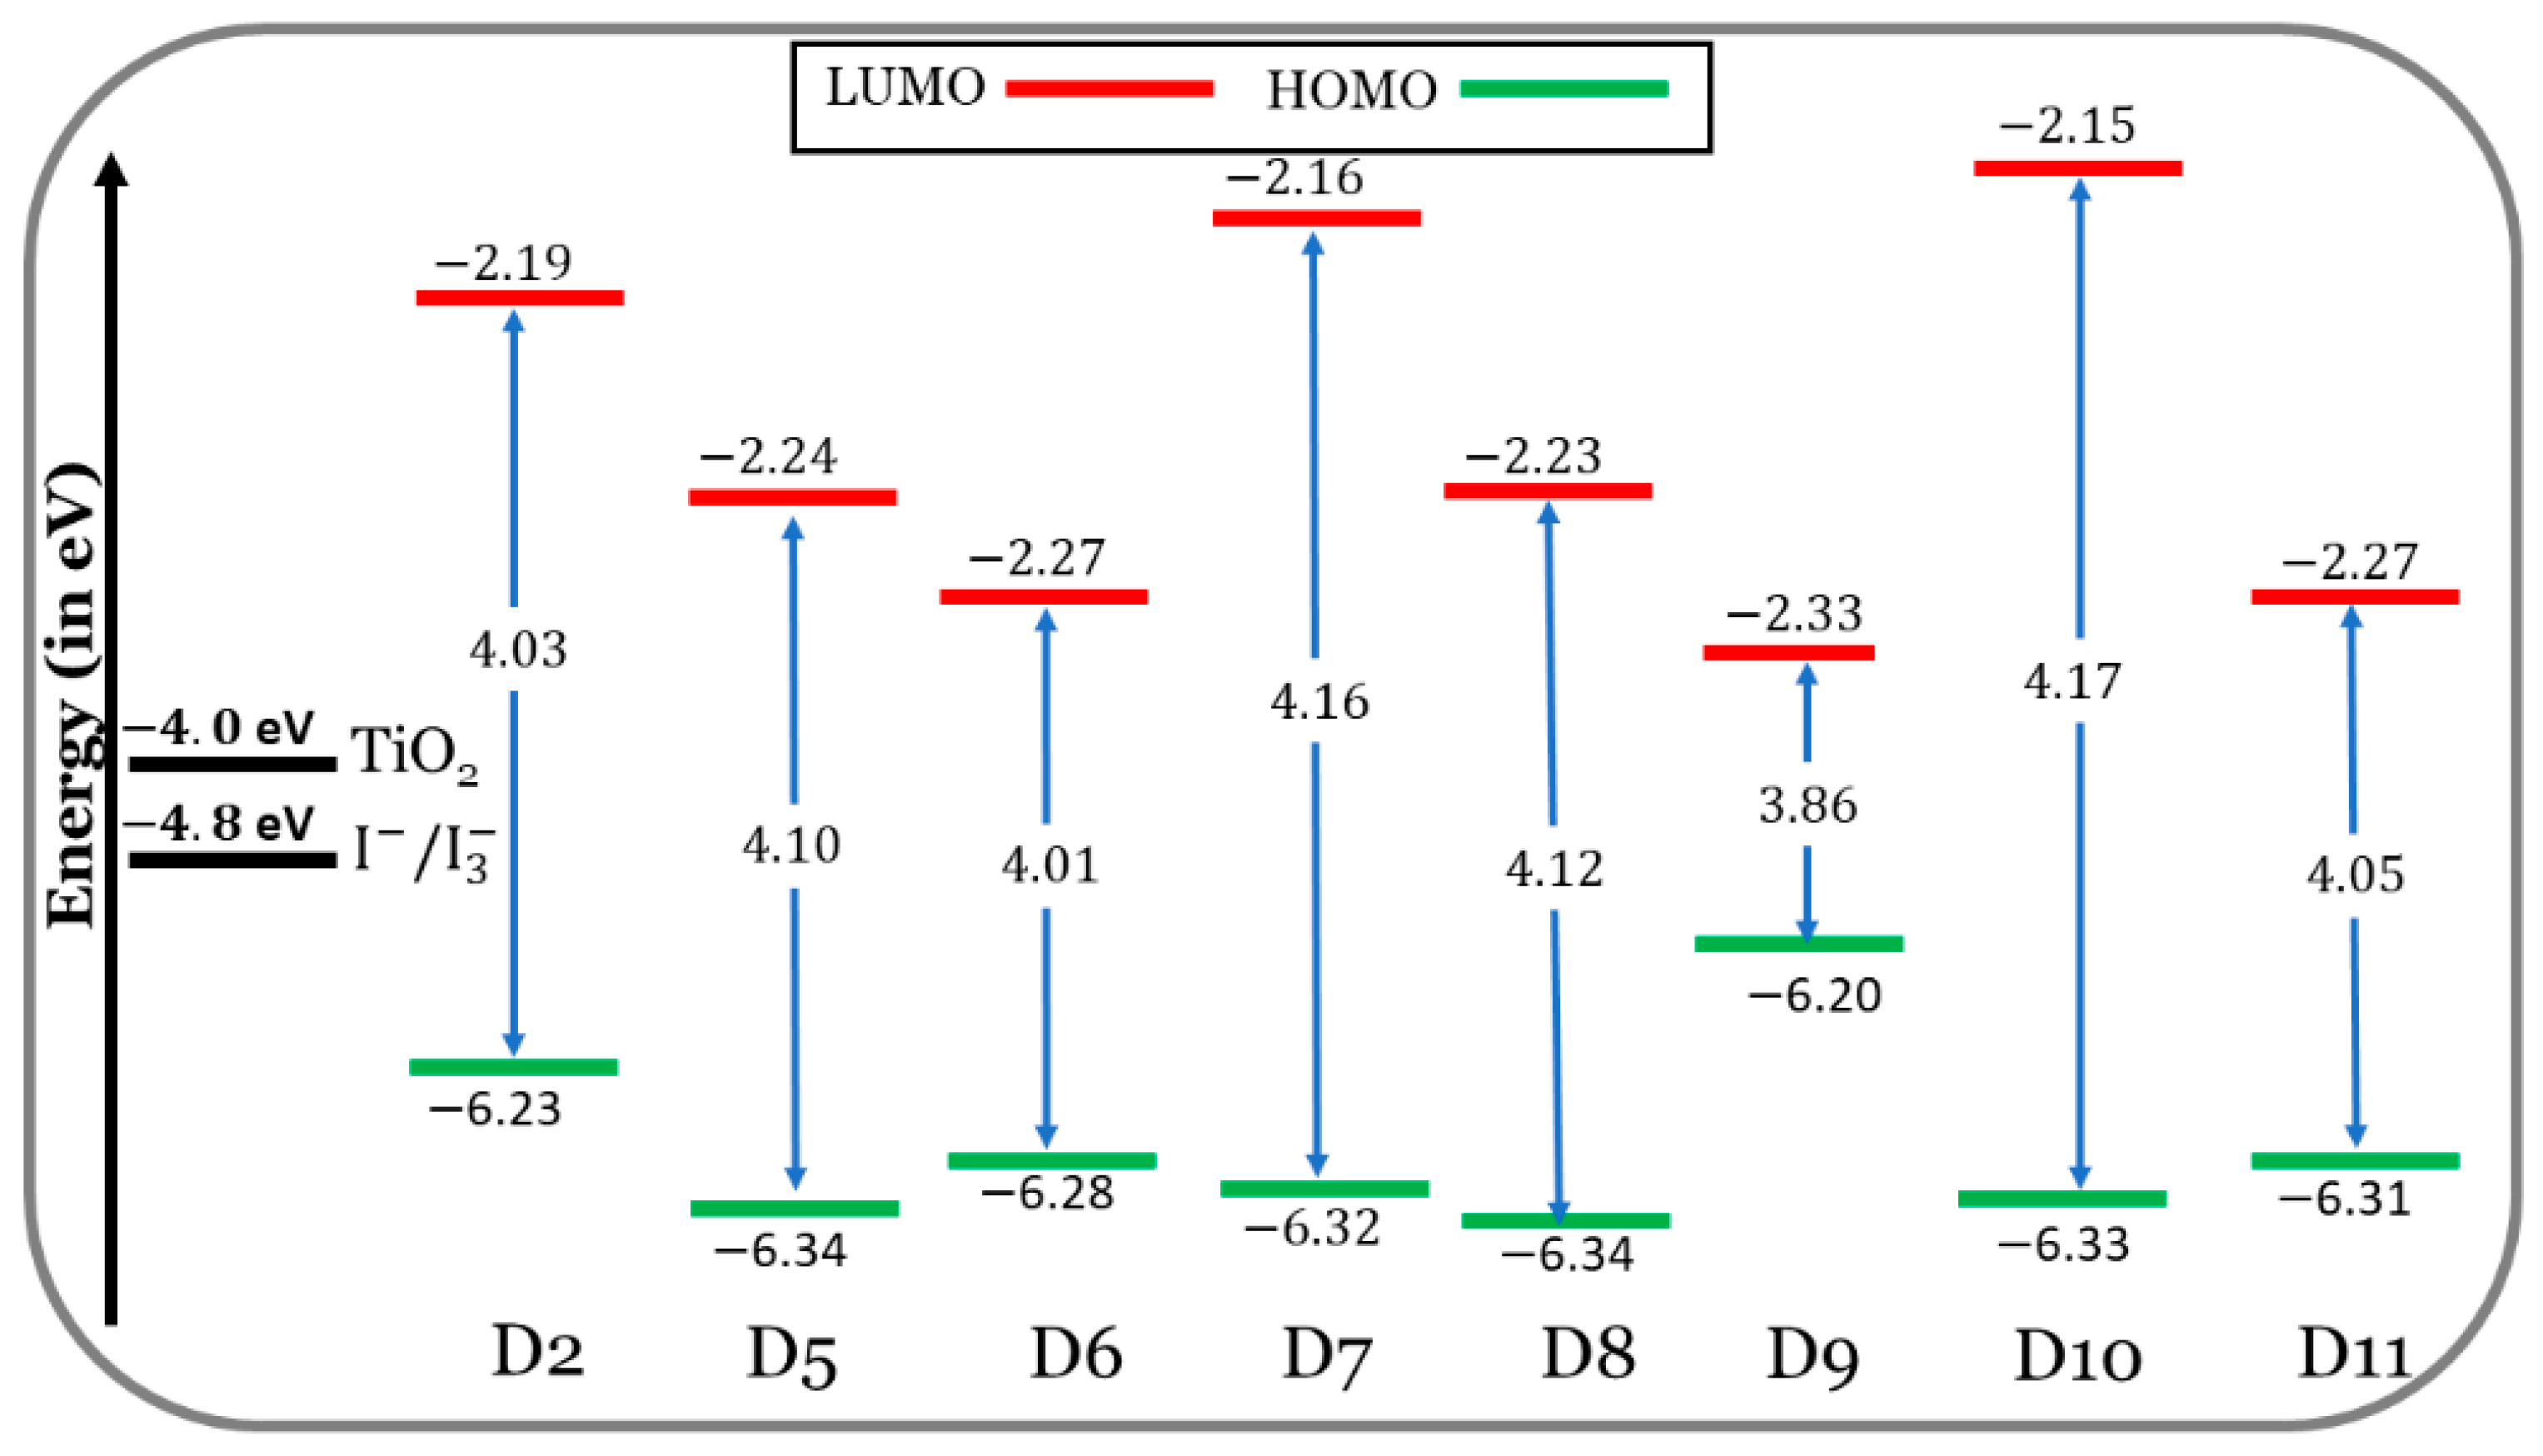
In Figure 4, at the CPCM/M06-2x/6-31+G(d,p) level of the theory, the FMO energy levels of the designed dyes (D5 to D11) are shown, along with those of the experimentally tested dye (D2) in the THF solvent. On the other hand, the alignment of the HOMO and LUMO energy levels of the TPA (triphenylamine), TPH (thiophene), and different π-bridge cores of the eight investigated dyes are discussed in the Supplementary Data (section: Additional Results and Discussion) and are illustrated in Figure S1. The designed dyes, with the appropriate HOMO and LUMO energies, aligned quite well with the redox potential (RP) of the I / I 3 electrolyte ( 4.8 eV) [40] and the CB of TiO2, in the present calculations, E C B T i O 2 = 4.0 eV [41,42]. Accordingly, the dyes designed are predicted to perform well during the key processes, i.e., dye regeneration and electron injection.
If the dye’s LUMO energy is above the semiconductor’s CB edge, this indicates that electrons are transferred from the excited state to the semiconductor in a favorable way. The LUMO levels of the designed dyes are situated in better positions compared to those of the D2 dye. In other words, the LUMOs of the designed dyes are above and much closer to the CB of TiO2. The electron injection from a closer LUMO is more thermodynamically favorable than from a farther LUMO level.
As compared to D2, the HOMOs of the designed dyes are lower in energy. An exception is the D9 dye. So, it is predicted that the dye regeneration process will be better for D2 compared to the designed dyes, and the D9 dye will be better than the D2 dye.
The energy gap is defined as follows: L H = E L U M O E H O M O . It is expected that lower energy gaps will favor ICT within the dye molecule’s skeleton and redshift, its absorption maxima. The values of L H decrease in the following order: D10 (4.17 eV) > D7 (4.16 eV) > D8 (4.12 eV) > D5 (4.10 eV) > D11 (4.05 eV) > D2 (4.03 eV) > D6 (4.01 eV) > D9 (3.86 eV). Only the D6 and D9 dyes (especially D9) show smaller energy gaps than the D2 dye, which means easier electron excitation and longer absorption wavelengths. This is evident in Section 3.1.3.

3.1.3. UV-Vis Spectroscopic Properties

In experiments, the D2 dye showed two absorption bands in the UV and Vis regions [15]. The UV band is more intense and is found at 329.77 nm, while the Vis-band intensity is lower at 460.36 nm. The difference between the calculated and experimental values of this dye is only 9 nm in the Vis band and only 21 nm in the UV band. Therefore, the calculated absorption wavelengths, as well as the level of theory used to calculate them (CPCM/TDCAM-B3LYP/6-31+G(d,p)), are reliable.
As with the D2 dye, the absorption spectra of dyes D5 to D11 also consist of two main bands. One ranges from 281.66 nm to 368.70 nm (UV region), and there is another band in the Vis region (in the range of 393.40 nm to 436.19 nm) (see Figure 5 and Table 2). Opposite to the oscillation strength values obtained for the four experimentally tested dyes in [15], here (the seven designed dyes), the f values of the Vis bands are larger than those of the UV region; therefore, the Vis bands are more intense than the UV bands. Because most solar light belongs to the visible and near-infrared ranges, this result is more beneficial [43]. As a general note, the λ a b s c a l c values of the designed dyes become redder and shifted (longer wavelengths) as the resonance energies of the aromatic rings increase. This has also been proven in the literature [17,44]. This conclusion is shown in Figure 6.
The oscillation strengths of the Vis bands are in the range of 0.938 to 0.987, while the values of the UV bands are in the range of 0.762 to 0.924. Compared with D2, the Vis bands of the designed dyes are slightly blue-shifted. Despite this, as we mentioned previously, they have better oscillation strengths and thus higher LHEs which enhance the J s c   values [45]. In addition, the transition character is attributed to molecular orbitals other than the LUMO and HOMO orbitals, implying that ICT is the predominant factor affecting these transitions rather than π → π* transitions. The charge density of the FMOs of isolated dyes involved in the major transitions is illustrated in Table 2.
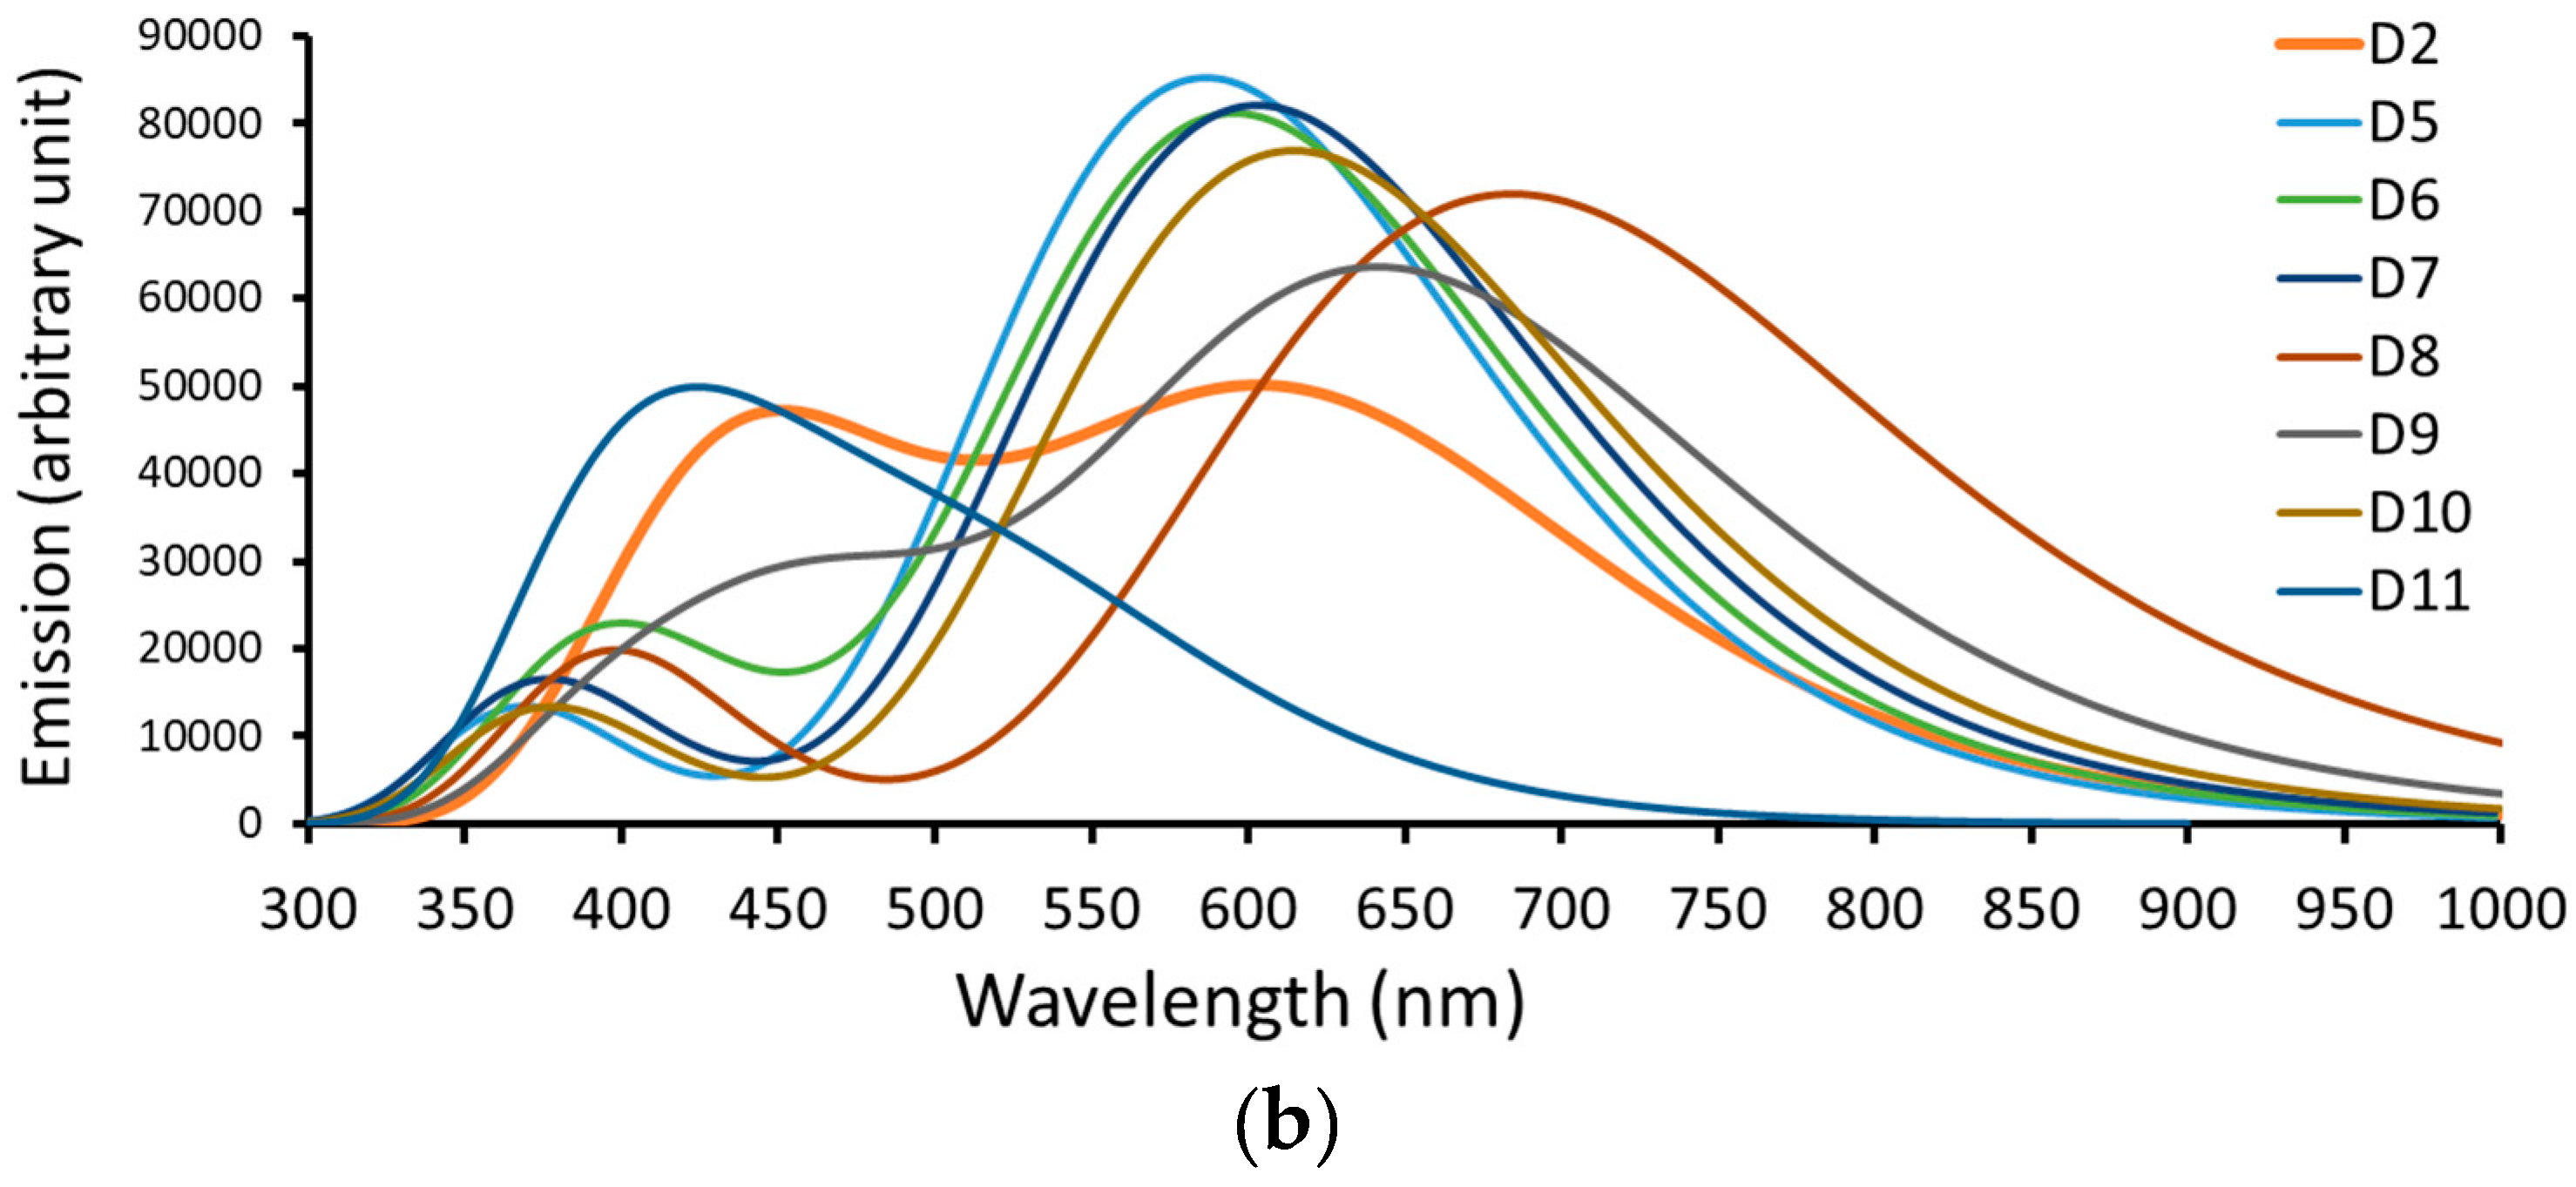
Table 3 lists the computed emission data calculated at CPCM/TDCAM-B3LYP/6-31+G(d,p) in the THF solvent, and Figure 4 represents the data graphically. Like the experimentally tested dye (D2), light from the dyes emits in the Vis region. The emission bands are significantly red-shifted from the absorption bands. The Stocks shift ( λ s s ) values range from 131 nm (D11) to 256 nm (D8). Compared to the other dyes investigated, the larger λ s s of the D8 dye predicts a larger difference between its ground and excited state geometries.
Table 3 shows τ (lifetime of the excited state calculated by Einstein’s transition probabilities [46]) values of the investigated dyes. In fact, by lengthening the τ value, more electrons can be injected into TiO2’s CB. The lifetime values of the photoexcited electron of the designed dyes are generally smaller than that of the D2 dye. An exception is D11 (perylene core with 529 kJ/mol resonance energy). The lifetimes of the photoexcited electron followed the order D11 (7.268 ns) > D2 (4.817 ns) > D9 (3.996 ns) > D8 (3.902 ns) > D10 (2.936 ns) > D7 (2.644 ns) > D6 (2.623 ns) > D5 (2.428 ns); hence, the electron injection process becomes less feasible in the same order.

3.1.4. Reorganization Energies, Transfer Integrals, and Intrinsic Mobility

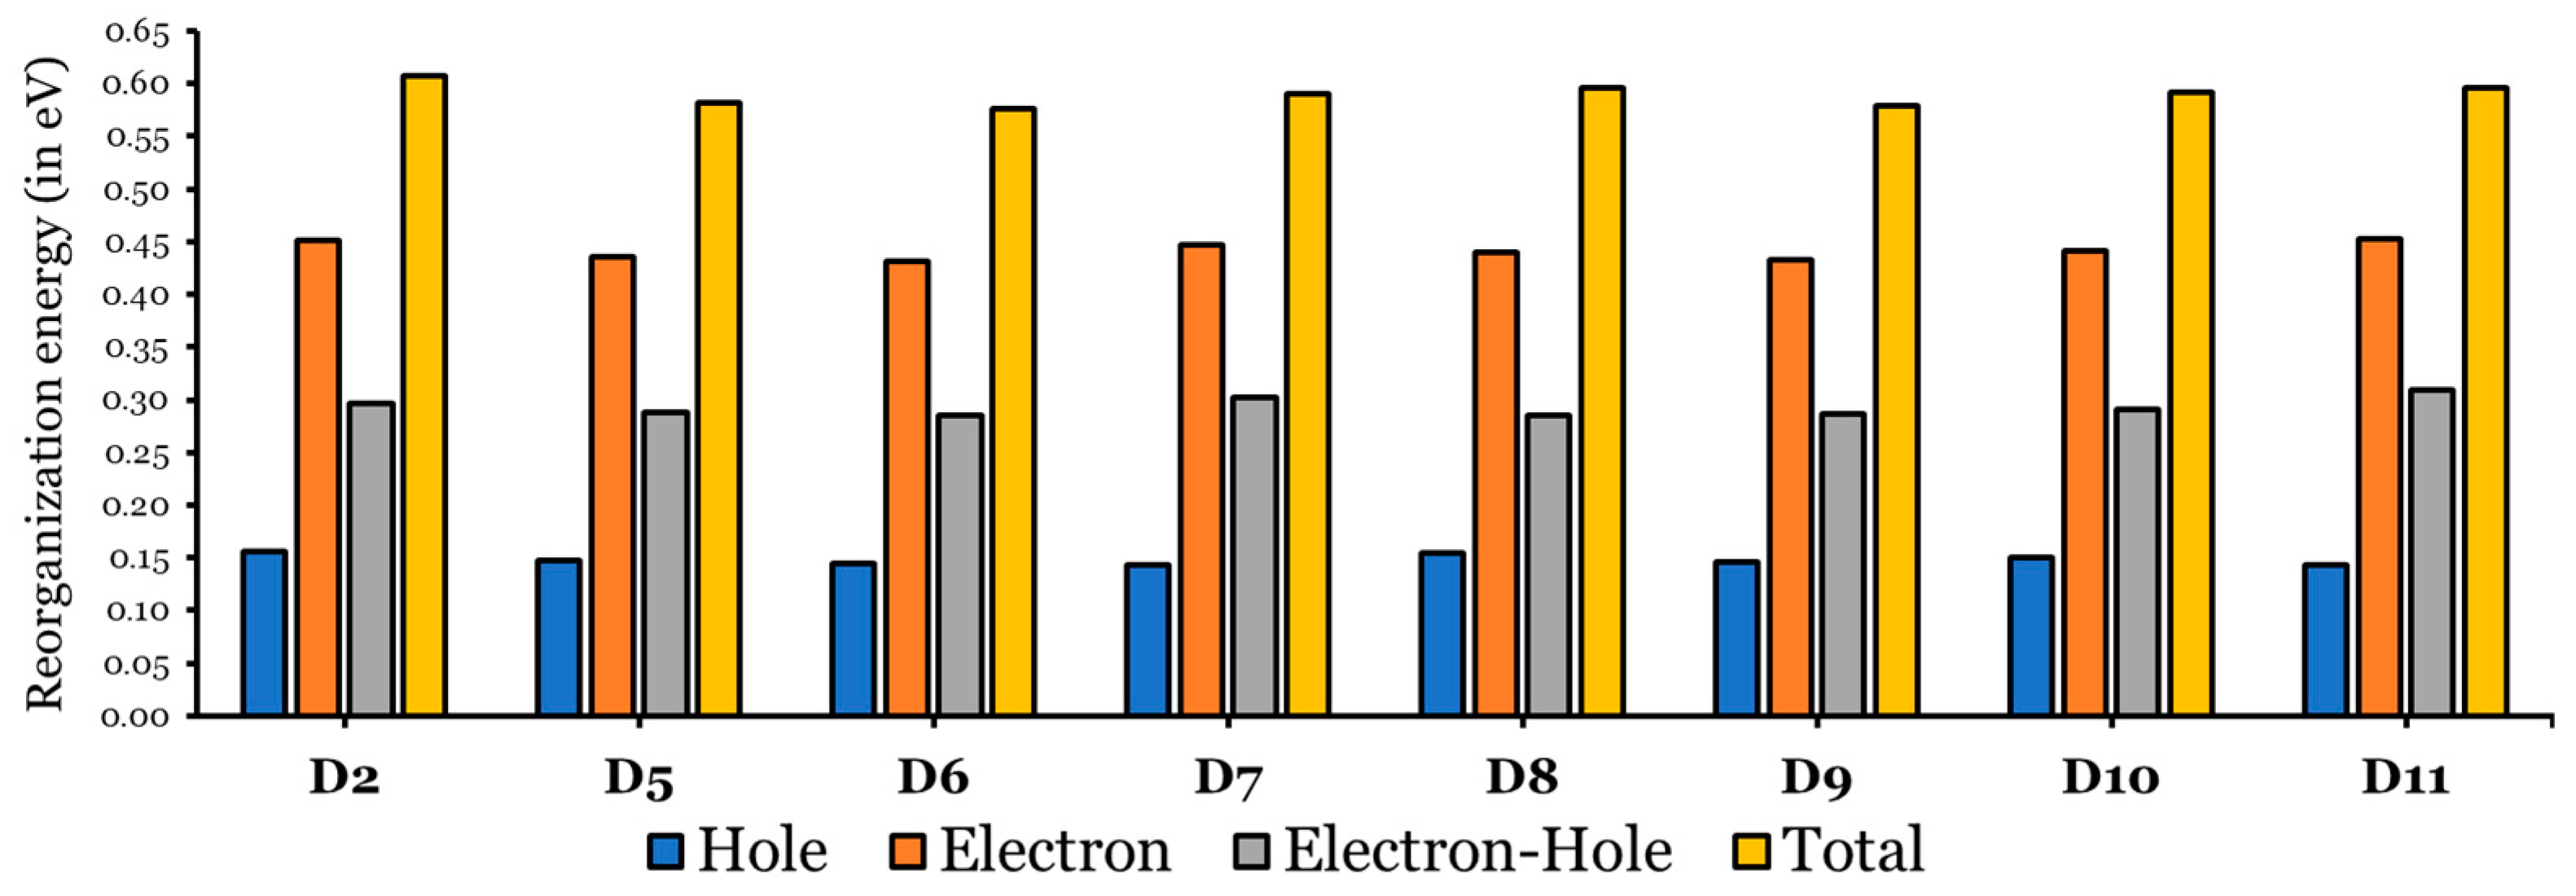
According to the Marcus electron transfer theory [47], for charge-transfer kinetics, a smaller reorganization energy gives rise to a higher rate constant. Figure 7 represents a bar plot of the electron and hole reorganization energies of the eight investigated dyes (D2 and D5 to D11) in THF, and detailed data are listed in Table S1.
The λ e l e c values are much greater than the λ h o l e values, indicating that the ability of all investigated dyes to transport holes is much better than their ability to transfer electrons [30,48], since λ e l e c values ranged between 0.431 eV and 0.453 eV, while the range of λ e l e c values are from 0.143 eV to 0.156 eV. Note that both regions are small.
In comparison to the D2 dye, the ability of the designed dyes to transfer holes is better than that of the D2 dye, since the λ h o l e values (range from 0.143 to 0.155 eV) of the designed dyes are smaller than the λ h o l e value of D2 (0.156 eV). In addition, the designed dyes (except D11 ( λ e l e c = 0.453 eV) can transfer electrons better than the D2 dye ( λ e l e c = 0.452 eV), since the λ e l e c values are within the range of 0.431 eV to 0.447 eV. Therefore, the designed dyes, having cores with smaller resonance energies, showed a better charge-transfer ability than the D2 dye [44]. Among the designed dyes, D6 shows the smallest λ e l e c , and D11 shows the smallest λ h o l e ; thus, they are predicted to perform the best as electron and hole transporter, respectively.
Additionally, the designed dyes showed better optimal electron–hole transport and smaller λ values. For D2, λ = 0.296 eV, while the λ values for the designed dyes are in the range of 0.286 eV to 0.291 eV. The exceptions are D7 ( λ = 0.303 eV) and D11 ( λ = 0.310 eV). Also, the total reorganization energy ( λ t o t = λ h o l e + λ e l e c ) values were calculated (see Figure 7 and Table S1). The λ t o t values of the dyes become smaller as the separation between the electron and hole becomes more effective. Due to this, recombination processes are rendered [45], and all the designed dyes have smaller λ t o t values compared to that of the D2 dye.
Based on the semi-classical model of the Marcus charge transfer [47,49], and by taking into account the π–π stacking configuration between two neighboring dye molecules (dimer), see Figure 8, one can calculate key parameters, including the following: (1) the charge-transfer rate (denoted by k C T + / ); (2) the electronic coupling matrix element ( V ) and holes ( V + ) between two dye molecules; and (3) hopping mobility ( μ h o p + / ), which helps calculate the dye’s electron or hole transport character. As can be seen in Table 4, these data are presented for each of the eight dye molecules investigated.
The hole/electronic coupling matrix element ( V + / ) of the dimer describes the coupling strength of hole–hole interactions/electron–electron interactions. These interactions strongly influence carrier mobility and charge transport rates [50,51]. A higher value of V + / is beneficial for charge transport when the coupling strength is high, because it increases charge mobility. For the dye molecules (D2, D8, D9, and D10) where V + < V , this indicates that the coupling strength of electron–electron interactions is larger than the hole–hole interactions. In this way, the electron mobilities of these dyes are much higher than the hole mobilities. The reverse is true with respect to the other dyes, i.e., D5–D7 and D11.
The hole transfer rate ( k C T + ) and electron transfer rate ( k C T ) values depend on two key parameters, and they are the hole/electronic coupling matrix element ( V + / ) and hole and electron reorganization energies ( λ + / ), as the molecule has a smaller λ + /   and a larger V + / , as it will have a larger k C T + / value [50,52]. For most of the investigated dyes, including D2, k C T + / > k C T , since the k C T + values range from 0.970 × 10 13 to 20.560 × 10 13 s−1, while the k C T values range from 0.026 × 10 13 to 0.179 × 10 13 s−1. Hence, the hole transfer rate is much better than the electron transfer rate in these dyes. These dye molecules will act better as hole-transporting materials than electron-transporting materials. These results are in accordance with the calculated λ + / values of these dyes. However, for D9,   k C T +   0.539 × 10 13  is larger but very comparable to its k C T   0.535 × 10 13 . Considering this, the D9 dye has a distinct advantage in that its electron and hole charge rates are comparable. The space distance ( l ) was measured as the distance between the two sulfur atoms in the two thiophene rings. Keep in mind that the π–π staking configuration of the core aromatic rings implies that their x  and y coordinates are very similar. The l values of most dye dimers are comparable and close to 3 Å. Mainly due to steric hindrance, the increase in l values followed the following order: D2 (3.437 Å) < D8 (3.557 Å) < D6 (3.755 Å) < D10 (3.783 Å) < D9 (3.843 Å) < D7 (4.523 Å) < D5 (6.216 Å) < D11 (6.965 Å).
The hopping mobility of the hole ( μ h o p + ) of the D2 dye dimer is greater than those of most other dye dimers, except the D7, D8, and D10 dye dimers. Meanwhile, the hopping mobility of the electrons ( μ h o p ) of the D2 dimer is smaller than most other dye dimers, except the D8 and D11 dye dimers. We should point out here that the hopping mobilities of each dye for electrons and holes are significantly different. For instance, for the D8 dye dimer, μ h o p + = 1.138  cm2 V−1 s−1 is higher than its μ h o p value by 1.4 cm2 V−1 s−1. However, this is not the case concerning the D9 dye dimer, since its hole and electron hopping mobilities are very similar and equal ~ 1.5 cm2 V−1 s−1. The D9 dye dimers have equal electron and hole hopping mobilities, as we concluded previously concerning its charge-transfer rates. The dye in a DSSC has a dual role: the oxidized state of the dye transfers electrons to the CB of TiO2, and the unoxidized state of the dye transfers holes to the electrolyte. The balanced ability to transfer the hole and electron of a dye gives an advantage for the total performance of this dye, which is the case for the D9 dye dimer.
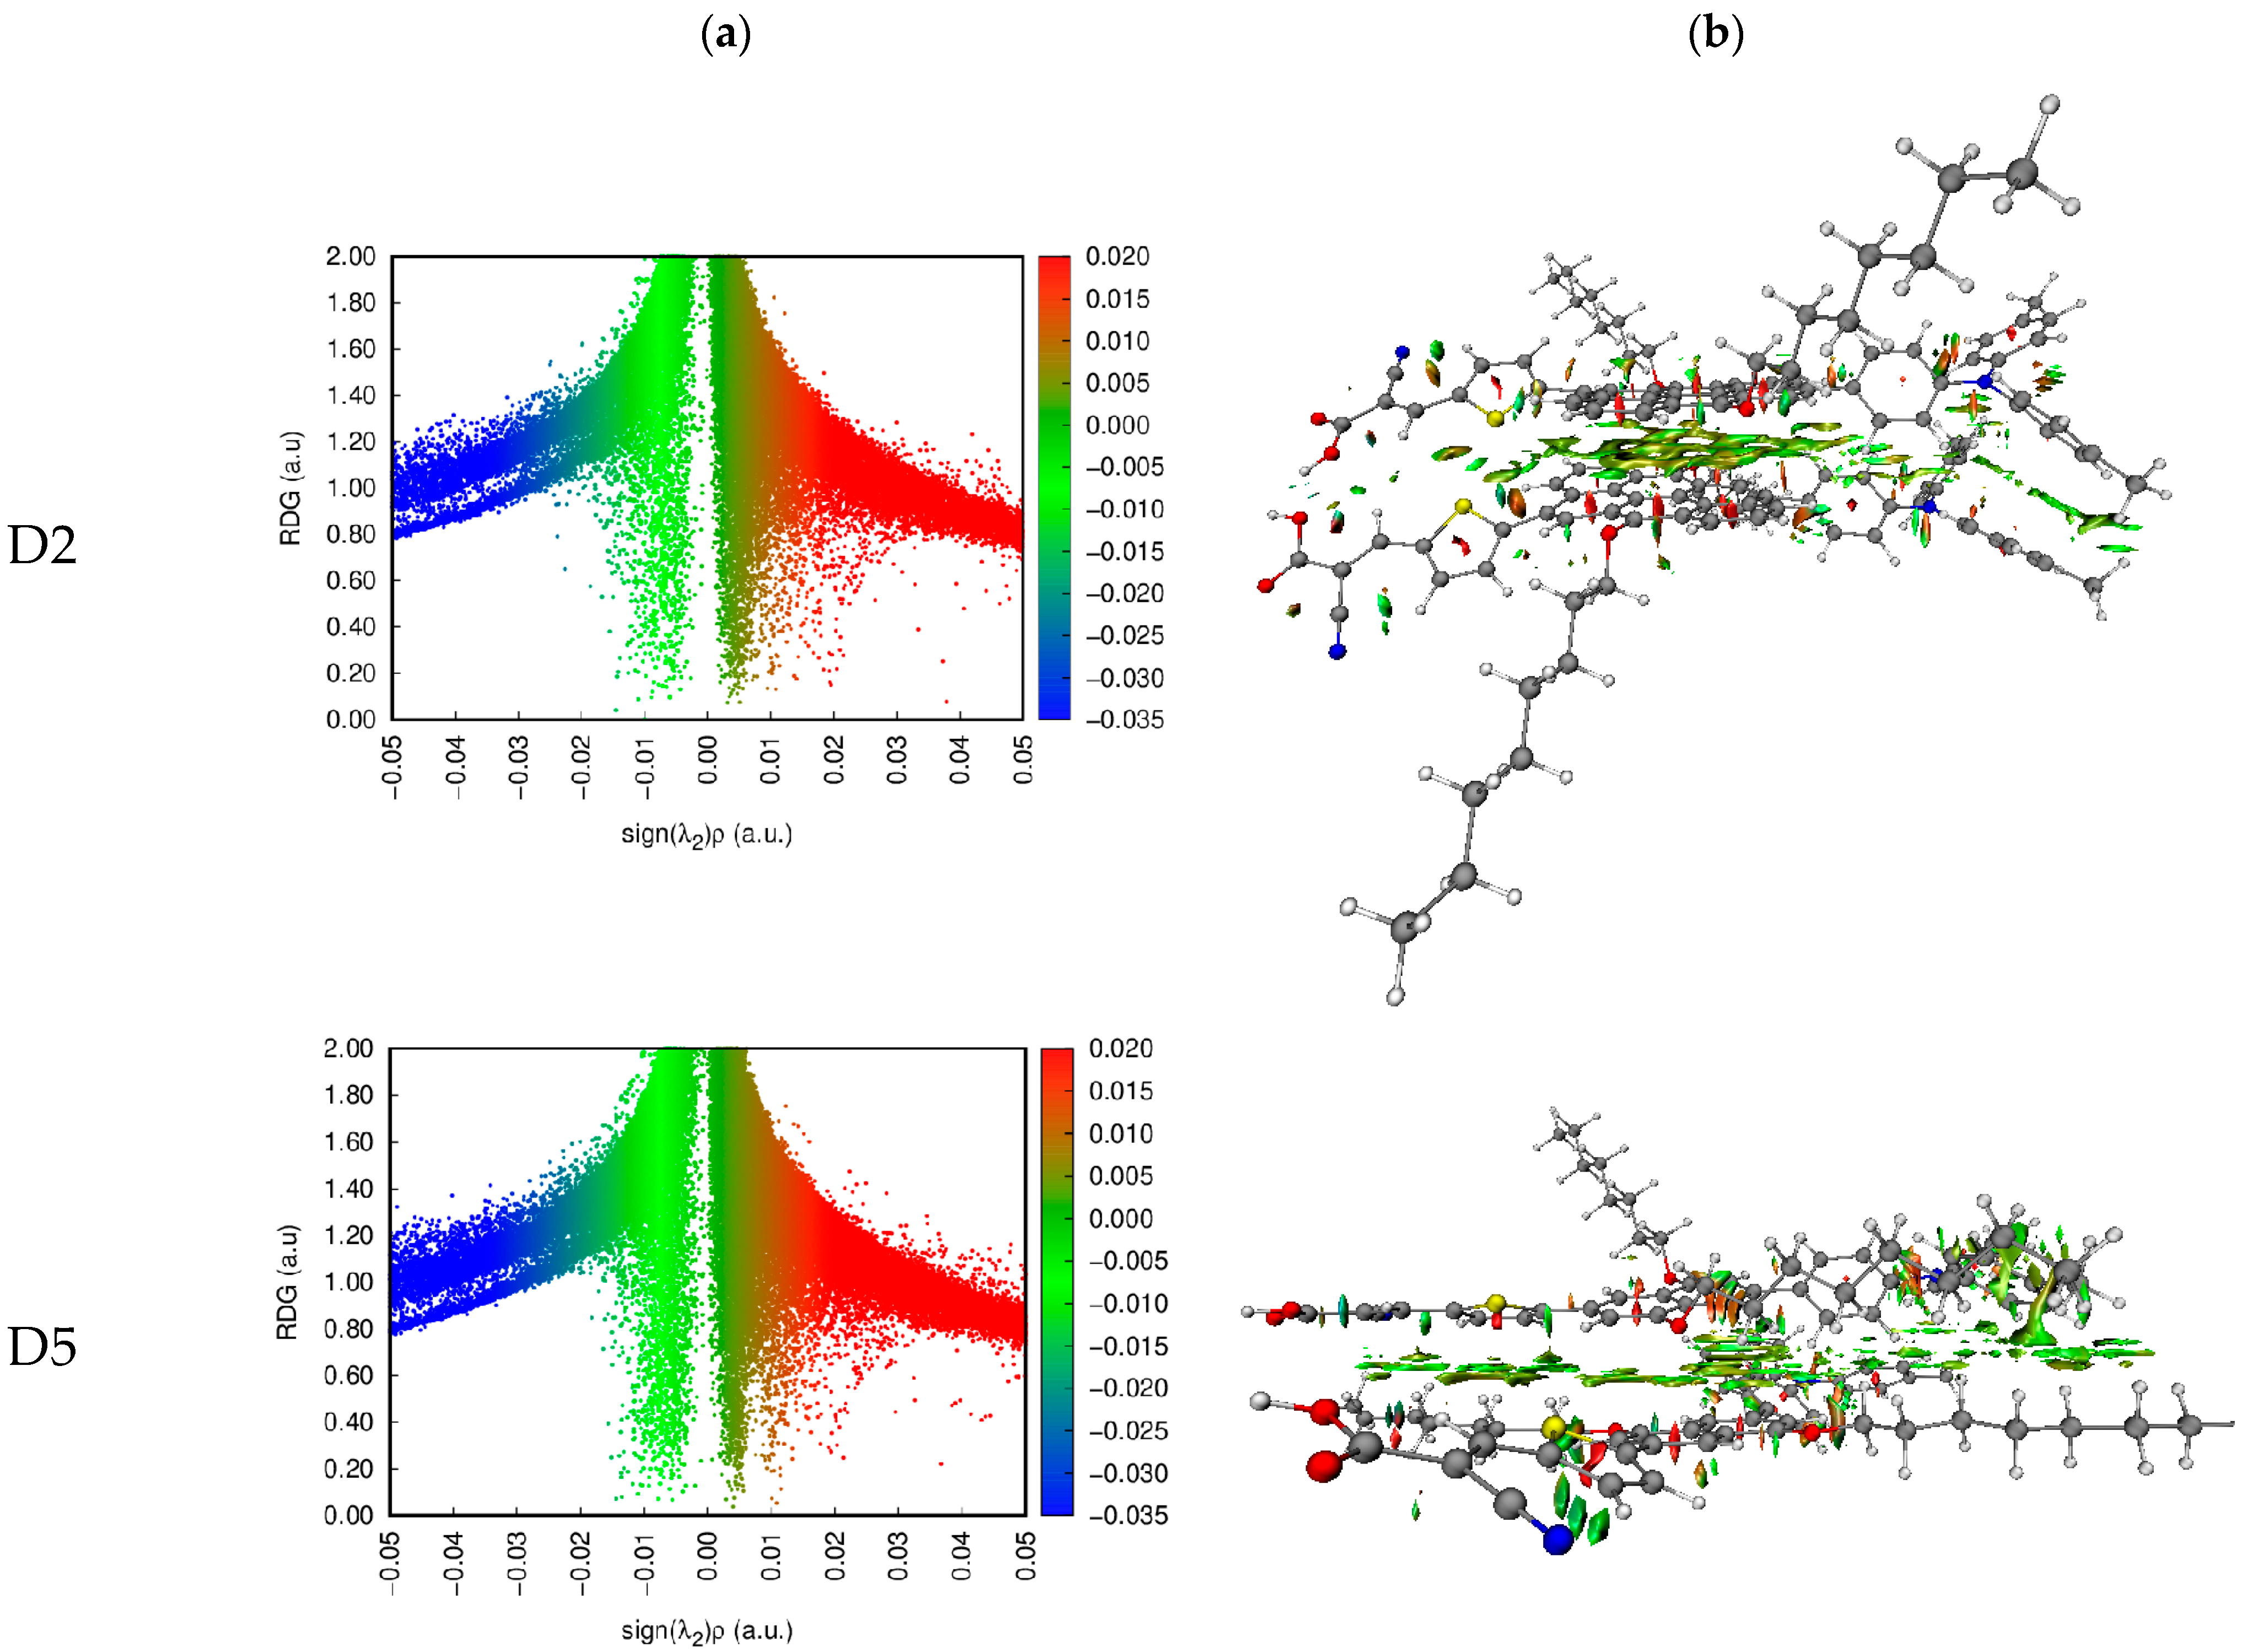
Johnson et al. [53] suggested the noncovalent interaction (NCI) approach. We can determine the types and regions of weak interactions in molecular systems by analyzing the electron density and its derivatives. This method represents van der Waals (VDW), steric clashes, and hydrogen bonds using only atomic coordinates as the input [53]. A gradient isosurface is colored according to the values of s i g n ( λ 2 ) ρ , and this is a good indicator of the strength of interactions. Large and negative values of s i g n ( λ 2 ) ρ are revealing of an attractive interaction (such as hydrogen bonding/dipole–dipole), while a large and positive s i g n ( λ 2 ) ρ is revealing of a nonbonding interaction. Values near zero reveal very weak VDW interactions.
The dye dimers were examined for their interaction. Two-dimensional scatter maps and 3D color-filled NCI-RDG isosurfaces of the D2–D2 and D5–D5 dimers at the CPCM/B3LYP-D/6-31G(d,p) in THF, as representative examples, are shown in Figure 9, and similar plots for the other dimers are found in Figure S3. A VDW interaction is indicated by the green region, a strong steric effect is indicated by the red region, and an H-bond attraction is indicated by the blue region. The 3D colored-filled RDG isosurfaces are more informative than the NCI-RDG 2D scatter maps (see Figure 8 and Figure S3). Although the two monomer molecules are in a π–π stacking arrangement, the aromatic cores face each other. The main interaction between them inside the dimer is due to VDW interactions (green plates), indicating the stability of such a configuration. As a result of the strong steric effect of aromatic rings, small red plates can be observed inside each of the monomer’s aromatic rings.

3.1.5. Le Bahers’ Intramolecular Charge-Transfer Indices

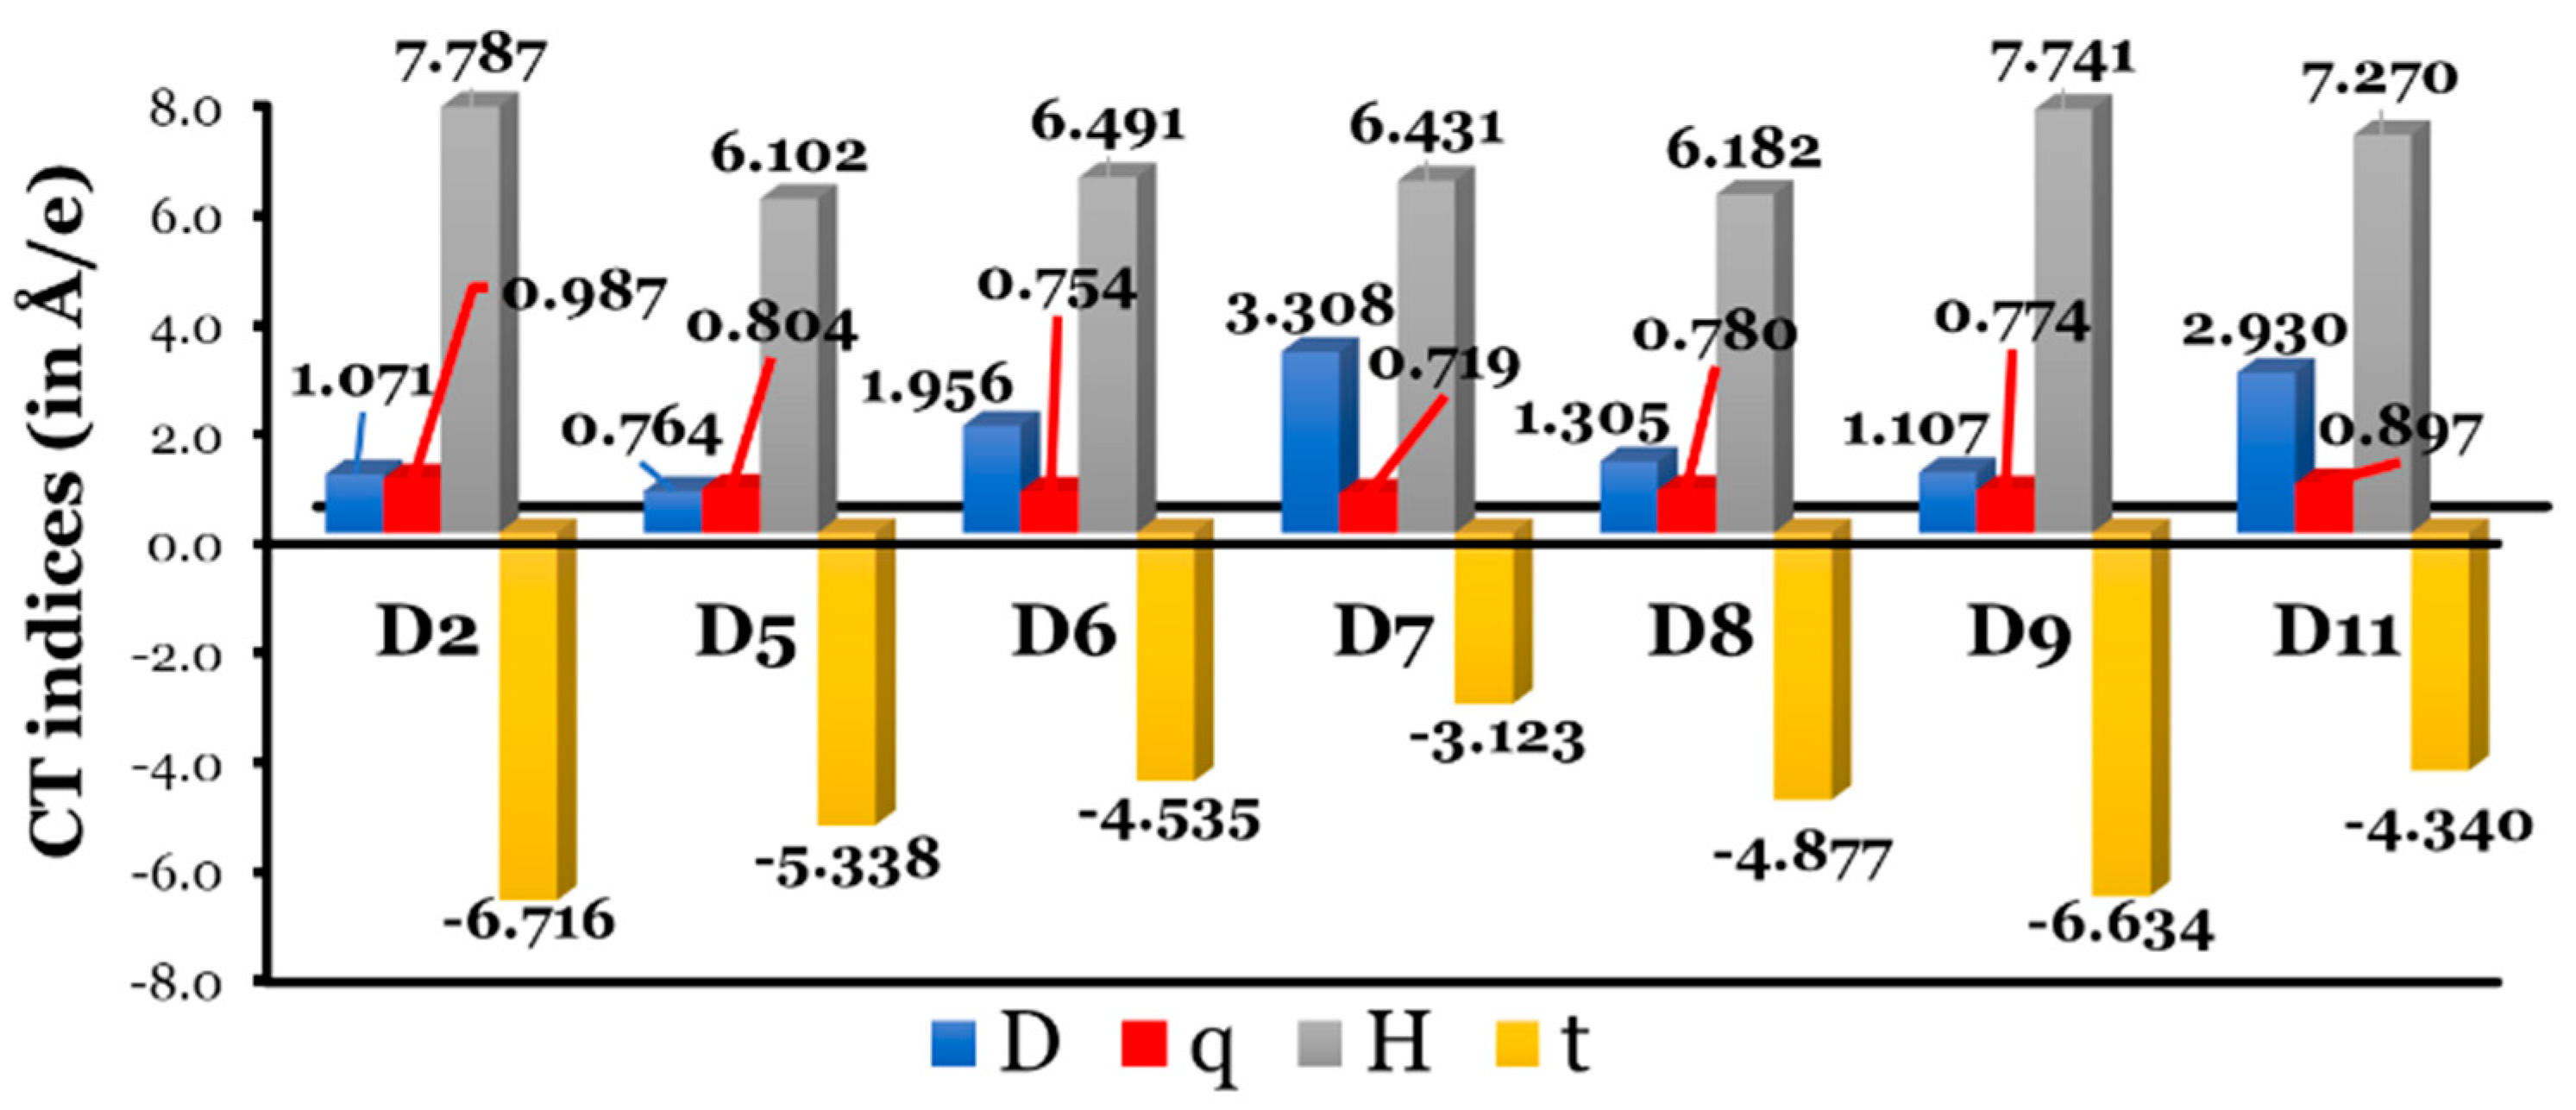
Since we are dealing with dyes that differ in their π-bridge aromatic rings, it is beneficial to estimate the ICT indices utilizing the code created by Le Bahers et al. [54]. A light-to-electricity conversion of a DSSC is made more efficient by ICT. Since the dye adsorbed on a semiconductor surface absorbs light and separates electrons from holes, a DSSC creates an electron–hole separation. So, the distance between the hole (positive region) and electron (negative region) should be large to enhance the ICT. Le Bahers’ model requires only the total electronic densities of the S0 and S1 states. The dye molecule can be considered as a push (D)–pull (A) rod-like molecule, and upon photoexcitation, the ground state (S0) D–A changes into an excited state (S1) D+–A. Through DFT calculations, we can obtain the S0 density, and through TD-DFT calculations, we obtain the S1 density. The CT indices calculated at the CPCM/TDCAM-B3LYP/6-31+G(d,p) in THF are listed in Table S2 and are represented graphically in Figure 10.
In general, larger intramolecular distances increase the efficacy of a DSSC. The charge-transfer distance ( D ) values increase as follows: D5 (0.764 Å) < D2 (1.071 Å) < D9 (1.107 Å) < D8 (1.305 Å) < D6 (1.956 Å) < D11 (2.930 Å) < D7 (3.308 Å). There is no clear correlation between the resonance energies of π-aromatic cores and the spatial distance between the ρ + and ρ regions associated with electronic excitation. In fact, the two cores with the maximum and minimum resonance energies, i.e., D2 and D5, respectively, recorded the lowest values of D . On the other hand, D7, with a phenanthrene core, recorded the largest value of D .
The amount of charge-transferred ( q ) values fall into small ranges, from 0.719 to 0.987 e, and increase as follows: D7 (0.719 e) < D6 (0. 0.754 e) < D9 (0.774 e) < D8 (0.780 e) < D5 (0.804 e) < D11 (0.897 e) < D2 (0.987 e). Clearly, the dye with the largest charge separation ( D value) has the smallest amount of charge transfer ( q value). The opposite is true regarding the D2 dye, i.e., D2 recorded one of the smallest D values and the largest q value. However, we cannot generalize the inverse relationship between the D and q values for the other dyes.
For all investigated dyes, an overlap between the centroids along the axis of charge transfer is expected, since the H index is D . Finally, the t index (quantify through-space excitations in ICTs) should satisfy three important criteria: (i) it should be smaller than 1.6 to accurately account for the transition energy [54,55,56]; (ii) it should be positive, since positive values of t are associated with a better separation between the areas of density increment and depletion, and (iii) an increase in the t value occurs with a reduced overlap between electron-donating and electron-accepting regions [57]. The recorded t values are all less than 1.6 and are negative, evidencing regions of high and low electron density overlap spatially [54,57]. The extent of overlap increases as the t values become more negative, and this follows the following order: D7 (−3.123 Å) > D11 (−4.340 Å) > D6 (−4.535 Å) > D8 (−4.877 Å) > D5 (−5.338 Å) > D9 (−6.634 Å) > D2 (−6.716 Å). In D2 (with the largest E R ), a region of high and low electron density overlaps the most, while all the designed dyes have a smaller overlap.
In conclusion, compared to the designed dyes and D2, the experimentally tested dye showed the smallest D value and the largest q and t values, which were unbeneficial for an effective ICT process. Thus, it is expected that the designed dyes will show better ICT characteristics. However, no clear relationship was detected between the E R and CT index values.
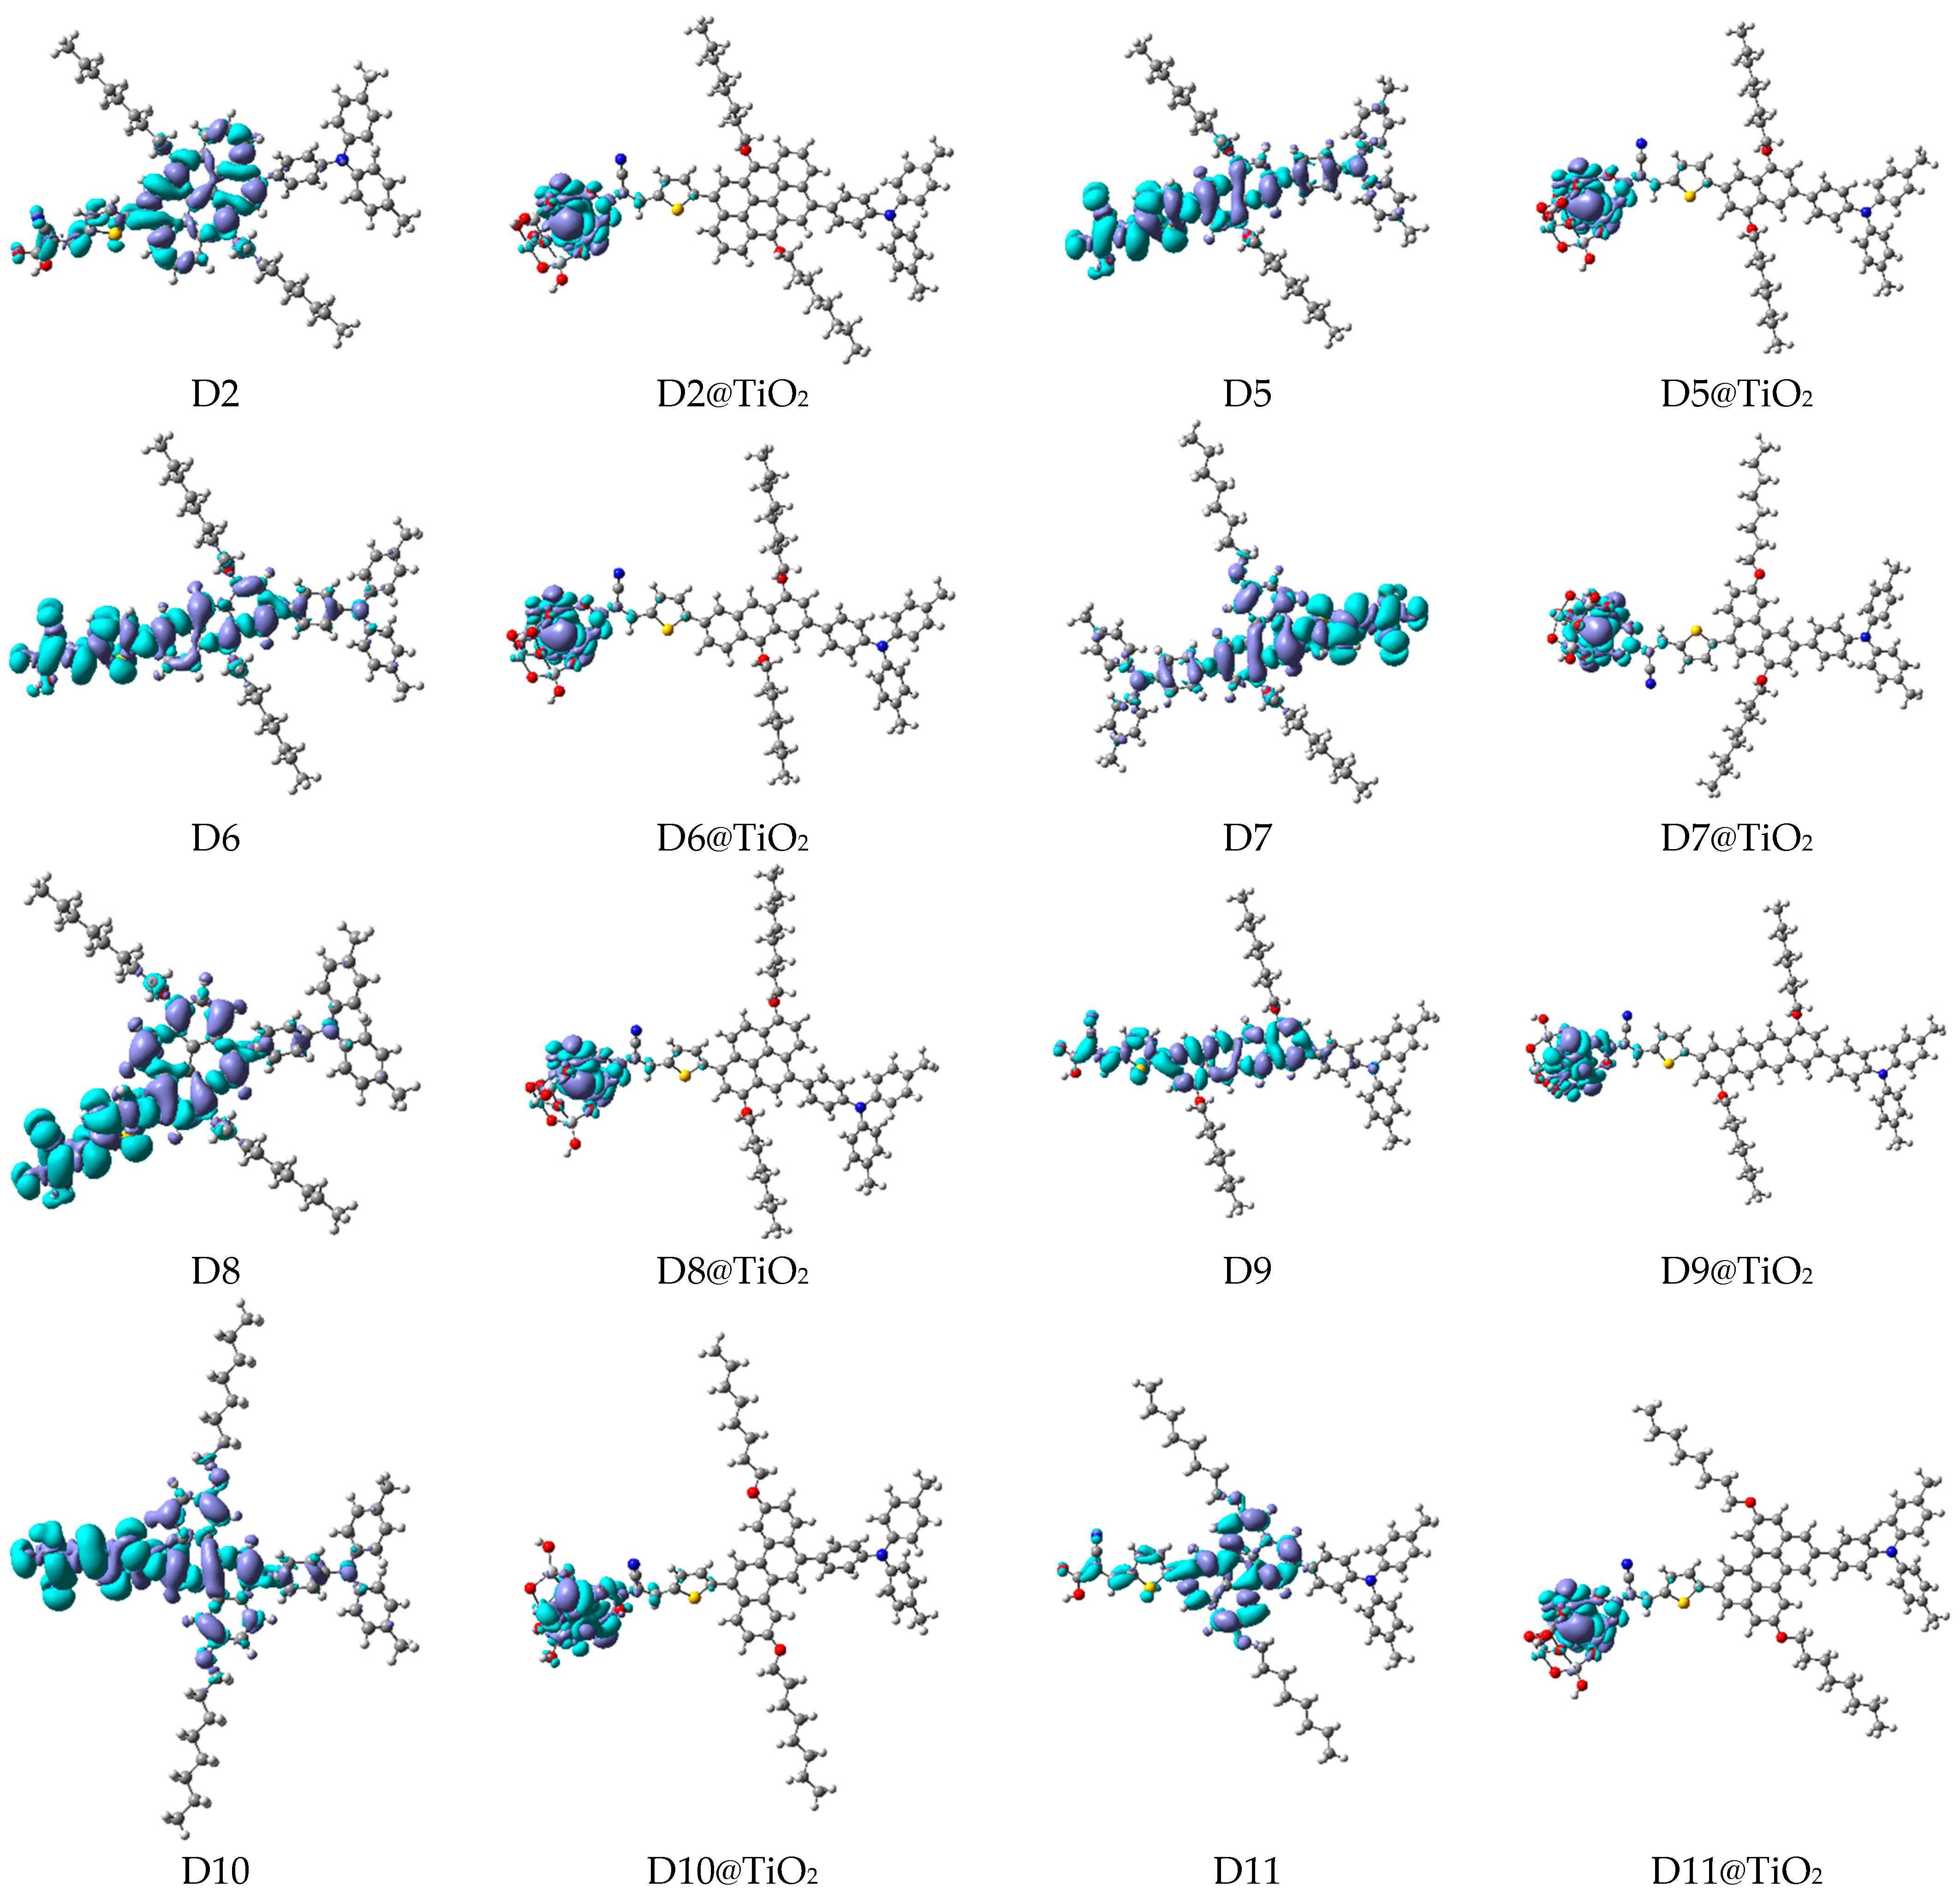
A visual illustration of ICT by mapping the electron density variation between S1 and So is shown in Figure 10. In cyan, the electron density is decreased, while in blue, it is increased. From Figure 11, the electron density of the π-linker, thiophane, and cyanoacrylic acid units is highest for all dyes, whereas the electron density of the TPA unit is the lowest. In other words, the electron density is the highest in units with a π-linker and acceptor and the lowest in units with donors. Therefore, it can be concluded that during the electronic transition So → S1, charges are transferred through the π-bridge from the donor to the acceptor [45].

3.1.6. Electron Injection and Dye Regeneration Free Energies

Charge injection into the CB, followed by dye regeneration, is highly dependent on the difference between a dye’s excited state oxidation potential (ESOP = E D y e * ) and TiO2’s CB, and the optimal value of the free energy of electron injection ( G i n j ) is   0.2 eV [37,58,59]. Meanwhile, the optimal difference between a dye’s ground-state oxidation potential (GSOP = E D y e ) and an electrolyte’s redox couple, the free energy of a dye regeneration, is G r e g   0.4 eV [37,58,59]. The values of the E D y e , E D y e * , E e x , G i n j , and G r e g of the eight investigated dyes calculated in THF at CPCM/TDCAM-B3LYP/6-31G(d,p) are listed in Table S3, and the values of G i n j and G r e g are represented graphically in Figure 12. The G i n j values of the investigated dyes range from 0.504 to 0.791 eV ( 0.2 eV, as required), and the G r e g values range from 1.436 to 1.582 eV ( 0.4 eV, as required). Negative values of G i n j indicate that a dye has sufficient driving force to ensure electron injection into TiO2. According to Figure 11 and Table S3, all the designed dyes have greater G i n j values than that of the D2 dye molecule, implying that the designed dyes have a considerably increased electron injection driving force [30,48,60,61]. The G i n j values increase (become more negative) as follows: D2 ( 0.504 eV) < D6 ( 0.516 eV) < D8 ( 0.518 eV) < D5 ( 0.582 eV) < D10 ( 0.724 eV) < D11 ( 0.750 eV) < D9 ( 0.764 eV) < D7 ( 0.791 eV).
It is necessary to have enough of G r e g to achieve efficient regeneration. The G r e g values of the eight investigated dyes are all negative, indicating that the dye has sufficient driving force to ensure a smooth dye regeneration process by the electrolyte. Also, the designed dyes have greater G r e g values than that of the D2 dye molecule, implying that the designed dyes can considerably improve the process of dye regeneration. An exception is the D9 dye, which has a smaller G r e g value compared to that of the D2 dye. Consequently, we conclude that the dyes designed in this study are promising candidates for improving the photovoltaic properties of DSSCs.

3.2. Dyes After Adsorption on TiO2 Clusters

It has been reported in the literature that either periodic models or clusters of TiO2 can be used to model dye@TiO2-adsorbed systems. To achieve a successful simulation of the optoelectronic properties of the adsorbed system with a low computational cost, small clusters have been used [17,30,37,62]. This work considers the anatase (TiO2)6H3 cluster to simulate dye@TiO2 complexes [63,64,65]. In this study, the dyes bind almost perpendicular to the TiO2 surface. After deprotonating the hydrogen of -COOH, oxygen atoms are attached to TiO2 clusters through a bidentate bridging mode [30,66,67]; therefore, the two monomers in the adsorbed system will be connected by two Ti–O covalent bonds. These two covalent bonds are designated as (Ti–O)1 and (Ti–O)1. The adsorption energies ( E a d s ) were calculated as follows:
E a d s = E d y e @ T i O 2 [ E d y e + E T i O 2 ]
E d y e @ T i O 2 is the energy of the optimized complex (dye@TiO2). E d y e and E T i O 2 are the energies of the optimized dye and TiO2 cluster, respectively. Reliable adsorption energy was obtained by adding hydrogen energies to the system.
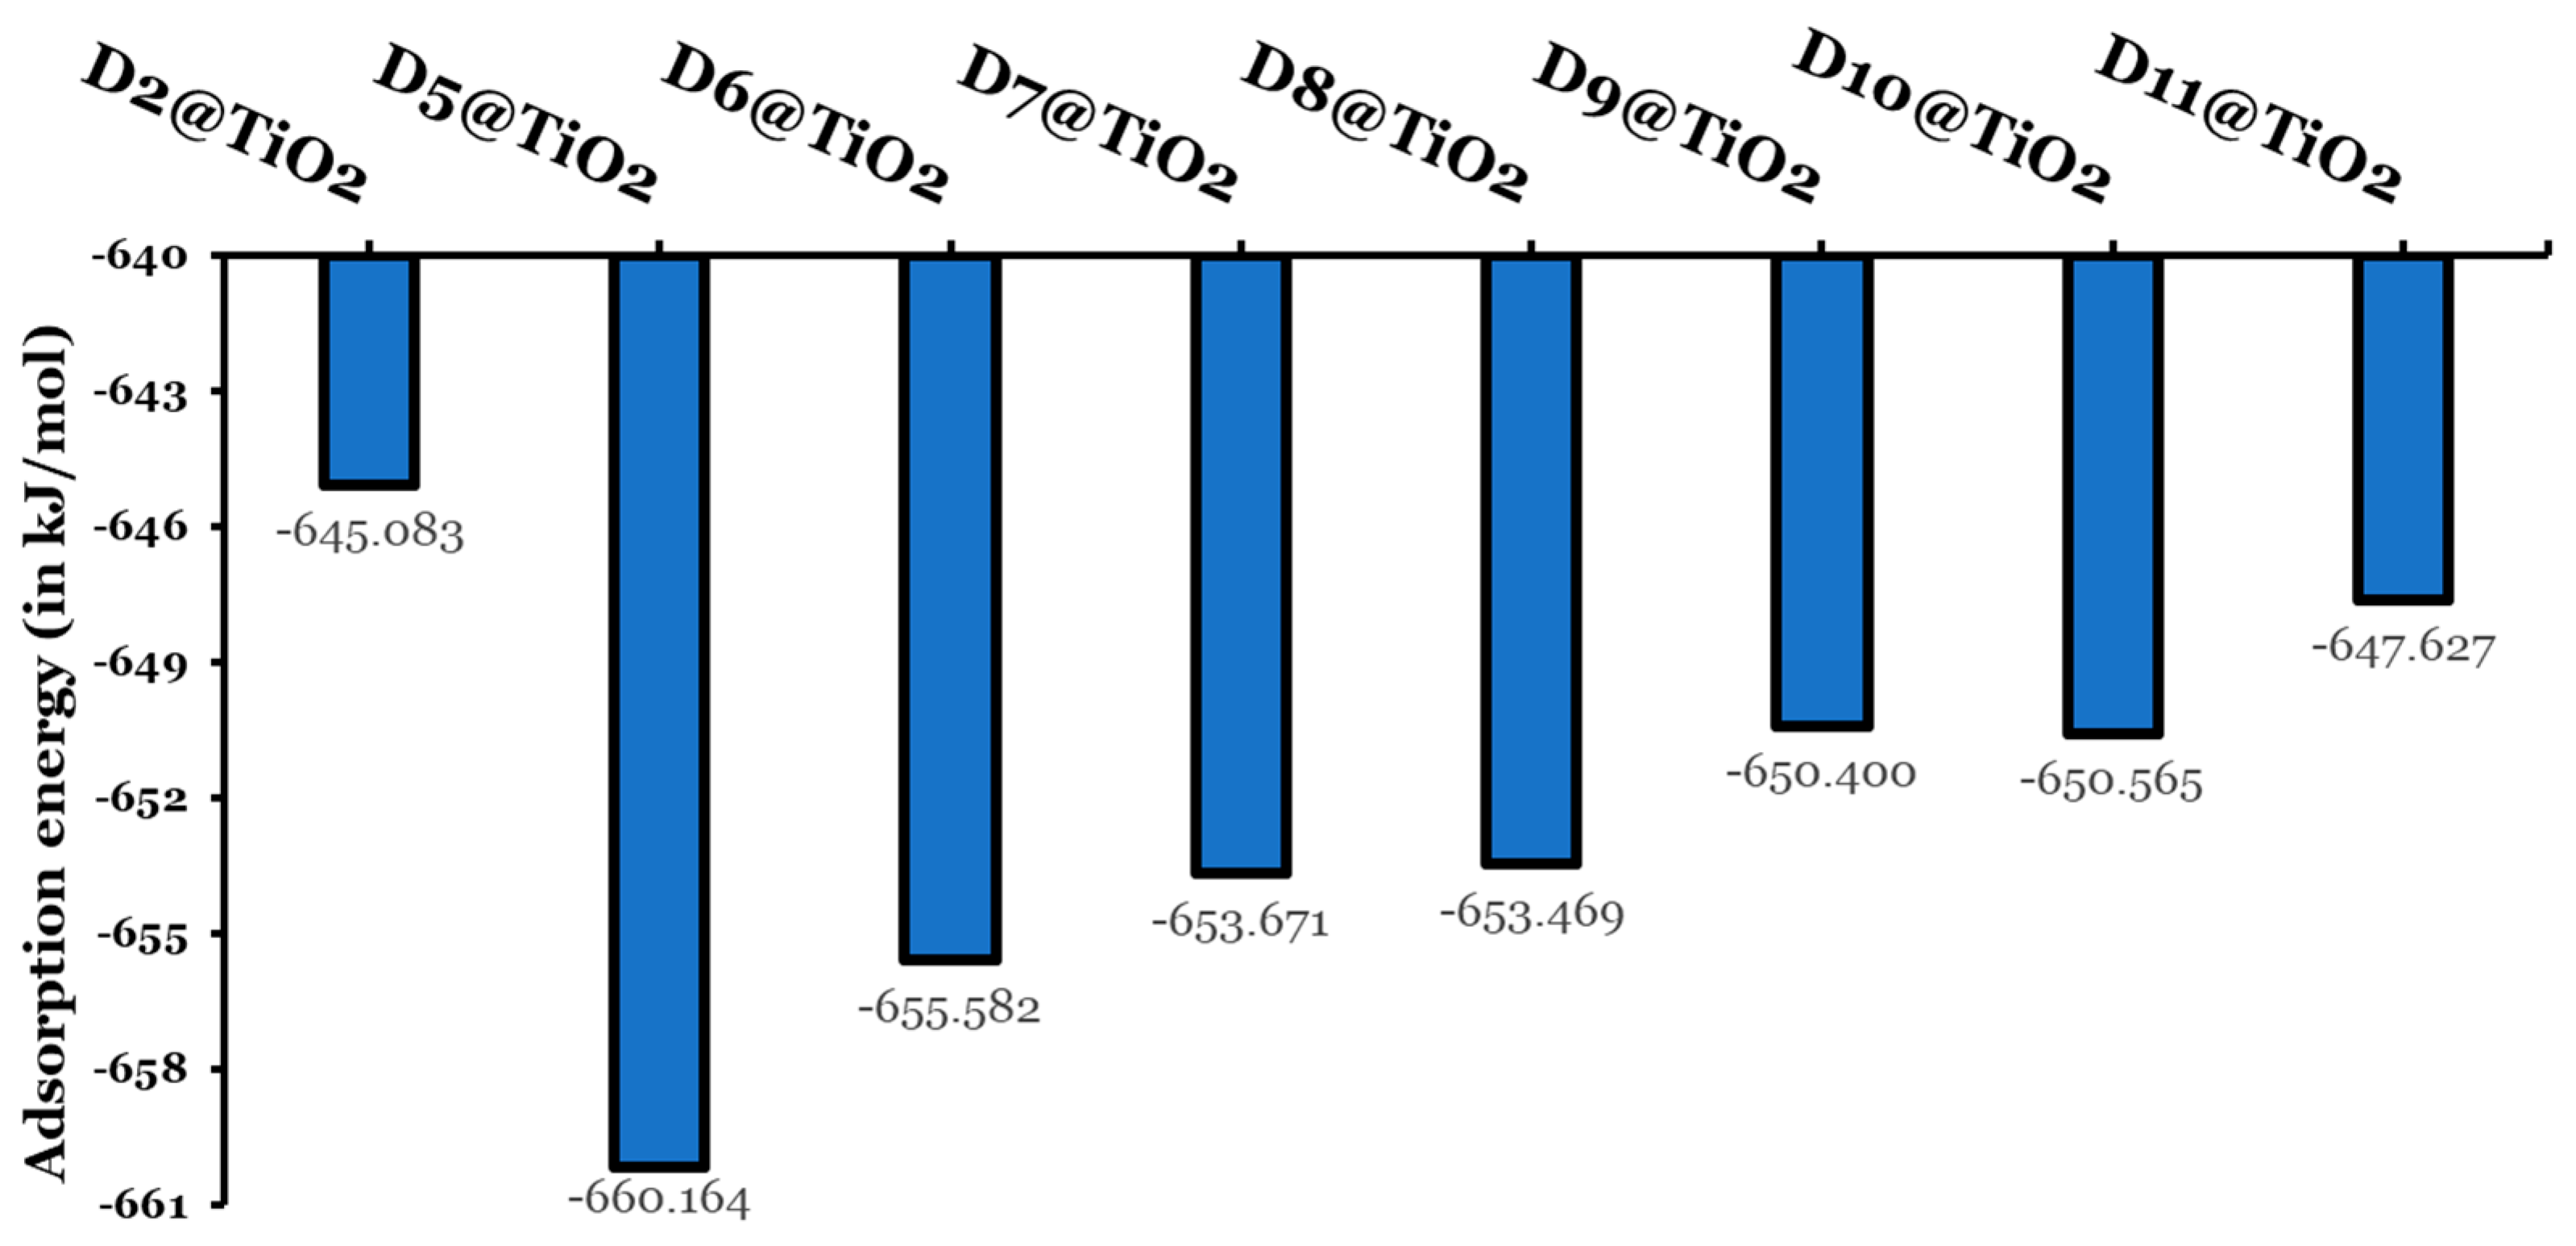
It is safe to assume that stable adsorption occurs when the adsorption energy is negative, see Table S4, and the data in Table S4 is illustrated graphically in Figure 13. Table S5 lists the bond lengths of the two Ti–O bonds between the dye and TiO2 cluster. Table S5 shows that the bond lengths of these two bonds in the eight investigated dyes are very comparable and are approximately equal to ~ 2 Å. They are in the range of 2.0377 to 2.0652 Å. The obtained bond lengths are in the same range reported in other theoretical works for other dye@TiO2-adsorbed systems [37,45,68]. Hence, a chemosorption type of adsorption may occur in these adsorbed systems [45], and this conclusion is supported by the reported values of adsorption energies, as we will see in the next paragraph.
The adsorption energies of the eight investigated dyes fall in the range of −645.083 to −660.164 kJ/mol. Larger adsorption energies indicate a chemosorption mechanism. In addition, larger adsorption energies are a sign of an increase in the electron transfer rate, leading to enhanced photovoltaic performance. The designed dyes reordered higher adsorption energies than the experimentally tested dye (D2). The D5@TiO2-adsorbed system reported the highest negative adsorption energy ( E a d s = 660.164 kJ/mol) and thus the most stable adsorbed system. The other adsorbed systems have larger (less negative) adsorption energies by not less than 4.6 kJ/mol and not more than 15.1 kJ/mol. The adsorbed systems can be arranged according to their increase in stability and decrease in their adsorption energies as follows: D2@TiO2 (−645.083 kJ/mol) < D11@TiO2 (−647.627 kJ/mol) < D9@TiO2 650.400 kJ/mol) < D10@TiO2 (−650.565 kJ/mol) < D8@TiO2 (−653.469 kJ/mol) < D7@TiO2 (−653.671 kJ/mol) < D6@TiO2 (−655.582 kJ/mol) < D5@TiO2 (−660.164 kJ/mol).

3.2.1. Optical Properties

The TiO2 nanoparticle surface was modeled using a small cluster of Ti6O12H3. The band gap ( C B V B ) of this cluster is 4.561 eV larger than 3.2 eV [69], and the experimental band gap of the TiO2 anatase is due to the difference in size. However, the S0 → S1 optical gap was calculated to be 3.42 eV. The deviation (0.22 eV) is minor from the experimental value [69]. On the other hand, the obtained band gap is very close to the reported values of band gaps for other similar small clusters [30,37,45,62]. The HOMO–LUMO energy gaps ( L H ) of isolated dyes are larger than the energy gaps of their adsorbed systems. The difference between the two datasets is not less than 0.081 eV nor more than 0.161 eV. This trend indicates an enhancement in the charge transport properties upon adsorption [45]. The L H values of adsorbed systems show a decrease in the following order: D10@TiO2 > D7@TiO2 > D8@TiO2 > D11@TiO2 > D5@TiO2 > D6@TiO2 > D2@TiO2 > D9@TiO2. Hence, this is the order in which the charge-transfer ability increases. The shift of the CB of the semiconductor ( C B ) when the dye is adsorbed can be expressed using the following equation [70]:
C B = q . μ n o r m a l . γ ε 0 ε
where q is the electron charge, γ is the surface concentration of the dye molecule, the μ n o r m a l of a dye molecule isolated from a semiconductor surface has a dipole moment perpendicular to its surface, and ε 0 and ε represent the vacuum permittivity and dielectric permittivity, respectively. On the other hand, the open-circuit voltage ( V o c ) can be calculated according to the equation below [70]:
V o c = E C B + C B q + k B T q l n n C B N C B R P q
q is the unit charge, E C B is the conduction band edge of the semiconductor, k B is the Boltzmann constant, T is the absolute temperature, n C B is the number of electrons in CB, and N C B is the density of accessible states in CB. Therefore, different dipole moments are anticipated to significantly affect the C B of TiO2, which in turn will affect the value of V o c . It has been reported that the higher the dipole moment ( μ n o r m a l ) of the adsorbed dye pointing outward from the TiO2 surface, the larger the V o c [71]. The μ n o r m a l values of the investigated dyes were calculated at the geometry of the dye adsorbed on TiO2, and they are recorded in Table S6. Some of the designed dyes have larger μ n o r m a l values compared to that of the D2 dye. The μ n o r m a l value of the D2 molecule is 9.963 Debye, and for D5, D6, and D9, they are larger, by 0.158, 0.286, and 0.511 Debye, respectively. For the other designed dyes (D7, D8, D10, and D11), their μ n o r m a l values are smaller than the D2 dye, by 0.572, 0.608, 0.435, and 0.267 Debye, respectively. Therefore, it is expected the three designed dyes (D5, D6, and D9) with larger μ n o r m a l values will produce larger V o c values compared to that of the D2 dye in a DSSC device. Of course, this is a general prediction, since other factors are affecting the V o c values, such as the charge distribution at the TiO2 surface [70].
Alternatively, the ground-state dipole moments of the TiO2- and dye@TiO2-adsorbed systems are also presented in Table S6. As we can see, the dipole moment of TiO2 is only 1.941 Debye, and after the adsorption process, the dipole moments of the dye@TiO2-adsorbed systems are elevated to a great extent, ranging from 5.847 to 10.674 Debye. In addition, the dipole moments of the three adsorbed systems, D5@, D6@, and D8@TiO2, are larger than their isolated dyes, indicating an elevation in their charge transport properties [45].
Figure S4 represents the total density-of-states (TDOS) plots of the dye@TiO2-adsorbed systems. We did not consider the partial DOS (PDOS) from each component in the dye@TiO2 systems, i.e., dye and TiO2, because the PDOS of a dye is expected to have a minor contribution to the TDOS [72,73]. The energy gaps ( L H ) of dye@TiO2 fall in a small region and decrease in the following order: D10@ TiO2 (4.053 eV) > D7@ TiO2 (4.000 eV) D8@ TiO2 (3.990 eV) > D5@ TiO2 (3.984 eV) > D11@ TiO2 (3.945 eV) > D6@ TiO2 (3.905 eV) > D2@TiO2 (3.883 eV) > D9@TiO2 (3.782 eV). This order indicates the order of increasing ICT properties of the dye@TiO2 systems with respect to each other.
The electronic absorption spectra of the dyes on the TiO2 substrate were examined using CPCM/TDCAM-B3LYP with 6-31+G(d,p) and LANL2DZ in THF. This study aims to investigate the relationship between spectroscopic properties and solar energy conversion efficiency. The UV-Vis absorption properties of the dye@TiO2 systems, such as the maximum wavelengths/energies and their oscillation strengths, transition, transition characters, and LHEs, are recorded in Table 5. A simulation of the absorption spectra is shown in Figure S5. Upon adsorption, the two maximum wavelengths are shifted to longer wavelengths (red-shift) for some dye@TiO2 systems and to shorter wavelengths (blue-shift) for other dye@TiO2 systems compared to the values of their isolated dyes. However, in all cases, the change (elongation or shortening) in the wavelengths is small and does not exceed 13 nm/0.11 eV. Similar to the observed red-shift in wavelengths with increasing π-linker resonance energies for isolated dyes, this trend is also evident in the values associated with adsorbed systems. The aromatic core of the D2 dye has the maximum resonance energy, showing maximum absorption wavelengths in the UV and Vis regions. The two maximum wavelengths of all other designed systems are shorter. The changes in the absorption spectra of the adsorbed dyes, including changes in intensity and shape, may result from the aggregation of dye molecules at the TiO2 surface. This aggregation may occur either through an H-type or a J-type aggregation, depending on the orientation of the dye molecules.
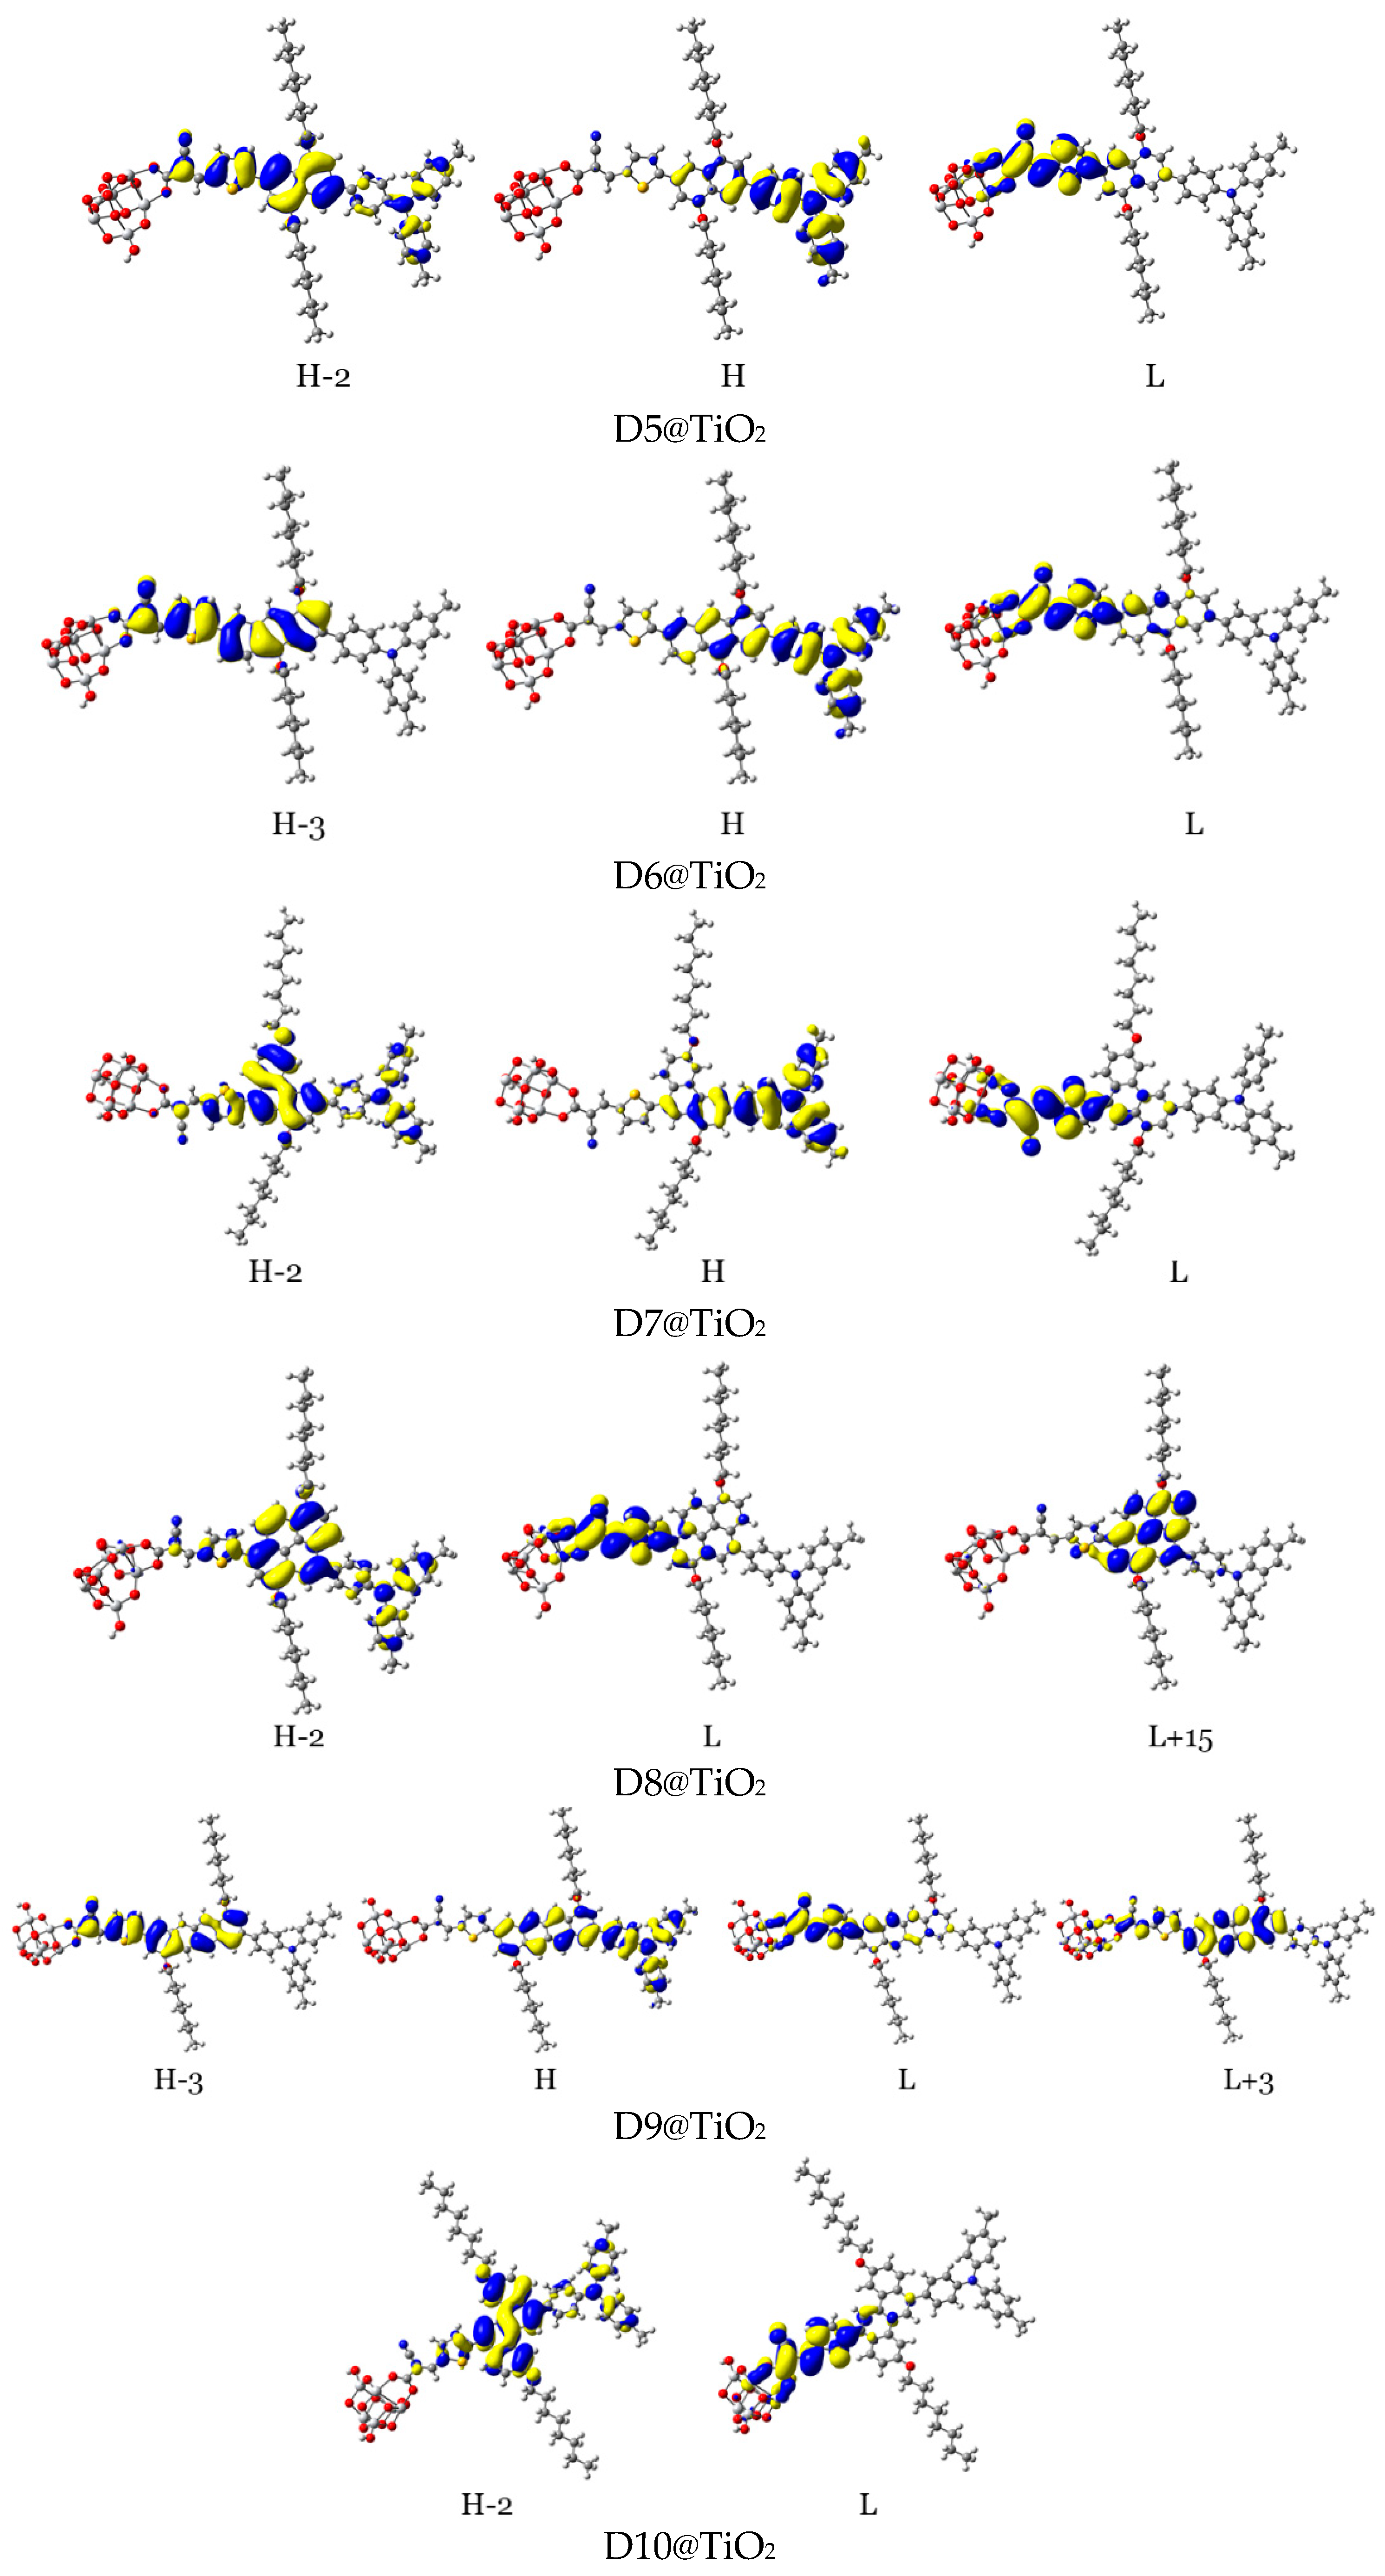
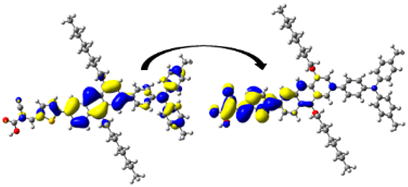
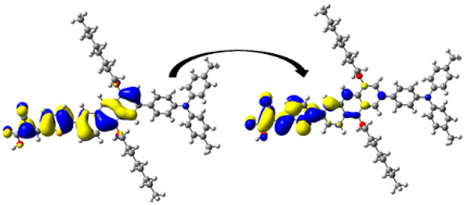
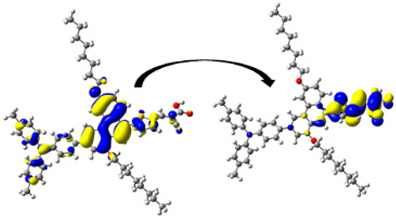
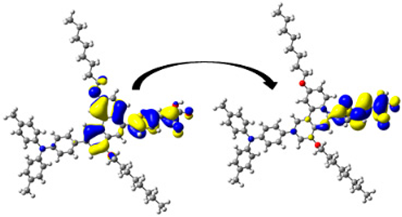
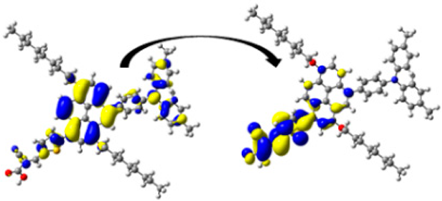
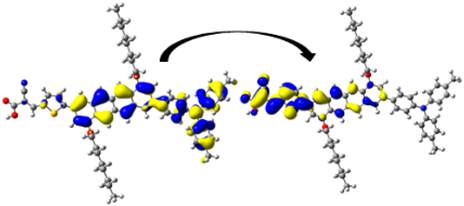
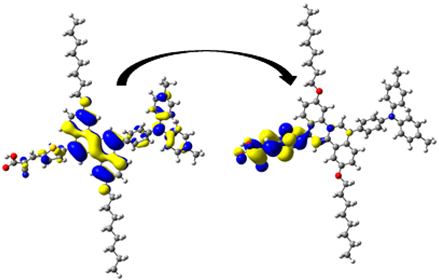
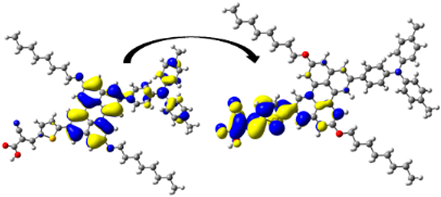
For efficient sensitization, it is required that the electron density of the highest occupied molecular orbitals (HOMO, HOMO−1, and other adjacent HOMOs) be located on or nearby the dye’s donor units, while that of the lowest unoccupied molecular orbitals (LUMO, LUMO+1, and other adjacent LUMOs) be distributed on the acceptor units and be close to the semiconductor moiety. In Table 5 and Figure 14, the density of charge of the dye@TiO2 clusters participating in the most important transitions is depicted. The major electronic transitions are attributed to HOMO/HOMO−1/HOMO−2/H−3 and to LUMO/LUMO + 2/LUMO + 3 molecular orbitals.
In the D2@TiO2 system, the most important transitions are from H → L and H−3 → L with 51 and 45% contributions, respectively [14]. An HOMO orbital is placed over an anthanthrene core and TPA unit, while an HOMO-3 orbital is located over an anthanthrene core and thiophene unit attached to a TiO2 cluster. LUMO orbitals are distributed on thiophene units and cyanoacrylic anchors. Now, we will discuss the distributions of HOMOs and LUMOs of the D5@TiO2 system as a representative example of the distribution in other designed dyes. The most important transitions in the D5@TiO2 system are from H−2 → L to H → L with 48 and 38% contributions, respectively. The H−2 orbital is located over the whole skeleton of the D5 molecule except the two alkyl units and TiO2 cluster, while the HOMO orbital is distributed mainly on the TPA unit. In contrast, the LUMO orbital is delocalized on the thiophene unit attached to the TiO2 cluster.
With no exceptions, we can generalize the distribution of LUMO orbitals on the thiophene unit (acceptor unit) and cyanoacrylic acid (anchoring group) attached to the TiO2 cluster for all investigated dyes. On the other hand, for other LUMOs such as L + 3, L + 4, and L + 15, the distribution is on the naphthacene core and thiophene unit of TiO2 in D9@TiO2 and mainly on the perylene core and pyrene cores in D11@TiO2 and D8@TiO2 clusters, respectively. Also, we can generalize that the major transitions in all investigated dyes involved a transition to LUMO orbitals. Also, we can say that the transitions occurred from the HOMO in most systems. Exceptions are D8@TiO2 and D10@TiO2, where major transitions were not involved the HOMO orbital but in other orbitals such as H-2 and H-3. In conclusion, in all adsorbed systems, comprehensible ICT from HOMO to LUMO orbitals was detected.

3.2.2. Maps of Molecular Electrostatic Potential and Electron Density Difference

The MESPs of the adsorbed systems of dye@TiO2 are presented in Figure S6. The MESPs of D2 and the designed dyes (D5 to D11) are quite similar, as in the case of the isolated dyes (see Section 4.2 in Additional Results and Discussion in SD). A key observation regarding the molecular electrostatic potential (MESP) of D2@TiO2 compared to the designed dyes is that D2 exhibits negative potentials from the π-linker core, along with the thiophene units. In contrast, the anchoring units (carboxylic group) and TiO2 clusters display positive potentials.
Conversely, in the designed dyes, the negative potential is localized primarily in the thiophene units, while the anchoring units and TiO2 clusters continue to exhibit positive potential. This observation may suggest a higher resonance energy of the anthanthrene core in D2 compared to the lower resonance energies associated with the cores of the designed dyes. Nevertheless, the distinct distribution of these electronic potentials facilitates charge separation, enabling efficient ICT from the dye to the TiO2 during the photoexcitation process. This, in turn, promotes effective charge injection. This conclusion can be confirmed by investigating the EDD maps of the adsorbed systems, see Figure 10, as follows. As we can notice, the EDD maps of the adsorbed systems show an accumulation of charge only on the TiO2 clusters. Therefore, during the photoexcitation from the ground to the first excited state, a complete CT occurs from the donor units through the π-linkers to the acceptor units, and finally, the total charge is delocalized on the TiO2 clusters for all investigated systems.

3.2.3. Overall Performance of the Designed Dyes

Table 6 lists the most important properties (electronic and electrochemical parameters) of the designed dyes, along with those of the D2 dye, in correlation with their structural properties (core structures, resonance energies, and degree of planarity) to evaluate the overall performance of these designed dyes.
In comparison with the D2 dye, the designed dyes D6 and D9, with lower E R values and a higher degree of planarity, show smaller L H values than the D2 dye, which means easier electron excitation and longer absorption wavelengths. All dyes harvest light efficiently within a range of 95–99%. In addition, the designed dyes (isolated and adsorbed) absorb light at longer wavelengths as their resonance energies of the aromatic rings increase. Obtaining the optimal values and negative values of  G r e g ( 0.4 eV) and G i n j   ( 0.2 eV), the designed dyes have greater G i n j and G r e g (except D9) values than that of the D2 dye molecule. This implies that the new design of dyes improves the processes of dye regeneration and electron injection.
The designed dyes show a favorable electron–hole transport (except D7 and D11) and the total reorganization energy, and thus, recombination processes are rendered. Finally, all dyes bind chemically to the TiO2 cluster, and the designed dyes show stronger adsorption with a red/blue shift in their light absorbance, indicating an aggregation of the dye molecules at the TiO2 surface. Notably, D9, with a naphthacene core and moderate E R (=460 kJ/mol), displayed balanced hole and electron hopping mobilities and a reduced energy gap, leading to excellent charge-transfer properties.

4. Conclusions

This study examines the impact of cores with varying resonance energies on the properties of anthanthrene-based dyes, utilizing DFT methods. An experimental validation of the computational approach was achieved through testing one of the dyes (D2) in a DSSC, which yielded good performance. The following conclusions were reached:
  • Although the designed dyes exhibit similar properties to D2 in energy-level alignment and molecular electrostatic potentials (MESPs), D2 outperformed the others by its higher HOMO energy.
  • D6 and D9, with lower resonance energies and greater planarity than D2, show smaller energy gaps, facilitating easier electron excitation and longer wavelength absorption.
  • All designed dyes demonstrate high LHEs (95–99%).
  • The designed dyes (isolated and adsorbed) absorb light at longer wavelengths due to increased resonance energies of the aromatic rings, with most exhibiting greater G i n j and G r e g values compared to D2, suggesting enhanced dye regeneration and electron injection processes.
  • Most of the designed dyes demonstrate favorable electron–hole transport properties, reducing reorganization energy and mitigating recombination.
  • All dyes bind chemically to the TiO2 cluster, with the designed dyes showing stronger adsorption and red/blue shifts in absorbance spectra.
  • D9, with a naphthacene core, shows moderate resonance energy, achieving balanced mobilities and reduced energy gaps for excellent charge-transfer characteristics.
Notably, the relationship between ICT and resonance energy is not straightforward, though the results highlight the importance of aromaticity in optimizing photovoltaic performance. In conclusion, the newly designed dyes exhibit enhanced electronic and electrochemical properties, making them promising candidates for use as photosensitizers in dye-sensitized solar cells, with implications for optimizing aromatic bridges in molecular photovoltaic applications.

Supplementary Materials

The following supporting information can be downloaded at: https://www.mdpi.com/article/10.3390/pr13020418/s1, Figure S1: Energy levels of FMOs of the π-cores of D2, and D5 to D11 dyes; Figure S2: Left: NCI-RDG 2D scatter maps, and right: 3D colour-filled RDG isosurfaces of investigated dye dimers at CPCM/M06-2x/6-31+G(d,p) in THF; Figure S3: Total density of states (TDOS) plots of the adsorbed systems of dye@TiO2; Figure S4: Simulated absorption spectra of dye@TiO2 systems in THF; Figure S5: MESPs of the eight investigated dyes in their isolated and adsorbed (on TiO2) forms at iso-value 0.1 au; Figure S6: ELFs of dye molecules before and after adsorption on TiO2; Figure S7: Dipole moments (μGS, μES and ∆μ) (in Debye) of D2, and D5 to D11 dyes; Figure S8: LHE and η relationship of D2, and D5 to D11 dyes; Table S1: Hole, electron, hole-electron, and total reorganization energies (λhole, λelec, ∆λ and λtot, respectively; Table S2: Le Bahers’s CT indices included the charge transfer distance D, H, t (in Å), and the amount of charge transferred q (in e) of the seven designed dyes along with those of D2 dye calculated at the CPCM/TDCAM-B3LYP/6-31+G(d,p) in THF. Note: data for D10 dye not converged and not included; Table S3: GSEO, ESOPs, EDye and EDye*, excitation energy Eex, and free energies of charge injection and dye regeneration, ∆Ginj, ∆Greg, respectively, (in eV) of the isolated dyes calculated at CPCM/TDCAM-B3LYP/6-31G(d,p) in THF; Table S4: Adsorption energies (in kJ/mol) and their energy components (in Hartree) of the eight dye@TiO2 adsorbed systems. Note: data of D2 dye are collected from ref. [17]; Table S5: Ti–O bond lengths of the dye@TiO2 adsorbed systems calculated at CPCM/M06-2x with 6-31+G(d,p) and LANL2DZ in THF; Table S6: Energies of HOMOs, LUMOs of isolated and adsorbed dyes, CB, and VB of TiO2, and their dipole moments (in Debye) calculated at CPCM/M06-2x with 6-31+G(d,p) and LANL2DZ in THF; Table S7: Ground state, excited state, and change dipole moments (μGS, μES, and ∆μ, respectively) in Debye; Table S8: Computed molecular parameters of the eight investigated dyes.

Funding

This project was funded by a KAU Endowment (WAQF) at King Abdulaziz University, Jeddah, under grant number (WAQF: 122-247-2024). The author, therefore, acknowledges, with thanks, WAQF and the Deanship of Scientific Research (DSR) for technical and financial support. The author acknowledges King Abdulaziz University’s High-Performance Computing Centre (Aziz Supercomputer) (http://hpc.kau.edu.sa) for supporting the computation of the work described in this paper.

Data Availability Statement

The original contributions presented in this study are included in the article/Supplementary Material. Further inquiries can be directed to the corresponding author.

Conflicts of Interest

The author declares no conflict of interest.

References

  1. Tyagi, H.; Chakraborty, P.R.; Powar, S.; Agarwal, A.K. (Eds.) Solar Energy: Systems, Challenges, and Opportunities, 1st ed.; Springer: Berlin/Heidelberg, Germany, 2020; p. 423. [Google Scholar]
  2. Archer, D. Global Warming: Understanding the Forecast; John Wiley & Sons: Hoboken, NJ, USA, 2012. [Google Scholar]
  3. O’Regan, B.; Grätzel, M. A low-cost, high-efficiency solar cell based on dye-sensitized colloidal TiO2 films. Nature 1991, 353, 737–740. [Google Scholar] [CrossRef]
  4. Muñoz-García, A.B.; Benesperi, I.; Boschloo, G.; Concepcion, J.J.; Delcamp, J.H.; Gibson, E.A.; Meyer, G.J.; Pavone, M.; Pettersson, H.; Hagfeldt, A.; et al. Dye-sensitized solar cells strike back. Chem. Soc. Rev. 2021, 50, 12450–12550. [Google Scholar] [CrossRef]
  5. Borges-Martínez, M.; Alvarez, D.; Montenegro-Pohlhammer, N.; Menéndez, M.I.; López, R.; Cárdenas-Jirón, G. Assessment of BODIPY–Oxasmaragdyrin Dyads for Dye-Sensitized Solar Cells: Aromaticity, Photosensitization Capability, and Charge Transport. J. Phys. Chem. C 2019, 123, 19362–19375. [Google Scholar] [CrossRef]
  6. He, J.; Wang, B.; Chang, S.; Chen, T. Ruthenium-Based Photosensitizers for Dye-Sensitized Solar Cells. In Organometallics and Related Molecules for Energy Conversion; Wong, W.-Y., Ed.; Springer: Berlin/Heidelberg, Germany, 2015; pp. 91–114. [Google Scholar]
  7. Aksakal, N.E.; Kazan, H.H.; Eçik, E.T.; Yuksel, F. A novel photosensitizer based on a ruthenium(ii) phenanthroline bis(perylenediimide) dyad: Synthesis, generation of singlet oxygen and in vitro photodynamic therapy. New J. Chem. 2018, 42, 17538–17545. [Google Scholar] [CrossRef]
  8. Al Mogren, M.M.; Ahmed, N.M.; Hasanein, A.A. Molecular modeling and photovoltaic applications of porphyrin-based dyes: A review. J. Saudi Chem. Soc. 2020, 24, 303–320. [Google Scholar] [CrossRef]
  9. Obasuyi, A.R.; Glossman-Mitnik, D.; Flores-Holguín, N. Electron injection in anthocyanidin and betalain dyes for dye-sensitized solar cells: A DFT approach. J. Comput. Electron. 2019, 18, 396–406. [Google Scholar] [CrossRef]
  10. Dhar, A.; Kumar, N.S.; Paul, P.K.; Roy, S.; Vekariya, R.L. Influence of tagging thiophene bridge unit on optical and electrochemical properties of coumarin based dyes for DSSCs with theoretical insight. Org. Electron. 2018, 53, 280–286. [Google Scholar] [CrossRef]
  11. Ayare, N.N.; Sharma, S.; Sonigara, K.K.; Prasad, J.; Soni, S.S.; Sekar, N. Synthesis and computational study of coumarin thiophene-based D-π-A azo bridge colorants for DSSC and NLOphoric application. J. Photochem. Photobiol. A Chem. 2020, 394, 112466. [Google Scholar] [CrossRef]
  12. Pounraj, P.; Mohankumar, V.; Pandian, M.S.; Ramasamy, P. The effect of different π-bridge configuration on bi-anchored triphenylamine and phenyl modified triphenylamine based dyes for dye sensitized solar cell (DSSC) application: A theoretical approach. J. Mol. Graph. Model. 2018, 79, 235–253. [Google Scholar] [CrossRef]
  13. Al-Temimei, F.; Mraity, H. DFT/TD-DFT investigation of novel D–π–A configuration dyes for improving solar cell efficiency. Struct. Chem. 2022, 33, 859–869. [Google Scholar] [CrossRef]
  14. Wazzan, N. Theoretical investigation of anthanthrene-based dyes in dye-sensitized solar cell applications: Effect of nature of alkyl-substitutions and number of anchoring groups. Arab. J. Chem. 2022, 15, 103969. [Google Scholar] [CrossRef]
  15. Geng, Y.; Yi, C.; Bircher, M.P.; Decurtins, S.; Cascella, M.; Grätzel, M.; Liu, S.-X. Anthanthrene dye-sensitized solar cells: Influence of the number of anchoring groups and substitution motif. RSC Adv. 2015, 5, 98643–98652. [Google Scholar] [CrossRef]
  16. Giguère, J.-B.; Verolet, Q.; Morin, J.-F. 4,10-Dibromoanthanthrone as a New Building Block for p-Type, n-Type, and Ambipolar π-Conjugated Materials. Chem.—A Eur. J. 2013, 19, 372–381. [Google Scholar] [CrossRef]
  17. Venkatraman, R.; Panneer, S.V.K.; Varathan, E.; Subramanian, V. Aromaticity–Photovoltaic Property Relationship of Triphenylamine-Based D-π-A Dyes: Leads from DFT Calculations. J. Phys. Chem. A 2020, 124, 3374–3385. [Google Scholar] [CrossRef] [PubMed]
  18. Pino-Rios, R.; Montenegro-Pohlhammer, N.; Cárdenas-Jirón, G. Assessment of New Expanded Porpholactones as UV/Vis/NIR Chromophores for Dye-Sensitized Solar Cell Applications. J. Phys. Chem. A 2021, 125, 2267–2275. [Google Scholar] [CrossRef]
  19. Silva López, C.; Nieto Faza, O. 2—Overview of the computational methods to assess aromaticity. In Aromaticity; Fernandez, I., Ed.; Elsevier: Amsterdam, The Netherlands, 2021; pp. 41–71. [Google Scholar]
  20. Prajapat, K.; Dhonde, M.; Sahu, K.; Bhojane, P.; Murty, V.V.S.; Shirage, P.M. The evolution of organic materials for efficient dye-sensitized solar cells. J. Photochem. Photobiol. C Photochem. Rev. 2023, 55, 100586. [Google Scholar] [CrossRef]
  21. Zhao, Y.; Truhlar, D.G. The M06 suite of density functionals for main group thermochemistry, thermochemical kinetics, noncovalent interactions, excited states, and transition elements: Two new functionals and systematic testing of four M06-class functionals and 12 other functionals. Theor. Chem. Acc. 2008, 120, 215–241. [Google Scholar] [CrossRef]
  22. Ditchfield, R.; Hehre, W.J.; Pople, J.A. Self-Consistent Molecular-Orbital Methods. IX. An Extended Gaussian-Type Basis for Molecular-Orbital Studies of Organic Molecules. J. Chem. Phys. 1971, 54, 724–728. [Google Scholar] [CrossRef]
  23. Clark, T.; Chandrasekhar, J.; Spitznagel, G.W.; Schleyer, P.V.R. Efficient diffuse function-augmented basis sets for anion calculations. III. The 3-21+G basis set for first-row elements, Li–F. J. Comput. Chem 1983, 4, 294–301. [Google Scholar] [CrossRef]
  24. Josa, D.; Rodríguez-Otero, J.; Cabaleiro-Lago, E.M.; Rellán-Piñeiro, M. Analysis of the performance of DFT-D, M05-2X and M06-2X functionals for studying π⋯π interactions. Chem. Phys. Lett. 2013, 557, 170–175. [Google Scholar] [CrossRef]
  25. Walker, M.; Harvey, A.J.A.; Sen, A.; Dessent, C.E.H. Performance of M06, M06-2X, and M06-HF Density Functionals for Conformationally Flexible Anionic Clusters: M06 Functionals Perform Better than B3LYP for a Model System with Dispersion and Ionic Hydrogen-Bonding Interactions. J. Phys. Chem. A 2013, 117, 12590–12600. [Google Scholar] [CrossRef]
  26. Delgado-Montiel, T.; Soto-Rojo, R.; Baldenebro-López, J.; Glossman-Mitnik, D. Theoretical Study of the Effect of Different π Bridges Including an Azomethine Group in Triphenylamine-Based Dye for Dye-Sensitized Solar Cells. Molecules 2019, 24, 3897. [Google Scholar] [CrossRef] [PubMed]
  27. Wu, W.; Li, Y.; Zhang, J.; Guo, X.; Wang, L.; Ågren, H. Theoretical modelling of metal-based and metal-free dye sensitizers for efficient dye-sensitized solar cells: A review. Sol. Energy 2024, 277, 112748. [Google Scholar] [CrossRef]
  28. Barone, V.; Cossi, M. Quantum Calculation of Molecular Energies and Energy Gradients in Solution by a Conductor Solvent Model. J. Phys. Chem. A 1998, 102, 1995–2001. [Google Scholar] [CrossRef]
  29. Cossi, M.; Rega, N.; Scalmani, G.; Barone, V. Energies, structures, and electronic properties of molecules in solution with the C-PCM solvation model. J. Comput. Chem. 2003, 24, 669–681. [Google Scholar] [CrossRef]
  30. Wazzan, N.; Irfan, A. Theoretical study of triphenylamine-based organic dyes with mono-, di-, and tri-anchoring groups for dye-sensitized solar cells. Org. Electron. 2018, 63, 328–342. [Google Scholar] [CrossRef]
  31. Syzgantseva, O.A.; Gonzalez-Navarrete, P.; Calatayud, M.; Bromley, S.; Minot, C. Theoretical Investigation of the Hydrogenation of (TiO2)N Clusters (N = 1–10). J. Phys. Chem. C 2011, 115, 15890–15899. [Google Scholar] [CrossRef]
  32. Hay, P.J.; Wadt, W.R. Ab initio effective core potentials for molecular calculations. Potentials for the transition metal atoms Sc to Hg. J. Chem. Phys. 1985, 82, 270–283. [Google Scholar] [CrossRef]
  33. Yanai, T.; Tew, D.P.; Handy, N.C. A new hybrid exchange–correlation functional using the Coulomb-attenuating method (CAM-B3LYP). Chem. Phys. Lett. 2004, 393, 51–57. [Google Scholar] [CrossRef]
  34. Frisch, M.J. Gaussian 09 Programmer’s Reference; Gaussian: Wallingford, England, 2009. [Google Scholar]
  35. Dennington, R.; Keith, T.; Millam, J. GaussView; Version 5; Semichem Inc.: Shawnee, KS, USA, 2009. [Google Scholar]
  36. Hanwell, M.D.; Curtis, D.E.; Lonie, D.C.; Vandermeersch, T.; Zurek, E.; Hutchison, G.R. Avogadro: An advanced semantic chemical editor, visualization, and analysis platform. J. Cheminformatics 2012, 4, 17. [Google Scholar] [CrossRef]
  37. Deogratias, G.; Al-Qurashi, O.S.; Wazzan, N.; Pogrebnaya, T.; Pogrebnoi, A. Effects of heteroatoms in π-conjugated linkers on the optical and electronic properties of modified triphenylamine based dyes: Towards DSSCs’ applications. J. Mol. Model. 2020, 26, 288. [Google Scholar] [CrossRef] [PubMed]
  38. Lu, T. Simple, reliable, and universal metrics of molecular planarity. J. Mol. Model. 2021, 27, 263. [Google Scholar] [CrossRef] [PubMed]
  39. Lu, T.; Chen, F. Multiwfn: A multifunctional wavefunction analyzer. J. Comput. Chem. 2012, 33, 580–592. [Google Scholar] [CrossRef] [PubMed]
  40. Zhang, G.; Bai, Y.; Li, R.; Shi, D.; Wenger, S.; Zakeeruddin, S.M.; Grätzel, M.; Wang, P. Employ a bisthienothiophene linker to construct an organic chromophore for efficient and stable dye-sensitized solar cells. Energy Environ. Sci. 2009, 2, 92–95. [Google Scholar] [CrossRef]
  41. Cahen, D.; Hodes, G.; Grätzel, M.; Guillemoles, J.F.; Riess, I. Nature of Photovoltaic Action in Dye-Sensitized Solar Cells. J. Phys. Chem. B 2000, 104, 2053–2059. [Google Scholar] [CrossRef]
  42. Som, N.N.; Sampath, P.M.W.P.; Dabhi, S.D.; Mankad, V.; Shinde, S.; Attygalle, M.L.C.; Jha, P.K. Strain and layer modulated electronic and optical properties of low dimensional perovskite methylammonium lead iodide: Implications to solar cells. Sol. Energy 2018, 173, 1315–1322. [Google Scholar] [CrossRef]
  43. Martsinovich, N.; Troisi, A. Theoretical studies of dye-sensitised solar cells: From electronic structure to elementary processes. Energy Environ. Sci. 2011, 4, 4473–4495. [Google Scholar] [CrossRef]
  44. Lin, J.T.; Chen, P.-C.; Yen, Y.-S.; Hsu, Y.-C.; Chou, H.-H.; Yeh, M.-C.P. Organic Dyes Containing Furan Moiety for High-Performance Dye-Sensitized Solar Cells. Org. Lett. 2009, 11, 97–100. [Google Scholar] [CrossRef]
  45. Bora, S.R.; Kalita, D.J. Tuning the charge transfer and optoelectronic properties of tetrathiafulvalene based organic dye-sensitized solar cells: A theoretical approach. RSC Adv. 2021, 11, 39246–39261. [Google Scholar] [CrossRef]
  46. Hilborn, R.C. Einstein coefficients, cross sections, f values, dipole moments, and all that. Am. J. Phys. 1982, 50, 982–986. [Google Scholar] [CrossRef]
  47. Marcus, R.A. Electron transfer reactions in chemistry. Theory and experiment. Rev. Mod. Phys. 1993, 65, 599–610. [Google Scholar] [CrossRef]
  48. Wazzan, N.A. A DFT/TDDFT investigation on the efficiency of novel dyes with ortho-fluorophenyl units (A1) and incorporating benzotriazole/benzothiadiazole/phthalimide units (A2) as organic photosensitizers with D–A2–π–A1 configuration for solar cell applications. J. Comput. Electron. 2019, 18, 375–395. [Google Scholar] [CrossRef]
  49. Marcus, R.A. Chemical and Electrochemical Electron-Transfer Theory. Annu. Rev. Phys. Chem. 1964, 15, 155–196. [Google Scholar] [CrossRef]
  50. Chen, Z.; Li, Y.; He, Z.; Xu, Y.; Yu, W. Theoretical investigations on charge transport properties of tetrabenzo[a,d,j,m]coronene derivatives using different density functional theory functionals (B3LYP, M06-2X, and wB97XD). J. Chem. Res. 2019, 43, 293–303. [Google Scholar] [CrossRef]
  51. Wazzan, N.; El-Shishtawy, R.M.; Irfan, A. DFT and TD–DFT calculations of the electronic structures and photophysical properties of newly designed pyrene-core arylamine derivatives as hole-transporting materials for perovskite solar cells. Theor. Chem. Acc. 2017, 137, 9. [Google Scholar] [CrossRef]
  52. Alongamo, C.I.L.; Tasheh, S.N.; Nkungli, N.K.; Bine, F.K.; Ghogomu, J.N. Structural, Electronic, and Charge Transport Properties of New Materials based on 2-(5-Mercapto-1,3,4-Oxadiazol-2-yl) Phenol for Organic Solar Cells and Light Emitting Diodes by DFT and TD-DFT. J. Chem. 2022, 2022, 1802826. [Google Scholar] [CrossRef]
  53. Johnson, E.R.; Keinan, S.; Mori-Sánchez, P.; Contreras-García, J.; Cohen, A.J.; Yang, W. Revealing Noncovalent Interactions. J. Am. Chem. Soc. 2010, 132, 6498–6506. [Google Scholar] [CrossRef]
  54. Le Bahers, T.; Adamo, C.; Ciofini, I. A Qualitative Index of Spatial Extent in Charge-Transfer Excitations. J. Chem. Theory Comput. 2011, 7, 2498–2506. [Google Scholar] [CrossRef]
  55. Ali, B.A.; Allam, N.K. Propping the optical and electronic properties of potential photo-sensitizers with different π-spacers: TD-DFT insights. Spectrochim. Acta Part A Mol. Biomol. Spectrosc. 2018, 188, 237–243. [Google Scholar] [CrossRef]
  56. Li, P.; Cui, Y.; Song, C.; Zhang, H. A systematic study of phenoxazine-based organic sensitizers for solar cells. Dye. Pigm. 2017, 137, 12–23. [Google Scholar] [CrossRef]
  57. Wu, H.; Zhang, T.; Wu, C.; Guan, W.; Yan, L.; Su, Z. A theoretical design and investigation on Zn-porphyrin-polyoxometalate hybrids with different π-linkers for searching high performance sensitizers of p-type dye-sensitized solar cells. Dye. Pigm. 2016, 130, 168–175. [Google Scholar] [CrossRef]
  58. Wei, S.; Li, K.; Lu, X.; Zhao, Z.; Shao, Y.; Dang, Y.; Li, S.; Guo, W. Theoretical insight into electronic structure and optoelectronic properties of heteroleptic Cu(I)-based complexes for dye-sensitized solar cells. Mater. Chem. Phys. 2016, 173, 139–145. [Google Scholar] [CrossRef]
  59. Zanjanchi, F.; Beheshtian, J. Natural pigments in dye-sensitized solar cell (DSSC): A DFT-TDDFT study. J. Iran. Chem. Soc. 2019, 16, 795–805. [Google Scholar] [CrossRef]
  60. Li, Y.; Zhang, W.; Li, X.; Xu, Y. Boosting the photoelectric conversion efficiency of DSSCs through graphene quantum dots: Insights from theoretical study. Mater. Chem. Front. 2021, 5, 5814–5825. [Google Scholar] [CrossRef]
  61. Al-Qurashi, O.S.; Wazzan, N.A.; Obot, I. Exploring the effect of mono-and di-fluorinated triphenylamine-based molecules as electron donors for dye-sensitised solar cells. Mol. Simul. 2020, 46, 41–53. [Google Scholar] [CrossRef]
  62. Costa, R.; Al-Qurashi, O.S.; Wazzan, N.; Pogrebnoi, A.; Pogrebnaya, T. Designed complexes based on betanidin and L0 Dyes for DSSCs: Thermodynamic and optoelectronic properties from DFT study. Mol. Simul. 2022, 48, 647–661. [Google Scholar] [CrossRef]
  63. Irfan, A.; Chaudhry, A.R.; Jin, R.; Al-Sehemi, A.G.; Muhammad, S.; Tang, S. Exploring the charge transfer nature and electro-optical properties of anthracene based sensitizers @TiO2 cluster. J. Taiwan Inst. Chem. Eng. 2017, 80, 239–246. [Google Scholar] [CrossRef]
  64. Soria, F.A.; Daldossi, C.; Di Valentin, C. Tuning the electron injection mechanism by changing the adsorption mode: The case study of Alizarin on TiO2. Mater. Today Energy 2022, 28, 101085. [Google Scholar] [CrossRef]
  65. Britel, O.; Fitri, A.; Touimi Benjelloun, A.; Slimi, A.; Benzakour, M.; McHarfi, M. Theoretical design of new carbazole based organic dyes for DSSCs applications. A DFT/TD-DFT insight. J. Photochem. Photobiol. A Chem. 2022, 429, 113902. [Google Scholar] [CrossRef]
  66. Horn, M.; Schwerdtfeger, C.F.; Meagher, E.P. Refinement of the structure of anatase at several temperatures. Z. Für Krist. 1972, 136, 273. [Google Scholar] [CrossRef]
  67. Bates, S.P.; Kresse, G.; Gillan, M.J. The adsorption and dissociation of ROH molecules on TiO2(110). Surf. Sci. 1998, 409, 336–349. [Google Scholar] [CrossRef]
  68. Al-Qurashi, O.S.; Wazzan, N. Prediction of Power Conversion Efficiencies of Diphenylthienylamine-Based Dyes Adsorbed on the Titanium Dioxide Nanotube. ACS Omega 2021, 6, 8967–8975. [Google Scholar] [CrossRef] [PubMed]
  69. Dette, C.; Pérez-Osorio, M.A.; Kley, C.S.; Punke, P.; Patrick, C.E.; Jacobson, P.; Giustino, F.; Jung, S.J.; Kern, K. TiO2 anatase with a bandgap in the visible region. Nano Lett. 2014, 14, 6533–6538. [Google Scholar] [CrossRef]
  70. Jin, X.; Sun, L.; Li, D.; Wang, C.-L.; Bai, F.-Q. Efficiency difference between furan- and thiophene-based D–π–A dyes in DSSCs explained by theoretical calculations. RSC Adv. 2018, 8, 29917–29923. [Google Scholar] [CrossRef] [PubMed]
  71. Dualeh, A.; Angelis, F.; Fantacci, S.; Moehl, T.; Yi, C.; Kessler, F.; Baranoff, E.; Nazeeruddin, M.; Graetzel, M. Influence of Donor Groups of Organic D−π–A Dyes on Open-Circuit Voltage in Solid-State Dye-Sensitized Solar Cells. J. Phys. Chem. C 2012, 116, 1572–1578. [Google Scholar] [CrossRef]
  72. Heng, P.; Mao, L.; Guo, X.; Wang, L.; Zhang, J. Accurate estimation of the photoelectric conversion efficiency of a series of anthracene-based organic dyes for dye-sensitized solar cells. J. Mater. Chem. C 2020, 8, 2388–2399. [Google Scholar] [CrossRef]
  73. He, L.-J.; Chen, J.; Bai, F.-Q.; Jia, R.; Wang, J.; Zhang, H.-X. Fine-tuning π-spacer for high efficiency performance DSSC: A theoretical exploration with D−π−A based organic dye. Dye. Pigment. 2017, 141, 251–261. [Google Scholar] [CrossRef]
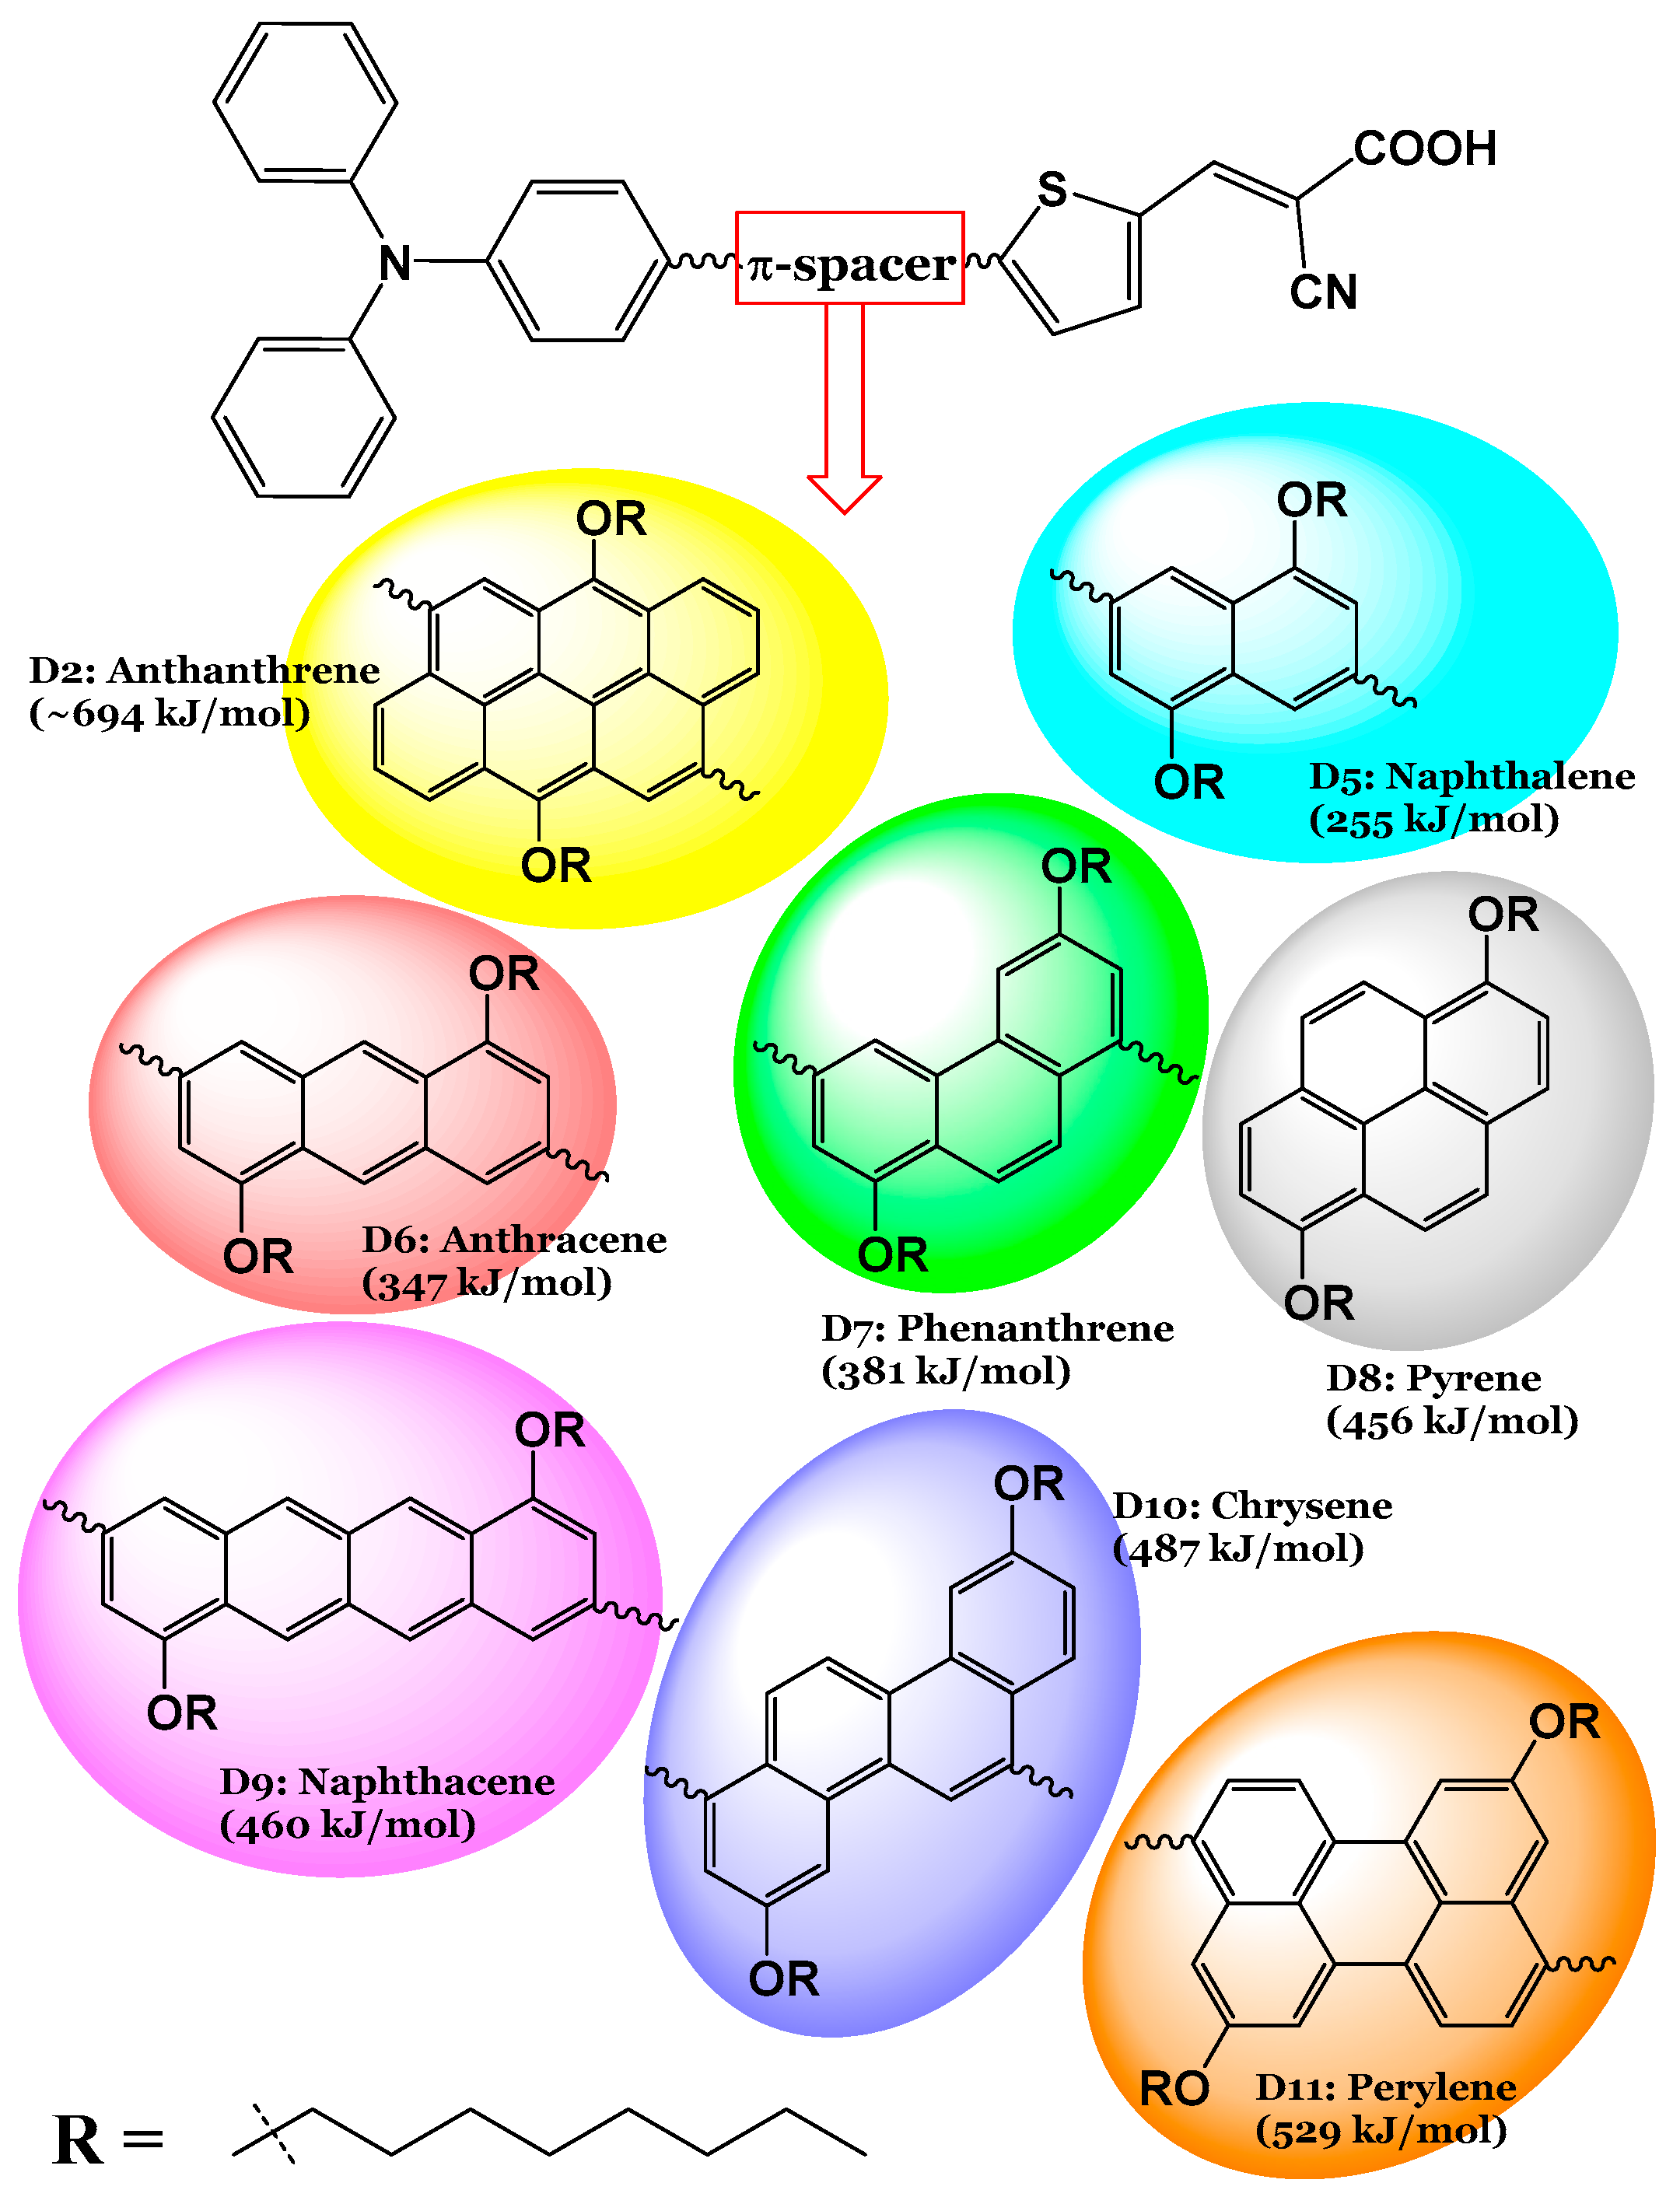
Figure 1. The seven designed dyes (D5 to D11) from the most efficient D2 dye (indicated too) [15], obtained by replacing the π-spacer unit in D2 (anthanthrene) by aromatic rings with different resonance energies (in kJ/mol).
Processes 13 00418 g001
Figure 2. The synthesis procedure of D2, as adopted from ref. [15]. The designed dyes, D5 to D11, can be synthesized by replacing the anthanthrene core with naphthalene, anthracene, phenanthrene, pyrene, naphthacene, chrysene, and perylene cores, respectively.
Processes 13 00418 g002
Figure 3. The investigated dyes are placed vertically to illustrate the degree of planarity of each dye molecule with respect to other dye molecules. MPP values also are indicated, and different atoms are indicated with different colors (S: yellow, N: blue, C: gray, O: red, H: white).
Processes 13 00418 g003
Figure 4. FMO energy levels of the seven designed dyes (D5 to D11) along with those of the efficient existing dye D2.
Processes 13 00418 g004
Figure 5. A simulation of the (a) absorption spectrum and (b) emission spectrum of dyes D2 and D5 to D11.
Processes 13 00418 g005aProcesses 13 00418 g005b
Figure 6. Graphical presentation of the relationship between the π-aromatic’s resonance energies and wavelengths in Vis and UV absorption bands.
Processes 13 00418 g006
Figure 7. Reorganization energies of hole, electron, electron–hole, and total for D2 and D5 to D11 in THF.
Processes 13 00418 g007
Figure 8. The optimized π-stacking arrangement of two adjacent dye molecules of the investigated dyes calculated at the CPCM/M06-2x/6-31+G(d,p) in THF. Note: the arrow between the two sulfur atoms (yellow) of the thiophene units is considered to represent the space distance between two interacting dye molecules.
Processes 13 00418 g008
Figure 9. NCI isosurfaces: (a) 2D scatter maps and (b) 3D color-filled RDG isosurfaces of D2 and D5 dye dimers as representative examples at CPCM/M06-2x/6-31+G(d,p) in THF.
Processes 13 00418 g009
Figure 10. Graphical representation of Le Bahers’ CT indices. Note: data for D10 dye were not converged and are not included.
Processes 13 00418 g010
Figure 11. EDD plots between S1 and So states of the investigated dyes (isolated and adsorbed forms).
Processes 13 00418 g011
Figure 12. Electron injection and dye regeneration free energies (in eV) of the isolated dyes.
Processes 13 00418 g012
Figure 13. Adsorption energies (in kJ/mol).
Processes 13 00418 g013
Figure 14. Distribution patterns of the FMOs of the D2 and D5 to D11 adsorbed on TiO2 clusters involved in the most important transition (see Table 5).
Processes 13 00418 g014aProcesses 13 00418 g014bProcesses 13 00418 g014c
Table 1. The optimized dihedral angles (in 0) (DA1, DA2, DA3, and DA4) of the eight investigated dyes.
Aromatic Core (Dye)DA1 (TPA)DA2 (TPH)DA3 (ALKY1)DA4 (ALKY2)
Anthanthrene (D2)54.1256.7390.9891.13
Naphthalene (D5)35.4025.6192.3490.97
Anthracene (D6)35.2225.6691.8293.71
Phenanthrene (D7)36.2156.21179.2188.77
Pyrene (D8)52.6346.9586.6491.85
Naphthacene (D9)35.1925.3391.7992.45
Chrysene (D10)52.4356.90179.52179.38
Perylene (D11)36.4428.10179.15179.30
Table 2. Computed absorption data and the distribution patterns of the FMOs of the isolated dyes D2 and D5 to D11 at the ground states involved in the major transition. Note: data on the D2 dye were collected from ref. [14].
Dye λ a b s c a l c
(in nm/eV)
f TransitionTransition CharacterLHEIso-Density
D2451.36/
2.75
1.001S0 → S1H → L + 1 (49%)0.900Processes 13 00418 i001
350.77/
3.53
1.490S0 → S4H-2 → L (47%)0.968Processes 13 00418 i002
D5418.47/
2.96
1.899S0 → S1H-1 → L (50%)0.987Processes 13 00418 i003
299.41/
4.14
0.4512S0 → S6H-1 → L + 1 (38%)0.646Processes 13 00418 i004
D6436.19/
2.84
1.447S0 → S1H-1 → L (44%)0.964Processes 13 00418 i005
348.16/
3.56
0.693S0 → S3H-2 → L (34%)0.797Processes 13 00418 i006
D7393.40/
3.15
1.421S0 → S1H-1 → L (47%)0.962Processes 13 00418 i007
320.55/
3.87
0.863S0 → S3H-3 → L (32%)0.863Processes 13 00418 i008
D8428.01/
2.90
1.571S0 → S1H-1 → L (50%)0.973Processes 13 00418 i009
315.51/
3.93
0.830S0 → S5H-2 → L (27%)0.852Processes 13 00418 i010
D9413.38/
3.00
1.289S0 → S2H → L + 1 (41%)0.949Processes 13 00418 i011
368.70/
3.36
1.118S0 → S3H-1 → L (33%)0.924Processes 13 00418 i012
D10401.63/
3.09
1.306S0 → S1H-1 → L (47%)0.951Processes 13 00418 i013
281.66/
4.40
0.822S0 → S10H-2 → L (39%)0.849Processes 13 00418 i014
D11400.40/
3.10
1.210S0 → S2H-1 → L (34%)0.938Processes 13 00418 i015
352.90/
3.51
0.623S0 → S4H → L + 1 (44%)0.762Processes 13 00418 i016
HOMO: H; LUMO: L.
Table 3. Computed emission data based on the S1 states. Note: data on D2 dye were collected from ref. [14].
Dye λ m a x e m
(in nm/eV)
f m a x e m λ s s
(in nm)
τ
(in ns)
D2616.27/2.011.16591654.817
D5586.50/2.112.10311342.428
D6595.63/2.082.00381592.623
D7602.82/2.062.02632092.644
D8684.28/1.811.77852563.902
D9646.00/1.921.54332333.996
D10614.64/2.021.89782132.936
D11531.15/2.330.57621317.268
Table 4. Charge-transfer rate parameters between two dyes in the π-stacking configuration include the electronic coupling matrix element V + (in eV), the charge-transfer rate k C T ± (in s−1), the space distance l (in Å), and hopping mobility μ h o p ± (in cm2 V−1 s−1).
Dye V + V k C T + × 10 13 k C T × 10 13 l μ h o p + μ h o p
D20.1140.06612.1270.1353.4372.7910.031
D50.0530.0642.8860.1526.2162.1720.114
D60.0300.0680.9700.1793.7550.2660.049
D70.0560.0683.4190.1524.5231.3620.061
D80.0700.0274.6170.0263.5571.1380.006
D90.0230.1190.5390.5353.8430.1550.154
D100.0210.00520.5600.1583.7835.7320.044
D110.0150.0280.2380.0266.9650.2250.023
Table 5. Computed absorption data of dye@TiO2 systems. Note: data on D2 dye were collected from ref. [14].
Dye@TiO2 λ a b s c a l c
(in nm/eV)
fTransitionTransition CharacterLHE
D2@TiO2442.53/2.8020.863S0 → S9H → L (51%)0.863
357.25/3.4710.726S0 → S16H−3 → L (45%)0.812
D5@TiO2415.65/2.9831.9869S0 → S10H−2 → L (48%)0.990
307.09/4.0370.3834S0 → S20H → L (38%)0.586
D6@TiO2434.58/2.8531.6115S0 → S9H → L (43%)0.976
347.24/3.5710.5086S0 → S9H−3 → L (41%)0.690
D7@TiO2415.73/2.9821.5539S0 → S10H−2 → L (46%)0.972
313.00/3.9610.9301S0 → S9H → L (30%)0.883
D8@TiO2431.15/2.8761.5860S0 → S10H−2 → L (47%)0.974
315.21/3.9330.4721S0 → S19H−2 → L+15 (28%)0.663
D9@TiO2409.02/3.0311.0321S0 → S11H → L+3 (40%)0.907
366.16/3.3861.0507S0 → S15H−3 → L (33%)0.911
D10@TiO2410.60/3.0201.2562S0 → S10H−2 → L (45%)0.945
319.47/3.8810.7682S0 → S18H−2 → L (35%)0.829
D11@TiO2397.18/3.1221.4398S0 → S13H−1 → L+4 (35%)0.964
365.14/3.3960.4673S0 → S19H−3 → L (46%)0.659
Table 6. Electronic and electrochemical parameters represented the overall performance of the designed isolated and adsorbed dyes in connection with their core structures, resonance energies, and degree of planarity.
DyeAromatic Core E R
(kJ/mol)
MPP L H
(eV)
LHE
(%)
G i n j
(eV)
G r e g
(eV)
λ t o t
(eV)
λ
(eV)
E a d s
(kJ/mol)
D2Anthracene6942.0424.030970.501.450.6070.296−645.08
D5Naphthalene 2551.9404.099990.581.580.5820.288−660.16
D6Anthracene 3471.9394.012960.521.520.5760.286−655.58
D7Phenanthrene3811.4854.161960.791.560.5900.303−653.67
D8Pyrene 4561.8064.115970.521.580.5950.286−653.47
D9Naphthacene 4601.9623.863950.761.440.5790.286−650.40
D10Chrysene 4870.9144.174950.721.570.5920.291−650.57
D11Perylene 5290.7074.048940.751.550.5960.310−647.63
Disclaimer/Publisher’s Note: The statements, opinions and data contained in all publications are solely those of the individual author(s) and contributor(s) and not of MDPI and/or the editor(s). MDPI and/or the editor(s) disclaim responsibility for any injury to people or property resulting from any ideas, methods, instructions or products referred to in the content.