


Abstract
Prestressed flexible support systems have become essential in deep excavation engineering, with the load distributive compression anchor (LDCA) widely adopted to enhance load-bearing performance through effective load dispersion among multiple anchoring units. Structural parameters of the anchor, particularly perforation ratio and height-to-diameter ratio, play a critical role in determining the mechanical behavior of the surrounding grout. In this study, grout located 500 mm behind the anchor body was selected as the test specimen. Unconfined compression tests were conducted to evaluate the ultimate load-bearing capacity under varying anchor configurations. Based on experimental measurements, a numerical simulation model was established and calibrated to investigate the internal stress distribution of the grout under different perforation ratios and height-to-diameter ratios. Results indicate that the perforation ratio significantly influences both the magnitude and location of stress peaks within the grout, with higher perforation ratios shifting the x-directional stress peak toward the anchor orifice and gradually reducing ultimate load-bearing capacity. Reducing the height-to-diameter ratio leads to a more uniform stress distribution, mitigating stress concentration while maintaining near-constant load-bearing capacity, although it increases anchor deformation. Optimal perforation ratio ranges were determined as [11%, 23%], [31%, 37%], and [42%, 50%] for anchors 1, 2, and 3, respectively, and the recommended height-to-diameter ratio is [15%, 17%]. The integration of experimental testing and numerical simulation provides quantitative insights into the effects of anchor design on grout performance, offering practical guidance for optimizing LDCA structures in deep excavation projects.
1. Introduction
With the advancement of national economic development, China has continuously intensified its infrastructure construction efforts, particularly in the fields of water conservancy, transportation, and telecommunications. Given the advantages of prestressed anchor cable support, including cost-effectiveness, construction convenience, and minimal foundation pit deformation [1], this method has been widely adopted in numerous major foundation engineering projects. For example, in coal mine roadways, rock bolts and cable bolts are employed for surrounding rock control [2,3]. The high-precision characteristics demonstrated negative Poisson’s ratio anchor cables in landslide monitoring [4,5]. Prestressed anchor cables play a critical role in ensuring the long-term safety and serviceability of slopes [6,7,8]. The aforementioned aspects collectively highlight the essential and pivotal role of the anchor cable support system in geotechnical engineering.
In practical engineering applications, tension-type anchors are predominantly used, with their load-bearing capacity primarily depending on the bond interaction between the strands and the grout [9,10]. The prestress is transferred from the strand to the grout along the bonded length and subsequently transmitted to the surrounding rock and soil mass [11,12]. This process induces tensile stress in the grout [13,14], making it prone to brittle failure. To address this issue, the pressure-type anchor cable utilizes the anchor body to transform the tensile force in the strand into compressive stress within the grout, thereby shifting the failure mechanism from tensile brittle fracture to compressive ductile behavior, which significantly improves structural reliability [15].
However, as the load increases, the anchorage zone of load-concentrated anchors (including tension-type and compression-type anchors) exhibits pronounced stress concentration [16,17,18]. Excessive peak stress is highly likely to induce grout-ground shear failure [19,20]. Therefore, multiple anchor bodies are incorporated into the pressure-type anchor to form the load distributive compression anchor (LDCA), thereby transforming the concentrated load into multiple distributed compressive stresses and improving the interfacial stress distribution [21]. The LDCA effectively distributes the tensile force transmitted by the strands, uniformly dispersing prestress across multiple anchor bodies and thereby mitigating peak stress [22,23,24].
The load-bearing capacity of LDCA is primarily determined by three key factors: strand failure, grout–ground shear failure, and grout failure [25]. Among these, grout failure represents a critical failure mode in LDCA [26]. Existing research has predominantly focused on grout–ground shear failure [27,28]. The shear strength at the grout–ground interface is significantly influenced by in situ geological conditions. When the interfacial strength is sufficiently high, it may exceed the compressive strength of the grout. Under such conditions, grout failure becomes the dominant factor limiting the load-bearing capacity of the LDCA. It has been demonstrated that when the applied load exceeds the compressive strength of the grout, the grout adjacent to the anchor body becomes highly susceptible to compressive failure [29]. Furthermore, it has been well established that grout failure significantly undermines the overall structural integrity and load-bearing performance of LDCA [30].
The grout failure is intrinsically linked to its internal structural integrity, particularly where the structural configuration of the anchor body significantly compromises the load-bearing capacity of the grout. Extensive research has been conducted to investigate the significant impact of grout geometry, including cubic and cylindrical configurations, on compressive strength, elastic modulus, and failure modes [31,32,33,34,35]. It has been demonstrated that the compressive strength of cubic specimens is 8.4–23.4% higher than that of cylindrical specimens, with notable differences observed in peak strain and post-peak behavior [36]. Similarly, discrepancies in compressive strength between cement–lime mortar cubes and cylinders have also been reported in the literature [37]. However, previous studies have predominantly focused on the influence of specimen geometry. More critically, as a pivotal component of the anchor structure, the structural design of the anchor body directly determines the internal structural characteristics of the grout. While the compressive performance of grout under a single perforation ratio has been established, the study does not address how variations in LDCA structural configurations influence load-bearing capacity by altering key grout structural characteristics, such as stress transmission paths [38].
In conclusion, this study adopts the compressive failure of grout as the failure criterion for LDCA and focuses on two key structural design parameters of the anchor body: the perforation ratio and the height-to-diameter ratio. This investigation integrates physical model testing with numerical simulations. By examining the variation patterns of the grout’s load-bearing capacity across different ranges of these parameters, the study aims to identify the optimal parameter range for the anchor body structure in engineering applications. To simulate field construction conditions as closely as possible, the diameter of the grout specimens was designed to match that of the boreholes used for on-site anchor cables, and a water-cement ratio of 0.5, commonly employed in anchor cable construction, was adopted. By modifying the structural configuration of the anchor body, this study investigates its effect on the ultimate load-bearing capacity of the grout and the associated failure modes. Subsequently, numerical simulations are conducted to analyze variations in internal stress distribution, including the migration of stress peaks. Finally, the optimal parameter range for the anchor body structure is discussed.
2. Compressive Test of Grout
2.1. Overview of the Test and Specimen Preparation
During prestress application to LDCA, the anchor body transfers compressive stress to the surrounding grout [39]. As prestress increases, it becomes more embedded. Different anchor body configurations directly affect nearby grout, causing peak stress near the anchor body. Studies show stress is highest around the anchor body and decreases rapidly toward the anchor head [40,41]. Thus, the grout segment 500 mm behind the anchor body was selected for study.
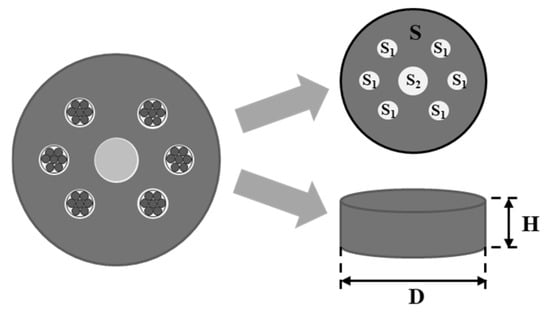
Figure 1 shows the anchor body’s geometry, defined by diameter and height, with perforation ratio and height-to-diameter ratio as key design parameters. To study how anchor body structure affects the load-bearing capacity of LDCA, this work focuses on how these two parameters influence the grout’s ultimate load-bearing capacity. The definitions of the perforation ratio [42,43,44] and height-to-diameter ratio [45,46,47,48] are provided in Equations (1) and (2), respectively.
where p is the perforation ratio, n is the number of strand orifices, s1 and s2 are the cross-sectional areas of the strand orifices and the central grout orifice (in mm2), respectively, and S is the area of the anchor body (in mm2).
where RH-D is the height-to-diameter ratio, H is the height of the anchor body, and D is the diameter of the anchor body.
Figure 1.
The perforation ratio and height-to-diameter ratio of the anchor body.
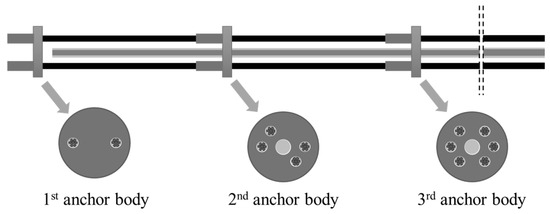
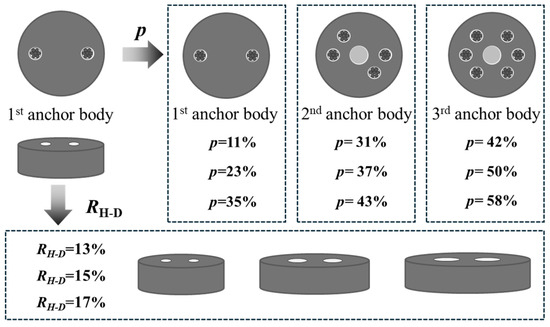
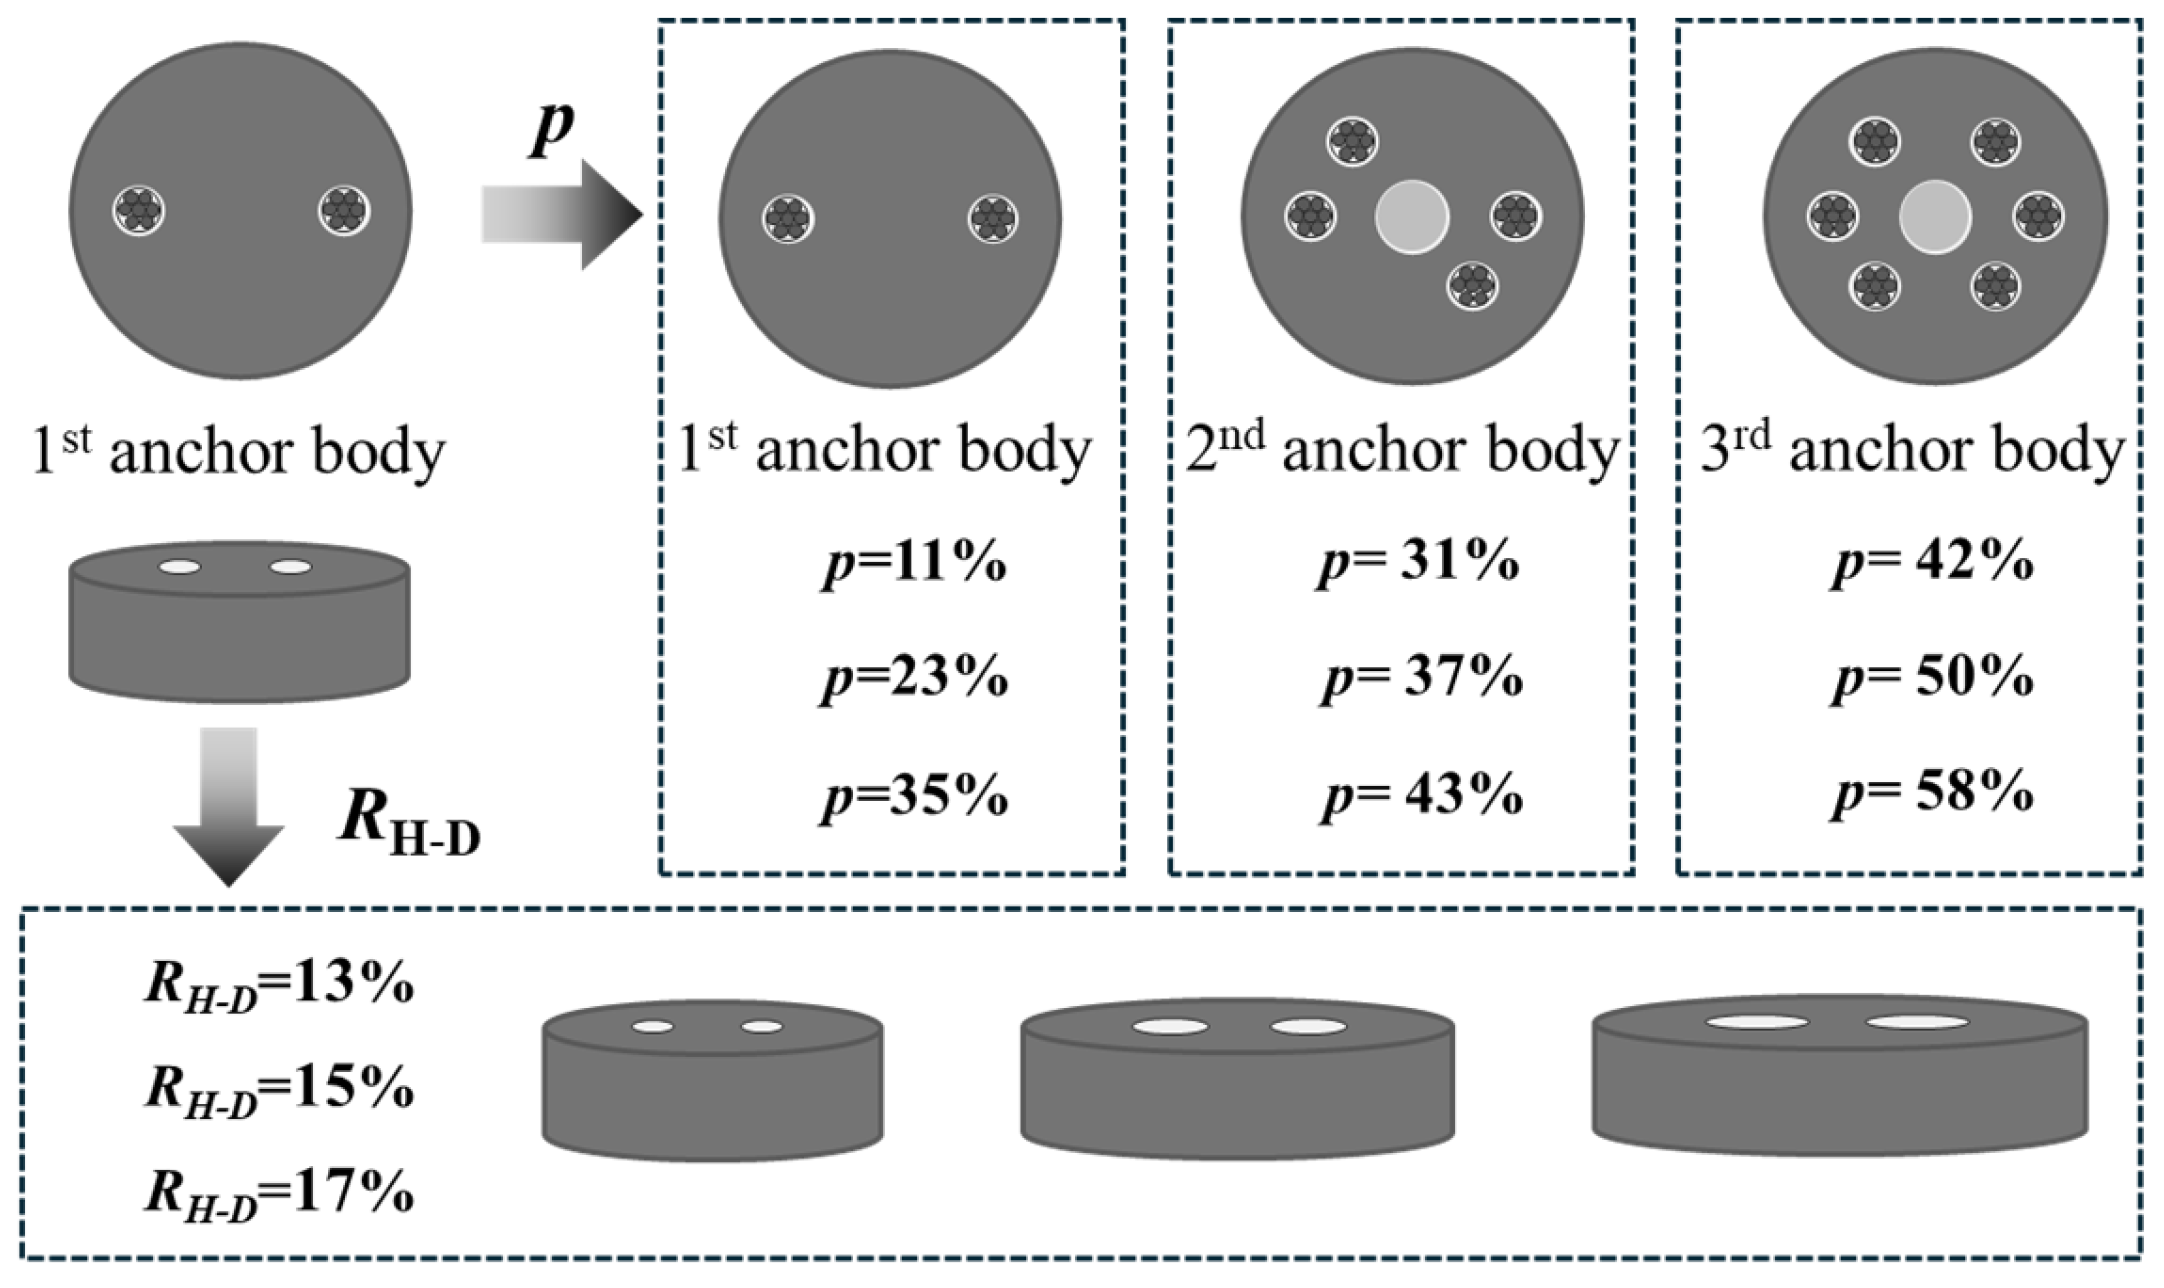
The LDCA in this study comprises three anchor bodies, as illustrated in Figure 2. The corresponding anchor bodies are sequentially designated from the bottom of the anchor cable toward the anchor head as the 1st anchor body, the 2nd anchor body, and the 3rd anchor body. Given that the perforation ratio of the 3rd anchor body is significantly higher than that of the 1st anchor body, a gradient in perforation ratio is established across different anchor body structures to determine their respective optimal perforation ratio ranges. For the 1st anchor body, to investigate the optimal range of height-to-diameter ratio, the control variable method was employed by fixing the height of the anchor body and varying its diameter, with specific values presented in Figure 3.
Figure 2.
Schematic diagram of an LDCA with triple anchor bodies.
Figure 3.
Test range for perforation ratio and height-to-diameter ratio.
The grout was cast in two halves along its longitudinal axis using a PVC pipe with a length of 500 mm and a diameter of 200 mm, which was selected based on the borehole diameters used in actual engineering practice. Ordinary Portland cement with a strength class of 42.5 MPa was used, and the water-to-cement ratio was maintained at 0.5. To simulate grout conditions under varying perforation ratios, steel pipes of different diameters were used. In accordance with engineering practices, the unbonded strands of the LDCA consist of 15.2 mm steel strands sheathed in polyethylene plastic tubes, resulting in an outer diameter of approximately 22 mm. Consequently, the minimum diameter of the steel pipe is set at 22 mm. Furthermore, considering that the minimum diameter of the grout orifice is 30 mm, the steel pipe used to simulate the grout orifice is designed with a minimum diameter of 30 mm.
The number of orifices and the corresponding perforation ratio of the 1st anchor body are as follows: when the perforation ratio of the 1st anchor body is 11%, two steel pipes with a diameter of 22 mm are used for simulation. When the perforation ratio of the 2nd anchor body is 31%, two additional steel pipes with a diameter of 22 mm are added to the existing setup, resulting in a total of four steel pipes with a diameter of 22 mm used to simulate the strand orifices, along with one steel pipe with a diameter of 30 mm used to simulate the grout orifice. When the perforation ratio of the 3rd anchor body reaches 42%, two more steel pipes with a diameter of 22 mm are added to those already present in the configuration from the previous step, resulting in six strand wire orifices and one grout orifice.
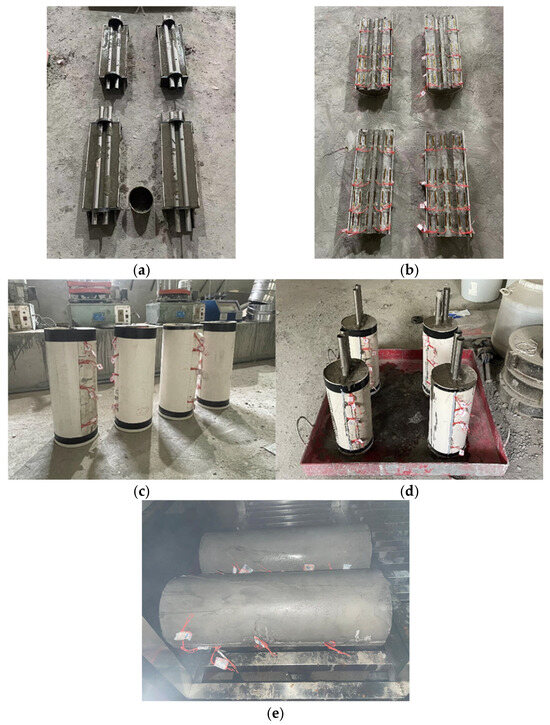
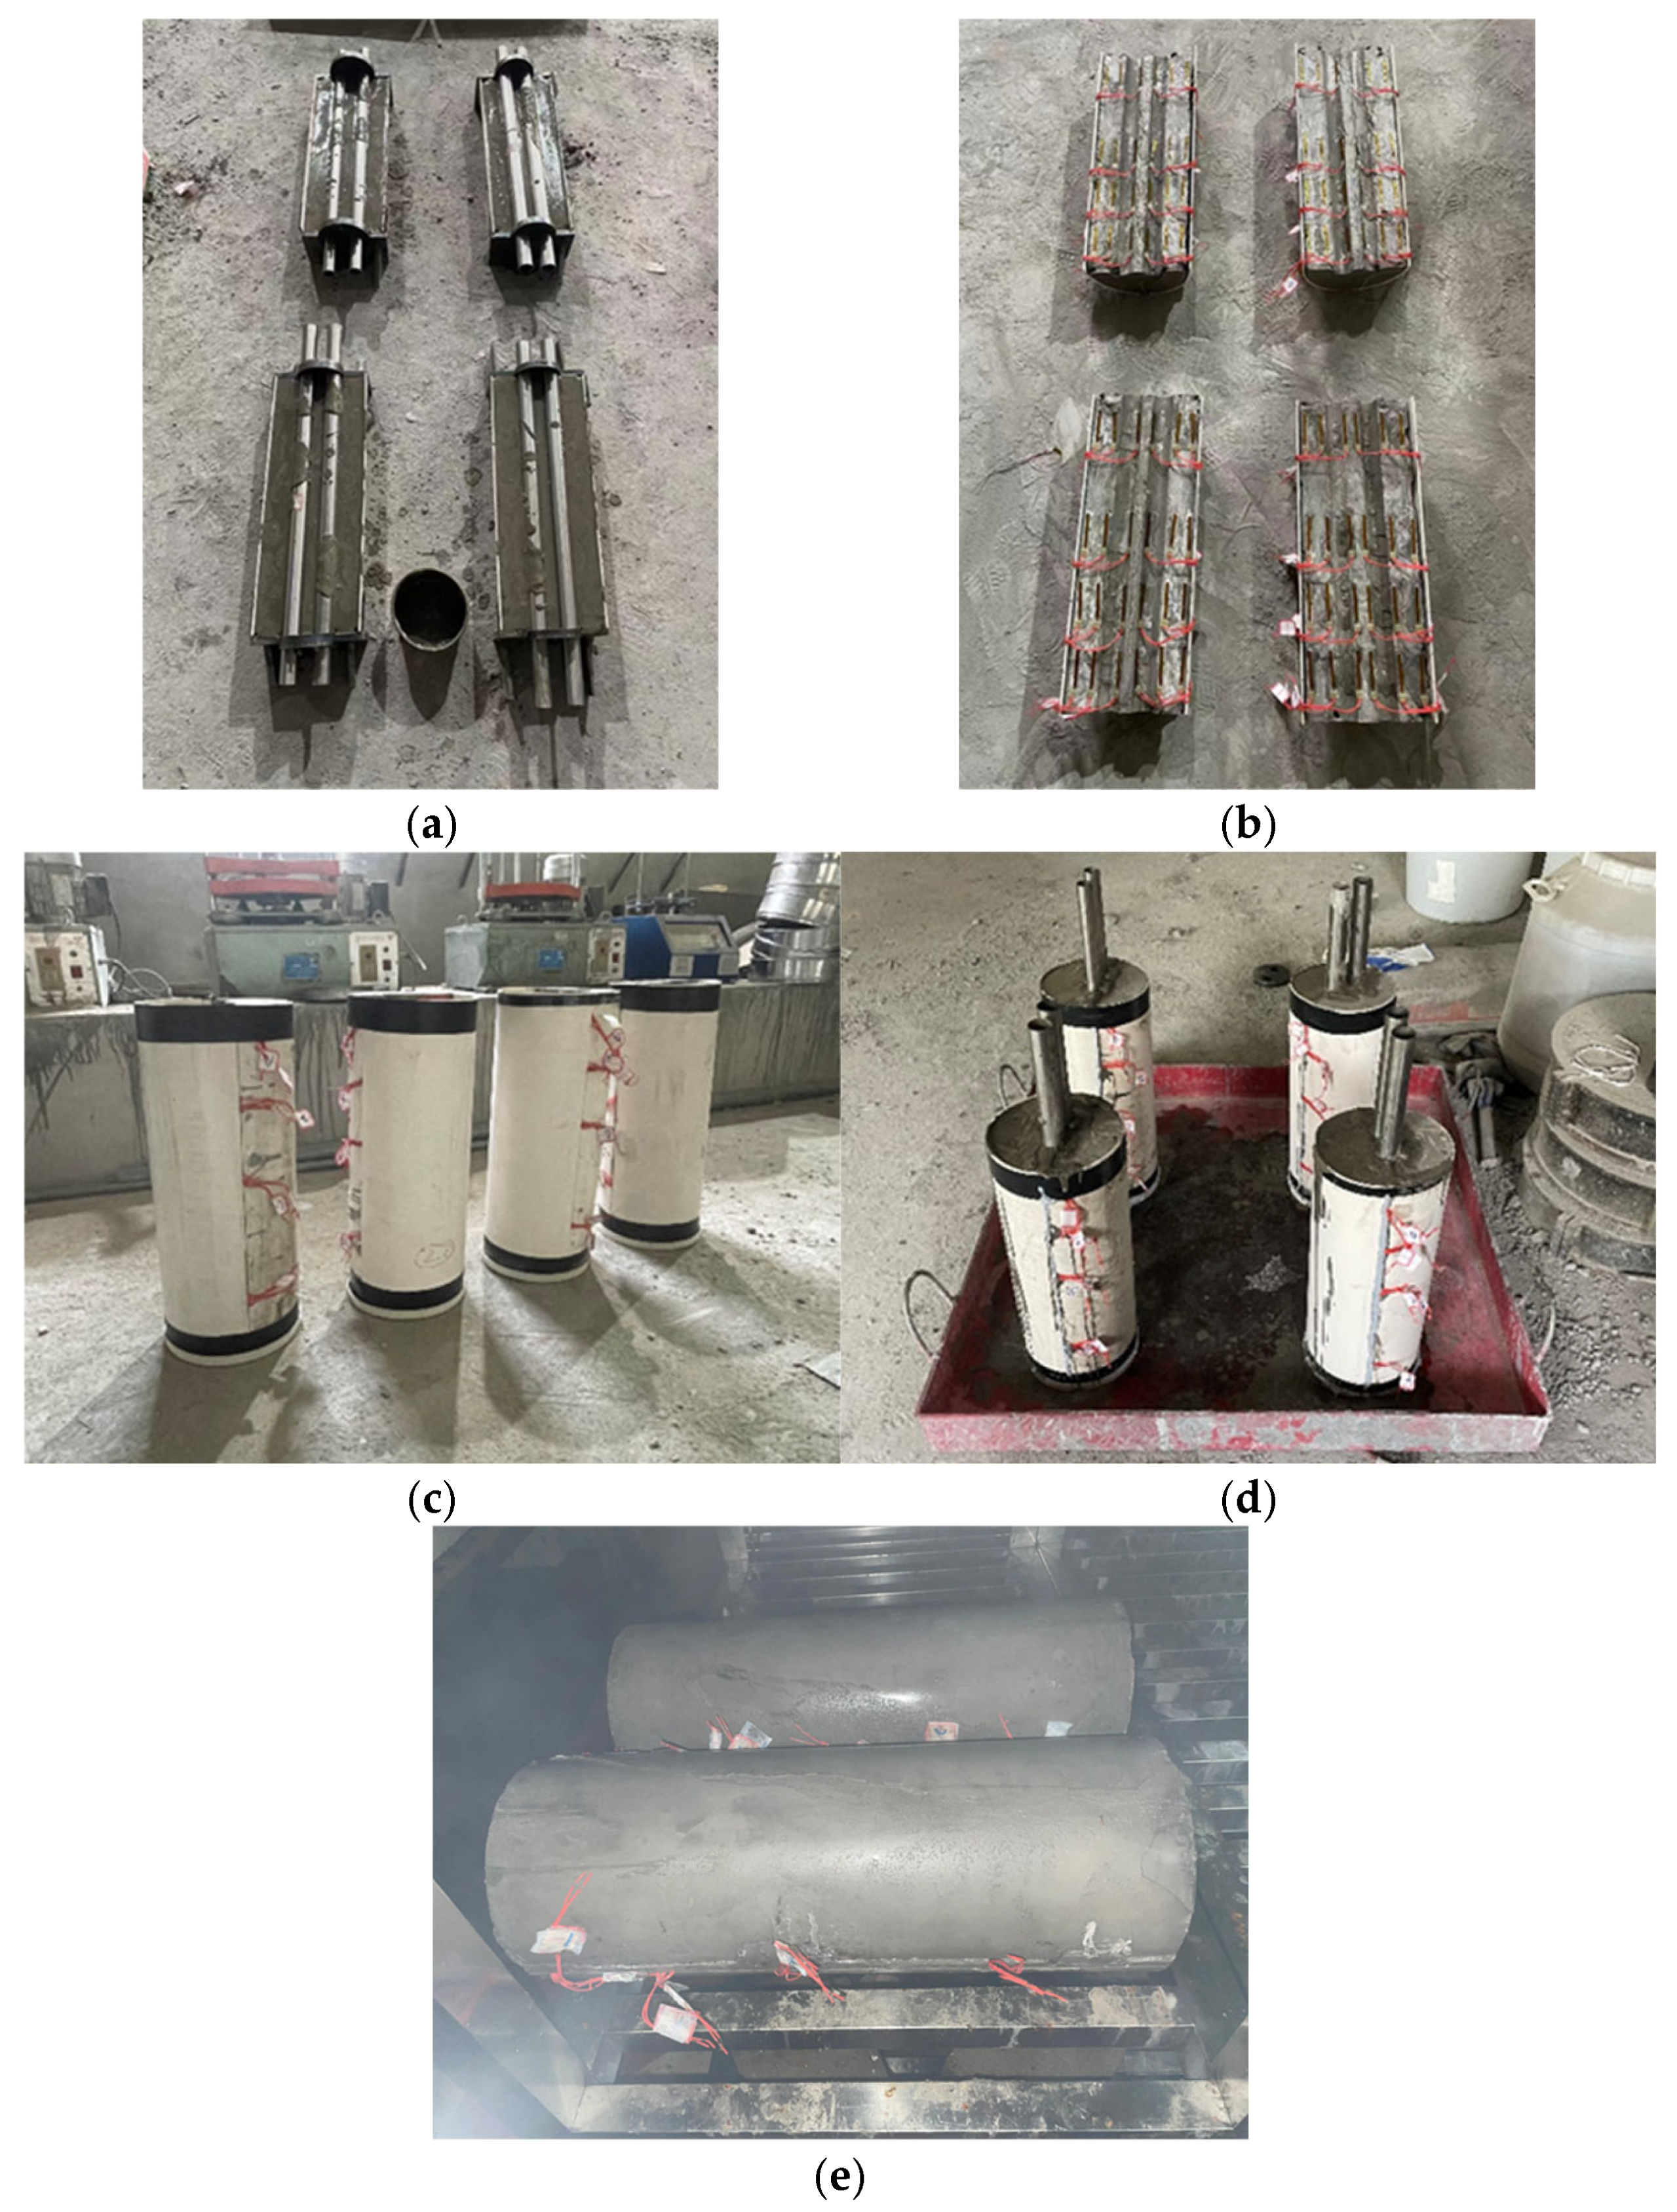
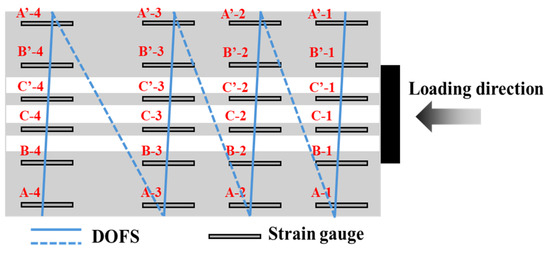
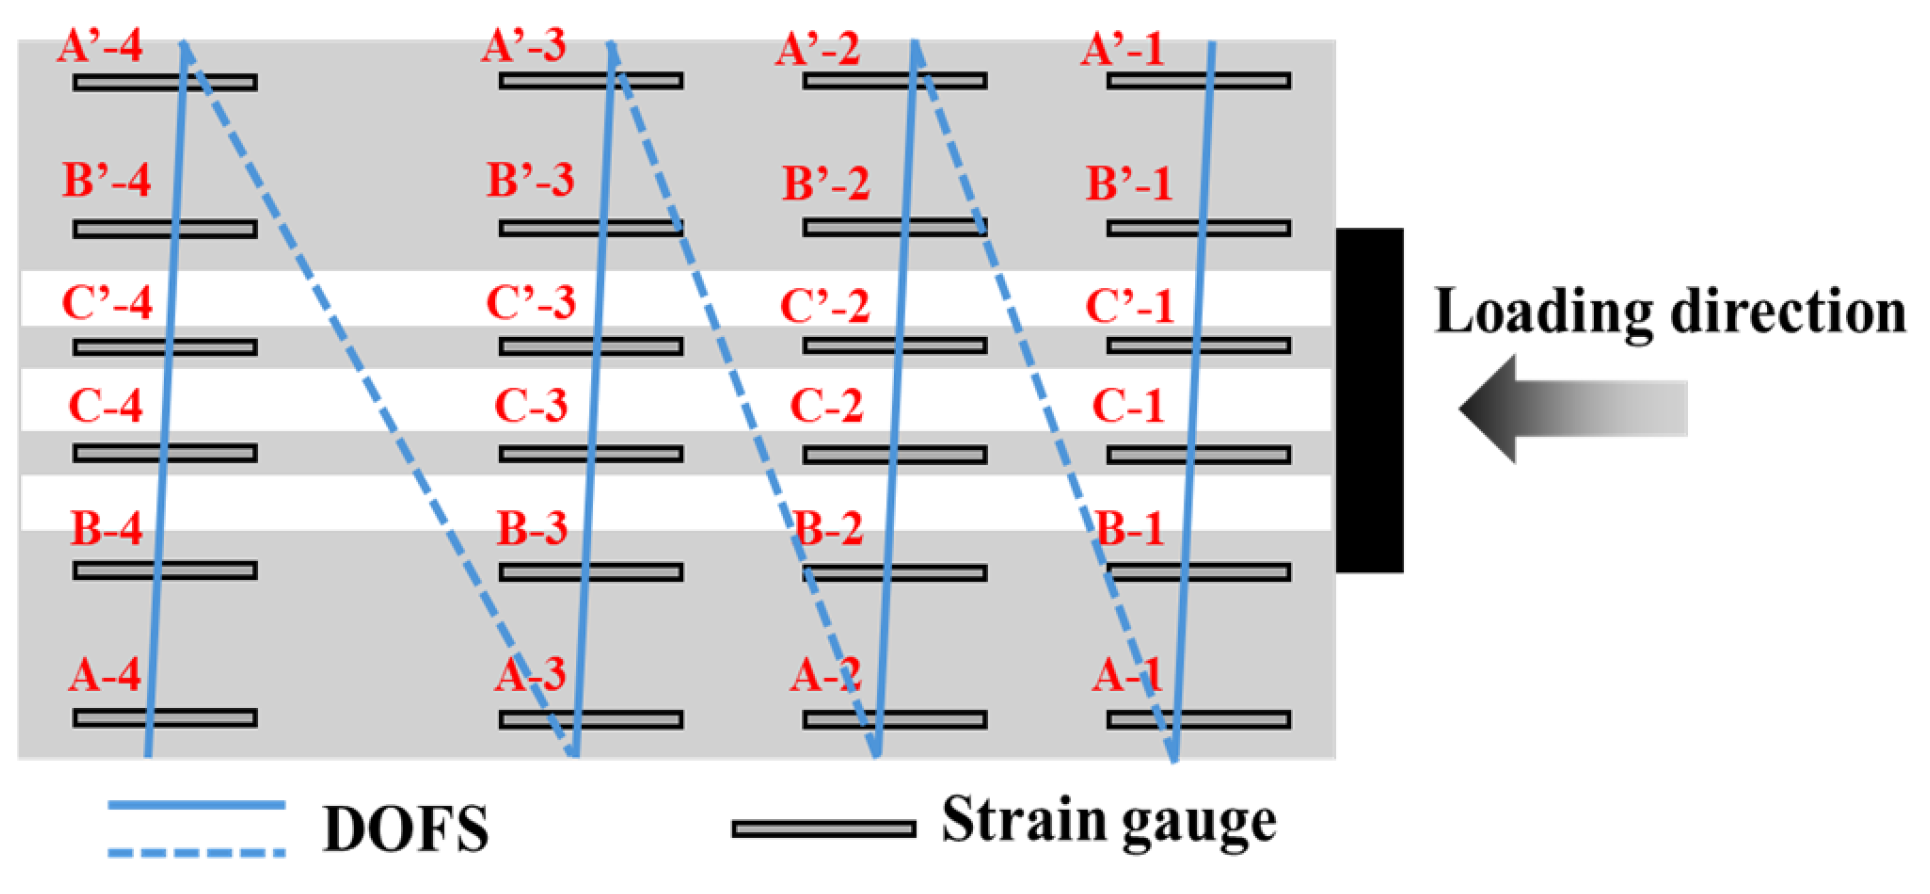
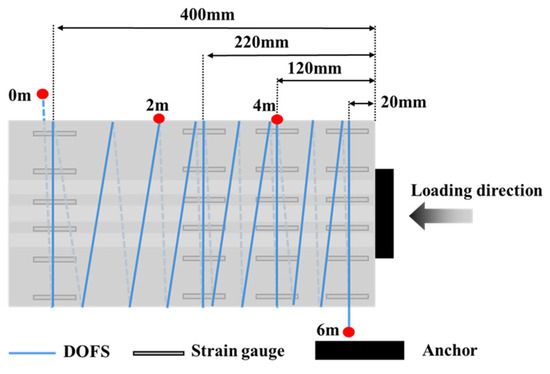
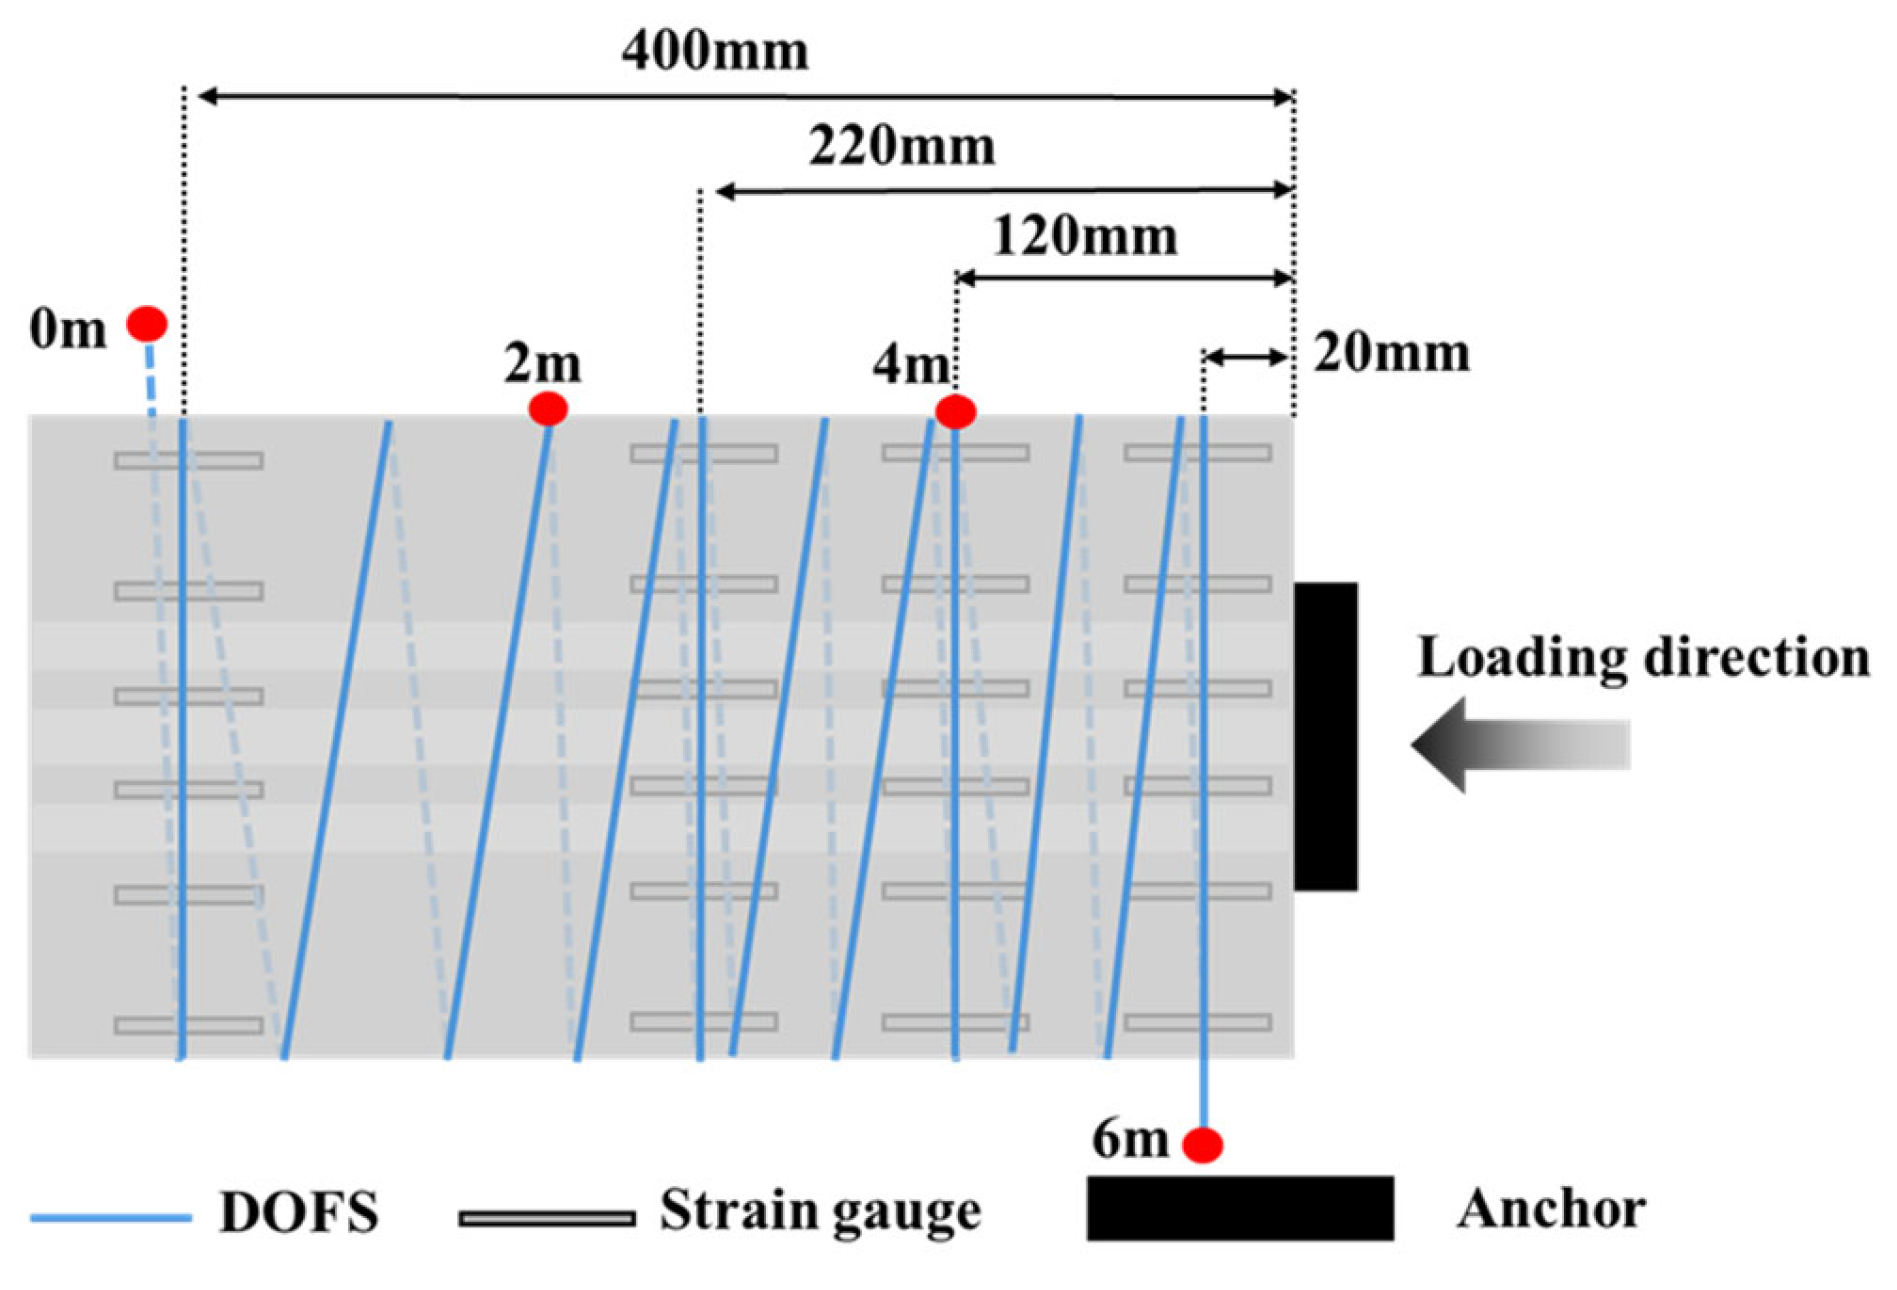
The specimen fabrication process is depicted in Figure 4, where the PVC tube is longitudinally split into two symmetrical semi-cylindrical segments along the grout axis, and both ends are sealed with custom-designed anchor body supports. The specified anchor body and steel pipe are selected, and the steel pipe is sequentially inserted through the pre-arranged strand and grout orifices in the anchor body, followed by secure attachment to the custom-designed anchor body supports. The assembly is then cast to achieve the final configuration, as shown in Figure 4a. Following the initial setting of the cement and upon achieving sufficient strength, strain gauges are installed at predetermined measurement locations within the grout body. To improve waterproofing durability, a uniform layer of silicone rubber sealing material is applied over the strain gauges and surrounding areas, as shown in Figure 4b. One half of the grout specimens is vertically positioned and aligned with the corresponding PVC segments on the opposite side. PVC end caps are secured at the bottom, and all joints are sealed with silicone sealant to ensure mold airtightness, as illustrated in Figure 4c. Subsequently, steel pipes were inserted into pre-designed orifices prior to injecting cement grout into the mold. This procedure ensured precise control over the internal dimensions of the grout’s orifices, as illustrated in Figure 4d. After the grout had fully solidified and hardened, the specimens were carefully demolded and transferred to a standard curing environment for a continuous curing period of 28 days, as shown in Figure 4e. Upon completion of this curing phase, distributed optical fiber sensing (DOFS) was helically wound around the external surface of the grout specimens. The DOFS was oriented in a nearly horizontal direction, ensuring that the winding radius closely matched the geometric radius of the specimens. A uniform layer of epoxy resin adhesive was then applied to securely bond the DOFS to the grout surface, as shown in Figure 5. Finally, the specimens were placed in a cool, well-ventilated environment for 12 h to allow complete curing of the adhesive.
Figure 4.
The grout specimens preparation process: (a) Pouring of the segmental grout; (b) Pasting the strain gauge; (c) Mold assembly; (d) Pouring of the monolithic grout; (e) Curing of grout.
Figure 5.
Schematic diagram of DOFS and strain gauge.
2.2. Strain Measurement
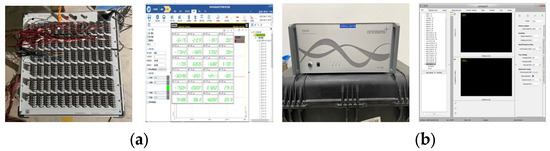
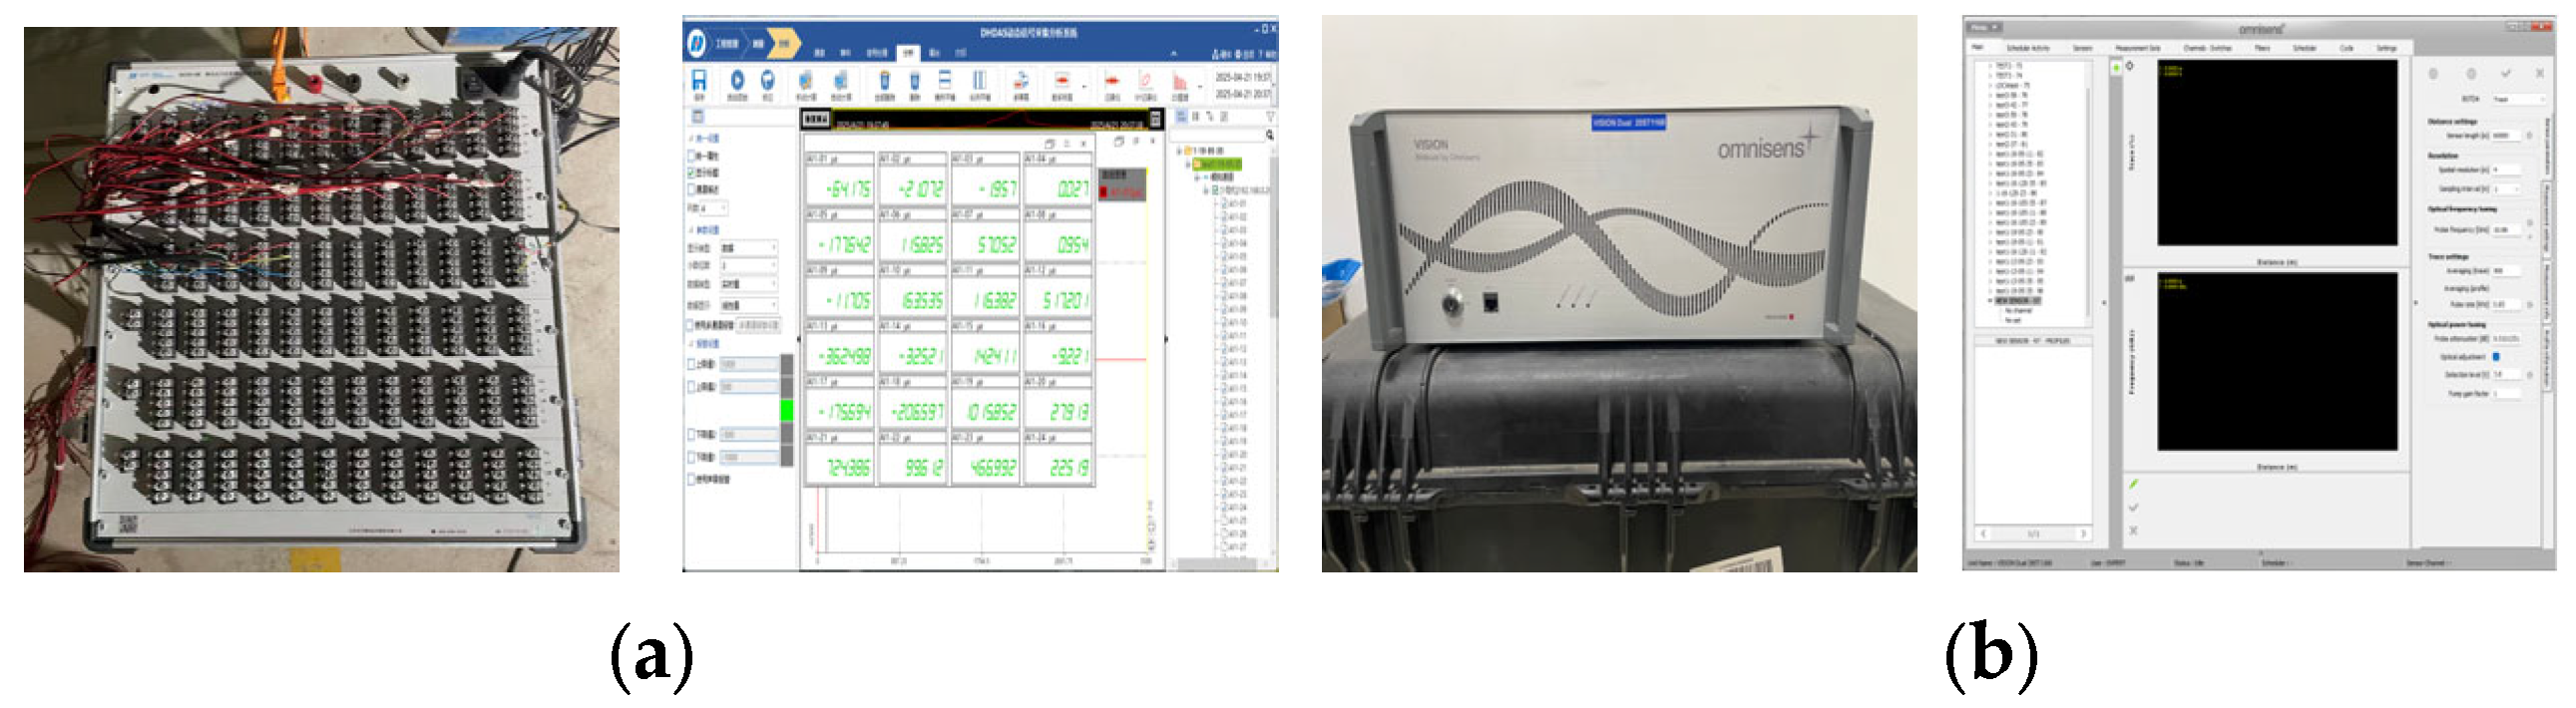
As shown in Figure 6a, the experiment utilized the DH3816N static stress–strain testing and analysis system to collect data on the internal axial strain of the grout. The DH3816N static stress-strain testing and analysis system is manufactured by DongHua Testing Technology Co., Ltd., based in Jingjiang City, China. Specifically, strain gauges were installed at internal locations along the grout to measure its axial strain. As shown in Figure 6b, the external radial strain of the grout was measured using the DOFS temperature and strain sensing system. The DOFS temperature and strain sensing system is manufactured by Omnisens SA, headquartered in Morges, Switzerland. By helically winding the DOFS along the surface of the grout, the helical winding radius closely approximates the geometric radius of the grout, thereby enabling circumferential stress on the DOFS to approximate radial stress. Finally, based on strain measurements obtained from each section, internal axial stress distribution within the grout and radial stress distribution along its height were calculated.
Figure 6.
The strain measurement system: (a) DH3816N Static Stress and Strain Testing and Analysis System; (b) Distributed Optical Fiber Temperature and Strain Sensing System.
2.3. Experimental Equipment
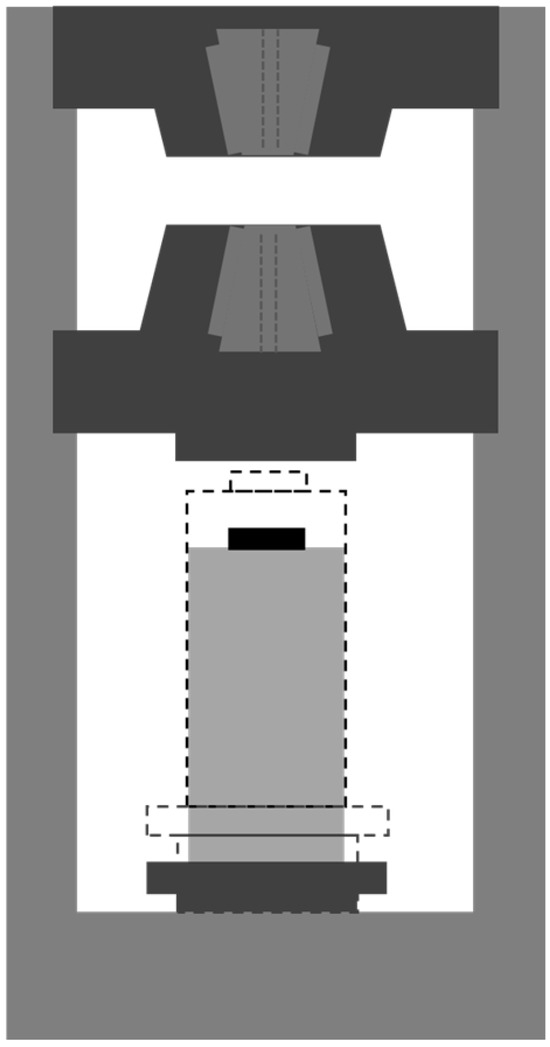
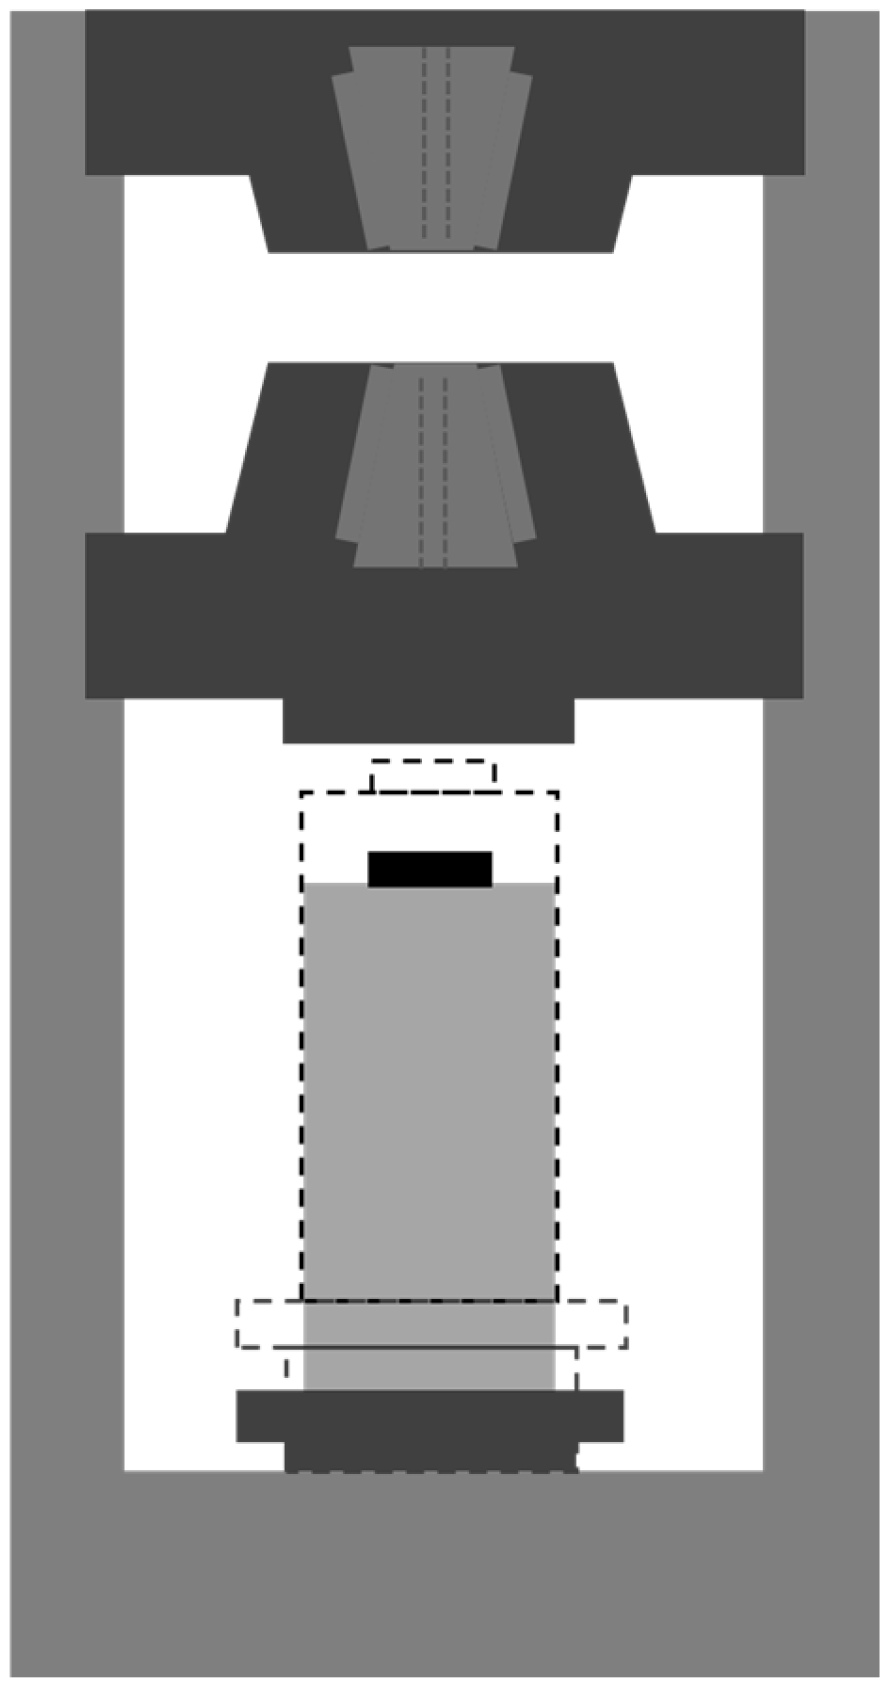
As shown in Figure 7, the experimental setup used in this study consisted of a WAW-1000 microcomputer-controlled electro-hydraulic servo universal testing machine manufactured by Shanghai Hualong Test Instruments Corporation, Shanghai, China. The apparatus has a rated maximum load capacity of 1000 kN. The experiment was conducted using a constant loading rate of 0.32 MPa/s throughout the entire procedure until completion. The loading system primarily consisted of a bottom-mounted hydraulic cylinder and an adjustable four-column mainframe structure.
Figure 7.
Schematic diagram of the loading process of grout specimens.
3. Ultimate Load-Bearing Capacity of the Grout
The ultimate load-bearing capacity test results of the grout are presented in Table 1. The designation 1-16-95-11 denotes the 1st anchor body with a height of 16 mm, a diameter of 95 mm, and a perforation ratio of 11%.
Table 1.
Ultimate load-bearing capacity of the grout.
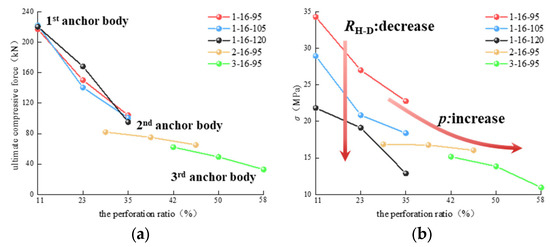
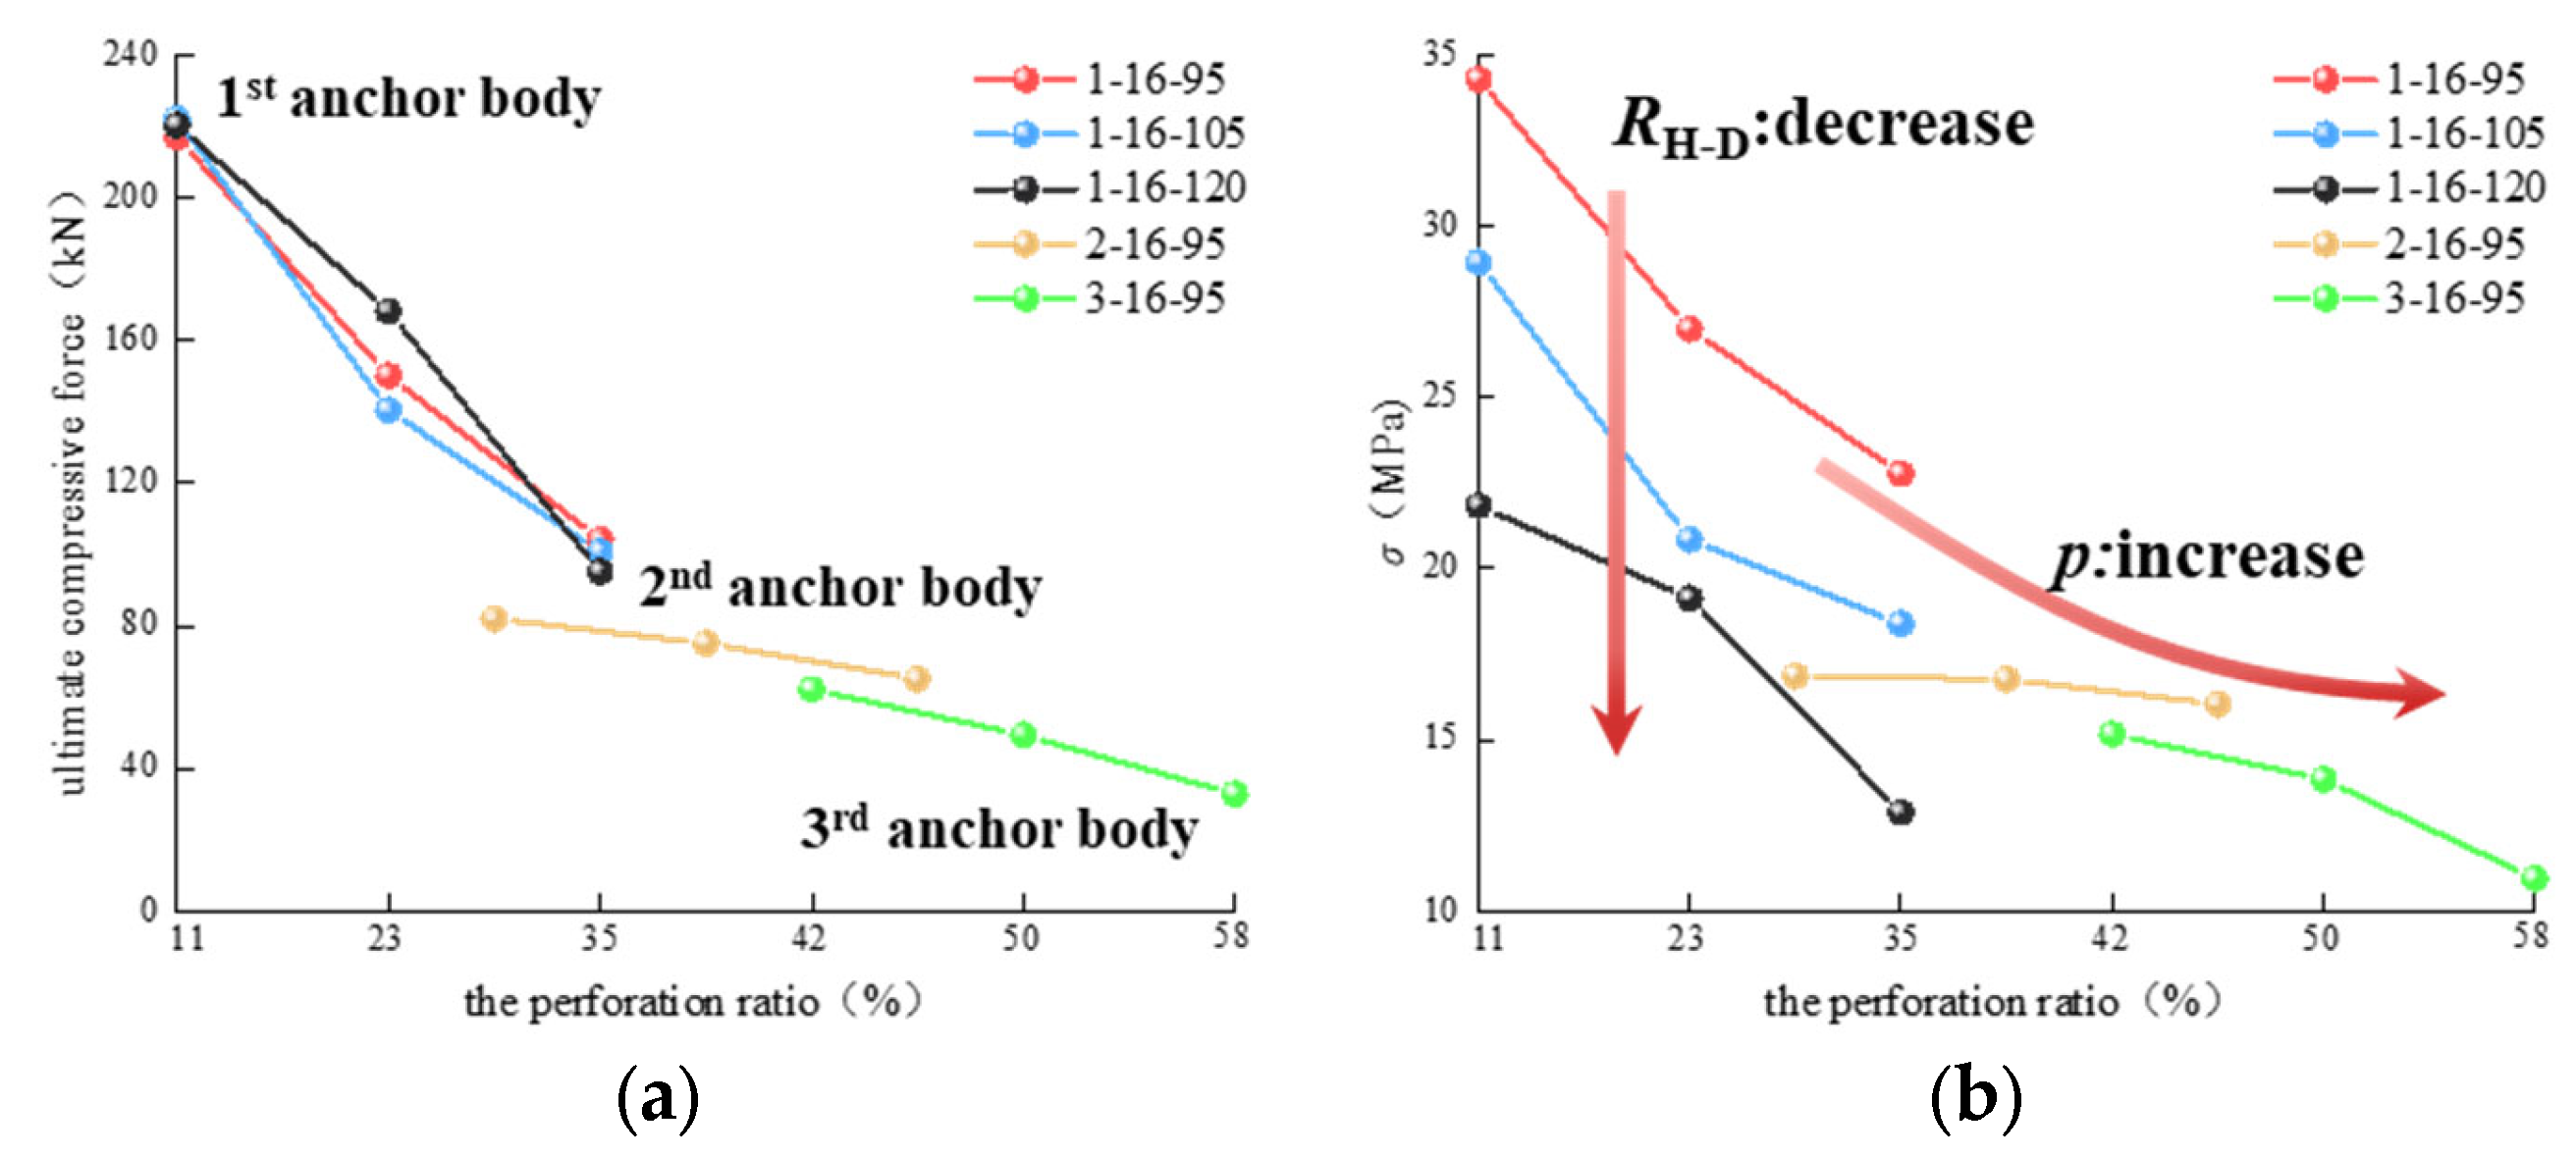
The experimental results are presented in Figure 8a. For 1st anchor body, as the perforation ratio increases, the ultimate load-bearing capacity of the grout exhibits a decreasing trend under varying height-to-diameter ratio conditions. When the perforation ratio reaches 11%, the load-bearing capacity of all specimens reaches its maximum value, approximately 220 kN. As the perforation ratio increases to 35%, the load-bearing capacity decreases to its minimum value of approximately 100 kN, representing a maximum reduction of approximately 120 kN.
Figure 8.
The influence of anchor body structure on load-bearing capacity: (a) the ultimate compressive force; (b) the axial stress.
As illustrated in Figure 3 and previously discussed, the structural design of the anchor body is achieved by increasing the number of strand orifices while maintaining a constant aperture size, which effectively reflects the variation in the perforation ratio. In the three experimental groups with identification numbers 1-16-95-23, 2-16-95-37, and 3-16-95-50, the perforation ratios were 23%, 37%, and 50%, respectively, representing a gradient interval of approximately 14%. As the perforation ratio increases, the ultimate load-bearing capacity of the specimen exhibits a significant decreasing trend, declining from 150 kN to 75 kN and further decreasing to 49 kN. In particular, the ultimate load-bearing capacity of the grout corresponding to the 3rd anchor body is 49 kN, which represents only 32.9% of the ultimate load-bearing capacity of the 1st anchor body (150 kN), indicating a significant relative reduction of approximately 67%.
As shown in Figure 8b, the ultimate load-bearing capacity of grout with three types of anchor bodies exhibits a decreasing trend as the perforation ratio increases. The increase in perforation ratio leads to a significant reduction in the load-bearing capacity of the grout, exhibiting a pronounced decreasing trend. Under the condition of maintaining a constant height-to-diameter ratio, there is significant variation in sensitivity to changes in porosity. The 1st anchor body exhibits the highest sensitivity to changes in perforation ratio: when the perforation ratio increases from 11% to 35%, the grout stress decreases significantly from 34.29 MPa to 22.78 MPa, with a reduction of 11.51 MPa, representing a relative decrease of approximately 33.57%. In comparison, the 2nd anchor body exhibits the lowest sensitivity, with a stress variation of only 0.83 MPa when the perforation ratio ranges from 31% to 37%. The 3rd anchor body demonstrates intermediate sensitivity compared to both other bodies, with a stress variation of 4.20 MPa.
At the height-to-diameter ratio of 17%, the maximum stress in the grout of the 1st anchor body reached 34.29 MPa, significantly exceeding the values recorded in the 2nd anchor body (16.87 MPa) and the 3rd anchor body (15.16 MPa), indicating that the structural configuration of the 1st anchor body provides superior load-bearing capacity. The root cause lies in the increased perforation ratio of the anchor body orifices, which results in an expansion of both the total volume of strand orifices and grout orifices, thereby compromising the structural integrity of the grout and intensifying stress concentration effects.
As the height-to-diameter ratio decreases from 17% to 13% at a constant perforation ratio of 11%, the stress decreases significantly from 34.29 MPa to 21.84 MPa, with an absolute reduction of 12.45 MPa and a relative reduction of approximately 36.31%. When at a height-to-diameter ratio of 13%, the stress value is only 63.69% of that observed at a height-to-diameter ratio of 17%. When the perforation ratio reaches 23%, the stress decreases from 27.39 MPa to 19.13 MPa, with an absolute reduction of 8.26 MPa and a relative reduction of approximately 30.16%. When the perforation ratio reaches 35%, the stress decreases from 22.77 MPa to 12.88 MPa, resulting in an absolute reduction of 9.89 MPa and a relative reduction of approximately 43.43%. The aforementioned phenomenon indicates that a reduction in the height-to-diameter ratio, while maintaining a constant anchor body height, results in an increased specimen diameter, thereby significantly enhancing the interfacial contact area between the specimen and grout. The enlarged contact area improves the uniformity in stress distribution, reduces stress concentration, and enables the grout to fully develop its load-bearing capacity.
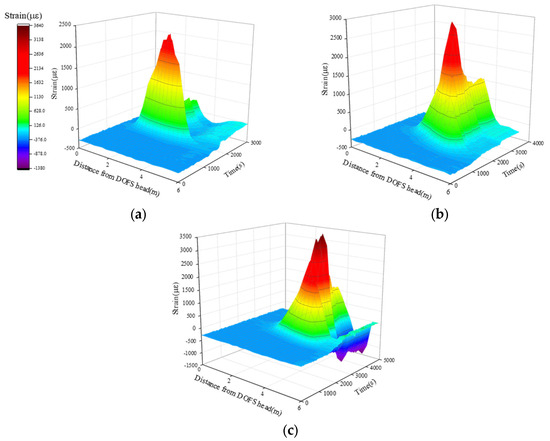
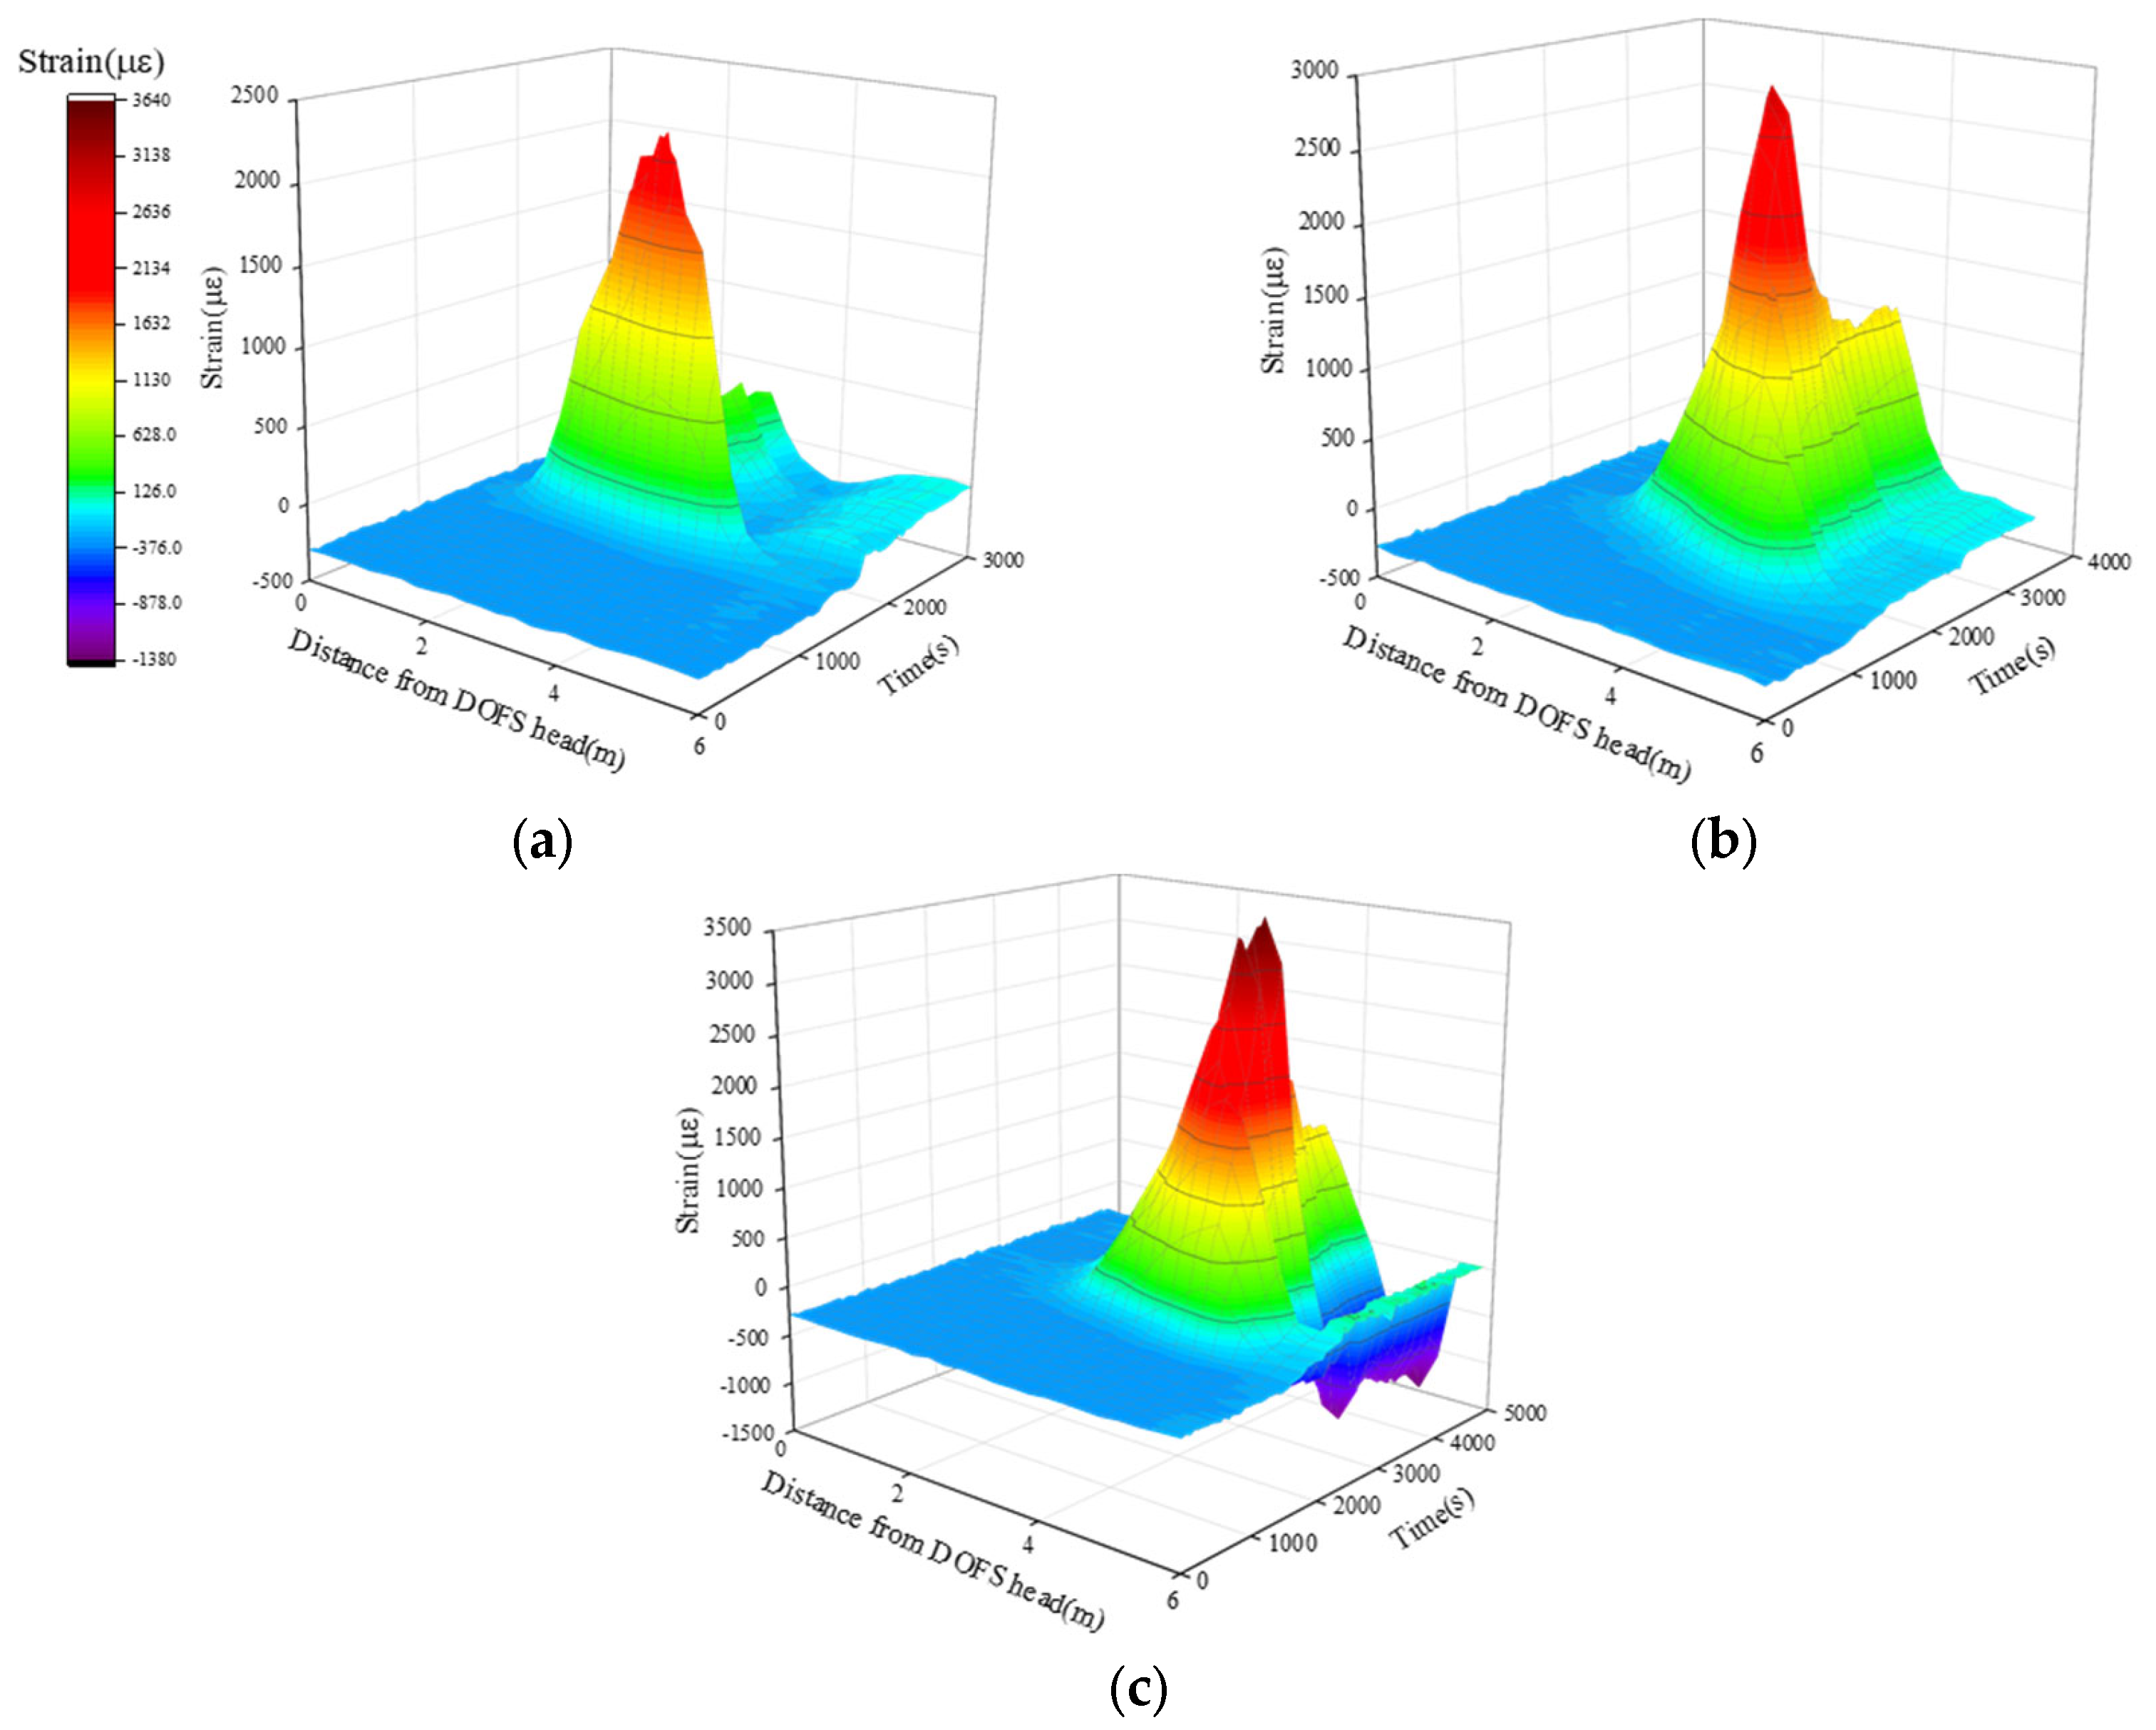
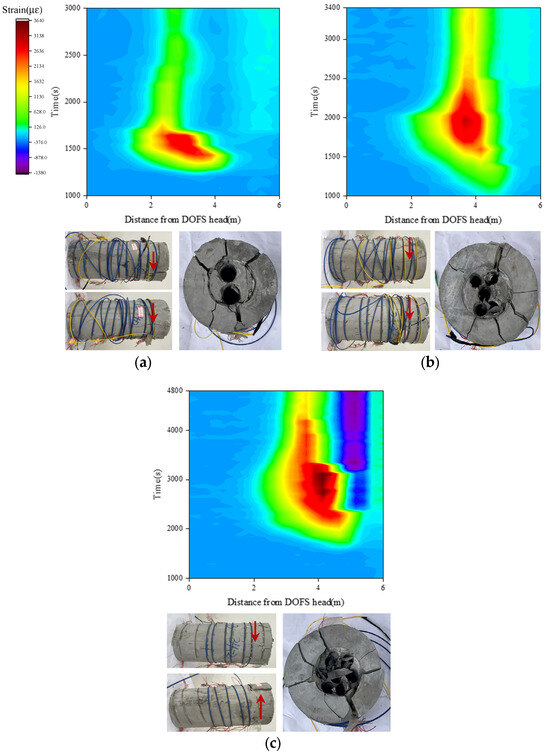
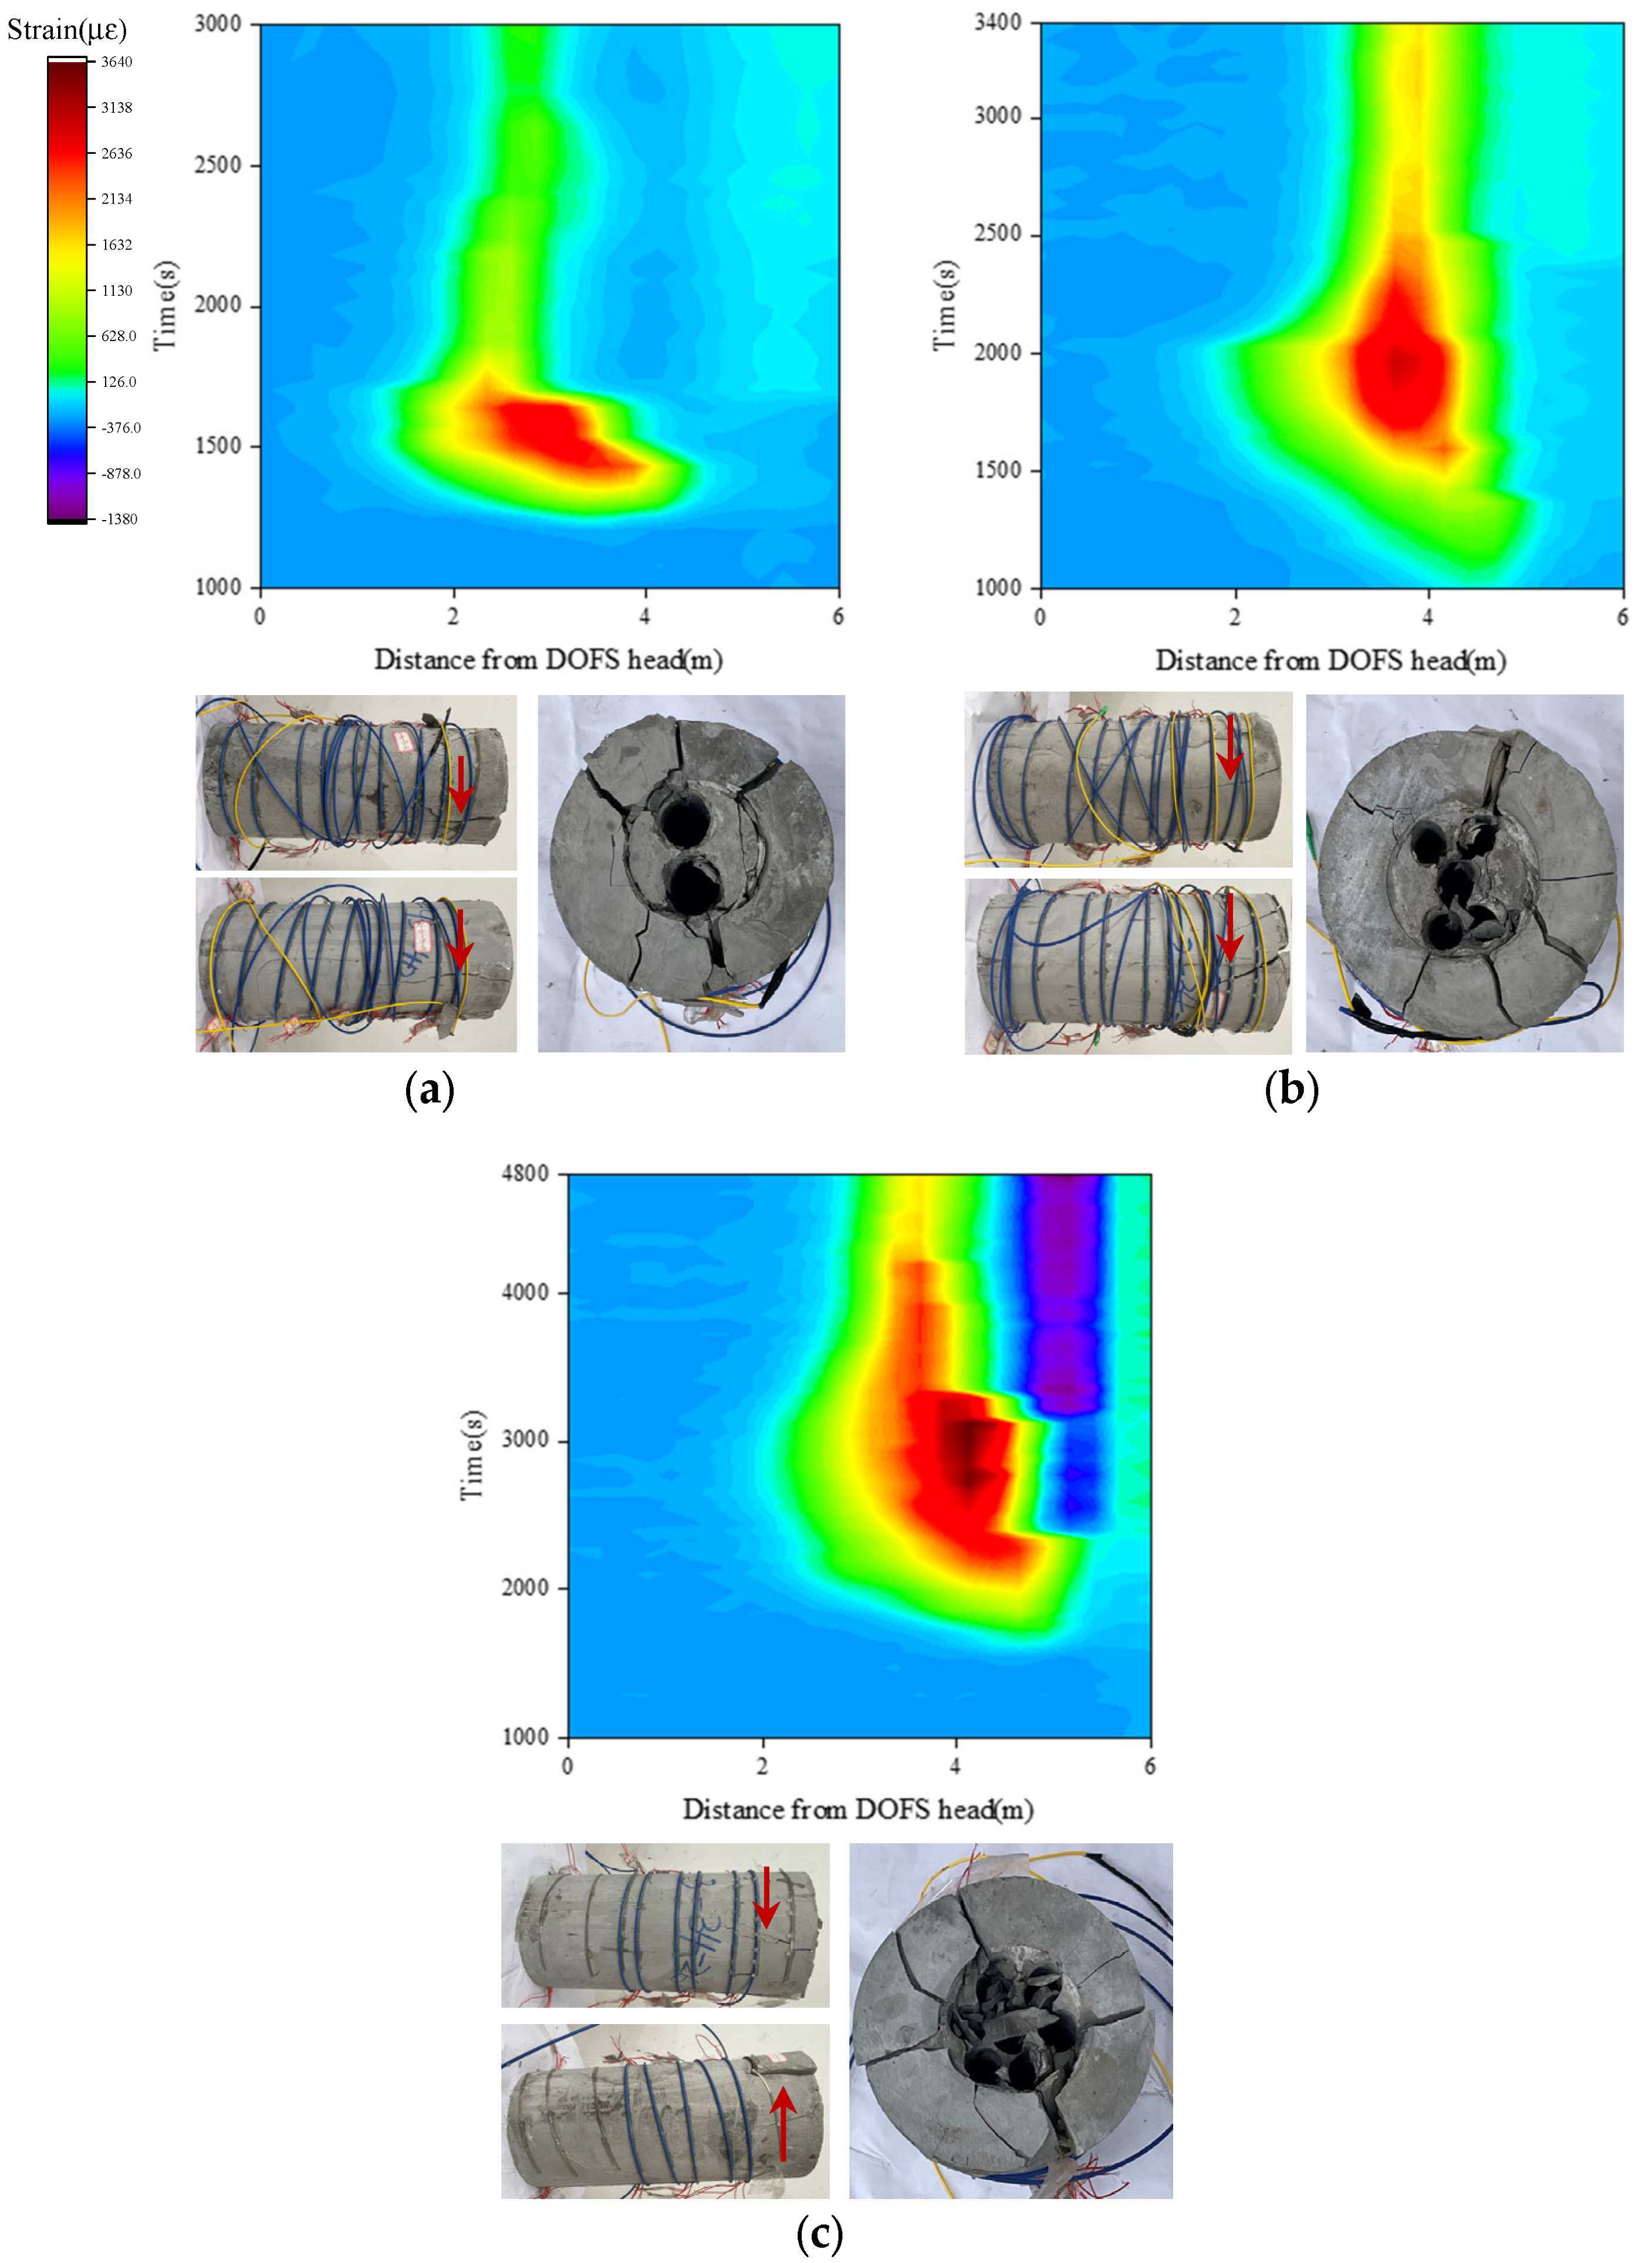
As shown in Figure 9, the schematic illustrates the arrangement of DOFS points. Specimen groups 1-16-95-35, 2-16-95-43, and 3-16-95-58 were selected. These radial strain data of the specimens during the entire loading process are acquired using DOFS, based on which a three-dimensional spatiotemporal evolution diagram of the strain field is constructed, as shown in Figure 10. The results indicate that radial strain is predominantly concentrated in the central region of the specimens. When the structural configuration of the anchor body changes—specifically with an increase in the perforation ratio—the peak microstrain exhibits a significant upward trend. Following the attainment of peak stress, the specimen’s residual strain increases.
Figure 9.
Arrangement of DOFS.
Figure 10.
Three-dimensional visualization of the spatiotemporal evolution characteristics of radial strain: (a) 1-16-95-35; (b) 2-16-95-43; (c) 3-16-95-58.
Based on the three-dimensional visualization of the spatiotemporal evolution of radial strain, representative loading stages were selected for comparative analysis. This study investigates the distribution and evolutionary characteristics of radial strain in specimens with different anchor body structural configurations, with a specific focus on variation in perforation ratio.
As illustrated in Figure 11a, the core radial strain of the 1-16-95-35 group is predominantly concentrated within the 2–4 m segment along the DOFS, with a peak microstrain reaching 2300 με. The residual strain after the peak stress is relatively low. The contact area between the specimen’s front surface and the anchor body exhibited more pronounced compressive failure, particularly near the orifice and along the edges of the anchor body contact zone, where damage was significantly more severe. Radial cracks developed in the non-contact area between the specimen’s front surface and the anchor body, while lateral cracks were predominantly oriented longitudinally parallel to the loading direction, penetrating through the entire specimen and exhibiting characteristic axial compression failure patterns.
Figure 11.
Radial strain variation during the loading process and specimen failure: (a) 1-16-95-35; (b) 2-16-95-43; (c) 3-16-95-58.
As illustrated in Figure 11b, the radial strain of the 2-16-95-43 specimen group is predominantly distributed within the 2.5–4.2 m segment, with the overall strain distribution showing a discernible shift toward the loading direction compared to that of the 1-16-95-35 specimen group. The peak microstrain of this group was 2960 με, representing an increase of 660 με compared to the 1-16-95-35 group and a growth rate of 28.7%. In the contact area between the specimen’s front surface and the anchor body, compressive failure was also observed. The extent of damage near the orifice and at the contact edge was more severe compared to that of the 1-16-95-35 group, with localized compressive failure occurring around the perimeter of the orifice. Radial cracks also developed in the non-contact regions surrounding both the specimen and anchor body, while lateral cracks exhibited an oblique distribution. The underlying cause lies in the compressive effect exerted by the anchor body on the periphery of the specimen during the embedding process, which induces significant radial strain.
As illustrated in Figure 11c, the radial strain of the 3-16-95-58 specimen group is predominantly concentrated within the 3–5 m segment, demonstrating a more pronounced shift in strain distribution toward the loading direction compared to those of the 1-16-95-35 and 2-16-95-43 specimen groups. The peak microstrain of this group reached 3640 με, representing an increase of 1340 με compared to that of the 1-16-95-35 group, with a growth rate of 58.3%, and an increase of 680 με compared to that of the 2-16-95-43 group, with a growth rate of 23.0%. Severe crushing was observed in the contact area between the specimen and anchor body, accompanied by the initiation and propagation of through-thickness cracks. Radial cracks were observed in non-contact regions surrounding both the specimen and anchor body, while lateral cracks extended only to approximately one-third of the specimen’s height, where large fragments of cementitious material were present. The primary cause lies in the further embedding of the anchor body into the specimen, which exerts substantial compressive forces on the surrounding area, resulting in localized stresses that exceed the tensile strength of the cement and lead to failure in regions adjacent to the anchor body.
With variation in the type of anchor body, particularly as the perforation ratio increases, the peak strain progressively intensifies and shifts closer to the anchor body. The failure mode transitions from axial compression failure to compressive failure radiating outward from the anchor body. Post-failure, the residual strain of the specimen progressively increases, indicating a gradual intensification of damage.
4. Numerical Simulation
4.1. Finite Difference Simulation for LDCA
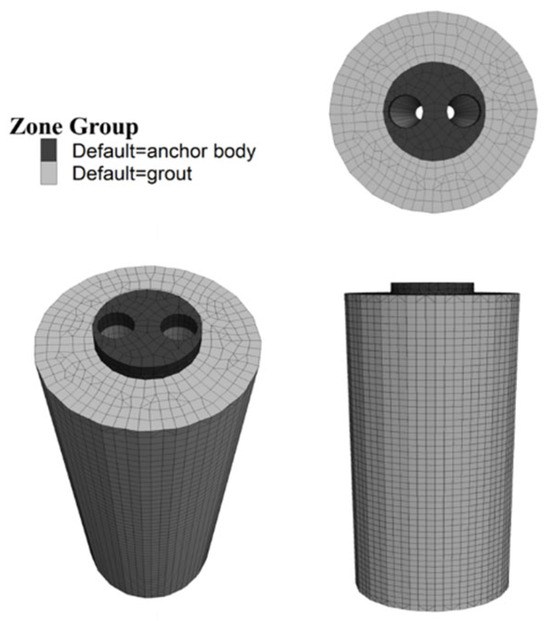
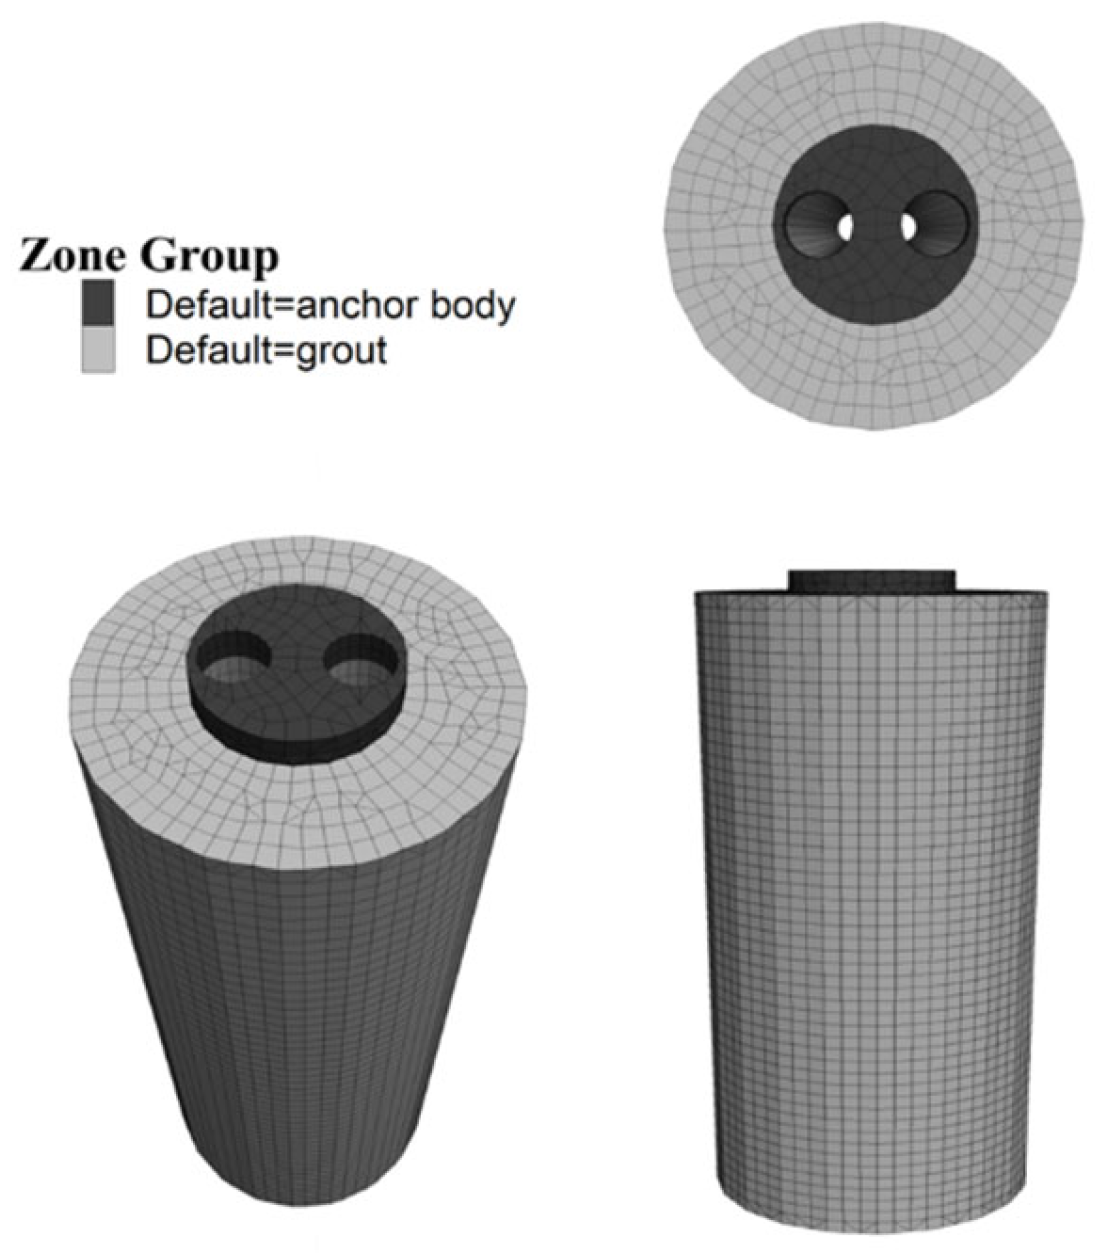
This study is based on model testing and employs the finite difference method, in which the grout is represented using a Mohr–Coulomb constitutive model. Both the grout and the anchor body are modeled using solid elements. The anchor body is assigned a Young’s modulus of 200 GPa, a Poisson’s ratio of 0.20, and a unit weight of 78.5 kN/m3, while the grout is assigned a Young’s modulus of 20 GPa, a Poisson’s ratio of 0.25, and a unit weight of 23.0 kN/m3. As illustrated in Figure 12, the model consists of two primary components: the anchor body and the grout. Both components have identical geometric dimensions. Specifically, the grout has a diameter of 200 mm and a length of 500 mm.
Figure 12.
Schematic diagram of the numerical model.
4.2. Model Validation
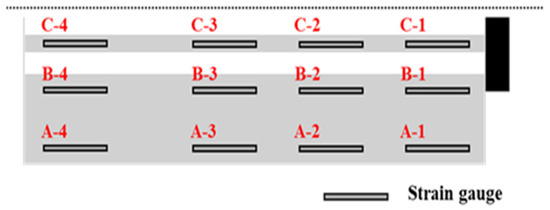
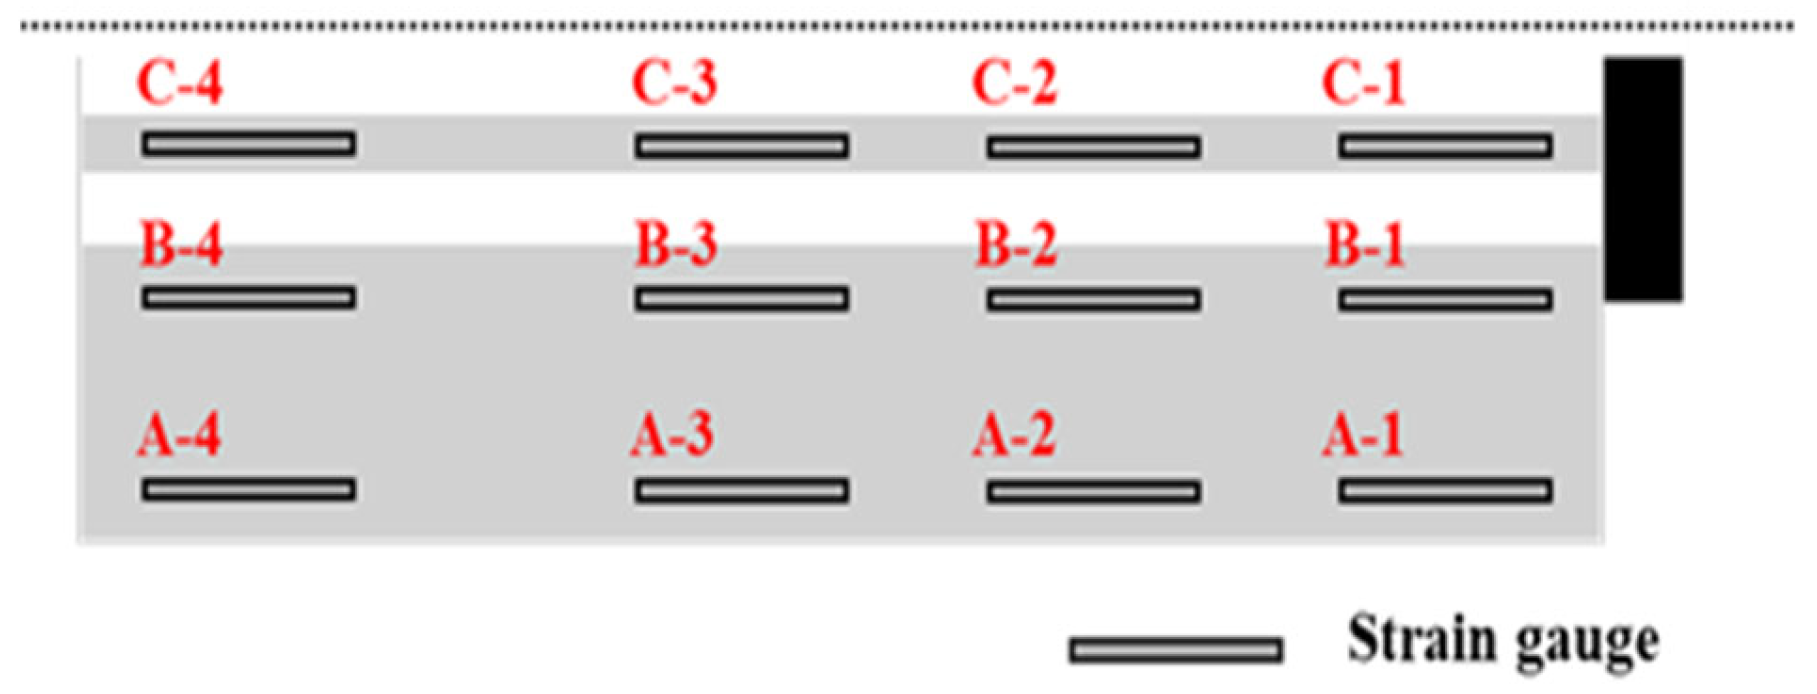
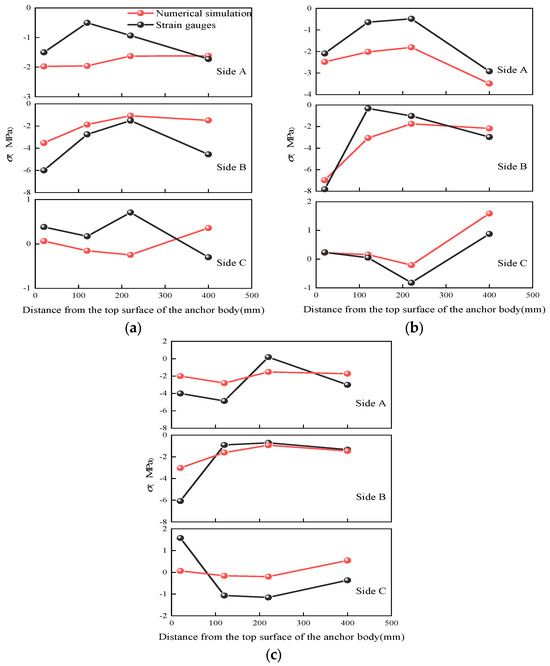
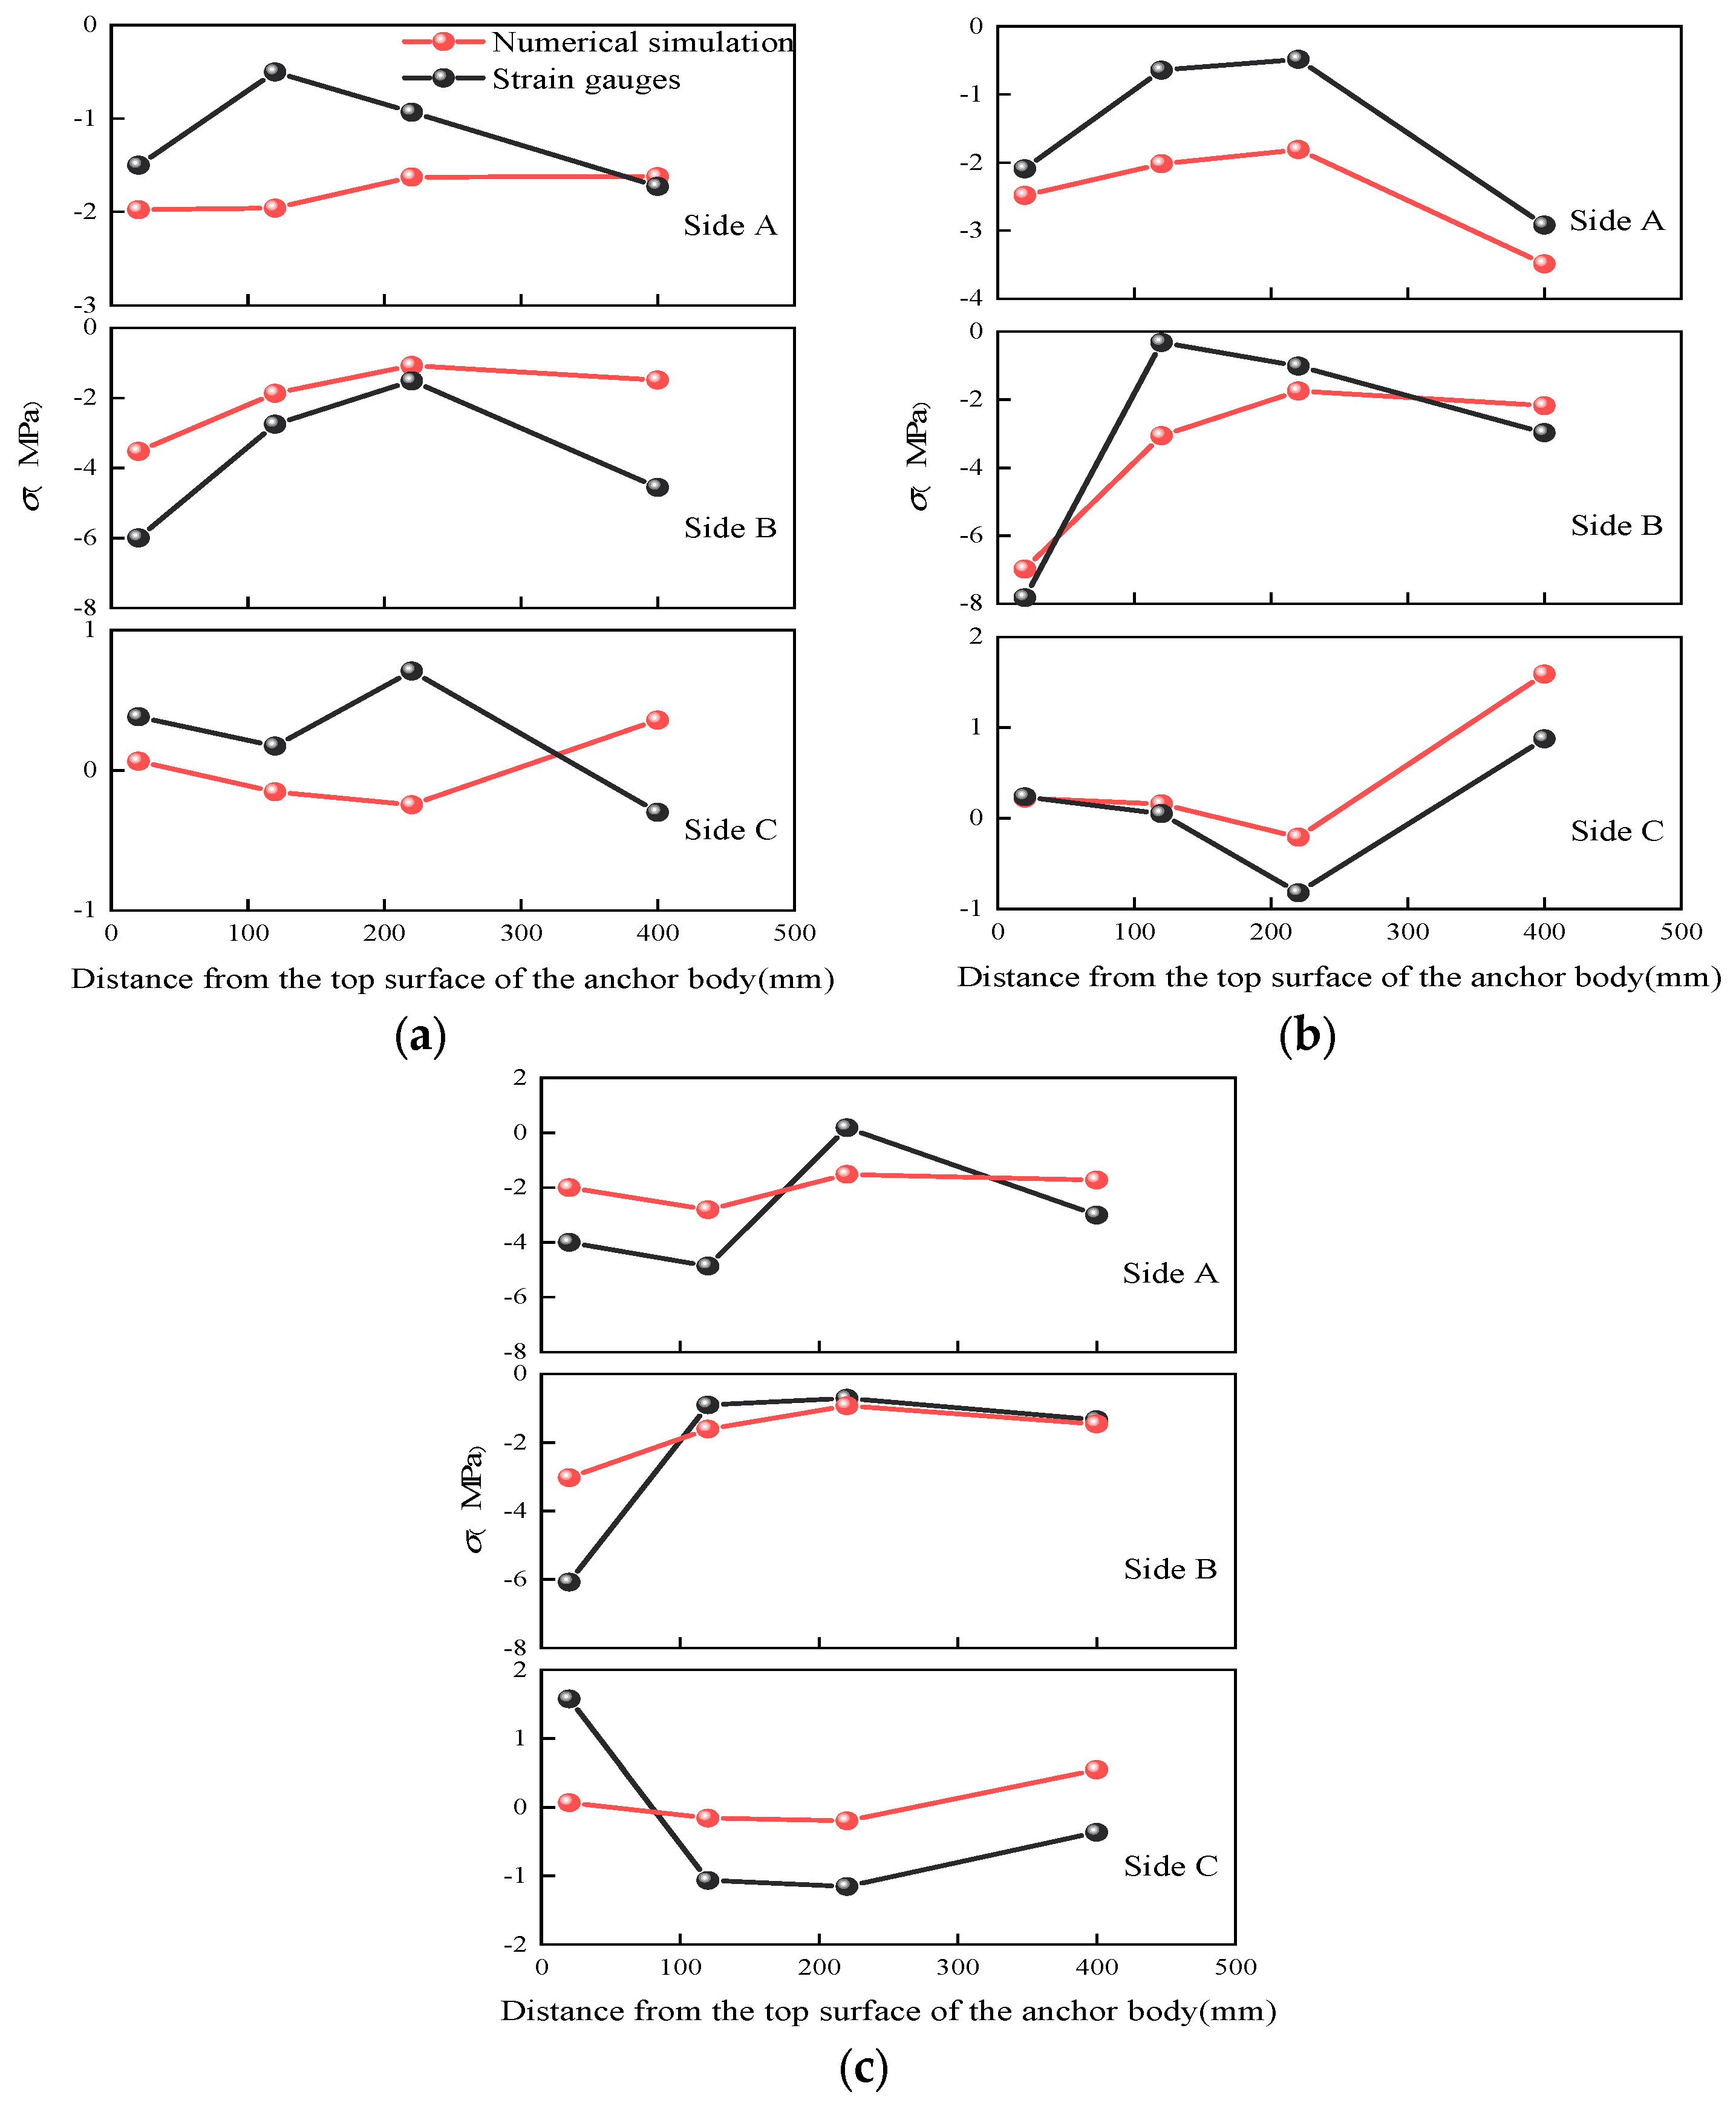
As illustrated in Figure 13, in the preceding model test, the strain gauges within the specimen are symmetrically arranged, and the measurement data from the strain gauges on the right side were selected for comparison with the numerical simulation results. The results indicate that the internal force distribution obtained from numerical simulations shows a high degree of consistency with the experimental measurements. The simulated values align well with the experimental data in terms of overall trend, thereby validating the rationality of the adopted numerical model and its parameter selection, as shown in Figure 14.
Figure 13.
Arrangement of strain gauges on the right side.
Figure 14.
Comparison between the numerical simulation model and the physical model test: (a) 1-16-95-11; (b) 1-16-95-23; (c) 1-16-95-35.
5. Internal Stress Analysis
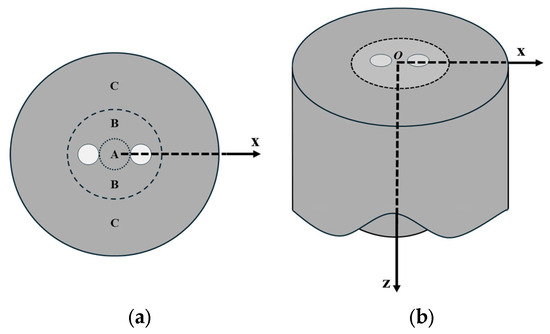
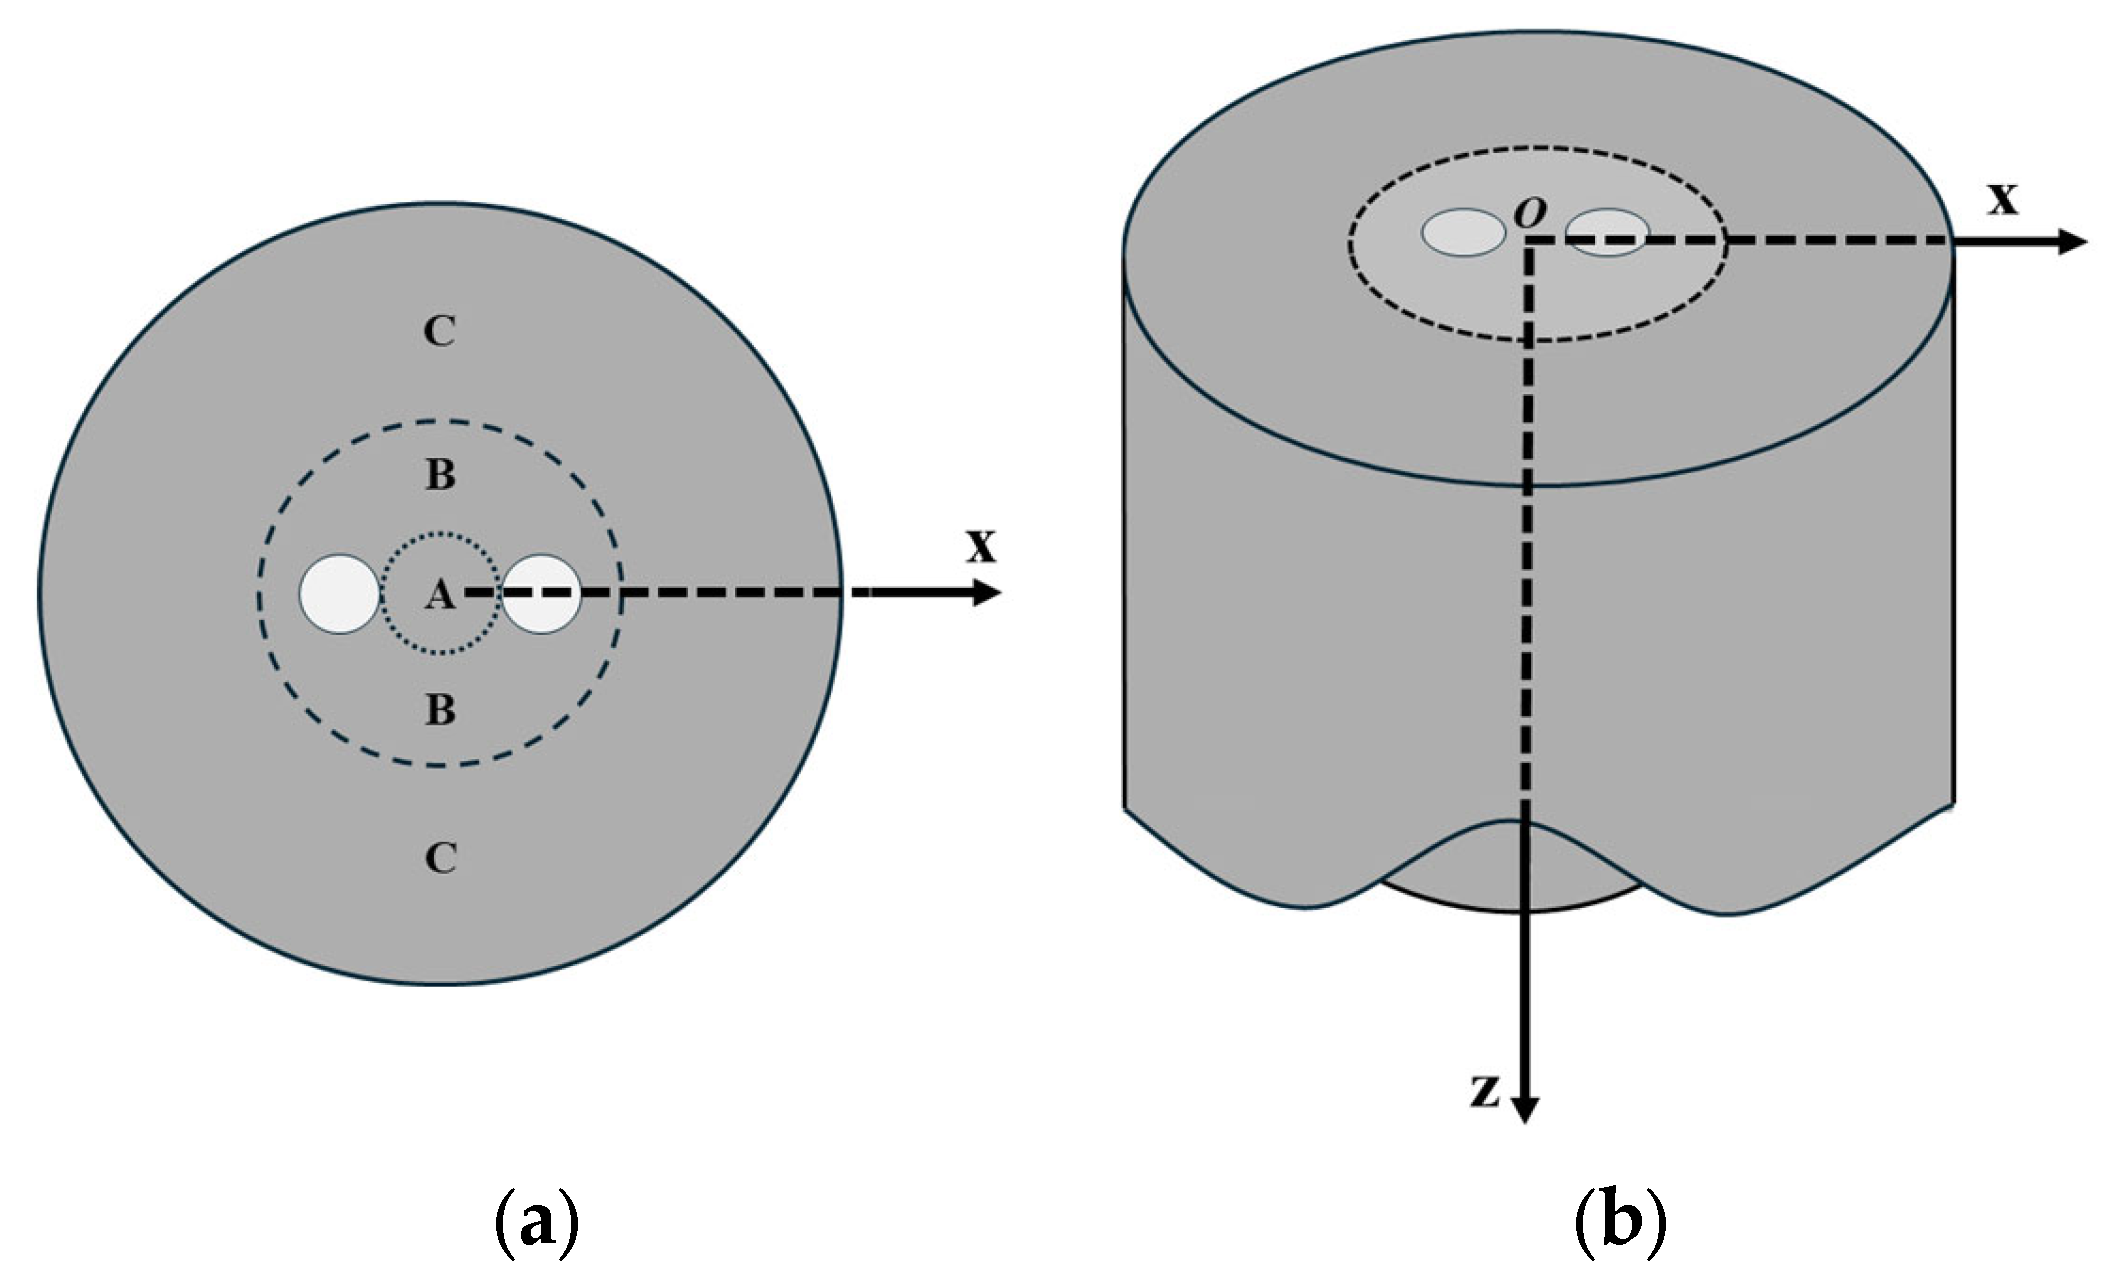
As illustrated in Figure 15, the grout body is divided into three distinct sections: A, B, and C. Section A encompasses the grout within the prestressing strand duct. Section B comprises the grout region extending from the outer boundary of the prestressing strand duct to the inner circumference defined by the anchor body diameter. Section C constitutes the peripheral grout region. The x-axis is defined as the direction parallel to the grout plane, while the z-axis is oriented perpendicular to it. Point O is defined as the centroid of the contact area between the grout and anchor body.
Figure 15.
Schematic diagram of grout zoning: (a) Partitioning in the x-direction; (b) The grout along the x- and z-directions.
5.1. Stress Distribution Along the x-Axis at the Height-to-Diameter Ratio of 17%
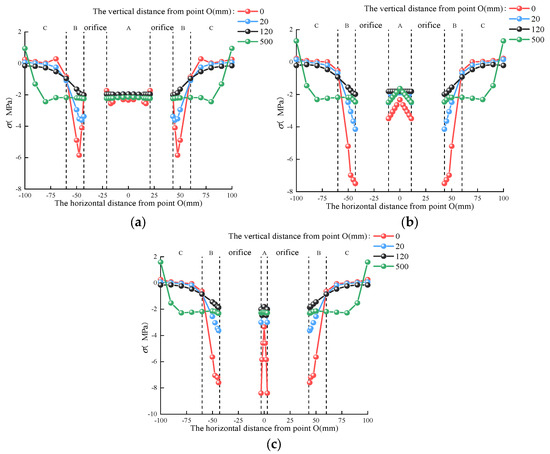
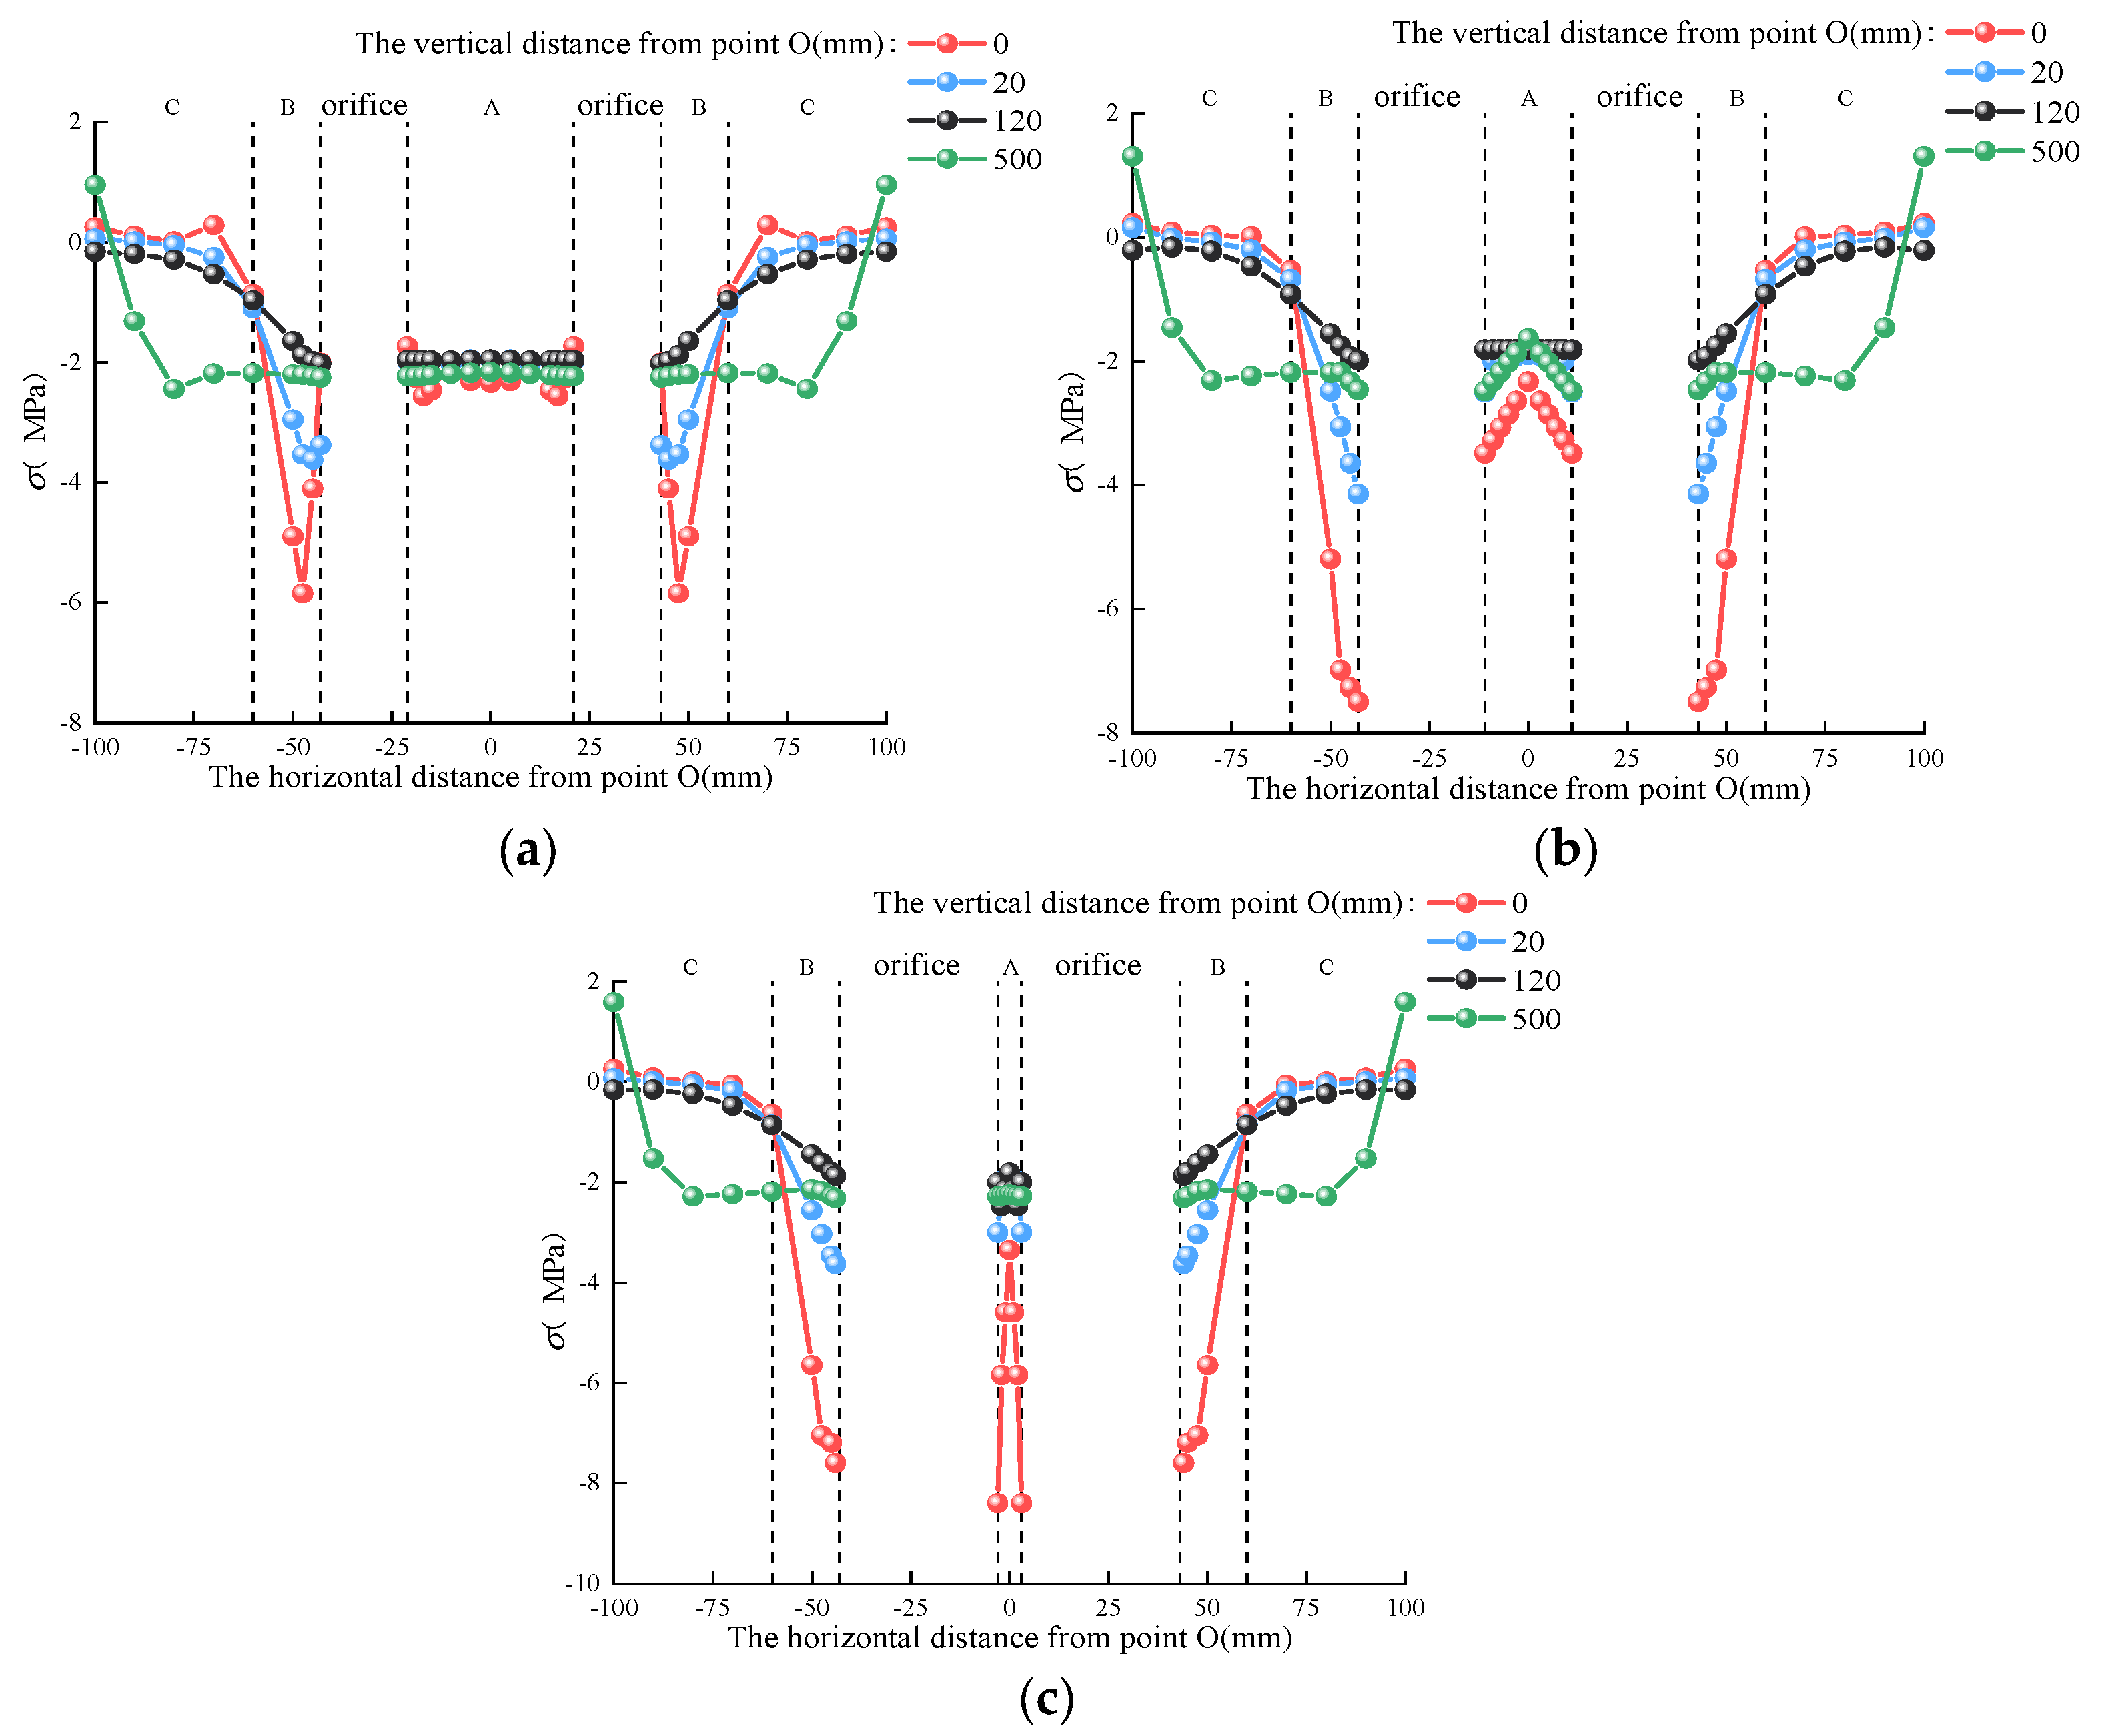
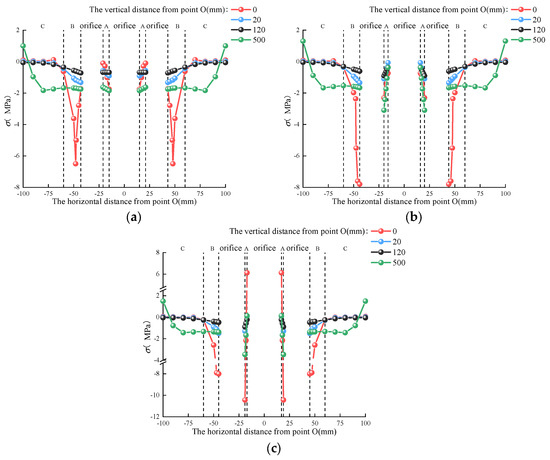
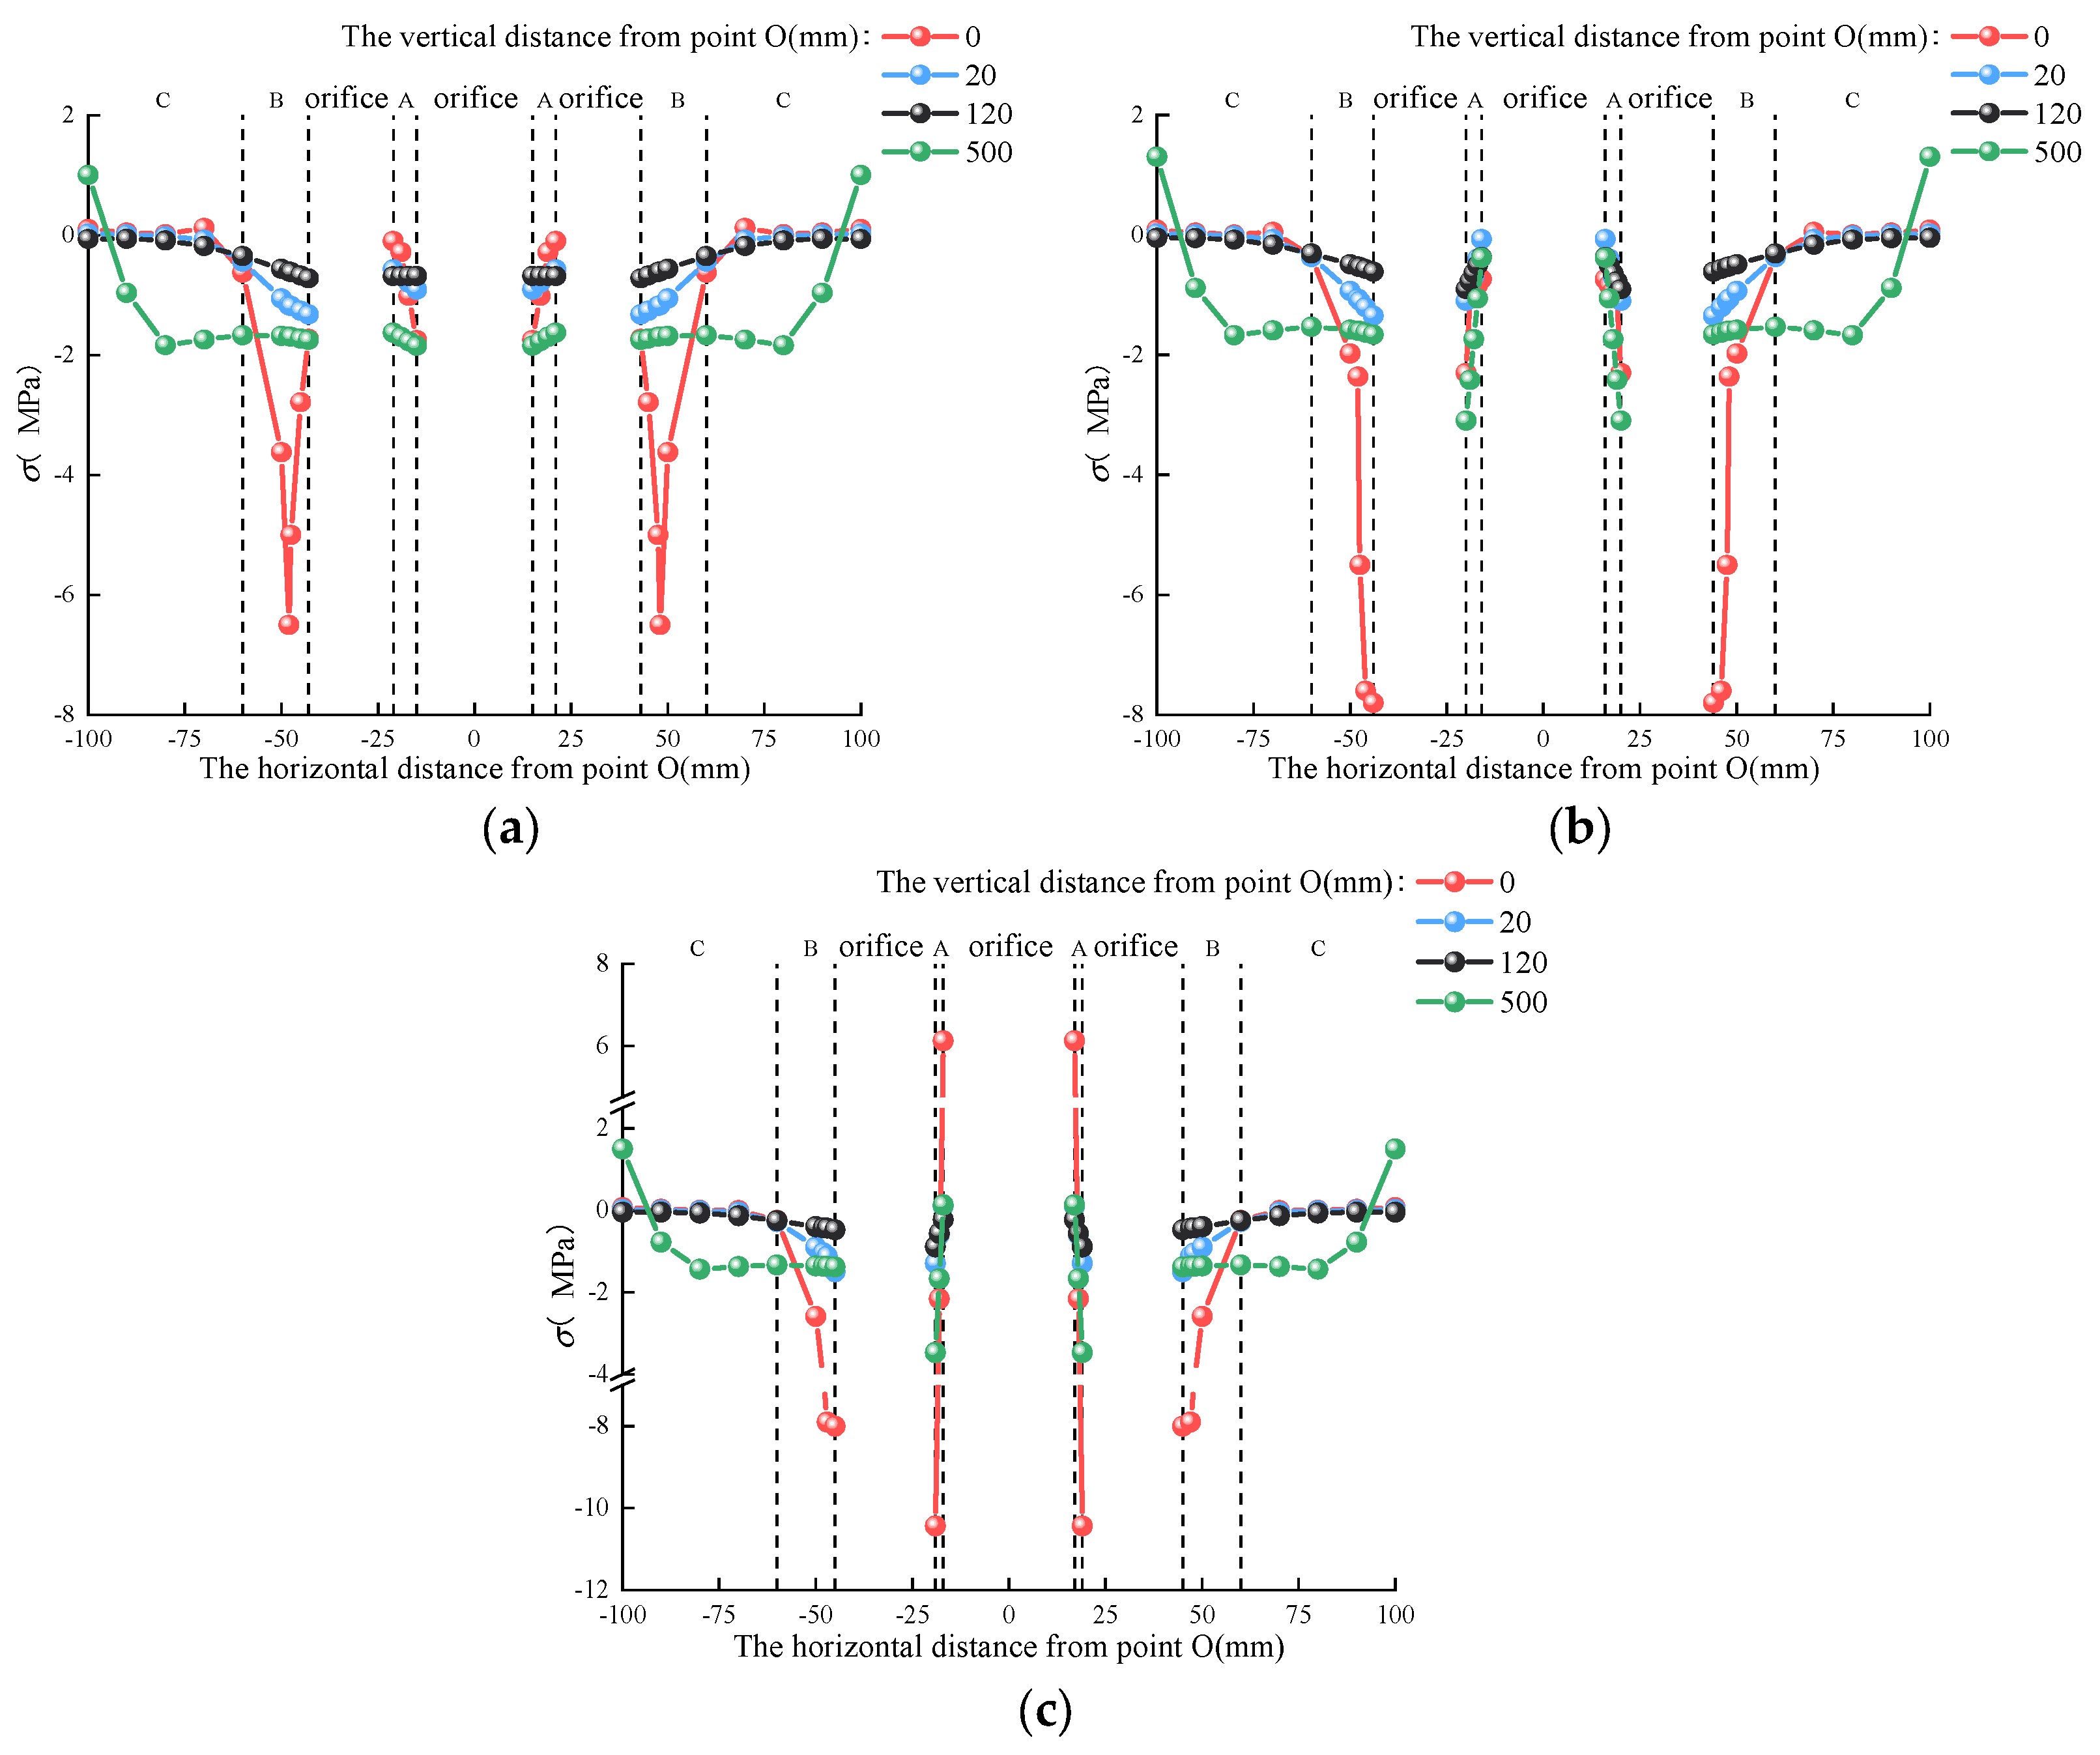
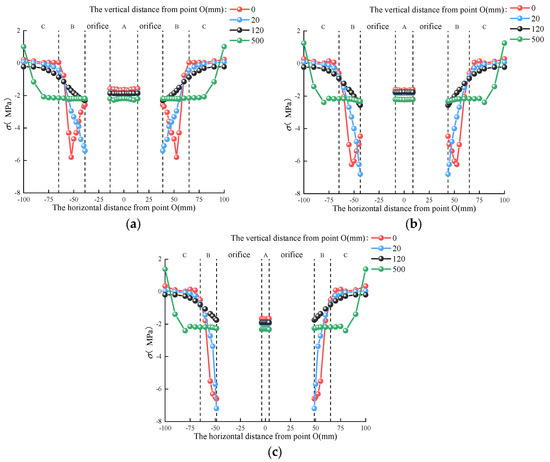
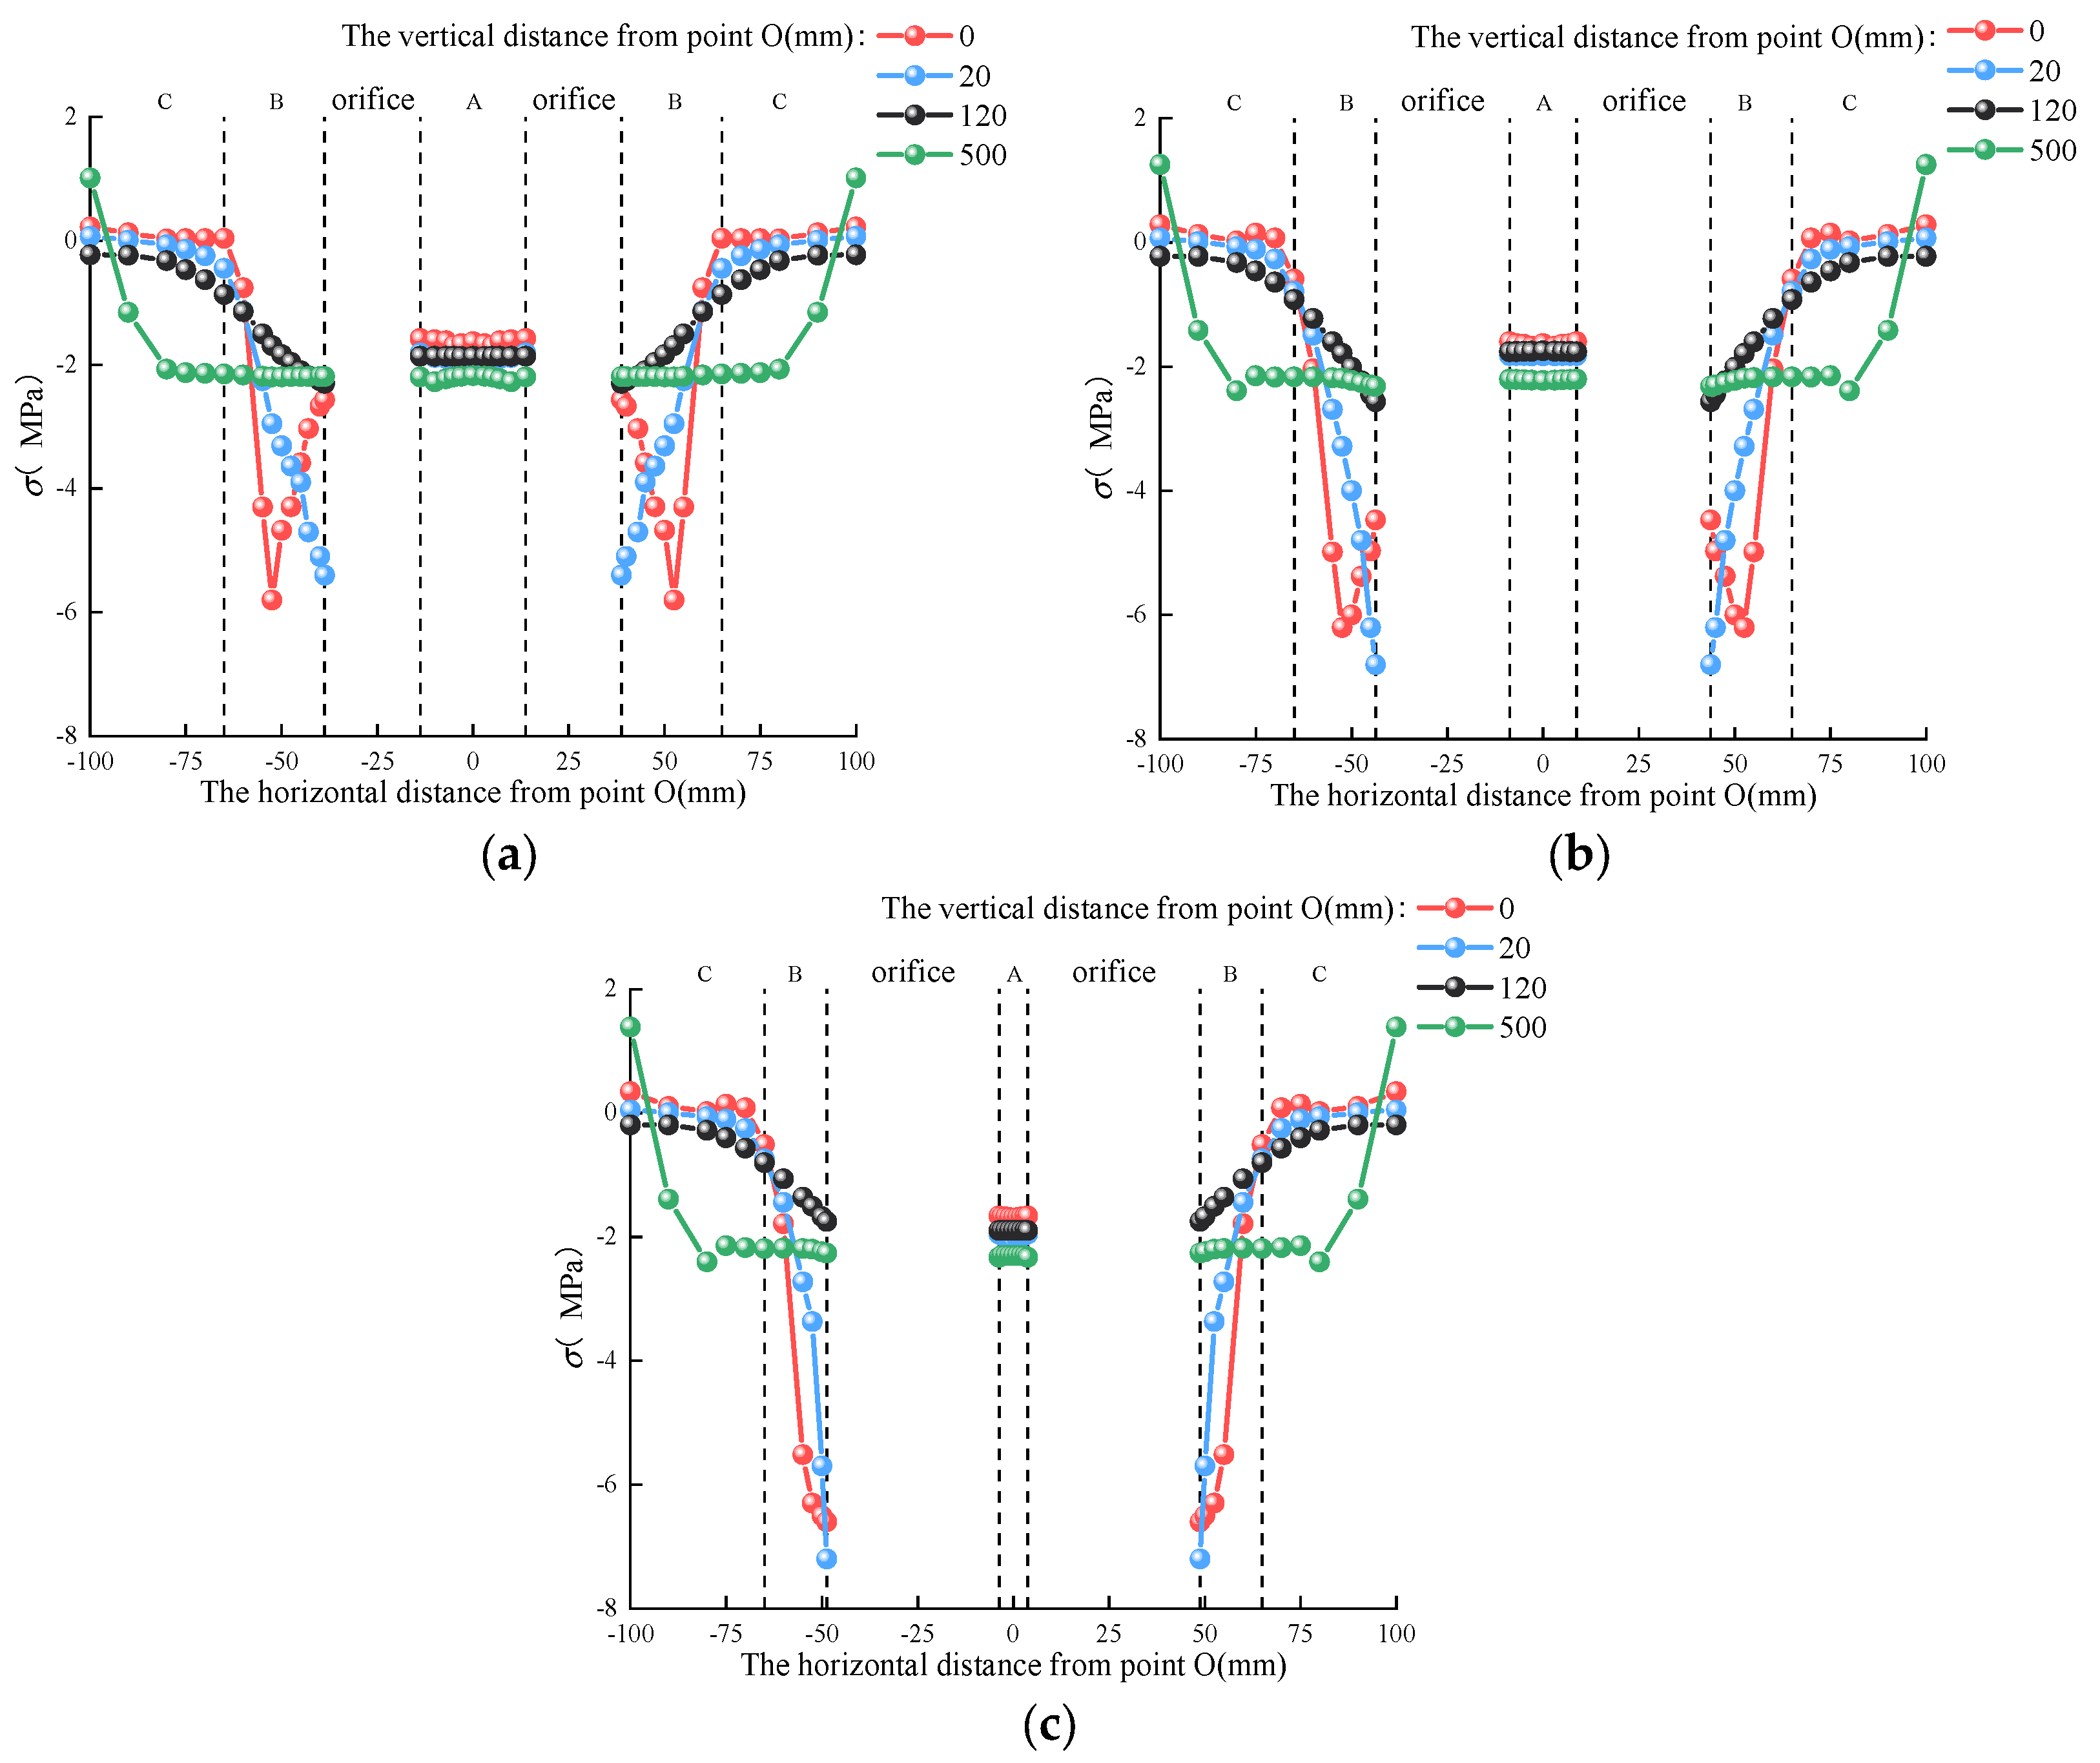
When the perforation ratio reaches 11%, the peak stress occurs in Zone B, specifically at the edge of the contact surface between the anchor body and the grout. In Zone A, the stress near the orifice exhibits only a slight increase, while in Zone C, the stress approaches zero at locations distant from the center of the anchor body, as illustrated in Figure 16a. At a perforation ratio of 23%, the peak stress remains in Zone B but shifts toward the periphery of the orifice, while the stress in Zone A increases significantly and exhibits an inverted “V”-shaped distribution, as shown in Figure 16b. When the perforation ratio reaches 35%, the peak stress shifts to Zone A, and the distribution pattern evolves into an inverted deep “V”-shaped profile. The stress differential between the center of the grout and the edge of the orifice reaches 4 MPa, as depicted in Figure 16c.
Figure 16.
Stress distribution along the x-axis for 1st anchor body: (a) 1-16-95-11; (b) 1-16-95-23; (c) 1-16-95-35.
As the perforation ratio increases from 11% to 35%, the stress in Region B shows a corresponding escalation, with the peak stress increasing from 6.2 MPa to 7.6 MPa. Simultaneously, the stress distribution in Zone A exhibits a progressively intensified non-uniformity, with its morphological evolution transitioning from a uniform stress distribution to an inverted “V” shape and finally to a pronounced inverted “V”-shaped configuration. Notably, the stress concentration at the orifice gradually surpasses that in Zone B, becoming the new locus of stress extremum. The results indicate that as the perforation ratio increases, the stress levels in both Zone A and Zone B exhibit a consistent upward trend. Furthermore, the location of peak stress gradually shifts from Zone B to Zone A, and the load transfer path undergoes progressive redistribution in response to changes in the perforation ratio.
As illustrated in Figure 3, the 2nd anchor body exhibits structural differences from the 1st anchor body, primarily characterized by the inclusion of two additional prestressing strand orifices and one grout orifice. Consequently, the perforation ratio of the second anchor body is significantly higher than that of the first. When the perforation ratio reaches 31%, the peak stress is localized near the contact surface at the edge of Zone B, while the stress in Zone A gradually attenuates outward from the grout orifice, as shown in Figure 17a. At a perforation ratio of 37%, the peak stress in Zone B shifts to the periphery of the strand orifice, and the stress distribution in Zone A undergoes a notable transformation, with high-stress regions migrating from the grout orifice to the vicinity of the strand orifice, as depicted in Figure 17b. The analysis suggests that increasing stress in Zone B intensifies the stress concentration effect at the orifice, thereby inducing stress redistribution within Zone A. When the perforation ratio increases to 43%, the rate of peak stress growth in Zone B begins to decelerate, indicating that the stress in this region is approaching the material’s load-bearing capacity limit, with excess load progressively transferring to Zone A. Concurrently, due to the reduction in the effective bearing area of Zone A, stress concentration becomes more pronounced, leading to the development of a tensile stress zone around the grout orifice. This results in a significant increase in the stress differential within this region, reaching 16.5 MPa, as illustrated in Figure 17c.
Figure 17.
Stress distribution along the x-axis for 2nd anchor body: (a) 2-16-95-31; (b) 2-16-95-37; (c) 2-16-95-43.
As illustrated in Figure 3, compared to the 2nd anchor body, the 3rd anchor body incorporates two additional prestressing strand orifices while maintaining the original aperture dimensions. When the perforation ratio reaches 42%, the peak stress is located at the edge of the contact surface in Zone B, while the stress in Zone A continues to exhibit a gradual decrease outward from the central grout orifice, as depicted in Figure 18a. At a perforation ratio of 50%, the peak stress in Zone B shifts to the edge of the strand orifices. Stress redistribution occurs in Zone A, with intensified compressive stress concentration near the strand orifices and tensile stress emerging around the grout orifices, resulting in a significant increase in the stress differential, as illustrated in Figure 18b. When the perforation ratio reaches 58%, the growth of stress in Zone B approaches saturation, exhibiting a limited increase. Due to further reduction in bearing area, Zone A exhibits more pronounced stress concentration, with stress differential reaching 17.4 MPa, as shown in Figure 18c.
Figure 18.
Stress distribution along the x-axis for 3rd anchor body: (a) 3-16-95-42; (b) 3-16-95-50; (c) 3-16-95-58.
5.2. Stress Distribution Along the x-Axis at the Height-to-Diameter Ratio of 15%
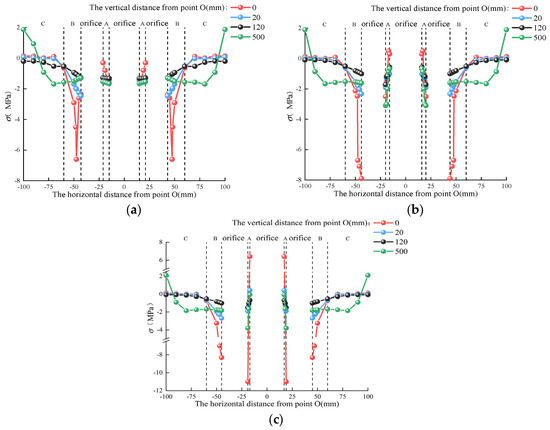
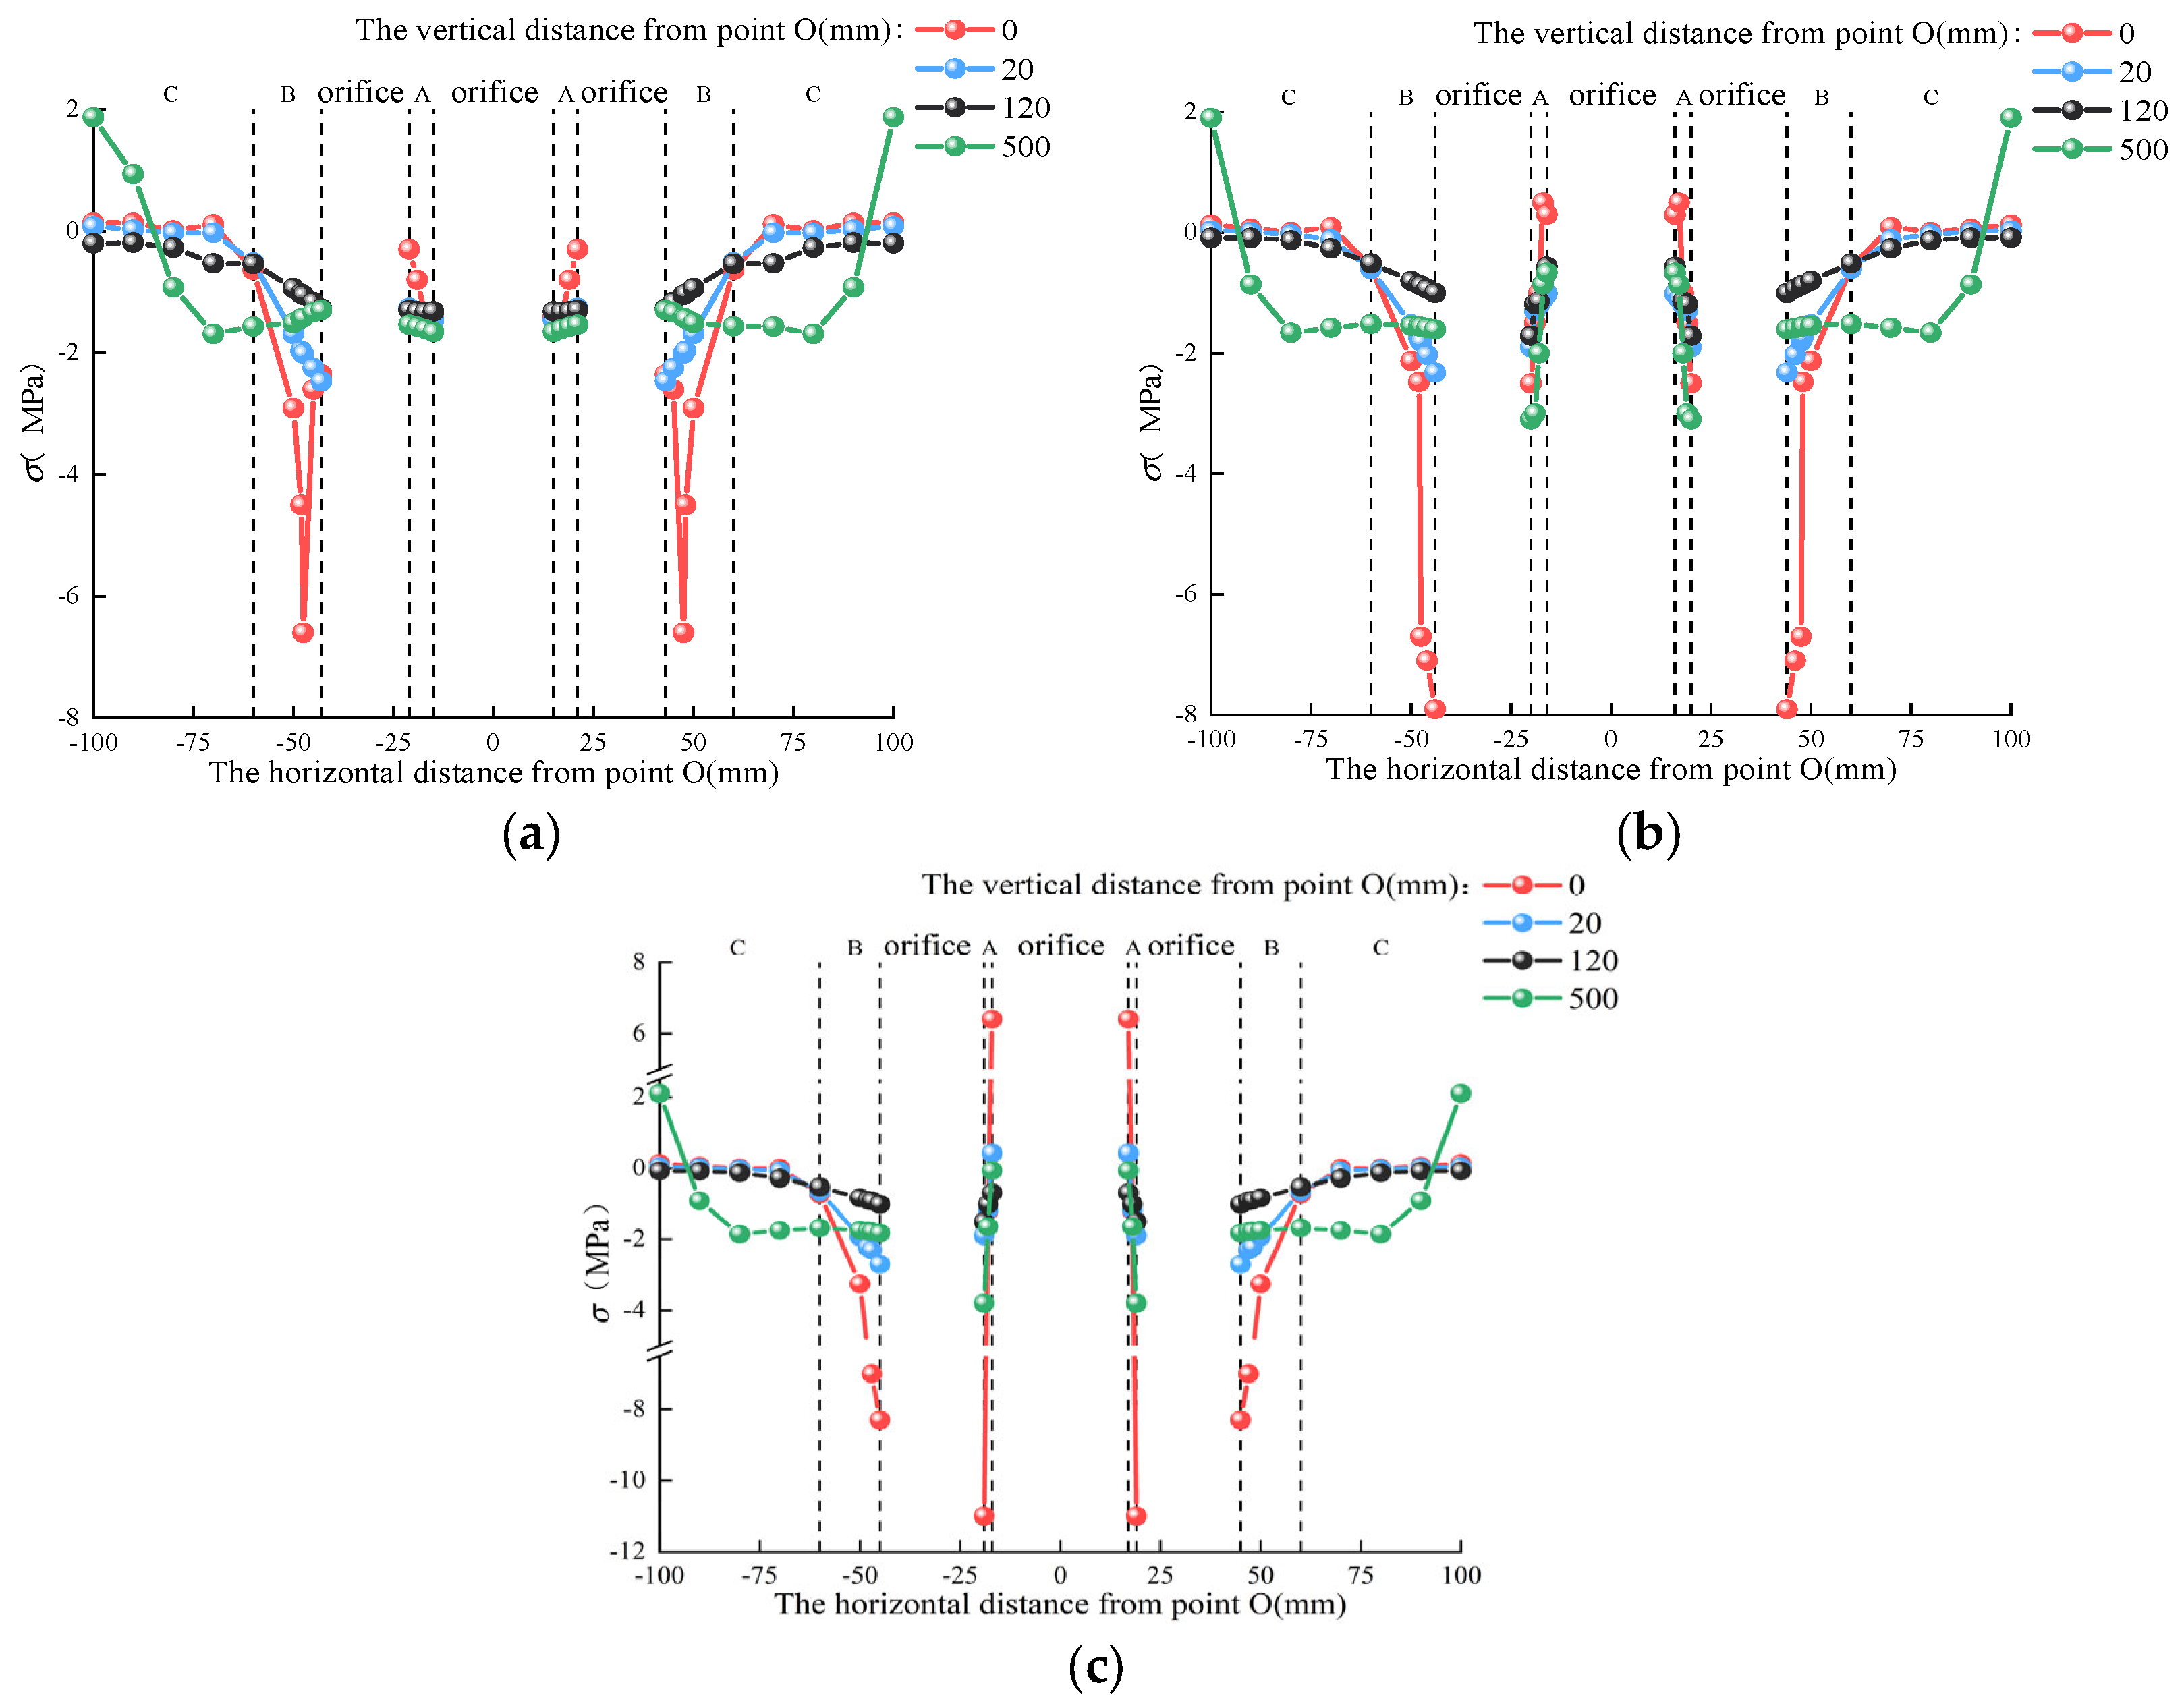
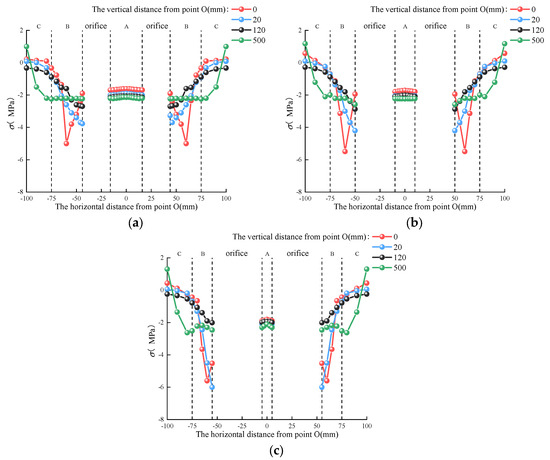
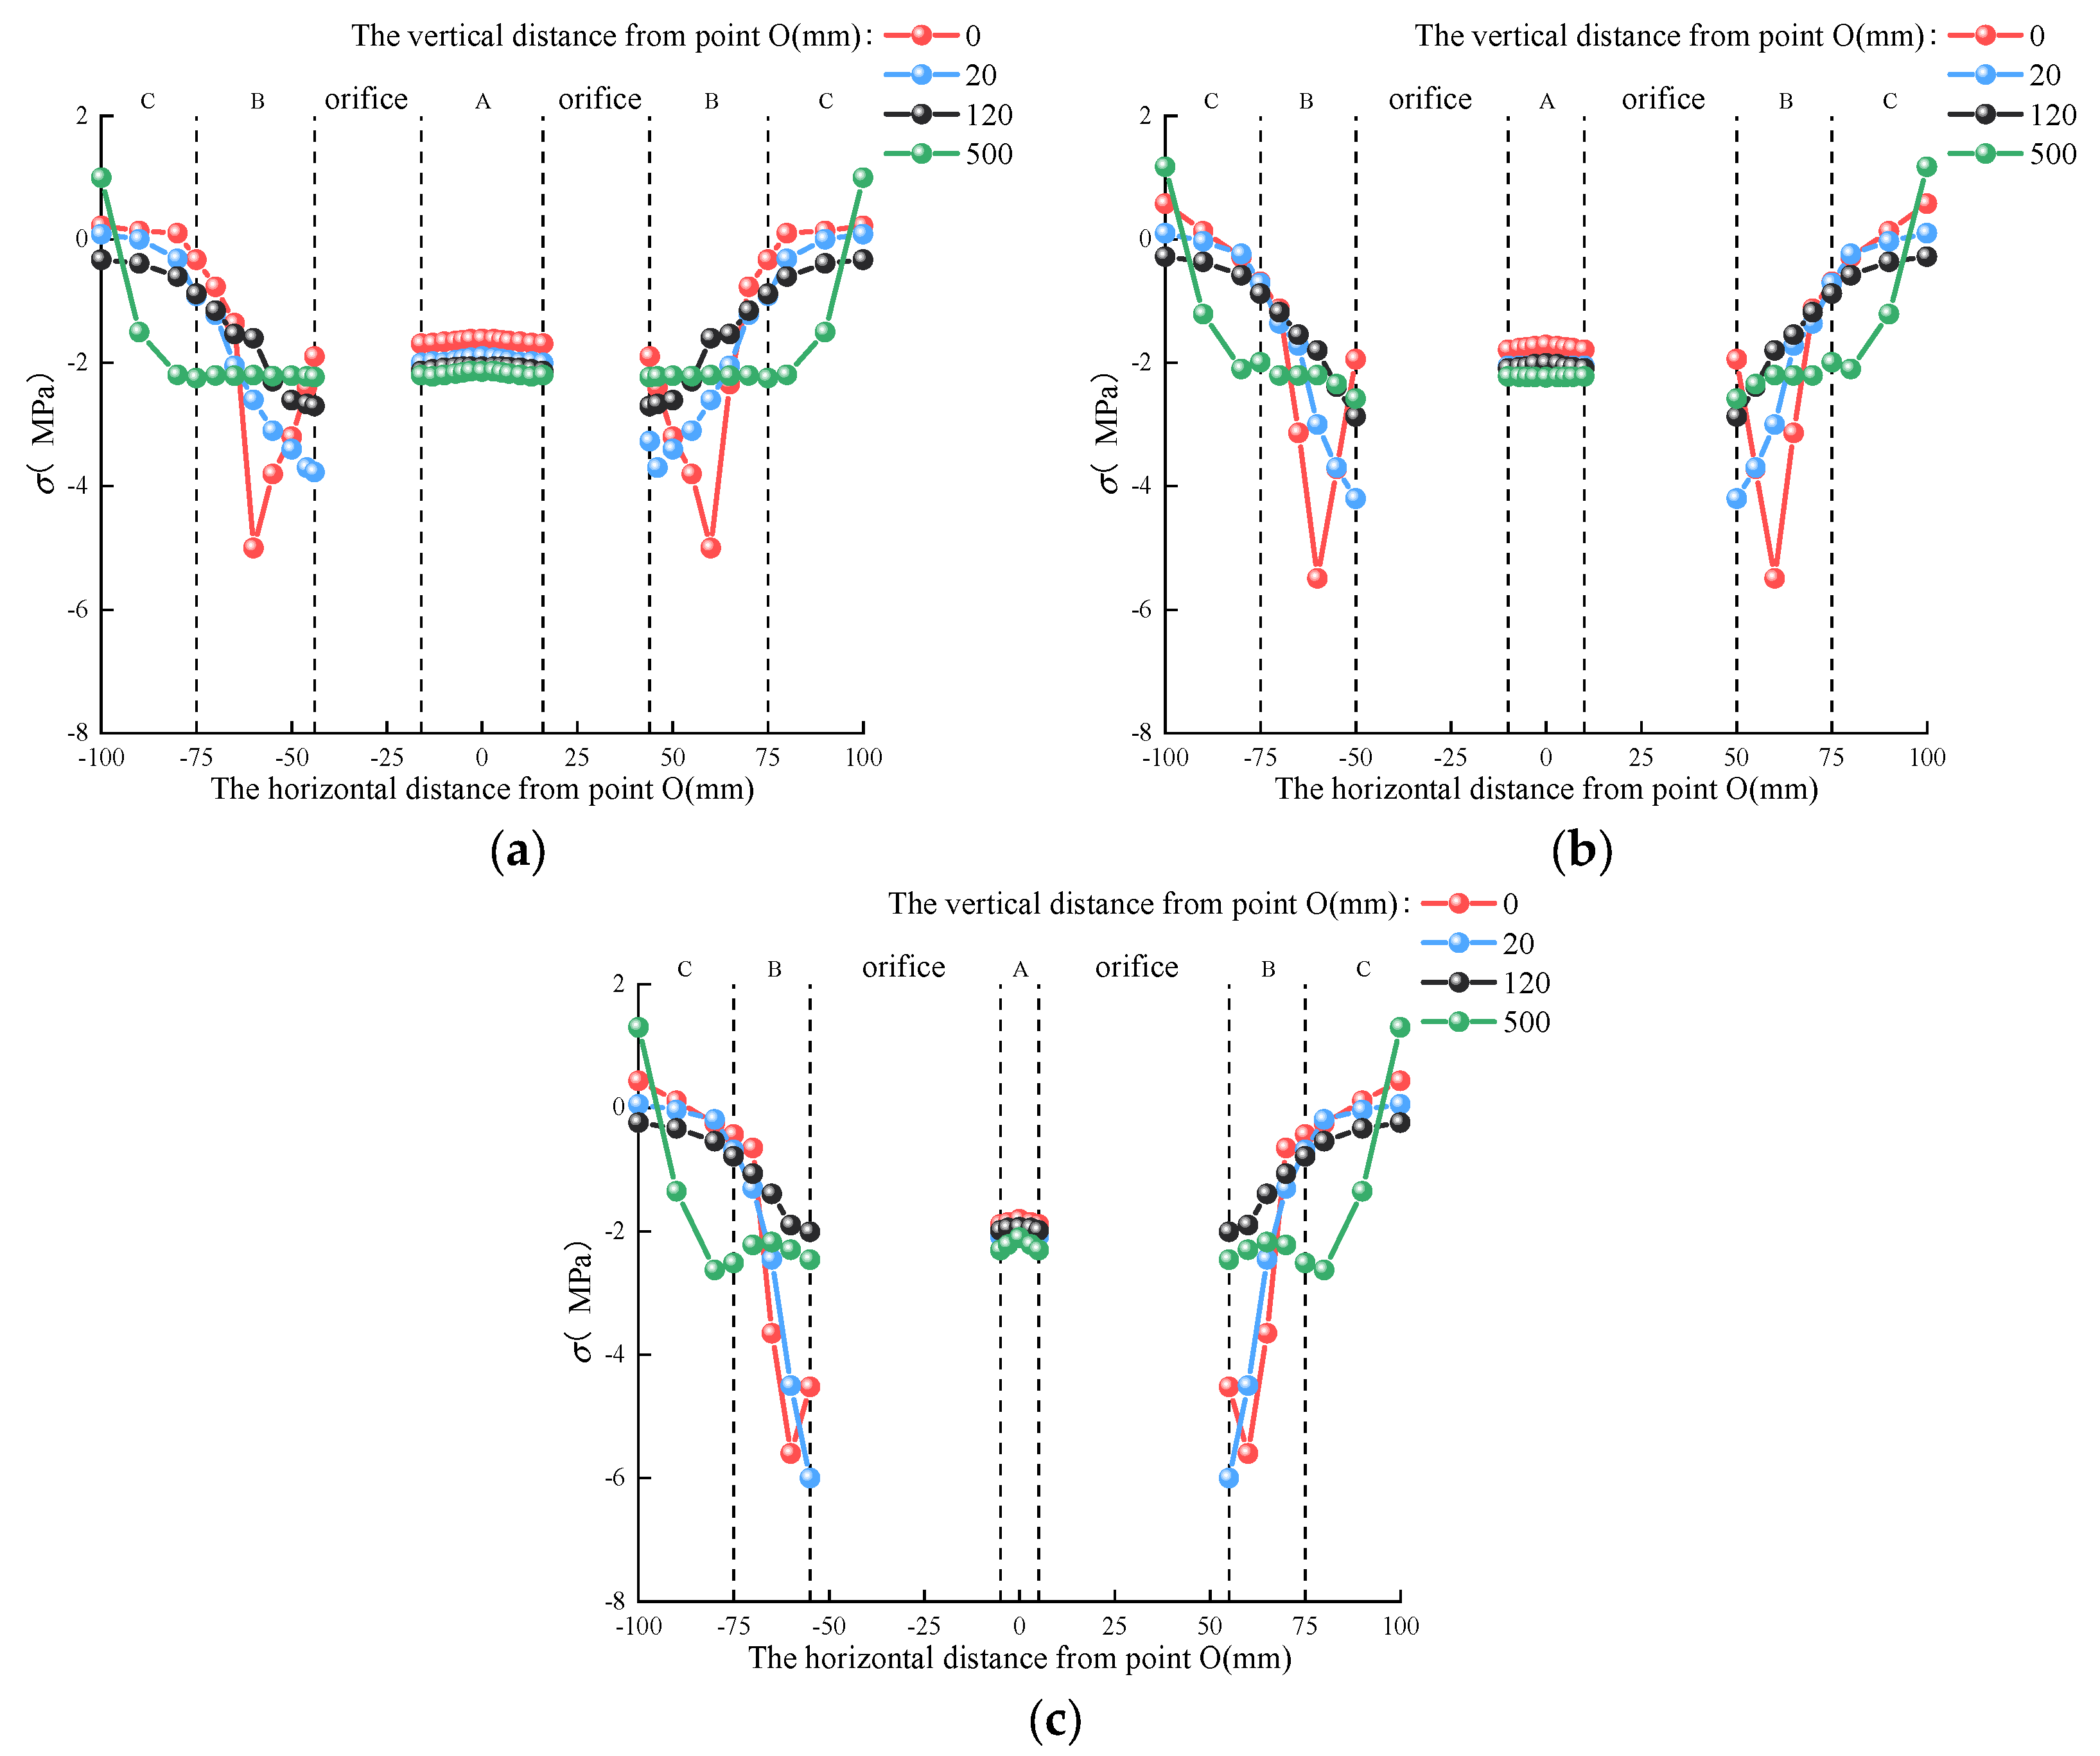
The reduction in the height-to-diameter ratio of the anchor body leads to a corresponding increase in the contact area with the grout body, resulting in the expansion of Zones A and B, while the extent of Zone C is proportionally reduced. When the height-to-diameter ratio is 15%, the stress distribution in Zone A exhibits an approximately uniform pattern across various perforation ratios, with no significant morphological evolution as the perforation ratio increases. However, the peak stress in Zone B varies with changes in the perforation ratio: When the perforation ratio reaches 11%, the peak stress is localized at the interface between the anchor body and grout, as depicted in Figure 19a. As the perforation ratio increases to 23%, the peak stress no longer occurs at this interface but rather shifts inward within the grout, located approximately 20 mm from its surface (z = 20 mm) near the orifice. Simultaneously, stress in proximity to this orifice on the grout surface exhibits an increasing trend, as illustrated in Figure 19b. When the perforation ratio reaches 35%, the peak stress in Zone B remains located approximately 20 mm (z = 20 mm) from the grout surface near the orifice opening, with the stress value exhibiting a further increase compared to the case with a perforation ratio of 23%, as shown in Figure 19c.
Figure 19.
Stress distribution along the x-axis for 1st anchor body (the height-to-diameter ratio of 15%): (a) 1-16-105-11; (b) 1-16-105-23; (c) 1-16-105-35.
5.3. Stress Distribution Along the x-Axis at the Height-to-Diameter Ratio of 13%
When the height-to-diameter ratio is 13% and the perforation ratio is 11%, the peak stress in Zone B occurs at the contact interface between the anchor body and the grout, as depicted in Figure 20a. As the perforation ratio increases to 23%, the peak stress remains localized at the edge of the grout–anchor body interface, as illustrated in Figure 20b. When the perforation ratio reaches 35%, the peak stress shifts inward within the grout, located approximately 20 mm (z = 20 mm) from the grout surface near the orifice, as shown in Figure 20c.
Figure 20.
Stress distribution along the x-axis for 1st anchor body (the height-to-diameter ratio of 13%): (a) 1-16-120-11; (b) 1-16-120-23; (c) 1-16-120-35.
6. The Optimal Structural Configuration of the Anchor Body
The ultimate load-bearing capacity of the grout, as determined from compressive testing of the grout, yielded the following representative results: For the 1st anchor body, the corresponding ultimate load-bearing capacities were 216.90 kN, 150.10 kN, and 104.15 kN at perforation ratios of 11%, 23%, and 35%, respectively. The ultimate load-bearing capacity of the 2nd anchor body was measured as 81.95 kN, 75.04 kN, and 65.05 kN at perforation ratios of 31%, 37%, and 43%, respectively. Similarly, the 3rd anchor body exhibited ultimate load-bearing capacities of 62.10 kN, 49.40 kN, and 32.80 kN at perforation ratios of 42%, 50%, and 58%, respectively. It is evident that as the perforation ratio increases, the ultimate load-bearing capacity of the grout exhibits a significant decreasing trend, consistent with the deterioration of stress distribution and the intensification of stress concentration observed in the numerical simulations.
The integrated analysis of numerical simulations and laboratory tests demonstrates that the perforation ratio significantly influences the stress distribution and failure modes of the grout. The optimal perforation ranges for the 1st, 2nd, and 3rd anchor bodies are [11%, 23%], [31%, 37%], and [42%, 50%], respectively. Within these ranges, the grout exhibits favorable stress distribution characteristics and enhanced load-bearing capacity.
The ultimate load-bearing capacity of the grout under varying height-to-diameter ratios was investigated through compressive testing of the grout. The experimental results indicate that the average ultimate load-bearing capacity of the specimens is 157.05 kN when the height-to-diameter ratio is 17%. Upon reducing the height-to-diameter ratio to 15%, the average load-bearing capacity decreases to 73.68 kN. A further reduction to 13% results in a subsequent decline in the average load-bearing capacity to 48.12 kN. The load-bearing capacity decreases as the height-to-diameter ratio is reduced, which is consistent with the results of stress analysis.
Under constant perforation ratio conditions, the stress in Region B exhibits a decreasing trend as the height-to-diameter ratio of the anchor body decreases. Taking a perforation ratio of 35% as an example, the peak stress in Zone B for anchor bodies with height-to-diameter ratios of 15% and 13% is lower than that of the 17% height-to-diameter ratio, indicating that reducing the height-to-diameter ratio can effectively mitigate stress concentration at the contact interface. Furthermore, by comparing the stress distribution at varying depths beneath the anchor body, it was observed that the stress value at a depth of 20 mm for the anchor body with a height-to-diameter ratio of 13% was significantly higher than that of the anchor body with a height-to-diameter ratio of 15%. This indicates that reducing the height-to-diameter ratio facilitates more effective transfer of prestress to deeper regions of the grout.
In the stress distribution analysis of Zone A, when the height-to-diameter ratio is 17%, the stress distribution undergoes significant morphological changes with increasing perforation ratio, ultimately forming an inverted deep “V” shape, indicating severe stress concentration. In contrast, for the anchor body with height-to-diameter ratios of 15% and 13%, the stress distribution in Zone A consistently exhibits uniform characteristics. This demonstrates that reducing the height-to-diameter ratio can effectively inhibit the deterioration of stress distribution morphology and prevent the occurrence of stress concentration.
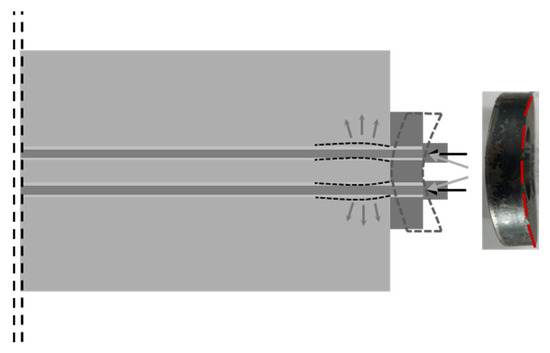
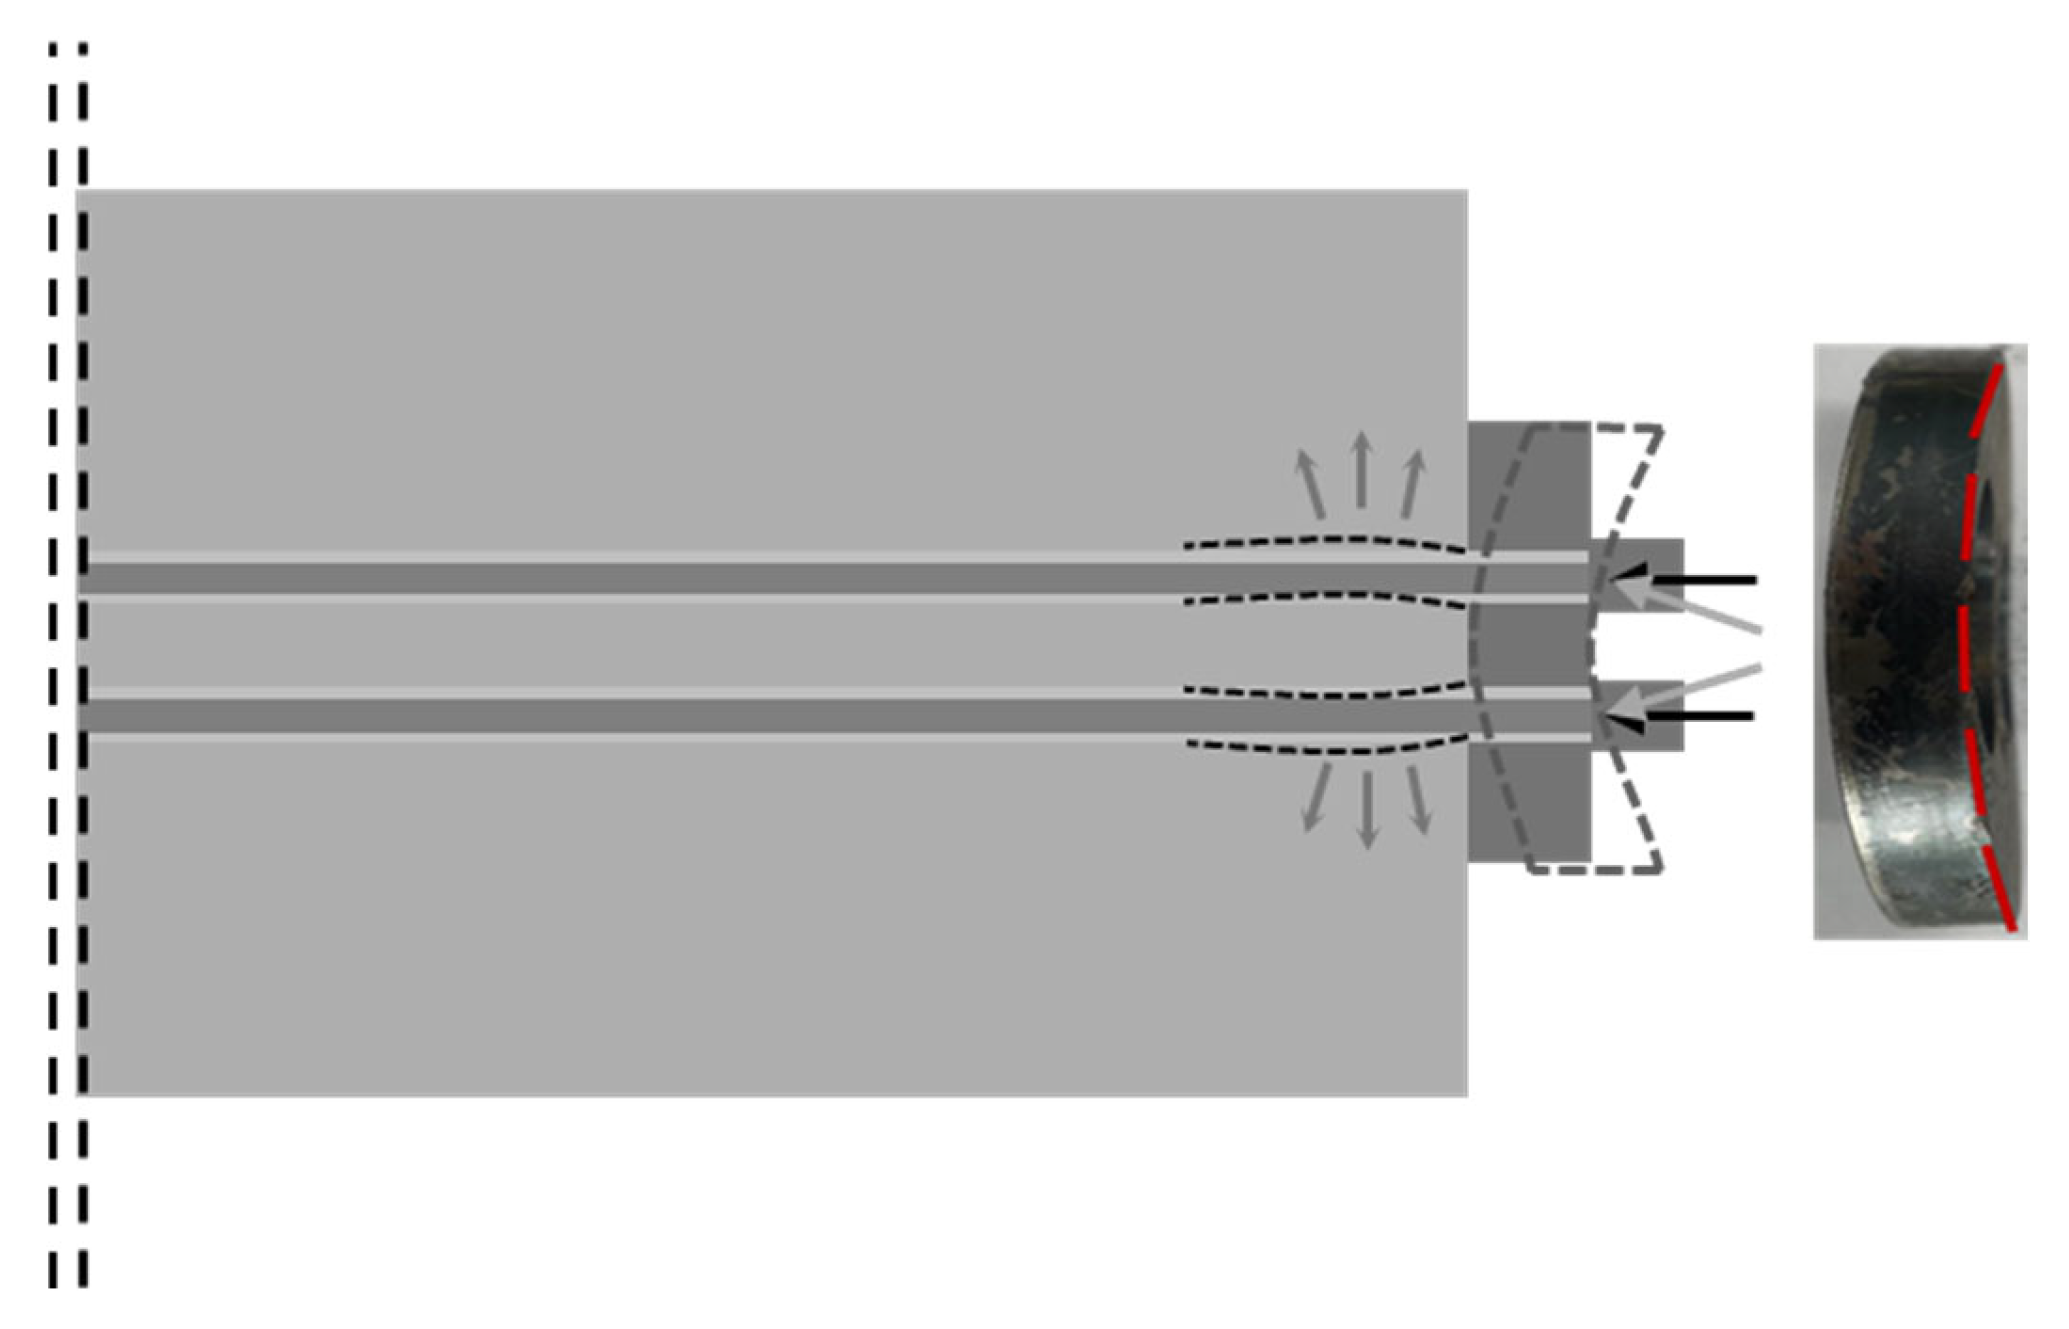
Numerical simulations and laboratory test results consistently show that as the height-to-diameter ratio increases, the internal stress level within the grout rises overall, accompanied by a significantly intensified stress concentration effect near the anchor body. This trend is highly consistent with the load-bearing capacity test results, which demonstrate a decrease in load-bearing capacity with increasing height-to-diameter ratio. Consequently, the theoretically optimal range for the height-to-diameter ratio is determined to be [13%, 15%]. However, as illustrated in Figure 21, laboratory tests revealed that the degree of structural deformation increases significantly with decreasing height-to-diameter ratio. Based on this critical phenomenon, and by comprehensively considering the stress distribution characteristics and structural deformation control requirements, the optimal engineering application range for the height-to-diameter ratio of the anchor body is determined to be [15%, 17%]. This range ensures optimal stress transfer performance and load-bearing capacity of the grout while effectively controlling structural deformation of the anchor body.
Figure 21.
Deformation behavior of the anchor body.
7. Discussion
This study investigates the influence of anchor body configurations on the load-bearing capacity of LDCA through a combination of laboratory experiments and numerical simulations, with a particular focus on analyzing the effects of two key parameters—the perforation ratio of the anchor body and the height-to-diameter ratio—on the load-bearing capacity of the grout. It is noteworthy that, in examining the influence of the height-to-diameter ratio, this study exclusively varied the diameter of the anchor body while keeping the height constant. This approach led to a simplified variation mechanism for the height-to-diameter ratio, thereby limiting the comprehensiveness of the assessment of its effect on load-bearing capacity. In addition, on construction sites, low-pressure grouting is typically carried out using grouting pumps to ensure the effective delivery of slurry to the bottom of anchor cable boreholes over extended distances [39]. In contrast, most existing model tests fabricate specimens using direct pouring methods [49,50]. Consequently, in this laboratory study, the influence of actual grouting pressure was not accounted for, and direct pouring was adopted to simulate the grouting process. Neither the indoor experiments nor the numerical simulations considered the confinement effect of the surrounding rock and soil on the lateral deformation of the grout body under actual field conditions [51,52]. As a result, the load-bearing capacity of the grout is lower than that observed in practical applications. Consequently, future research should systematically vary the height of the anchor body to comprehensively investigate the effects of height-to-diameter ratio changes on stress distribution and failure patterns in grout. Furthermore, to validate the engineering applicability of the research findings, it is recommended to conduct field tests in the future to evaluate the actual performance of the LDCA structure under real-world engineering conditions.
8. Conclusions
In this study, laboratory tests on the anchor body structure of the LDCA were conducted and complemented by numerical simulations of the internal grout, leading to the following key conclusions:
The optimal perforation ratio range for the 1st anchor body is determined to be [11%, 23%]; for the 2nd anchor body, it is [31%, 37%]; and for the 3rd anchor body, it is [42%, 50%].
A reduction in the height-to-diameter ratio of the anchor body significantly reduces the stress exerted on the grout. However, based on a comprehensive analysis of anchor body deformation derived from laboratory test results, it is recommended that the optimal height-to-diameter ratio range for the anchor body be maintained within [15%, 17%].
For compression plates with a height-to-diameter ratio of 17%, as the perforation ratio increases, the peak stress continuously rises, and the peak stress zone gradually shifts from region B to the vicinity of the strand orifice in region A. For anchor bodies with height-to-diameter ratios of 15% and 13%, although the increase in perforation ratio similarly leads to a rise in peak stress values, the peak stress locations remain stable. Reducing the height-to-diameter ratio from 17% to 13% results in an expanded stress influence range along the x-axis and a more gradual distribution gradient, significantly mitigating the stress concentration effect and thereby enhancing the load-bearing capacity of the grout.
Author Contributions
E.F.: Conceptualization, Methodology, Software, Validation, Formal analysis, Writing—original draft. W.Y.: Conceptualization, Methodology, Validation, Supervision, Project administration, Funding acquisition. X.Z.: Conceptualization, Supervision, Project administration, Resources, Validation. L.L.: Conceptualization, Methodology, Validation, Formal analysis. J.Y.: Conceptualization, Methodology, Software, Project Administration. All authors have read and agreed to the published version of the manuscript.
Funding
This work was supported by the Key Supported Project of the Joint Fund of the National Natural Science Foundation of China for Geology (No. U2444220), the Natural Science Foundation of Xiamen, China (No. 3502Z202372047), the National Natural Science Foundation of China (Nos. 52374090), Construction Science and Technology Plan Projects of Xiamen, China (XJK2024-1-29).
Data Availability Statement
The original contributions presented in this study are included in the article. Further inquiries can be directed to the corresponding authors.
Conflicts of Interest
Author Lyuliang Lin was employed by the company Xiamen Chengzhi New Materials Technology Co., Ltd. The remaining authors declare that the research was conducted in the absence of any commercial or financial relationships that could be construed as a potential conflict of interest.
References
- Jia, J.Q.; Tu, B.X.; Wang, H.T.; Meng, G.; Yao, D.-L. Mechanical Behaviors of Pressure-Dispersive Prestressed Anchor. Chin. J. Geotech. Eng. 2011, 33, 1320–1325. [Google Scholar]
- Kang, H. Seventy Years Development and Prospects of Strata Control Technologies for Coal Mine Roadways in China. Chin. J. Rock Mech. Eng. 2021, 40, 1–30. [Google Scholar] [CrossRef]
- Fu, Y.; Wu, Y.; He, S.; Zhou, P.; Li, J.; He, J. Investigation of the Mechanical Properties of Shear in an Experimental Setting of Prestressed Anchor Cable in Mines. Rock Mech. Rock Eng. 2024, 57, 8179–8192. [Google Scholar] [CrossRef] [Scilit]
- He, M.; Ren, S.; Tao, Z. Remote Monitoring and Forecasting System of Newton Force for Landslide Geological Hazards and Its Engineering Application. Yanshilixue Yu Gongcheng Xuebao/Chin. J. Rock Mech. Eng. 2021, 40, 2161–2172. [Google Scholar] [CrossRef]
- Nie, W.; Wang, W.; Tao, Z.; Zhu, C.; Chen, Y. Numerical Modeling of the NPR-Cable and Its Applications for Analysis of a Slide-Toe-Toppling Failure. Comput. Geotech. 2022, 149, 104852. [Google Scholar] [CrossRef] [Scilit]
- Song, M.; Xiang, X.; Zhang, G.; Yang, X.; Wen, L. Study on the Mechanical Characteristics and Prestress Loss of Slope-Anchored Structure. Chin. J. Rock Mech. Eng. 2022, 41, 2791–2800. [Google Scholar] [CrossRef]
- Shi, K.; Wu, X.; Liu, Z.; Dai, S. Coupled Calculation Model for Anchoring Force Loss in a Slope Reinforced by a Frame Beam and Anchor Cables. Eng. Geol. 2019, 260, 105245. [Google Scholar] [CrossRef] [Scilit]
- Lin, C.; Li, T.; Zhao, L.; Zhang, Z.; Lin, C.; Liu, X.; Niu, Z. Reinforcement Effects and Safety Monitoring Index for High Steep Slopes: A Case Study in China. Eng. Geol. 2020, 279, 105861. [Google Scholar] [CrossRef] [Scilit]
- Xin, X.; Meng, Q.; Pu, H.; Wu, J. Numerical Simulation Analysis of Energy Evolution Law and Distribution Characteristics of Anchored Body Unidirectional Loading. Tunn. Undergr. Space Technol. 2025, 158, 106419. [Google Scholar] [CrossRef] [Scilit]
- Wang, Y.J.; Liu, H.-B.; Wu, Z.-M.; Liang, Y.Q.; Yang, J.Q.; Jia, M.-D. Influence of Bond Defects on the Pullout Response of Grouted Rockbolts: Analytical Study and Experimental Validation. Tunn. Undergr. Space Technol. 2025, 158, 106438. [Google Scholar] [CrossRef] [Scilit]
- Dong, Z.; Peng, H.; Liu, T.; Wang, K.; Zheng, J.; Li, H.; Qiu, X. Study on the Mechanism of Prestress Loss Caused by Friction in the Free Segment of Anchor Cables. Constr. Build. Mater. 2024, 413, 134927. [Google Scholar] [CrossRef] [Scilit]
- Zhao, H.; Duan, K.; Zheng, Y.; Zhang, Q.; Zhang, L.; Jiang, R.; Zhang, J. Failure Mechanism of Fully Grouted Rock Bolts Subjected to Pullout Test: Insights from Coupled FDM-DEM Simulation. Num. Anal. Meth. Geomech. 2024, 48, 3979–3996. [Google Scholar] [CrossRef] [Scilit]
- Chen, C.; Zhu, S. Element-Scale Pullout Test Study on the Mechanical Behavior of Grouted Anchor–Soil Interface Subjected to Ground Pressure. Acta Geotech. 2024, 19, 5433–5447. [Google Scholar] [CrossRef] [Scilit]
- Ouyang, J.; Shi, X.; Qiu, X.; Zhang, Z.; Li, Z. Bond Length and Interface Failure Mechanism of Anchor Cable Under Continuous Radial Pressure Conditions. Int. J. Min. Sci. Technol. 2025, 35, 231–247. [Google Scholar] [CrossRef] [Scilit]
- Kim, N.K. Performance of Tension and Compression Anchors in Weathered Soil. J. Geotech. Geoenviron. Eng. 2003, 129, 1138–1150. [Google Scholar] [CrossRef] [Scilit]
- Zhang, N.; Lu, F.; Li, C.; Guo, H.; Yin, S.; Liu, Y.; Li, Q. Shear Stress Distribution of Fully Grouted Rockbolts Under Tensile Loads. Int. J. Geomech. 2025, 25, 04025022. [Google Scholar] [CrossRef] [Scilit]
- Jeon, S.; Ju, M.; Park, J.; Choi, H.; Park, K. Prediction of Concrete Anchor Pull-Out Failure Using Cohesive Zone Modeling. Constr. Build. Mater. 2023, 383, 130993. [Google Scholar] [CrossRef] [Scilit]
- Zhu, S.; Chen, C.; Zhang, G.; Wang, M.; Zhang, Z. A Theoretical Model for the Load-Transfer Analyses of Load Distributive Compression Anchor Integrating DSC-Based Interface Nonlinear Model. Constr. Build. Mater. 2024, 449, 138250. [Google Scholar] [CrossRef] [Scilit]
- Zuo, J.; Wen, J.; Li, Y.; Sun, Y.; Wang, J.; Jiang, Y.; Liu, L. Investigation on the Interaction Mechanism and Failure Behavior Between Bolt and Rock-like Mass. Tunn. Undergr. Space Technol. 2019, 93, 103070. [Google Scholar] [CrossRef] [Scilit]
- Zhu, S.; Chen, C.; Du, C. Interface Stress Relaxation Behavior of Grouted Anchors in Red Clay: Experimental Study and a Disturbed State Concept-Based Theoretical Model. Acta Geotech. 2023, 18, 3287–3306. [Google Scholar] [CrossRef] [Scilit]
- Zhang, Z.; Liu, J.; Ye, G.; Liang, Z.; He, Z. Performance Tests on Pressure-Dispersed Compression Anchors in Cohesive Soils. Int. J. Geomech. 2021, 21, 04021012. [Google Scholar] [CrossRef] [Scilit]
- Tian, J.; Hu, L. Review on the Anchoring Mechanism and Application Research of Compression-Type Anchor. Engineering 2016, 08, 777–788. [Google Scholar] [CrossRef]
- Lee, S.W.; Kim, T.S.; Sim, B.K.; Kim, J.S.; Lee, I.-M. Effect of Pressurized Grouting on Pullout Resistance and Group Efficiency of Compression Ground Anchor. Can. Geotech. J. 2012, 49, 939–953. [Google Scholar] [CrossRef] [Scilit]
- Shin, G.B.; Jo, B.H.; Baek, S.H.; Kim, S.R.; Chung, C.-K. Load Transfer Mechanism of a Load Distributive Compression Anchor Installed in Weathered Rock Layer. Can. Geotech. J. 2022, 59, 473–484. [Google Scholar] [CrossRef] [Scilit]
- Barley, A.D.; Windsor, C.R. Recent Advances in Ground Anchor and Ground Reinforcement Technology with Reference to the Development of the Art. In Proceedings of the ISRM International Symposium 2000, IS 2000, Melbourne, VIC, Australia, 19–24 November 2000; International Society for Rock Mechanics: Melbourne, VIC, Australia, 2018. [Google Scholar]
- Gong, X.; Yu, J. Development and Prospect of Removable Anchor Technology. Tumu Gongcheng Xuebao/China Civ. Eng. J. 2021, 54, 90–96. [Google Scholar]
- Wu, C.; Kong, L.; Guo, Q.; Cao, H. Enlarged Head Pressure-Dispersed Anchor Cable for Foundation Pit Engineering Purposes. Appl. Sci. 2022, 12, 12400. [Google Scholar] [CrossRef] [Scilit]
- Sun, H.; Lu, W.; Zhao, D.; Li, D. Analytical Method for Interfacial Slip Failure Processes Based on UFL Bond-Slip Model: Study of Grout/Soil Anchorage Interfaces in Earthen Sites. Comput. Geotech. 2024, 176, 106778. [Google Scholar] [CrossRef] [Scilit]
- Shin, G.B.; Jo, B.H.; Kim, S.R.; Baek, S.H.; Chung, C.-K. Numerical Simulation of Load Distributive Compression Anchor Installed in Weathered Rock Layer. Acta Geotech. 2022, 17, 4173–4190. [Google Scholar] [CrossRef] [Scilit]
- Chen, W.; Hong, C.; Chen, X.; Luo, G.; Su, D. Comparative Analysis of Anchor Cables in Pullout Tests Using Distributed Fiber Optic Sensors. Can. Geotech. J. 2023, 60, 1861–1876. [Google Scholar] [CrossRef] [Scilit]
- Bing, H.; Yuan, H. Experimental Research on Compressive Strength-Size Effect and Mechanical Properties of Cement-Based Grout. Constr. Build. Mater. 2023, 373, 130882. [Google Scholar] [CrossRef] [Scilit]
- Huang, Y.; Zhu, Z.; Naito, C.J.; Weijian, Y. Tensile Behavior of Half Grouted Sleeve Connections: Experimental Study and Analytical Modeling. Constr. Build. Mater. 2017, 152, 96–104. [Google Scholar] [CrossRef] [Scilit]
- Lu, Z.; Huang, J.; Li, Y.; Dai, S.; Peng, Z.; Liu, X.; Zhang, M. Mechanical Behaviour of Grouted Sleeve Splice Under Uniaxial Tensile Loading. Eng. Struct. 2019, 186, 421–435. [Google Scholar] [CrossRef] [Scilit]
- Wang, Z.; Zhu, J.; Wang, J.; Zhao, G.; Sun, S.; Zhang, J. Experimental Study on a Novel UHPC Grout-Filled Pipe Sleeve with Mechanical Interlocking for Large-Diameter Deformed Bars. Eng. Struct. 2021, 226, 111358. [Google Scholar] [CrossRef] [Scilit]
- Wang, Y.-H.; Yu, J.; Liu, J.-P.; Zhou, B.-X.; Chen, Y.F. Experimental Study on Assembled Monolithic Steel-Prestressed Concrete Composite Beam in Negative Moment. J. Constr. Steel Res. 2020, 167, 105667. [Google Scholar] [CrossRef] [Scilit]
- Chen, J.; Hagan, P.C.; Saydam, S. An Experimental Study of the Specimen Geometry Effect on the Axial Performance of Cement-Based Grouts. Constr. Build. Mater. 2021, 310, 125167. [Google Scholar] [CrossRef] [Scilit]
- Lakshani, M.M.T.; Jayathilaka, T.K.G.A.; Thamboo, J.A. Experimental Investigation of the Unconfined Compressive Strength Characteristics of Masonry Mortars. J. Build. Eng. 2020, 32, 101558. [Google Scholar] [CrossRef] [Scilit]
- Lu, L.; Li, L.; Deng, Y.; Hu, T.S.; Li, X.X. Failure Mechanism of Mortar in Front of Bearing Plate of Compression Type Anchor Cables. Chin. J. Geotech. Eng. 2013, 35, 2110–2116. [Google Scholar]
- Jo, B.H.; Shin, G.B.; Chung, C.K. Load Transfer Behavior and Interference Effect of Load Distributive Compression Anchor in Residual Soil. Acta Geotech. 2024, 19, 3883–3900. [Google Scholar] [CrossRef] [Scilit]
- Shin, G.B.; Jo, B.H.; Kim, S.R.; Chung, C.K.; Baek, S.-H. Field Study on Behavior of Load Distributive Compression Anchor Installed in Weathered Rock and Soft Rock. Can. Geotech. J. 2023, 60, 1895–1908. [Google Scholar] [CrossRef] [Scilit]
- Zhu, S.; Chen, C.; Mao, F.; Cai, H. Application of Disturbed State Concept for Load-Transfer Modeling of Recoverable Anchors in Layer Soils. Comput. Geotech. 2021, 137, 104292. [Google Scholar] [CrossRef] [Scilit]
- Singh, A.; Narasimhamurthy, V.D. Perforation Effects on the Wake Dynamics of Normal Flat Plates. J. Fluid Mech. 2022, 947, A23. [Google Scholar] [CrossRef] [Scilit]
- Emami, N.; Giles, H.; Von Buelow, P. Structural, Daylighting, and Energy Performance of Perforated Concrete Shell Structures. Autom. Constr. 2020, 117, 103249. [Google Scholar] [CrossRef] [Scilit]
- Mentzoni, F.; Kristiansen, T. Numerical Modeling of Perforated Plates in Oscillating Flow. Appl. Ocean Res. 2019, 84, 1–11. [Google Scholar] [CrossRef] [Scilit]
- Wang, C.; Liu, H.; Wang, C.; Xu, J.; Zhang, P.; Guo, B.; Shan, D.; Wang, Z. Interactive Effects of Height-to-Diameter Ratio and Strain on Tribological Behavior in Micro Compression of Pure Nickel Cylinder. Int. J. Mech. Sci. 2018, 144, 452–460. [Google Scholar] [CrossRef] [Scilit]
- Karabinis, A.I.; Rousakis, T.C. Concrete Confined by FRP Material: A Plasticity Approach. Eng. Struct. 2002, 24, 923–932. [Google Scholar] [CrossRef] [Scilit]
- Bordón, J.D.R.; Medina, C.; Galván, J.C.; Padrón, L.A. Kinematic Response of Flexible Suction Caissons for Offshore Wind Turbines to Vertically Incident Shear Waves. Ocean Eng. 2025, 326, 120750. [Google Scholar] [CrossRef] [Scilit]
- Shi, L.; Yan, J.; Peng, B.; Han, Y. Deformation Behavior of Semi-Solid Zn–Al Alloy Filler Metal during Compression. Mater. Sci. Eng. A 2011, 528, 7084–7092. [Google Scholar] [CrossRef] [Scilit]
- Zhao, G.; Wang, W.; Li, Z.; Guan, S.; Lu, X.; Li, N. Investigation of the Mechanical Properties and Fracture Failure Modes of Anchor Cables Under Various Cyclic Load Conditions. Eng. Fail. Anal. 2025, 182, 110124. [Google Scholar] [CrossRef] [Scilit]
- Zhao, H.; Ren, T.; Remennikov, A. Standing Support Incorporating FRP and High Water-Content Material for Underground Space. Tunn. Undergr. Space Technol. 2021, 110, 103809. [Google Scholar] [CrossRef] [Scilit]
- Wang, Y.; Zhao, Z.; Hou, B.; Wang, X.; Pan, K. Reaming Anchorage for Cable Bolts in Weak Rocks: Experimental and Numerical Investigations. Rock Mech. Rock Eng. 2025, 58, 12295–12313. [Google Scholar] [CrossRef] [Scilit]
- Dehestani, M.; Nikbin, I.M.; Asadollahi, S. Effects of Specimen Shape and Size on the Compressive Strength of Self-Consolidating Concrete (SCC). Constr. Build. Mater. 2014, 66, 685–691. [Google Scholar] [CrossRef] [Scilit]

Disclaimer/Publisher’s Note: The statements, opinions and data contained in all publications are solely those of the individual author(s) and contributor(s) and not of MDPI and/or the editor(s). MDPI and/or the editor(s) disclaim responsibility for any injury to people or property resulting from any ideas, methods, instructions or products referred to in the content. |
© 2025 by the authors. Licensee MDPI, Basel, Switzerland. This article is an open access article distributed under the terms and conditions of the Creative Commons Attribution (CC BY) license (https://creativecommons.org/licenses/by/4.0/).