Article

Design of Continuous Fixed Plate Photo-Fenton Reactor Based on Fe3O4/TiO2@Al2SiO5 Fiber Board Photocatalyst and Application in Tetracycline Hydrochloride Degradation
Key Laboratory of Songliao Aquatic Environment, Ministry of Education, Jilin Jianzhu University, Changchun 130118, China
*
Author to whom correspondence should be addressed.
Processes 2025, 13(12), 3824; https://doi.org/10.3390/pr13123824
Submission received: 5 November 2025 / Revised: 19 November 2025 / Accepted: 25 November 2025 / Published: 26 November 2025

Abstract

To address the limitations of traditional photo-Fenton reactions in antibiotic wastewater treatment, this study designed a continuous flat-plate photo-Fenton reactor based on the Fe3O4/TiO2@Al2SiO5 fiberboard photocatalyst and applied it to the degradation of tetracycline HCl (TCH). The supported catalyst Fe3O4/TiO2@Al2SiO5 was prepared via a calcination method, using the Al2SiO5 fiberboard as the carrier. This not only effectively addresses the issue of catalyst recovery but also enhances the dispersion and stability of the Fe3O4/TiO2 catalyst as a support. Moreover, the catalyst mainly exhibited an amorphous structure. TiO2 and Fe3O4 were successfully loaded onto the surface of the carrier. The operating parameters of the reactor were systematically optimized, and the optimal conditions were determined as follows: TCH influent concentration of 50 mg/L, hydraulic retention time (HRT) of 120 min, initial pH of 4.5, H2O2 dosage of 10 mmol/L, and ultraviolet (UV) light intensity of 2.36 kW/m3. Under these conditions, the TCH removal efficiency could reach over 90%. Active species trapping experiments indicated that hydroxyl radicals (•OH) were the main active substances responsible for TCH degradation. With the assistance of HPLC-MS/MS and GC-MS analyses, 19 types of degradation intermediates were identified. It was proposed that the TCH degradation pathway mainly included •OH-mediated hydroxylation addition reactions and demethylation reactions initiated by •OH and h+. The toxicity assessment showed that the toxicity of the degradation intermediates gradually decreased with the progress of the reaction. This reactor features high efficiency, stability, and easy operation, providing a feasible solution for the large-scale treatment of antibiotic wastewater.

1. Introduction

Recently, due to the widespread use of antibiotics and a large number of residual antibiotics entering the water and soil environment, antibiotic pollutants cause endless harm to the ecological environment [1,2]. Therefore, the development of water treatment processes for antibiotic pollutants is of great significance for environmental protection and the healthy development of human society. The traditional methods for removing antibiotics from water include physical adsorption [3], biological degradation [4], and advanced oxidation processes (AOPs) [5]. Physical adsorption has a wide range of applications [6], but the adsorption capacity of the adsorbent is prone to saturation [7], and there is a risk of secondary pollution. The cost of biodegradation is low, but microorganisms are prone to developing resistance and have demanding living conditions [8]. Therefore, currently, the advanced oxidation process is commonly used for the degradation of antibiotics. Radical-based advanced oxidation processes (AOPs) yielded a good catalytic effect on the degradation of antibiotic wastewater by the activation of peroxodisulfate (PDS) [9], peroxymonosulfate (PMS) [10], and hydrogen peroxide (H2O2) [11], etc. Among them, photo-Fenton reactions have gained wide attention because of their simple operation, being environmentally friendly, and low cost. However, some drawbacks such as acid environments and a low Fe3+/Fe2+ cycle rate hinder the practical applications [12].
To overcome the aforementioned limitations of photo-Fenton reactions, some studies have shown that the introduction of semiconductor photocatalytic materials (e.g., BiVO4, TiO2) to photo-Fenton not only yielded a good catalytic effect on the degradation of wastewater but also helps solve some problems associated with photo-Fenton systems [13,14]. Upon light irradiation, hole-electron pairs are formed on the surface of photocatalytic materials (Equation (1)). Fe3+ in the Fenton reagent acts as an electron acceptor to capture photoexcited electrons and is effectively reduced (Equation (2)). The cycle rate of Fe3+/Fe2+ is improved so that more hydroxyl radicals are generated in the system, and the treatment effect is obviously improved. At the same time, Fe3+ acts as an electron capture agent to inhibit the recombination of TiO2 photogenerated holes and electrons and also improves the quantum efficiency of photocatalysis [15,16]. For example, Xu et al. [15] developed BiVO4/Fh semiconductors as Fenton composite catalysts by modifying the structure and surface of natural nano-mineral materials. The results showed that BiVO4 promotes the decomposition of H2O2, and the high concentration of Fe2+ in the system indicates that the photogenerated electrons generated by BiVO4 promote Fe3+/Fe2+ conversion, thereby improving the decomposition efficiency of H2O2, rather than the degradation of H2O2 by BiVO4. Furthermore, Deng et al. [17] found that the P-type semiconductor is not suitable for coupling with the Fenton reagent. The hole concentration of P-type semiconductors is much greater than the free electron concentration, and holes will consume H2O2 in the system, which also leads to a decrease in catalytic efficiency due to the reduction in holes.
Semiconductor   h ν   e C B + h V B
Fe3+ + eCB → Fe2+
At present, the research on photo-Fenton or photocatalysis is mainly limited to the laboratory. The design and development of a heterogeneous photocatalytic reactor with high efficiency, good stability, and operation simplicity is a problem that needs to be addressed for large-scale application. According to the form of catalysts, heterogeneous photocatalytic reactors can be divided into suspension reactors [18] and supported reactors [19]. Suspension reactors have the advantages of high mass transfer efficiency, good photon absorption performance, high degradation efficiency of pollutants, and simple structure [20]. However, there is a problem of catalyst recovery in practical applications, and they are mostly designed as sequencing batch reactors. In a supported reactor, the catalyst is fixed or attached to a carrier such as ceramic, glass, zeolite, etc., and then placed in the reactor, thus avoiding the problem of catalyst recovery, and the reactor can also be operated continuously. In addition, according to the bed state of the reactor, they can be divided into fluidized-bed and fixed-bed photocatalytic reactors. The catalyst in the fluidized bed photocatalytic reactor is always in a flowing state, which improves the specific surface area of the catalyst and the utilization rate of light to a certain extent. However, due to the serious back-mixing of materials and particle wear, it is necessary to increase the recovery and dust collection devices. This makes its internal components and operations complex. The fixed-bed photocatalytic reactor solves the problem of material back-mixing very well. The fluid reacts through the bed formed by the catalyst fixed on the carrier, the mechanical loss of the catalyst is small, and the structure of the reactor is simple. At present, fixed-bed photocatalytic reactors can be divided into shallow pool reactors, tubular reactors, flat-plate reactors, and optical fiber bundle photochemical reactors according to their structure and shape. Among many fixed-bed reactors, plate photocatalytic reactor has attracted more and more attention because of its high light utilization and simple structure.
So far, the synergies of Fe and Ti have been shown to efficiently activate the degradation of pollutants by UV-Fenton, but the design and development of a heterogeneous photocatalytic reactor with high efficiency, good stability, and operation simplicity is a problem that need to be addressed for large-scale application. Therefore, in this study, Fe3O4/TiO2@Al2SiO5 prepared using Al2SiO5 fiber as the carrier was fabricated by the calcination method and applied to the plate fixed-bed continuous flow reactor. The efficiency of Fe3O4/TiO2@Al2SiO5 for the degradation of pollutants by fixed plate UV-Fenton reactor was tested by taking TCH as the target contaminant. The operation parameters of the process were also optimized. The reactive oxygen species (ROS) in the Fe3O4/TiO2@Al2SiO/UV-Fenton system were analyzed through radical quenching experiments. Combining the intermediate products of TCH degradation detected by HPLC-MS/MS and GC-MS, the possible degradation pathways of TCH were proposed. By studying the degradation mechanism of TCH in the Fe3O4/TiO2@Al2SiO/UV-Fenton system, the electronic cycling and synergistic effect were explored. The toxicity of the degradation products was evaluated using the toxicity assessment soft tool (ECOSAR). This study provided valuable approaches for developing efficient catalysts and designed a novel plate fixed-bed continuous flow UV-Fenton reactor, achieving immobilization of the Fe3O4/TiO2 composite catalyst and its efficient degradation of TCH. The findings provide valuable guidance for the industrial application of the catalyst.

2. Materials and Methods

2.1. Chemicals and Materials

All chemicals used in this study were analytical-grade reagents and were used without further purification. Tetracycline (TC) HCl (C22H24N2O8 HCl) was obtained from Sigma (Sigma–Aldrich Chemical Co., Shanghai, China). Sodium thiosulfate pentahydrate (Na2S2O3·5H2O), Ferric chloride (FeCl3•6H2O), Ferrous chloride (FeCl2•4H2O), sulfuric acid (H2SO4), Sodium hydroxide (NaOH), tetrabutyl titanate (TBT), t-BuOH, p-benzoquinone (BQ), sodium azide and ammonium oxalate and hydrogen peroxide (H2O2) 30% were purchased from Shenyang East China Reagent Plant, Shenyang, China. The Al2SiO5 board was purchased by Hebei Fuluda Company, Baoding, China. All solutions were prepared in deionized water.

2.2. Preparation and Characterization of Fe3O4/TiO2@Al2SiO5

The Fe3O4/TiO2-coated Al2SiO5 fiberboard (Fe3O4/TiO2@Al2SiO5) was fabricated using the calcination method. Firstly, a certain amount of FeCl3•6H2O and FeCl2•4H2O was dissolved in 100 mL distilled water. And then, 30 mL NH3•H2O was added to a water bath at 60 °C and continuously stirred for 40 min to obtain a solution containing Fe3O4. An amount of this solution was taken and dropped on the Al2SiO5 fiberboard. After drying for 12 h, 5 mL of tetrabutyl titanate sol–gel was evenly dropped onto the surface, and finally the precursor was calcined at 300 °C in the synthesis atmosphere (90% N2, 10% O2) for 1 h (10 °C/min), and then heated to 550 °C at the same rate for 4 h. Five Fe3O4/TiO2@Al2SiO5 were prepared with different Fe3O4 loading dosages (0.1 g/L, 0.25 g/L,0.5 g/L and 0.75 g/L).
The X-ray diffraction (XRD) patterns of all powders were obtained on a Rigaku D/Max 2550 diffractometer (Rigaku Corporation, Tokyo, Japan) using a Cu Kα radiation source (ƙ = 1.54056) at a scan rate of 10° min−1 to determine the crystal phase of the obtained samples. The acceleration voltage and the applied current were 3 kV and 20 mA, respectively. The surface morphology was characterized by field-emission scanning electron microscopy (FE-SEM, NOVA-230, FEI, Hillsboro, OR, USA). The chemical composition was analyzed using X-ray photoelectron spectroscopy (XPS, ESCA LAB 220-XL, Al Kα radiation XPS, Thermo Fisher Scientific 250Xi, Waltham, MA, USA). The degradation intermediate products of TCH were detected using ultra-high performance liquid chromatography-tandem mass spectrometry (UPLC-MS/MS, Agilent1100 Agilent, Santa Clara, CA, USA) and Gas Chromatography-Mass Spectrometry (GC-MS-QP2010 Plus, Tokyo, Japan).

2.3. Setting Up of the Reactor and Analytical Methods

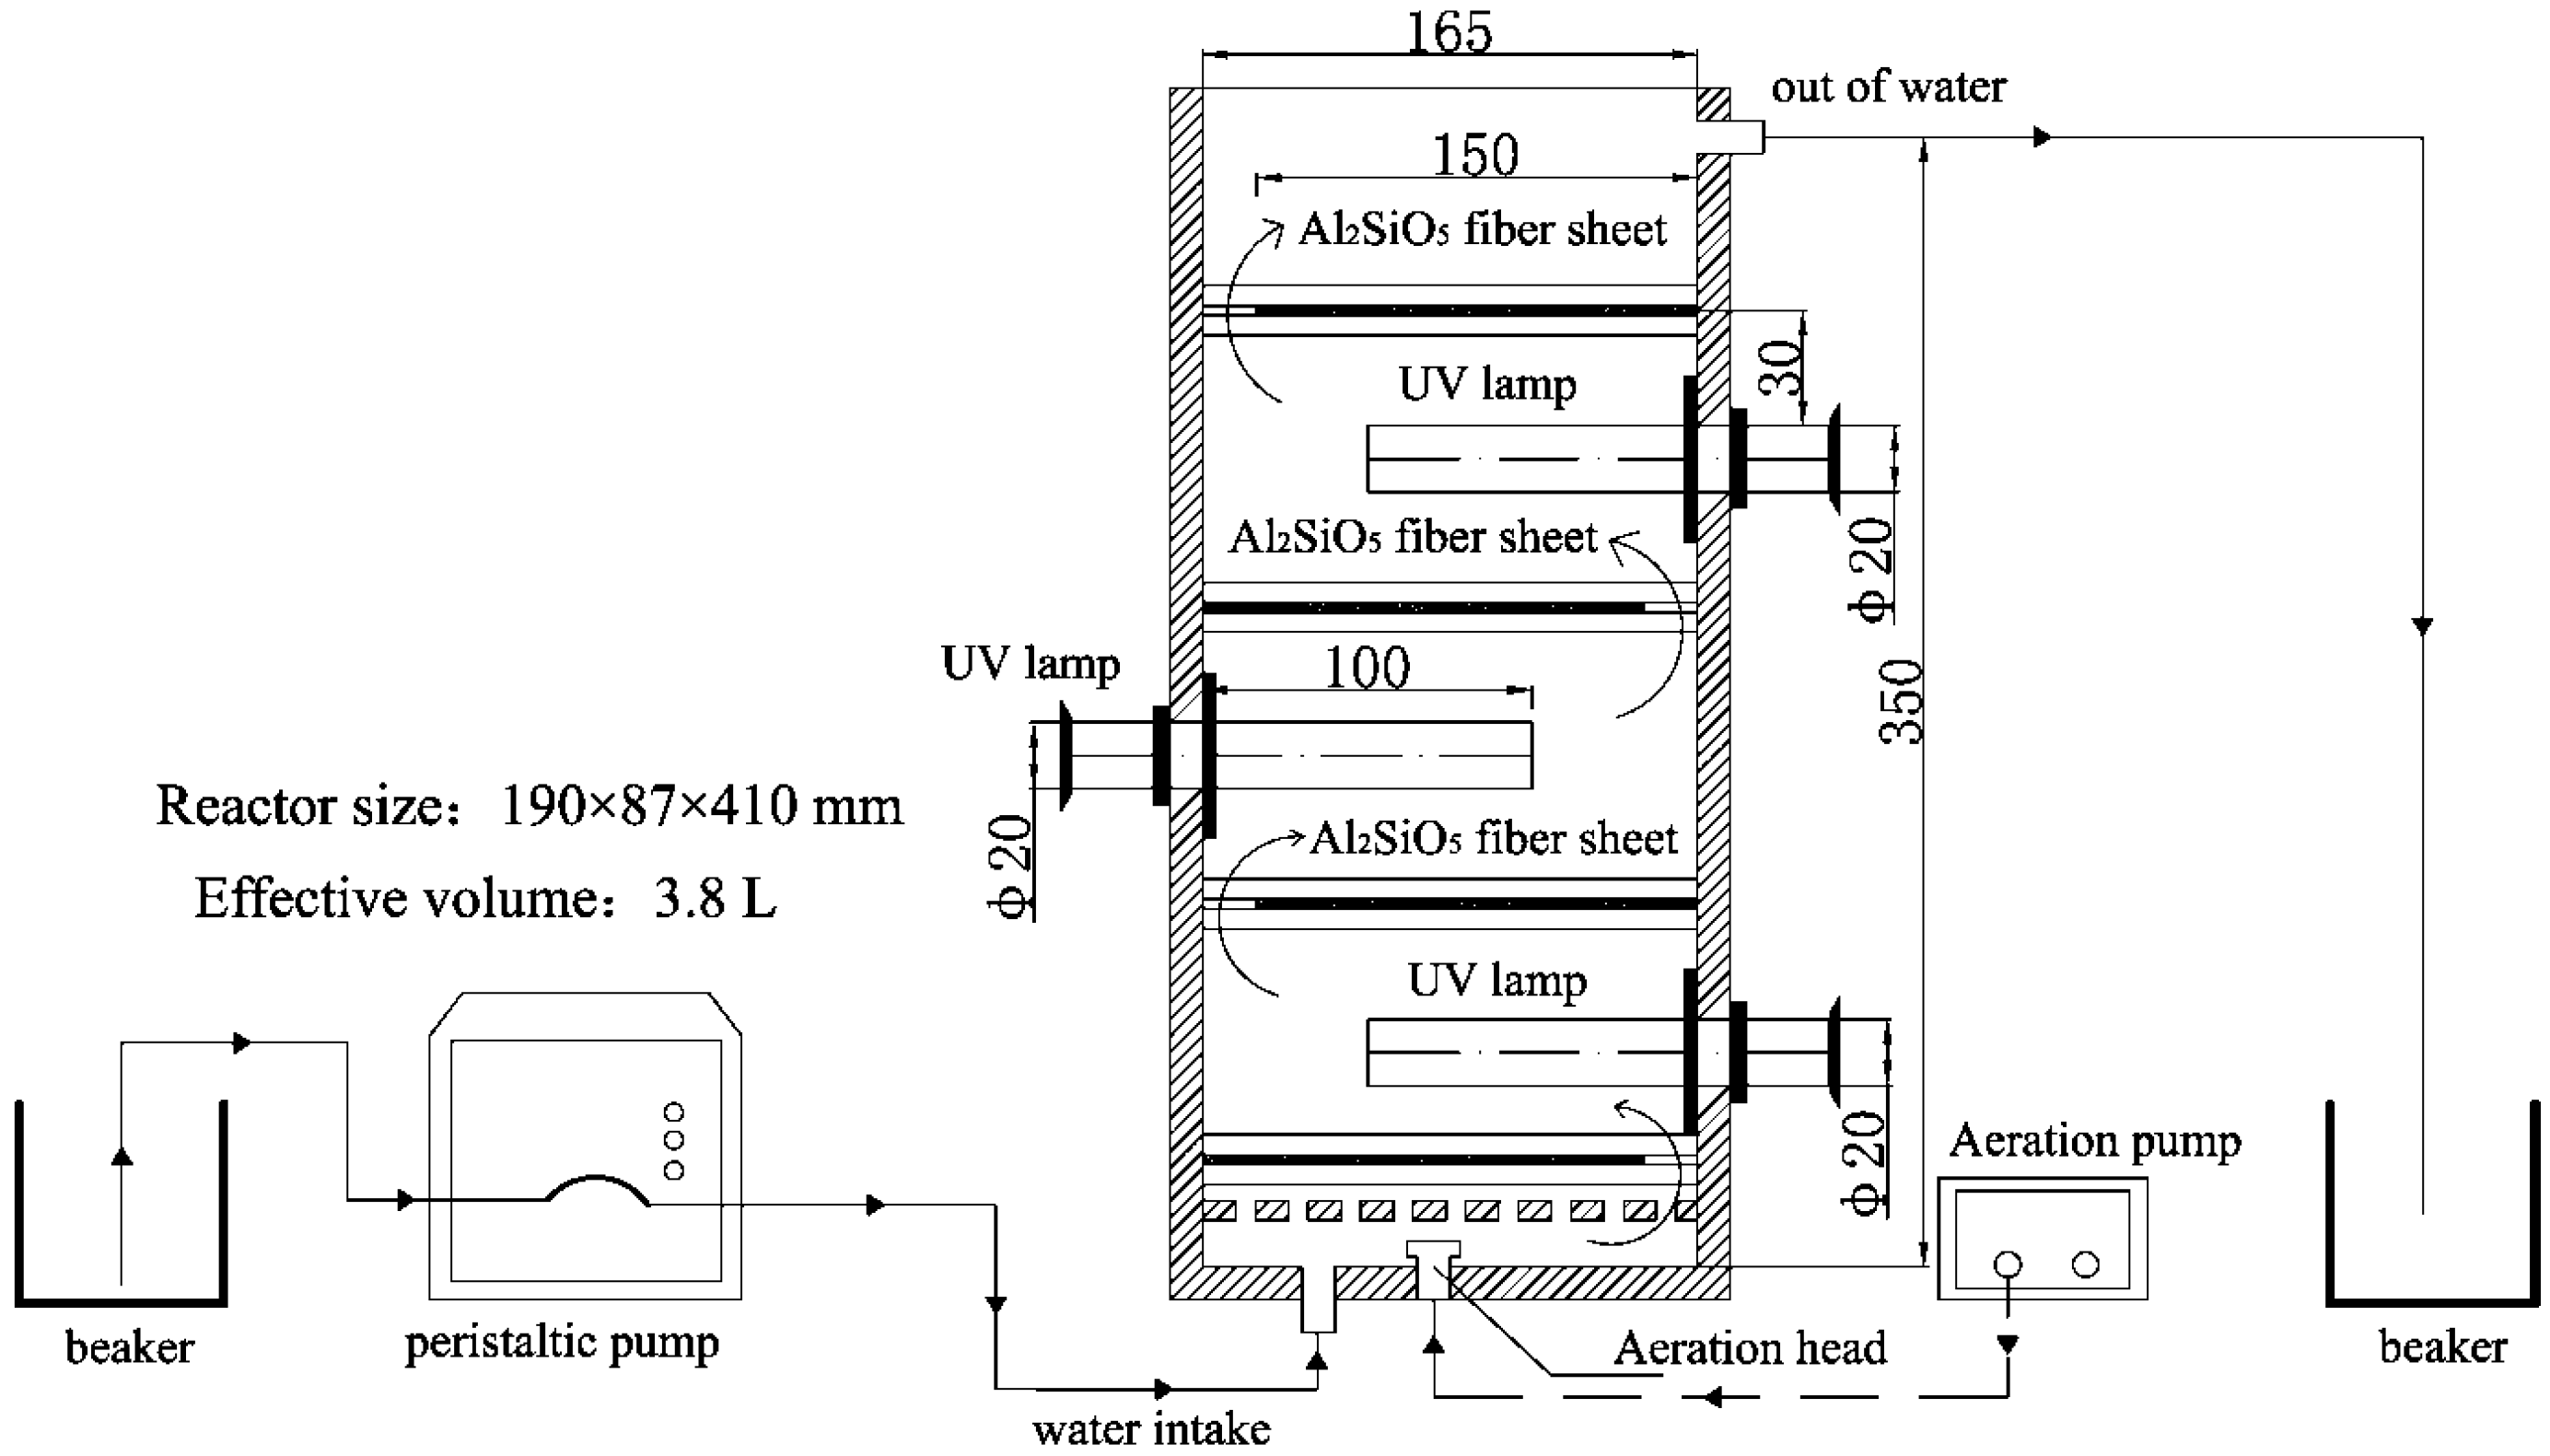
The overall structure of the designated plate fixed-bed UV-Fenton reactor is shown in Figure 1. The main material of the reactor is plexiglass. In the radial direction, it is divided into five areas: the lowest layer and the uppermost layer are water inlet and water outlet area, respectively, and the middle layers are the main reaction areas. Each reaction area is loaded with Fe3O4/TiO2@Al2SiO5. The samples are separated by Fe3O4/TiO2@Al2SiO5 fiberboard, the middle of each reaction zone has a 4 W (8 W, 15 W) UV lamp as a light source, and an aeration device is installed at the bottom of the reactor. The operation mode of the gas and liquid phases in the reactor is shown in Figure 1. After entering the reactor from the bottom, the gas flow is completely mixed with the solution. The gas flow is used as the driving force to raise the water flow. After the degradation reaction, the liquids are released through the effluent zone.
The schematic diagram of the experiment is to mix 3.8 L of simulated TCH wastewater with H2O2. If the hydraulic retention time is calculated as 2 h, the influent flow rate is about 0.032 L/min, and aeration at a ventilation rate of 25 mL/min, timing is started when the UV lamp is turned on, and samples are collected and measured at certain intervals.
The absorbance of TCH was measured at 375 nm via an ultraviolet-visible spectrophotometer (752, Shanghai Shunyu Instrument Co., Ltd., Shanghai, China). The degradation intermediate products of TCH were detected using ultra-high performance liquid chromatography-tandem mass spectrometry (UPLC-MS/MS) and Gas Chromatography-Mass Spectrometry (GC-MS).

3. Results and Discussion

3.1. Characterization Results

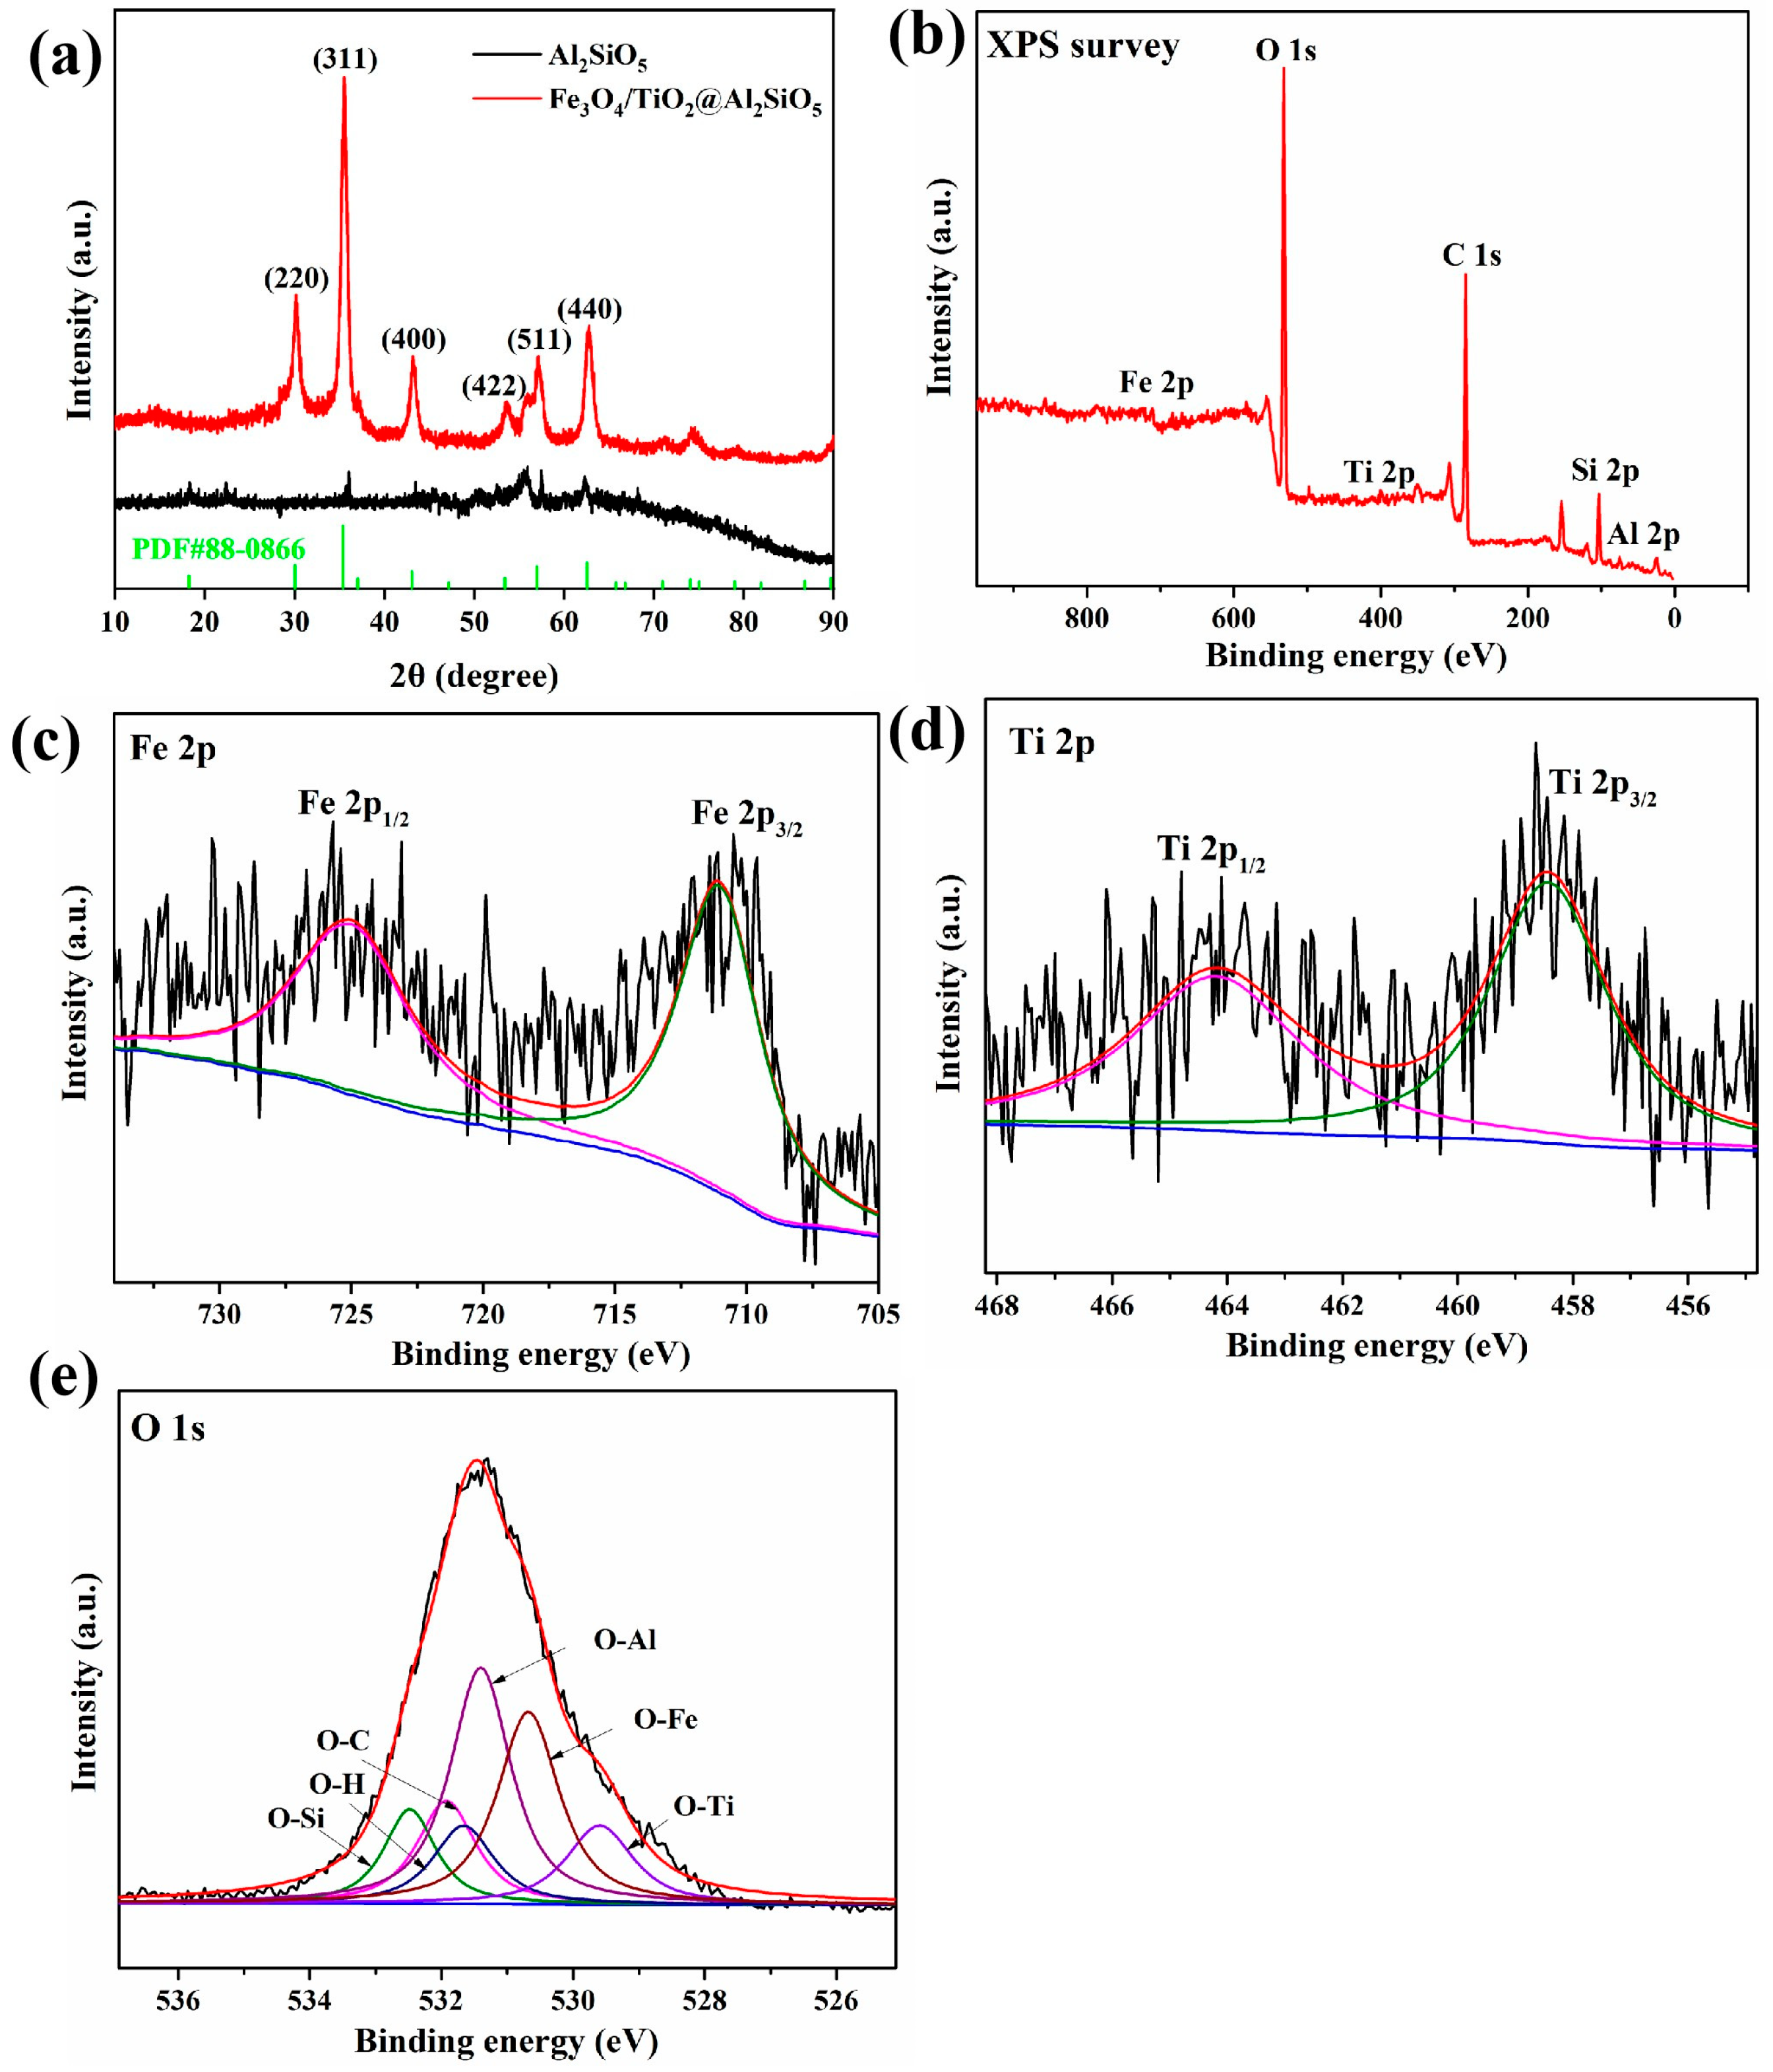
To determine the phase composition of the loaded catalyst, XRD analysis was carried out on the Al2SiO5 fiberboard. Figure 2a is the XRD patterns of Al2SiO5 fiberboard before and after loading. It is observed that there is no obvious diffraction peak in the XRD of Al2SiO5 fiberboard before loading, indicating that the obtained fiberboard is an amorphous phase. After Fe3O4 and TiO2 were loaded, strong X-ray diffraction peaks appeared in the XRD pattern of the fiberboard. The sample shows distinct diffraction peaks at 2θ values of 30.12°, 35.48°, 43.12°, 53.50°, 57.03°, 62.62°, and 74.09°. Analyzed using the standard card Fe3O4 (PDF#88-0866), this sample is of the tetragonal crystal system and belongs to magnetite. Through analysis, it is concluded that the peaks belong to the characterization of Fe3O4. However, due to the small amount of TiO2, no corresponding characteristic peak was found. Therefore, the phase of Al2SiO5 fiberboard catalyst is mainly an amorphous phase.
Since certain components within the obtained Fe3O4/TiO2@Al2SiO5 fiberboard catalyst samples exist in an amorphous phase, their phase composition cannot be determined through the XRD analysis. To further investigate the mainly amorphous phase of the catalyst, XPS analysis was employed to examine its chemical composition and the chemical states of each element. The full-scan survey in Figure 2b showed that the sample is mainly composed of Fe, O, Ti, C, Si, and Al. Among them Si, Al, and O elements constitute Al2SiO5 fiberboard, and Fe, O, and Ti elements are the constituent elements of Fe3O4 and TiO2.
Simultaneously, high-resolution XPS spectroscopy was performed on Fe 2p, Ti 2p, and O 1s. The high-resolution XPS spectrum of Fe 2p, as shown in Figure 2c, exhibits peaks at binding energies of 710.9 eV and 725.8 eV, corresponding to Fe 2p3/2 and Fe 2p1/2, respectively [21]. Following Gaussian–Lorentzian deconvolution (peak separation), the Fe 2p3/2 and Fe 2p1/2 peaks were fitted to Fe3+ (726.2 eV and 712.2 eV) and Fe2+ (724.3 eV and 710.2 eV), respectively. The Fe3+ to Fe2+ ratio was approximately 2:1, which is consistent with the binding energies reported for Fe3O4 in the literature. The high-resolution XPS spectrum of Ti 2p in Figure 2d shows Ti4+ 2p3/2 and Ti4+ 2p1/2 binding energies of 464.3 eV and 458.5 eV, respectively, with a peak separation of 5.8 eV. Comparison with standard spectra indicates these values are typical for Ti4+ in TiO2. The high-resolution XPS spectrum of O 1s in Figure 2e was fitted into six peaks with binding energies of 532.8 eV, 532.2 eV, 531.6 eV, 531.5 eV, 530.1 eV, and 529.6 eV. The 530.1 eV and 529.6 eV peaks correspond to the O-Fe bond in Fe3O4 and the O-Ti bond in TiO2, respectively, representing lattice oxygen [22,23]. The peaks at 531.6 eV and 532.2 eV correspond to the O-H bond and O-C bond, respectively [24]. The binding energies of 532.8 eV and 531.5 eV correspond to the O-Si and O-Al bonds in the Al2SiO5 carrier, respectively. It is evident that the Al2SiO5 fiberboard carrier has not altered the chemical composition or elemental state of Fe3O4 and TiO2.
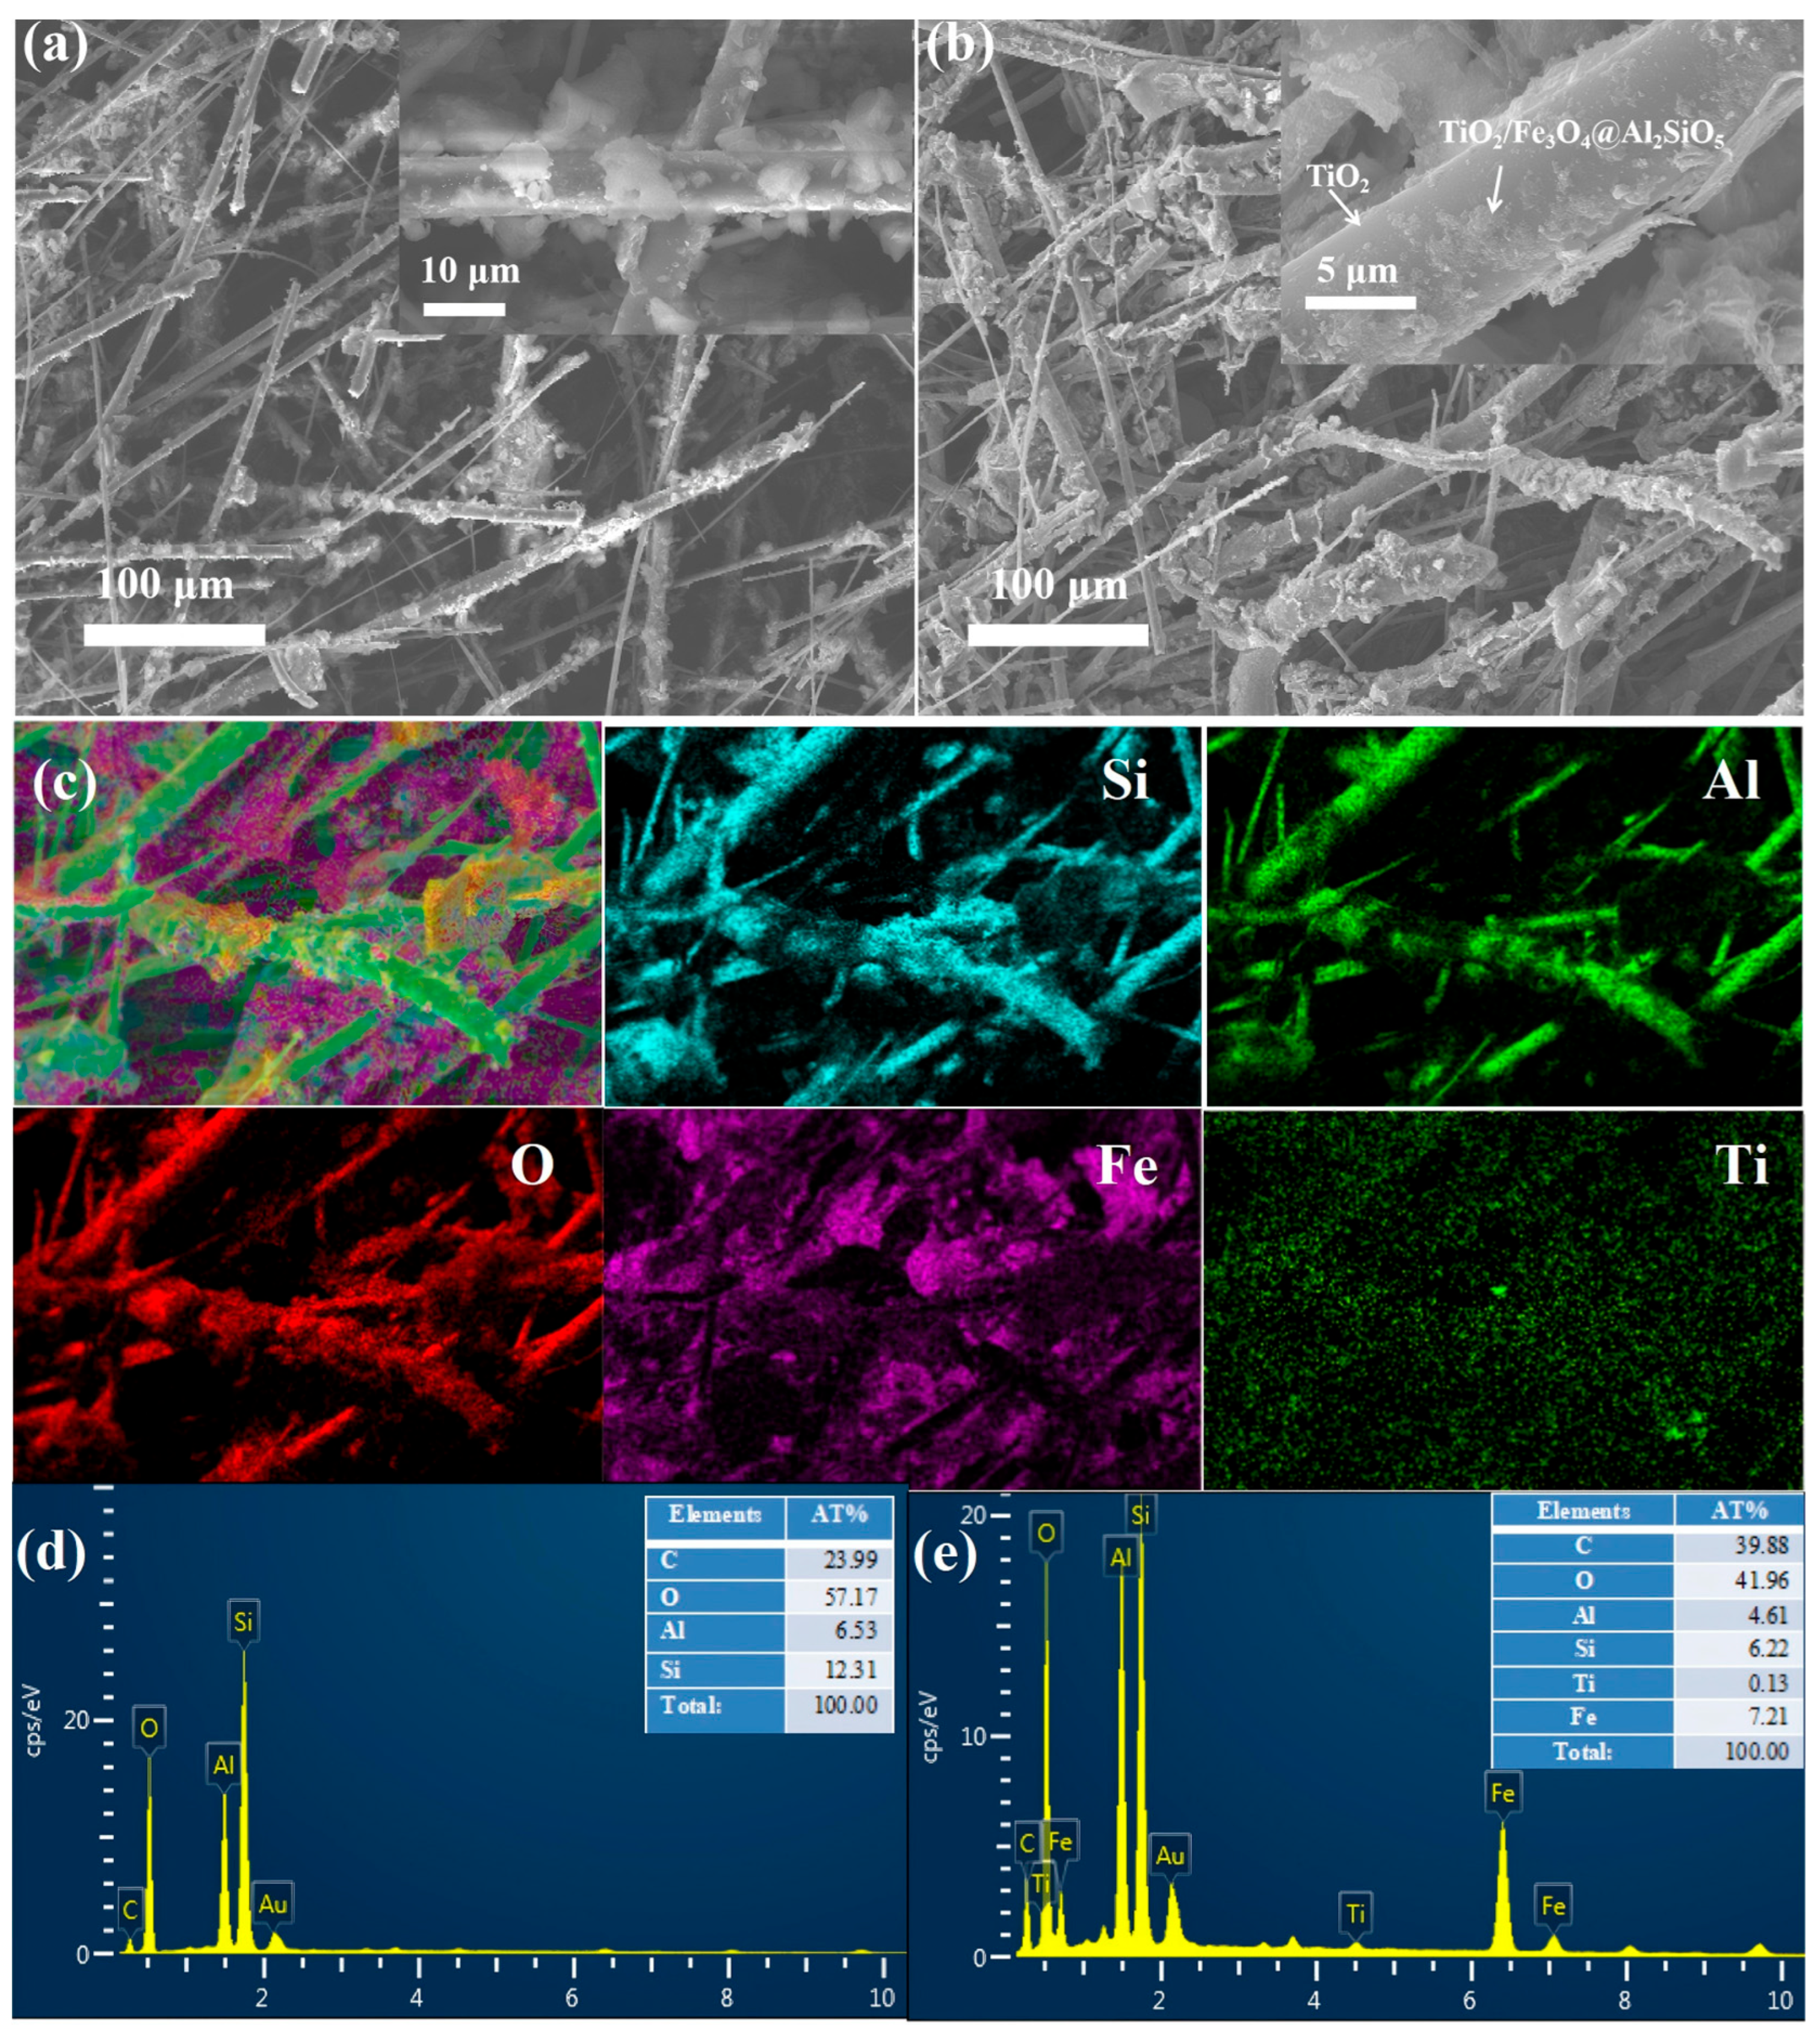
The surface morphology of the Al2SiO5 fiberboard was characterized by SEM (Figure 3a). It was observed that the Al2SiO5 fiberboard carrier exhibited a filamentous structure with a rough and uneven surface, making them suitable for loading powdered catalysts. The diameter of the filaments is approximately 10 μm (Figure 3a). Figure 3b shows the SEM image of Fe3O4/TiO2@Al2SiO5 fiberboard. The surface of the loaded Al2SiO5 fibers appears even rougher. The enlarged inset in Figure 3b reveals nanoscale Fe3O4 particles loaded onto the surface of the Al2SiO5 fibers and TiO2 with lamellar structure is coated on the Al2SiO5 fibers surface. As shown in Figure 3c, Si, Al, O, Fe, and Ti could be detected. And the elements Si, Al and O are the main constituents of the fiberboard and formed the skeleton structure of the sample. The elements Fe, Ti, and O are highly uniformly distributed on the surface of Fe3O4/TiO2@Al2SiO5. Additionally, the EDX energy spectrum of the sample reveals the presence of three Fe, Ti, and O elements (Figure 3e). The Au element is attributed to the gold spraying pretreatment performed during SEM. Signal peaks at energies of 0.41 and 4.52 keV correspond to the Ti element in TiO2, while peaks at 0.72, 6.44, and 7.06 keV correspond to Fe in Fe3O4, while the peak at 0.52 keV corresponds to O element. Compared to Al2SiO5 Figure 3d, the peak area ratio of O in Fe3O4/TiO2@Al2SiO5 shows a significant increase, originating from oxygen in Fe3O4/TiO2 and adsorbed oxygen. The percentages of C, O, Al, and Si in the Al2SiO5 fiberboard are 23.99%, 57.17%, 6.53%, and 12.31%, respectively. The proportions of C, O, Al, Si, Ti, and Fe in Fe3O4/TiO2@Al2SiO5 are 39.88%, 41.96%, 4.61%, 6.22%, 0.13%, and 7.21%, respectively. The presence of C might be due to the fact that there was C in the organic ligands during the synthesis process, and the synthesis process did not thoroughly remove it, resulting in residual C. Alternatively, it could be because CO2 was present in the testing environment. The low content of Ti is due to the small amount of Ti used in the doping process.

3.2. Optimization of Operating Parameters for TCH Degradation in the Plate Fixed-Bed Reactor

3.2.1. Optimization of Loading Dosage

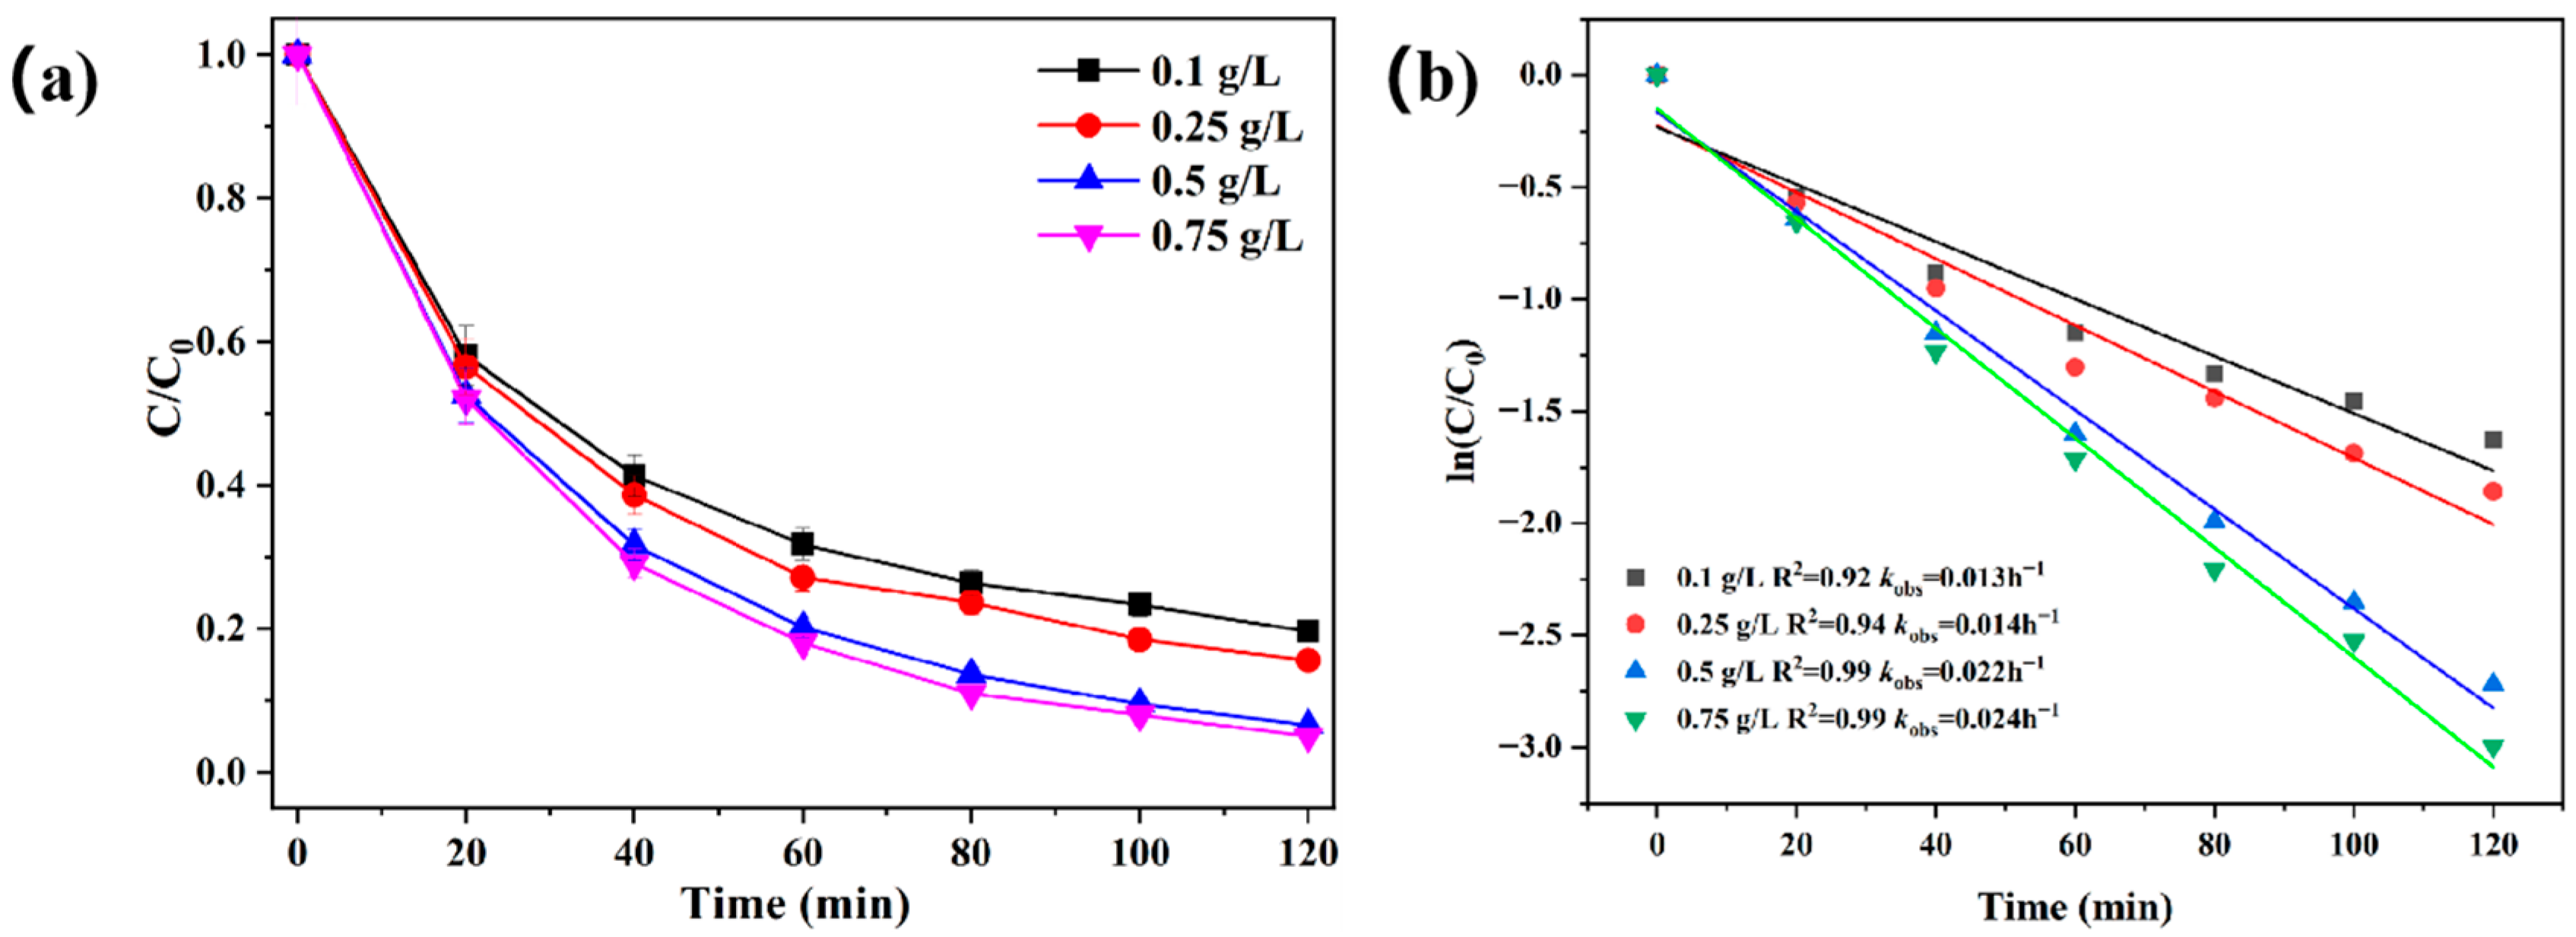
The effect of catalyst dosage was investigated as the amount of catalyst used has a certain effect on the degradation of TCH. The results are shown in Figure 4a. We can see that the removal rate of TCH gradually increases with the increase in load of Fe3O4/TiO2@Al2SiO5. For catalyst loading of 0.1 g/L, 0.25 g/L, 0.5 g/L, and 0.75 g/L, the removal rates of TCH after 120 min were 74.5%, 80.5%, 93.5%, and 94%, respectively. As shown in Figure 4b, at different initial concentrations, ln(C/C0) shows a good linear relationship with time, and the fitting equation R2 is close to 1. Moreover, when the loading dosage is 0.75 g/L, the reaction rate is the fastest, which is consistent with Figure 4a.The result indicates that an increase in the catalyst loading into the reaction increases the reaction area of the heterogeneous Fenton reaction, which in turn increases the active sites on the catalyst surface, and improves the efficiency of the process [25]. However, as the catalyst dosage continued to increase to 0.75 g/L, the TCH removal rate improved by only 1.5%. Therefore, to achieve cost-effective operation, the catalyst dosage should be maintained at 0.5 g/L.

3.2.2. Effect of pH Value on the Degradation

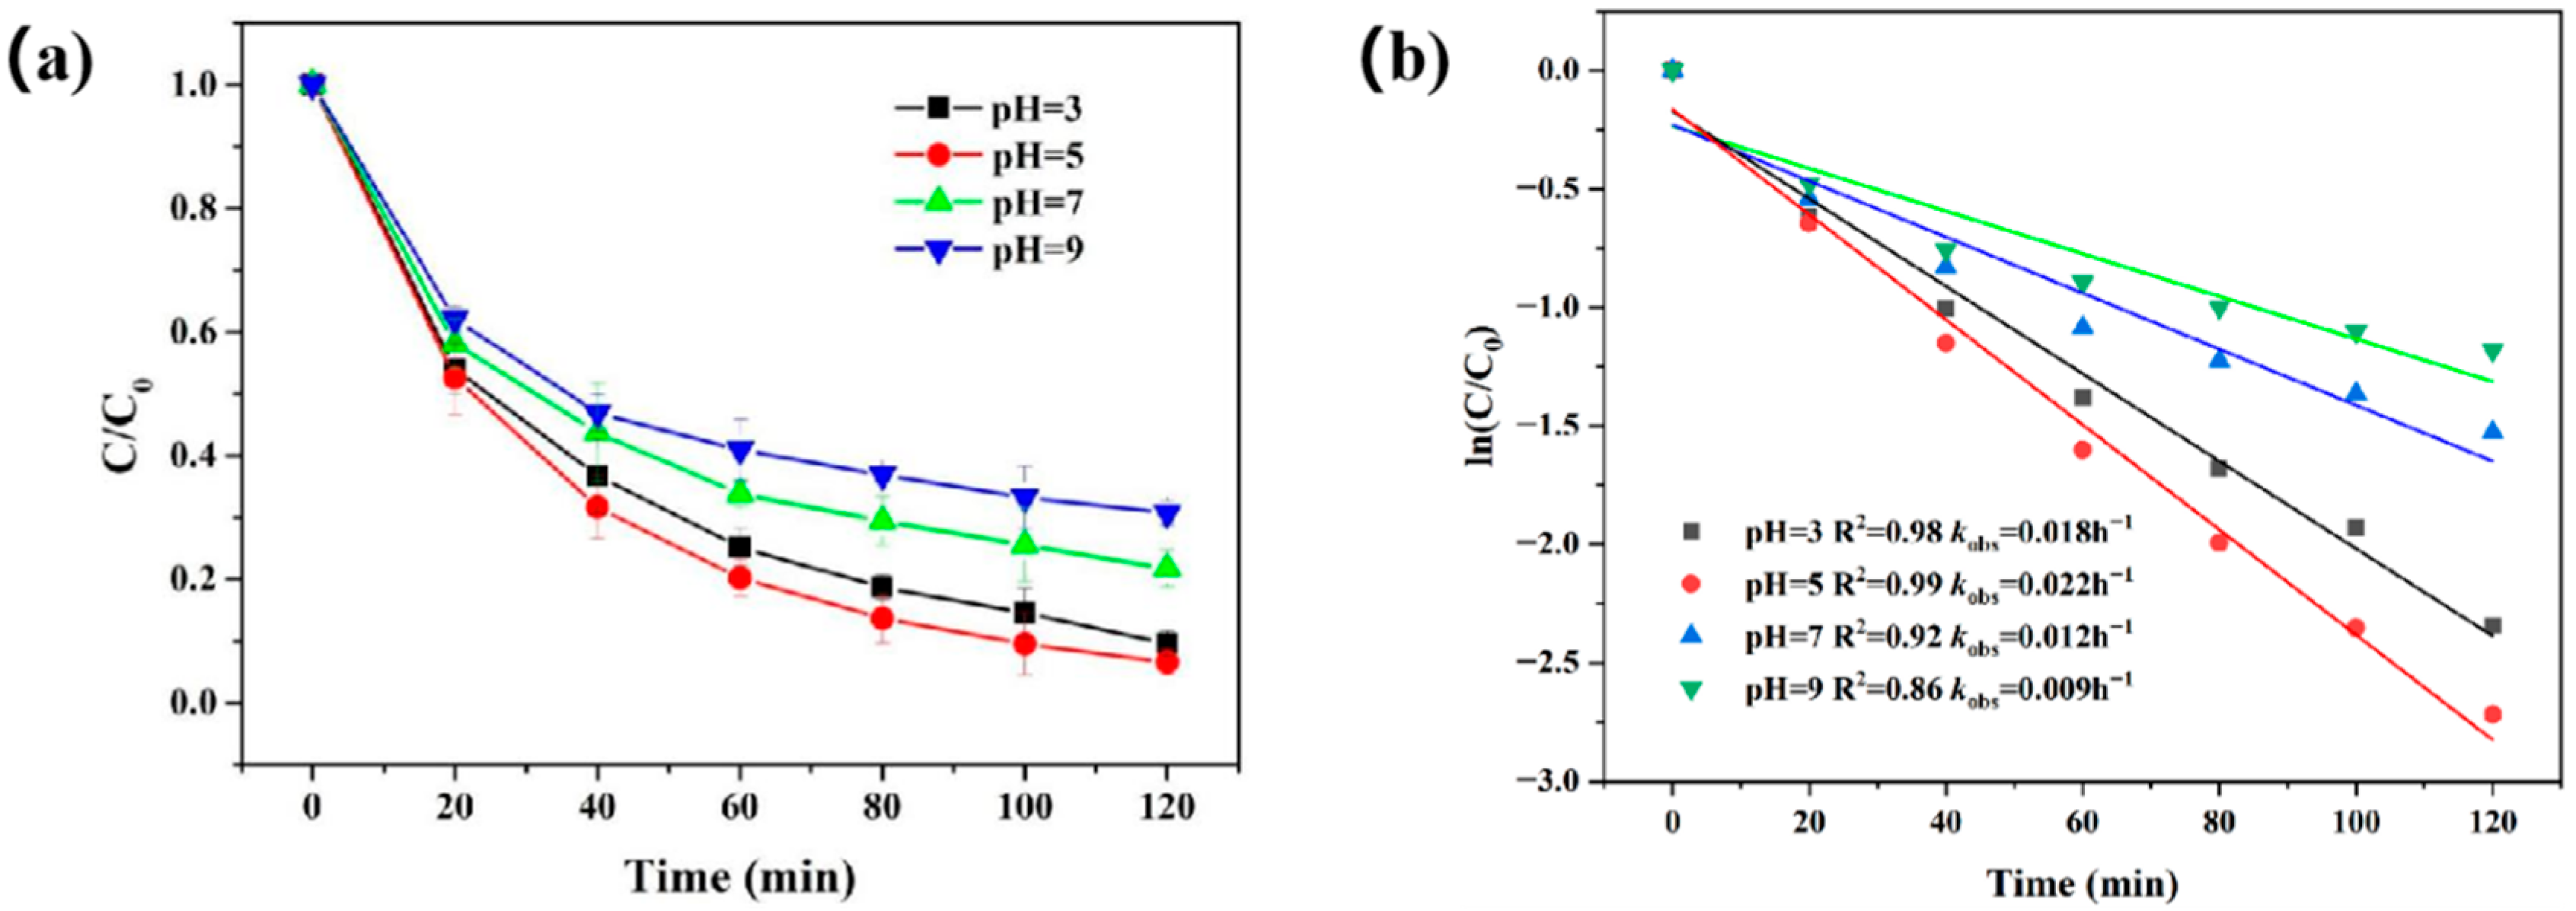
The pH of a solution is a very important factor affecting the treatment effect of the plate fixed-bed UV-Fenton reactor. About 0.1 M H2SO4 and 0.1 M NaOH solutions were used to adjust the pH of the TCH solution. The result of the effect of the initial pH on TCH degradation is shown in Figure 5a. For pH values of 3.0, 5.0, 7.0, and 9.0, the degradation rate of TCH increases first and then decreases with the increase in pH value. The removal rates are 90.5%, 93.5%, 78.3%, and 69.3%, respectively, for pH 3.0, 5.0, 7.0, and 9.0. As shown in Figure 5b, at different pH values, the linear relationship between ln(C/C0) and time conforms to the first-order kinetic model. The reaction is in accordance with the first-order kinetic model at different pH values. When pH = 5, the reaction rate is the fastest, further indicating that pH = 5 is the optimal pH for the reaction. In previous studies [26], it can be found that the UV-Fenton reaction in the beaker test could be operated at a wider pH range, which is mainly related to the treatment method. The beaker test belongs to the sequencing batch reaction, and the organic acids generated in the system first gradually increased and then gradually decreased with the progress of the reaction. For the continuous flow reactor, the intermediate metabolites (organic acids) generated in the system will be discharged from the system with the effluent, resulting in a slow drop in pH value in the system (Table 1).

3.2.3. Effect of H2O2 Concentration

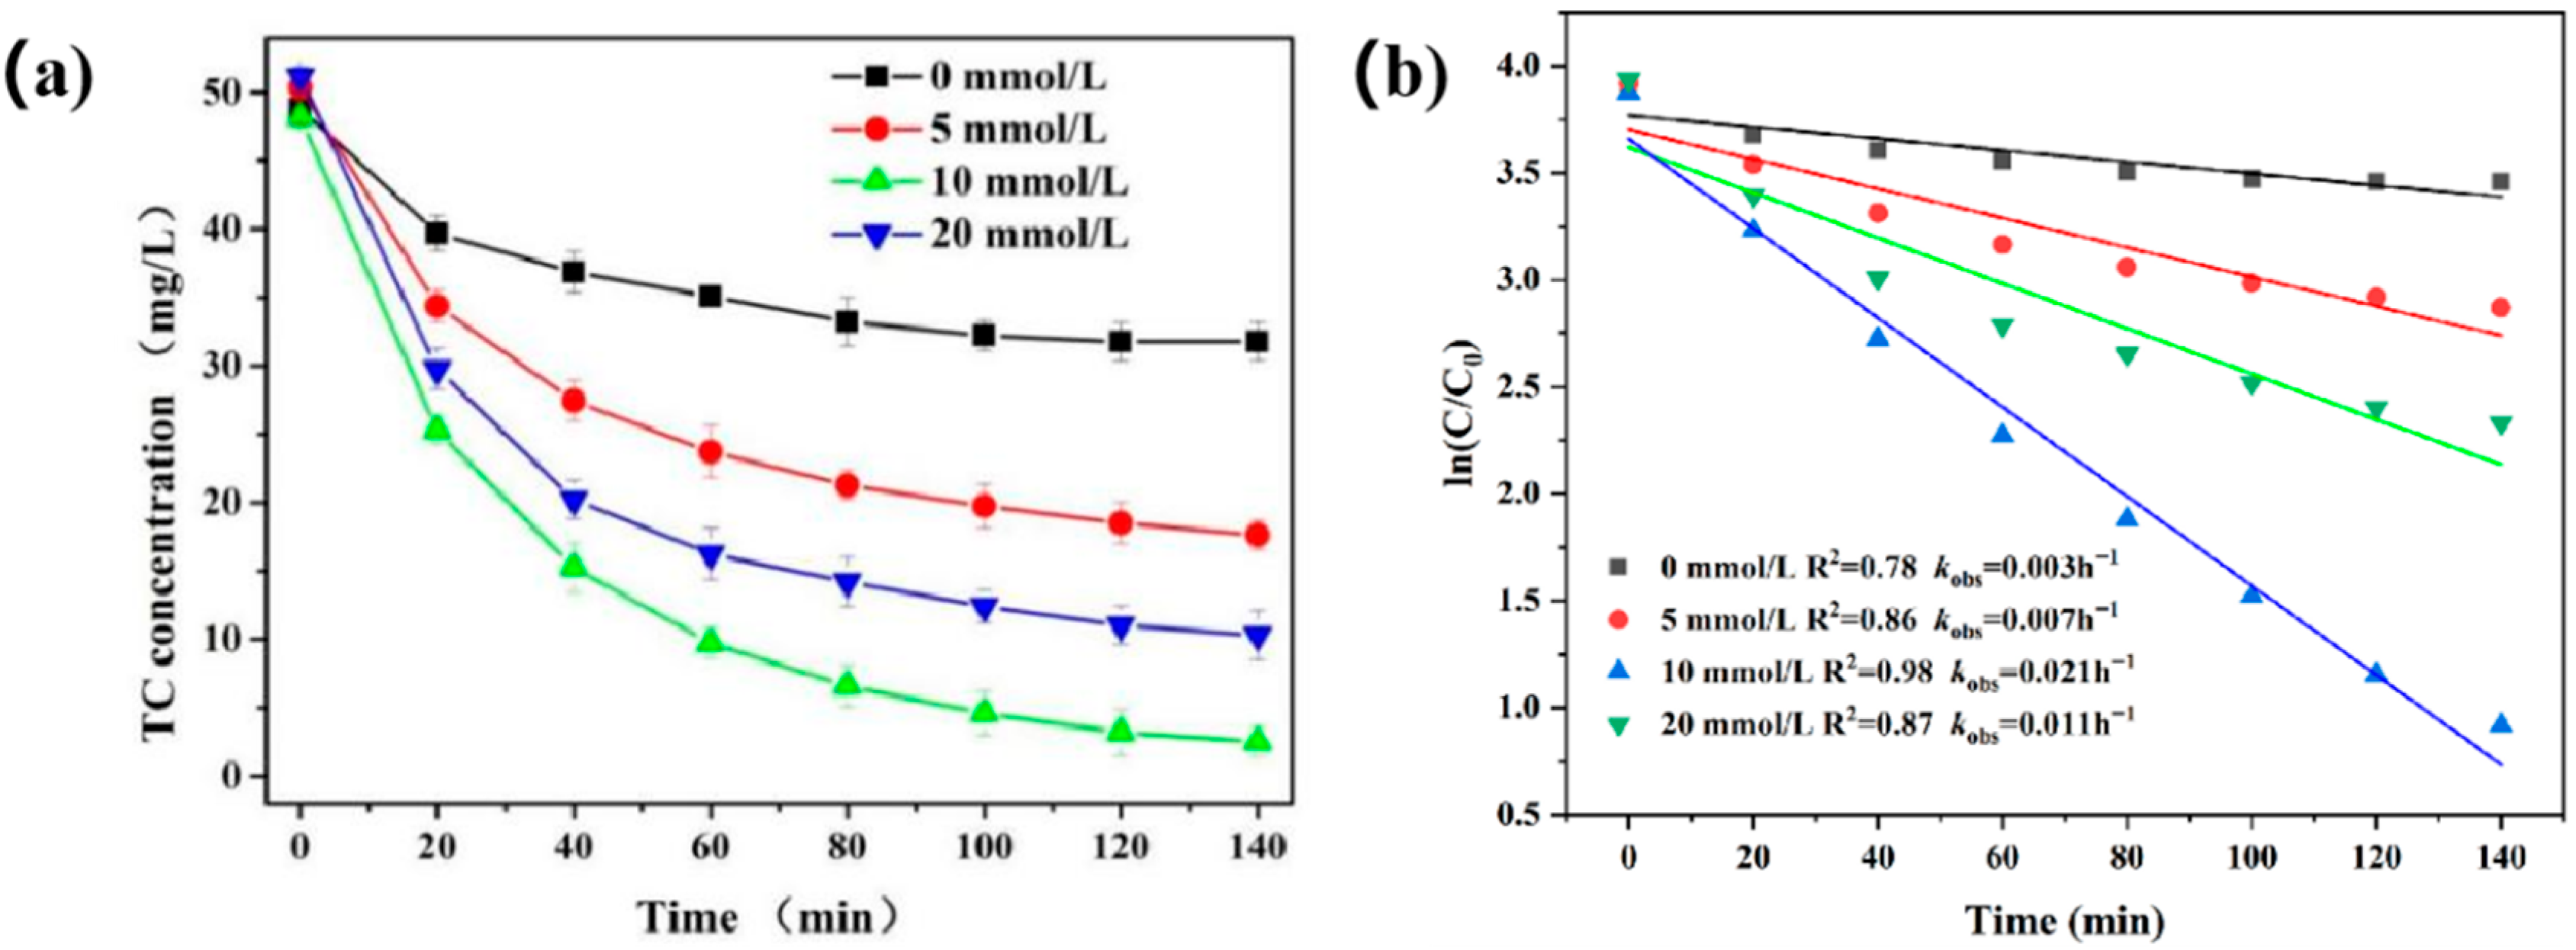
The main source of the hydroxyl radical in the UV-Fenton system is from the decomposition of H2O2. The dosage of H2O2 will not only affect the production of the hydroxyl radical but will also affect the project cost during practical application. The dosage or amount of H2O2 is therefore vital to the process and hence it is investigated in this study for TCH degradation. The results are presented in Figure 6a. We can see that the change in concentration of H2O2 from 5 mmol/L to 20 mmol/L first shows an increase in the removal efficiency of TCH and then a decrease with more concentration of H2O2. After 120 min of the reaction, the initial concentration of H2O2 from 5 mmol/L, 10 mmol/L, and 20 mmol/L resulted in a TCH removal efficiency of 63.2%, 93.4% and 78.5%, respectively. It can be concluded from this result that the best dosage of H2O2 in the plate fixed-bed UV-Fenton reactor system is 10 mmol/L. As shown in Figure 6b, at different H2O2 concentration, the linear relationship between ln(C/C0) and time conforms to the first-order kinetic model. This result indicates that the higher the dosage of H2O2, the more the hydroxyl radical produced in the system and the better the removal efficiency. A further increase in the H2O2 dosage would compete for active species resulting in a decrease in the removal rate of TCH in the reaction system and also unnecessary waste of H2O2 leading to a higher cost.

3.2.4. Effect of UV Light Intensity

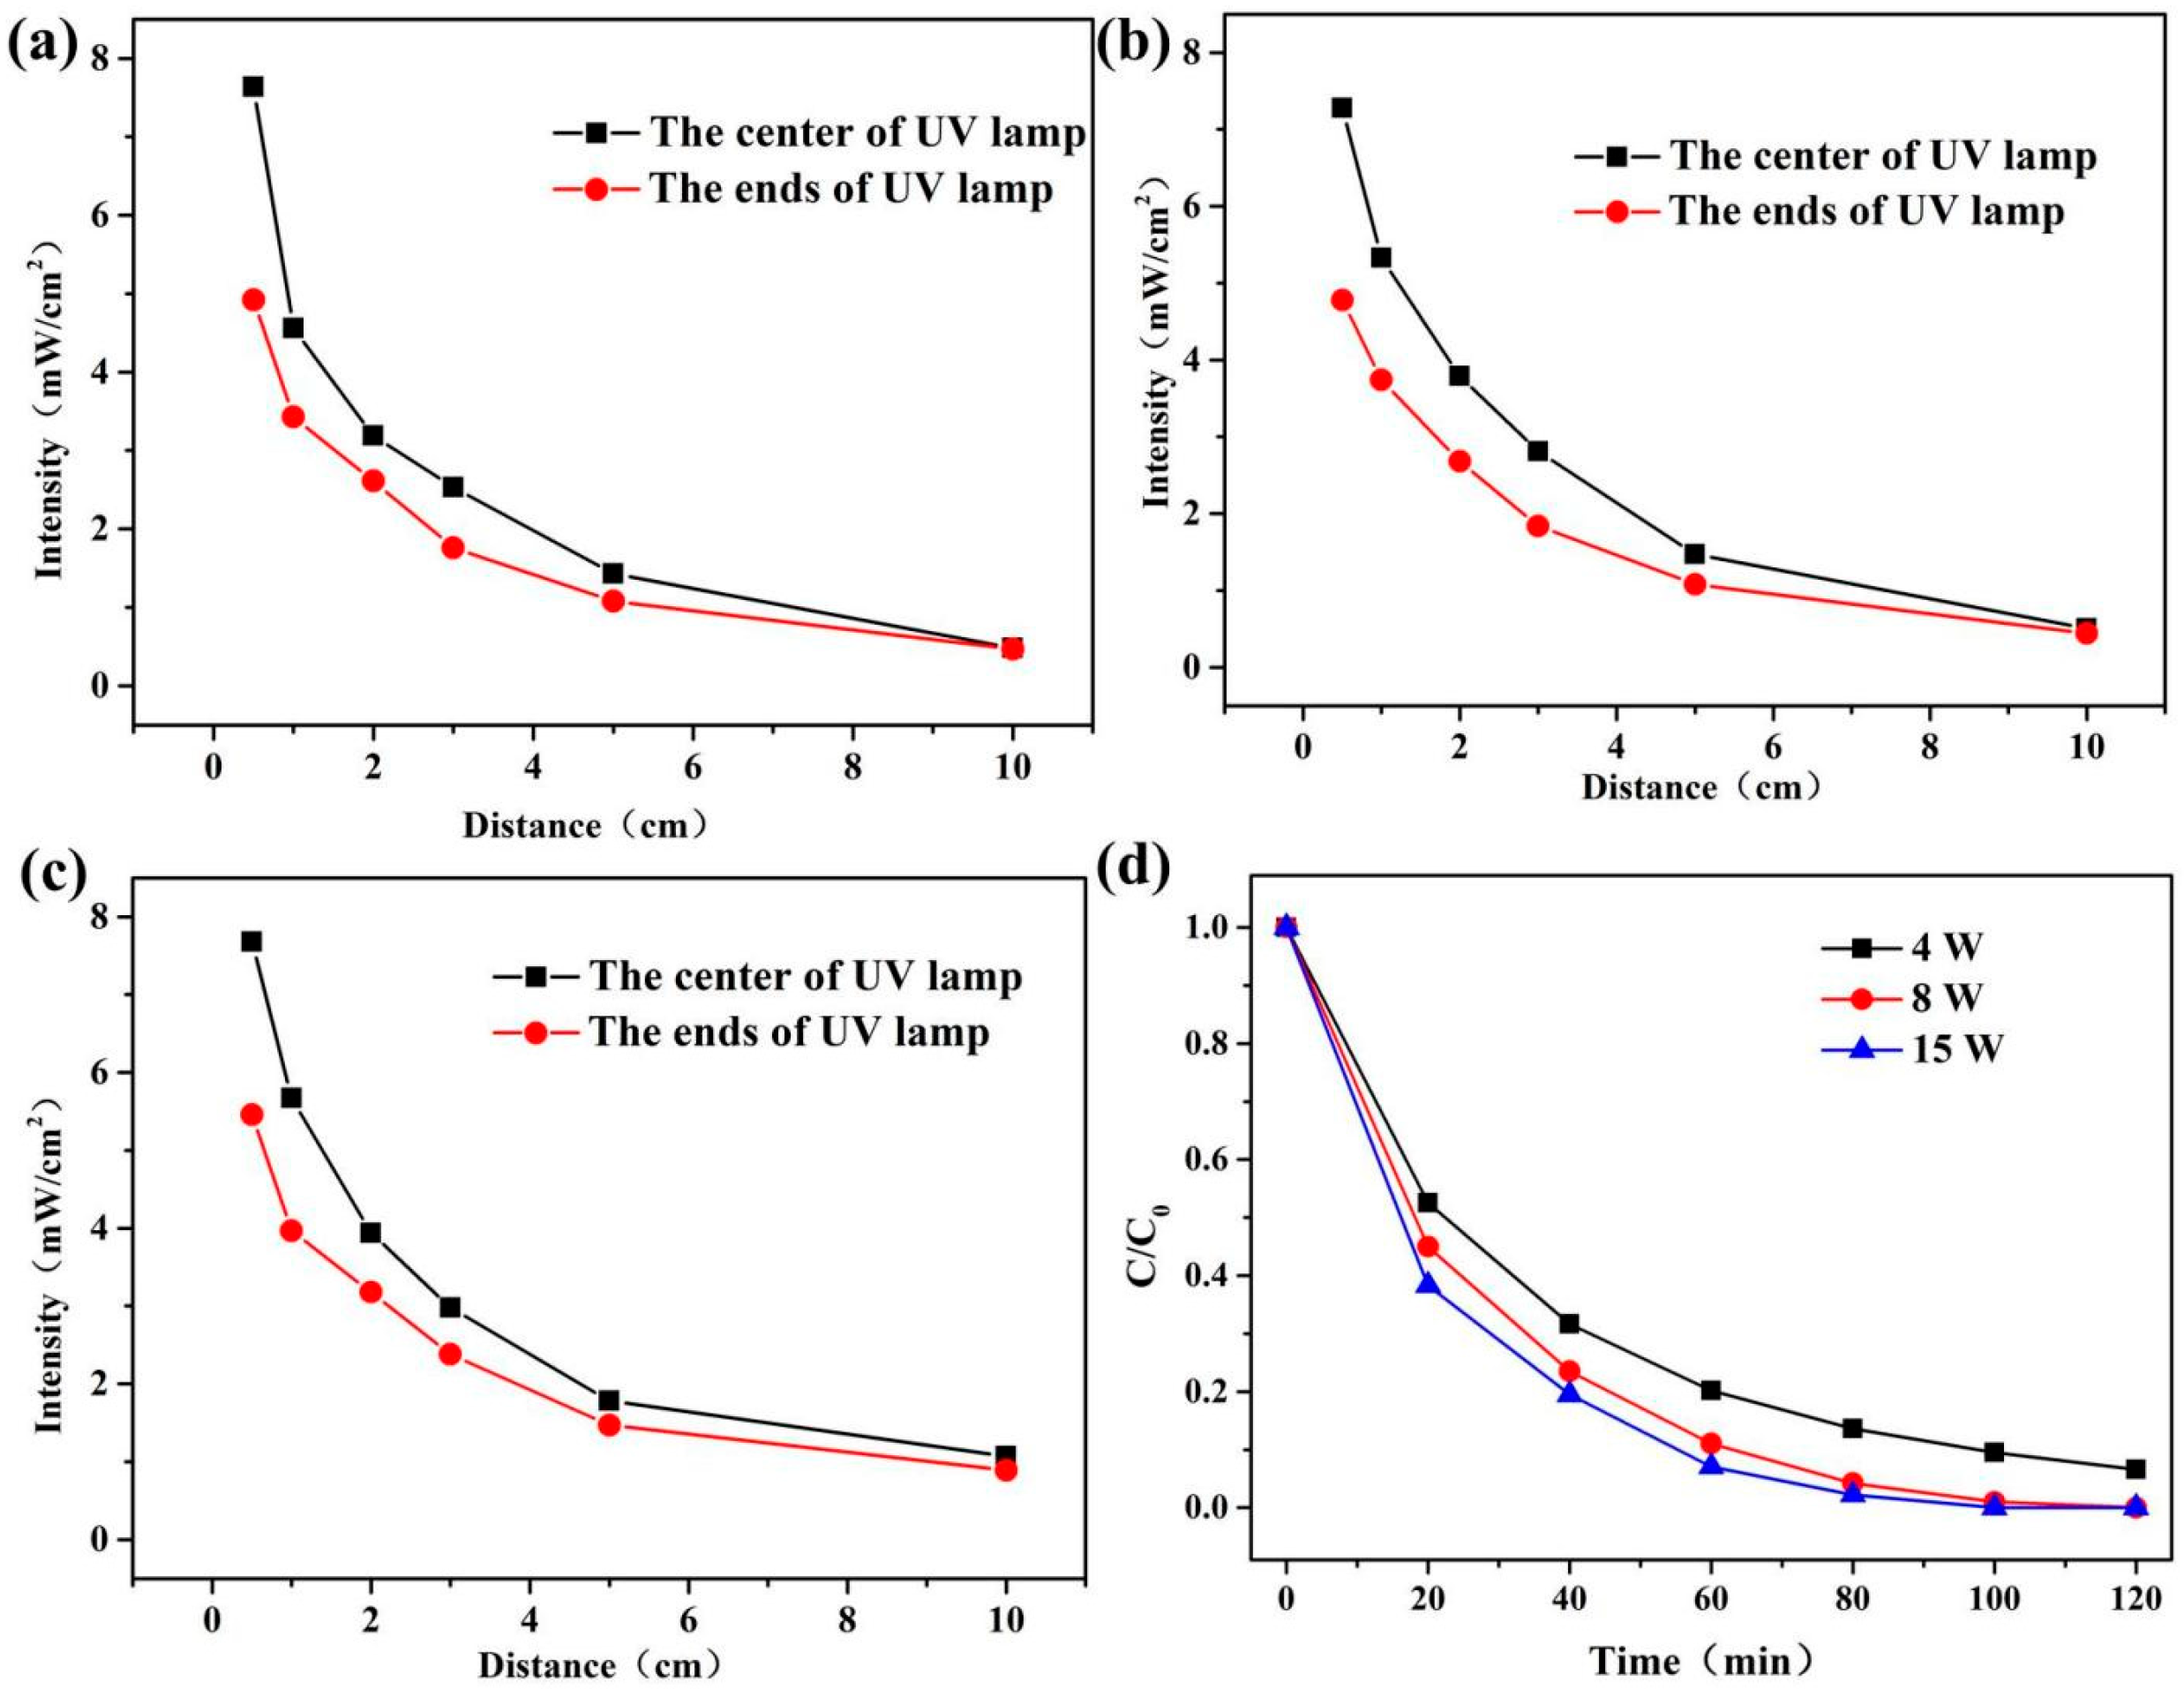
The intensity of the ultraviolet light directly affects the power consumption in the treatment process, and this is one of the key factors that is affecting the catalytic oxidation of the plate fixed-bed UV-Fenton reactor. For this study, the power consumption per ton of water per hour in (Kw/m3) is used to express the intensity of UV light. The effect of the different UV light intensity on the degradation of TCH in the plate fixed-bed UV-Fenton reactor is shown in Figure 7. As shown in Figure 7a–c, the two curves in the figure are the light intensity of UV radiation at the center and both ends of the UV lamp tube. As the power of the UV lamp increases, the spatial distribution of the light intensity does not change significantly, and the trend is consistent. At the same time, the further the distance from the light source, the smaller the light intensity. Since the distance between the Al2SiO5 fiberboard and the UV lamp tube in the reactor is about 3 cm, it can be seen from the figure that the light intensity ranges of the three UV lamps (4 W, 8 W, and 15 W) at 3 cm are 1.76~2.53 mW/cm2, 1.84~2.81 mW/cm2, and 2.38~2.98 mW/cm2, respectively. In the TCH degradation test, as shown in Figure 7d, under the conditions of 4 W, 8 W, and 15 W, the removal rates of TCH after 100 min were 90.5%, 99.1%, and 99.8%, respectively. This is because the increase in the light intensity can improve the absorption of light by the solution and the catalyst and accelerate the oxidation reaction rate of TCH. Although increasing the light intensity can improve the degradation effect of TCH, it also increases the consumption of electricity, and the increase in the removal rate of TCH is less than the increase in light intensity. Therefore, lower light intensity and longer operation time can meet the processing effect and reduce the power consumption at the same time.

3.2.5. Effect of Hydraulic Retention Time (HRT) on TCH Degradation

The hydraulic retention time is one of the important parameters to be considered in the reactor design. From the results shown in Figure 8, with gradual reduction in hydraulic retention time, the degradation efficiency of TCH in the effluent gradually decreases. When the HRT is 180 min and the concentration of TCH in the effluent is about 2 mg/L, the removal rate of TCH in the reactor can reach more than 95%. When the HRT is gradually reduced to 120 min, the degradation efficiency of TCH decreases slightly and the removal rate of TCH is maintained at 93%. At 90 min HRT, the TCH effluent concentration of the reactor first increases rapidly and then stabilizes at about 13 mg/L and the removal rate is 70%. It can therefore be concluded that during the operation of the plate fixed-bed UV-Fenton reactor, regulating the HRT plays a vital role in the catalytic efficiency of the reactor. When the HRT is 120 min, the removal rate of TCH in the plate fixed-bed UV-Fenton reactor can achieve more than 93% efficiency.

3.2.6. Effect of Different Influent TCH Concentration on the Degradation

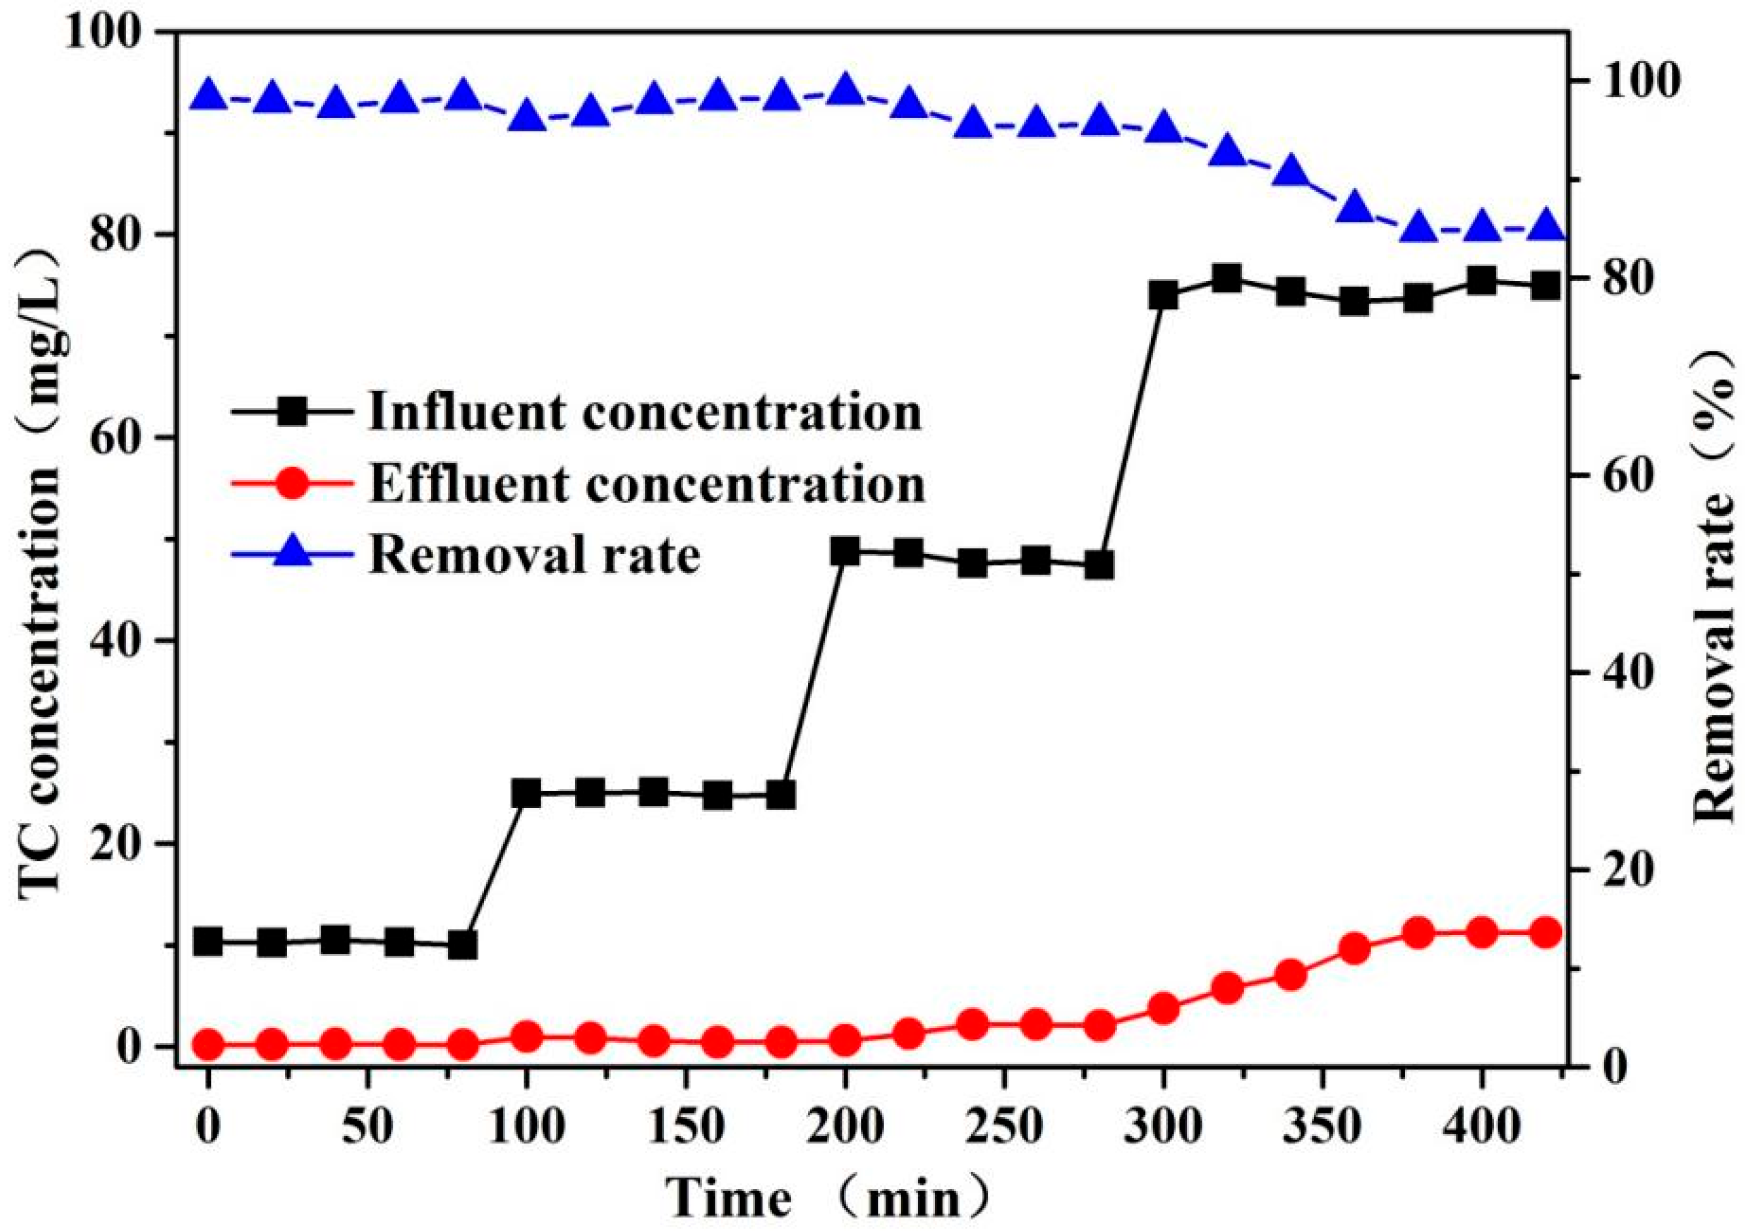
The change in TCH concentration was studied under different concentrations (10 mg/L, 25 mg/L, 50 mg/L, and 75 mg/L) in the continuous influent and effluent and the influence of concentration change on the operation process of the reactor was investigated so as to determine the maximum load that the UV-Fenton reactor can bear. It can be seen from the results shown in Figure 9 that when the influent concentration is increased from 10 mg/L to 25 mg/L, the concentration of TCH in the effluent is lower, and the removal rate is above 96.5%. When the influent concentration was increased to 50 mg/L, it reached stability within 20 min of the reaction, the effluent concentration was maintained at about 2 mg/L, and the removal rate could reach more than 95.3%. When the influent concentration continued to increase to 75 mg/L, the effluent concentration rose slowly. After 60 min of reaction, the effluent concentration was basically stable to 11.2 mg/L, and the removal rate was 85%. The reason was that the removal rate decreased due to insufficient H2O2 in the system. It can be seen that during the operation of the reaction device, the change in the influent concentration has little effect on the removal rate of TCH, and the dynamic test device has a good impact resistance.

3.3. Stability Evaluation of the Plate Fixed-Bed Reactor

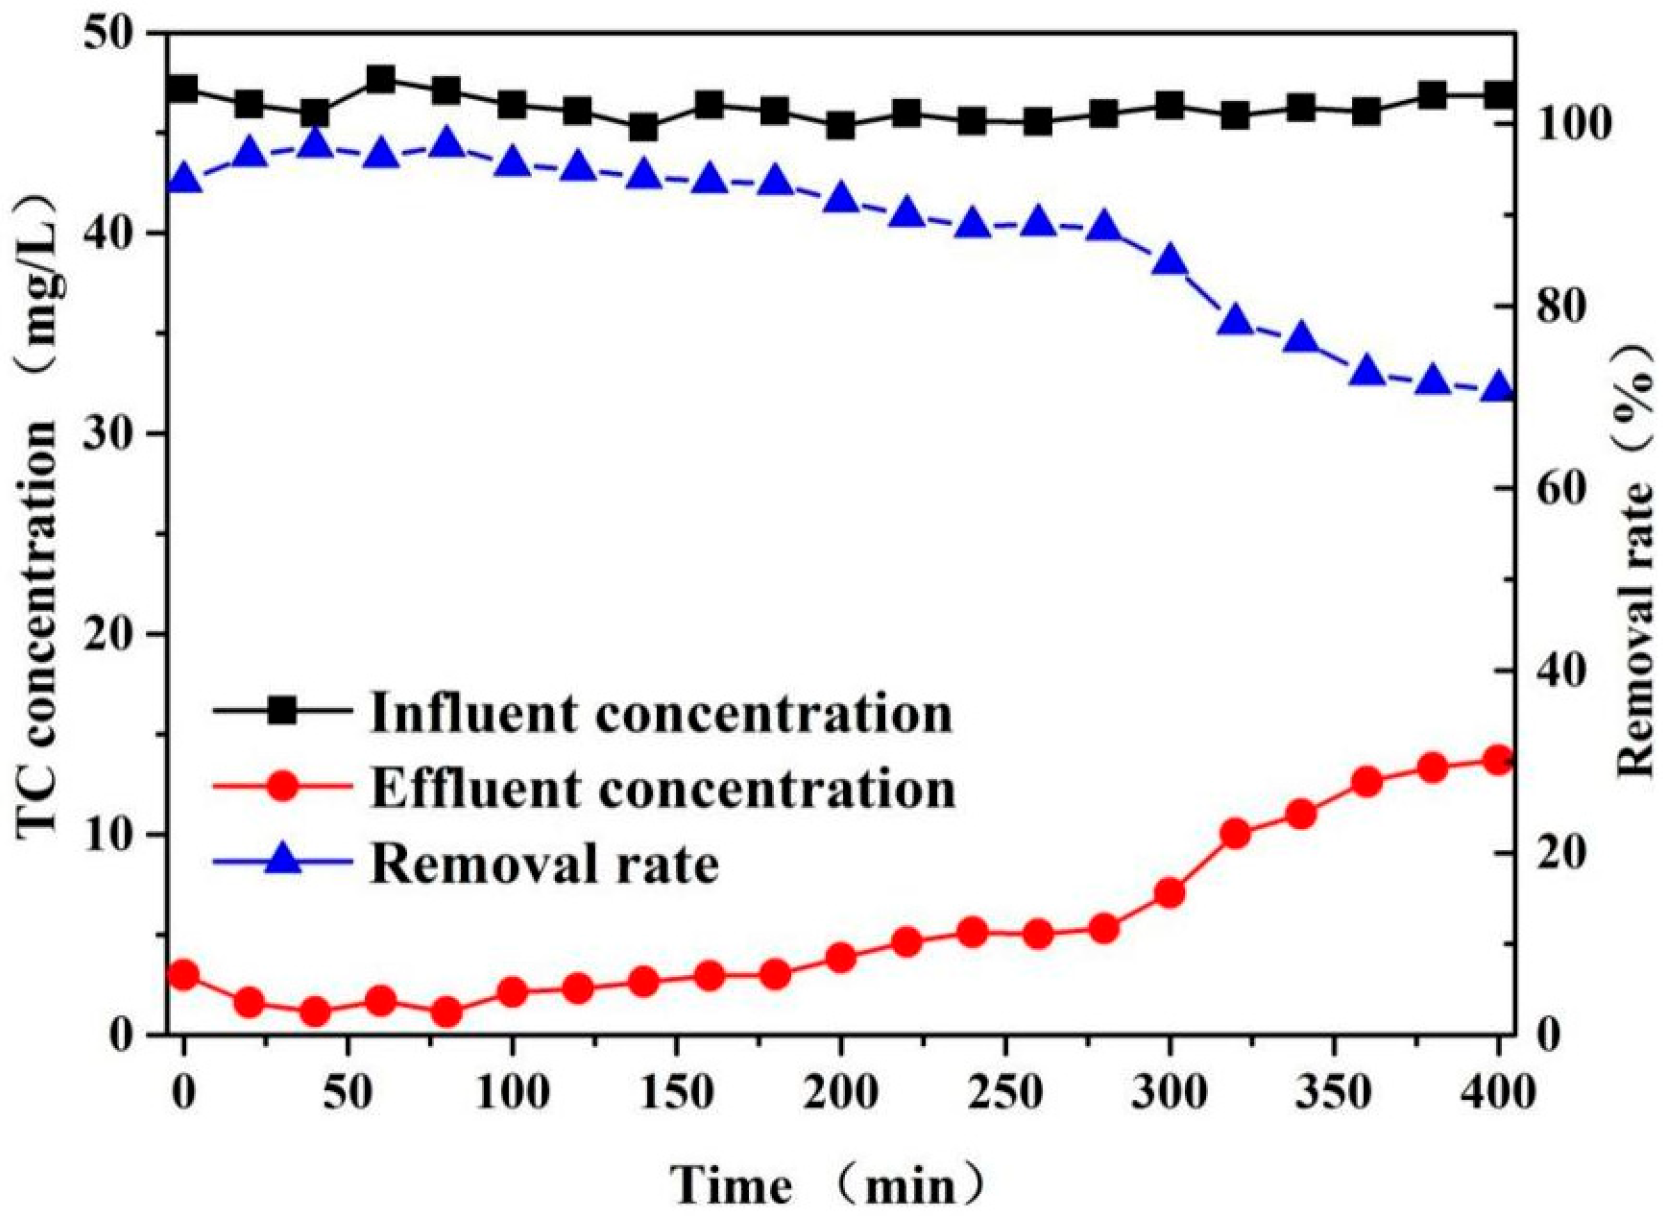
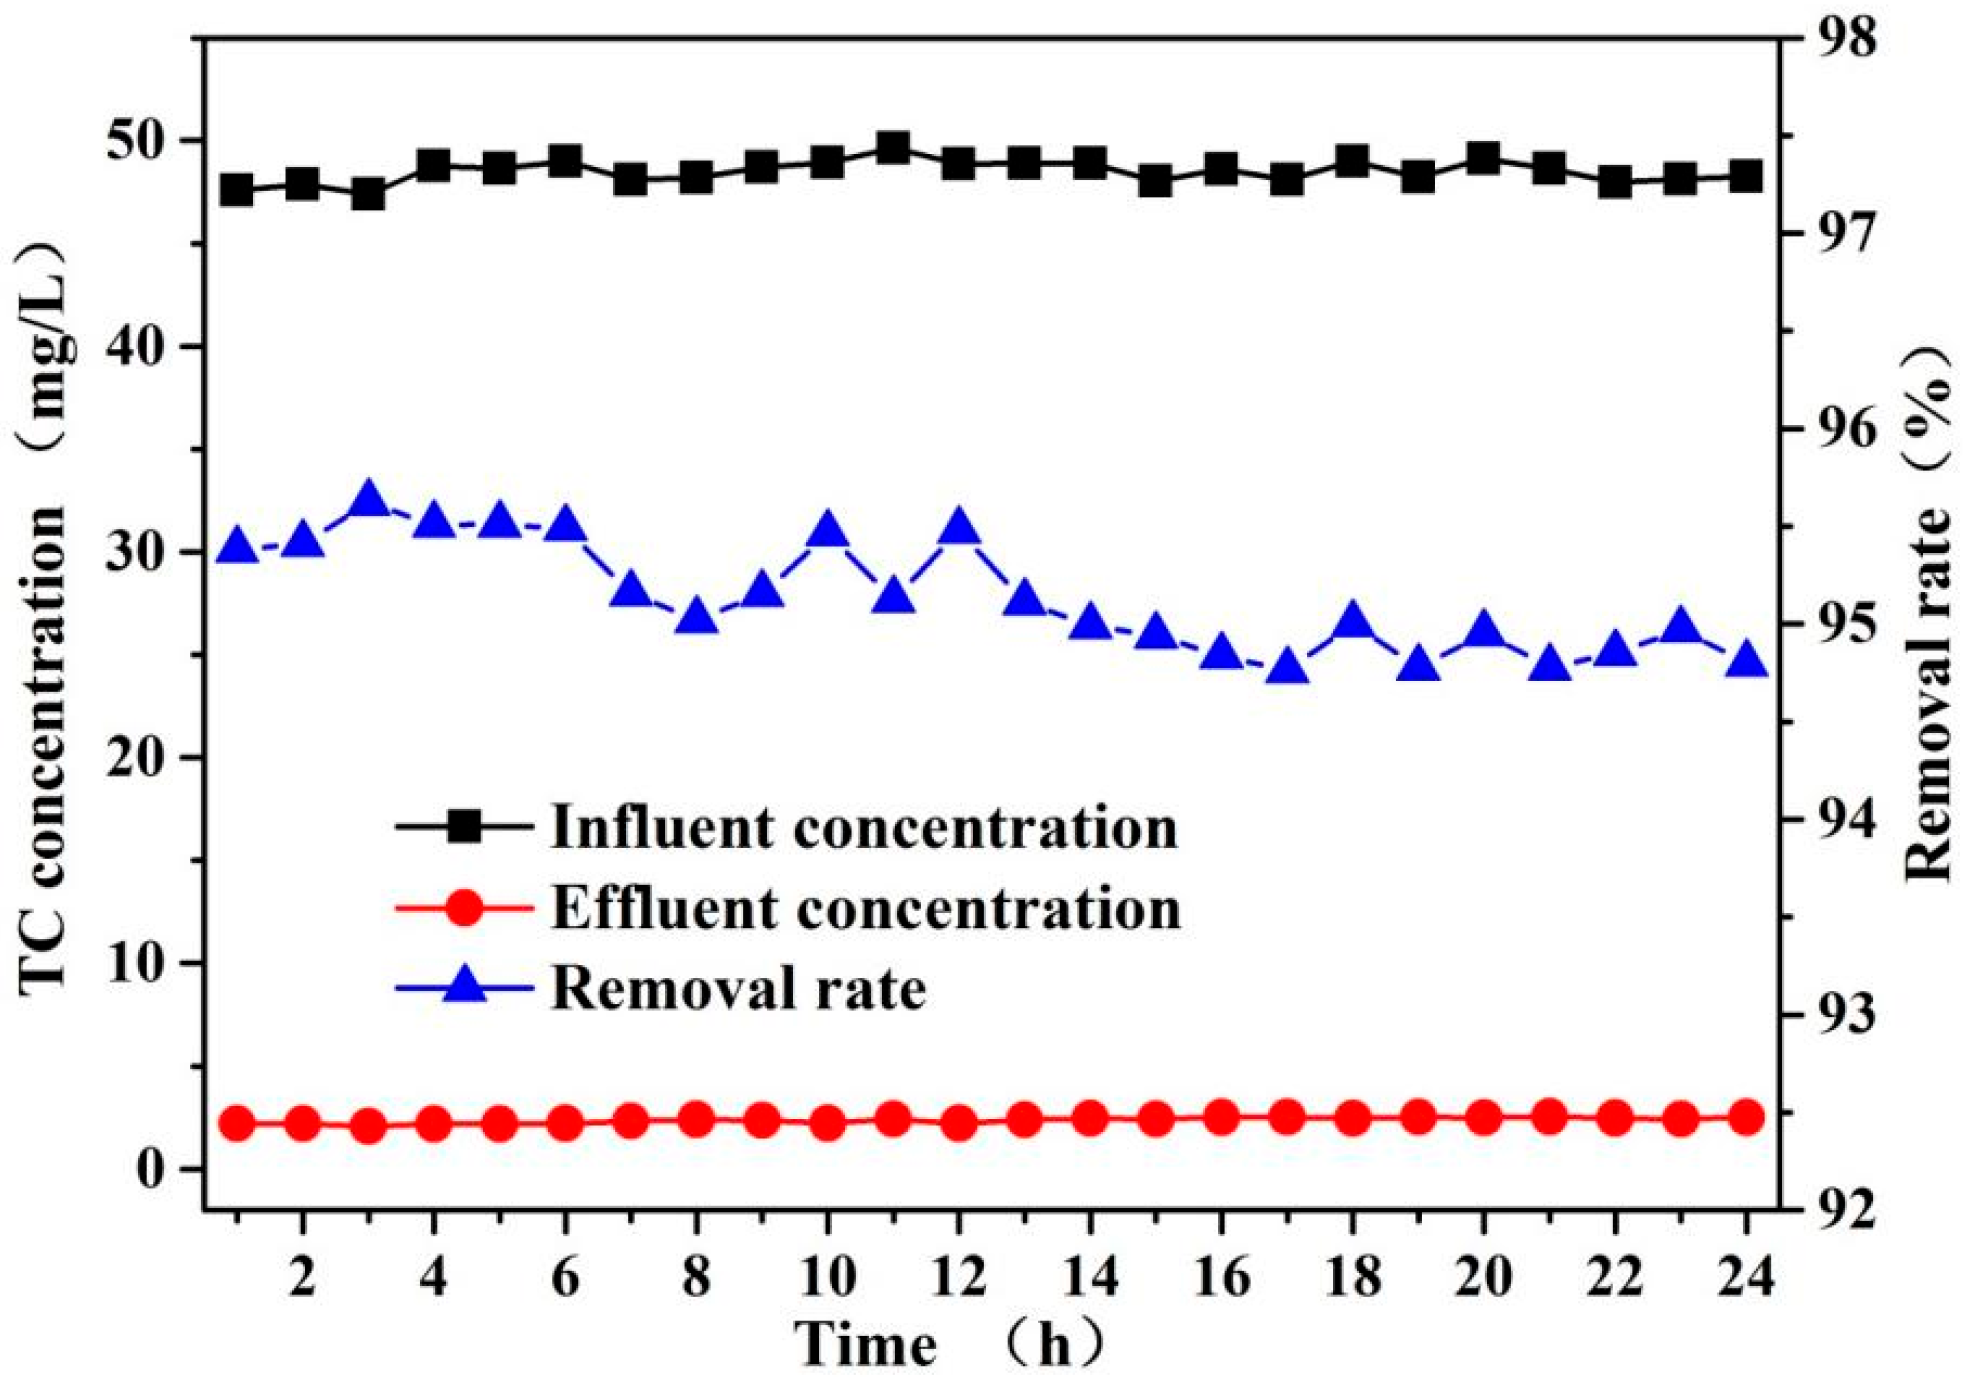
For practical industrial applications, the reactor should not only achieve a certain treatment efficiency but should also maintain an excellent stability. The stability of a reactor is one of the important indexes to evaluate its performance. The stability of the TCH degradation by the continuous operation of the reactor was investigated by means of monitoring the continuous inlet and outlet. As shown in Figure 10, the fixed-plate UV-Fenton reactor demonstrated excellent stability during continuous operation over 24 h. When the influent concentration was 50 mg/L, the effluent concentration remained below 2.5 mg/L. The removal rate of TCH decreased from 95.3% at the start of the reaction to 94.7%, a reduction in only 0.6%, indicating no significant change in degradation efficiency.

3.4. Mechanism of Catalysts System

3.4.1. Identification of Active Species

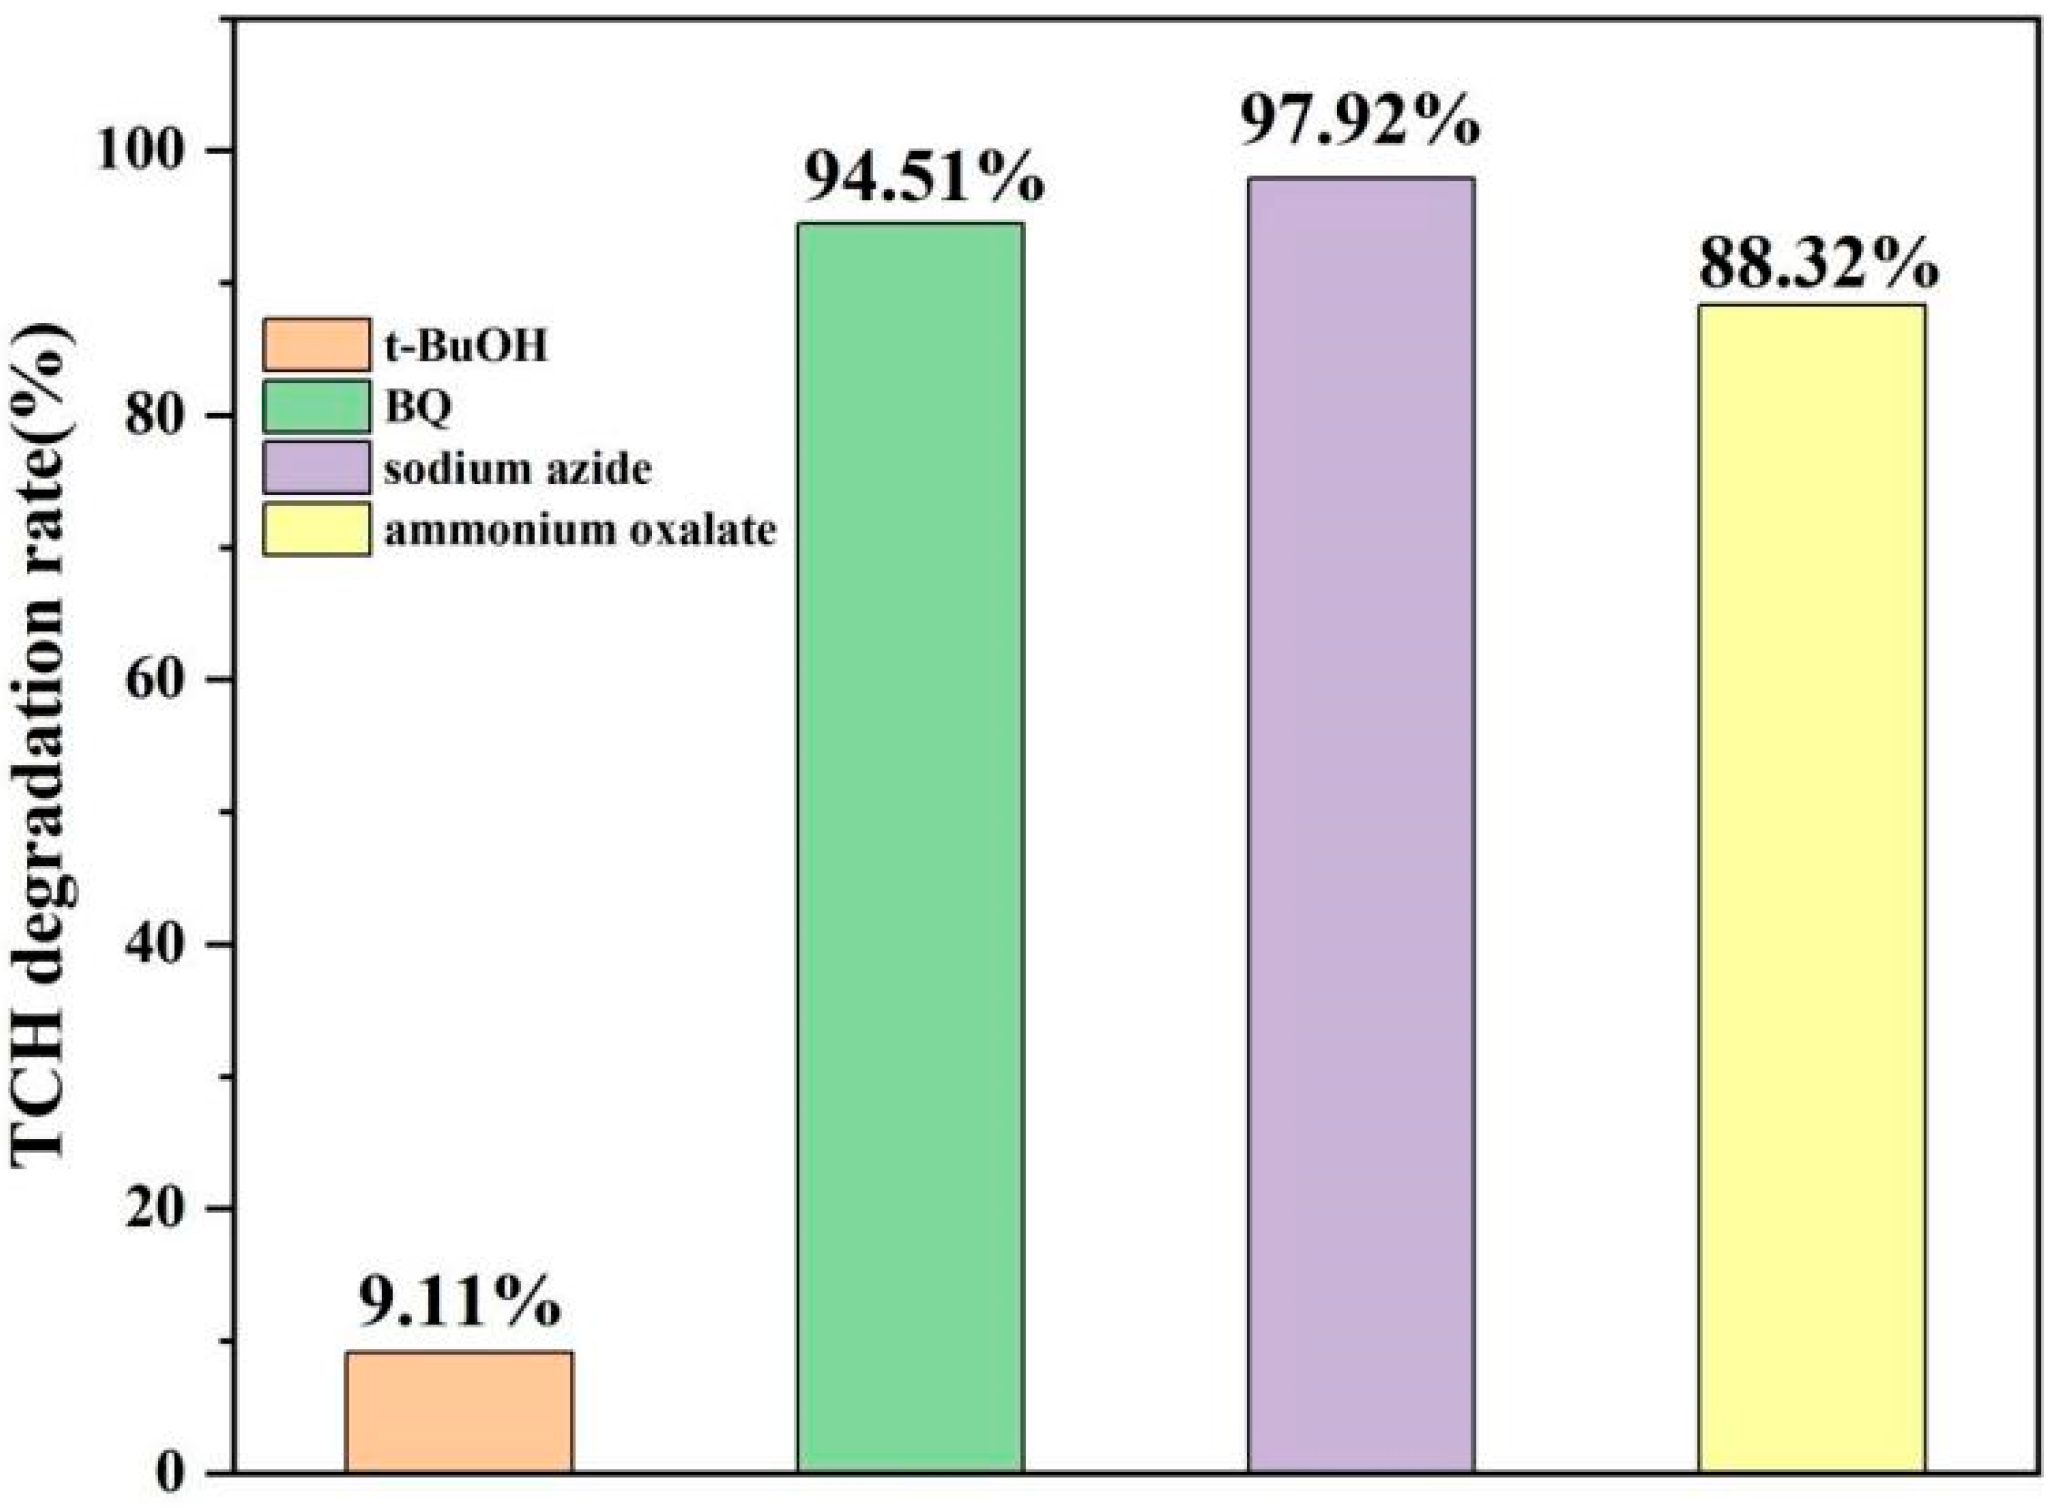
The trapping experiment was conducted under similar experimental conditions to investigate the free radicals that play a major role in the degradation of TCH. The scavengers (250 mmol/L) were added to the reaction system. The main oxidative species detected by the trapping experiments were singlet hydroxyl (•OH), oxygen (•O2), singlet oxygen (1O2) and h+ by using t-BuOH, p-benzoquinone (BQ), sodium azide, and ammonium oxalate [27,28,29].
The results of the active radical group inhibition experiment indicate that the main active substance involved in the degradation of TCH in Figure 11, •OH, plays a more significant role in this system. The TCH removal rate decreased to 9.11%, while the effect of h+ was slightly reduced compared to the system, and the TCH removal rate decreased to 88.32%. The reason might be that the content of TiO2 in the Fe3O4/TiO2@Al2SiO5 catalyst is relatively low, which leads to a relatively smaller number of h+ produced in the system. In contrast, the effects of •O2 and 1O2 can still be ignored. The main radical group in this system remains •OH.

3.4.2. Catalytic Mechanism

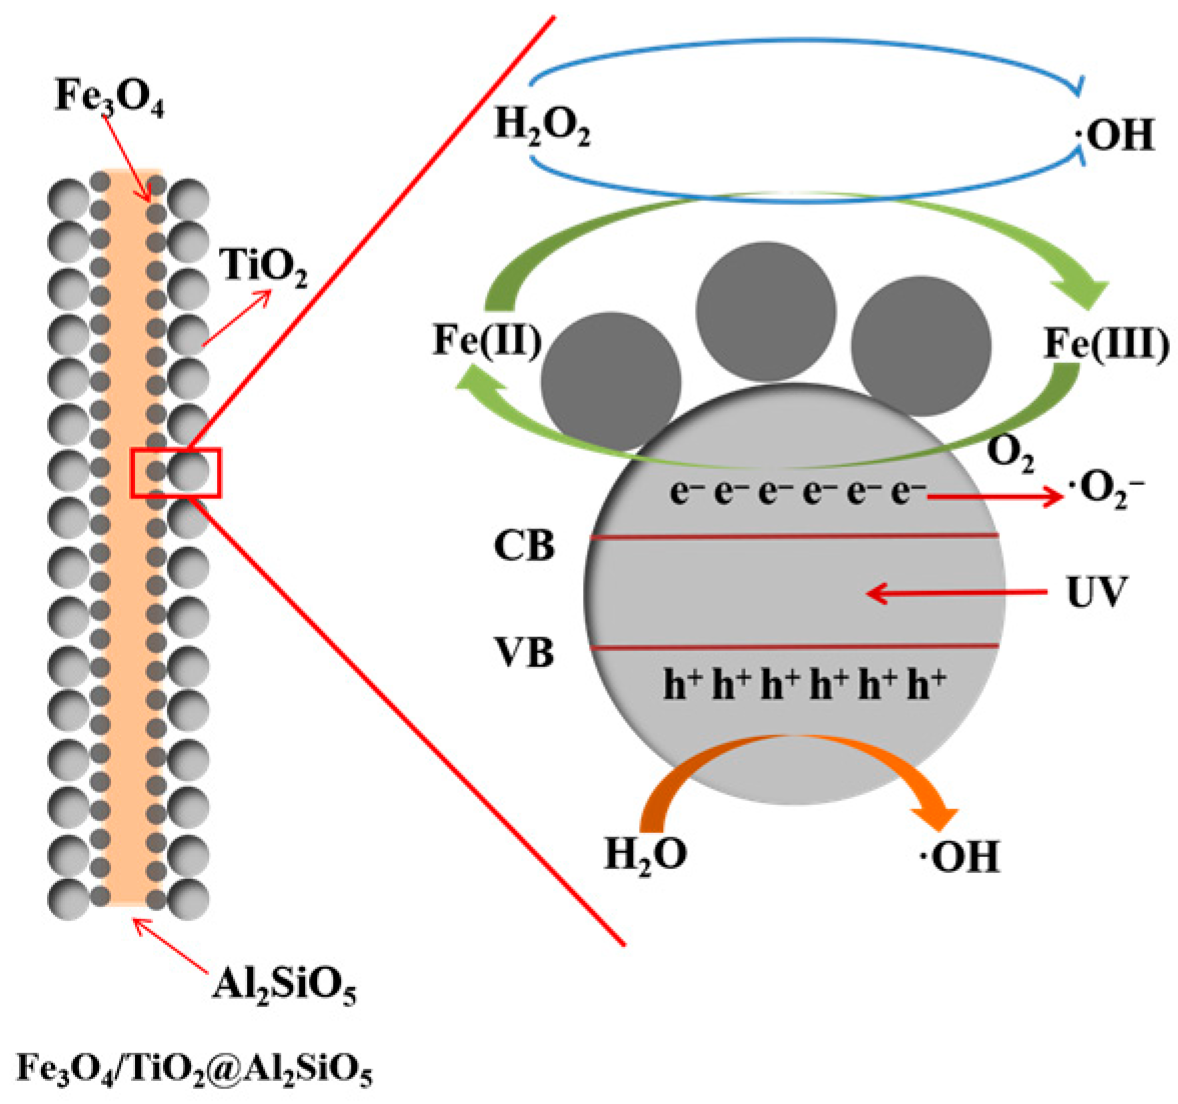
On the basis of the above-mentioned experimental results, we can draw a conclusion that the Fe3O4, TiO2 and Al2SiO5 fiberboard all play very important role in the UV-Fenton system for the degradation of TCH. Al2SiO5 fiberboard as a carrier enhances the dispersion and stability of the Fe3O4/TiO2 catalyst. The specific reaction process can be seen in Equations (3)–(9), and the reaction mechanism is shown in Figure 12. TiO2 possesses semiconductor conductivity and generates h+ and e- under light exposure (Equation (3)). The free oxygen atoms in water combine with e to form •O2 (Equation (4)). H2O reacts with h+ to form •OH (Equation (5)). Under the action of H2O2, Fe(II) is transformed into Fe(III) and •OH (Equation (6)). Excellent charge separation prolongs the lifetime of e-, enabling the reduction in Fe(III) to Fe(II) (Equation (2)). Furthermore, Fe(III) generated within the UV-Fenton system acts as an electron donor, accelerating the conversion of Fe(III) to Fe(II). This enhances the oxidative capacity of the Fenton reaction while simultaneously inhibiting electron-hole pair recombination, thereby promoting the generation of additional free radicals within the system. The enhanced efficiency of the Fe(III)/Fe(II) cycling reaction on the catalyst surface is crucial for achieving efficient TCH degradation (Equation (9)). The possible reaction mechanism is shown in Figure 12.
TiO2 + hν → h+ + e
O2 + e → •O2
H2O + h+ → •OH
Fe(II) + H2O2 → Fe(III) + •OH + OH
•OH + Fe(II) → Fe(III) + OH
Fe(III) + H2O2 → Fe(II) + H+
TCH + •OH → degradation products

3.5. Degradation Pathways

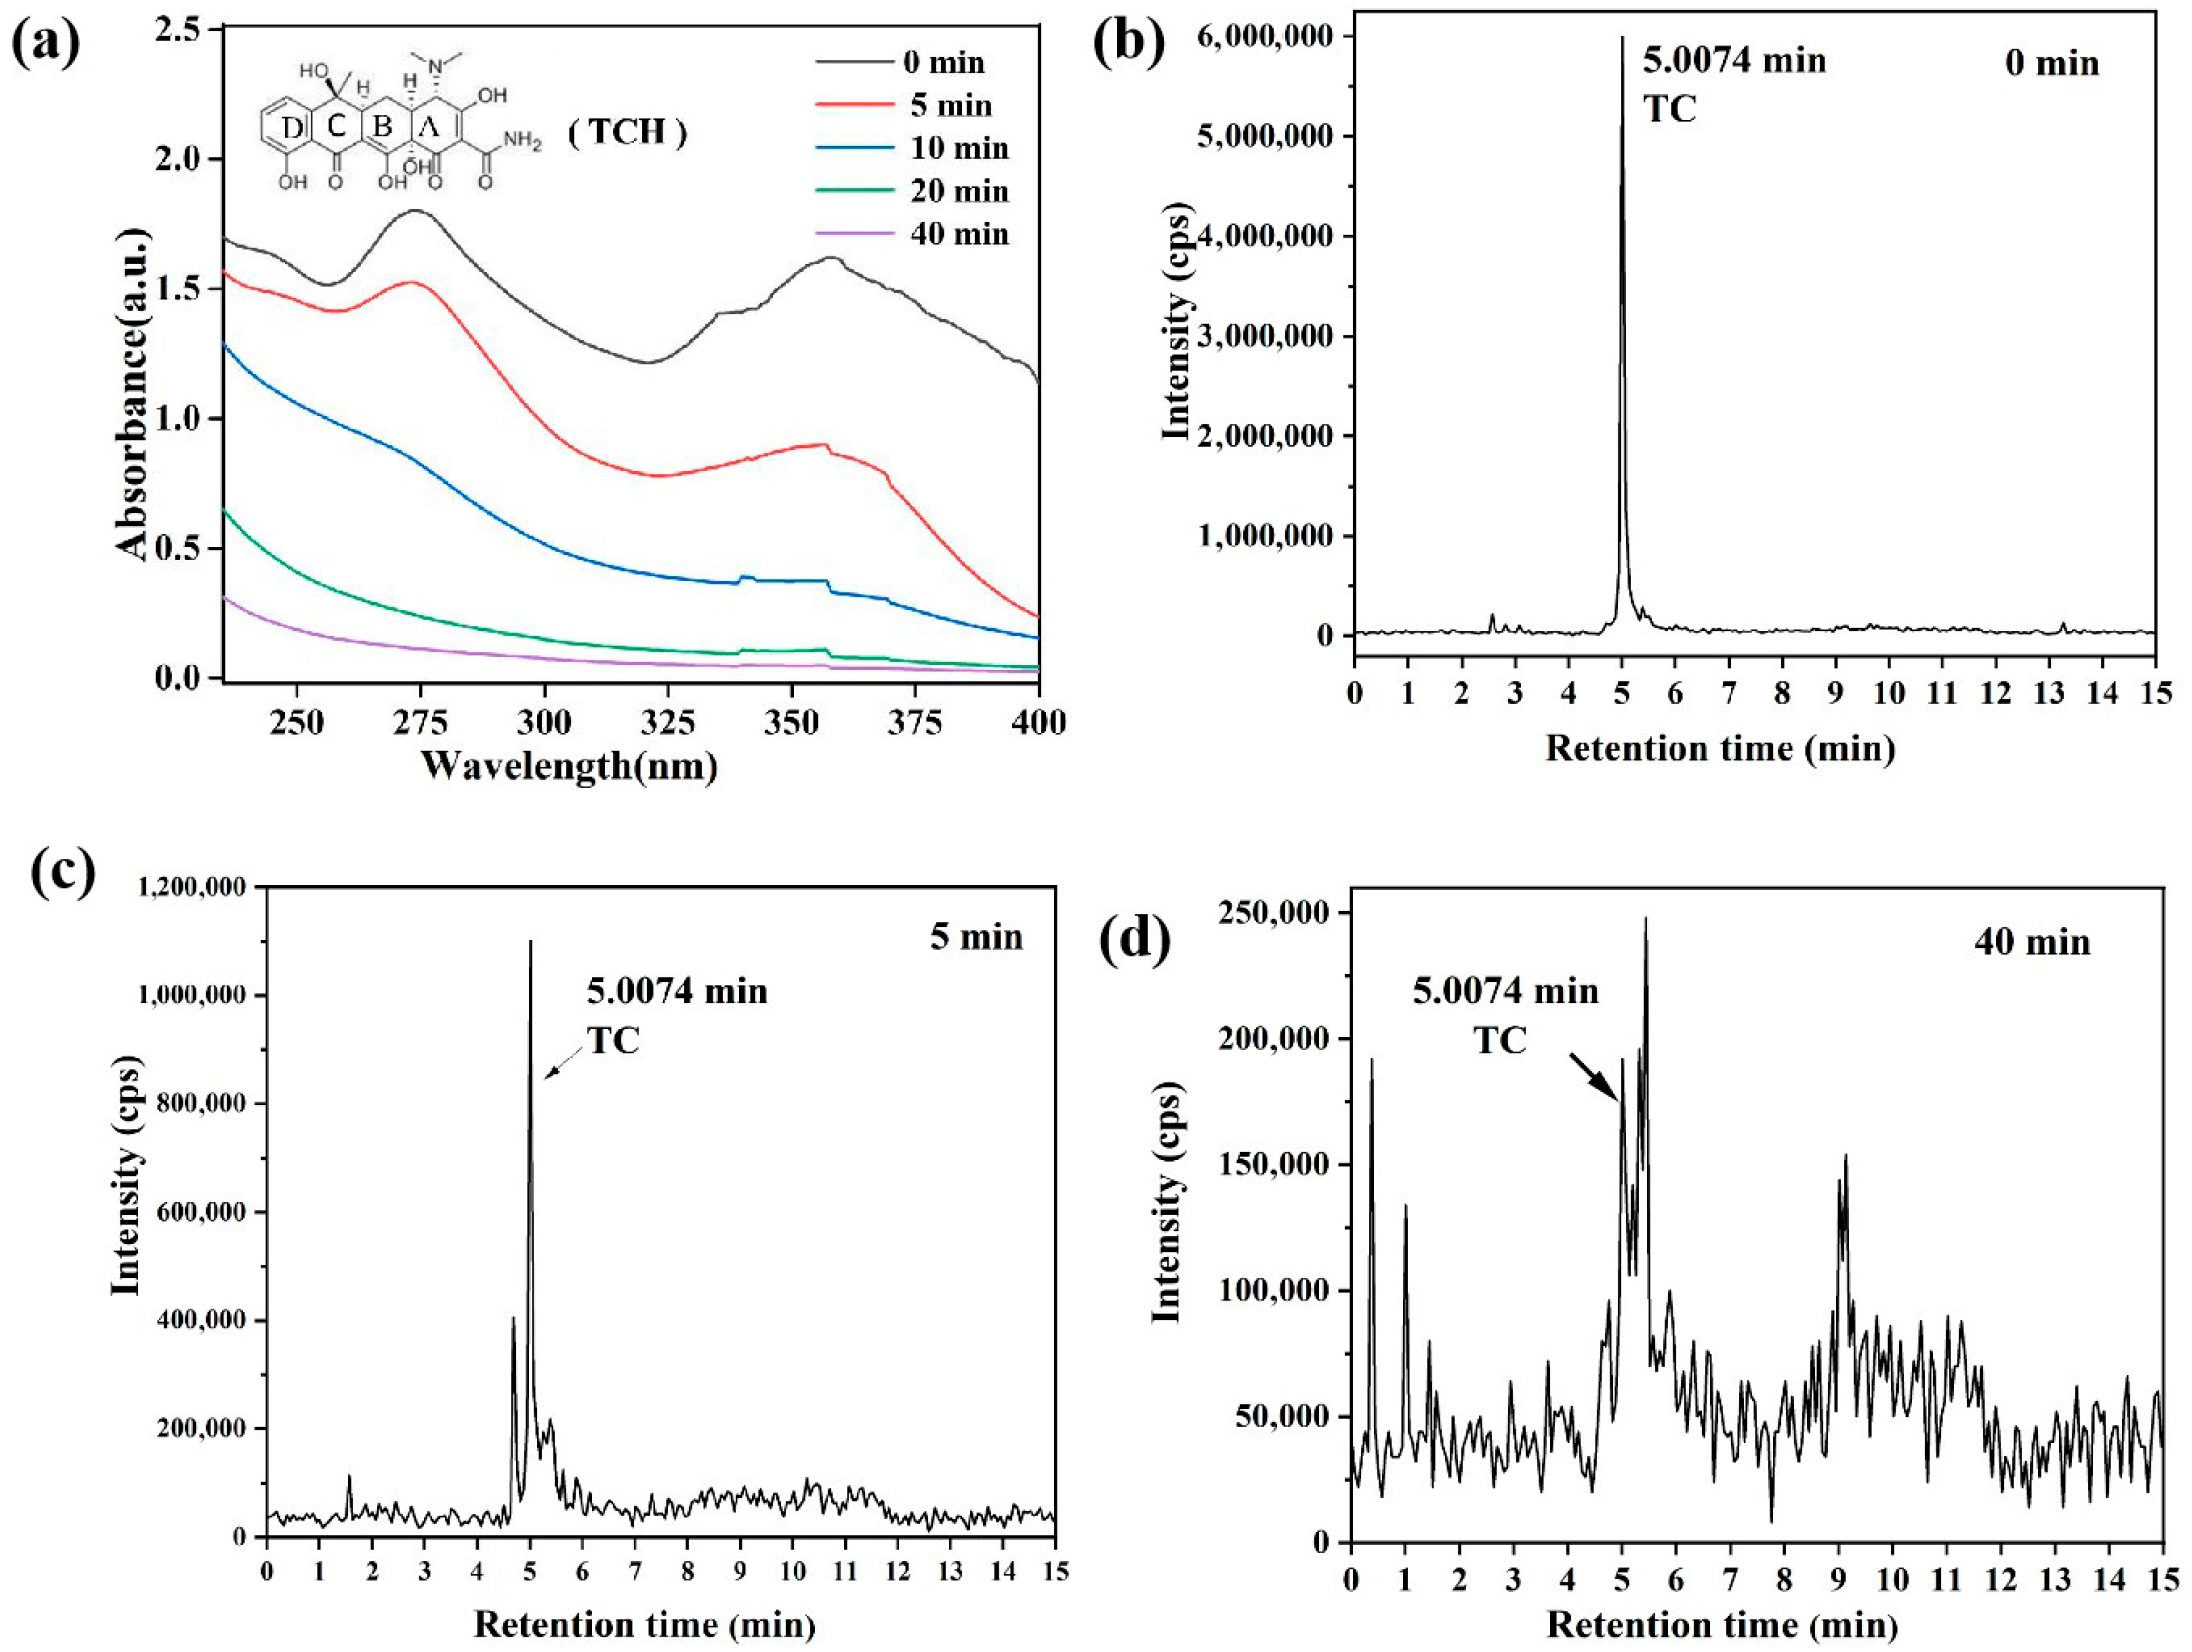
The color of TCH is determined by its chromophore, which consists of a large π-conjugated system formed by aromatic rings B, C, and D, along with their connected phenolic hydroxyl and ketone carbonyl groups (as shown in Figure 13) [30]. Due to the delocalization of electrons in the conjugated system, it can absorb light with longer wavelengths. When the wavelength of absorbed light shifts into the visible region (357 nm), the substance exhibits color. Figure 13a shows the UV-vis full-scan spectrum of UV-Fenton degradation of TCH hydrochloride catalyzed by Fe3O4/TiO2@Al2SiO5.
As shown in Figure 13a, prior to the catalytic reaction (0 min), tetracycline hydrochloride exhibits two distinct absorption peaks. The peak at approximately 275 nm corresponds to aromatic ring A and its associated amide and hydroxyl groups (as illustrated in Figure 13). The peak at 357 nm originates from aromatic rings B, C, D, and the extended chromophore group. As the reaction progressed, the intensities of both peaks decreased to near zero over time, indicating a gradual reduction in TCH concentration and further confirming the disruption of its conjugated structure under the UV-Fenton system. The attenuation of absorbance at 275 nm likely resulted from the destruction of the phenolic hydroxyl and amide groups within aromatic ring A of TCH and its degradation intermediates. The decay of the 357 nm visible band during the reaction resulted from the ring-opening of aromatic ring D and the subsequent disruption of its conjugated structure. Furthermore, the figure indicates that the absorption peak at 357 nm decayed faster than that at 275 nm, suggesting that aromatic rings B, C, and D, along with the extended chromophore group in the TCH molecule, were preferentially destroyed.
Figure 13b shows the chromatogram at 0 min, revealing a characteristic peak for TCH at a retention time of 5.0074 min. As the reaction progressed to 5 min in Figure 13c, the peak intensity of TCH noticeably diminished, though the peak shape remained well-defined. This indicates that a portion of TCH had been gradually degraded. Concurrently, a series of new peaks emerged, signifying the formation of new degradation products. As the reaction continued to 40 min in Figure 13d, the intensity of the TCH peak became markedly weaker than that of its reaction byproducts, confirming that TCH had been almost completely degraded.
To further understand the degradation pathway of TCH, HPLC-MS/MS and GC-MS were used to analyze the intermediate products of tetracycline in the UV-Fenton reaction system catalyzed by Fe3O4/TiO2@Al2SiO5. The results are shown in Table 2.
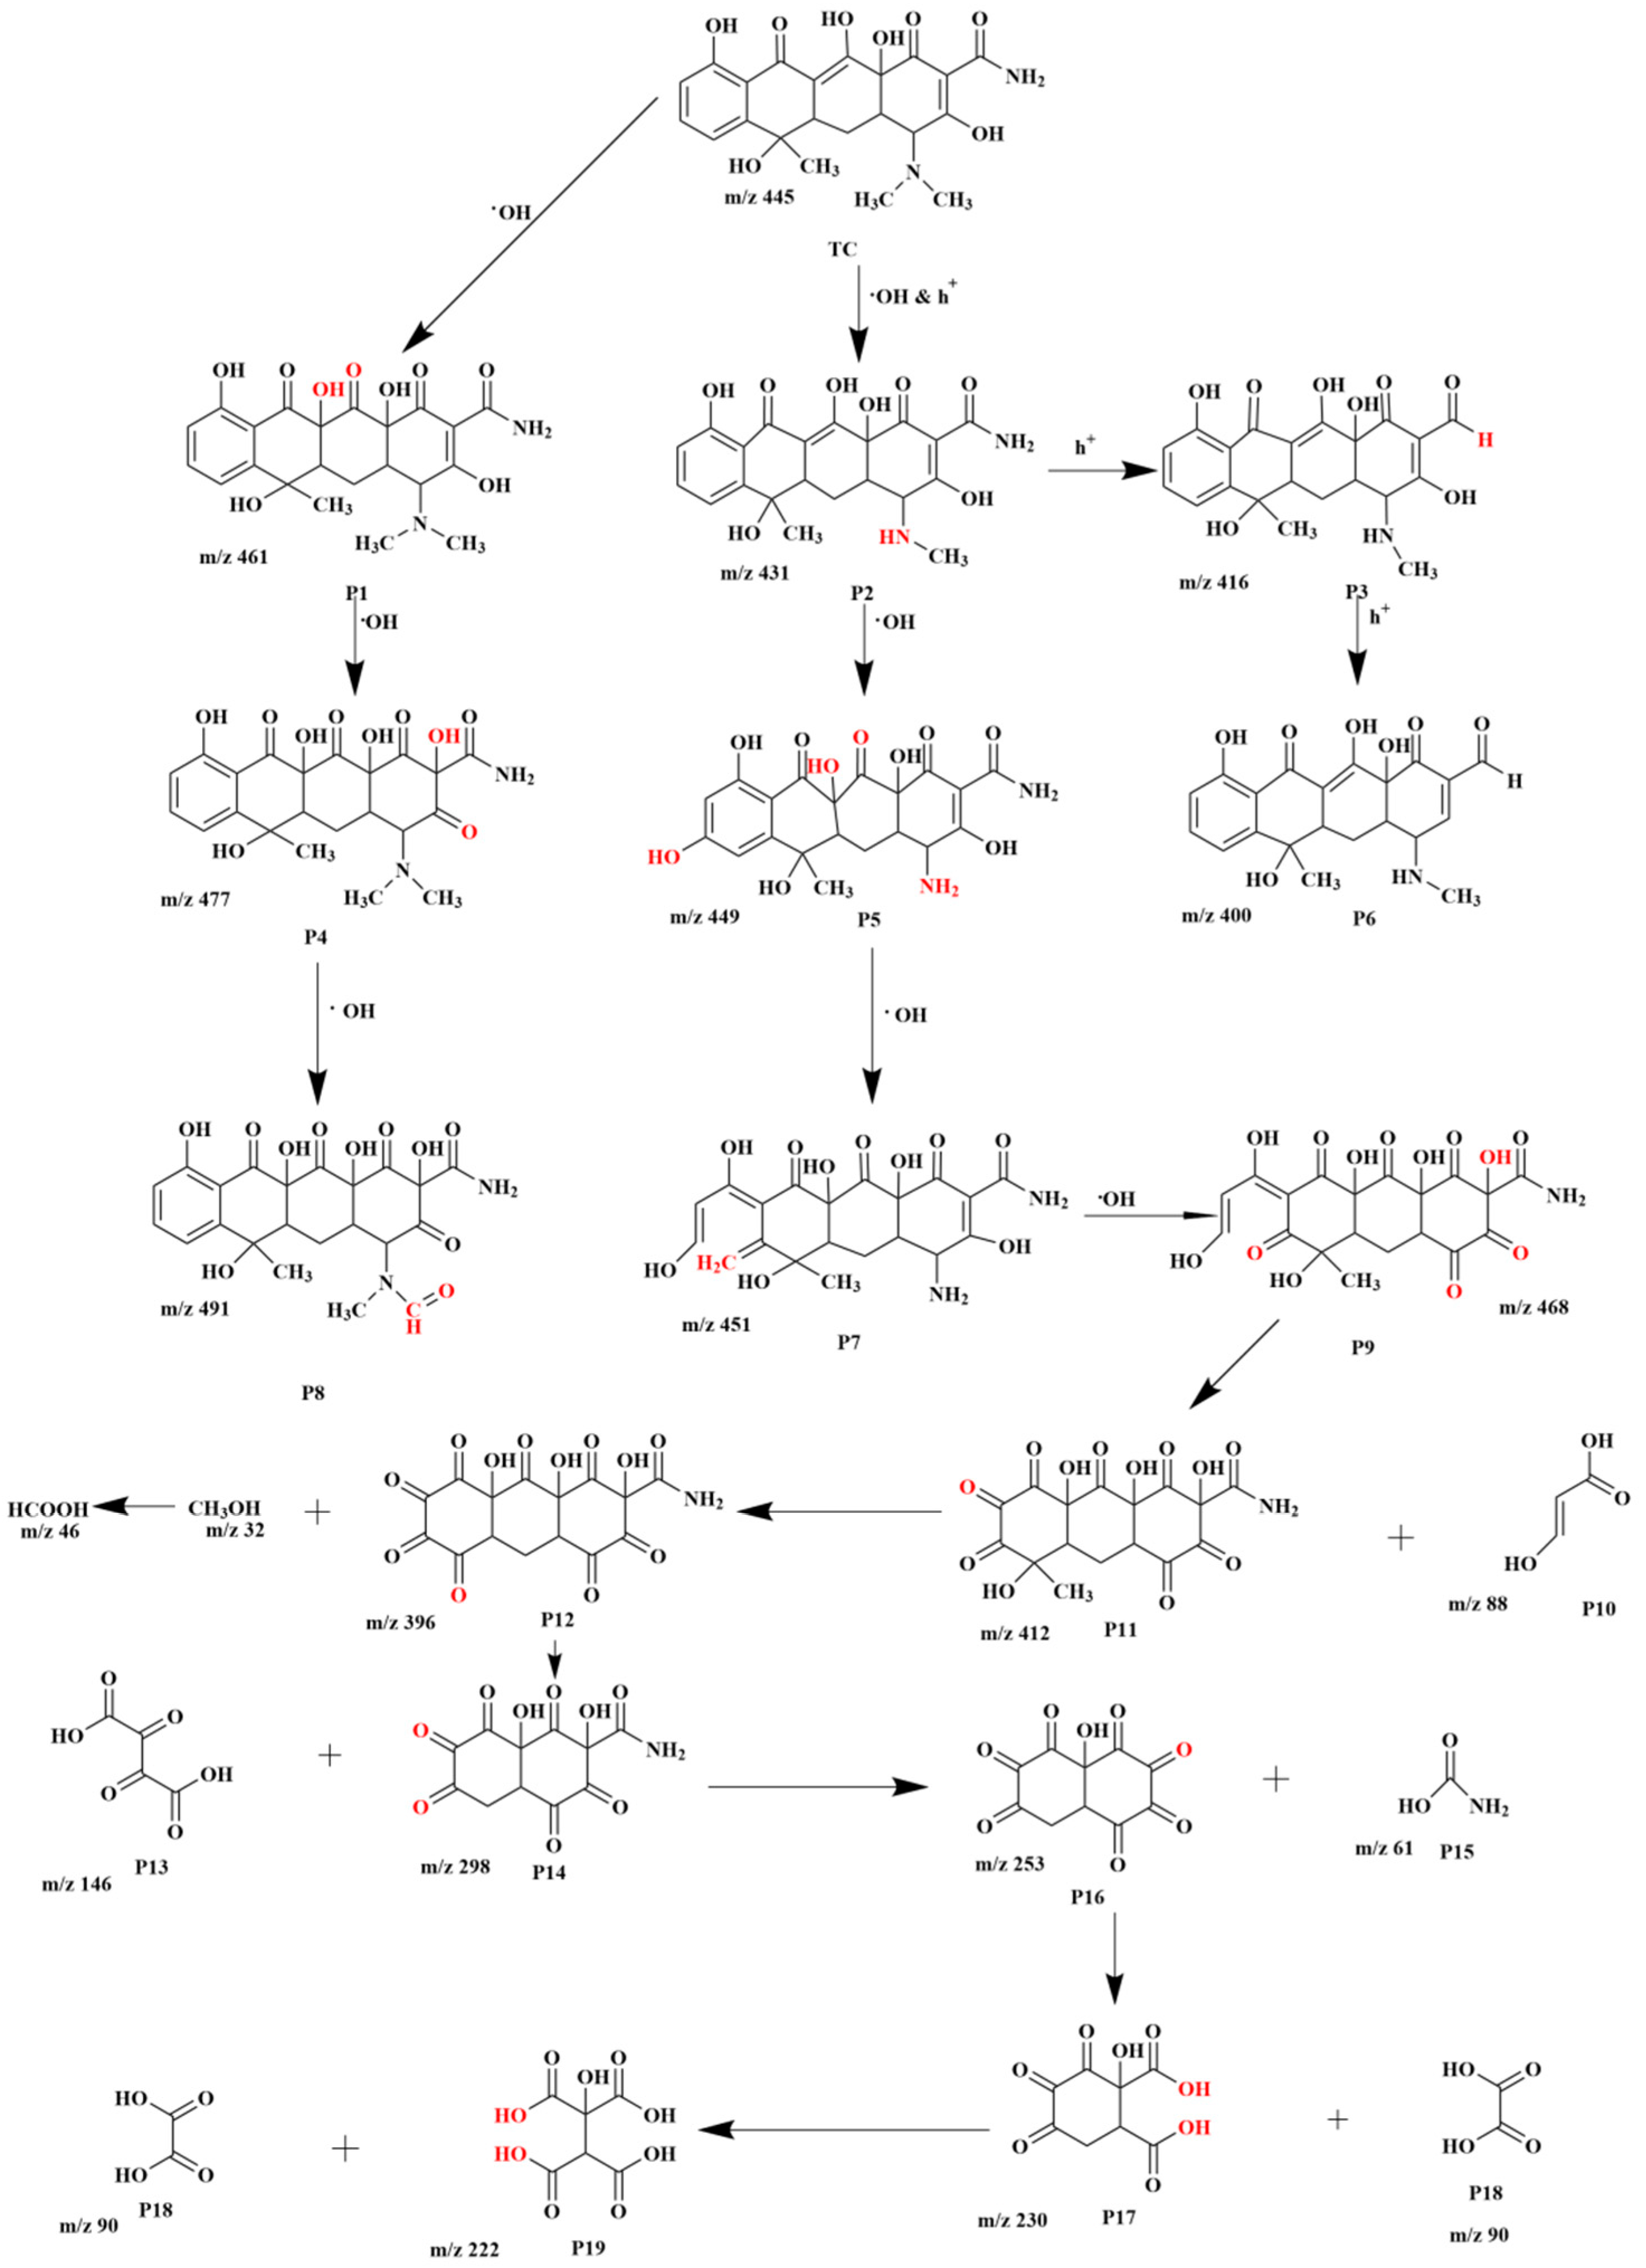
From the results in Table 2, it can be seen that the UV-Fenton system catalyzed by TiO2/Fe3O4@Al2SiO5 produced a total of 19 intermediate products. Based on the detected intermediate products, the degradation pathway of TCH was briefly analyzed, and the results are shown in Figure 14. It can be seen that one of the degradation pathways of TCH is the hydroxylation reaction of tetracycline by •OH [31], generating polar molecules with larger m/z ratios than the tetracycline parent, such as intermediate products with m/z 461 and 477. The product with m/z 461 is presumably formed by the addition of the C11a-C12 double bond of the tetracycline molecule followed by the rearrangement of the hydroxyl group at C12 into a carbonyl group. The product with m/z 477 is produced by the further addition of •OH at the C-2 position. On this basis, •OH further attacks one methyl group of the amino group, leading to the formation of a compound with m/z 491. Another degradation pathway of TCH involves the demethylation by •OH and h+, which attacks the N-C bond with lower bond energy, resulting in the destruction of the N-methyl group of TCH and the generation of a substance with m/z 431 [32]. On one hand, the amino group in the amide group of the polar molecule with m/z 431 is destroyed to form an intermediate with m/z 416, and the further destruction of the hydroxyl group produces a product with m/z 400. On the other hand, demethylation and hydroxylation occur to generate a degradation product with m/z 449. The aromatic ring D of this substance opens, forming a product with m/z 451. Subsequently, product 6 (m/z 451) undergoes demethylation, deamination, and hydroxylation to form product 9 (m/z 468). The double bond at the C10-10a position of product 9 is easily attacked by •OH. When the C10-10a double bond is attacked by •OH, product 11 (m/z 412) and product 10 (3-hydroxyacrylic acid, m/z 88) are generated. The C6 position of product 11 is attacked by •OH, producing product 12 (m/z = 396) and methanol (m/z = 32). Methanol can be further oxidized to formic acid (m/z = 46). The C5a and C11a positions of product 12 are attacked by •OH, generating product 14 (m/z = 298) and 2,3-dioxosuccinic acid (product 13, m/z = 146). •OH further attacks product 14, oxidizing it to product 16 (m/z = 253) and carbamic acid (product 15, m/z = 61), which is caused by the free radical attacking the C2 position. Product 16 is attacked by •OH at the C1-C2 and C3-C4 positions, forming 1-hydroxy-4,5,6-trioxocyclohexane-1,2-dicarboxylic acid (product 17, m/z = 230) and oxalic acid (product 18, m/z = 90). The former can be oxidized at the C5-C5a and C11a-C12 positions to generate 1-hydroxyethane-1,1,2,2-tetracarboxylic acid (product 19, m/z = 222) and oxalic acid (product 18, m/z = 90). These degradation products are ultimately converted into small-molecule organic compounds, NH4+, CO2, and H2O.

3.6. Toxicity Evaluation

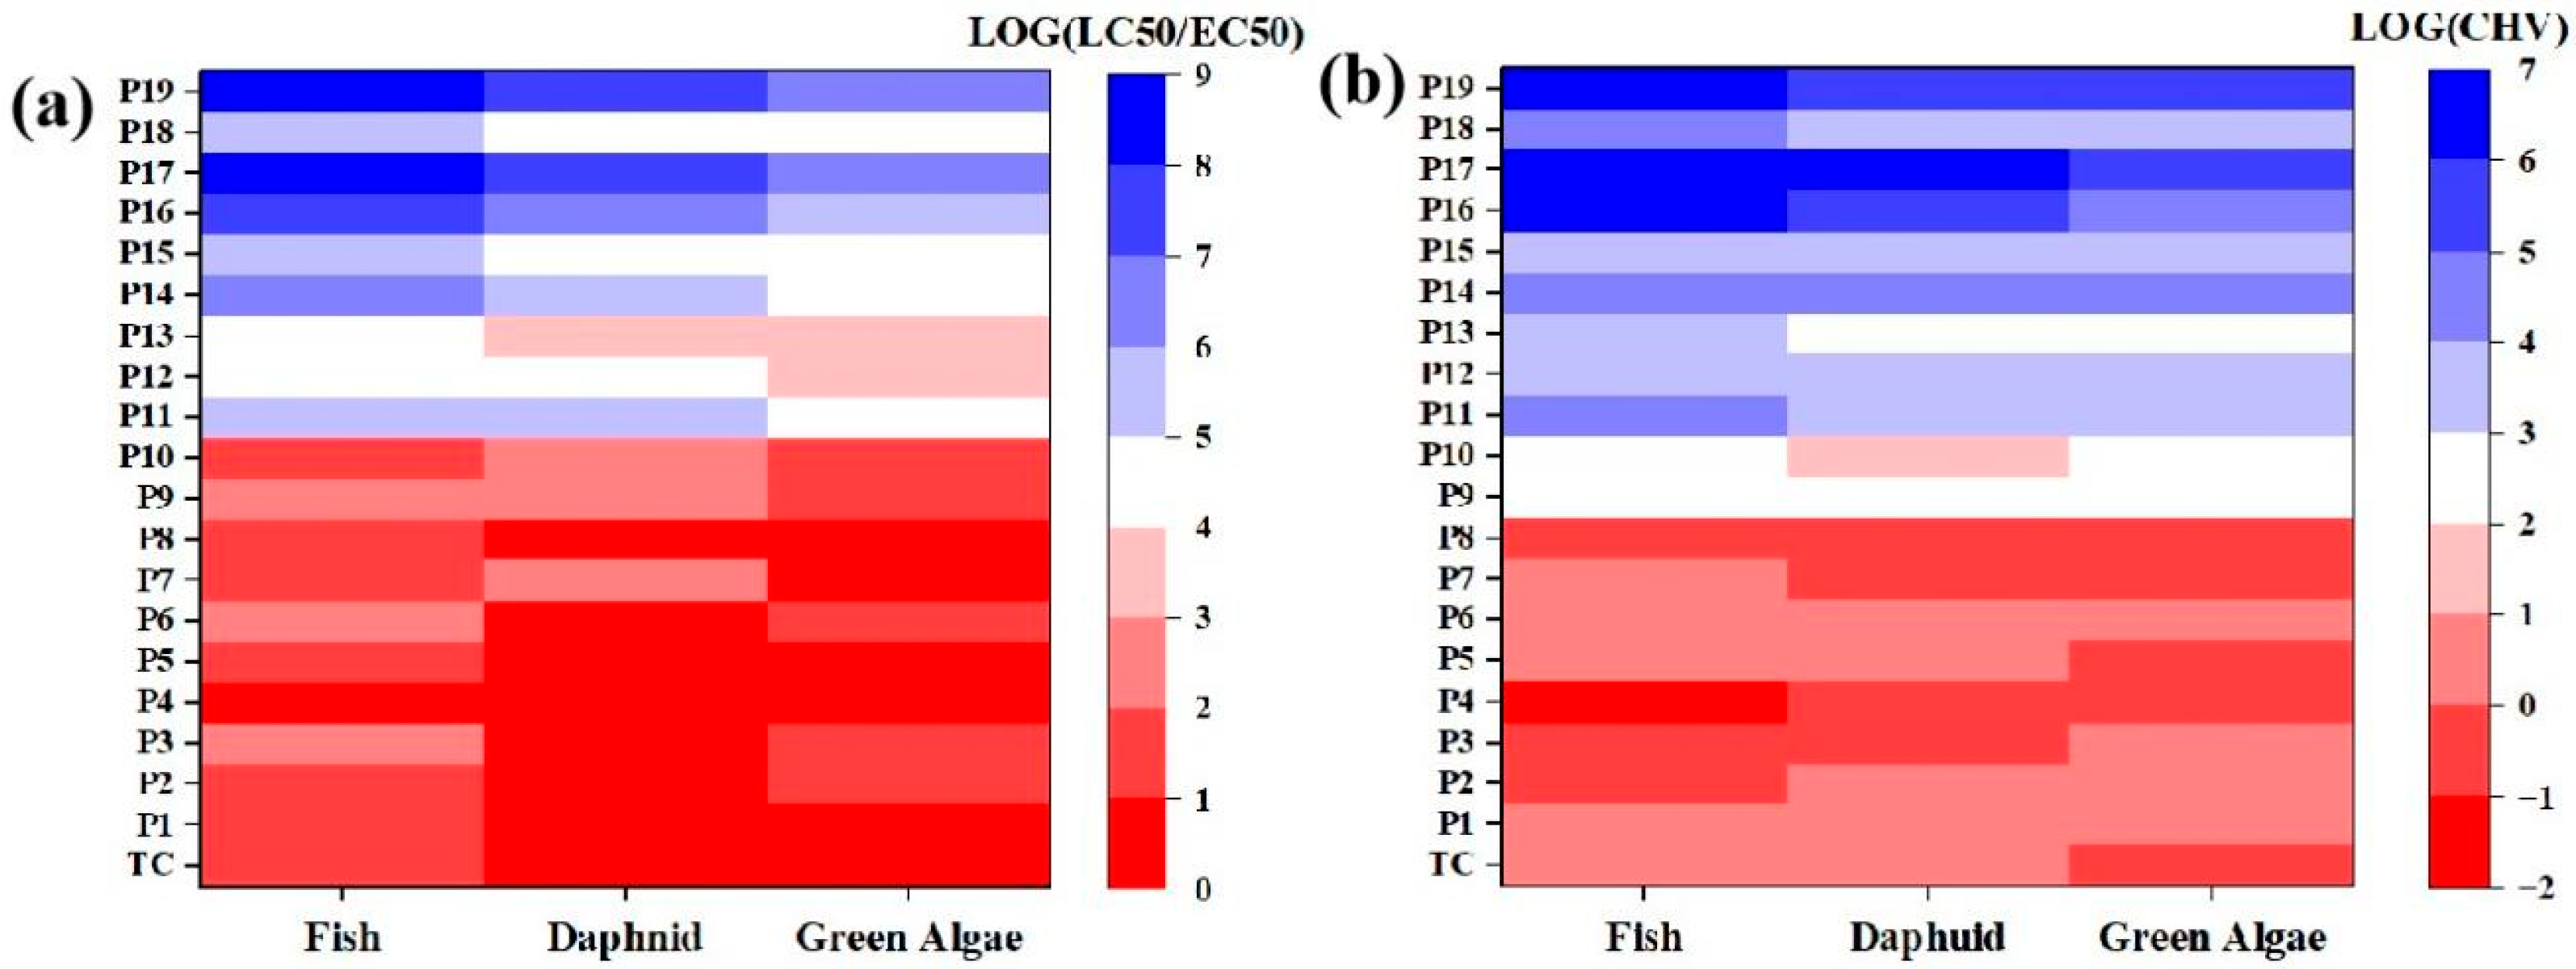
TCH and its degradation intermediates generated during the reaction exert certain hazards and impacts on the survival and growth of aquatic animals, aquatic plants, and algae. Therefore, this study predicted the toxicity of TCH degradation intermediates using the ECOSAR program [32]. The prediction results from ECOSAR indicated that algae, fish, and green algae exhibit differences in sensitivity to TCH and its degradation intermediates, with algae showing the most significant sensitivity [33]. Acute toxicity data, as presented in the heat map of Figure 15, revealed that P1 to P10 have high toxicity to fish; P1 to P6 and P8 display extremely high toxicity to daphnids, while the remaining intermediates have low toxicity to daphnids. For green algae, P1 to P10 possess high toxicity, and the toxicity of subsequent degradation intermediates decreases. Chronic toxicity data, as observed in Figure 15, showed that all intermediates except P9, P11, P12, P13, P14, P15, P16, P17, P18, and P19 exert extremely high toxicity to daphnids. All intermediates except P9 to P19 demonstrate extremely high toxicity to fish. Regarding algae, P1 to P8 have extremely high toxicity, while the remaining chemicals are only slightly hazardous or harmless. The above analysis results indicated that the toxicity of intermediates undergoes significant changes during TCH degradation, with the product toxicity gradually decreasing.

4. Conclusions

In this study, a new type of plate fixed-bed UV-Fenton reactor is developed and designed for prospective practical application of UV-Fenton system in antibiotic TCH wastewater. Using Al2SiO5 fiberboard as carrier, successful preparation of supported catalytic TiO2/Fe3O4@Al2SiO5. The supported catalysts on fiberboard were mainly amorphous phase and the TiO2/Fe3O4 was successfully loaded on Al2SiO5 fiberboard. The initial pH and H2O2 dosage had significant effect on the operation of reactor, followed by the hydraulic retention time, and the UV intensity. The optimum reaction conditions are influent concentration of TCH is 50 mg/L, the hydraulic retention time is 120 min, the initial pH is 4.5, the dosage of H2O2 is 10 mmol/L, and the UV light intensity is 2.36 kW/m3. The removal rate of TCH subsequently achieved more than 90%. A proposed TCH degradation pathway was given according to the by-products detected by HPLC-MS/MS and GC-MS. The primary degradation pathways for TCH involve addition and substitution reactions with organic compounds through hydroxylation by •OH radicals, as well as demethylation by •OH and h+, leading to the detachment of certain functional groups (such as amino, methyl, and carboxyl groups) from the TCH. Additionally, HPLC/MS-MS and GC-MS analysis identified several lower m/z products, indicating that prolonged degradation can achieve complete mineralization of TCH.

Author Contributions

Conceptualization, X.Y.; methodology, Y.C.; data curation, Q.J.; writing—original draft preparation, X.Y.; writing—review and editing, X.Y.; funding acquisition, X.Y. All authors have read and agreed to the published version of the manuscript.

Funding

This research was funded by the Jilin Provincial Department of Science and Technology of China, grant number No. YDZJ202201ZYTS630.

Data Availability Statement

The original contributions presented in this study are included in the article. Further inquiries can be directed to the corresponding author.

Conflicts of Interest

The authors declare no conflicts of interest.

References

  1. Jiang, M.; Wang, X.; Han, R.; Ning, P.; Lynch, I.; Ma, J. Establishing photocatalysis-self-Fenton system over a S-scheme Fe/Fe2O3@CuBi2O4 for enhancing TC removal via in-situ generating H2O2 and Fe/Cu dual-metal electron cycle: Radical and non-radical pathways. Sep. Purif. Technol. 2025, 354, 128675. [Google Scholar] [CrossRef] [Scilit]
  2. Shen, C.; He, M.; Zhang, J.; Liu, J.; Su, J.; Dai, J. Effects of the coexistence of antibiotics and heavy metals on the fate of antibiotic resistance genes in chicken manure and surrounding soils. Ecotoxicol. Environ. Saf. 2023, 263, 115367. [Google Scholar] [CrossRef] [Scilit] [PubMed]
  3. Cevallos-Mendoza, J.E.; Cedeño-Muñoz, J.S.; Navia-Mendoza, J.M.; Figueira, F.; Amorim, C.G.; Rodríguez-Díaz, J.M.; Montenegro, M.C.B.S.M. Development of hybrid MIL-53(Al)@CBS for ternary adsorption of tetracyclines antibiotics in water: Physical interpretation of the adsorption mechanism. Bioresour. Technol. 2024, 396, 130453. [Google Scholar] [CrossRef] [Scilit]
  4. Li, S.; Peng, L.; Yang, C.; Song, S.; Xu, Y. Cometabolic biodegradation of antibiotics by ammonia oxidizing microorganisms during wastewater treatment processes. J. Environ. Manag. 2022, 305, 114336. [Google Scholar] [CrossRef] [Scilit]
  5. Dehghani, M.H.; Nabizadeh, R.; Ramezanian, N.; Alimohammadi, M.; Najafpoor, A.A.; Ahmadi Nasab, M.; Dehghan, A. Solar photocatalytic removal of tetracycline using bismuth oxyiodide: Intermediates identification, toxicity assessment and effect of solution matrix. Results Eng. 2025, 25, 103796. [Google Scholar] [CrossRef] [Scilit]
  6. Liang, S.; Zhang, H.; Dai, H.; Wan, X.; Zhu, F.; Xu, Q.; Ji, W. Efficient, rapid and simple adsorption method by polydopamine polystyrene nanofibers mat for removal of multi-class antibiotic residues in environmental water. Chemosphere 2022, 288, 132616. [Google Scholar] [CrossRef] [Scilit]
  7. Li, Q.; Tan, J.; Sha, H.; Li, K.; Li, X. Adsorption of Macrolide Antibiotics by Aged Microplastics of Different Sizes: Mechanisms and Effects. Nanomaterials 2025, 15, 467. [Google Scholar] [CrossRef] [Scilit]
  8. Liu, M.; Wang, C.; Qi, X.-E.; Du, S.; Ni, H. Reducing residual chlortetracycline in wastewater using a whole-cell biocatalyst. Ecotoxicol. Environ. Saf. 2024, 282, 116717. [Google Scholar] [CrossRef] [Scilit]
  9. Wang, Y.; Kang, X.; Li, Y.; Li, R.; Wu, C.; Wang, L.; Wang, C.; Yang, T.; Ge, M.; He, Z. Cobalt-loaded carbon nanofibers as magnetic catalyst for tetracycline degradation through peroxydisulfate activation: Non-radical dominated mechanism. J. Water Process Eng. 2024, 57, 104600. [Google Scholar] [CrossRef] [Scilit]
  10. Zhang, K.; Kang, S.; Jia, R.; Wang, C. Unraveling the impact of Cu-loading in MIL-101(Fe) for markedly boosting photocatalytic PMS activation for TC degradation. Environ. Res. 2025, 278, 121664. [Google Scholar] [CrossRef] [Scilit] [PubMed]
  11. Singh, B.; Rafiquee, M.Z.A. Kinetics of the Degradation of Tetracycline Hydrochloride by H2O2 in the Presence of Cu–Fe3O4 Nanoparticles Under Sonication. J. Solut. Chem. 2025, 54, 704–720. [Google Scholar] [CrossRef] [Scilit]
  12. Zhang, X.; Liu, Y.; Yuan, J. Amino-functionalized Fe/Co bimetallic MOFs for accelerated Fe (III)/Fe (II) cycling and efficient degradation of sulfamethoxazole in Fenton-like system. Front. Chem. 2025, 13, 1579108. [Google Scholar] [CrossRef] [Scilit]
  13. Du, D.; Shi, W.; Wang, L.; Zhang, J. Yolk-shell structured Fe3O4 @void@TiO2 as a photo-Fenton-like catalyst for the extremely efficient elimination of tetracycline. Appl. Catal. B 2017, 200, 484–492. [Google Scholar] [CrossRef] [Scilit]
  14. Mohamed, M.M.; Bayoumy, W.A.; Goher, M.E.; Abdo, M.H.; Mansour El-Ashkar, T.Y. Optimization of α-Fe2O3 @Fe3O4 incorporated N-TiO2 as super effective photocatalysts under visible light irradiation. Appl. Surf. Sci. 2017, 412, 668–682. [Google Scholar] [CrossRef] [Scilit]
  15. Xu, T.; Zhu, R.; Zhu, G.; Zhu, J.; Liang, X.; Zhu, Y.; He, H. Mechanisms for the enhanced photo-Fenton activity of ferrihydrite modified with BiVO4 at neutral pH. Appl. Catal. B 2017, 212, 50–58. [Google Scholar] [CrossRef] [Scilit]
  16. Deng, Y.; Xing, M.; Zhang, J. An advanced TiO2 /Fe2TiO5 /Fe2O3 triple-heterojunction with enhanced and stable visible-light-driven fenton reaction for the removal of organic pollutants. Appl. Catal. B 2017, 211, 157–166. [Google Scholar] [CrossRef] [Scilit]
  17. Deng, X.; Zhang, Q.; Zhao, Q.; Ma, L.; Ding, M.; Xu, X. Effects of architectures and H2O2 additions on the photocatalytic performance of hierarchical Cu2O nanostructures. Nanoscale Res. Lett. 2015, 10, 8. [Google Scholar] [CrossRef] [Scilit]
  18. Ballari, M.d.l.M.; Brandi, R.; Alfano, O.; Cassano, A. Mass transfer limitations in photocatalytic reactors employing titanium dioxide suspensions. Chem. Eng. J. 2008, 136, 242–255. [Google Scholar] [CrossRef] [Scilit]
  19. Tryba, B. Immobilization of TiO2 and Fe-C-TiO2 photocatalysts on the cotton material for application in a flow photocatalytic reactor for decomposition of phenol in water. J. Hazard. Mater. 2008, 151, 623–627. [Google Scholar] [CrossRef] [Scilit] [PubMed]
  20. Mahmood, Z.; Garg, S.; Yuan, Y.; Xie, L.; Wang, Y.; Waite, T.D. Performance evaluation and optimization of a suspension-type reactor for use in heterogeneous catalytic ozonation. Water Res. 2024, 254, 121410. [Google Scholar] [CrossRef] [Scilit] [PubMed]
  21. Chandekar, K.V.; Yadav, S.P. Comprehensive study of MFe2O4 (M=Co, Ni, Zn) nanostructures prepared by co-precipitation route. J. Alloys Compd. 2023, 960, 170838. [Google Scholar] [CrossRef] [Scilit]
  22. Yao, J.; Yan, J.; Huang, Y.; Li, Y.; Xiao, S.; Xiao, J. Preparation of ZnFe2O4/α-Fe2O3 Nanocomposites from Sulfuric Acid Leaching Liquor of Jarosite Residue and Their Application in Lithium-Ion Batteries. Front. Chem. 2018, 6, 442. [Google Scholar] [CrossRef] [Scilit] [PubMed]
  23. Uthiravel, V.; Narayanamurthi, K.; Raja, V.; Anandhabasker, S.; Kuppusamy, K. Green synthesis and characterization of TiO2 and Ag-doped TiO2 nanoparticles for photocatalytic and antimicrobial applications. Inorg. Chem. Commun. 2024, 170, 113327. [Google Scholar] [CrossRef] [Scilit]
  24. Shi, C.; Wang, M.; Zhang, Z.; Zhou, H.; Hu, P.; He, L.; Liu, X.; Cai, H.; Pang, Z. Novel Fe3O4@TiO2@PB ternary composites for photocatalytic magnetorheological polishing of ceramic dentures and photocatalytic degradation of pollutants. Surf. Interfaces 2025, 70, 106849. [Google Scholar] [CrossRef] [Scilit]
  25. Nie, M.; Li, Y.; Li, L.; He, J.; Hong, P.; Zhang, K.; Cai, X.; Kong, L.; Liu, J. Ultrathin iron-cobalt oxide nanosheets with enhanced H2O2 activation performance for efficient degradation of tetracycline. Appl. Surf. Sci. 2021, 535, 147655. [Google Scholar] [CrossRef] [Scilit]
  26. Yu, X.; Lin, X.; Feng, W.; Li, W. Effective Removal of Tetracycline by Using Bio-Templated Synthesis of TiO2/Fe3O4 Heterojunctions as a UV–Fenton Catalyst. Catal. Lett. 2019, 149, 552–560. [Google Scholar] [CrossRef] [Scilit]
  27. Liu, H.; Chen, Y.; Yu, Z.; Yang, G.; Song, Y.; Wang, J.; Chen, J.; Jiang, J. Metal-doped Fe@MXene/CdS Schottky junction photocatalysts for efficient H2O2 generation and self-Fenton degradation of TC. J. Alloys Compd. 2025, 1037, 182302. [Google Scholar] [CrossRef] [Scilit]
  28. Yu, N.; Ma, H.; Wen, Z.; Zhang, W.; Chen, J.; Yuan, Y.; Zhou, L. Bacteria-based biochar as a persulfate activator to degrade organic pollutants. Environ. Sci. Pollut. Res. 2023, 30, 83289–83301. [Google Scholar] [CrossRef] [Scilit]
  29. Han, Y.; Gan, L.; Gong, H.; Han, J.; Qiao, W.; Xu, L. Photoactivation of peroxymonosulfate by wood pulp cellulose biochar/g-C3N4 composite for diclofenac degradation: The radical and nonradical pathways. Biochar 2022, 4, 35. [Google Scholar] [CrossRef] [Scilit]
  30. Xiong, W.; Gao, Y.; Wu, X.; Hu, X.; Lan, D.; Chen, Y.; Pu, X.; Zeng, Y.; Su, J.; Zhu, Z. Composite of Macroporous Carbon with Honeycomb-Like Structure from Mollusc Shell and NiCo2O4 Nanowires for High-Performance Supercapacitor. ACS Appl. Mater. Interfaces 2014, 6, 19416–19423. [Google Scholar] [CrossRef] [Scilit]
  31. Liu, J.; Li, X.; Chu, Y.; Yuan, L.; Lv, R.; Zhang, W. An autocatalytic Fe(III)/H2O2 Fenton-like process triggered by tetracycline: The overlooked effect of quinone intermediates. Chem. Eng. J. 2023, 475, 146035. [Google Scholar] [CrossRef] [Scilit]
  32. Zhang, H.; Wang, Z.; Li, R.; Guo, J.; Li, Y.; Zhu, J.; Xie, X. TiO2 supported on reed straw biochar as an adsorptive and photocatalytic composite for the efficient degradation of sulfamethoxazole in aqueous matrices. Chemosphere 2017, 185, 351–360. [Google Scholar] [CrossRef] [Scilit] [PubMed]
  33. Li, F.; Sun, G.; Fan, T.; Zhang, N.; Zhao, L.; Zhong, R.; Peng, Y. Ecotoxicological QSAR modelling of the acute toxicity of fused and non-fused polycyclic aromatic hydrocarbons (FNFPAHs) against two aquatic organisms: Consensus modelling and comparison with ECOSAR. Aquat. Toxicol. 2023, 255, 106393. [Google Scholar] [CrossRef] [Scilit] [PubMed]
Figure 1. A schematic diagram of the plate fixed-bed UV-Fenton reactor.
Processes 13 03824 g001
Figure 2. (a) XRD pattern of Al2SiO5 fiberboard and Fe3O4/TiO2@Al2SiO5; (b) XPS survey spectrum of Fe3O4/TiO2@Al2SiO5; (c) Fe 2p; (d) Ti 2p and (e) O 1s.
Processes 13 03824 g002
Figure 3. SEM images of (a) Al2SiO5 fiberboard and (b) Fe3O4/TiO2@Al2SiO5; (c) Elemental mapping of Si, Al, O, Fe, Ti on TiO2/Fe3O4@ Al2SiO5; (d) The EDS spectra of Al2SiO5 fiberboard (e) Fe3O4/TiO2@Al2SiO5.
Processes 13 03824 g003
Figure 4. (a) The degradation of TCH; (b) Reactivity kinetics. Effect of loading dosage on TCH catalytic activity of catalyst. Experimental conditions: initial pH = 4.5 (without adjustment), H2O2 = 10 mmol/L, HRT = 2 h, [TCH]0 = 50 mg/L, and T = 25 ± 1 °C.
Processes 13 03824 g004
Figure 5. (a) The degradation of TCH; (b) Reactivity kinetics. Effect of initial pH on TCH degradation. (Experiment conditions: TCH concentration = 50 mg/L, H2O2 concentration = 10 mmol/L, catalyst dosage = 0.5 g/L, HRT = 120 min, irradiation = 6 W UV lamps, Temperature = 25 °C).
Processes 13 03824 g005
Figure 6. (a) The degradation of TCH; (b) Reactivity kinetics. Effect of H2O2 concentration on TCH degradation. Experiment conditions: TCH concentration = 50 mg/L, initial pH = 4.5 (unadjusted), catalyst dosage = 0.5 g/L, HRT = 120 min, irradiation = three (3) UV lamps, Temperature = 25 °C.
Processes 13 03824 g006
Figure 7. Effect of UV light intensity on TCH degradation. (a) the intensity of 4 W; (b) the intensity of 8 W; (c) the intensity of 15 W; (d) the degradation of TC under different UV light intensity. Experiment conditions: TCH concentration = 50 mg/L, initial pH = 4.5, catalyst dosage = 0.5 g/L, HRT = 120 min, H2O2 concentration = 10 m Mol/L, Temperature = 25 °C.
Processes 13 03824 g007
Figure 8. Effect of HRT on TCH degradation. Experiment conditions: TCH concentration = 50 mg/L, H2O2 concentration = 10 mmol/L, catalyst dosage = 0.5 g/L, pH = 4.5, irradiation = three (3) 6 W UV lamps, Temperature = 25 °C.
Processes 13 03824 g008
Figure 9. Effect of influent concentration on TCH degradation. Experiment conditions: TCH concentration = 50 mg/L, H2O2 concentration = 10 mmol/L, catalyst dosage = 0.5 g/L, pH = 4.5 (unadjusted), irradiation = three (3) 6W UV lamps, Temperature = 25 °C.
Processes 13 03824 g009
Figure 10. Stability test on TCH degradation in plate fixed-bed UV-Fenton reactor. Experiment conditions: TCH concentration = 50 mg/L, H2O2 concentration = 10 mmol/L, catalyst dosage = 0.5 g/L, pH = 4.5 (unadjusted), irradiation = three (3) 6 W UV lamps, Temperature = 25 °C.
Processes 13 03824 g010
Figure 11. Determination of reactive species.
Processes 13 03824 g011
Figure 12. Hypothetical Reaction Mechanism Diagram.
Processes 13 03824 g012
Figure 13. UV-vis spectra with Fe3O4/TiO2@Al2SiO5 by UV-Fenton system (illustration is the structure formular of TCH) HPLC-MS/MS chromatograms for monitoring the degradation of TCH with Fe3O4/TiO2@Al2SiO5 by UV-Fenton system (a) UV-vis spectra with TiO2/Fe3O4@MSC by UV-Fenton system (illustration is the structure formular of TCH); HPLC-MS/MS chromatograms for monitoring the degradation of TC with TiO2/Fe3O4@MSC by UV-Fenton system; (b) 0 min; (c) 5 min; (d) 40 min.
Processes 13 03824 g013
Figure 14. Proposed degradation pathway of TCH with Fe3O4/TiO2@Al2SiO5 by UV-Fenton system.
Processes 13 03824 g014
Figure 15. LC50, EC50, and ChV values of TCH and the detected byproducts on fish, daphnia and green algae. (a) acute toxicity; (b) chronic toxicity.
Processes 13 03824 g015
Table 1. Variation in solution pH on TCH degradation in the plate fixed-bed UV-Fenton reactor under different initial pH values.
Time (min)pH
03.025.107.009.00
203.004.706.527.55
403.014.676.417.45
602.984.526.307.35
802.974.376.247.25
1002.984.356.157.18
1202.984.246.077.17
Table 2. Intermediate products identified by HPLC-MS/MS.
ProductsMass-to-Charge RatioFormulaChemical
Structure
TCH445C22H24N2O8Processes 13 03824 i001
P1461C22H24N2O9Processes 13 03824 i002
P2431C21H22N2O8Processes 13 03824 i003
P3416C21H21NO8Processes 13 03824 i004
P4477C22H24N2O10Processes 13 03824 i005
P5449C20H21N2O10Processes 13 03824 i006
P6400C21H21NO7Processes 13 03824 i007
P7451C20H22N2O10Processes 13 03824 i008
P8491C22H22N2O11Processes 13 03824 i009
P9468C19H17NO13Processes 13 03824 i010
P1088C3H4OProcesses 13 03824 i011
P11412C16H13NO12Processes 13 03824 i012
P12396C15H9NO12Processes 13 03824 i013
P13146C4H2O6Processes 13 03824 i014
P14298C11H7NO9Processes 13 03824 i015
P1561CH3NO2Processes 13 03824 i016
P16253C10H4O8Processes 13 03824 i017
P17230C8H6O8Processes 13 03824 i018
P1890C2H2O4Processes 13 03824 i019
Disclaimer/Publisher’s Note: The statements, opinions and data contained in all publications are solely those of the individual author(s) and contributor(s) and not of MDPI and/or the editor(s). MDPI and/or the editor(s) disclaim responsibility for any injury to people or property resulting from any ideas, methods, instructions or products referred to in the content.