Article

Experimental and Numerical Replication of Thermal Conditions in High-Pressure Die-Casting Process

Department of Mechanical Engineering, McMaster University, Hamilton, ON L8S4L7, Canada
*
Author to whom correspondence should be addressed.
Processes 2025, 13(12), 3815; https://doi.org/10.3390/pr13123815
Submission received: 30 October 2025 / Revised: 20 November 2025 / Accepted: 23 November 2025 / Published: 25 November 2025

Abstract

Acquiring reliable thermal data during the high-pressure die-casting (HPDC) process remains a significant challenge due to its complexity and rapidly evolving thermal environment. In industrial settings, the influence of process parameters is typically evaluated after solidification by examining the final casting quality, as direct temperature measurements within the die during operation are difficult to obtain. Additionally, most casting simulation tools lack accurate correlations for the interfacial heat transfer coefficient (IHTC) as a function of process parameters. To address this limitation, a laboratory-scale hot chamber die-casting (HCDC) apparatus was developed to replicate the fluid flow and the thermal conditions of industrial HPDC operation while enabling direct thermal measurements inside the die cavity using embedded thermocouples. The molten metal temperature was estimated using the lumped capacitance method, and the IHTC was determined through a custom inverse heat conduction algorithm incorporating an adaptive forward time-stepping scheme. This algorithm was validated by solving the forward heat conduction problem using the ANSYS 2025 R1 Transient Thermal solver. The experimentally obtained IHTC values showed good agreement with those measured during industrial HPDC trials, with a maximum deviation of about 14% in the peak value, while the full width at half maximum (FWHM) differed by less than 12%. These results confirm that the developed HCDC setup can reliably reproduce industrial thermal conditions and generate high-quality thermal data that can be used in numerical casting simulations.

1. Introduction

Die casting is a metal casting process where molten or semi-molten metal is injected into a mold cavity at high pressure and velocity [1,2]. The metal takes the shape of the mold and solidifies under continuous pressure. This process is valued for its ability to create components with high dimensional accuracy, strength, and efficient material use. It is widely used for manufacturing complex-shaped parts that can endure moderate loads [3,4].
High-Pressure Die Casting (HPDC) is one of the most advanced and commonly used die-casting techniques. It involves injecting molten metal, such as aluminum alloys, into a die cavity at high pressures. The rapid cooling rate of approximately 500 K/s ensures fast solidification. This enhances the mechanical properties of the casting and minimizes defects like porosity and shrinkage [5].
Industries requiring high precision and performance, such as automotive, aerospace, electronics, and machinery, benefit greatly from HPDC. The global shift toward energy conservation has accelerated the adoption of lightweight materials such as aluminum alloys [6]. These materials improve fuel efficiency [7], enhance structural strength, increase electric vehicle efficiency, and thereby extend driving range and elevate overall vehicle performance. Additionally, they are highly recyclable [8].
In the automotive sector, an average car in Europe weighs around 1500 kg [9]. Aluminum makes up 7–15% of this weight, depending on the model [10]. The demand for aluminum is expected to grow by 15% by 2026 and by 24.9% by 2030 compared to 2022 [11]. Currently, HPDC accounts for about 50% of global light metal casting production. This percentage is expected to increase by 2040 due to advancements in alloy development, process optimization, and automation [12].
Since HPDC molds are metal, solidification occurs rapidly. Accurately determining the interfacial heat transfer coefficient (IHTC) is essential for process control [13]. Since the 1970s [14], extensive efforts have been devoted to the HPDC process to quantify the IHTC, thereby better understanding solidification and improving casting quality. The accurate estimation of IHTC depends on the thermodynamic properties of both the casting and mold materials.
Temperature distribution and boundary conditions influence these properties. These factors change continuously throughout the process. Although conduction is the primary mode of heat transfer in HPDC, radiation and convection also contribute due to the high temperatures involved [15,16,17,18].

2. Literature Review

2.1. Analytical and Inverse Methods for IHTC Estimation

Analytical methods have been employed to estimate the IHTC at the metal–mold interface based on experimental temperature data. In [19,20], a heat-transfer model was developed that considers solidification with thermal conduction and interfacial resistance. Their approach assumed constant thermal properties for both metal and mold, and introduced the Virtual Adjunct Method (VAM), in which contact resistance was represented as an additional layer. A key limitation of these analytical formulations is the required assumption of a constant IHTC to obtain a closed-form solution.
In [21], HPDC cold-chamber experiments were conducted on A380 aluminum and AZ91 magnesium alloys. The metal temperature was 700 °C, with a shot speed of 1.54 m/s and a pressure of 800 bar. Cast section thicknesses ranged from 2 to 5 mm. Using the inverse heat conduction method and temperature data obtained from thermocouples positioned at 0.5 mm, 10 mm, and 20 mm below the die surface—while the molten metal temperature was simultaneously monitored using a light-pipe/pyrometric measurement chain—the IHTC was determined to be approximately 90 kW/m2·K for the A380 aluminum alloy and 100 kW/m2·K for the AZ91 magnesium alloy.
The study in [22] estimated the IHTC between the casting and the die through HPDC simulations. They instrumented a production die for an automotive engine bearing beam with type K thermocouples and compared the temperature data from the simulation with actual measurements. Initially, the simulation showed poor correlation using the default IHTC, so the IHTC was adjusted through multiple iterations. A peak IHTC of 42,000 W/m2·K was found to provide a good fit. This modified IHTC was validated with a second instrumented die, improving the simulation’s ability to predict casting defects and enhance casting quality.

2.2. Influence of HPDC Process Parameters on IHTC

Several studies have explored how key HPDC process parameters—such as velocity, pressure, and die temperature—affect the magnitude and evolution of the IHTC during solidification. In [23], cold-chamber HPDC experiments were conducted for various step thicknesses (2–14 mm) using AM50 and ADC12 alloys. The results showed that ADC12 produced higher IHTC values due to improved die contact during solidification. Pressure influenced thicker sections more strongly than thinner ones, as it propagates more effectively through larger thicknesses. Increasing shot velocity (0.7–4 m/s) also raised the peak IHTC, particularly in thinner steps. Overall, the pouring temperature had only a minor effect on the IHTC.
HPDC experiments were performed on the AZ91D alloy to determine the IHTC and its dependence on piston speed [24]. Based on inverse analysis at a pouring temperature of 700 °C, an increase in piston velocity from 0.8 m/s to 1.55 m/s led to a 15% rise in IHTC.
In [25], the IHTC for HPDC of AM50 magnesium alloy was estimated using temperature measurements from a step-shaped casting. Step thickness strongly influenced the IHTC evolution: thinner steps produced narrower profiles, while thicker steps sustained higher values for longer. Process parameters primarily affected the peak IHTC, with shot velocity having a greater impact on thin sections and casting pressure influencing thick ones. Lower initial die temperatures increased the peak IHTC, and melt flow patterns affected the early-stage behavior. The study assumed the casting temperature equaled the melt temperature, which may have caused slight underestimation due to heat loss during the slow shot phase.
The study in [26] covered the interfacial heat transfer behavior at the metal/shot-sleeve interface during HPDC of the AZ91D alloy was examined through temperature measurements along the shot sleeve. An inverse method was developed to determine the IHTC. Under static conditions, peak IHTC values were highest at the pouring zone (11.9 kW/m2 K) and lower at the middle (7.3 kW/m2 K) and end zones (8.33 kW/m2 K). During casting, a second peak of 6.1 kW/m2 K appeared at the middle zone at 0.3 m/s slow speed, while a peak of 12.9 kW/m2 K was observed at the end zone during high-speed flow. Initial and maximum shot sleeve surface temperatures first decreased with increasing slow speed up to 0.3 m/s, then increased again at 0.6 m/s. Experimental plate-shaped casting tests confirmed that entrapped surface coatings (ESCs) were minimized at 0.3 m/s and increased at higher speeds.
In [27], vacuum die-casting experiments were performed on the AM60B alloy in a cold chamber to assess the IHTC and its dependence on slow shot speed, pouring temperature, and die temperature. It was observed that increasing the slow shot speed from 0.1 m/s to 0.4 m/s resulted in an increase in the IHTC from approximately 13.5 kW/m2·K to 20 kW/m2·K, which can be attributed to improved metal–die contact and reduced gas entrapment. Furthermore, raising the pouring temperature from 680 °C to 720 °C increased the IHTC from about 16 kW/m2·K to 19 kW/m2·K. In contrast, variations in die temperature were found to have a negligible influence on the IHTC.
Variations in the die surface temperature at different locations were analyzed and linked to differences in the contact duration between the molten metal and the die by [28]. Locations near the gate exhibited higher temperatures due to prolonged contact with the flow, resulting in greater heat transfer. The filling time influenced grain size (Ds), with shorter filling times lowering die surface temperature and increasing local cooling rates. The flow direction also affected temperature distribution, as direct impingement areas experienced higher temperatures. The IHTC played a crucial role in grain structure formation, aligning with experimental observations. The Stefan model accurately predicted grain size distribution when excluding entrapped solid grains (ESGs), which accumulated near the gate due to solidification in the shot sleeve. The estimated IHTC values were consistent with previous research, confirming its dependence on alloy composition, pressure, and die temperature.
In [13], the heat transfer behavior at the cast–mold interface during HPDC was examined. They experimentally measured time-dependent temperatures using 18 thermocouples and calculated the IHTC and heat flux with a finite difference method. Their study examined the effects of injection pressure (80, 160 bar), velocity (1.5, 2.5 m/s), mold temperature (373, 453, 533 K), and casting temperature (973, 1033 K). Simulations using ANSYS Fluent confirmed the trends observed experimentally. Results showed that higher injection pressure, velocity, and casting temperature increased IHTC and heat flux, while higher mold temperature reduced them. Vacuum application further enhanced these values.
In [29], the time-dependent IHTC for A383 aluminum alloy was numerically investigated at different mold preheating temperatures. The study showed that higher mold temperatures led to higher average IHTC values, indicating improved thermal contact at the interface. Although the approach relied entirely on numerical modeling, it highlighted the sensitivity of IHTC to mold temperature in pressure die-casting conditions.

2.3. Vacuum-Assisted HPDC Effects on Quality

Research has also examined the role of vacuum assistance in HPDC, showing its impact on reducing porosity, improving mechanical properties, and enhancing heat transfer at the metal–mold interface. In [30], the influence of pouring temperature, casting pressure, piston velocity, and vacuum conditions on the mechanical and metallurgical characteristics of the A380 aluminum alloy was investigated. With vacuum, tensile and yield stress increased by 3–5%, and grain size decreased by 10–13%. Raising injection pressure from 100 to 200 bar (without vacuum) improved mechanical strength, while increasing pouring temperature from 740 to 800 °C led to an inhomogeneous structure.
The effects of thermal and dynamic injection parameters on porosity and mechanical properties of A383 alloy castings produced by HPDC were examined in [31]. They conducted experiments and simulations using 64 different conditions, varying mold and casting temperatures, injection velocity, pressure, and vacuum application. Tensile tests measured mechanical properties, while a gas pycnometer analyzed porosity. Simulations were performed using FLOW-3D. Their results showed that the optimal casting and mold temperatures were 790 °C and 220 °C, respectively. The best injection parameters were 1.7 m/s velocity and 10–20 MPa pressure with vacuum application, improving casting quality.
In [32], the influence of vacuum-assisted high-pressure die casting (VPDC) on porosity formation and mechanical performance was investigated. They cast AlSi9Cu3(Fe) alloy using both conventional HPDC and VPDC at different cavity air pressures (170, 90, and 70 mbar). Lowering the cavity pressure reduced porosity from 1.10% to 0.47% (57% reduction). This improved tensile strength from 271.6 MPa to 299.8 MPa (10% increase) and elongation from 1.66% to 2.49% (50% increase).
The IHTC and heat flux during pressure casting of the AlSi8Cu3Fe alloy were examined by [33] using a cylindrical mold. They examined the effects of casting temperature, injection pressure, speed, and vacuum application. Temperature measurements from thermocouples were used to calculate IHTC and heat flux via the finite difference method. Machine learning models (Decision Tree Regression (DTR), Multiple Linear Regression (MLR), Artificial Neural Network Regression (ANNR)) were applied to predict IHTC, with ANNR achieving the highest accuracy (99.9%). A software tool was developed to compare experimental and predicted results in real time.
The study in [34] examined the filling behavior during HPDC of the Al6061 alloy under both vacuum-assisted and conventional conditions. They compared filling time, pressure drops, and velocity vectors. VPDC reduced filling time from 1.2 s to 0.95 s, saving 21%. It also resulted in higher mold temperatures and an 8% increase in heat transfer.

2.4. IHTC Behavior in Squeeze Casting

The influence of applied pressure and section thickness on IHTC has been widely investigated in squeeze and indirect squeeze casting processes to better understand their heat transfer characteristics. In [35], the IHTC during squeeze casting of commercial aluminum was examined through analysis of temperature–time curves obtained under various applied pressures. Experimental IHTC values, derived from temperature measurements of the steel mold and aluminum casting, were compared with numerical results and showed close agreement. The IHTC increased with applied pressure and decreased as solidification progressed. Below 500 °C, pressure had a reduced effect on IHTC. Peak IHTC values were 2975.14 W/m2 K for as-cast aluminum and 3351.08 W/m2 K for squeeze-cast aluminum. Empirical equations were developed to relate IHTC to surface temperature and pressure.
In [36], the IHTC during indirect squeeze casting of AM60 magnesium alloy was examined using a P20 steel die and a 75-ton press for wall thicknesses of 3–20 mm. Temperature and pressure measurements showed that the IHTC reached an initial peak and then decreased. Higher hydraulic pressure increased the peak IHTC, and thicker sections exhibited higher IHTC and heat flux. Empirical correlations were proposed linking IHTC to local pressure and solidification temperature.
The interfacial heat transfer behavior during the squeeze casting of aluminum alloy 5083 was examined by [37]. They measured temperature profiles in the die and casting, using an inverse method to calculate the IHTC. Results showed that thicker sections had higher peak IHTC values due to better metal/die contact under hydraulic pressure. IHTC increased immediately after cavity filling and decreased during solidification. Regression analysis provided a logarithmic empirical equation relating IHTC to wall thickness.
In [38], the effect of die coating thickness on heat transfer behavior during squeeze casting was investigated. The IHTC was determined using an inverse method based on mold temperature measurements. A Fast Fourier Transform (FFT) filtering technique processed the data. Water-based graphite coating was applied, and its thickness was measured with a TT260B gauge. Results indicated that IHTC increased with coating thickness up to 32 μm but declined beyond this point. Additionally, as the coating thickened, the effect of applied pressure on IHTC became less significant.
The IHTC during the squeeze casting of aluminum alloy AA6061 was investigated by [39] using an H13 steel step die. Casting was performed at 95 MPa on sections of varying thickness (3–15 mm). The IHTC and heat flux were determined using the inverse heat conduction method. Results showed that IHTC increased sharply at the start of casting, peaked, and then declined. Thicker sections exhibited higher peak IHTC values and a slower stabilization rate compared to thinner sections.
From the existing literature, extensive research has been conducted on the IHTC in HPDC processes. However, to the best of the authors’ knowledge, no studies have specifically investigated this phenomenon for the A365 aluminum alloy, except for our recent publication [40], which was limited to a comparison of the peak IHTC values.

3. Experimental and Methodology

The experimental setup, illustrated in Figure 1, represents the hot chamber die casting (HCDC) designed to replicate the thermal and flow conditions encountered in HPDC processes used in gigacasting applications. The setup includes a heated shot sleeve, maintained by eight Watt-Flex® cartridge heaters (3/8” × 12-1/4”, 1000 W, 250 V, Cold Tip, 26” MG Leads) supplied by Dalton Electric Heating Co., Ipswich, MA, USA, which guide the molten metal from the pouring basin to the die cavity. A 2” hydraulic piston, driven by an ENERPAC ZE4-Series hydraulic pump (Enerpac Tool Group Corp., Menomonee Falls, WI, USA). hydraulic pack with a maximum pressure capacity of 700 bar, is used to inject the molten metal into the die cavity. The piston operates at a velocity of 55.6 mm/s. The die is equipped with a cartridge heater for preheating and features 12 internal cooling channels with a total maximum flow rate of 86 L/min.
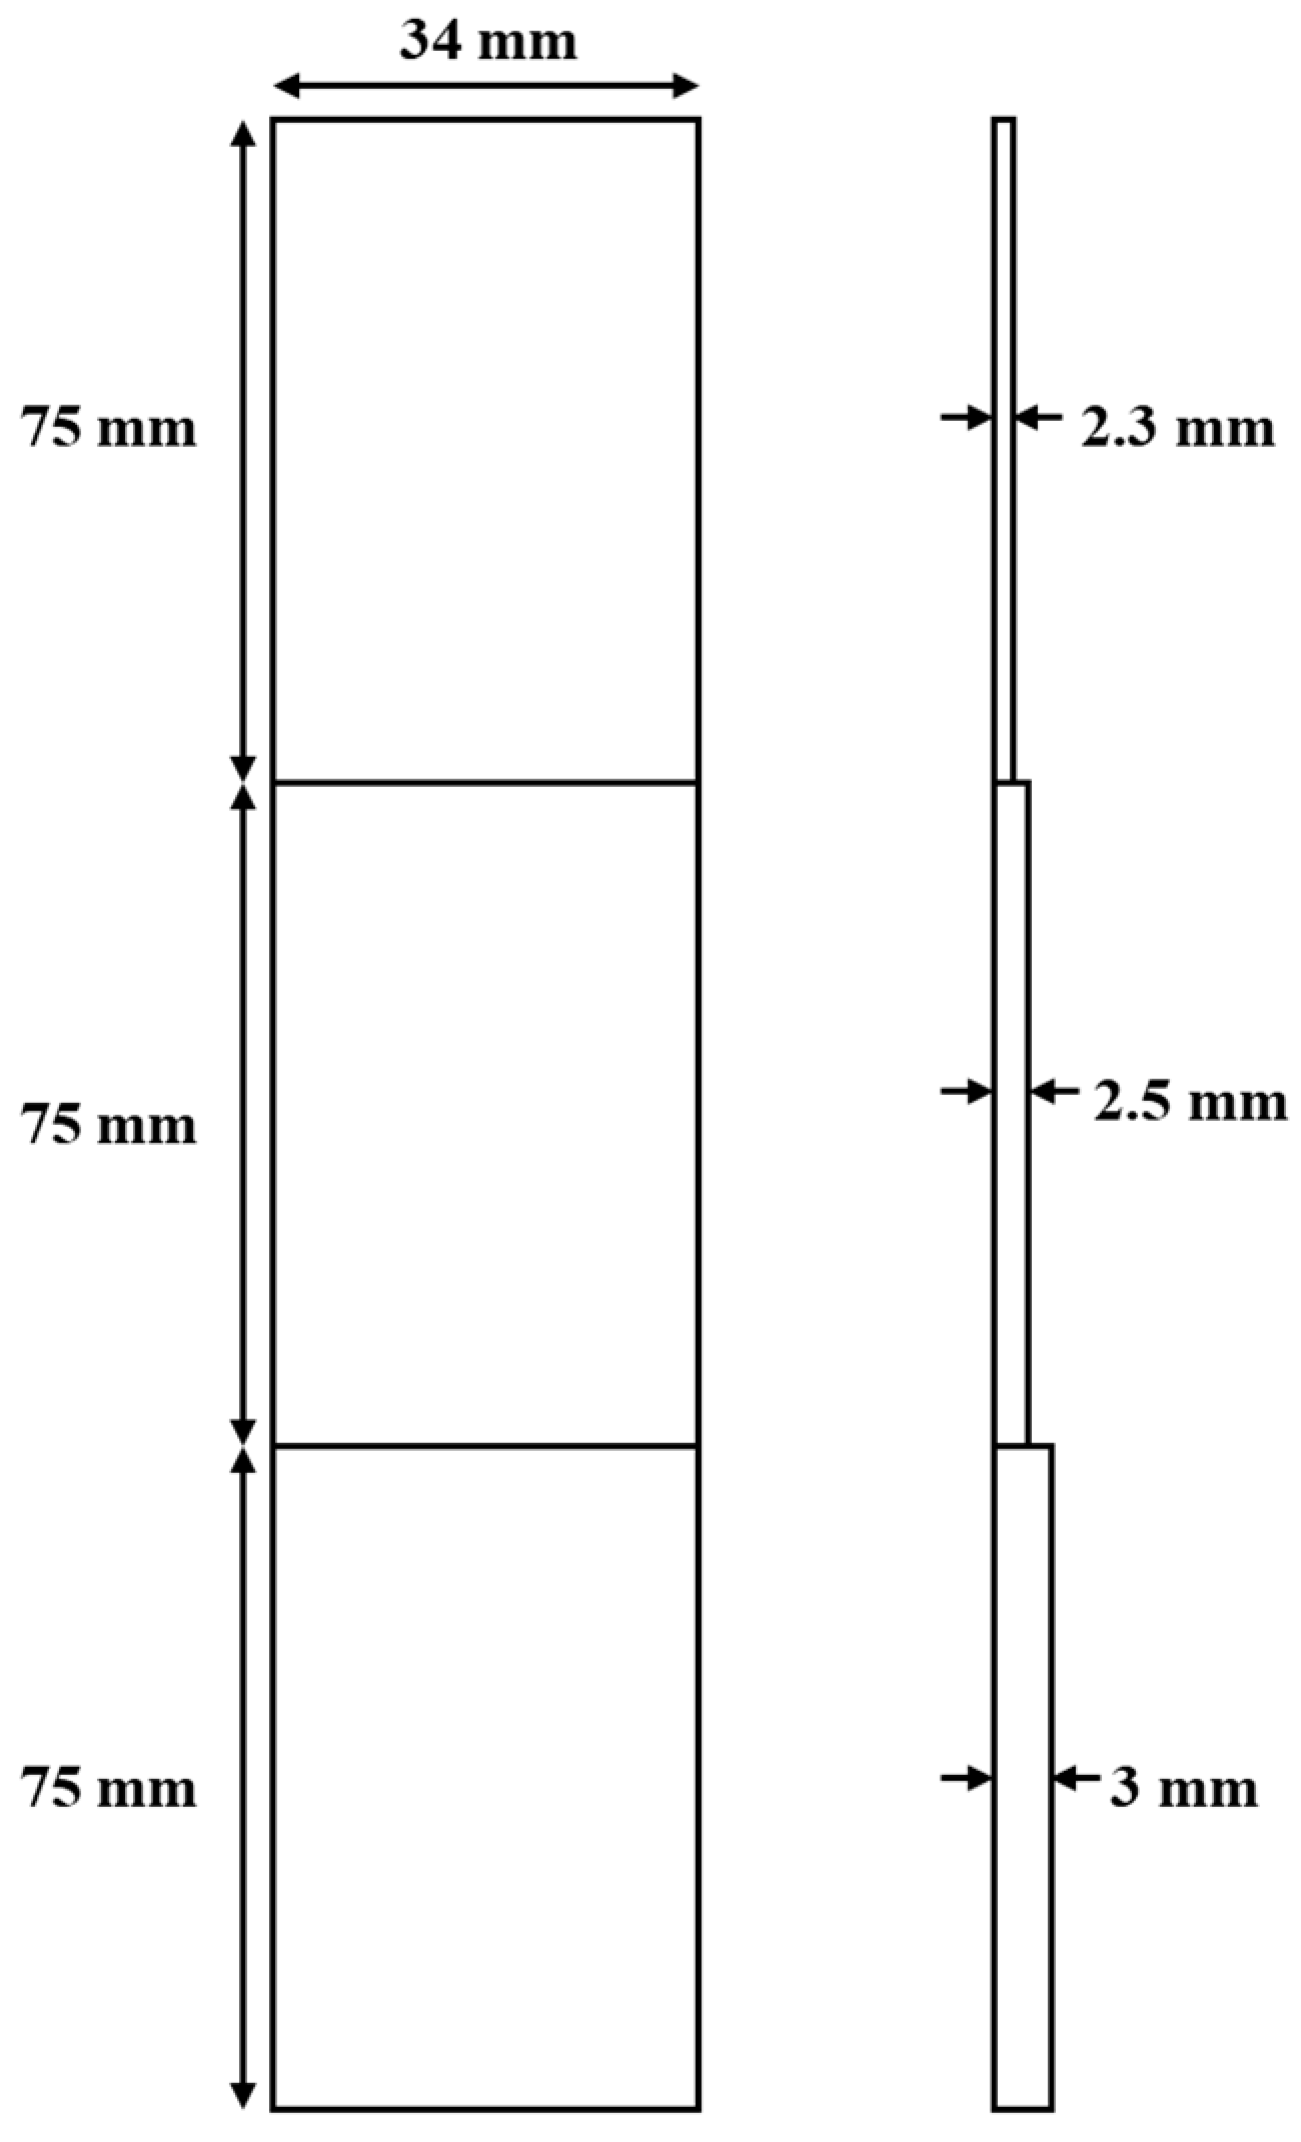
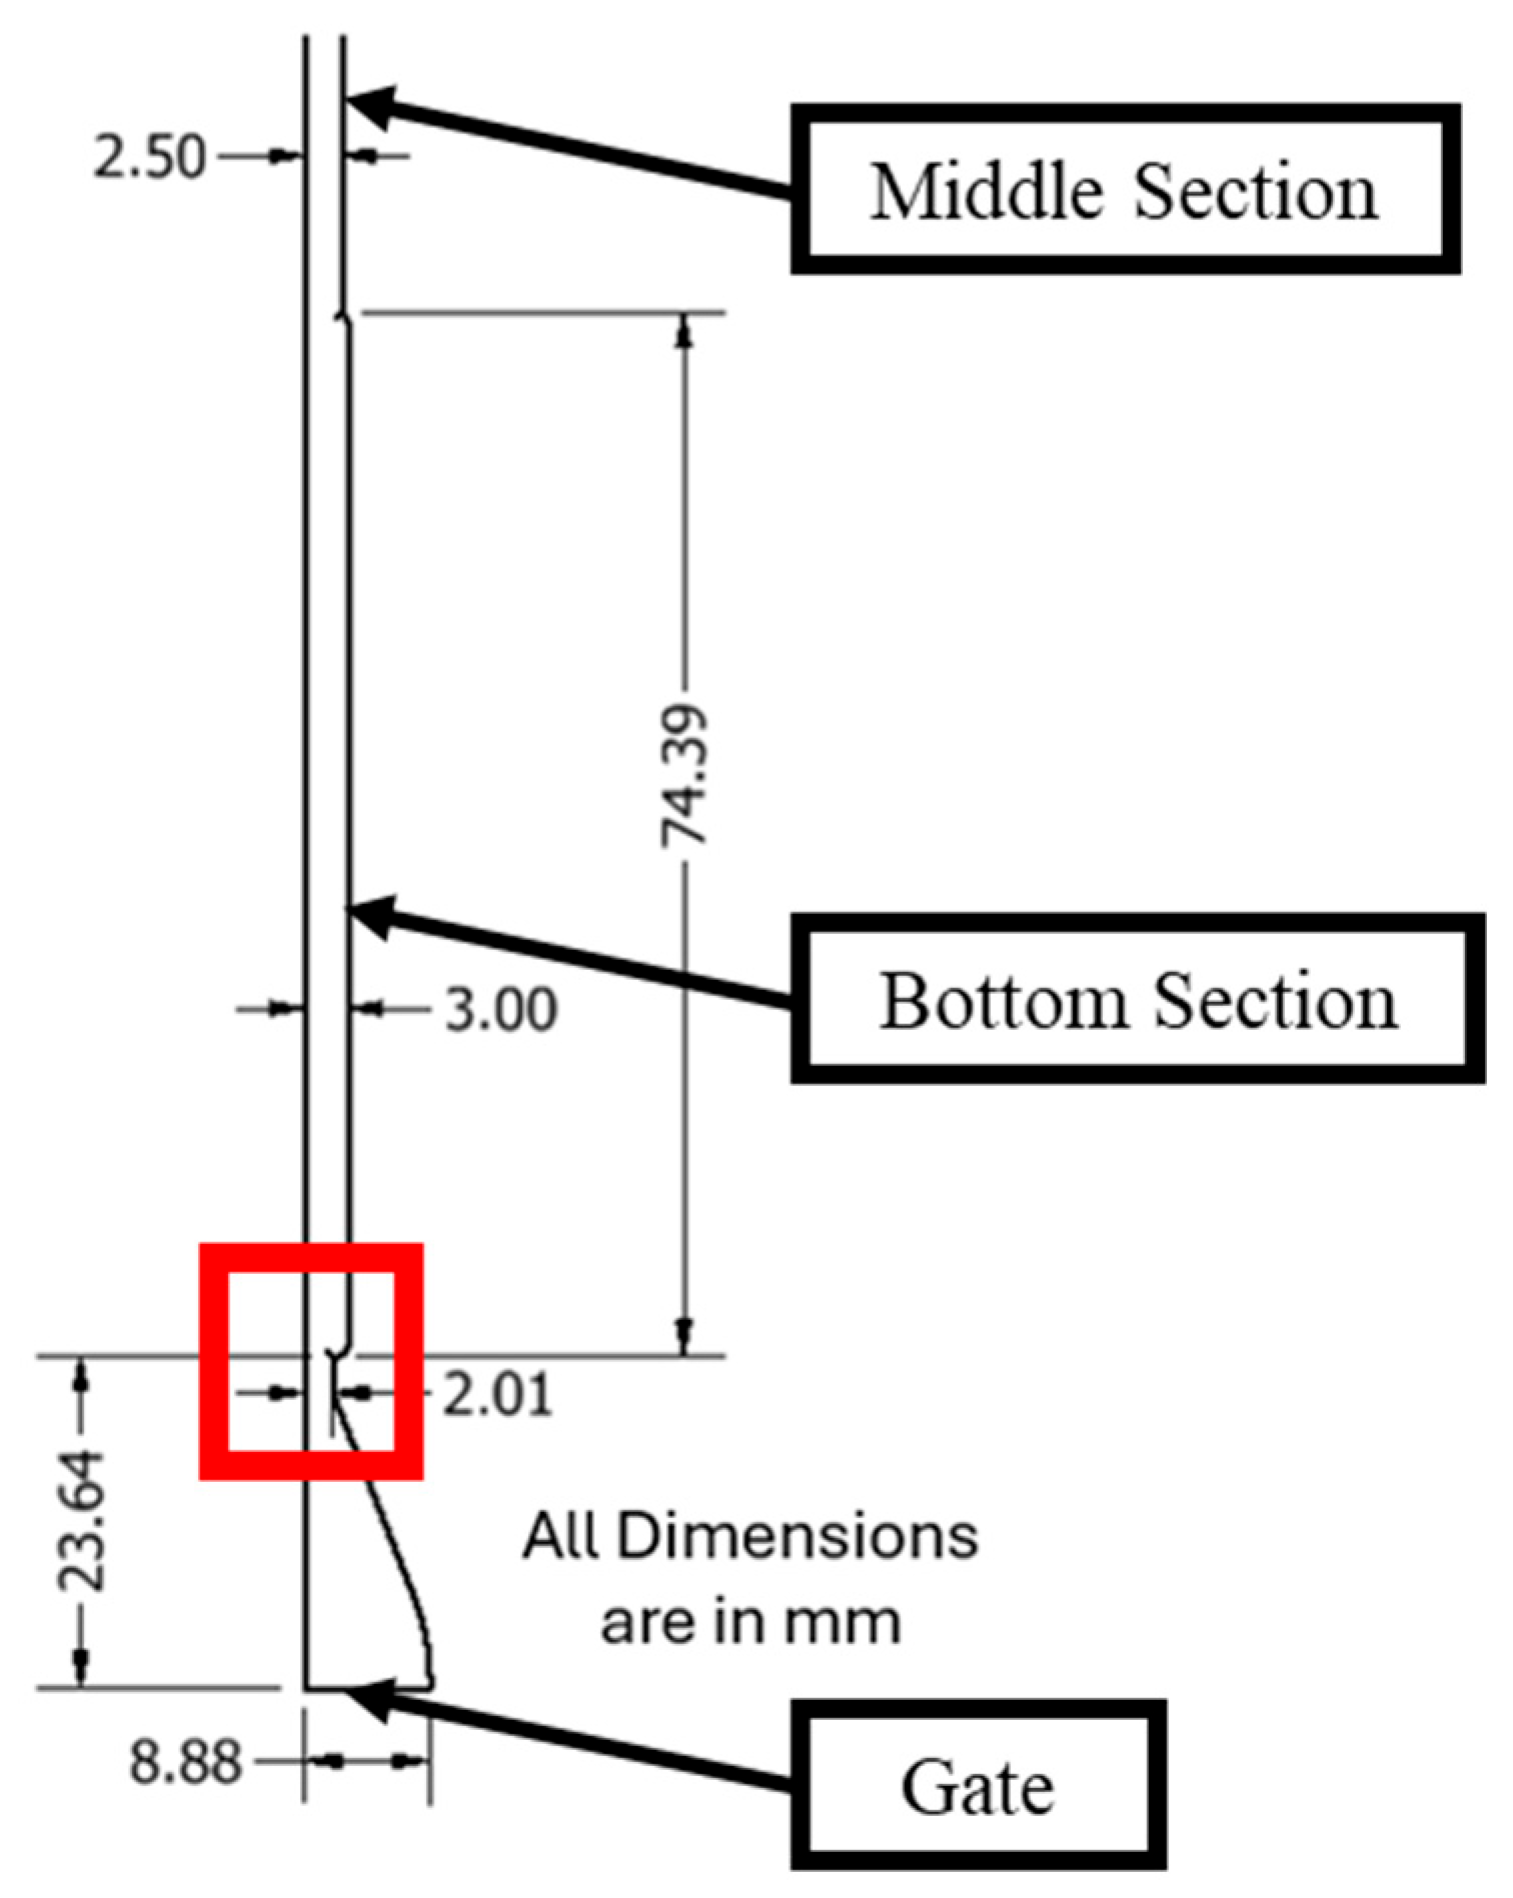
Figure 2 shows the dimensions of the three-step casting, which consists of three steps (from top to bottom, designated as steps 1–3) with the following dimensions, respectively: 34 mm × 75 mm × 2.3 mm, 34 mm × 75 mm × 2.5 mm, and 34 mm × 75 mm × 3 mm. The molten metal is filling the cavity from the bottom to the top.
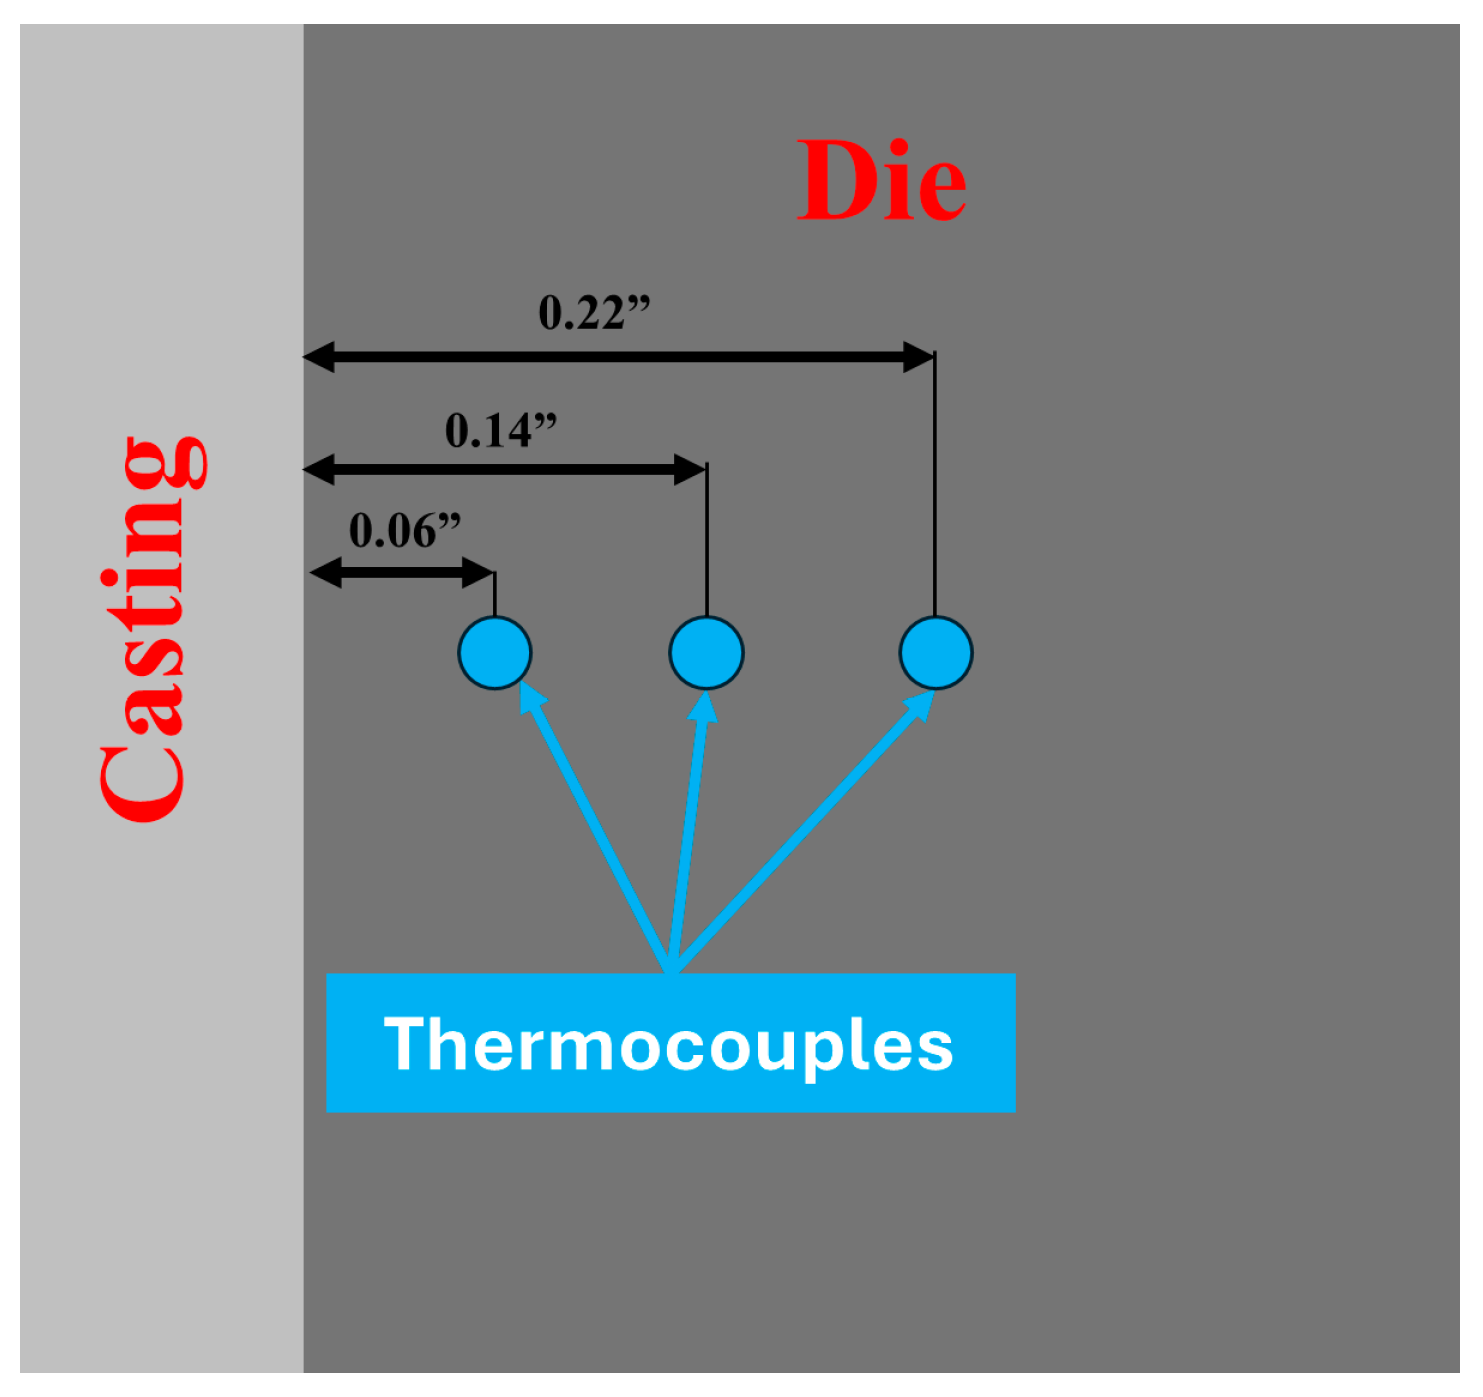
The die is manufactured from H13 tool steel, with its properties listed in Table 1. To capture thermal data during the casting process, three thermocouples are embedded at each section of the die, corresponding to different casting thicknesses of the part. These thermocouples are positioned at depths of 0.06”, 0.14”, and 0.22” from the casting surface, as shown in Figure 3. All thermocouples used are ungrounded OMEGA SCAXL-032U-6 type (Omega Engineering, Norwalk, CT, USA), with a diameter of 1/32”, selected to provide stable and reliable temperature measurements.
A365 aluminum alloy was used in the casting process, and its chemical composition (in mass percent) is presented in Table 2. Generally, A365 alloys contain elemental ranges as reported in [41], while the exact composition of the alloy used in this experiment is shown in Table 2. The relevant properties are listed in Table 3, where each elemental property is multiplied by its mass fraction in the alloy, and the elemental properties were taken from [42].
Prior to casting, the die was preheated to 120 °C using two cartridge heaters. The molten metal was poured into the shot sleeve at a temperature of 685 °C. Cooling was regulated via internal cooling channels within the die, operating at a flow rate of 86 L/min to control the cooling rate during solidification.

4. Mathematical Modeling

The IHTC between the molten metal and die surface, which implicitly accounts for the evolving contact resistance, is evaluated based on heat transfer principles and is expressed as:
h t   =   q ( t ) T c s T d s
where h t is the time-dependent IHTC, q ( t ) is the interfacial heat flux and T c s   a n d   T d s represent the temperatures at the casting surface and die surface, respectively. The variable t denotes the time since the beginning of filling.
Although the temperature field in the casting or die can be computed if the boundary conditions are known, direct measurement of the interface temperatures T c s   a n d   T d s is not feasible. Thermocouples placed at the interface disturb the thermal field, and complex geometries introduce multidirectional heat flow, making direct measurement impractical.
Therefore, the interfacial heat transfer coefficient is commonly obtained through inverse heat conduction methods using internal temperature measurements.
Because HPDC involves phase change and strongly temperature-dependent properties, the resulting inverse heat conduction problem is nonlinear. In this study, the IHTC was determined using a finite difference scheme combined with Beck’s iterative algorithm.

4.1. Inverse Heat Transfer Approach for Solidification Analysis

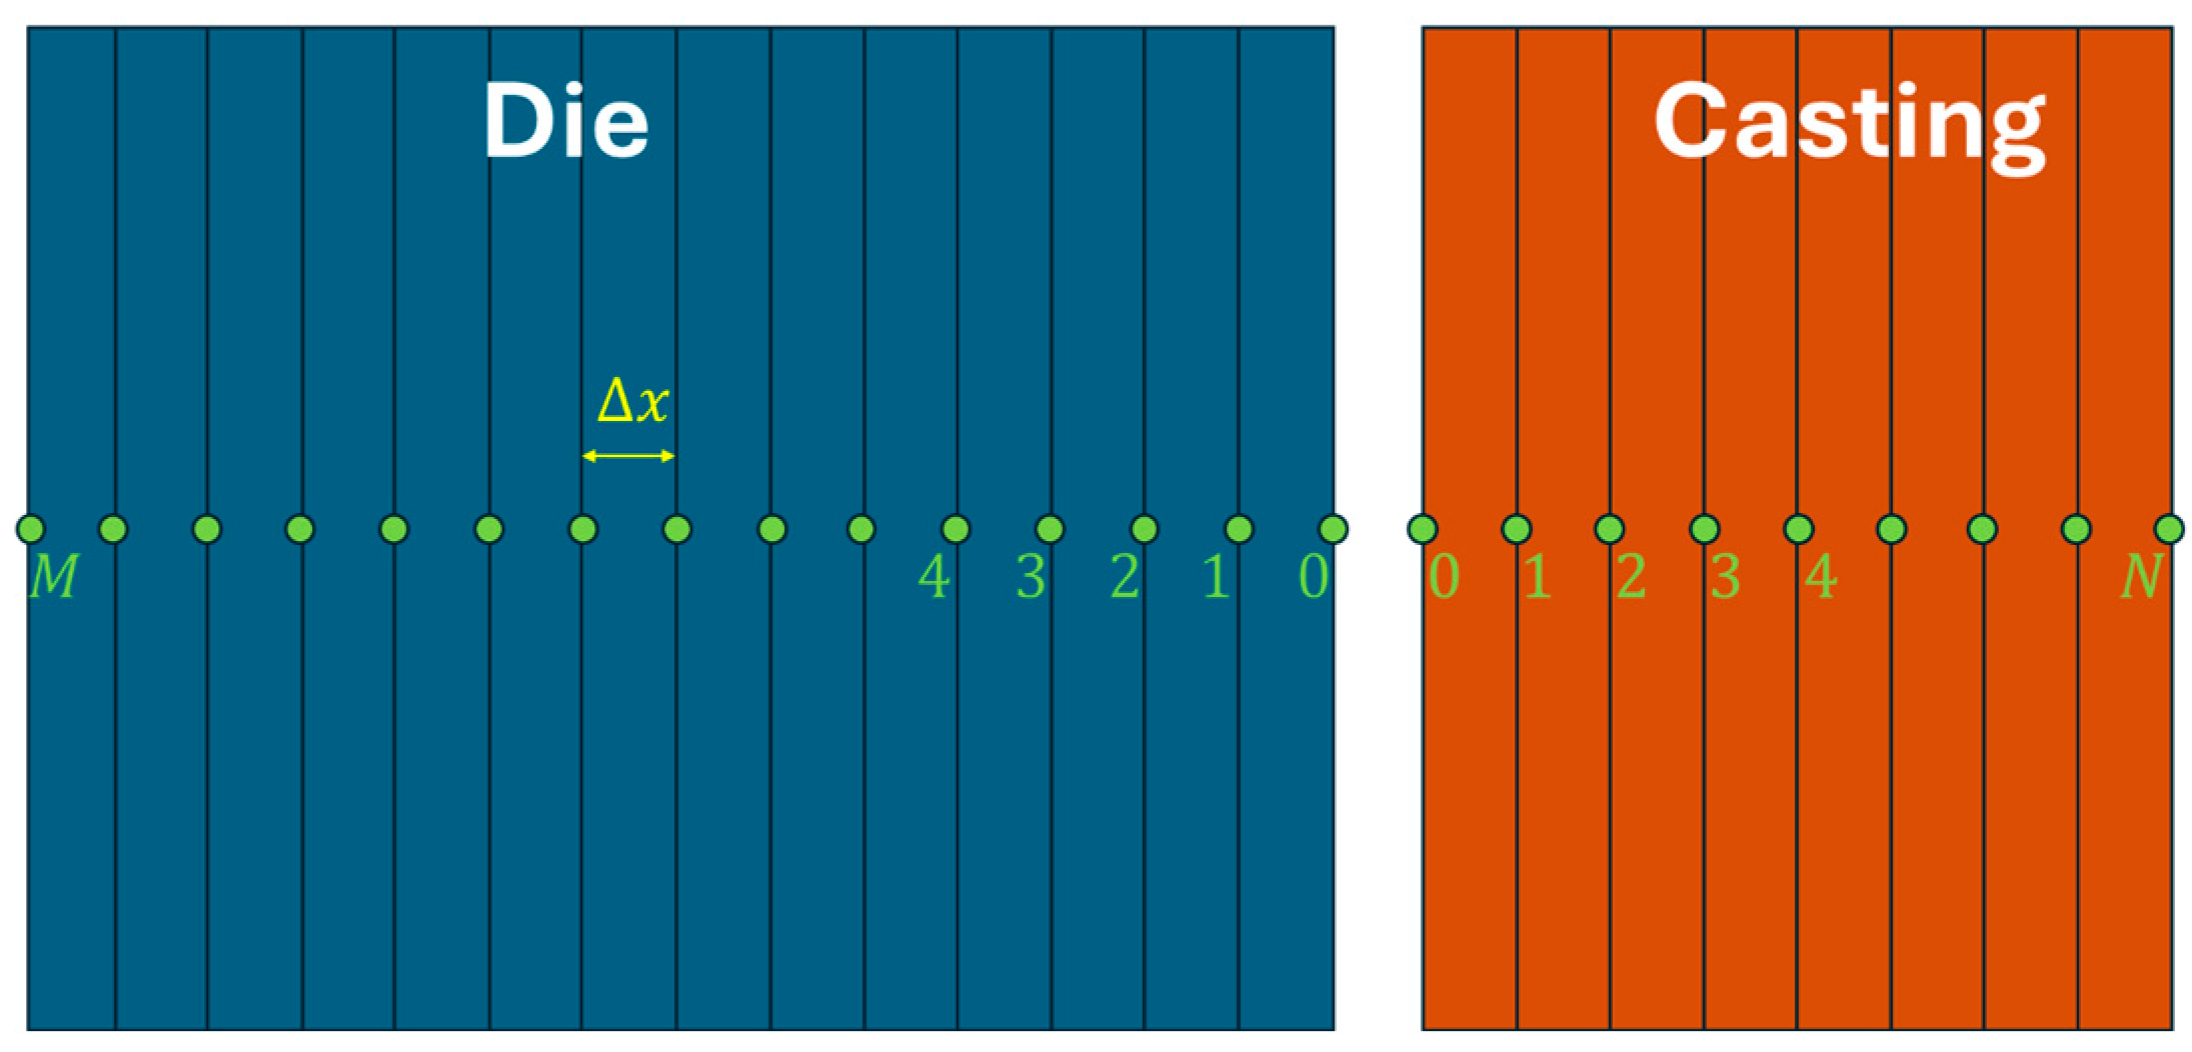
Considering that the thickness of each casting step is significantly smaller than its length and width, heat transfer was treated as one-dimensional in each region along its thickness. The discretized thermal interaction between the casting and die is illustrated schematically in Figure 4. Temperatures were experimentally measured at 0.06”, 0.14”, and 0.22” below the die surface. Based on these measurements, the heat flux at the die surface was reconstructed using inverse analysis, while the resulting temperature fields were subsequently validated through direct simulations.
The transient heat flux at the casting–die interface was determined from the temperature gradient between surface and subsurface nodes using the following expression:
q t   =   k d T d x   = k T m t T m 1 t x
where k represents the thermal conductivity of the respective material (casting or die), T m t is the temperature at timestep t and nodal position m , and x is the nodal spacing. Using this computed heat flux, the time-dependent IHTC values were subsequently evaluated via Equation (1).
The heat transfer within each section of the die is governed by transient, one-dimensional conduction, as described by Equation (3).
ρ C T t = x k T x
Here, ρ denotes the density of the die material, T is the temperature, t represents time, and x is the distance from the die surface to the nodal point. The temperature-dependent properties C and k correspond to the specific heat capacity and thermal conductivity of the die, respectively.
The initial and boundary conditions were applied as follows:
T x , 0 = T i x
q 0 , t = k T x x = 0
T L , t = T m e a s u r e d ( L , t )
T i x denotes the initial temperature distribution in the die, q 0 , t is the heat flux at the casting-die interface, and T m e a s u r e d ( L , t ) is the measured temperature of the farthest thermocouple from the die surface, which is located at a distance L from the die surface. The region from x   =   0 to x   =   L was discretized into M equally spaced control volumes ( L   =   M · x ), and the corresponding temporal domain was discretized using time steps of size t , with p and m referring to the time and spatial indices, respectively.
The first-order time derivative in Equation (3) was approximated using a backward finite difference scheme:
T t m   =   T m p + 1 T m p t
The superscript p denotes the current time level, while the subscript m denotes the spatial node.
To solve Equation (3), an implicit finite difference formulation was employed. At the surface node ( m   =   0 ), the equation becomes:
1 + 2 F o T 0 p + 1 2 F o T 1 p + 1   =   2 F o x k q 0 + T 0 p
For any internal node ( 1 m M 1 )
1 + 2 F o T m p + 1 F o T m 1 p + 1 + T m + 1 p + 1 = T m p
where F o is the finite-difference representation of the Fourier number, defined as:
F o   =   k t ρ C x 2
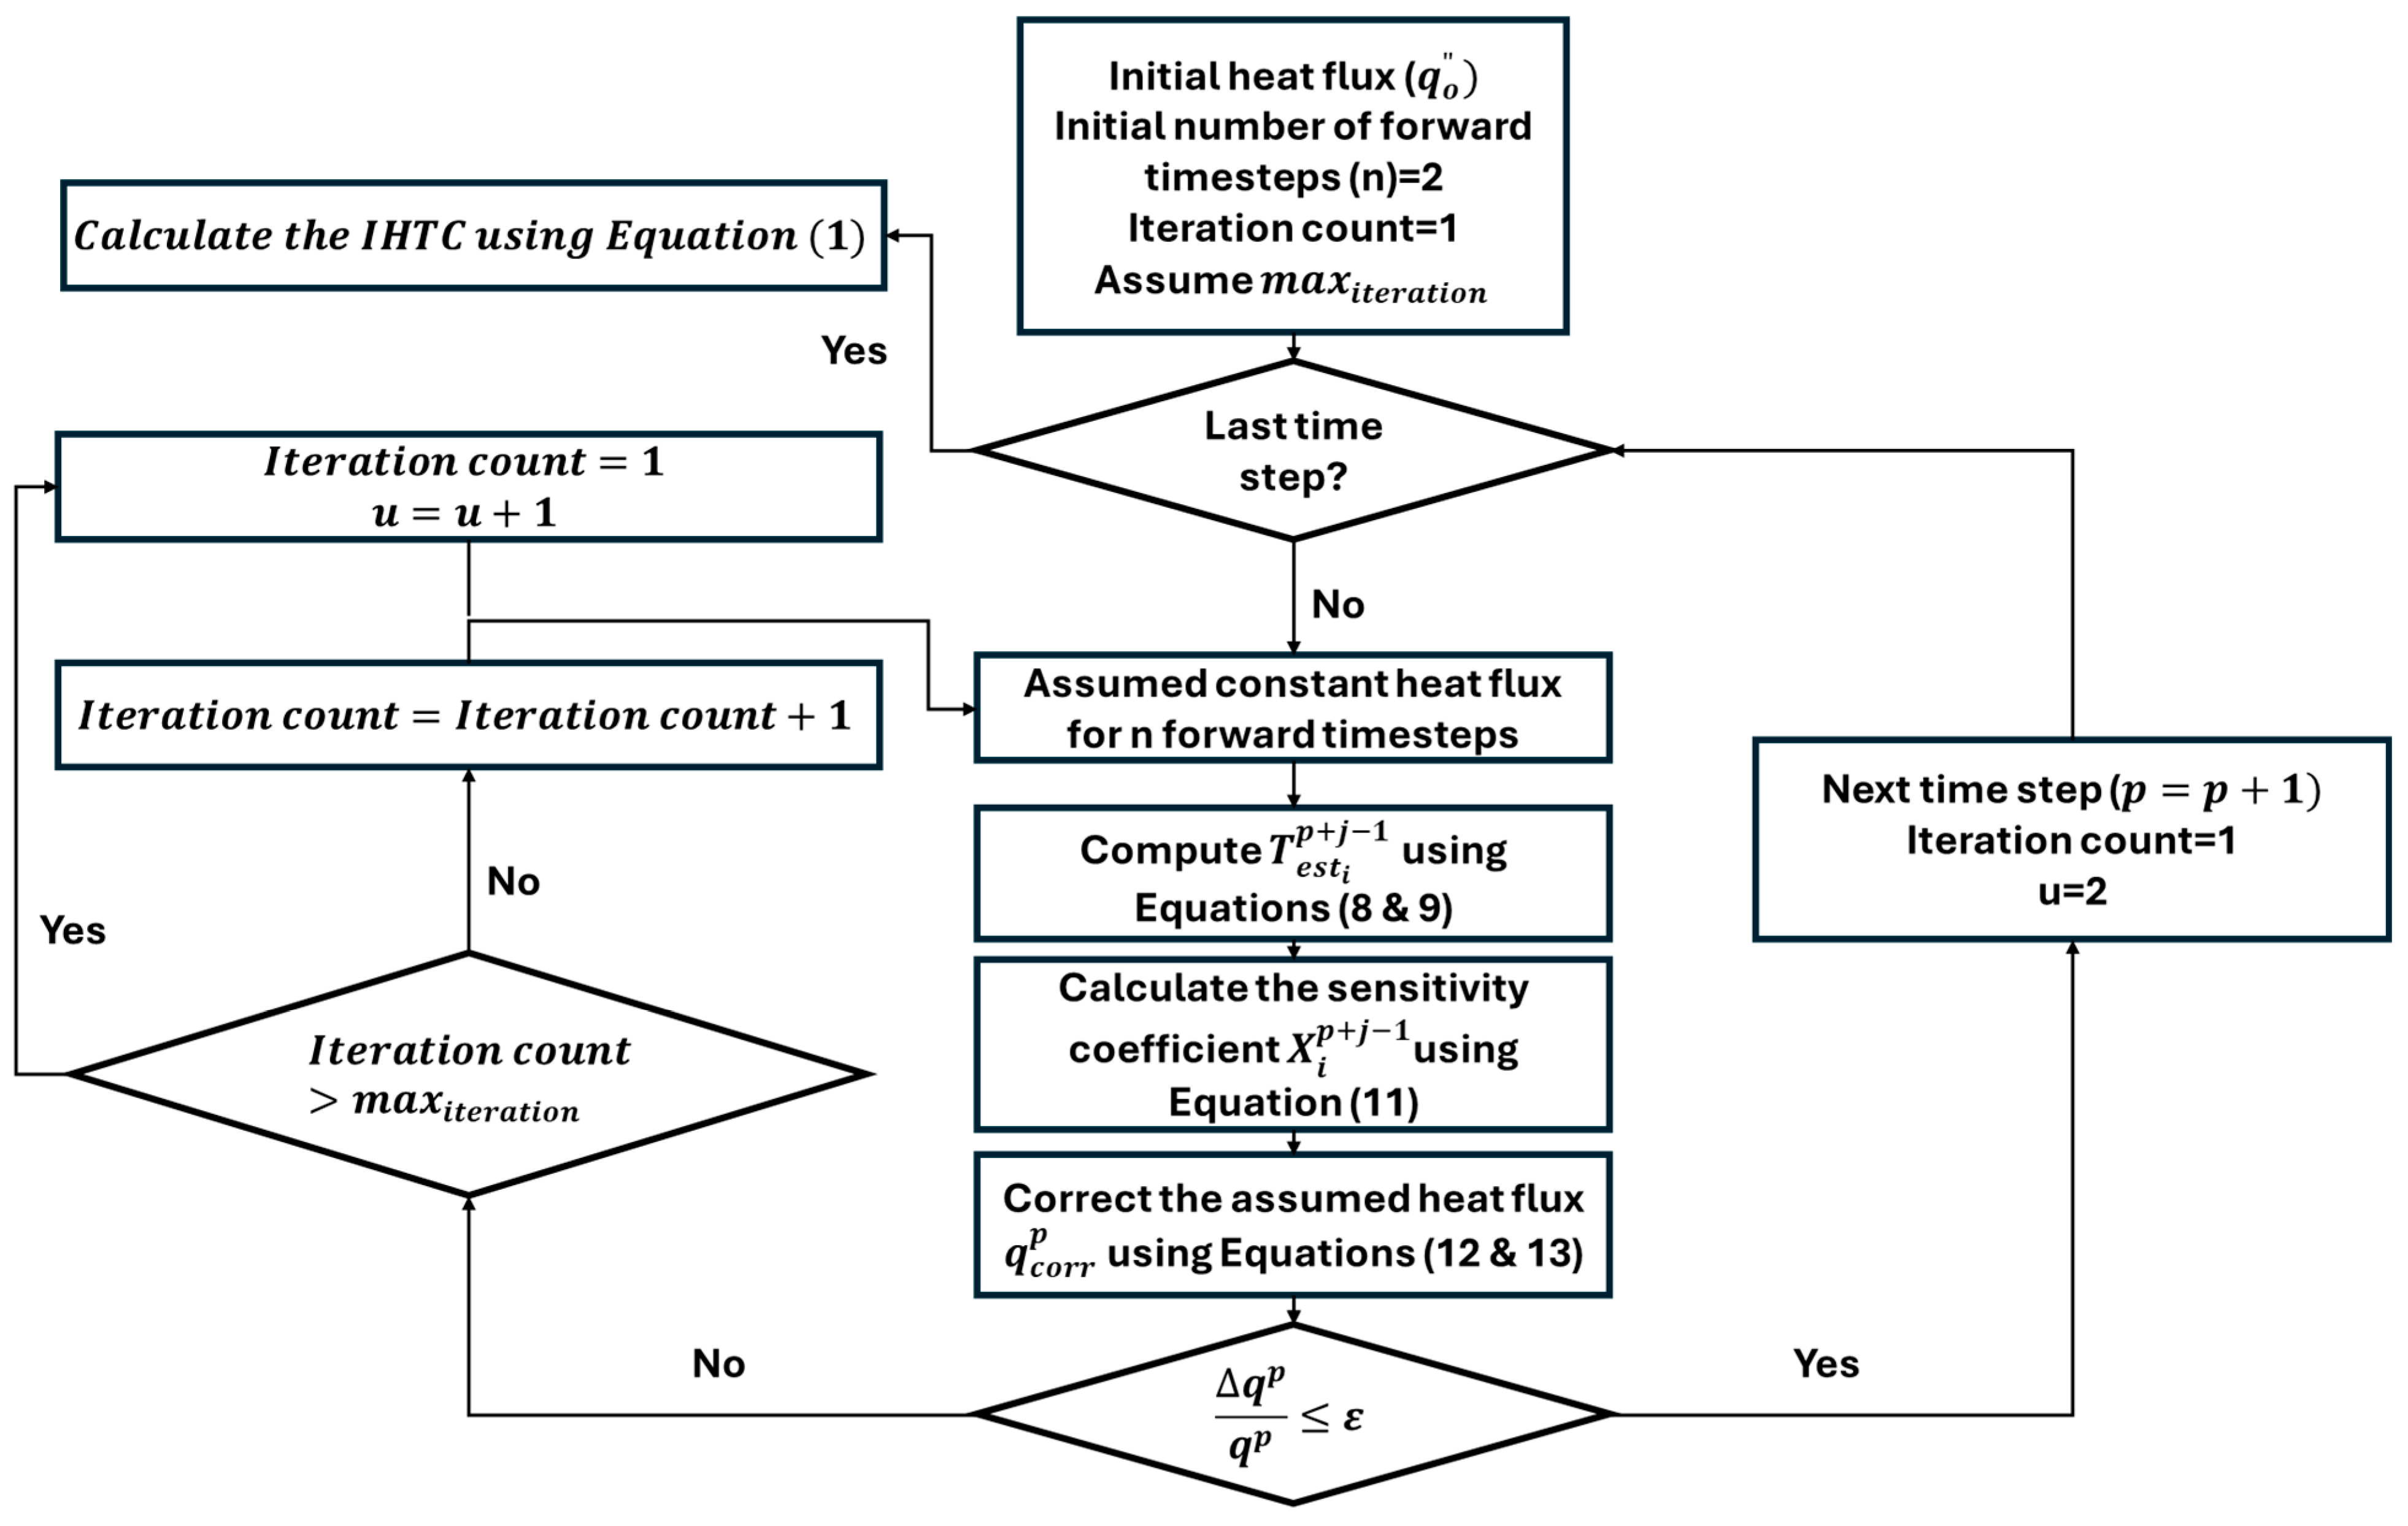
To estimate the interfacial heat flux q ( t ) , Beck’s function specification method was implemented, which is shown in Figure 5. Initially, a trial value for heat flux q was assumed and held constant for 2 future time steps ( u   =   2 ) . Using this assumed heat flux and the known initial temperature distribution at p   =   0 , the temperature field at the subsequent time steps was computed.
A small perturbation ε q was then added to the heat flux, and a second temperature distribution was computed. The sensitivity coefficient X i was evaluated at each thermocouple using Equation (11) based on [43]:
X i p + j 1   =   T q   =   T e s t i p + j 1 q + ε q T e s t i p + j 1 q ε q
The difference between the estimated and measured temperatures was used to correct the heat flux using Equation (12) based on [43]:
q p   =   i   =   1 n j   =   1 u T m e a s u r e d i p + j 1 T e s t i p + j 1 X i p + j 1 i   =   1 n j   =   1 u X i p + j 1 2
The corrected heat flux was then updated using Equation (13) based on [43]:
q c o r r p   =   q p + q p
In these equations, T e s t i   a n d   T m e a s u r e d i represent the estimated and measured temperatures at the sensor locations, respectively. The corrected heat flux was then used as the new initial guess for the next iteration. This process was repeated until the convergence criterion was satisfied:
q p q p ε
If the convergence criterion is not met after a predefined number of iterations, the number of future time steps used in the forward solution is incremented by one, and the inverse procedure is repeated.

4.2. Thermal Modeling of the Casting

In the present analysis, the casting was modeled as a lumped thermal system. The initial temperature of the casting was assumed to be equal to the temperature of the molten metal inside the shot sleeve immediately prior to injection. This assumption is considered reasonable given the high injection velocity characteristic of the HPDC process, which minimizes thermal gradients within the molten metal during die filling.
The subsequent temperature evolution in each casting section was analyzed using the lumped capacitance model, assuming uniform internal temperature within each step. This lumped-mass temperature is subsequently used as T c s in Equation (1) for estimating the interfacial heat transfer coefficient using Equation (16) [23].
q t + ρ L x d f s d T m e t a l d T m e t a l d t = ρ C x d T m e t a l d t
By applying the finite difference method
T m e t a l p + 1 = T m e t a l p + q ( t ) t ρ x C L d f s d T m e t a l
where
  • T m e t a l p + 1 , T m e t a l p : casting temperature at the current and next time steps, respectively.
  • q ( t ) : transient heat flux from the casting to the die at time t [ W / m 2 ] .
  • t : time increment [s].
  • ρ : density of the metal [ k g / m 3 ].
  • C : specific heat capacity of the metal [ J / k g · K ].
  • L : Latent heat of fusion [ J / k g ].
  • f s : is the solid fraction.
  • x : is half of the thickness of the casting.
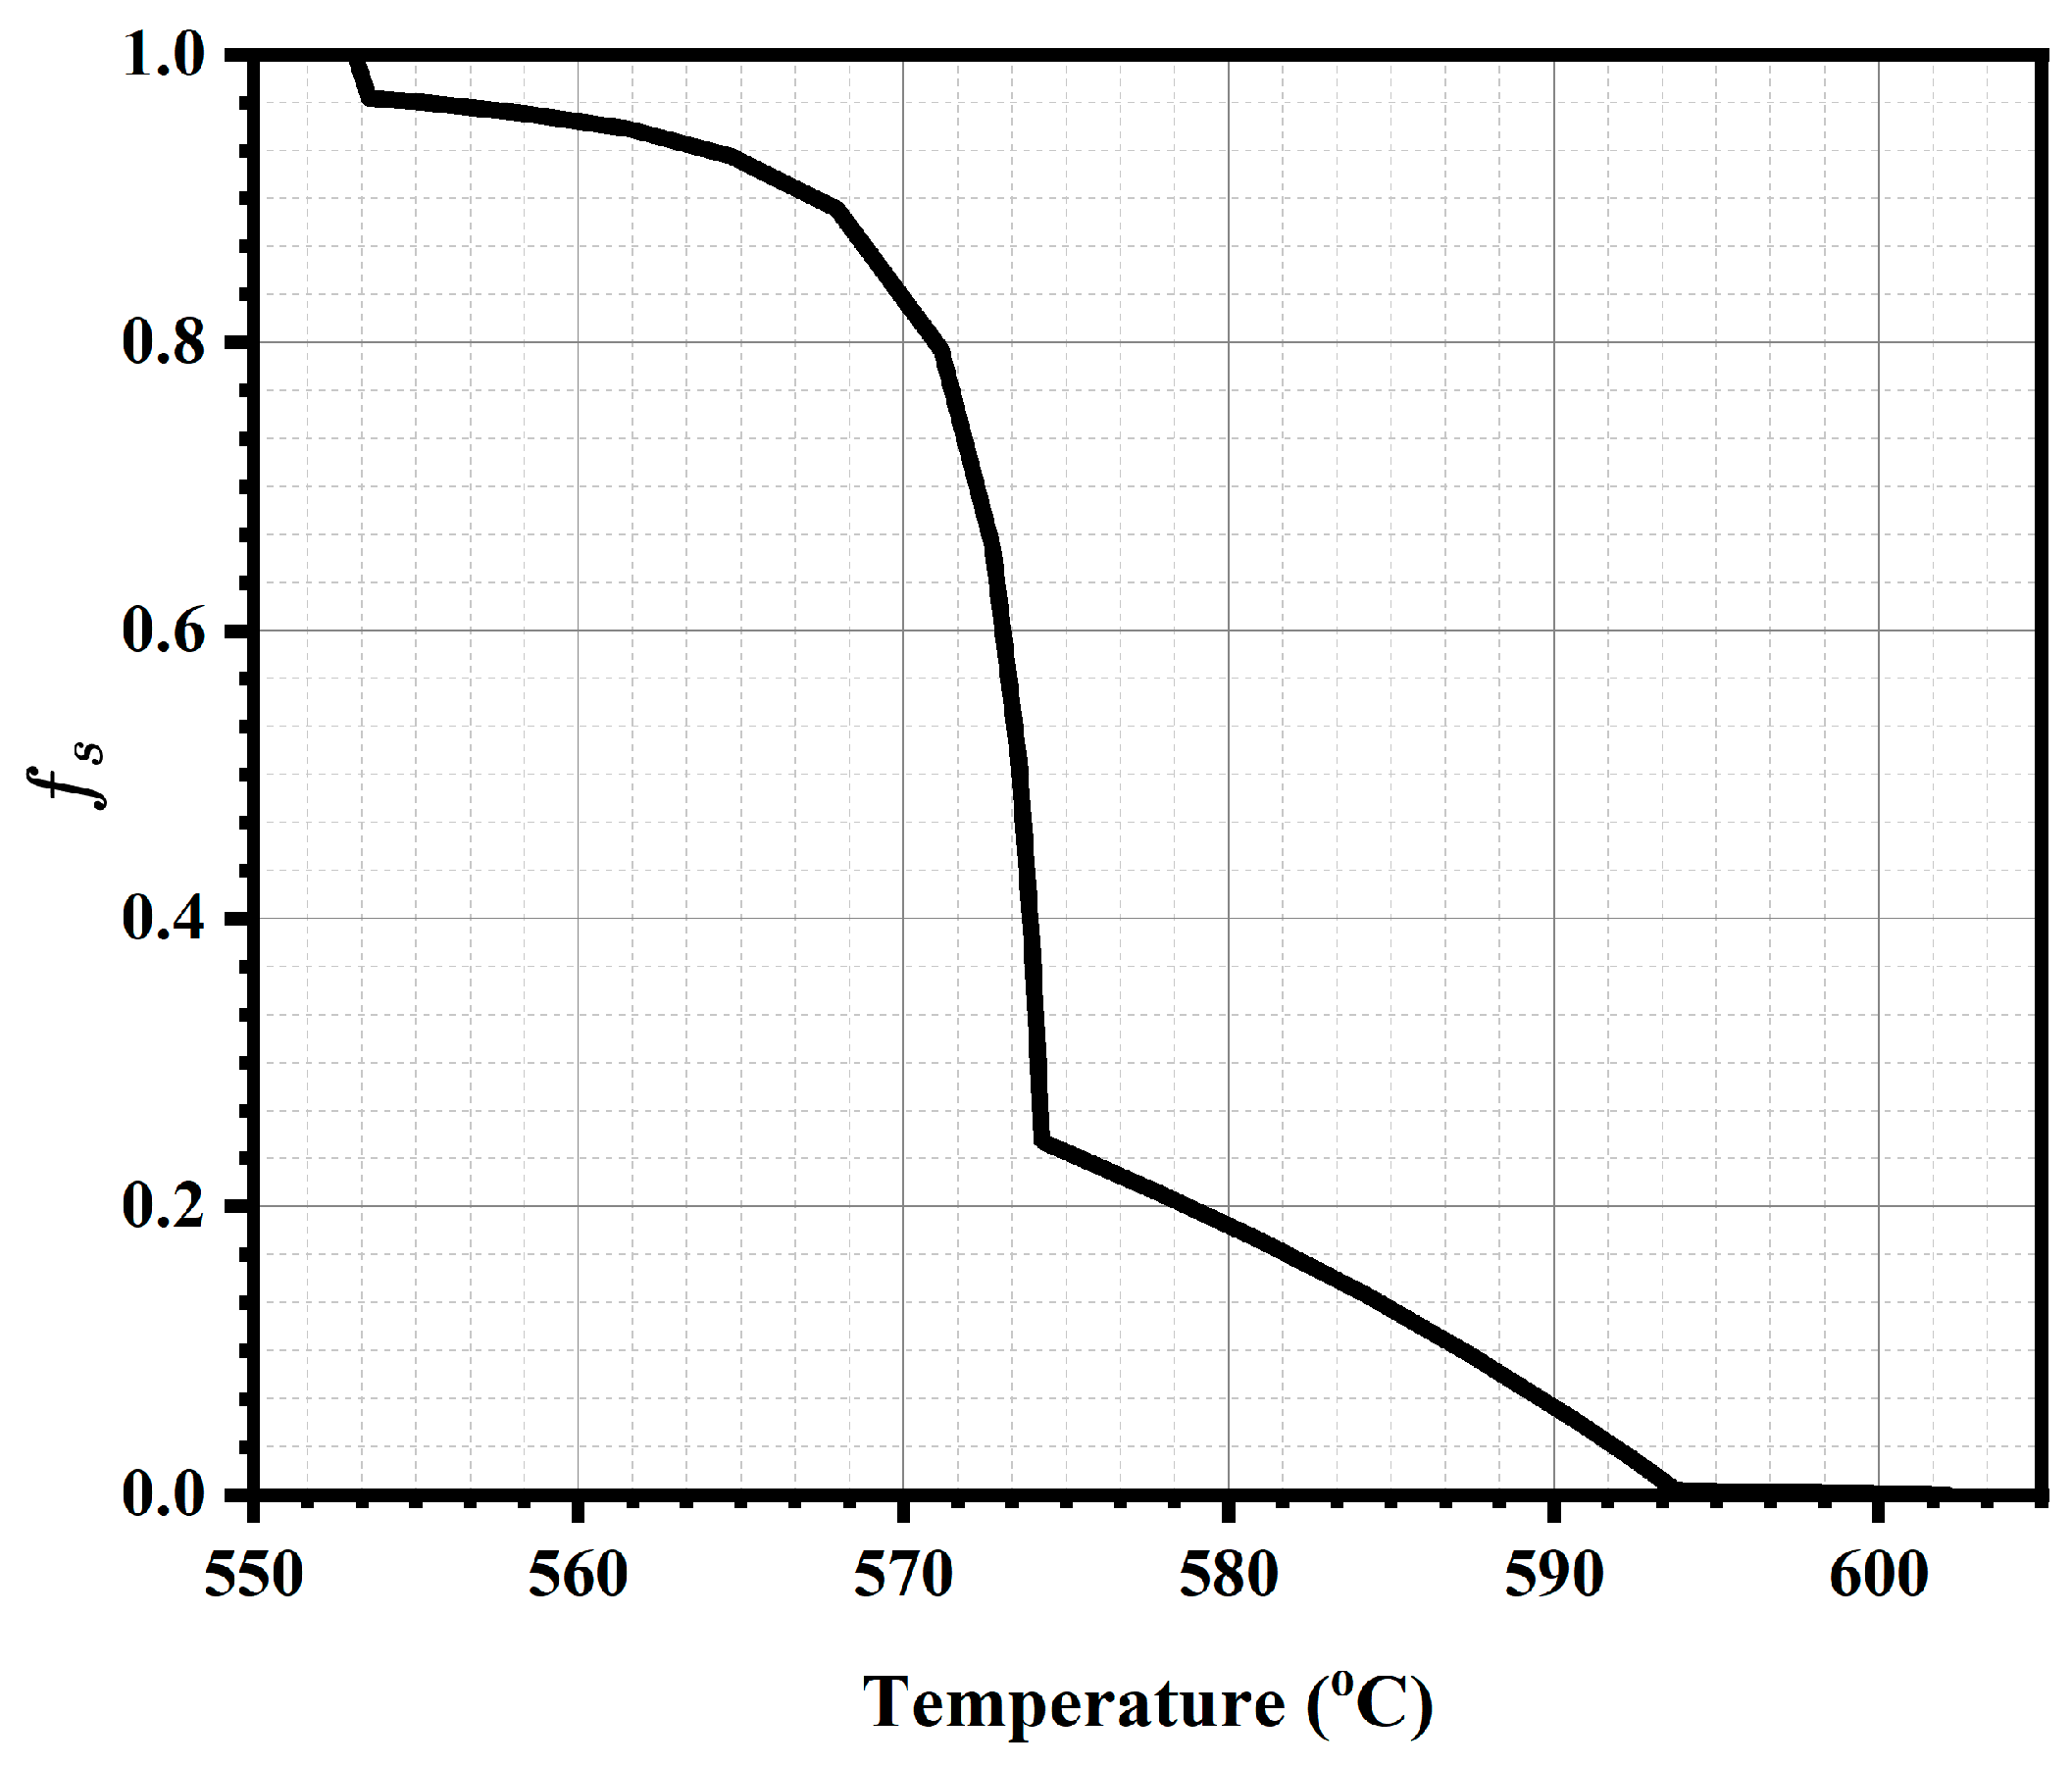
The fraction solid curve can be determined using the Scheil–Gulliver model, and for the A365 alloy, the corresponding relationship is presented in Figure 6, obtained using the PanAl2025_TH+MB database in Pandat 2025 software (Computherm, LLC, Madison, WI, USA).
To assess the validity of the lumped system assumption, Equation (17) was applied to the most conservative case. This case corresponds to the maximum casting thickness of 3 mm in the bottom section, with the characteristic length taken as half the thickness (1.5 mm). The thermal conductivity of the casting was assumed to be 150 W/m·K, while the Biot number was fixed at its upper limit of 0.1. Based on these parameters, the corresponding peak IHTC was determined to be approximately 10,000 W/m2·K. If this calculated peak IHTC exceeds the experimentally estimated value, the lumped system approximation can be considered valid.
B i = I H T C × x k

5. Mesh Independence Study

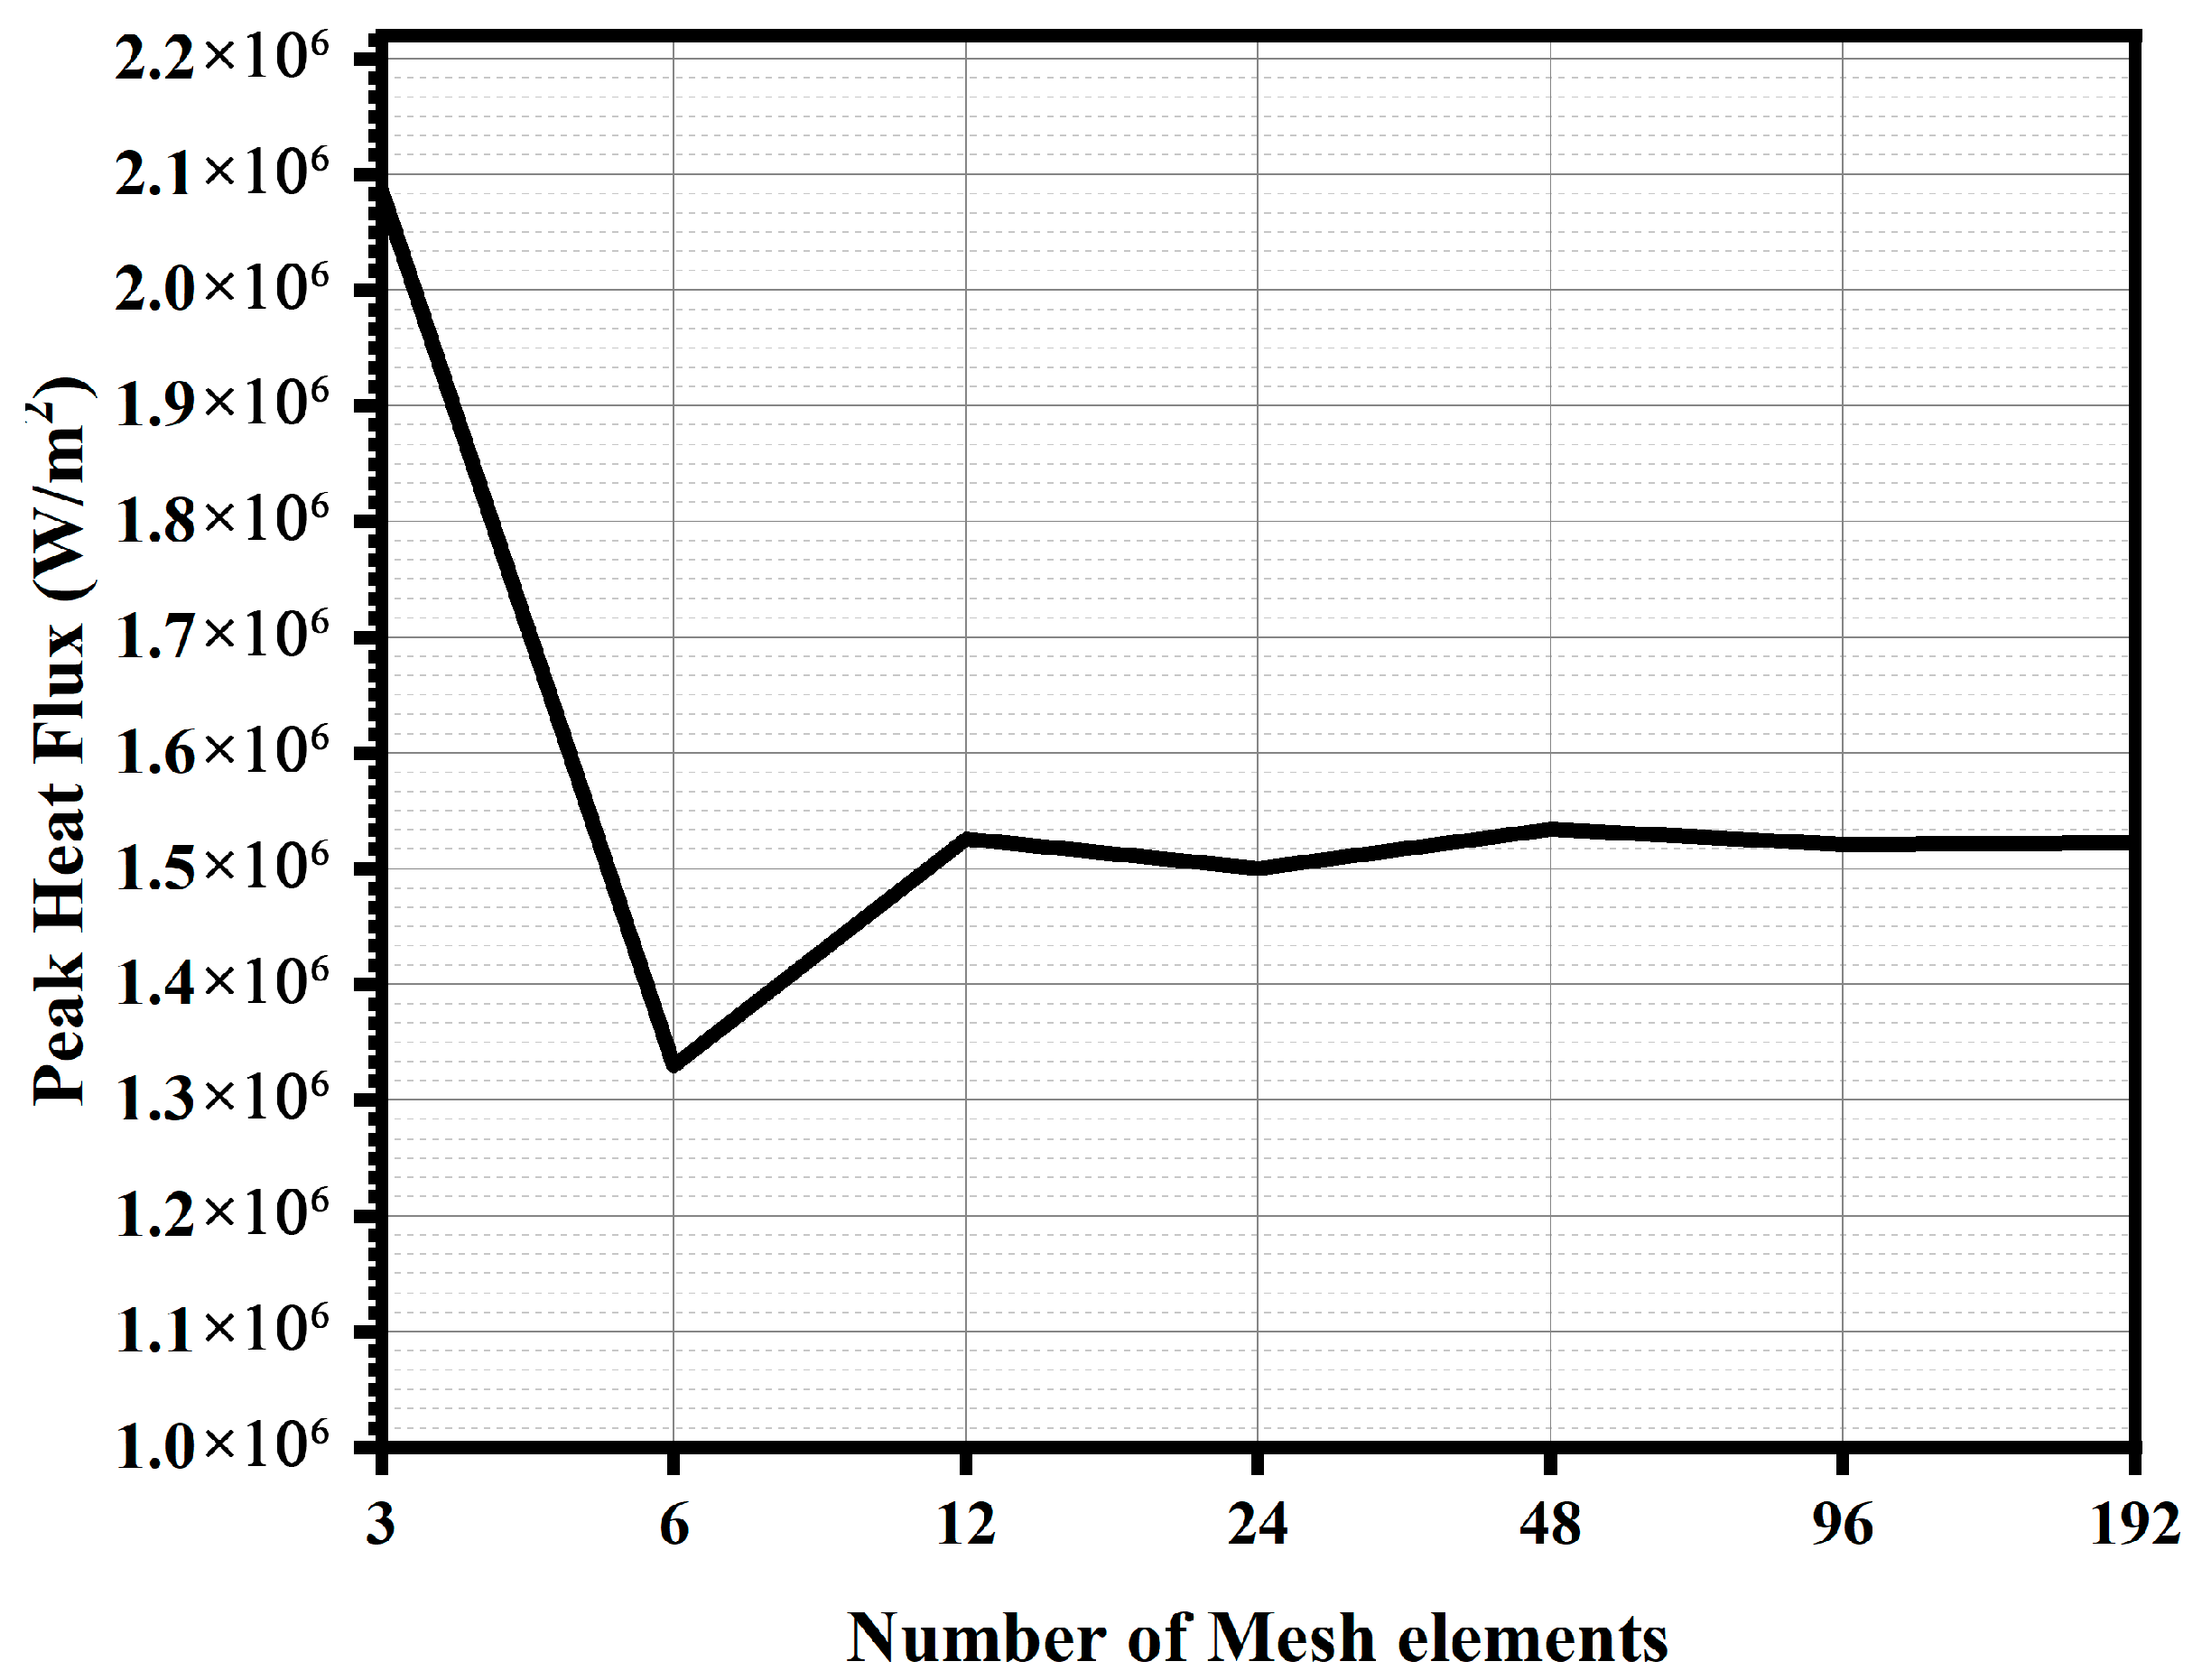
A grid independence study was conducted to assess the sensitivity of the Inverse Heat Transfer Algorithm (IHTA) to the spatial discretization of the computational domain. The analysis was performed for the middle section of the HCDC experiment, where the peak heat flux is most pronounced. Simulations were carried out using progressively refined meshes, and the resulting peak heat flux values were compared as shown in Figure 7. The peak heat flux obtained using 48 elements was 1.534 × 10⁶ W/m2, while a further refinement to a denser mesh yielded a peak value of 1.522 × 10⁶ W/m2. This corresponds to a change of only about 0.79%, indicating that the solution had effectively reached mesh independence. Based on this observation, the mesh with 48 elements was selected for all subsequent inverse analyses, as it provided a satisfactory balance between computational efficiency and accuracy.

6. Forward Simulation Validation

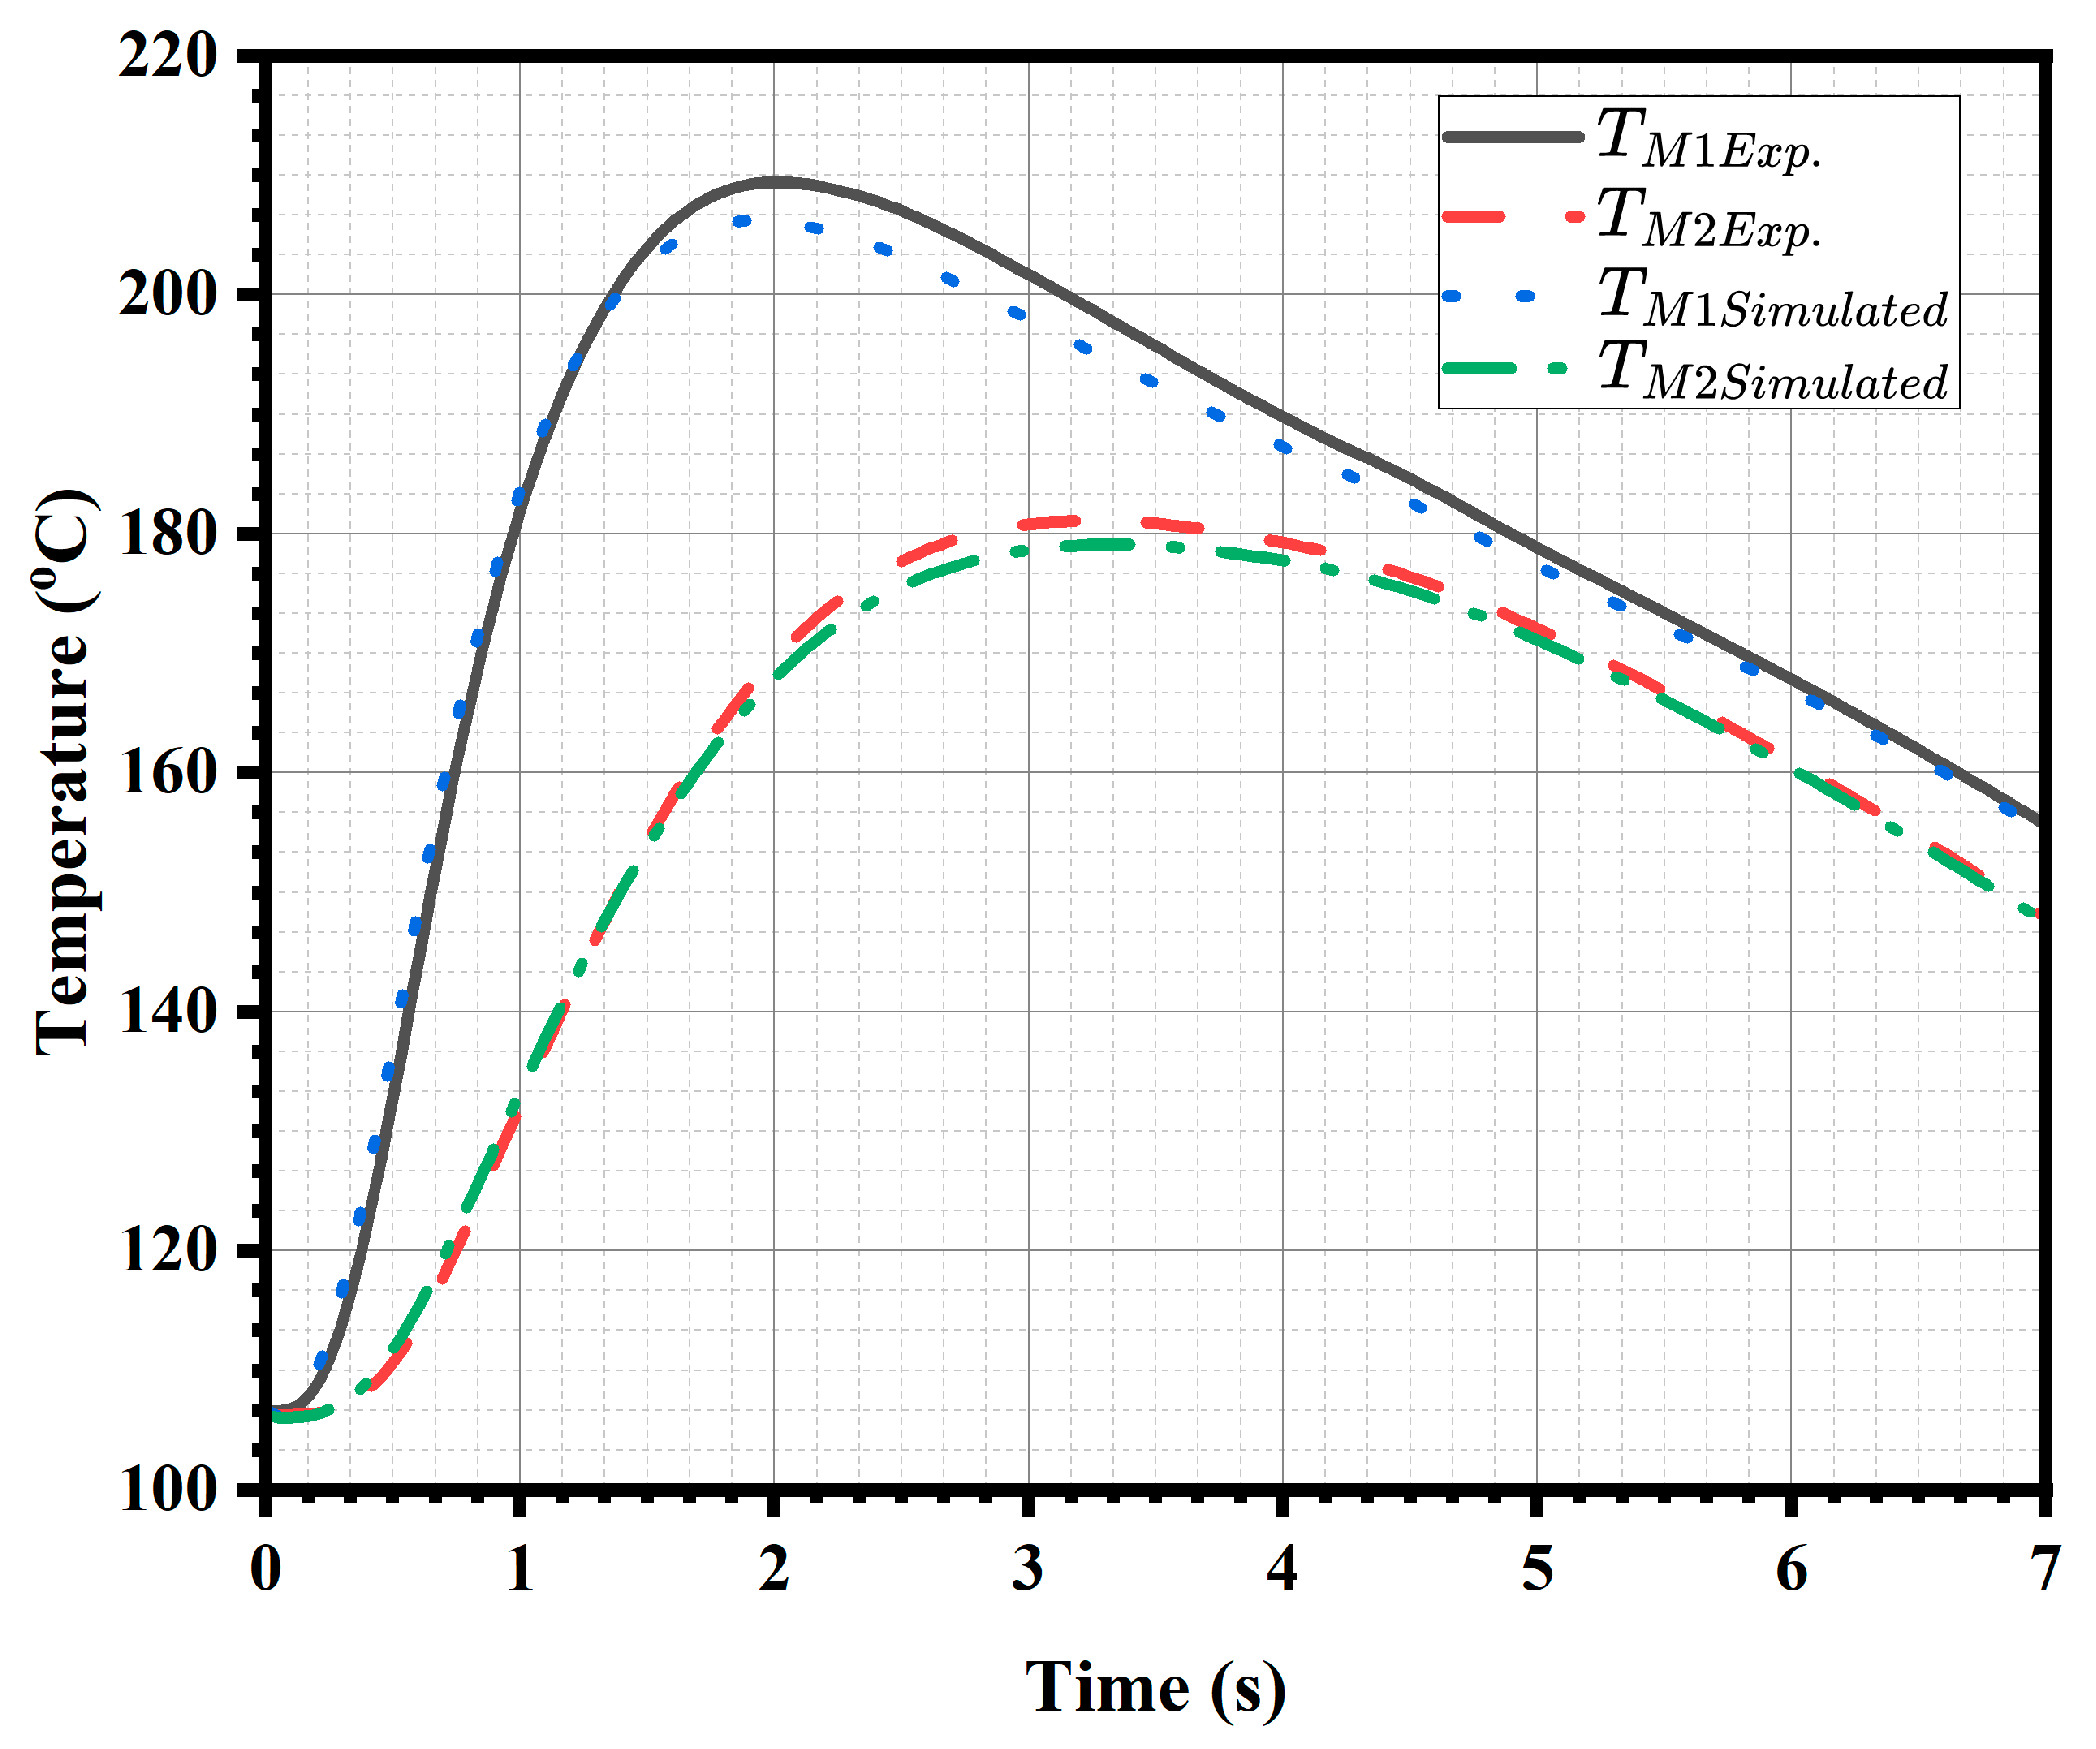
To validate the accuracy of the interfacial heat flux estimated via the IHTA, a forward transient thermal simulation was performed using the ANSYS transient heat conduction solver. In this simulation, the heat flux obtained from the inverse solution for the middle section was applied as a boundary condition at the die–metal interface, while the temperature measured by the thermocouple at the third location was imposed as the opposing boundary condition. The experimental thermocouple temperature data were lightly smoothed using the Savitzky–Golay method to reduce high-frequency noise while preserving the physical temperature trends. Figure 8 illustrates a comparison between the temperature histories predicted at the first and second thermocouple locations by the forward simulation ( T M 1   S i m u l a t e d , T M 2   S i m u l a t e d ) and those measured experimentally ( T M 1   E x p . , T M 2   E x p . ). The results demonstrate excellent agreement, with a maximum absolute deviation of only 4.3 °C and a corresponding relative deviation of approximately 3.12%, thereby validating the accuracy and reliability of the IHTA in capturing the transient thermal behavior of the die during casting.

7. Experimental Results: HCDC vs. Industrial HPDC

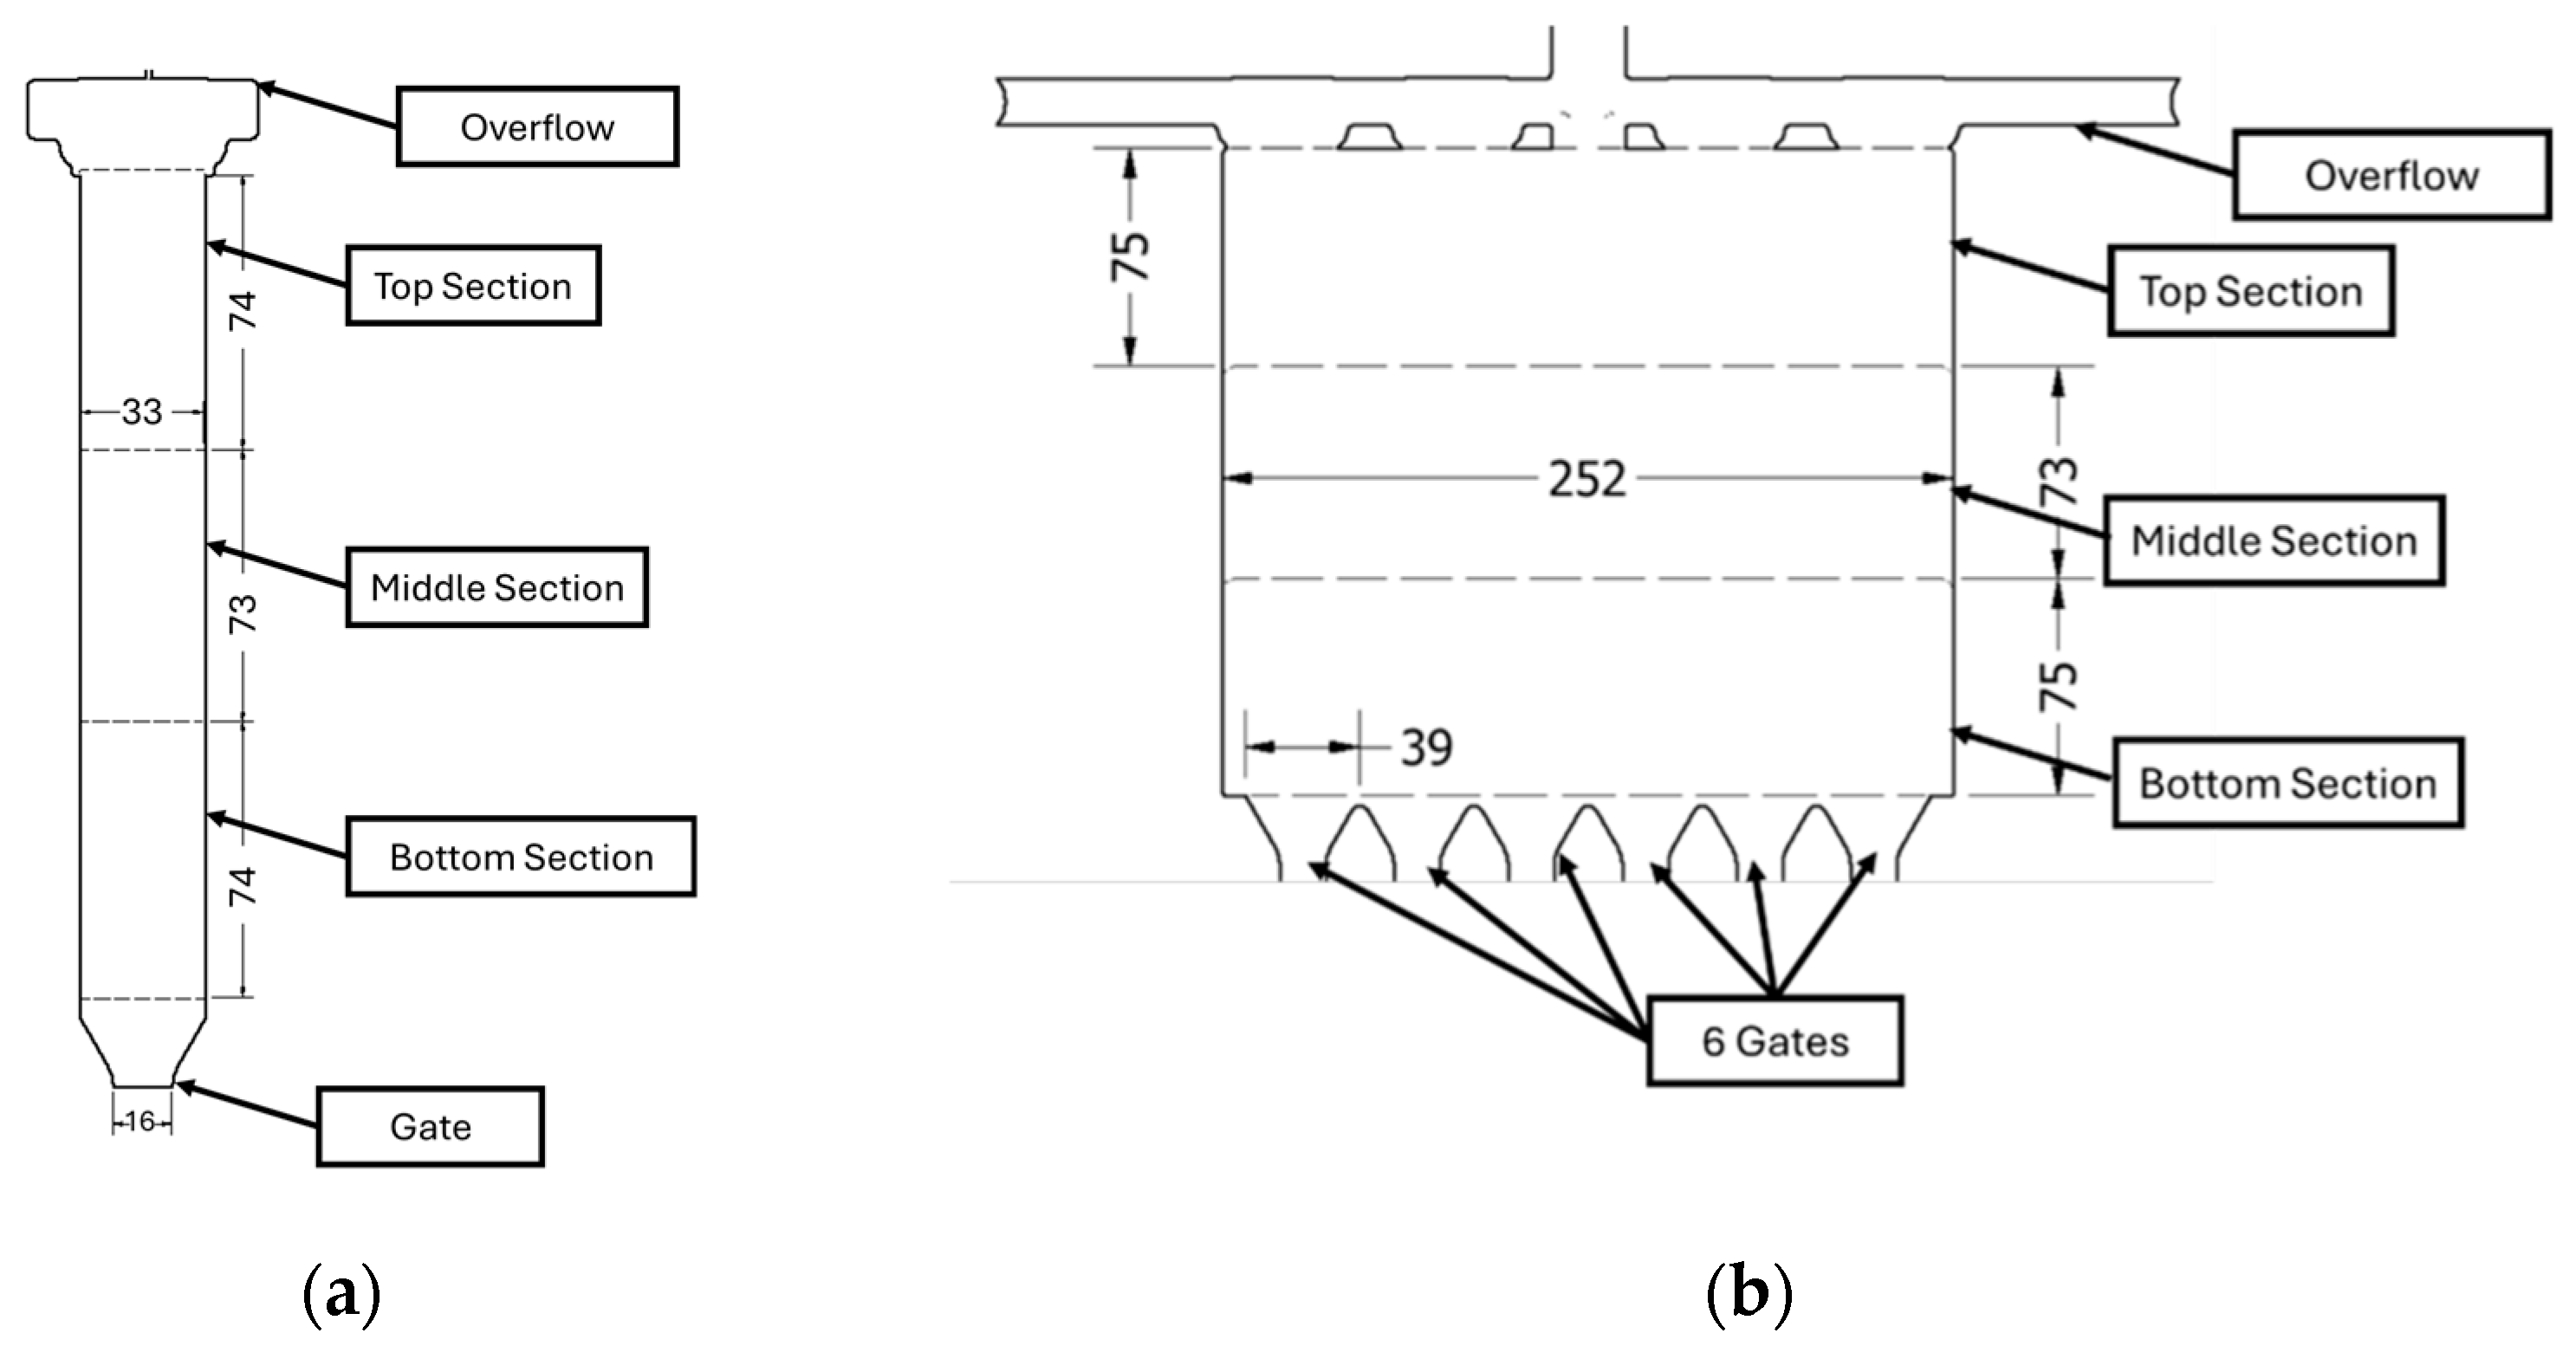
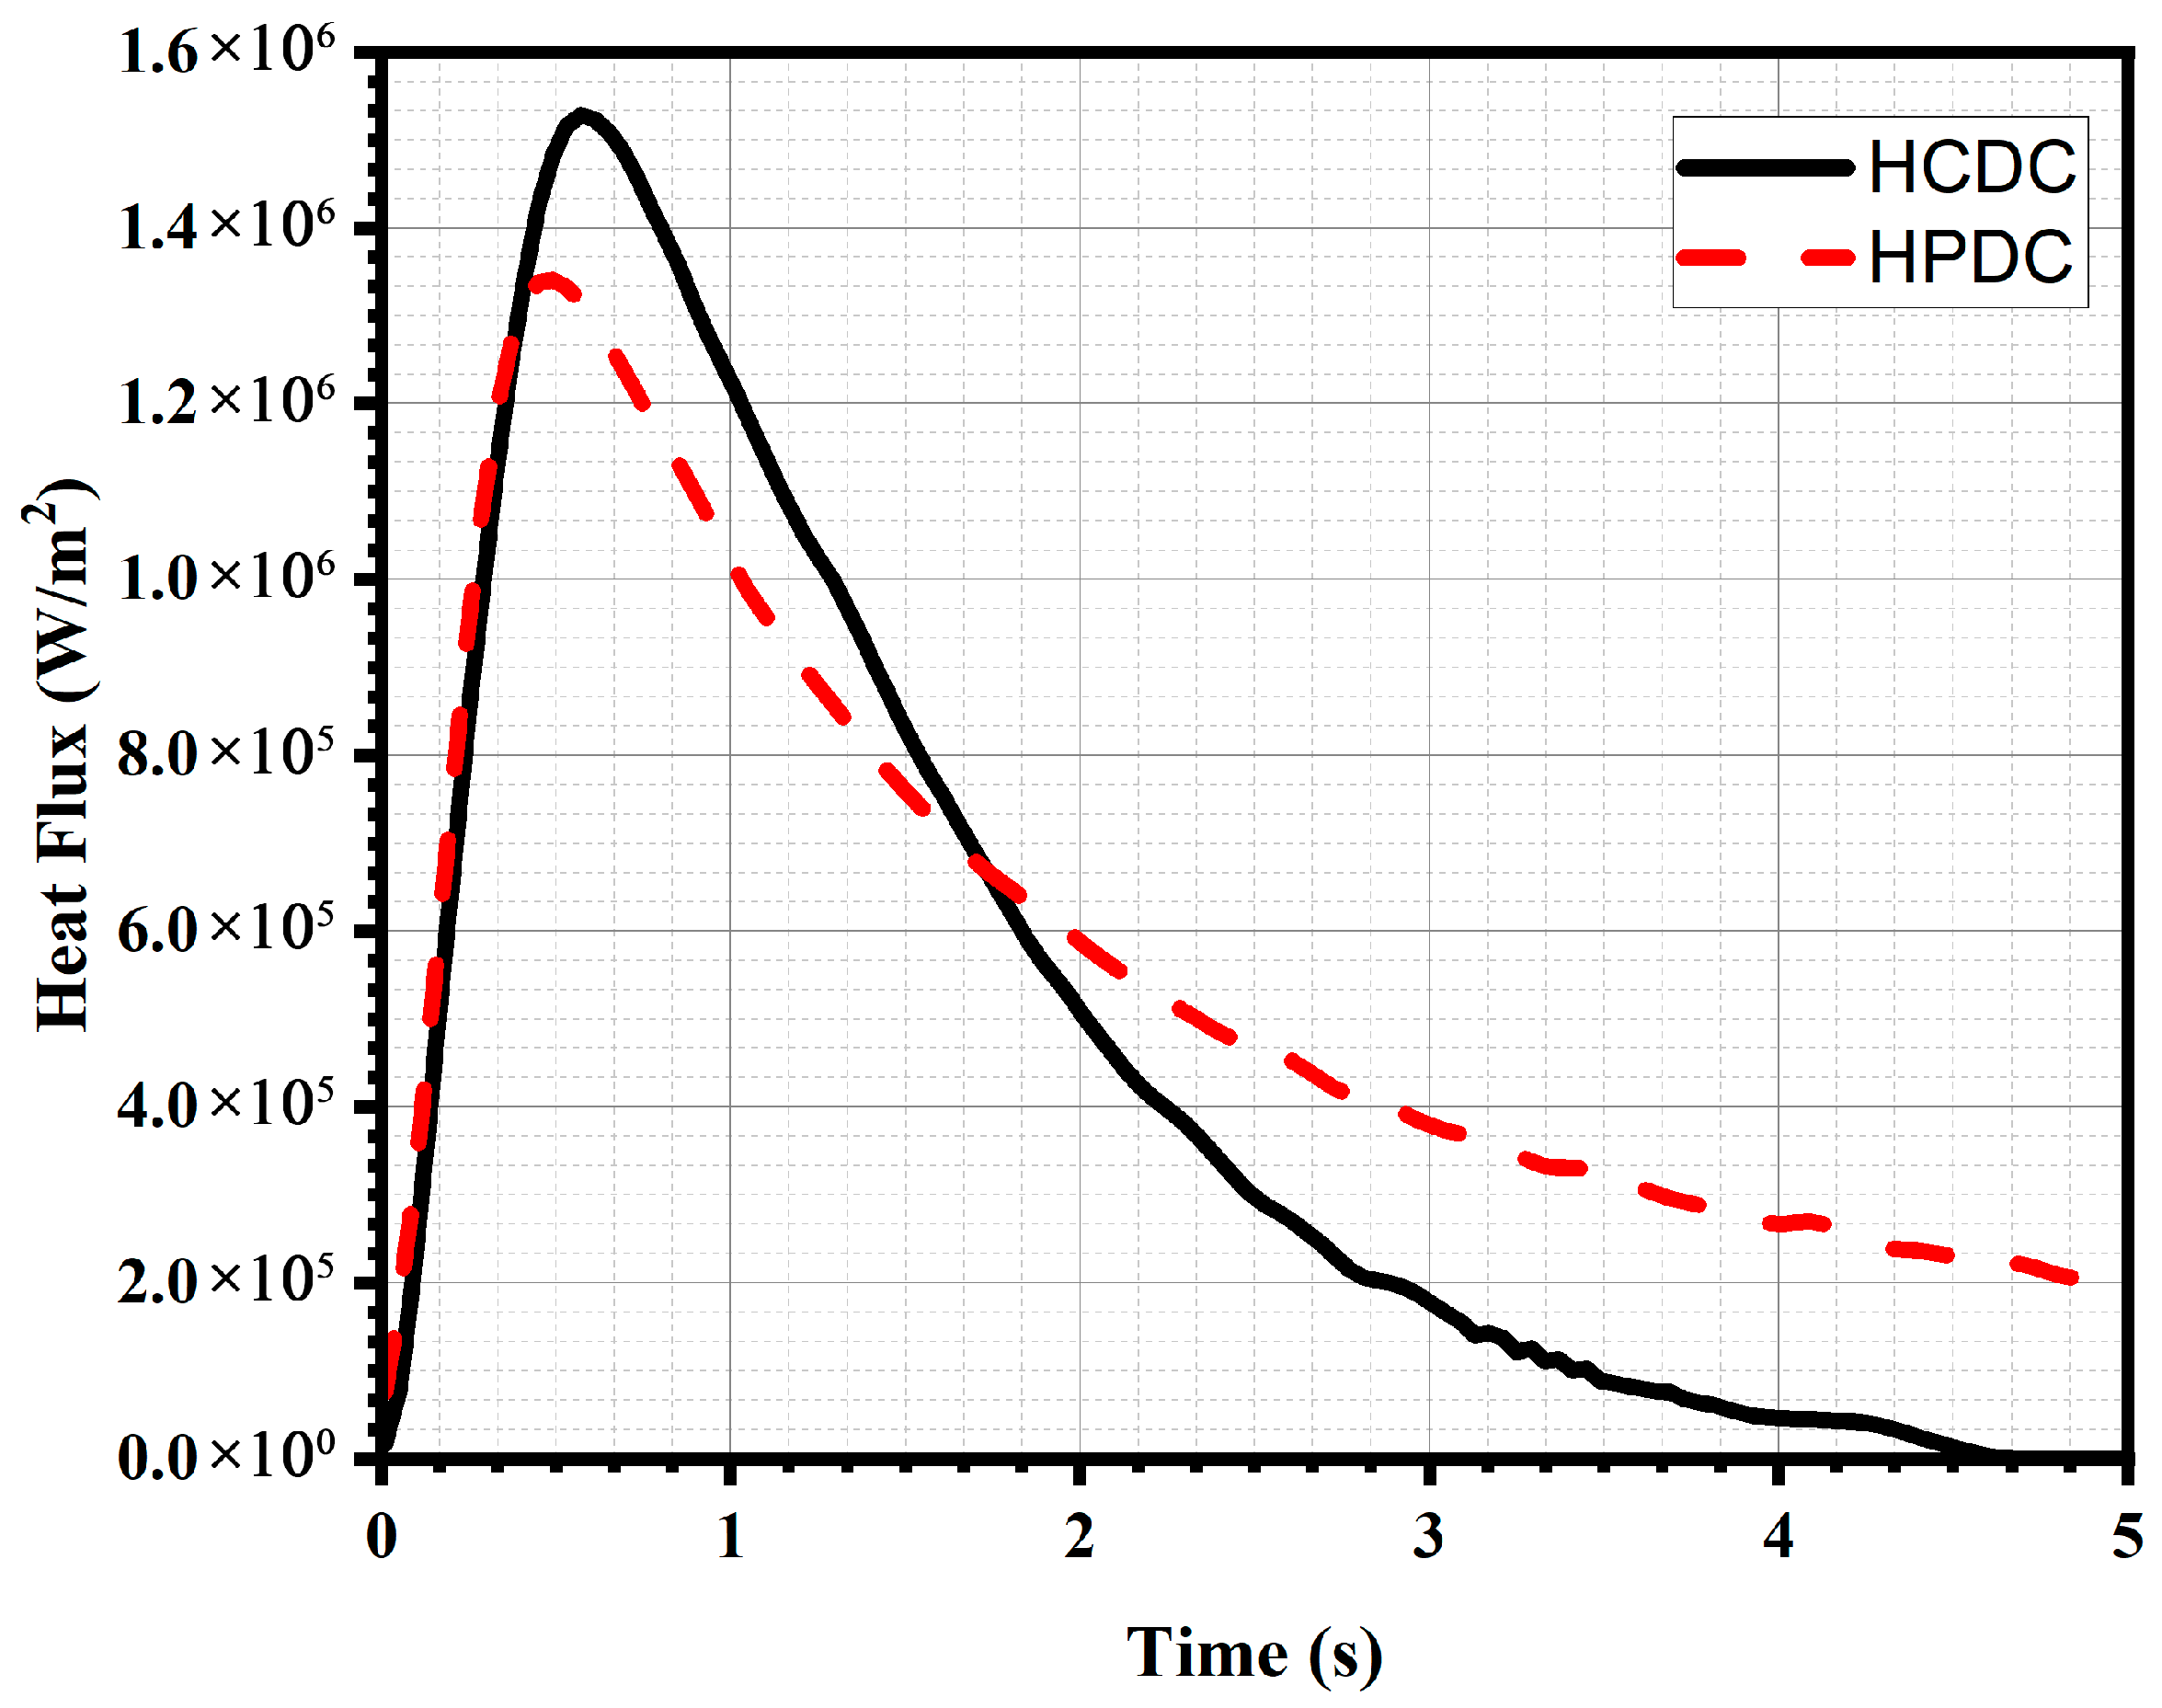
To validate the experimental test setup, a real HPDC trial was conducted at CanmetMATERIALS (Hamilton, ON, Canada) using the A365 aluminum alloy poured at 700 °C and cooled by oil, employing a cavity with the same overall geometrical shape as the HCDC configuration. The only distinction is that the HCDC cavity has a single gate, whereas the HPDC die features six gates and a total width approximately six times larger, as shown in Figure 9. Figure 10 presents a comparison between the interfacial heat flux profiles estimated by the IHTA for both HCDC and HPDC in the middle section. In both cases, the heat flux exhibits a similar trend: it rises rapidly to a peak value as the molten metal fills the cavity and then decreases as shrinkage occurs and an interfacial gap form. The key characteristics of these profiles are the peak magnitude and the curve width, the latter quantified using the full width at half maximum (FWHM), defined as the time interval during which the heat flux remains greater than or equal to half of its peak value. The peak heat flux for HCDC is 1.528 × 10⁶ W/m2, compared to 1.341 × 10⁶ W/m2 for HPDC, representing a deviation of approximately 13.93%. Similarly, the FWHM is 1.365 s for HCDC and 1.545 s for HPDC, corresponding to a deviation of about 11.64%.

8. Results and Discussion

8.1. Die Temperature vs. Time

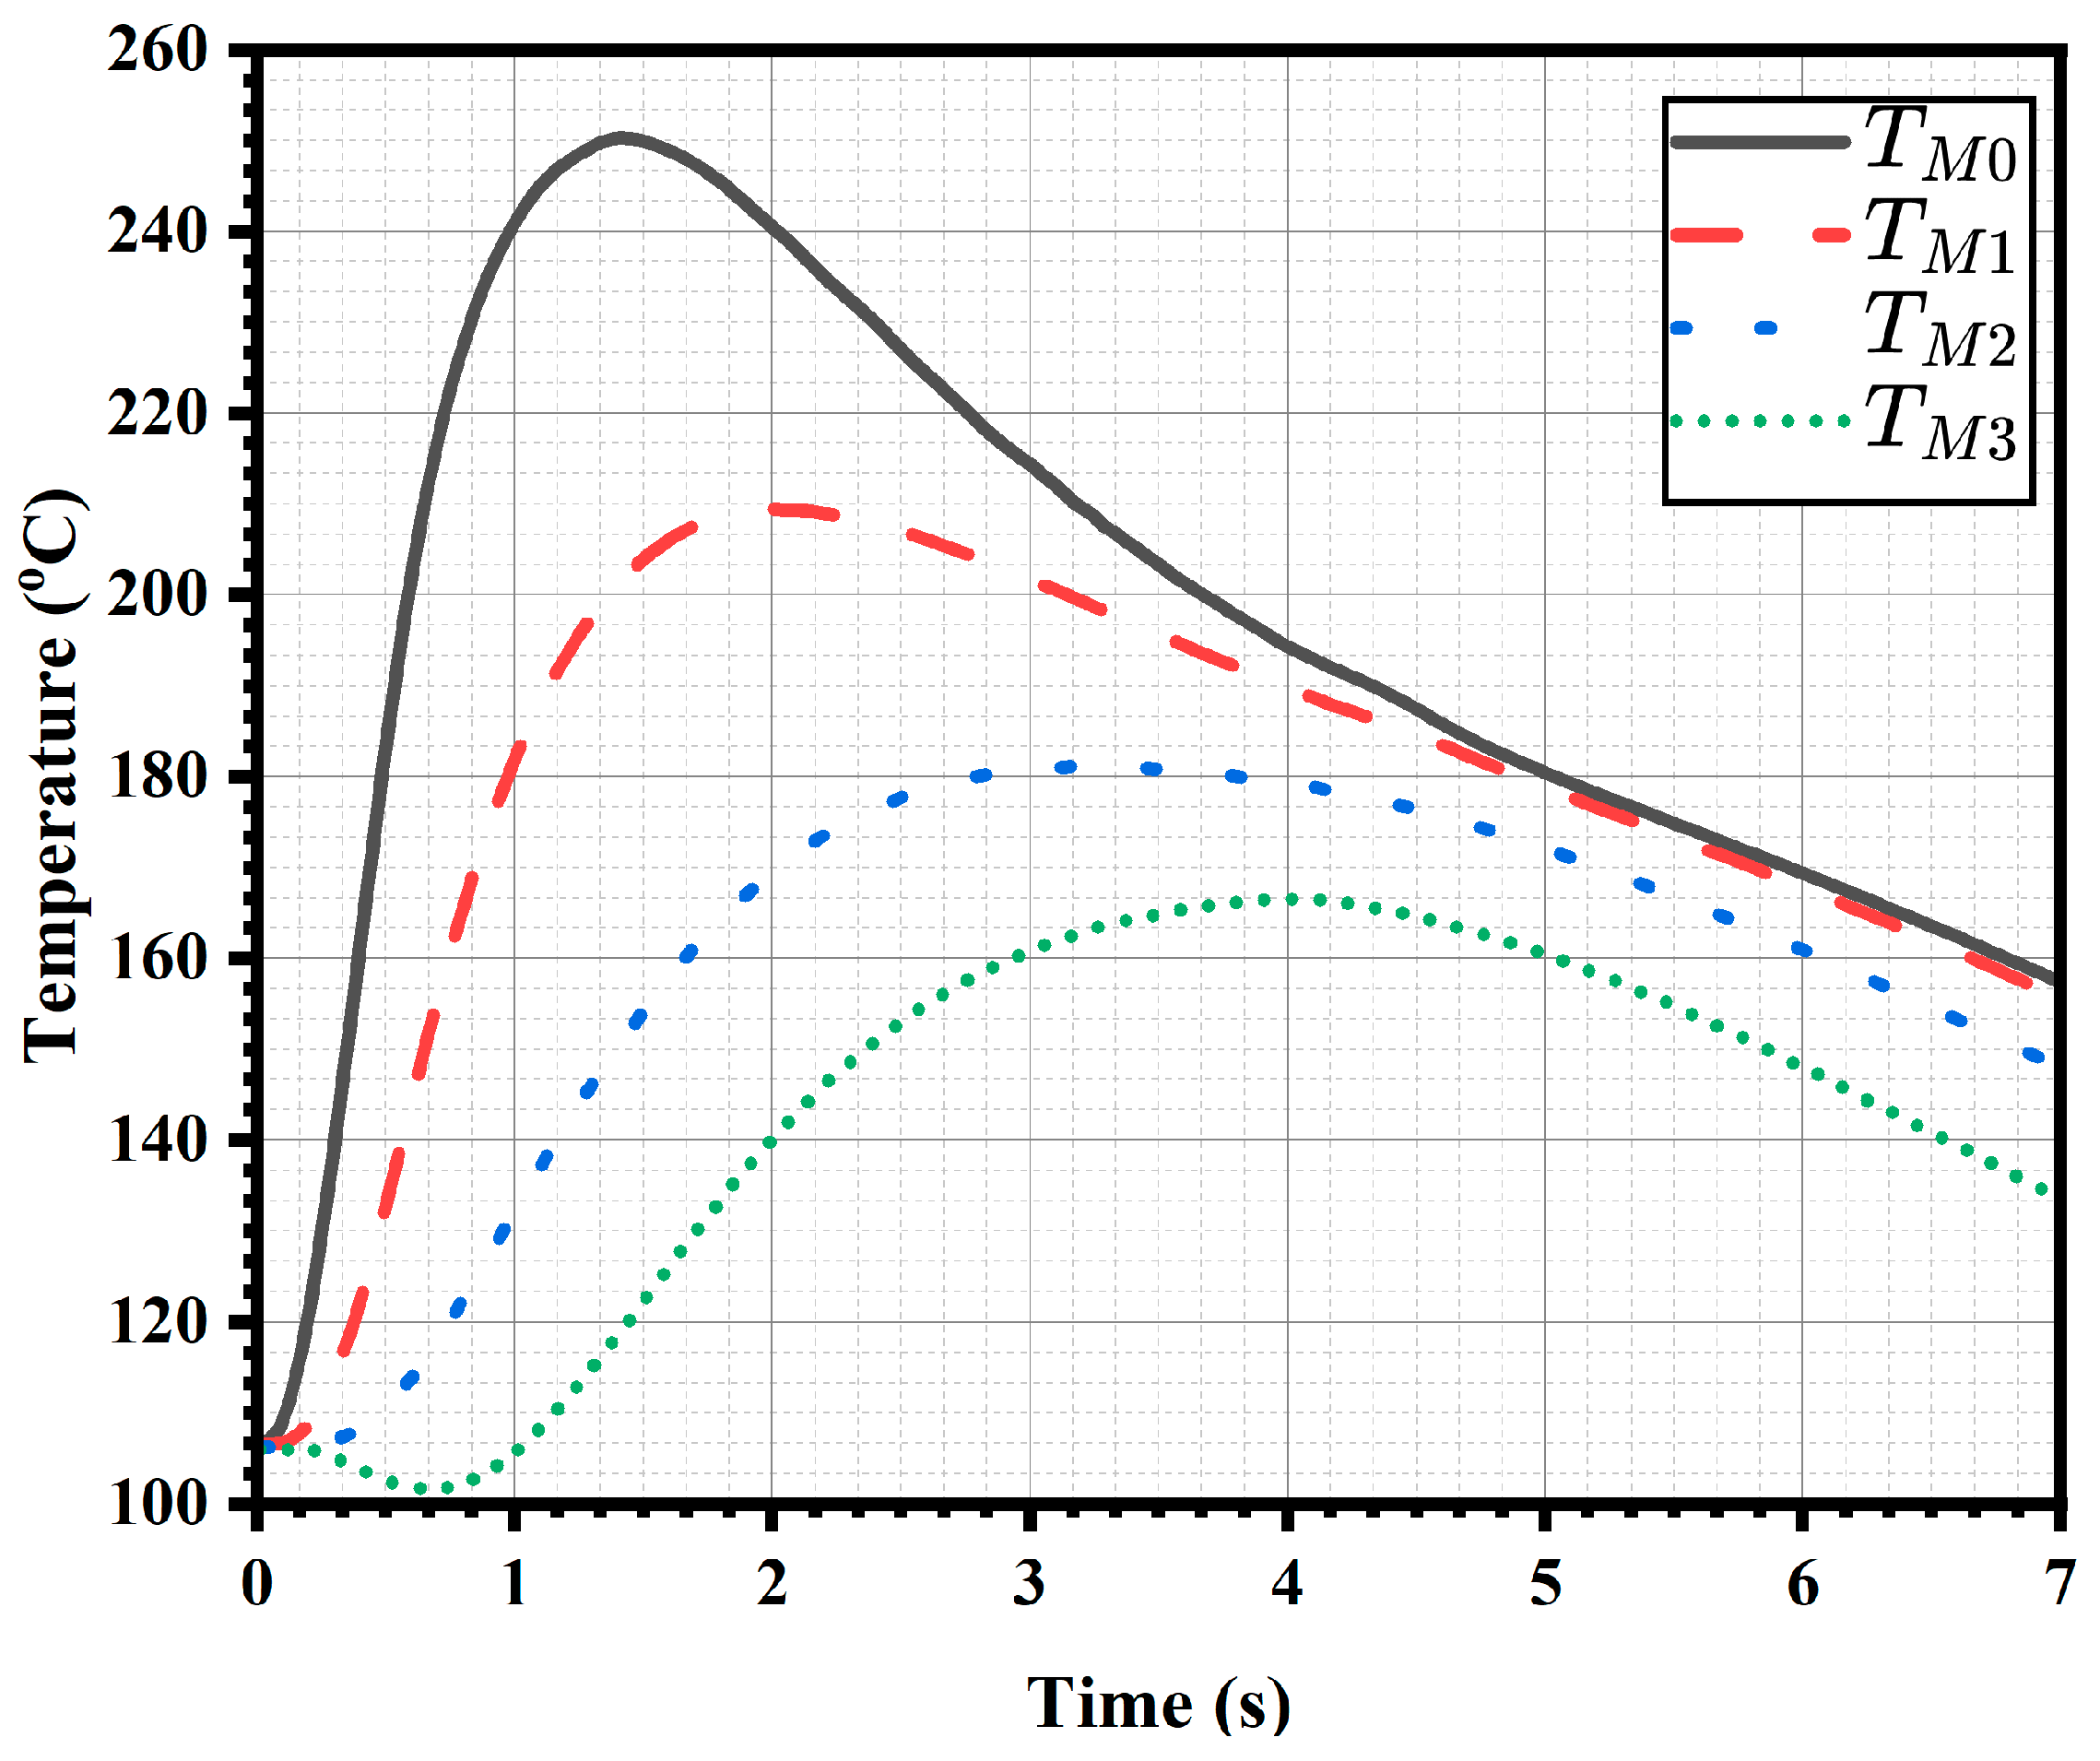
Figure 11 presents the temperature–time profiles at the first, second, and third thermocouple locations in the middle section ( T M 1 , T M 2 , T M 3 ), along with the die interface temperature ( T M 0 ) obtained via the IHTA for the middle section, under a cooling water flow rate of 80 L/min. The results indicate that the maximum die temperature did not exceed 260 °C throughout the cycle. The slight temperature drop observed at the beginning corresponds to the initiation of cooling water flow.

8.2. Heat Flux vs. Time

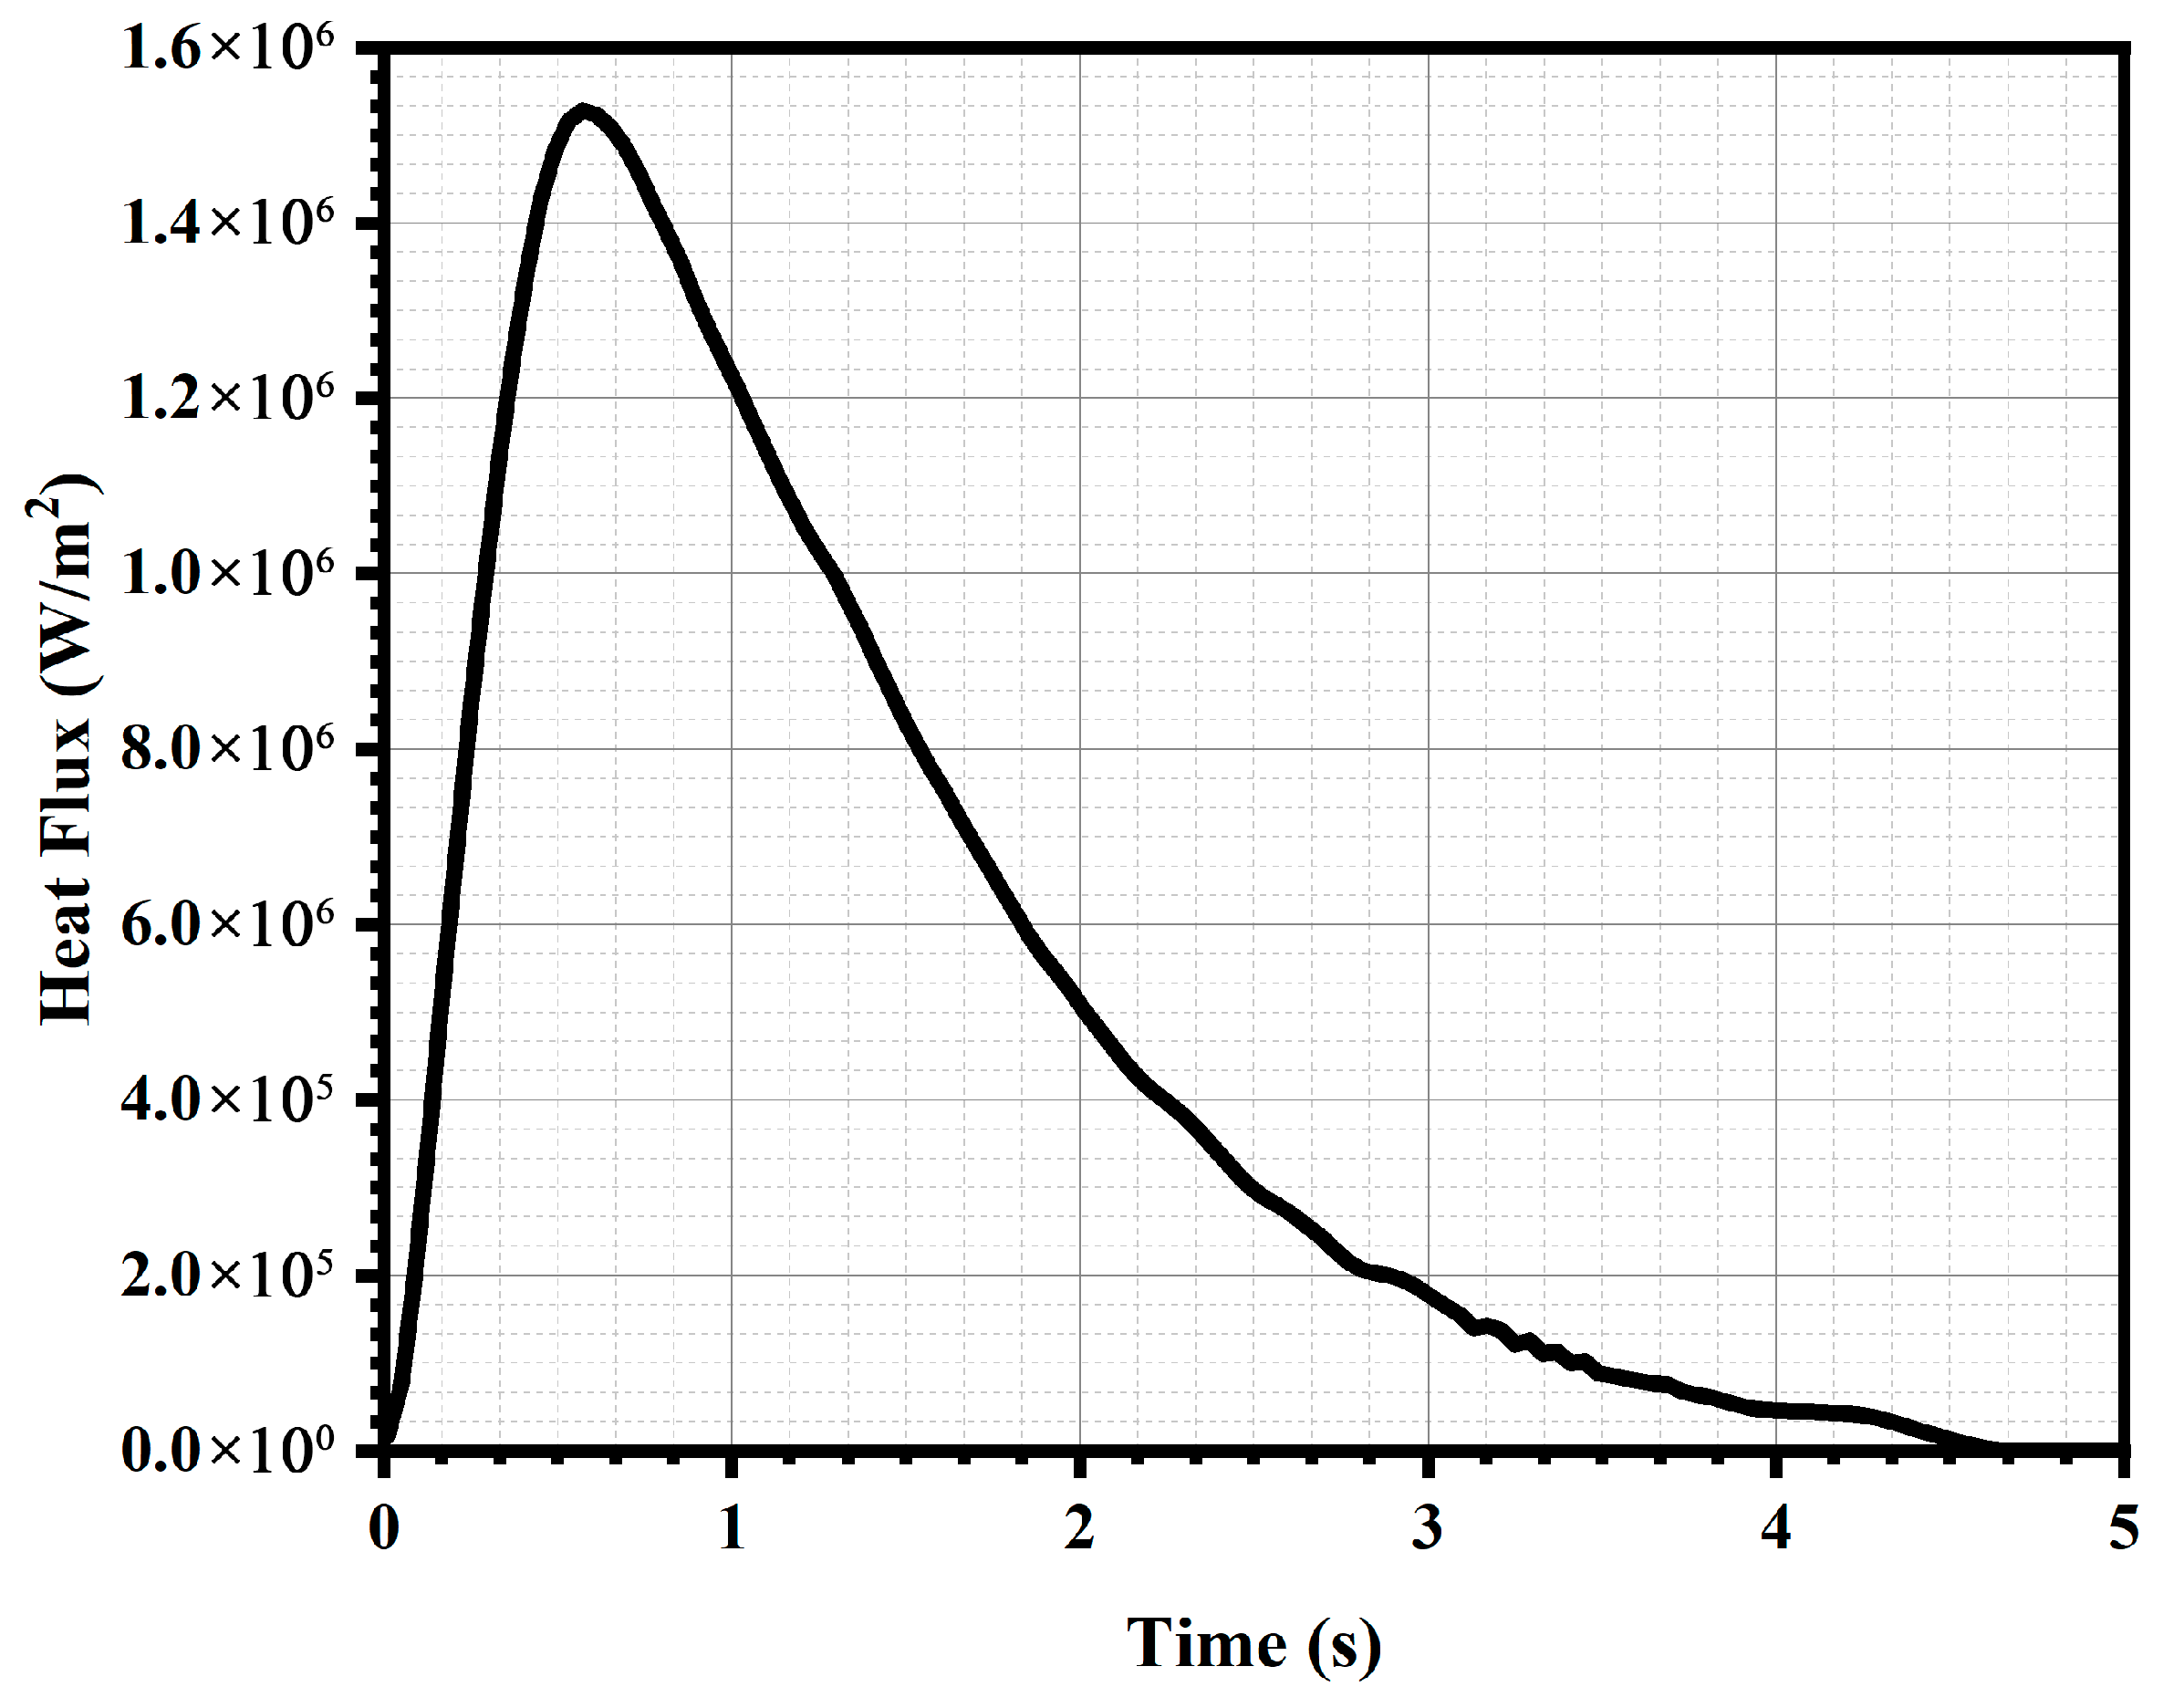
Figure 12 presents the variation in interfacial heat flux with time, as estimated by the IHTA for the middle section of the die. The curve exhibits a rapid increase in heat flux immediately following metal injection, reaching a maximum value of approximately 1.528 × 10⁶ W/m2 at 0.57 s. This sharp rise indicates intense thermal interaction between the molten metal and the die surface during the initial stages of solidification. After reaching its peak, the heat flux gradually decreases, reflecting the declining temperature gradient at the interface as the solidification front advances and the die begins to cool. The shape of the curve highlights the transient nature of the interfacial thermal behavior and the effectiveness of the inverse method in capturing the temporal evolution of heat transfer during the casting process.

8.3. IHTC and Metal Temperature vs. Time

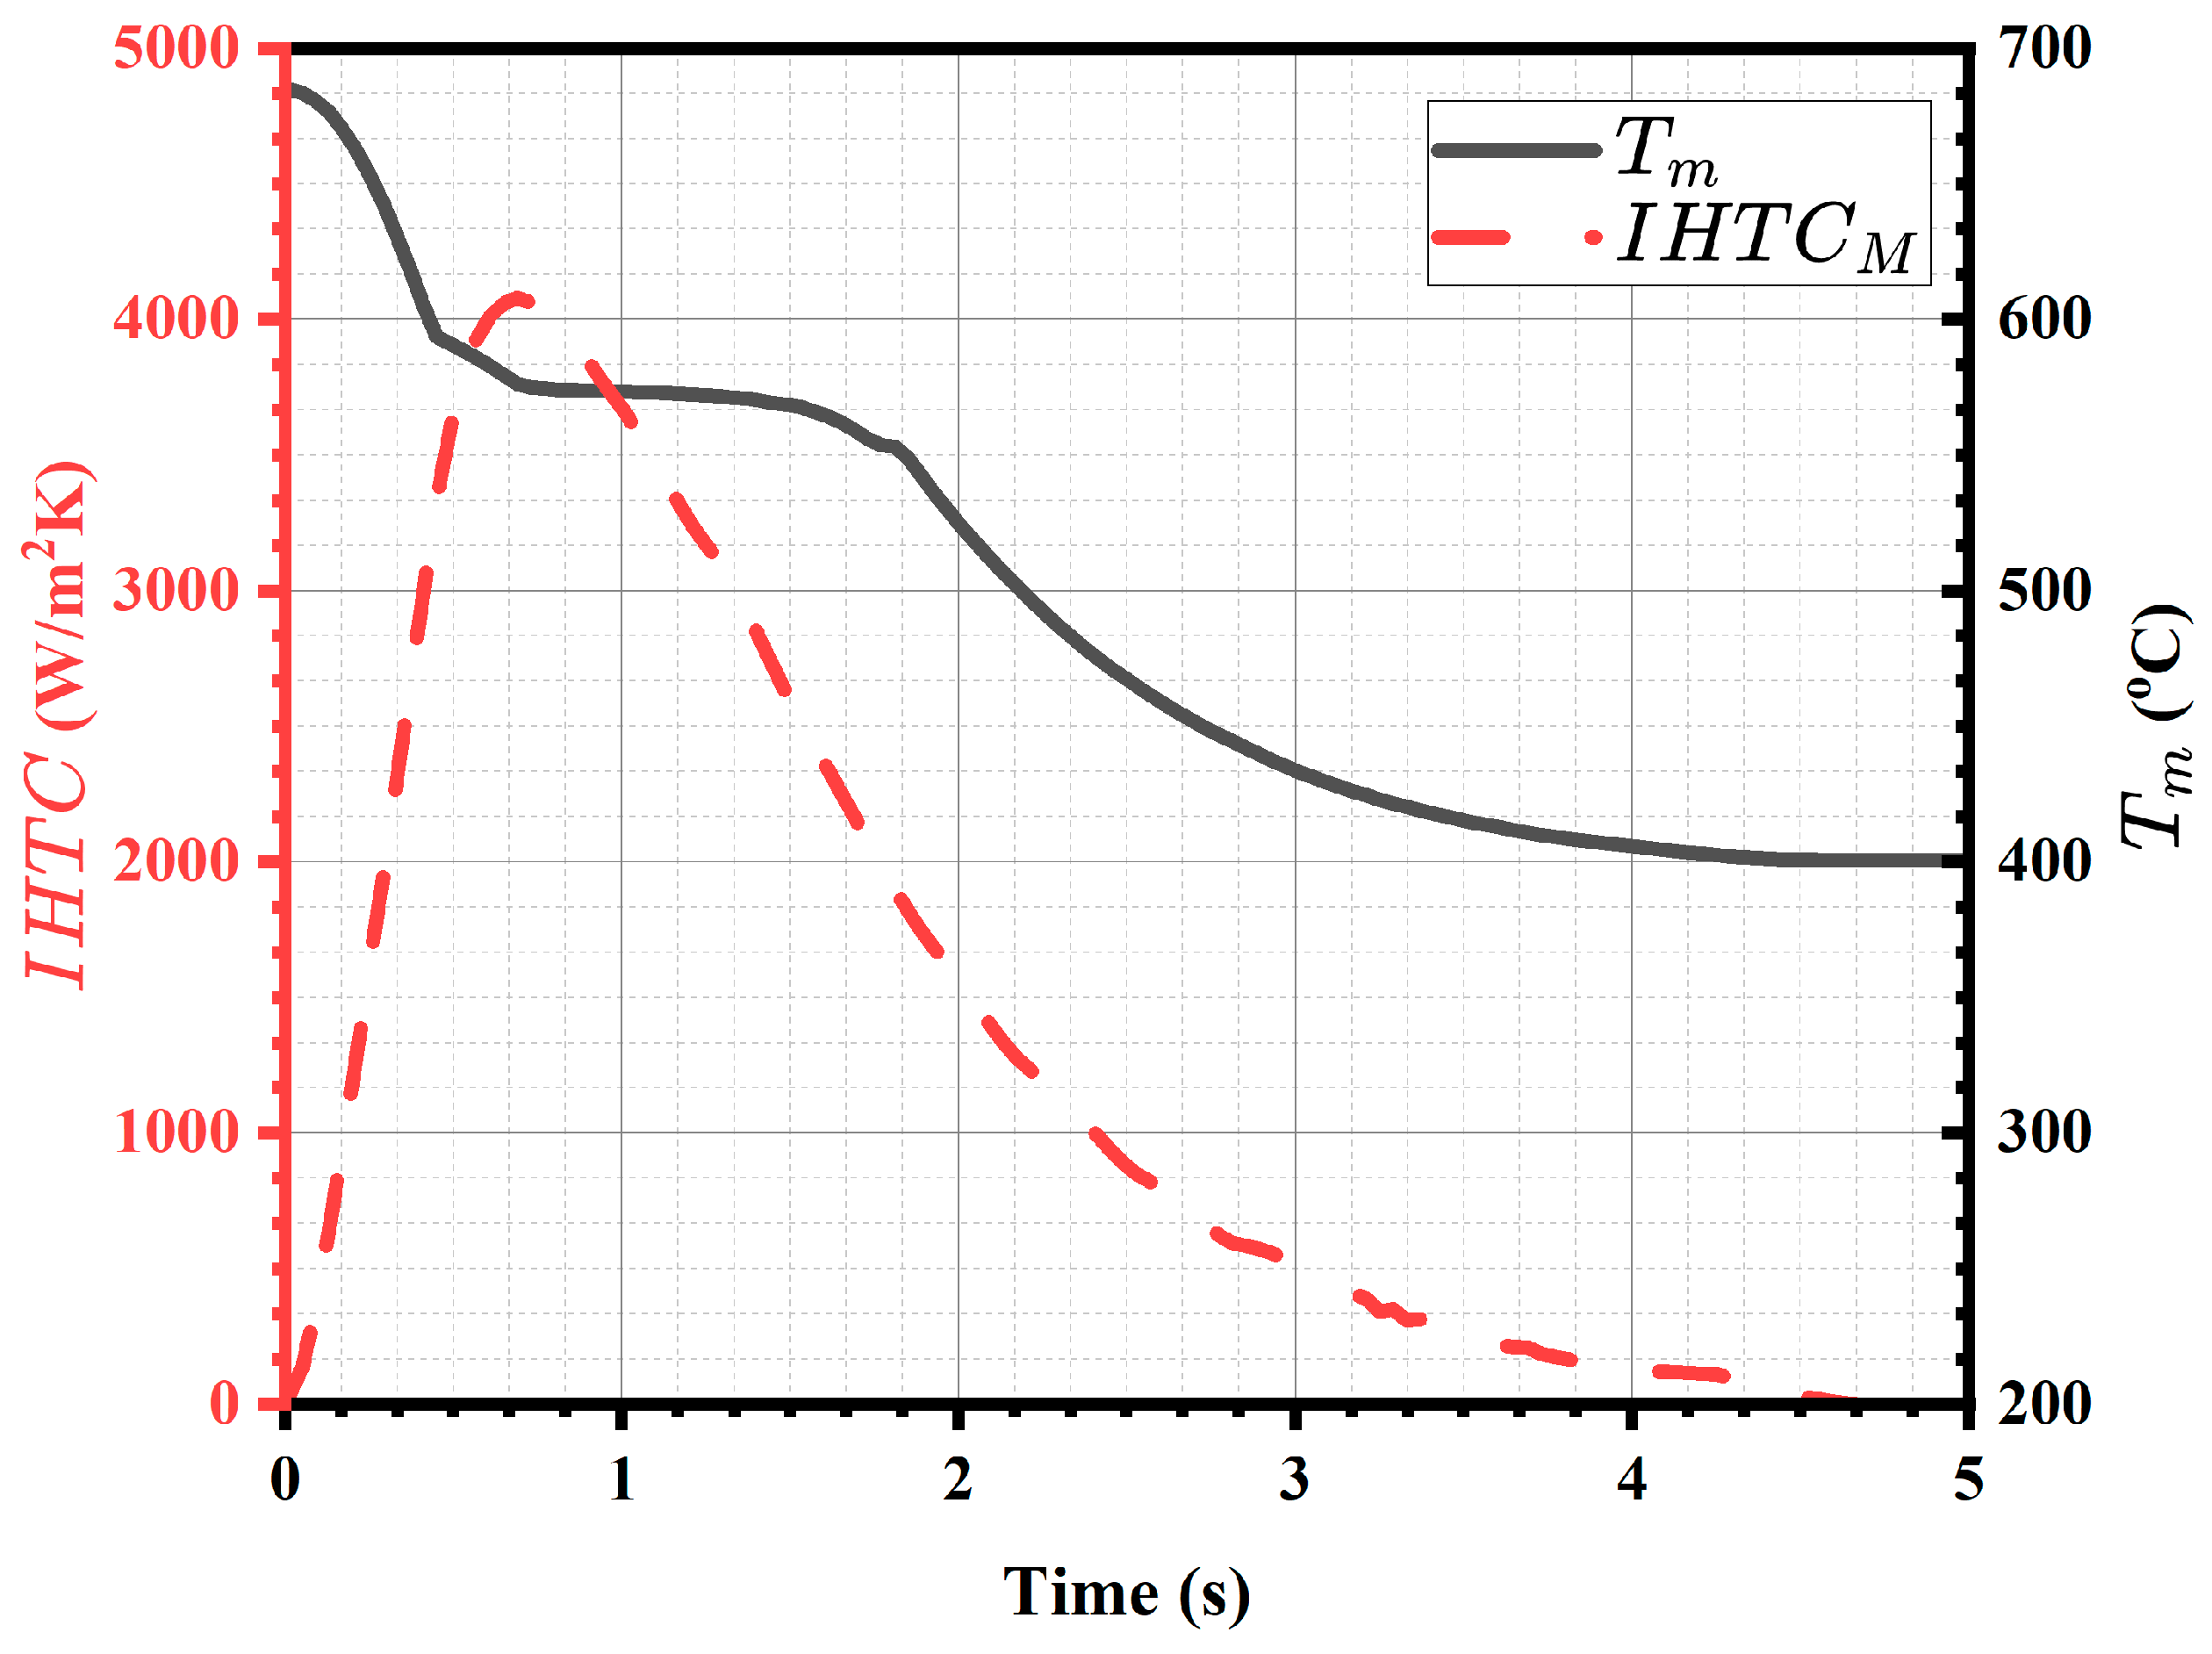
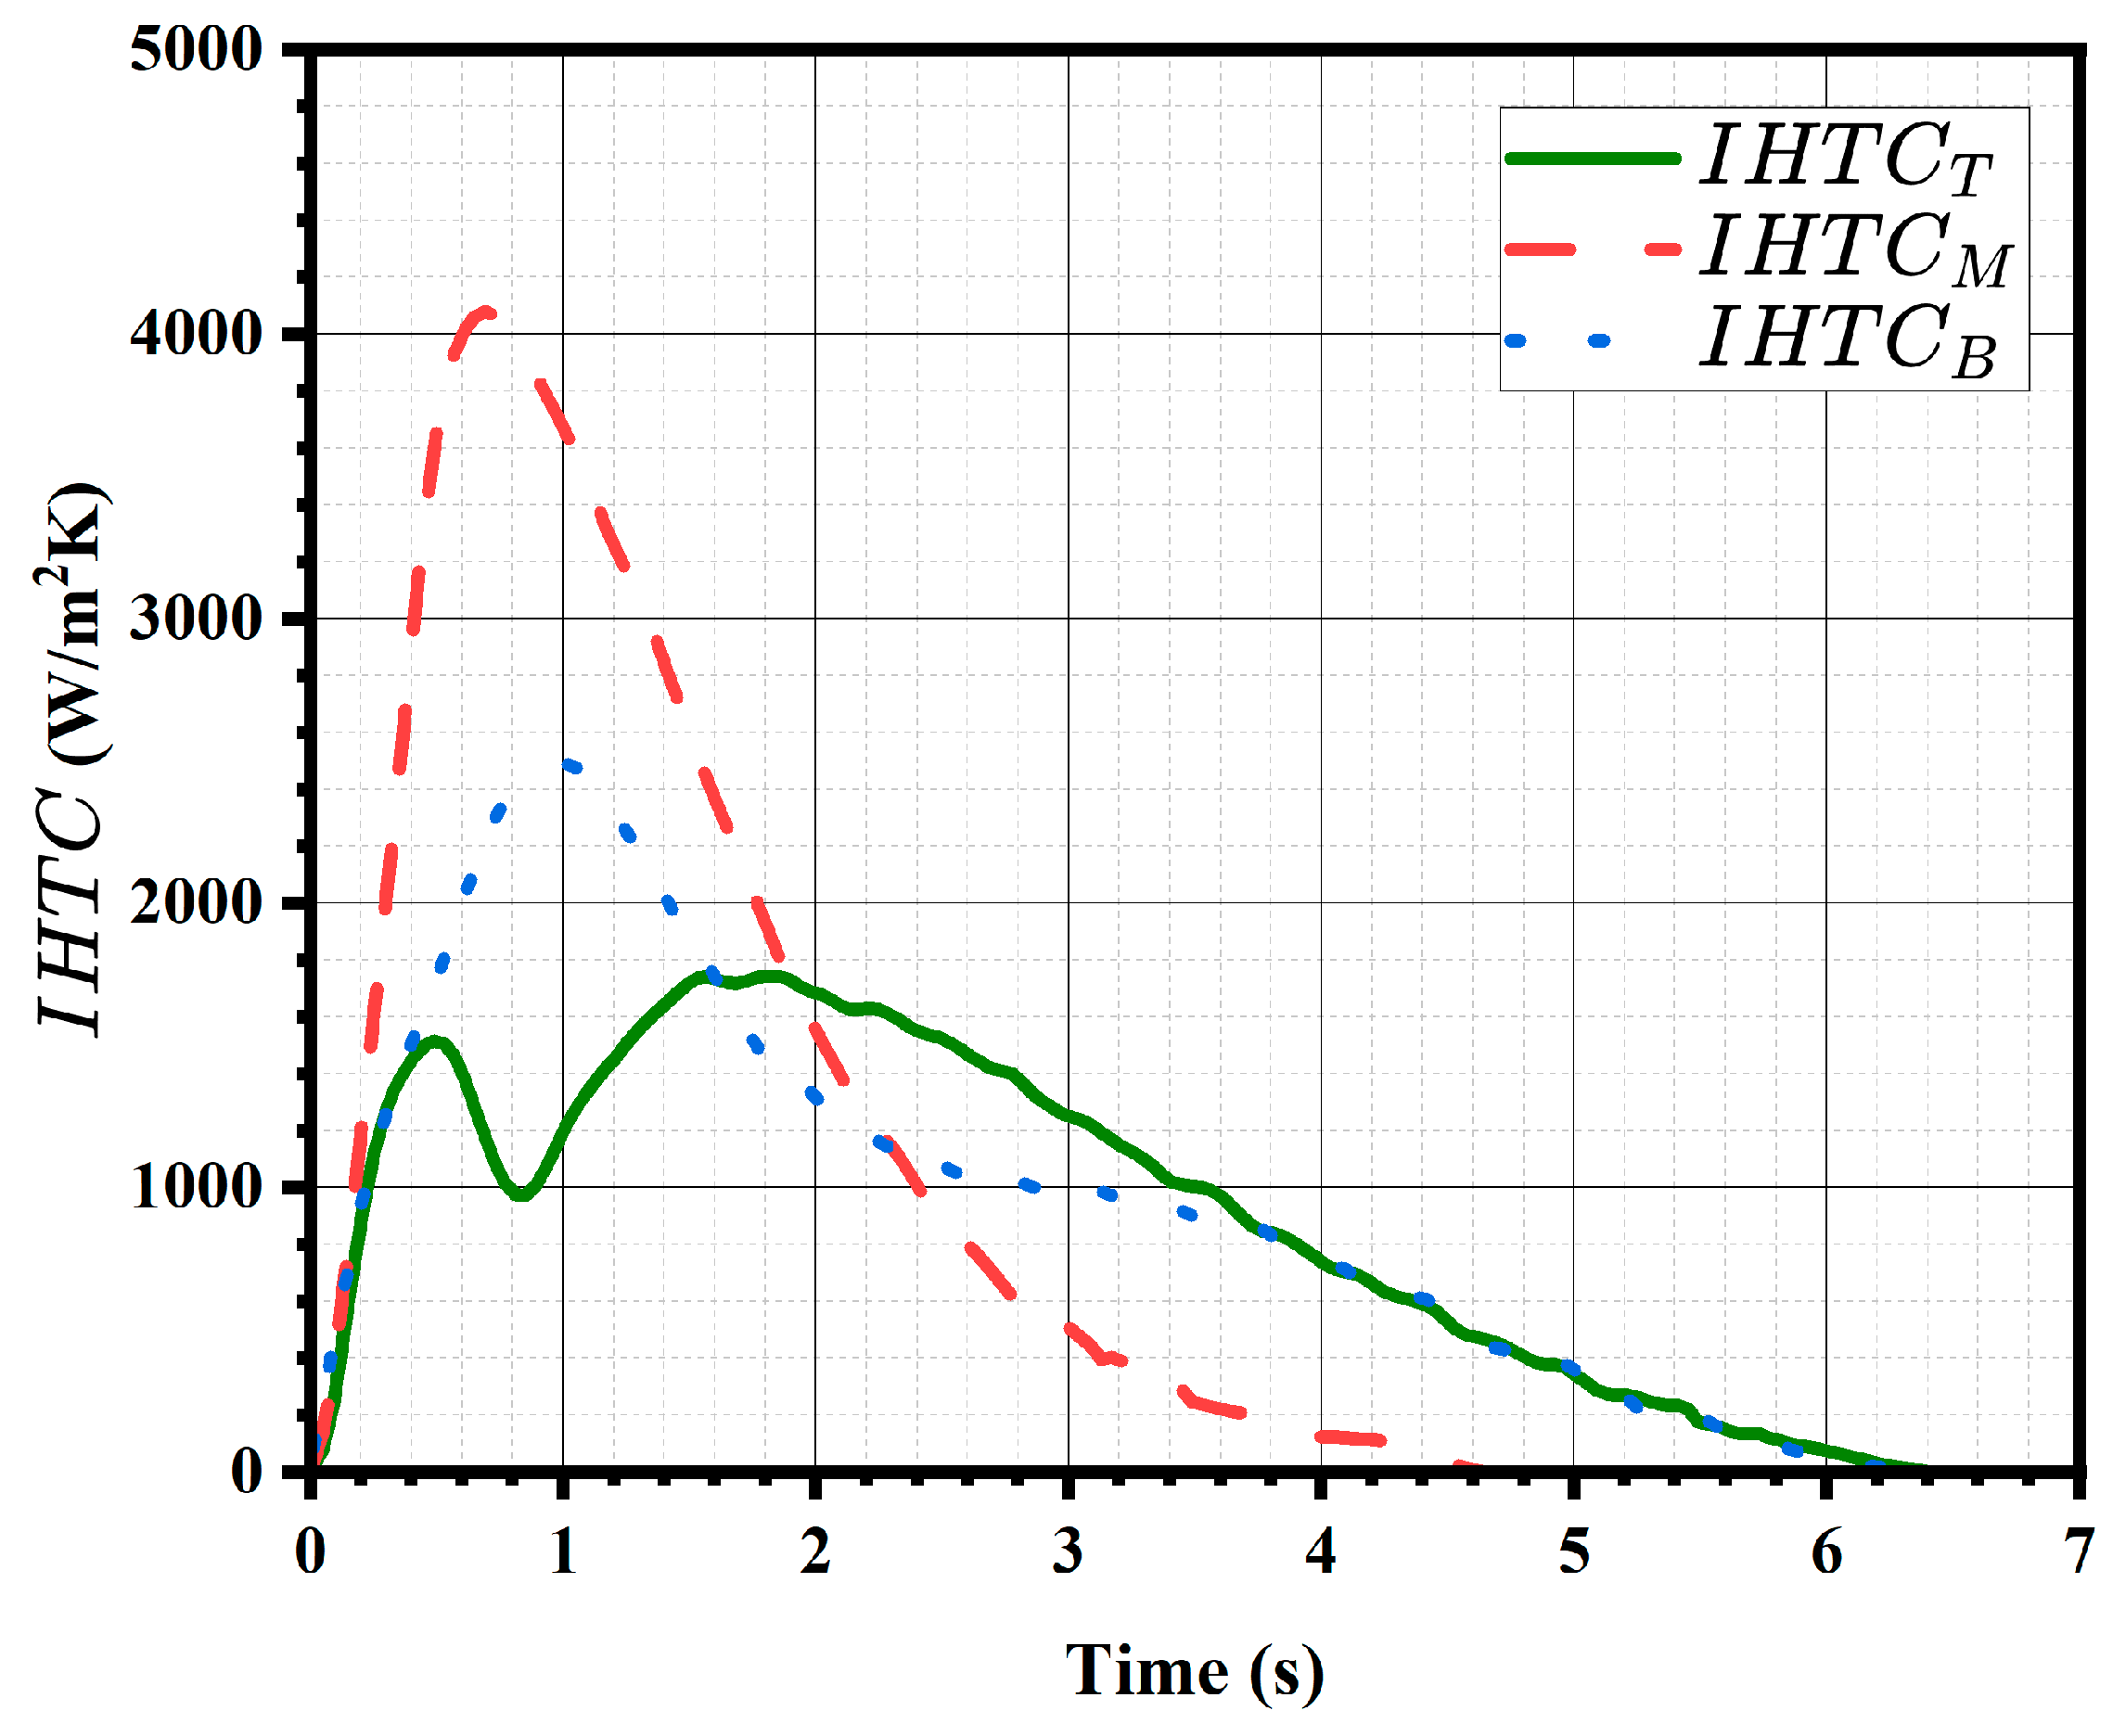
Figure 13 illustrates the variation in the IHTC and the corresponding estimated metal temperature with time at the middle section of the casting. The IHTC is represented on the left vertical axis, while the metal temperature, estimated using Equations (15) and (16) of the lumped mass method, is shown on the right vertical axis. The IHTC profile exhibits a pronounced increase shortly after the start of the casting process, reaching a peak value of approximately 4078 W/m2·K. This peak occurs during the mushy zone, which spans from around 0.5 s to 1.8 s after the metal first contacts the die surface. This stage corresponds to the progression of solidification, where a partially solidified structure enhances thermal contact between the casting and the die, leading to higher interfacial heat transfer.
Following the peak, the IHTC decreases gradually, reaching approximately 2000 W/m2·K by the end of the mushy zone. This decline is likely due to the formation of a fully solidified layer at the interface, which reduces the effective contact area and thermal conductivity between the metal and die.

8.4. Effect of Thickness on the IHTC

As shown in Figure 14, the peak IHTC increases progressively from the top to the bottom section in correspondence with the increase in local casting thickness. The peak values rise from approximately 1740 W/m2·K in the top section to about 2488 W/m2·K in the bottom section, and this trend is also reported in [43]. In contrast, the middle section exhibits an anomalously high peak IHTC of about 4078 W/m2·K, this behavior is attributed to the direct impingement of the molten metal at the thermocouple location, which results from the die cavity geometry. As illustrated in Figure 15, a recess is present at the entrance of the bottom section. This recess, combined with the high velocity of the incoming molten metal, causes the jet to impinge directly on the middle section rather than the bottom section. Furthermore, the IHTC profile in the top section displays a peak–valley–peak pattern, likely caused by the transient presence of an entrapped air bubble that temporarily reduced interfacial heat transfer before dissipating. Porosity analysis of this section confirmed this deduction. Also, these peak values are way lower than the limit of the lumped mass, which is 10,000 W/m2·K.

9. Conclusions

In this study, a dedicated HCDC experimental platform was developed to overcome the challenges of directly measuring transient thermal conditions in HPDC. The setup successfully replicated the thermal and flow environment of industrial HPDC, while allowing systematic control of key process parameters and precise instrumentation. Using inverse heat conduction analysis, detailed temporal profiles of die temperature, interfacial heat flux, and IHTC were reconstructed for different casting sections. Comparisons with an industrial HPDC trial demonstrated that the HCDC setup can reproduce the essential thermal behavior of HPDC, with both processes exhibiting similar heat flux curve shapes characterized by a sharp rise to a peak followed by a gradual decline during solidification. The peak heat flux obtained in the HCDC experiment (1.528 × 10⁶ W/m2) was within 14% of that measured in HPDC, while the FWHM differed by less than 12%, confirming the capability of the HCDC device to emulate industrial conditions. Analysis of the IHTC further revealed a thickness-dependent increase from the top to the bottom section, as well as localized anomalies due to die cavity geometry. The combined experimental and computational approach presented here establishes a robust framework for investigating interfacial heat transfer phenomena in die casting. Beyond validating the HCDC methodology, these results provide valuable input for improving numerical models of HPDC and for guiding the design of next-generation giga casting processes.

Author Contributions

Conceptualization, A.M.T. (Abdelfatah M. Teamah), M.S.H. and S.S.; methodology, A.M.T. (Abdelfatah M. Teamah) and A.M.T. (Ahmed M. Teamah); software, A.M.T. (Ahmed M. Teamah); validation, A.M.T. (Abdelfatah M. Teamah) and A.M.T. (Ahmed M. Teamah); investigation and analysis, A.M.T. (Abdelfatah M. Teamah); resources, M.S.H. and S.S.; writing—original draft, A.M.T. (Abdelfatah M. Teamah); writing—review and editing, A.M.T. (Ahmed M. Teamah), M.S.H. and S.S.; supervision, M.S.H. and S.S.; project administration, S.S. and M.S.H. All authors have read and agreed to the published version of the manuscript.

Funding

Funding for this project was provided jointly by the Natural Science and Engineering Research Council (NSERC), Canada through the Alliance grant program (File No. ALLRP 586591–23), MITACS through their Accelerate grant program (Ref IT35357), Nemak of Canada Corporation, CanaDatum Moulds Ltd., Flow-3D and CanmetMaterials.

Data Availability Statement

The original contributions presented in this study are included in the article. Further inquiries can be directed to the corresponding author.

Acknowledgments

The authors are grateful for the valuable contributions to this project by Gabrial Birsan, Frank Benkel and Kumar Sadayappan at CanmetMaterials, Hamilton, Canada for enabling the high pressure die casting experiments using the 1200 Buhler automatic machine; Glenn Byczynski and Anthony Lombardi from Nemak of Canada Corporation for their resources and feedback; Michael Barkhudarov and Nathan LeBlanc of Flow-3D for casting simulations using Flow-3D, and Ignacio Musalem and Michael Checca from CanaDatum Moulds Inc. for preparing the die tool material in the HPDC with the required thermocouples and sensors. Further we thank these individuals for their collective time and effort in our fortnightly meetings, providing insightful discussions helped hone our project path.

Conflicts of Interest

The authors declare no conflict of interest.

Abbreviations

The following abbreviations are used in this manuscript:
Nomenclature
BiBiot Number
C Specific   heat   ( J / k g · K )
FoFourier Number
h Interfacial   heat   transfer   coefficient   ( W / m 2 · K )
k Thermal   conductivity   ( k )   ( W / m · K )
p The timestep number
q Heat   flux   ( W / m 2 )
TTemperature (°C)
u Number of forward timesteps
X i Sensitivity coefficient at the ith thermocouple
Greek symbols
ε The convergence criterion for the inverse method
ρ Density   ( k g / m 3 )
Subscript
BBottom
csCasting Surface
dsDie Surface
estEstimated
Exp.Experimental
MMiddle
sSolid
TTop
Acronyms
ANNRArtificial Neural Network Regression
DTRDecision Tree Regression
ESCsEntrapped Surface Coatings
ESGsEntrapped Solid Grains
FDMFinite Difference Method
FFTFast Fourier Transform
FWHMFull Width at Half
HCDCHot Chamber Die Casting
HPDCHigh-Pressure Die Casting
IHCPInverse Heat Conduction Problem
IHTCInterfacial Heat Transfer Coefficient
MLRMultiple Linear Regression
VAMVirtual Adjunct Method
VPDCVacuum-Assisted High-Pressure Die Casting

References

  1. Merchán, M.; Egizabal, P.; García de Cortázar, M.; Irazustabarrena, A.; Galarraga, H. Development of an Innovative Low Pressure Die Casting Process for Aluminum Powertrain and Structural Components. Adv. Eng. Mater. 2019, 21, 1800105. [Google Scholar] [CrossRef]
  2. Dash, S.; Li, D.; Zeng, X.; Chen, D. Heterogeneous microstructure and deformation behavior of an automotive grade aluminum alloy. J. Alloys Compd. 2021, 870, 159413. [Google Scholar] [CrossRef]
  3. Collot, J. Review of new process technologies in the aluminum die-casting industry. Mater. Manuf. Process. 2001, 16, 595–617. [Google Scholar] [CrossRef]
  4. Wang, L.; Makhlouf, M.; Apelian, D. Aluminium die casting alloys: Alloy composition, microstructure, and properties-performance relationships. Int. Mater. Rev. 1995, 40, 221–238. [Google Scholar] [CrossRef]
  5. Dong, X.; Youssef, H.; Zhang, Y.; Wang, S.; Ji, S. High performance Al/TiB2 composites fabricated by nanoparticle reinforcement and cutting-edge super vacuum assisted die casting process. Compos. Part B Eng. 2019, 177, 107453. [Google Scholar] [CrossRef]
  6. Kawajiri, K.; Kobayashi, M.; Sakamoto, K. Lightweight materials equal lightweight greenhouse gas emissions?: A historical analysis of greenhouse gases of vehicle material substitution. J. Clean. Prod. 2020, 253, 119805. [Google Scholar] [CrossRef]
  7. Trzepieciński, T.; Najm, S.M. Current trends in metallic materials for body panels and structural members used in the automotive industry. Materials 2024, 17, 590. [Google Scholar] [CrossRef]
  8. Soo, V.K.; Peeters, J.; Paraskevas, D.; Compston, P.; Doolan, M.; Duflou, J.R. Sustainable aluminium recycling of end-of-life products: A joining techniques perspective. J. Clean. Prod. 2018, 178, 119–132. [Google Scholar] [CrossRef]
  9. The Average Weight of Passenger Cars in Europe Has Increased Significantly Since 2020. Available online: https://www.inovev.com/index.php/en/market-analyses/category-blog/19969-2023-30-2 (accessed on 20 September 2025).
  10. Aluminum Content in Passenger Vehicles (Europe). Available online: https://european-aluminium.eu/wp-content/uploads/2023/05/23-05-02Aluminum-Content-in-Cars_Public-Summary.pdf (accessed on 20 September 2025).
  11. Aluminium Usage in Cars Surges as Automotive Industry Shifts Towards Electrification. Available online: https://aluminiumtoday.com/news/aluminium-usage-in-cars-surges-as-automotive-industry-shifts-towards-electrification (accessed on 20 September 2025).
  12. Baser, T.A.; Umay, E.; Akıncı, V. New trends in aluminum die casting alloys for automotive applications. Eurasia Proc. Sci. Technol. Eng. Math. 2022, 21, 79–87. [Google Scholar] [CrossRef]
  13. Koru, M.; Serçe, O. Experimental and Theoretical Investigation of Heat Transfer in Vacuum Assisted High Pressure Die Casting (HPDC) Process. Int. J. Met. 2024, 18, 3013–3027. [Google Scholar] [CrossRef]
  14. Nelson, C. Nature of heat transfer at the die face. In Proceedings of the 6th SDCE International Die Casting Congress, Cleveland, OH, USA, 16–19 November 1970. [Google Scholar]
  15. Lee, S.; Han, D.; Kang, S.; Kim, N. Method of predicting shrinkage defects and deriving process conditions in HPDC (high-pressure die-casting) for electric vehicle motor housings. Int. J. Met. 2024, 18, 1262–1272. [Google Scholar] [CrossRef]
  16. İpek, O.; Koru, M. Yüksek basınçlı döküm prosesinde kalıp sıcaklığına bağlı olarak döküm-kalıp ara yüzeyinde oluşan termal temas direncinin belirlenmesi. Isı Bilim. Tek. Derg. 2011, 31, 45–57. [Google Scholar]
  17. Dour, G.; Dargusch, M.; Davidson, C.; Nef, A. Development of a non-intrusive heat transfer coefficient gauge and its application to high pressure die casting: Effect of the process parameters. J. Mater. Process. Technol. 2005, 169, 223–233. [Google Scholar] [CrossRef]
  18. Chen, Z. Skin solidification during high pressure die casting of Al–11Si–2Cu–1Fe alloy. Mater. Sci. Eng. A 2003, 348, 145–153. [Google Scholar] [CrossRef]
  19. Garcia, A.; Prates, M. Mathematical model for the unidirectional solidification of metals: I. Cooled molds. Metall. Trans. B 1978, 9, 449–457. [Google Scholar] [CrossRef]
  20. Garcia, A.; Clyne, T.; Prates, M. Mathematical model for the unidirectional solidification of metals: II. Massive molds. Metall. Trans. B 1979, 10, 85–92. [Google Scholar] [CrossRef]
  21. Dargusch, M.; Hamasaiid, A.; Dour, G. An inverse model to determine the heat transfer coefficient and its evolution with time during solidification of light alloys. Int. J. Nonlinear Sci. Numer. Simul. 2008, 9, 275–282. [Google Scholar] [CrossRef]
  22. Long, A.; Thornhill, D.; Armstrong, C.; Watson, D. Determination of the heat transfer coefficient at the metal–die interface for high pressure die cast AlSi9Cu3Fe. Appl. Therm. Eng. 2011, 31, 3996–4006. [Google Scholar] [CrossRef]
  23. Guo, Z.-P.; Xiong, S.-M.; Liu, B.-C.; Li, M.; Allison, J. Effect of process parameters, casting thickness, and alloys on the interfacial heat-transfer coefficient in the high-pressure die-casting process. Metall. Mater. Trans. A 2008, 39, 2896–2905. [Google Scholar] [CrossRef]
  24. Hamasaiid, A.; Dour, G.; Dargusch, M.; Loulou, T.; Davidson, C.; Savage, G. Heat-transfer coefficient and in-cavity pressure at the casting-die interface during high-pressure die casting of the magnesium alloy AZ91D. Metall. Mater. Trans. A 2008, 39, 853–864. [Google Scholar] [CrossRef]
  25. Guo, Z.; Xiong, S.; Liu, B.; Mei, L.; Allison, J. Determination of the heat transfer coefficient at metal–die interface of high pressure die casting process of AM50 alloy. Int. J. Heat Mass Transf. 2008, 51, 6032–6038. [Google Scholar] [CrossRef]
  26. Yu, W.; Cao, Y.; Li, X.; Guo, Z.; Xiong, S. Determination of interfacial heat transfer behavior at the metal/shot sleeve of high pressure die casting process of AZ91D alloy. J. Mater. Sci. Technol. 2017, 33, 52–58. [Google Scholar] [CrossRef]
  27. Yang, H.-M.; Yu, W.-B.; Cao, Y.-Y.; Li, X.-B.; Guo, Z.-P.; Xiong, S.-M. Effect of different processing parameters on interfacial heat-transfer behavior in high-pressure die-casting process. Trans. Nonferrous Met. Soc. China 2018, 28, 2599–2606. [Google Scholar] [CrossRef]
  28. Sharifi, P.; Jamali, J.; Sadayappan, K.; Wood, J. Grain size distribution and interfacial heat transfer coefficient during solidification of magnesium alloys using high pressure die casting process. J. Mater. Sci. Technol. 2018, 34, 324–334. [Google Scholar] [CrossRef]
  29. Kan, M. Determination of the casting-mold interface heat transfer coefficient for numerically die-casting process depending on different mold temperatures. J. Mech. Sci. Technol. 2023, 37, 427–433. [Google Scholar] [CrossRef]
  30. Yalçin, B.; Koru, M.; Ipek, O.; Özgür, A.E. Effect of injection parameters and vacuum on the strength and porosity amount of die-casted A380 alloy. Int. J. Met. 2017, 11, 195–206. [Google Scholar] [CrossRef]
  31. Koru, M.; Serçe, O. The effects of thermal and dynamical parameters and vacuum application on porosity in high-pressure die casting of A383 Al-alloy. Int. J. Met. 2018, 12, 797–813. [Google Scholar] [CrossRef]
  32. Szalva, P.; Orbulov, I.N. The effect of vacuum on the mechanical properties of die cast aluminum AlSi9Cu3 (Fe) alloy. Int. J. Met. 2019, 13, 853–864. [Google Scholar] [CrossRef]
  33. Aksoy, B.; Koru, M. Estimation of casting mold interfacial heat transfer coefficient in pressure die casting process by artificial intelligence methods. Arab. J. Sci. Eng. 2020, 45, 8969–8980. [Google Scholar] [CrossRef]
  34. Kan, M.; Ipek, O.; Koru, M. An investigation into the effect of vacuum conditions on the filling analysis of the pressure casting process. Int. J. Met. 2023, 17, 430–446. [Google Scholar] [CrossRef]
  35. Aweda, J.O.; Adeyemi, M.B. Experimental determination of heat transfer coefficients during squeeze casting of aluminium. J. Mater. Process. Technol. 2009, 209, 1477–1483. [Google Scholar] [CrossRef]
  36. Zhang, X.; Fang, L.; Sun, Z.; Hu, H.; Nie, X.; Tjong, J. Interfacial heat transfer in squeeze casting of magnesium alloy AM60 with variation of applied pressures and casting wall-thicknesses. Heat Mass Transf. 2016, 52, 2303–2315. [Google Scholar] [CrossRef]
  37. Zhang, X.; Fang, L.; Hu, H.; Nie, X.; Tjong, J. Interfacial heat transfer of squeeze casting of wrought aluminum alloy 5083 with variation in wall thicknesses. Adv. Mater. Process. Technol. 2017, 3, 407–417. [Google Scholar] [CrossRef]
  38. Wang, F.; Wang, X.; Wu, K.; Han, Z. (Eds.) Study on the Effect of Die Coating Thickness on the Interfacial Heat Transfer Coefficient in Squeeze Casting of Aluminum Alloy. In TMS 2018 147th Annual Meeting & Exhibition Supplemental Proceedings; Springer: Berlin/Heidelberg, Germany, 2018. [Google Scholar]
  39. Khawale, V.R.; Alshamrani, A.; Palanisamy, S.; Haldar, B.; Ramamurthy, S.; John, J.M.H.; Krishnamoorthy, S.; Sharma, M.; Alrasheedi, N.H. Analysis of interfacial heat transfer coefficients in squeeze casting of AA6061 aluminum alloy with H13 steel die: Impact of section thickness on thermal behavior. Therm. Sci. 2024, 28 Pt A, 223–232. [Google Scholar] [CrossRef]
  40. Teamah, A.; Teamah, A.; Hamed, M.; Shankar, S. (Eds.) On Replicating the Thermal Conditions in High Pressure Die Casting Processes. Available online: https://journals.library.torontomu.ca/index.php/ictea/article/view/2665 (accessed on 20 September 2025).
  41. Beals, R.; Niu, X.; Brown, Z. Development of advanced aluminum alloy for structural castings. In Light Metals 2022; Springer: Berlin/Heidelberg, Germany, 2022; pp. 73–82. [Google Scholar] [CrossRef]
  42. Available online: https://thermtest.com/thermal-resources/materials-database (accessed on 20 September 2025).
  43. Sun, Z.; Hu, H.; Niu, X. Determination of heat transfer coefficients by extrapolation and numerical inverse methods in squeeze casting of magnesium alloy AM60. J. Mater. Process. Technol. 2011, 211, 1432–1440. [Google Scholar] [CrossRef]
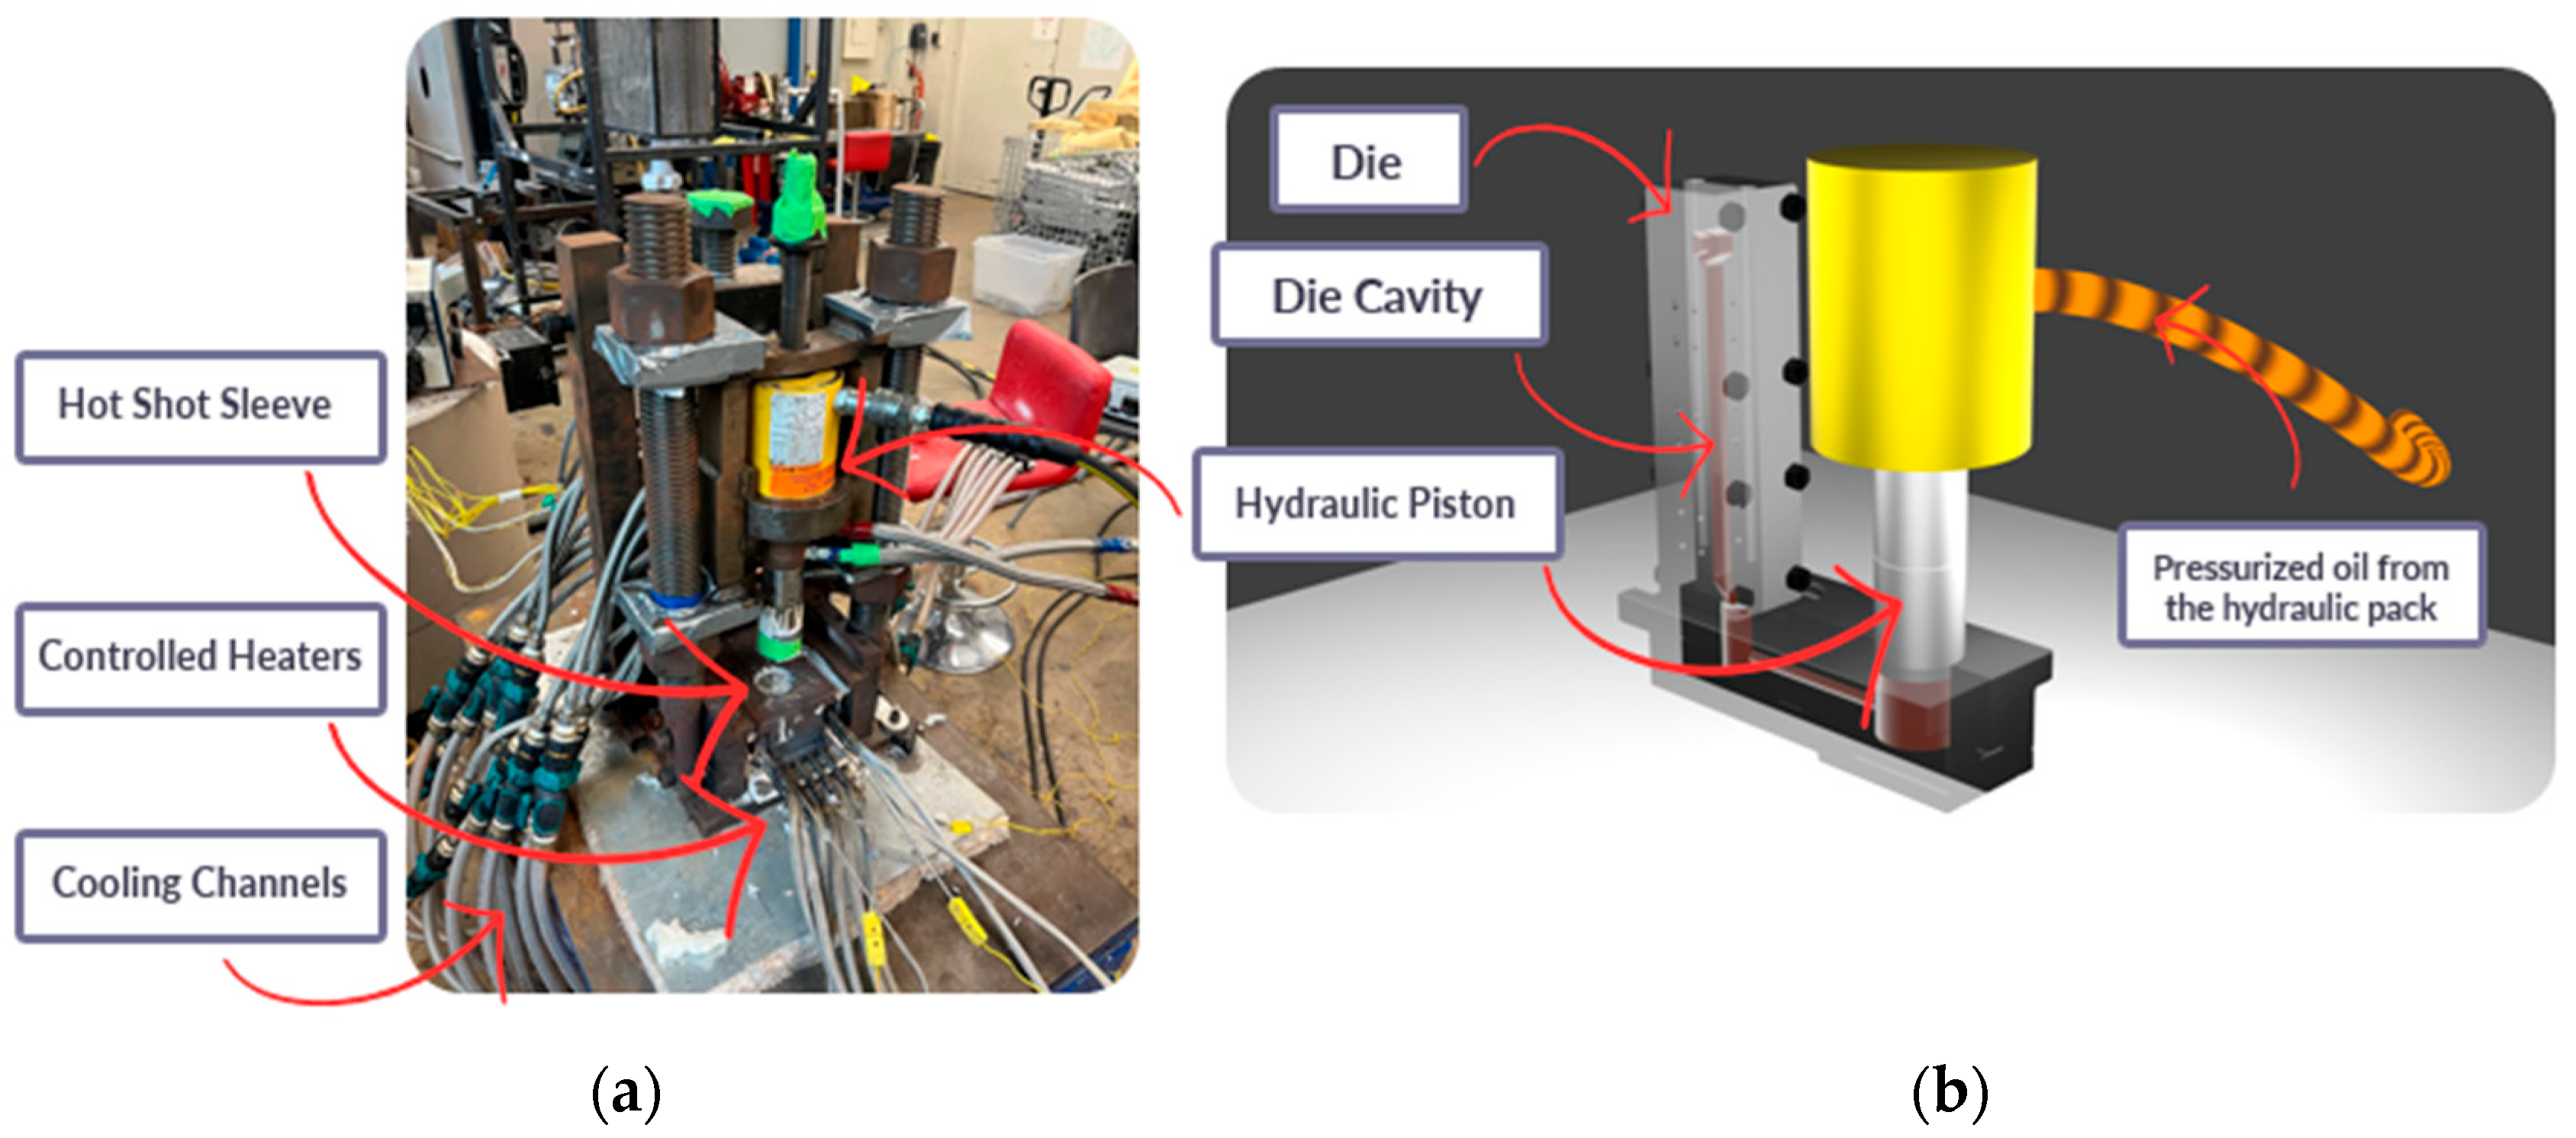
Figure 1. Main components of the HCDC experimental setup (a) The actual setup. (b) A schematic.
Processes 13 03815 g001
Figure 2. Casting geometry and key dimensions.
Processes 13 03815 g002
Figure 3. Locations of thermocouples embedded in the die.
Processes 13 03815 g003
Figure 4. One-dimensional heat transfer at the interface between the casting and die.
Processes 13 03815 g004
Figure 5. Algorithmic workflow for the determination of IHTC at the casting–die interface.
Processes 13 03815 g005
Figure 6. Fraction solid–temperature relationship for the A365 alloy as predicted by the Scheil–Gulliver model.
Processes 13 03815 g006
Figure 7. Variation in peak heat flux at the middle section of the HCDC experiment with different numbers of mesh elements inside the die.
Processes 13 03815 g007
Figure 8. Comparison of simulated and measured temperature histories at the first and second thermocouple locations.
Processes 13 03815 g008
Figure 9. Comparison between (a) the HCDC die cavity and (b) the HPDC die cavity used in the validation trials.
Processes 13 03815 g009
Figure 10. Comparison of interfacial heat flux profiles for HCDC and HPDC for the middle section obtained via the inverse method.
Processes 13 03815 g010
Figure 11. Temperature–time profiles in the middle section and the inverse-predicted die interface temperature.
Processes 13 03815 g011
Figure 12. Transient interfacial heat flux in the middle section estimated by the inverse method.
Processes 13 03815 g012
Figure 13. Variation in the IHTC and the corresponding metal temperature at the middle section.
Processes 13 03815 g013
Figure 14. IHTC versus time for the top, middle, and bottom sections of the casting.
Processes 13 03815 g014
Figure 15. Die cavity geometry showing the recess at the entrance of the bottom section, as indicated by the red box.
Processes 13 03815 g015
Table 1. Properties of H13 tool steel [23].
Thermal conductivity ( k ) ( W / m · K ) 31.2 0.013   T
Specific heat ( C ) ( J / k g · K ) 478 0.219   T
Density ( ρ ) ( k g / m 3 ) 7730 0.24   T
T is temperature ( ).
Table 2. Chemical composition of A365 alloy.
AlSi (%)Mn (%)Mg (%)Fe (%)Ti (%)Sr (%)Cu (%)Cr (%)P (%)
Balance10.350.560.290.1860.070.0220.020.010.001
Table 3. Properties of A365.
Thermal conductivity ( W / m · K ) 150
Specific heat liquid ( J / k g · K ) 1039
Specific heat Solid ( J / k g · K ) 895
Density liquid ( k g / m 3 ) 2395
Density Solid ( k g / m 3 ) 2694
Disclaimer/Publisher’s Note: The statements, opinions and data contained in all publications are solely those of the individual author(s) and contributor(s) and not of MDPI and/or the editor(s). MDPI and/or the editor(s) disclaim responsibility for any injury to people or property resulting from any ideas, methods, instructions or products referred to in the content.