Article

Design, Optimization, and Process Integration of a Methanol-to-Olefin Plant

Chemical Engineering Department, King Saud University, P.O. Box 800, Riyadh 11421, Saudi Arabia
*
Author to whom correspondence should be addressed.
Processes 2025, 13(12), 3806; https://doi.org/10.3390/pr13123806
Submission received: 31 October 2025 / Revised: 21 November 2025 / Accepted: 22 November 2025 / Published: 25 November 2025

Abstract

The methanol-to-olefins (MTO) process offers a viable alternative to traditional naphtha cracking for producing light olefins, providing flexibility in feedstock sources and the potential for reduced energy consumption. This study presents a detailed plant-wide design of an MTO process, developed and optimized to increase ethylene and propylene yields while reducing energy consumption. The methodology includes comprehensive reactor modeling of a fast fluidized-bed reactor–regenerator system, accounting for coke formation kinetics, along with rigorous process simulation for the subsequent separation and purification of products. A six-column distillation train has been designed and optimized for the recovery of polymer-grade ethylene and propylene, while dual-stage CO2 absorption units ensure complete removal of carbon dioxide. Pinch analysis is used to identify opportunities for heat integration, resulting in an optimized heat-exchanger network that significantly reduces the need for external heating and cooling utilities. The results show that the optimized MTO design achieves a methanol conversion rate of over 99.9% and produces a propylene-rich product stream with a propylene-to-ethylene ratio of approximately 1.8, while maintaining a high purity level exceeding 99.5%. By implementing heat integration and recycling by-products, including using off-gas methane as furnace fuel and repurposing waste heat for steam generation, the plant reduces utility requirements by more than 85%, significantly improving energy efficiency. An economic evaluation shows a favorable payback period of approximately 5.4 years and an internal rate of return of 15–16%, confirming the viability and industrial potential of the integrated MTO process for sustainable olefin production.

1. Introduction

Light olefins (including ethylene, propylene, butylene, and butadiene) are extensively used across a variety of industries. The global demand for light olefins has been rising steadily, driven by the rapid growth of polymer markets, packaging materials, and downstream chemical industries, making olefins among the most sought-after commodities worldwide [1]. The volatility of crude oil markets, combined with mounting pressure to reduce carbon emissions, has created a strong motivation to seek alternative olefin production technologies [2,3].
Conventional production of light olefins relies on two primary routes: steam cracking and fluid catalytic cracking (FCC). Steam cracking involves the thermal decomposition of feedstocks like ethane in the presence of steam at elevated temperatures, while FCC uses a hot circulating catalyst to convert heavier hydrocarbon fractions into lighter products such as olefins. However, these conventional methods are highly energy-intensive and heavily reliant on fossil-derived feedstocks, exposing the olefin market to price volatility and environmental concerns associated with greenhouse gas emissions [4,5].
The catalytic dehydration of bioethanol to ethylene is an emerging alternative that has reached a moderate Technology Readiness Level (TRL 6–7), as demonstrated by industrial projects like Braskem’s bio-based ethylene facility. Although it offers potential for renewable feedstocks, the scalability of MTO for large-scale olefin production is limited by biomass availability and competition with fuel markets, restricting its applicability across various carbon sources.
The methanol-to-olefins (MTO) process has emerged as a promising alternative for producing ethylene and propylene. It operates at lower temperatures with higher selectivity toward light olefins and offers greater flexibility in adjusting the ethylene-to-propylene output ratio [6]. MTO technology converts methanol derived from natural gas, coal, or biomass into these olefins [7,8]. Because methanol can be synthesized from such diverse carbon sources, MTO reduces the petrochemical industry’s reliance on oil-based feedstocks [9,10]. In comparison to the output of a traditional thermal cracking process, the hydrocarbon fractions released by an MTO reactor tend to be lighter. Furthermore, the abundance and low cost of coal and natural gas as methanol feedstocks enhance the economic appeal of MTO.
Catalyst selection is critical in the MTO process. SAPO-34, a silicoaluminophosphate molecular sieve with small pores, has demonstrated superior performance as an MTO catalyst, achieving high methanol conversion and strong selectivity for light olefins [6,11]. Early studies demonstrated that zeolites like ZSM-5 can catalyze methanol conversion to hydrocarbons [12], but the discovery of SAPO-34 was a major breakthrough due to its superior selectivity for light olefins [13,14]. Metal modifications of SAPO-34 (e.g., Mn-SAPO-34) have shown improved long-term stability over the unmodified catalyst [15]. However, SAPO-34 (like other zeolite catalysts) suffers from gradual deactivation due to coke deposition, as carbonaceous by-products accumulate in its micropores and hinder catalytic activity and selectivity, ultimately limiting reactor lifetimes and increasing operational costs [16,17]. To mitigate coking, industrial MTO processes often use circulating fluidized-bed reactors, which provide excellent heat transfer and allow continuous catalyst regeneration [18,19].
Developing an accurate kinetic model for the MTO reaction is challenging, as the underlying mechanism is still debated [20]. Park and Forment [21] developed a kinetic model for MTO over HZSM-5. Sedighi et al. [11] proposed a kinetic scheme for SAPO-34 and found that higher catalyst contact time and temperature both increased light olefin yields. Zhuang et al. [22] employed computational fluid dynamics to analyze a fixed-bed MTO reactor and found that coke deposition correlates with declining methanol conversion. In addition, advanced optimization techniques have been used to refine MTO kinetics; for example, Taheri Najafabadi et al. [6] applied a genetic algorithm to tune kinetic parameters, achieving good agreement between experimental and predicted results.
Optimizing the energy-intensive cryogenic distillation sequence and integrating it with heat recovery networks (e.g., via Pinch analysis) is critical for improving the MTO process’s energy efficiency and environmental performance [23]. Despite extensive literature on individual aspects of MTO, few studies provide a comprehensive, plant-wide design framework that combines reactor modeling, separation, and heat integration into a single, optimized process. To address this gap, a systematic process selection analysis was conducted, and its findings were used to guide the integrated MTO plant design presented in this study.
This work presents the detailed design, modeling, and optimization of an MTO process, including material and energy balances, equipment design, and sizing. The study integrates rigorous thermodynamic analysis using the Ideal Gas, Virial, and Peng-Robinson equations of state with process simulation and optimization techniques. A fast fluidized bed reactor configuration was adopted to sustain catalyst activity and minimize deactivation, while systematic design methods were applied to the separation and purification systems. Comprehensive heat integration (via Pinch analysis) and recycling strategies were implemented to enhance energy recovery, reduce utility consumption, and improve process sustainability. Finally, an economic evaluation covering equipment, raw material, and utility costs was performed to assess the plant’s technical and financial feasibility, establishing the proposed MTO configuration as both efficient and economically viable.

2. Process Design and Methods

2.1. Methods and Modeling

The proposed MTO flowsheet was modeled through detailed material and energy balance calculations, equipment design, and sizing to produce 1,000,000 tonnes per year with 330 days of operation. Thermodynamic modeling employed the ideal gas, virial, and Peng–Robinson equations of state with appropriate mixing rules from Perry’s Handbook [24] and property data from Yaws’ Handbooks [25,26] to predict multicomponent phase behavior and physical properties. Ideal gas behavior was assumed with pressure lower than 5 bar, while the virial and Peng–Robinson equations of state were applied for non-ideal conditions (Tables S1 and S2). The reaction framework, including coke formation, was refined based on the hydrocarbon pool mechanism proposed by Dahl and Kolboe and the seven lumped reactions from the Dalian Institute of Chemical Physics (DICP) [27]. DICP identified the catalyst coke as CH2, consistent with the Shanghai Research Institute of Petrochemical Technology findings using the SAPO-34 catalyst, as shown in Table 1 [28,29]. The coke formed on the catalyst in reactor R-101 has the empirical formula CH2 (Reaction 1), consistent with findings from DICP and the Shanghai Research Institute on SAPO-34 coke characterization. In the regenerator R-102, coke combustion occurs via two simultaneous reactions: carbon oxidation to carbon dioxide CO2 as described in Reaction 11, and hydrogen oxidation to water as outlined in Reaction 12. The clear separation of carbon and hydrogen combustion enables precise kinetic modeling, as these oxidation reactions have distinct rate parameters. For each mole of CH2 produced, one mole of carbon and two moles of hydrogen are combusted, maintaining complete atomic balance throughout the reactor-regenerator system.
To enhance model accuracy, the methane formation pathway (Reaction 2) was expanded to include carbon monoxide formation (Reaction 9) and the water-gas shift reaction (Reaction 10). Additionally, the pentene reaction (Reaction 8) was analyzed together with ethane formation (Reaction 4) to more accurately represent product distributions. Economic feasibility was evaluated through raw materials, products, and utility costs using Turton’s correlations [30] and market data from Chemanalyst and ICIS [31,32].

2.2. Process Synthesis and Flowsheet Development

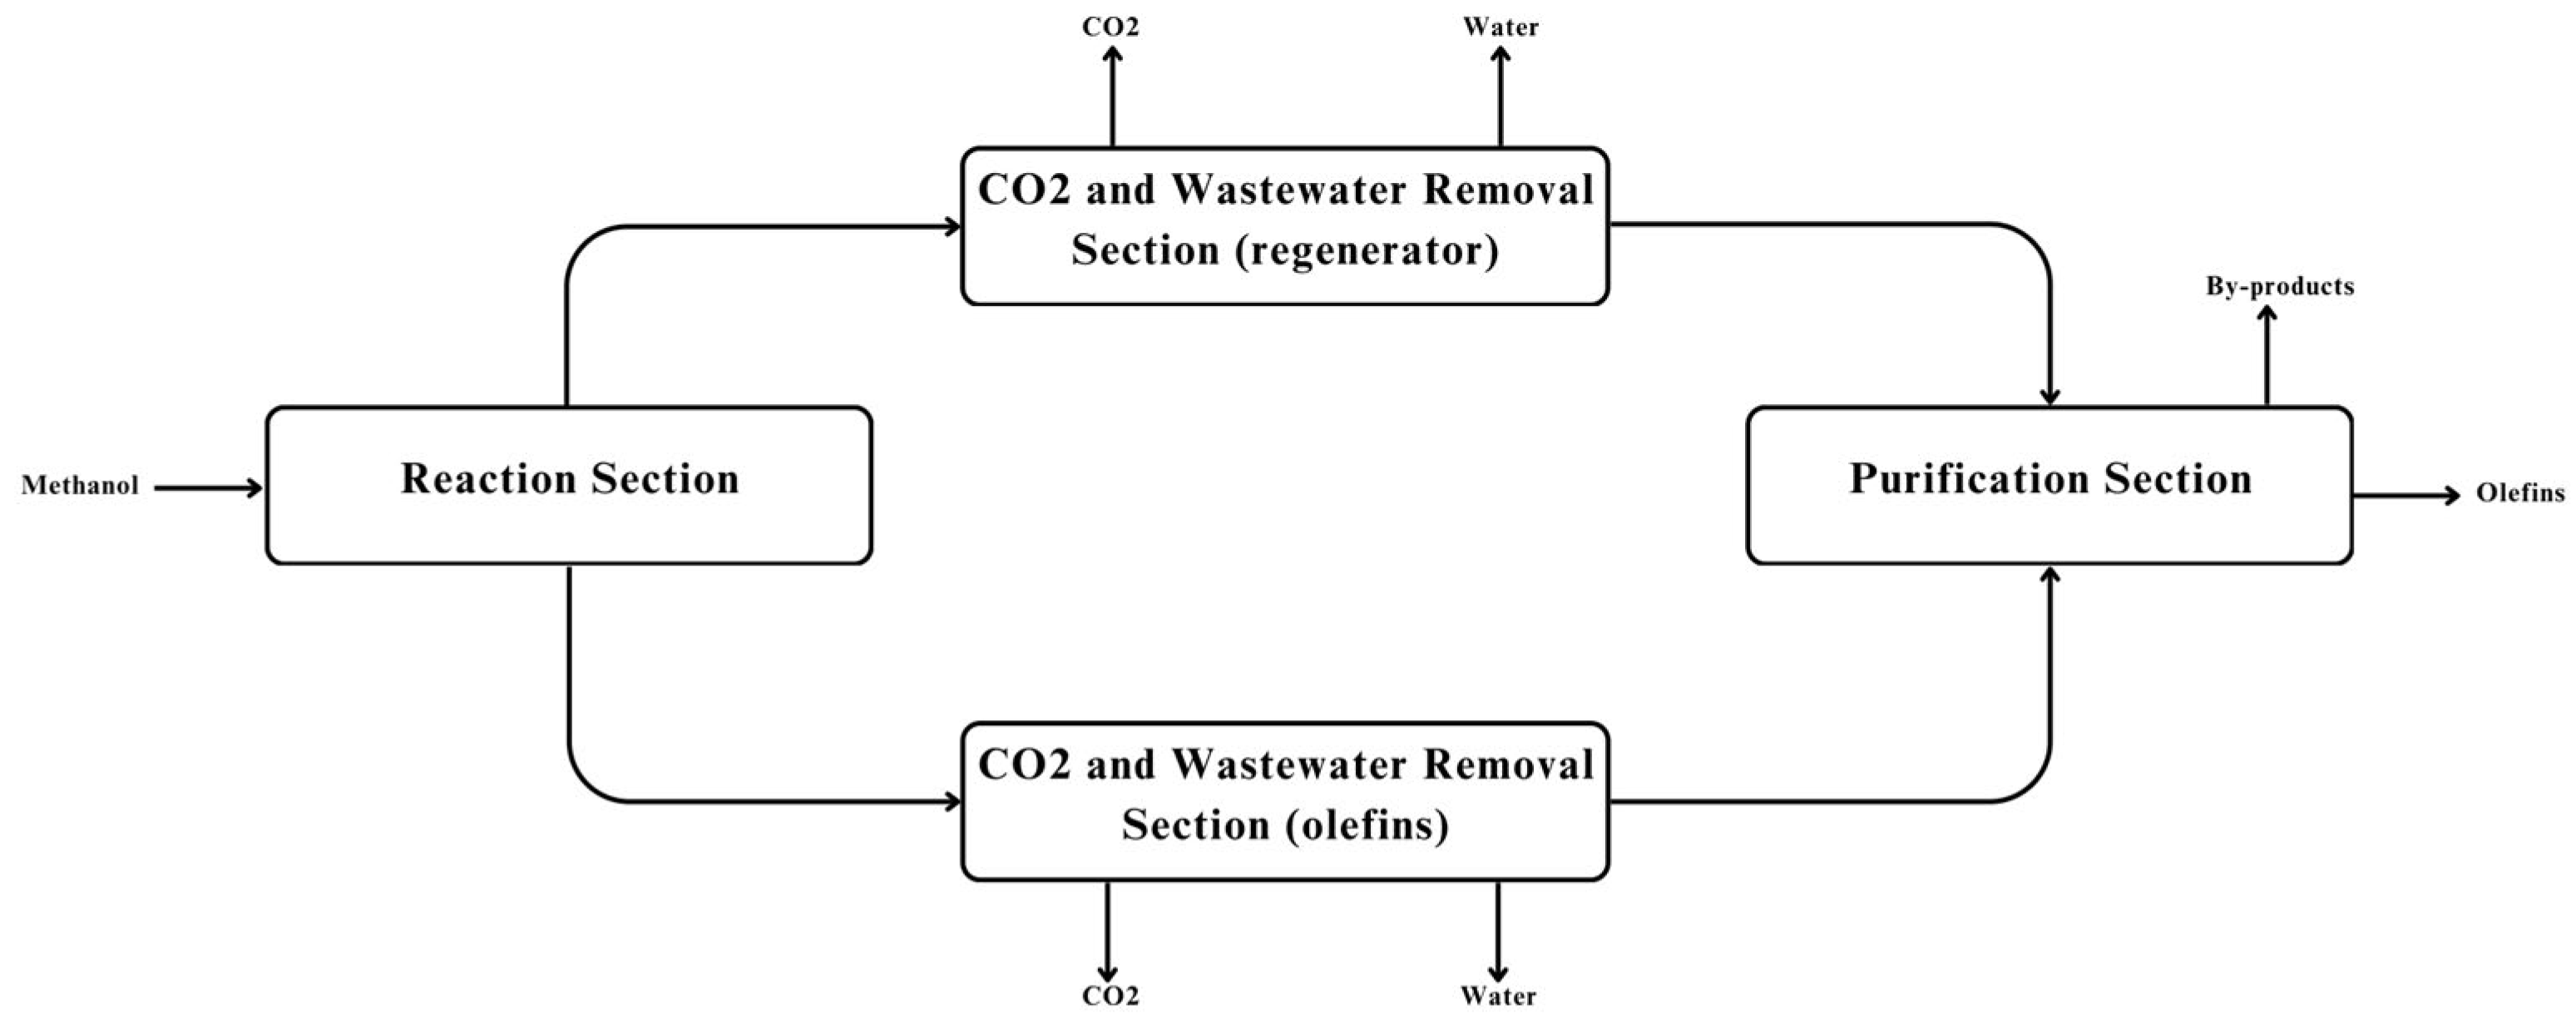
The process is designed around three primary stages, as illustrated in the block flow diagram (Figure 1). The process begins in the Reaction Section, where the methanol feed is preheated, pressurized, and catalytically converted into a stream rich in light olefins, water, CO2, and other hydrocarbons. This section is built around a reactor-regenerator system to ensure continuous catalyst activity.
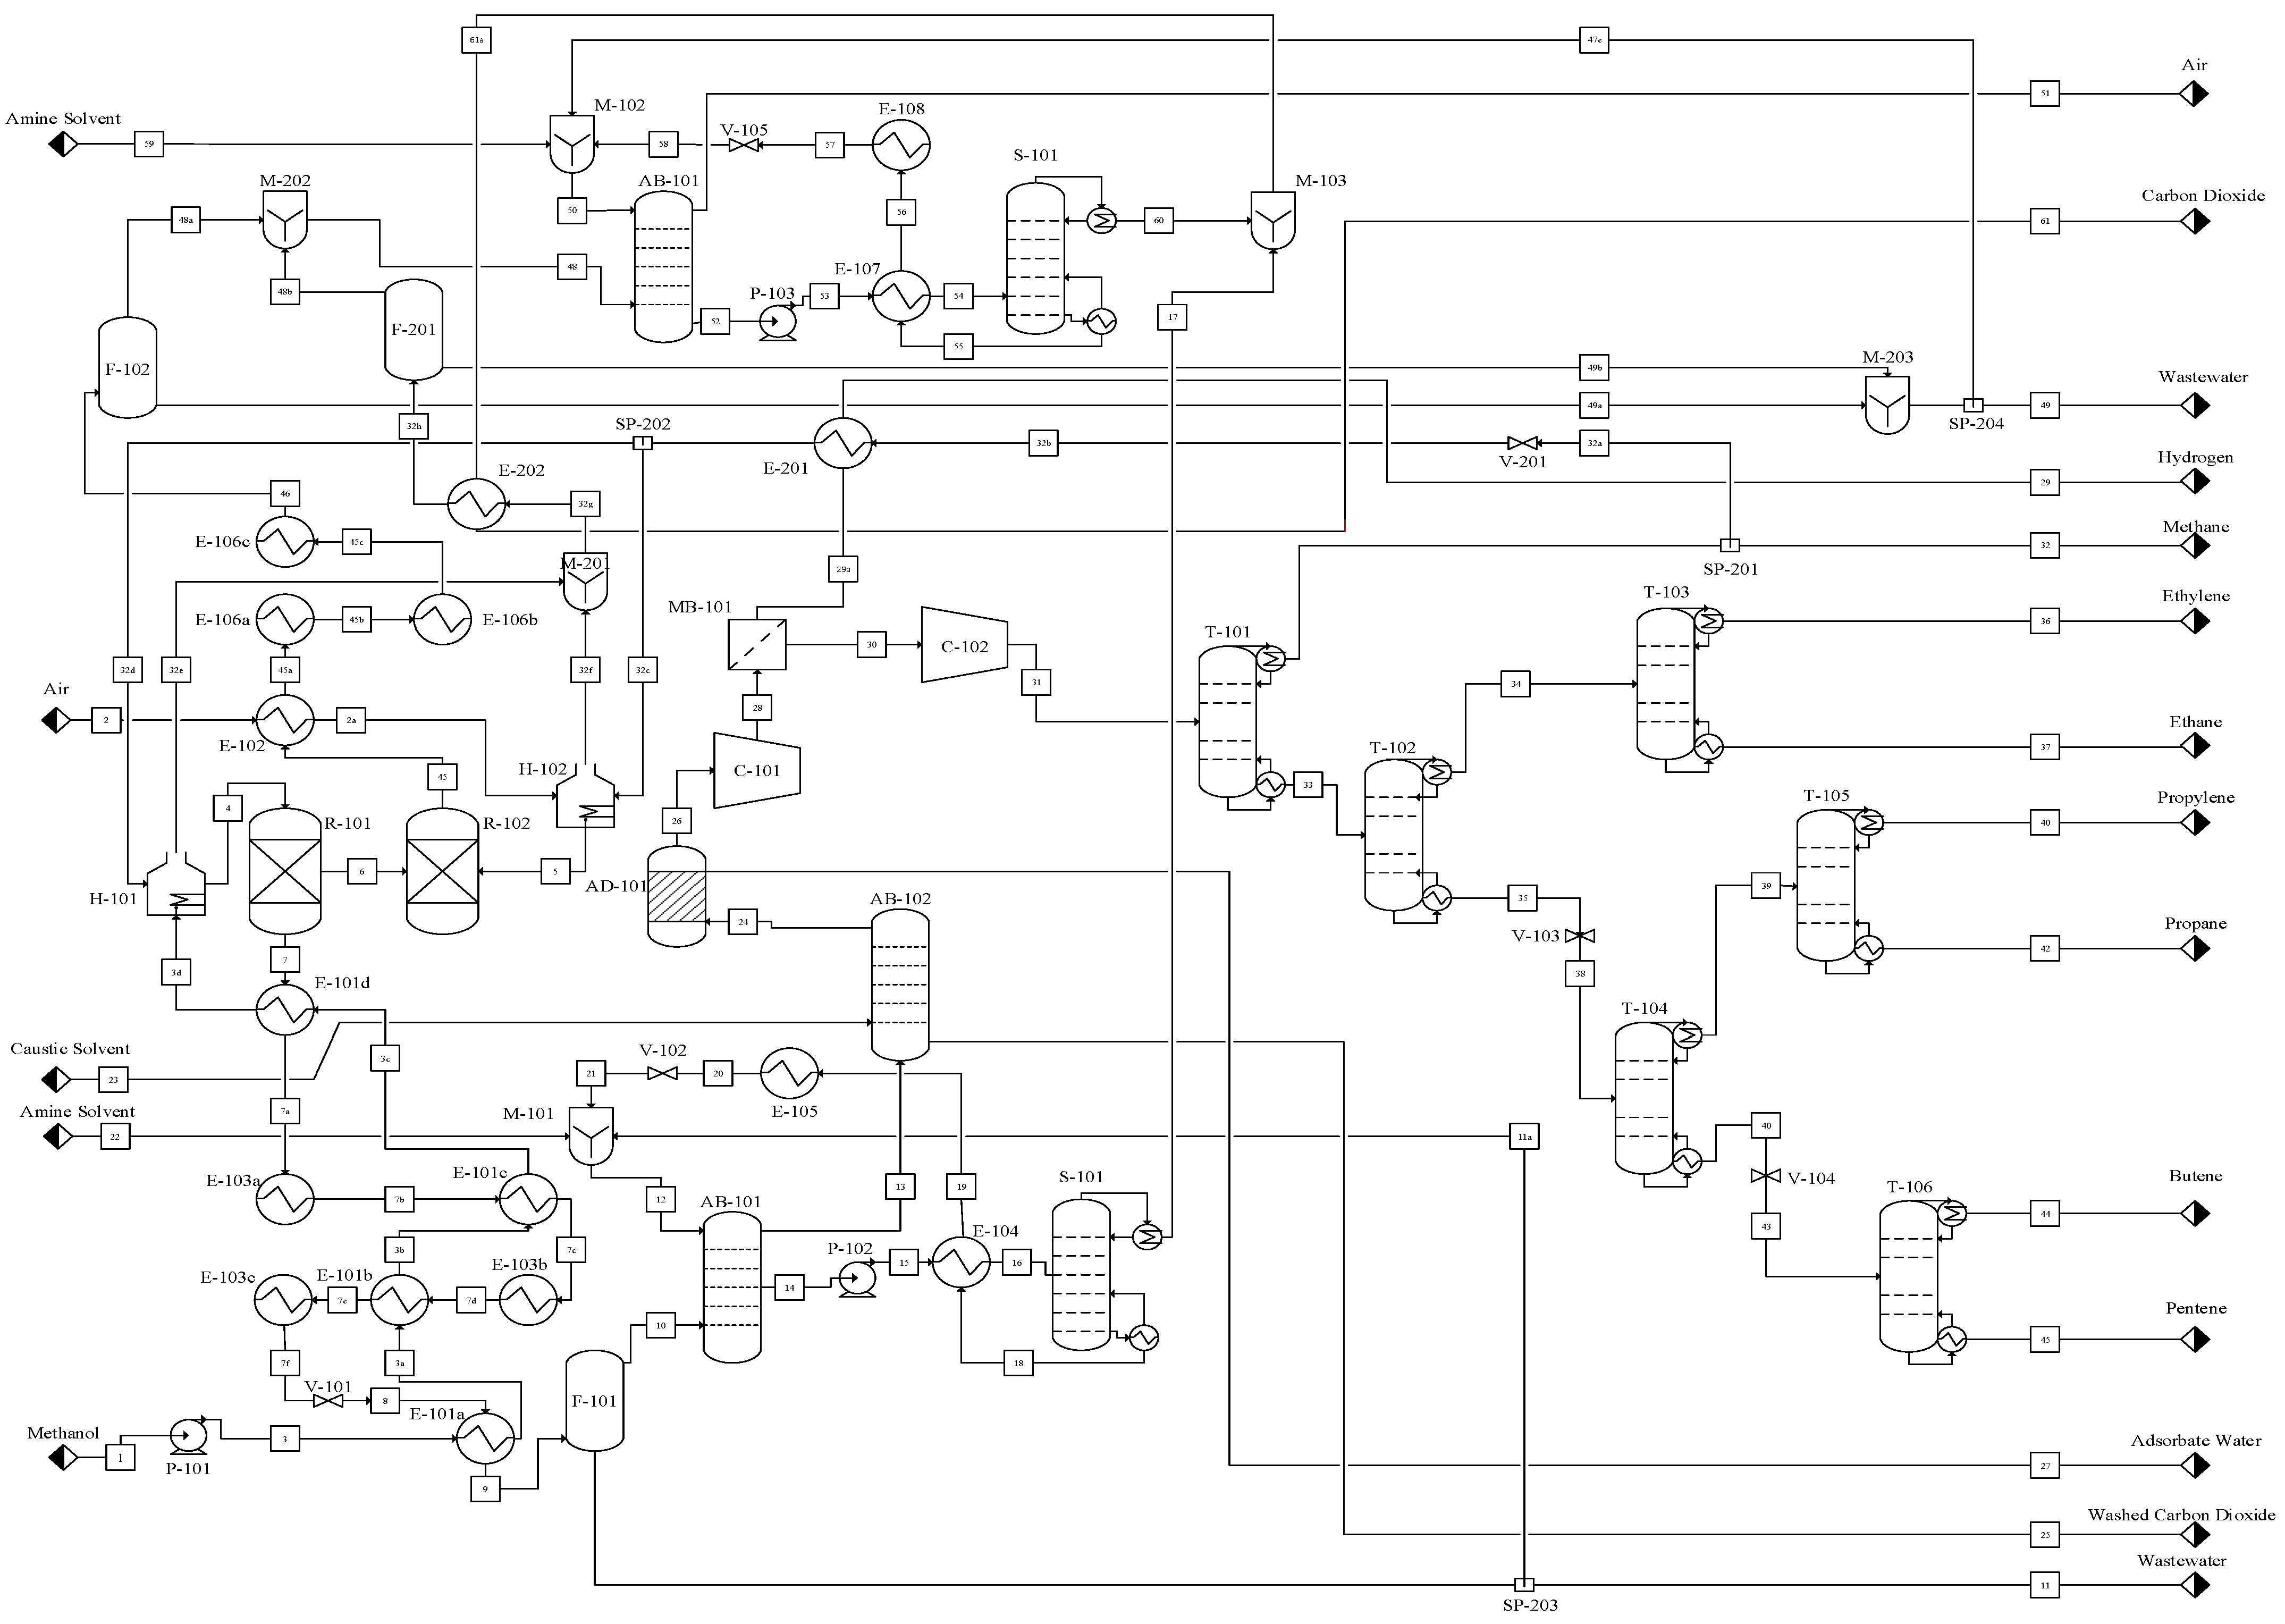
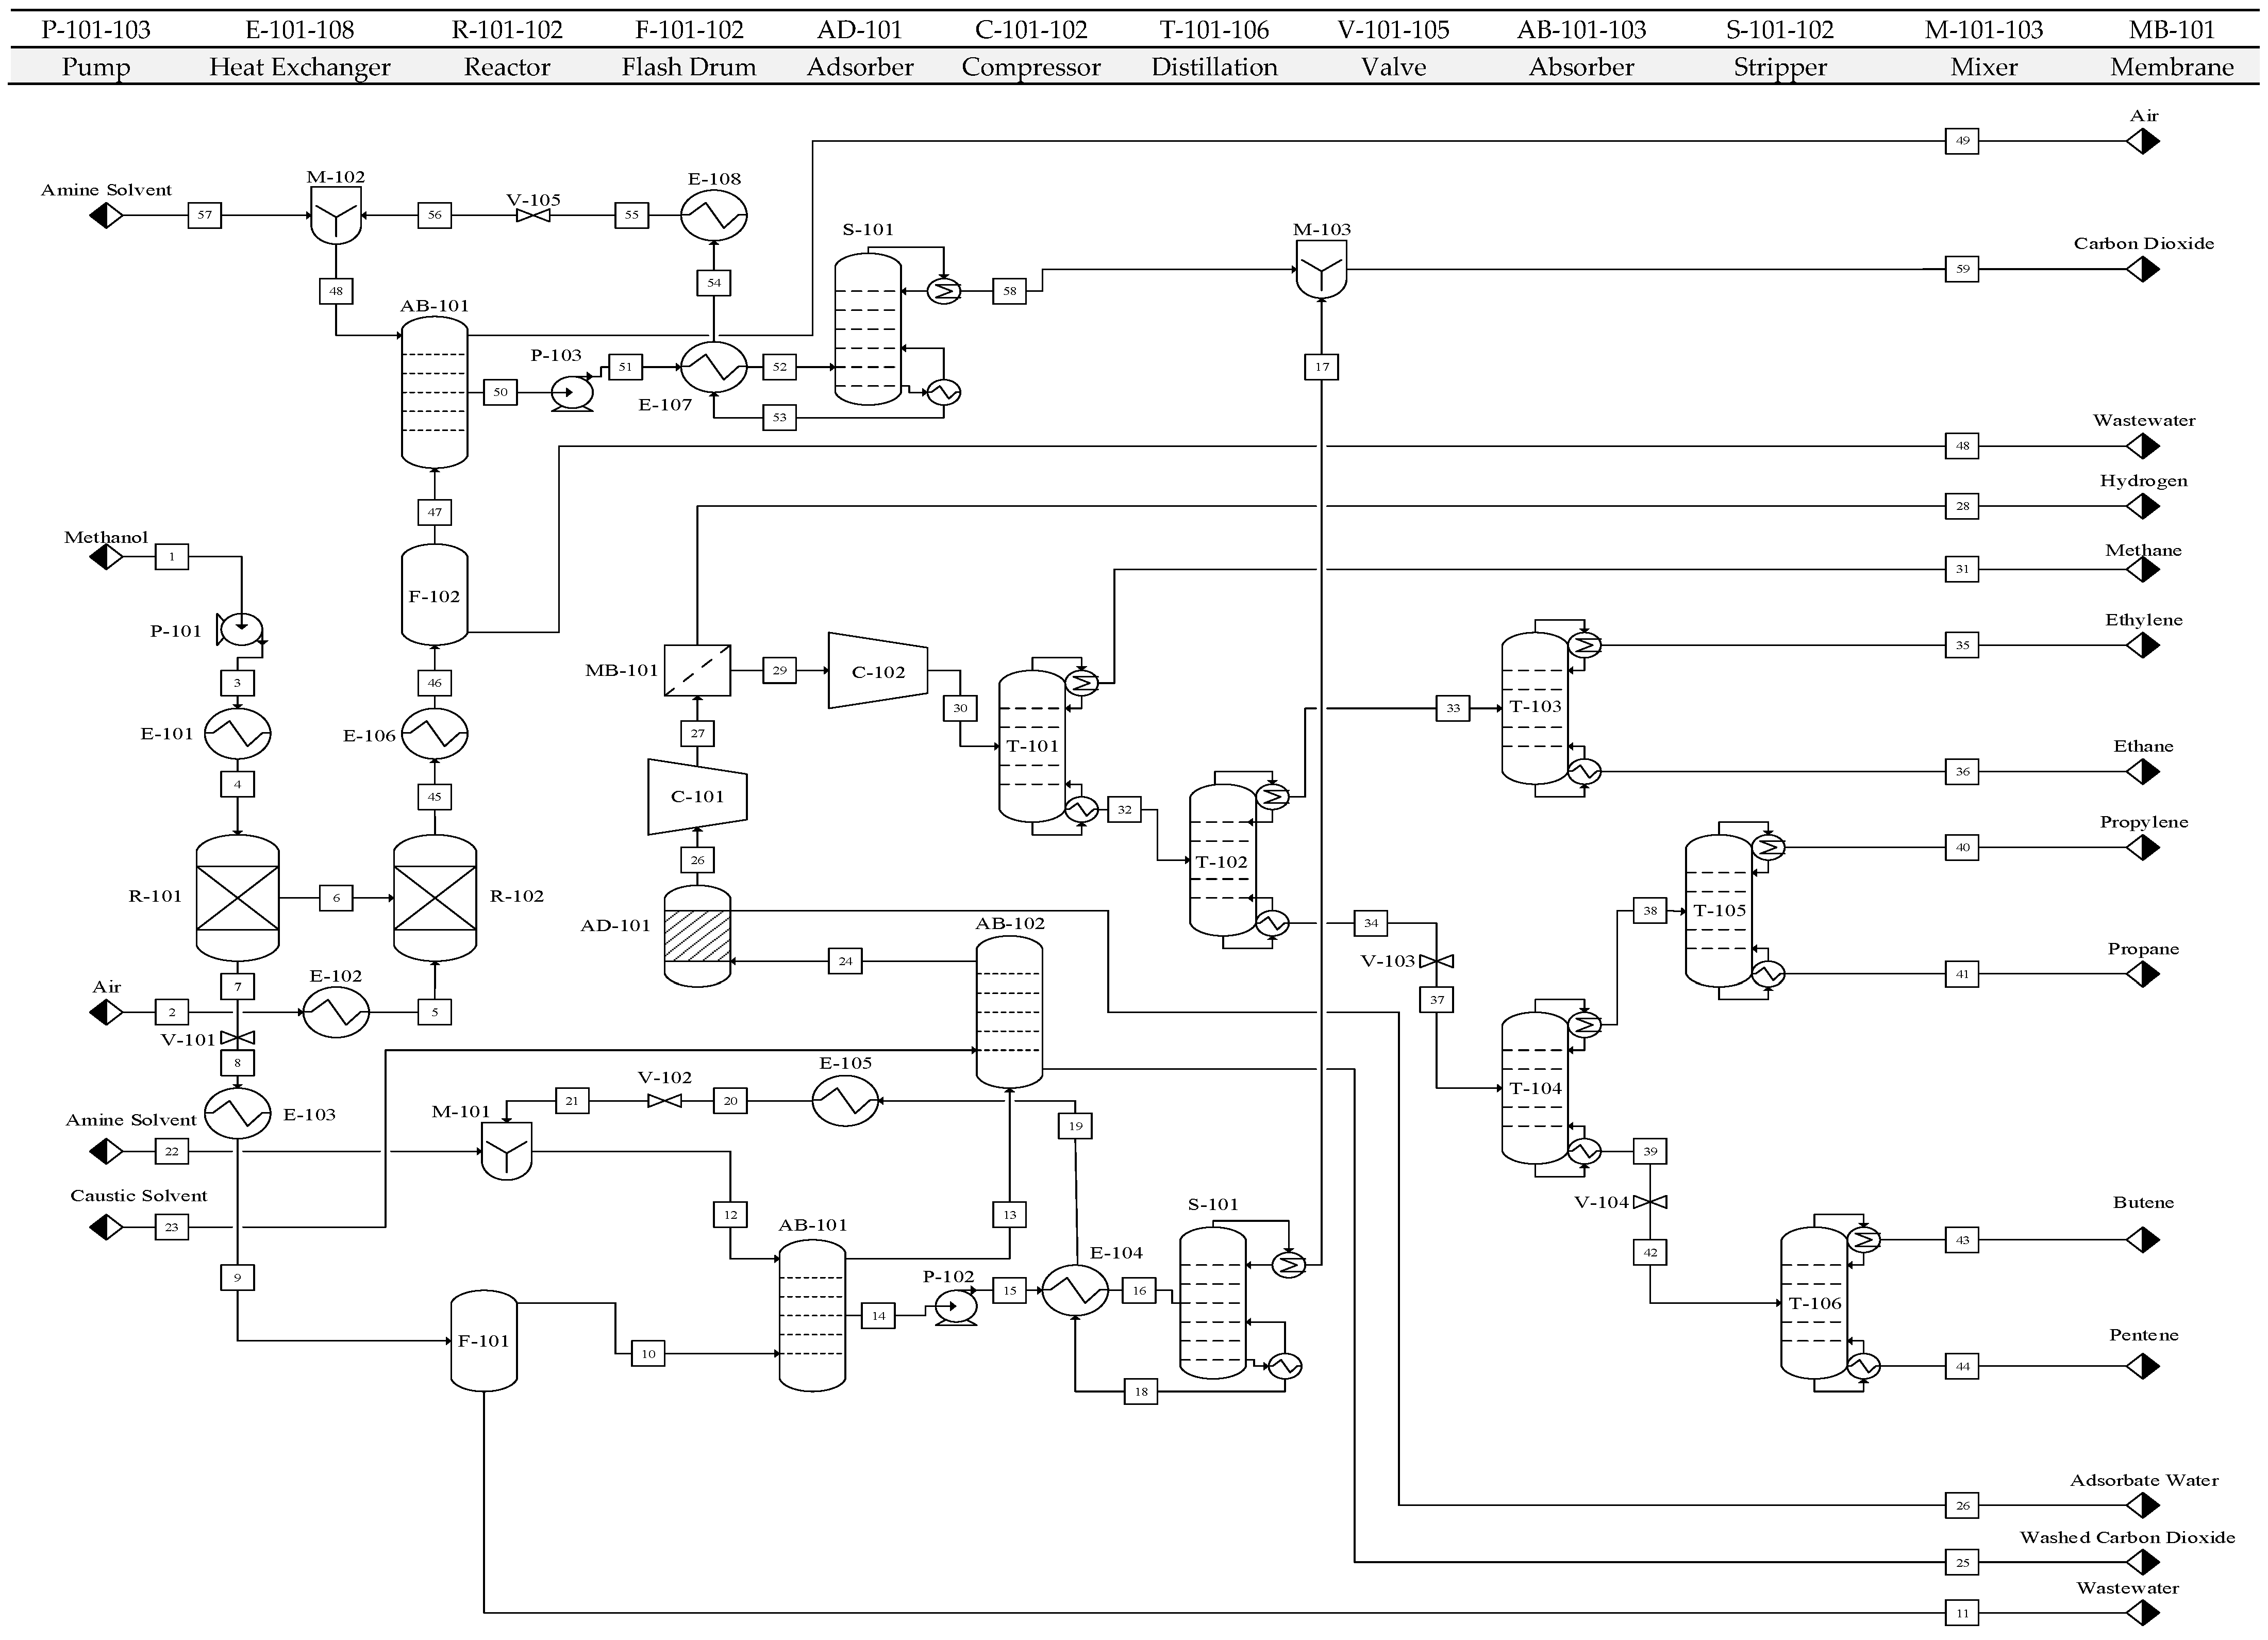
Figure 2 shows the detailed process flow diagram (PFD) of the base case MTO process. The effluent gases from the reactor enter the CO2 and Wastewater Removal Section. This stage involves cooling the effluent, removing condensed water via a flash drum, and capturing CO2 through a two-step chemical absorption process using aqueous monoethanolamine (MEA) [33] for bulk removal and a caustic soda (NaOH) wash for polishing [34]. A final adsorption step using a 3A molecular sieve ensures the complete elimination of water vapor to prevent freezing in subsequent cryogenic units [35].
The dry, purified stream then enters the Purification Section. A palladium membrane (MB-101) initially removes hydrogen to prevent interference with distillation [36]. Palladium-based membranes are recognized for their effectiveness in high-purity hydrogen separation applications, with the Pd-Ag alloy configuration providing excellent hydrogen permselectivity at elevated temperatures and pressures. Although not typically used in standard olefin facilities, hydrogen removal is essential in the MTO process because H2 is generated as a by-product of the reactions (Reaction 2 and Reaction 9 in Table 1). If not removed, hydrogen would accumulate in the cryogenic distillation columns, reducing separation efficiency. Following this, a series of six distillation columns separates the hydrocarbons. The sequence, detailed in the Supporting Information (Figure S1), is arranged to first group components by carbon number. Operating pressures are cascaded from 30 bar for C1/C2 separation, to 18 bar for C3 separation, and finally to 5 bar for C4/C5 separation to optimize energy efficiency.

2.3. Reactor Design and Optimization

A fluidized bed reactor configuration was selected for both the MTO reactor (R-101) and regenerator (R-102) to enable continuous catalyst circulation and reduce deactivation. The system was modeled as a plug flow reactor based on volume estimation similarity, incorporating void fraction and inlet-outlet velocity parameters to ensure fast fluidization [37]. The rate laws incorporated a deactivation term accounting for coke deposition on the catalyst. Table 2 and Table 3 present the kinetic and rate expressions for reactors R-101 and R-102. The first nine reactions follow first-order kinetics with respect to methanol, including a deactivation function based on the coke-to-catalyst mass ratio and a water effect defined by the feed water mass fraction (XW) and parameter (KW), along with the water-gas shift reaction. Coke combustion kinetics were defined as a function of oxygen partial pressure and coke content, with A, B, and D representing deactivation parameters.
A multivariable optimization performed in MATLAB (Version: R2023b) identified optimal conditions of 775 K, 4.5 bar, and 7.5% coke to catalyst, maximizing olefin yield. Figures S2–S5 illustrate the sensitivity analysis and reactor productivity.

2.4. Separation and Purification Section Design

In this section, a systematic methodology was adopted. First, for CO2 and wastewater removal, the theoretical number of stages in the absorption columns was determined using equilibrium data and mole balances, while the actual number of trays was estimated using O’Connell’s efficiency correlations. However, in the olefin purification train, a hybrid approach was applied: shortcut methods (Fenske, Underwood, Gilliland) [38] established initial parameters for the six distillation columns, followed by detailed optimization to determine the optimal reflux ratio by minimizing total annualized cost. For binary separations, the McCabe-Thiele [39] method was used to evaluate the theoretical number of trays.

2.5. Process Integration Methodology

A key objective of this work is to design an MTO plant by maximizing the resource efficiency through integrated heat and mass management. To achieve this goal, heat integration was performed by developing a heat exchanger network (HEN) using pinch analysis in Aspen Energy Analyzer (Version: V.14). The optimal minimum temperature approach (ΔTmin) of 15 °C was identified to balance capital investment and operating costs [40].
On the other hand, mass integration focused on waste minimization through direct recycling of methane-rich off-gas as fuel for process heaters and reuse of treated wastewater as makeup water for the carbon capture system. Utility reduction was further enhanced by generating high-pressure steam from wastewater using the reactors’ exothermic heat for column reboilers, while residual process streams, such as hot hydrogen and cooled CO2, were repurposed to preheat recycled methane and cool fired heater flue gases, respectively.

3. Results and Discussion

3.1. Optimized Reactor Performance

The performance of the coupled fast fluidized bed reactor (R-101) and regenerator (R-102) system was evaluated based on the multivariable optimization study. The study identified the optimal operating conditions that maximize the production of light olefins while ensuring stable, continuous catalyst activity as represented in Figures S2–S5. The key performance indicators for the optimized reactor system are summarized in Table 4.
Under the optimal conditions of 775 K, 4.5 bar, and a residual catalyst coke content of 7.5%, the reactor system achieves a methanol conversion exceeding 99.9%. The combined mass yield of the primary products, ethylene and propylene, is 33.87%. Simultaneously, the regenerator (R-102) is designed to achieve 100% conversion of the excess coke produced in the MTO reactor, ensuring that the catalyst is returned to the reactor at the optimal activity level. These results confirm that the systematic optimization of the reactor system successfully meets the primary design objectives of maximizing feedstock conversion and olefin yield.

3.2. Separation and Purification Performance

The performance of the separation and purification train was evaluated based on its ability to meet the stringent purity requirements for polymer-grade olefins and the efficiency of impurity removal. The results, summarized in Table 5, demonstrate the effectiveness of the designed units. The CO2 removal section achieves its targets through a two-stage absorption process. The primary MEA absorber (AB-101) removes 95% of the CO2 from the main process stream, while the secondary NaOH polishing absorber (AB-102) removes the remaining 100% to prevent freezing in the cryogenic units. The separate absorption system for the regenerator flue gas (AB-103) also performs with high efficiency, capturing 96.2% of the CO2.
The multi-column distillation train successfully fractionates the hydrocarbon mixture to produce high-purity products. The final ethylene product from the ethylene/ethane splitter (T-103) achieves a purity of 99.95%, while the propylene from the propylene/propane splitter (T-105) reaches 99.5% purity. The butene and pentene products from the final column (T-106) also meet their 99.5% purity specifications, confirming that all products meet polymer-grade standards.

4. Process Integration

Sustainability in process industries entails meeting present needs without limiting future generations, with sustainable manufacturing serving as a key implementation by integrating economic efficiency, environmental responsibility, energy optimization, and operational safety. This approach minimizes environmental burdens while maintaining competitiveness through effective by-product management, efficient heating and cooling, and reduced hazardous waste. However, the MTO process is constrained by high utility demands from extensive external heating and cooling. To address this, pinch analysis was employed to optimize energy integration by identifying process streams, constructing temperature interval diagrams, and applying the cascade method to determine minimum utility requirements, culminating in a heat exchanger network that significantly reduces energy consumption and improves process efficiency.

4.1. Pinch Analysis and Heat Exchanger Network

Hot and cold streams were identified, and their respective heat loads and average molar heat capacities were determined. Total heat duties, heat capacity flow rates, and supply and target temperatures for each stream are summarized in Tables S3 and S4. The methanol feed (Stream 3) entering heat exchanger E-101 underwent into three heating stages—sensible, latent, and sensible (final)—and was divided into three segments to accurately represent its thermal behavior.
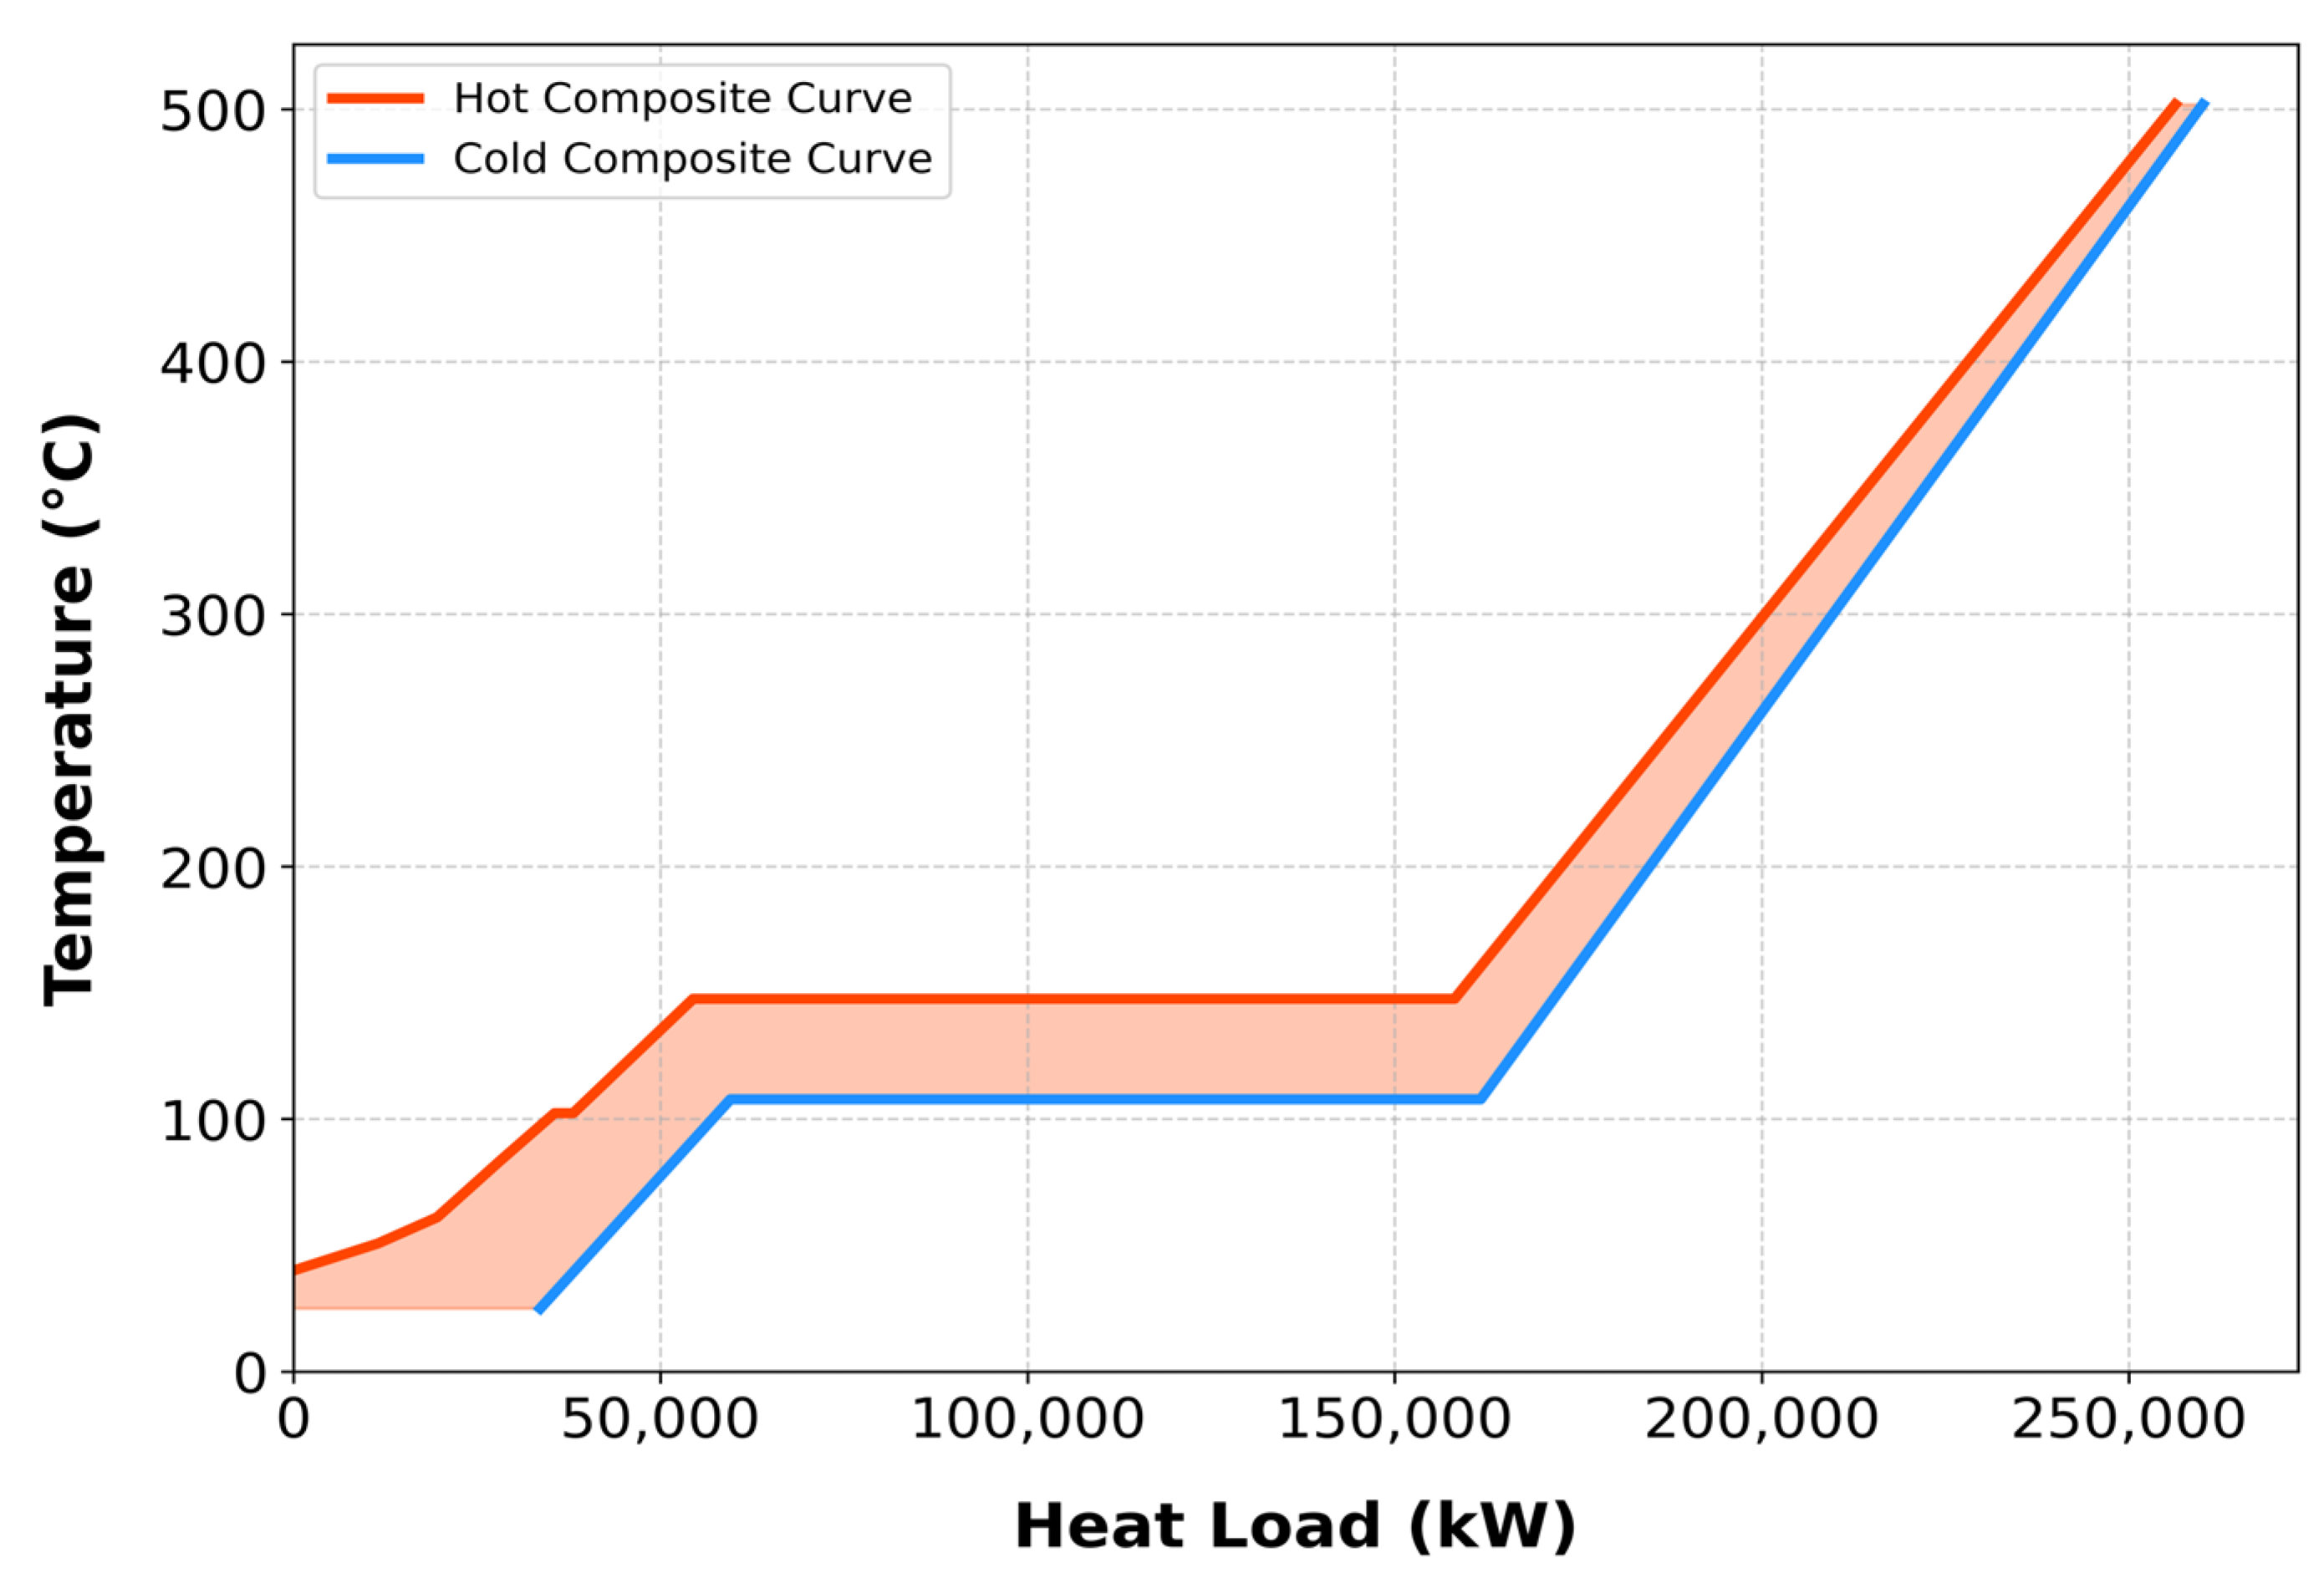
Hot and cold composite curves were superimposed to identify the pinch point, where the curves become tangent, representing the thermodynamic limit of heat recovery. At 107.12 °C, heat load reduction was insufficient because water boiled below methanol due to pressure reduction at valve V-101. To address this, the valve placement was modified, and Stream 7 was divided into two sub-segments with a valve inserted to prevent pentene liquefaction. This adjustment eliminated additional latent heat loads, requiring revision of the hot stream specifications, summarized in Table S5.
The composite curves were generated by combining hot and cold stream cumulative heating loads over each temperature interval. Figure S6 illustrates the revised composite curve after the modification. Pinch point at 501.85 °C.
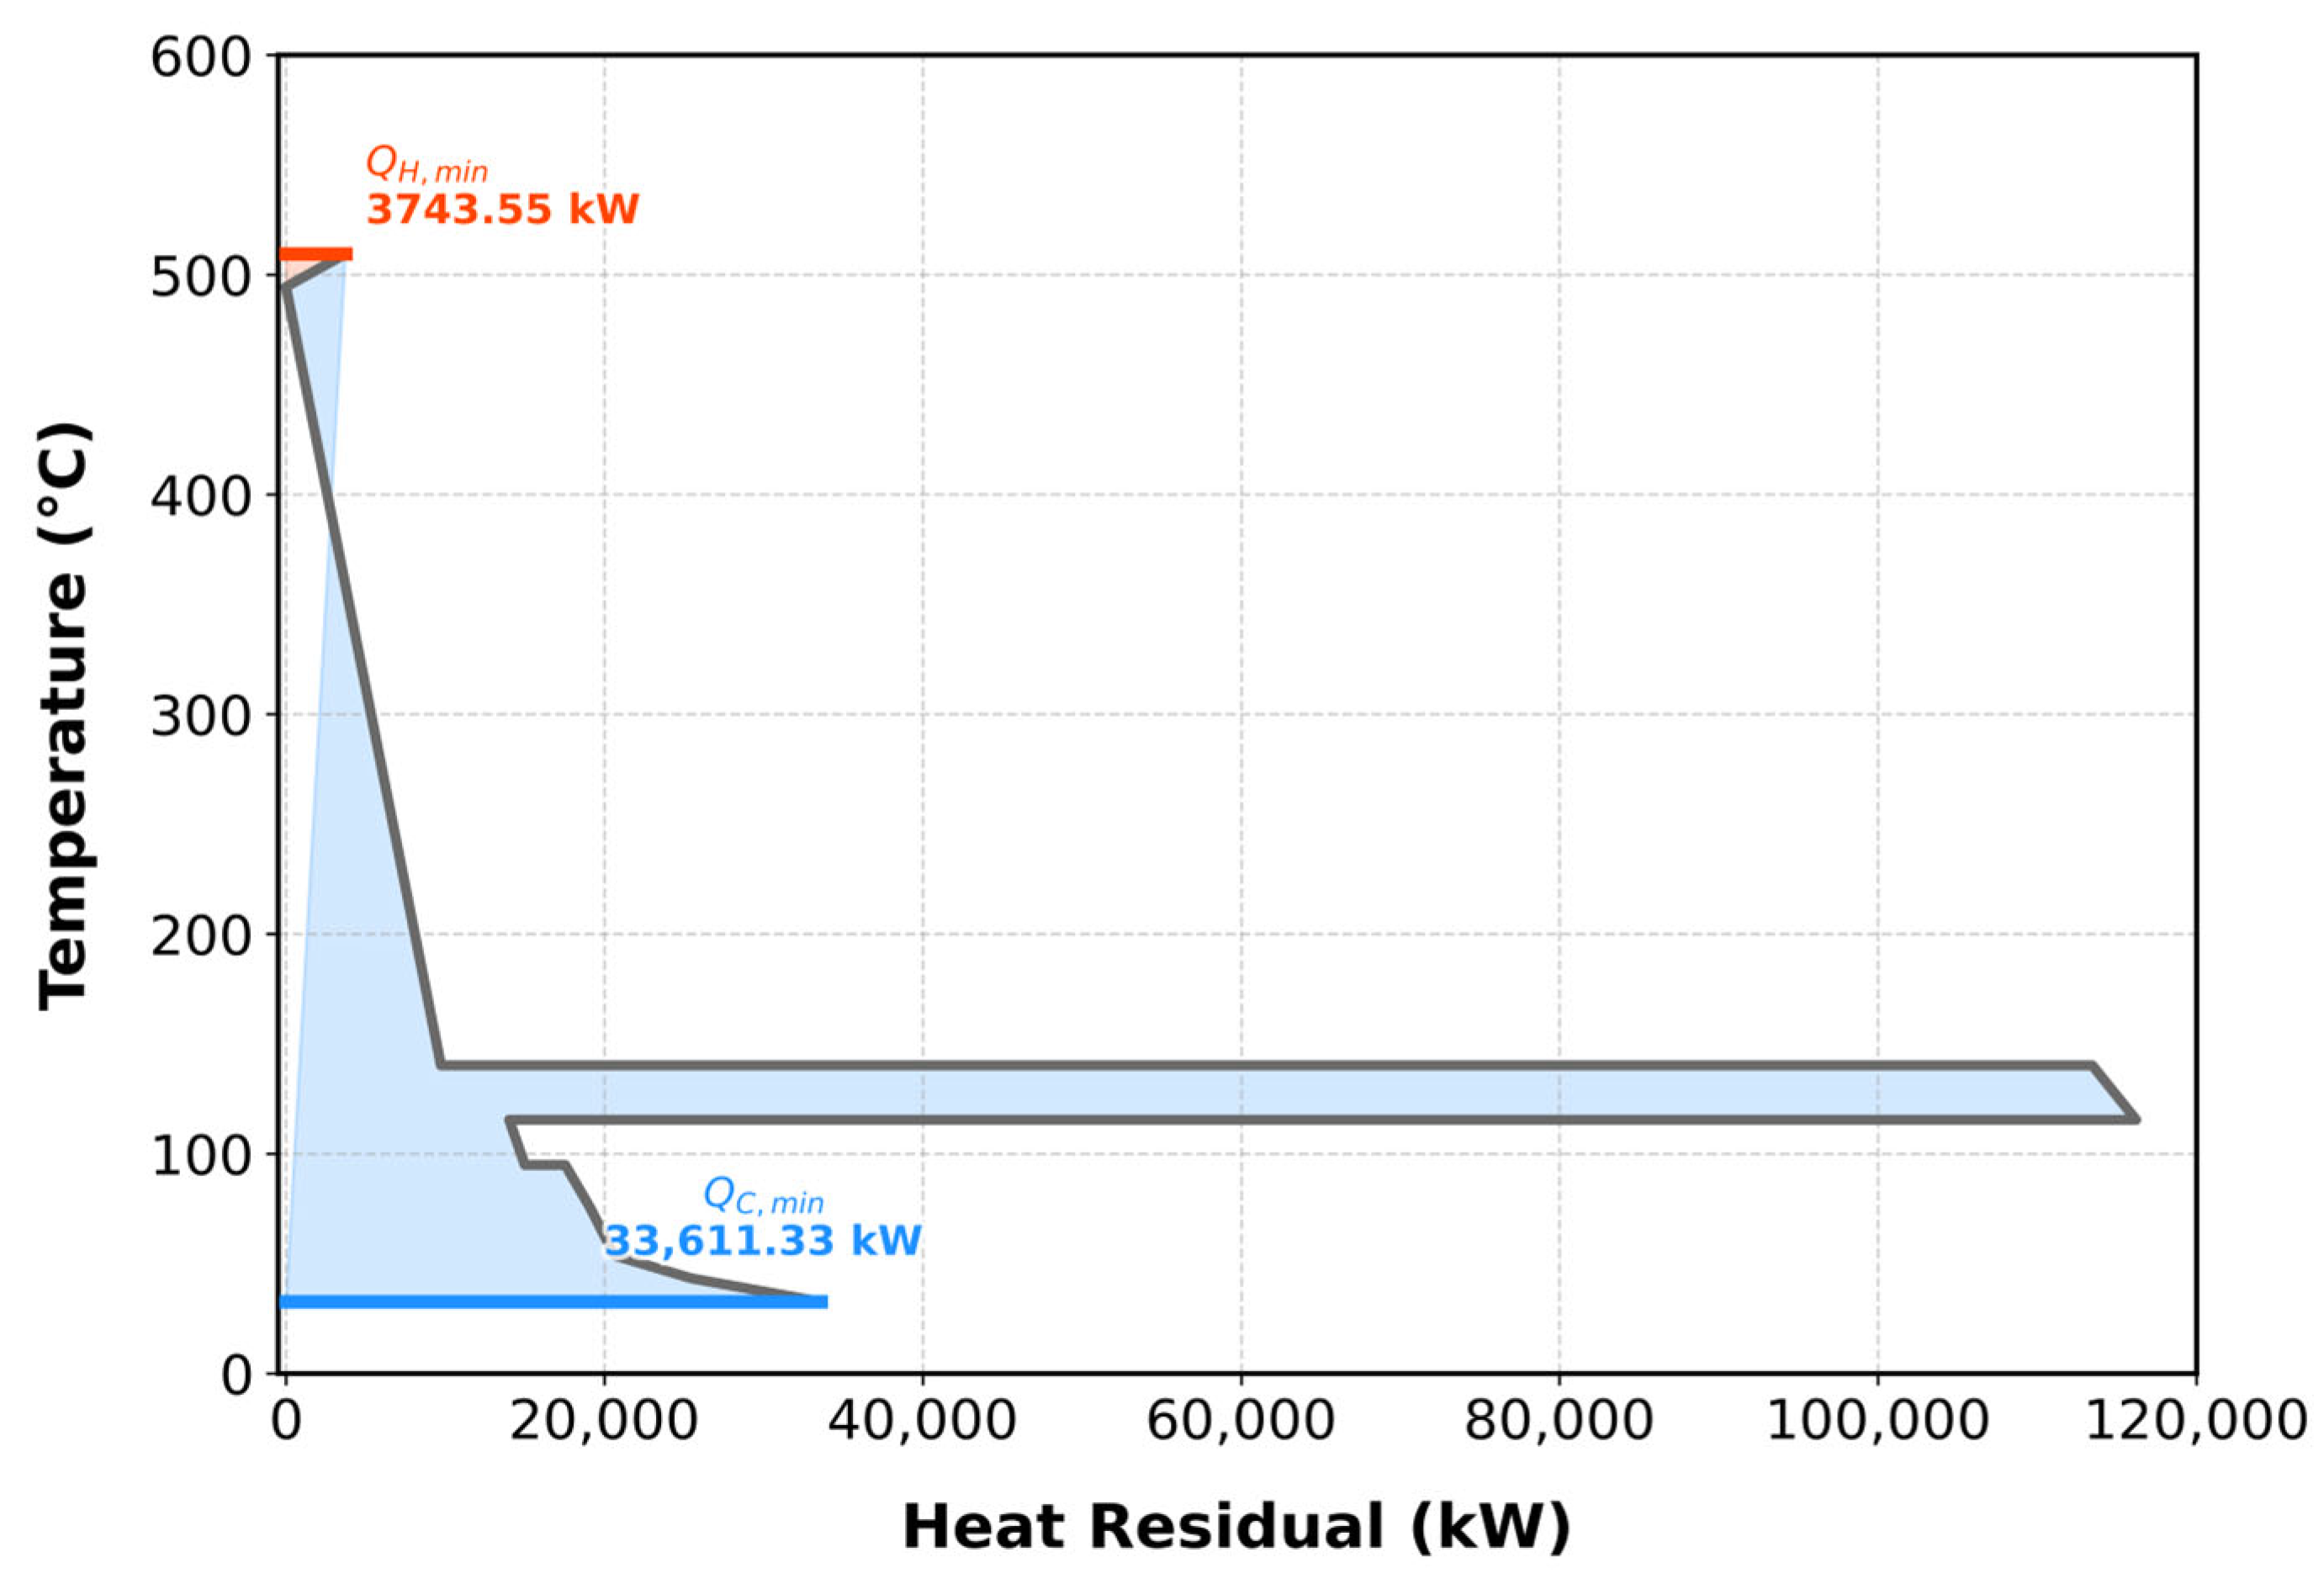
The minimum temperature difference (ΔTmin) between hot and cold streams represents a trade-off between heat exchanger capital cost and utility operating cost, with optimal values in petrochemical processes typically ranging from 10–20 °C. Using the Aspen Energy Analyzer, 20 scenarios were evaluated to identify the optimum ΔT corresponding to the minimum annualized cost. Figure S7 summarizes the cost index evaluations, while the T–H diagram (Figure 3) shows that the initial overlap of composite curves indicates the minimum cooling utility, and their final separation corresponds to the minimum heating utility. At an optimal ΔTmin of 15 °C, the minimum heating and cooling utilities were determined as Q ˙ _heating = 3743.55 kW and Q ˙ _cooling = 33,611.33 kW, respectively.
The algebraic cascade diagram was developed using a temperature interval diagram to ensure thermodynamic feasibility. Heat loads for each interval were calculated by adjusting temperatures and accounting for residual heat from the preceding interval, resulting in 11 temperature intervals, as shown in Figure S8. Multiple utilities were screened using the grand composite curve, constructed by plotting shifted temperatures representing the average of hot and cold stream temperatures against the revised residual heat loads. The highest negative residual value defines the minimum external heating requirement. Table S6 summarizes the shifted temperatures and corresponding residual loads, while Figure 4 illustrates the grand composite curve identifying the need for fired heaters and cooling water as external utilities.
The HEN was developed by matching hot and cold streams to meet minimum heating and cooling utility targets while minimizing the number of exchangers. The required network configuration was determined, ensuring compliance with both energy integration and utility requirements. The analysis concludes that two fired heaters and a total of 13 heat exchangers, including those associated with utilities, are required. Figure S9 depicts the heat exchanger network configuration that fulfills all energy targets following the stream-matching process. Theoretical reductions in utility heat load consumption were compared with the design and sizing of all heat transfer equipment using actual heat load values, demonstrating reductions of 98.35% in heating demand and 86.89% in cooling demand, respectively.

4.2. By Product Utilization Through Direct Recycling

Mass integration, commonly known as direct recycling, involves reintroducing unreacted feed or by-products into the process to reduce waste and improve overall productivity. This strategy enhances material utilization, decreases fresh feed consumption, and supports sustainable process operation by minimizing environmental impact. Three actions are proposed here: (i) direct recycling of methane, (ii) carbon dioxide and water removal section revision, and (iii) direct recycling of wastewater.
(i) In fact, the process employs two fired heaters that utilize methane as fuel, sourced from column T-101. The methane stream produced in the process, containing 99 mol% methane with minor ethylene impurities, was utilized directly as fuel for the fired heaters. The presence of ethylene enhances the mixture’s heating value, improving fuel efficiency and reducing the required fuel flow rate. Before entering heat exchangers H-101 and H-102, the methane stream is conditioned to 1.1 bar and 298.15 K. An energy balance on the adiabatic throttling valve V-201 reduces the pressure from 30 bar to 1.1 bar, resulting in an outlet temperature of 133.02 K, followed by reheating to 298.15 K. Table S7 summarizes the corresponding calculations.
(ii) Integrating the existing carbon capture unit on the regenerator side is more practical, as the fired heater effluent comprising air, moisture, and carbon dioxide has a lower flow rate than the R-102 outlet. Mixing both streams before AB-103 enables capture, requiring only a 4.28% increase in solvent molar flow. Establishing a new capture section would be economically unfeasible due to higher fixed costs. Therefore, redirecting the fired heater flue gases, which have a composition like the regenerator outlet, into the existing unit is optimal. Mixer M-201 was added to combine the streams before E-202, ensuring inlet conditions of 313.15 K and 1.1 bar consistent with the original capture unit.
(iii) Finally, the carbon capture section design required water makeup to maintain stable operation, presenting an opportunity to utilize process-generated wastewater to partially meet this demand. Material balance calculations for flashes F-101, F-102, and F-201 confirmed adequate water purity for reuse. Although F-101 may contain trace methanol before recycling Stream 11, these traces are expected to exit through condenser S-101 due to methanol’s higher volatility, preventing accumulation in the system. Table S8 summarizes the amount of recycled wastewater allocated to each carbon capture section.

4.3. By Product Utilization Through Indirect Recycling

Indirect recycling utilizes by-products as process utilities to reduce energy consumption and utility costs. It contributes to economic optimization by recovering useful energy or material from secondary streams.

4.3.1. Indirect Recycling of Wastewater

The wastewater stream generated within the process was determined, from material and energy balance calculations, to consist of almost pure water. Although indirect recycling is not feasible due to its operating conditions, converting this stream into steam provides a practical and flexible alternative that enhances opportunities for energy integration. In standard utility systems, high-pressure steam is produced through sequential preheating and furnace heating to meet process heating requirements; the same concept can be applied by utilizing heat release from highly exothermic reactions via reactor cooling jackets [41]. Table 6 summarizes the associated heat duties and operating temperatures for the relevant reactors.
The wastewater stream consists primarily of reaction co-product water, making up over 99.5 wt%, with trace impurities including residual methanol at less than 0.3 wt%, dissolved light hydrocarbons at under 0.1 wt%, and MEA at below 0.1 wt%. These impurities have minimal impact on the thermophysical properties and heat transfer calculations, with deviations from pure water properties remaining under 2% at these concentrations. The heat exchangers are built with standard fouling factors (0.0002 m2·K/W) to accommodate potential organic deposits from thermal decomposition. A continuous purge stream of 1–2% of the flow is recommended to prevent long-term accumulation of non-volatile species.
The use of wastewater in high-pressure (HP) steam generation is not yet common in all olefins plants; however, it is consistent with established steam-cracking practices. In these practices, process condensates such as quench water, dilution steam generator return, and decoking effluent are routinely recycled as boiler feedwater. Industry examples include the ExxonMobil Singapore Olefins Plant and several modern ethylene crackers that employ condensate recovery and boiler feed integration strategies [42]. These established precedents confirm the technical viability of our proposed HP steam generation using treated process water.
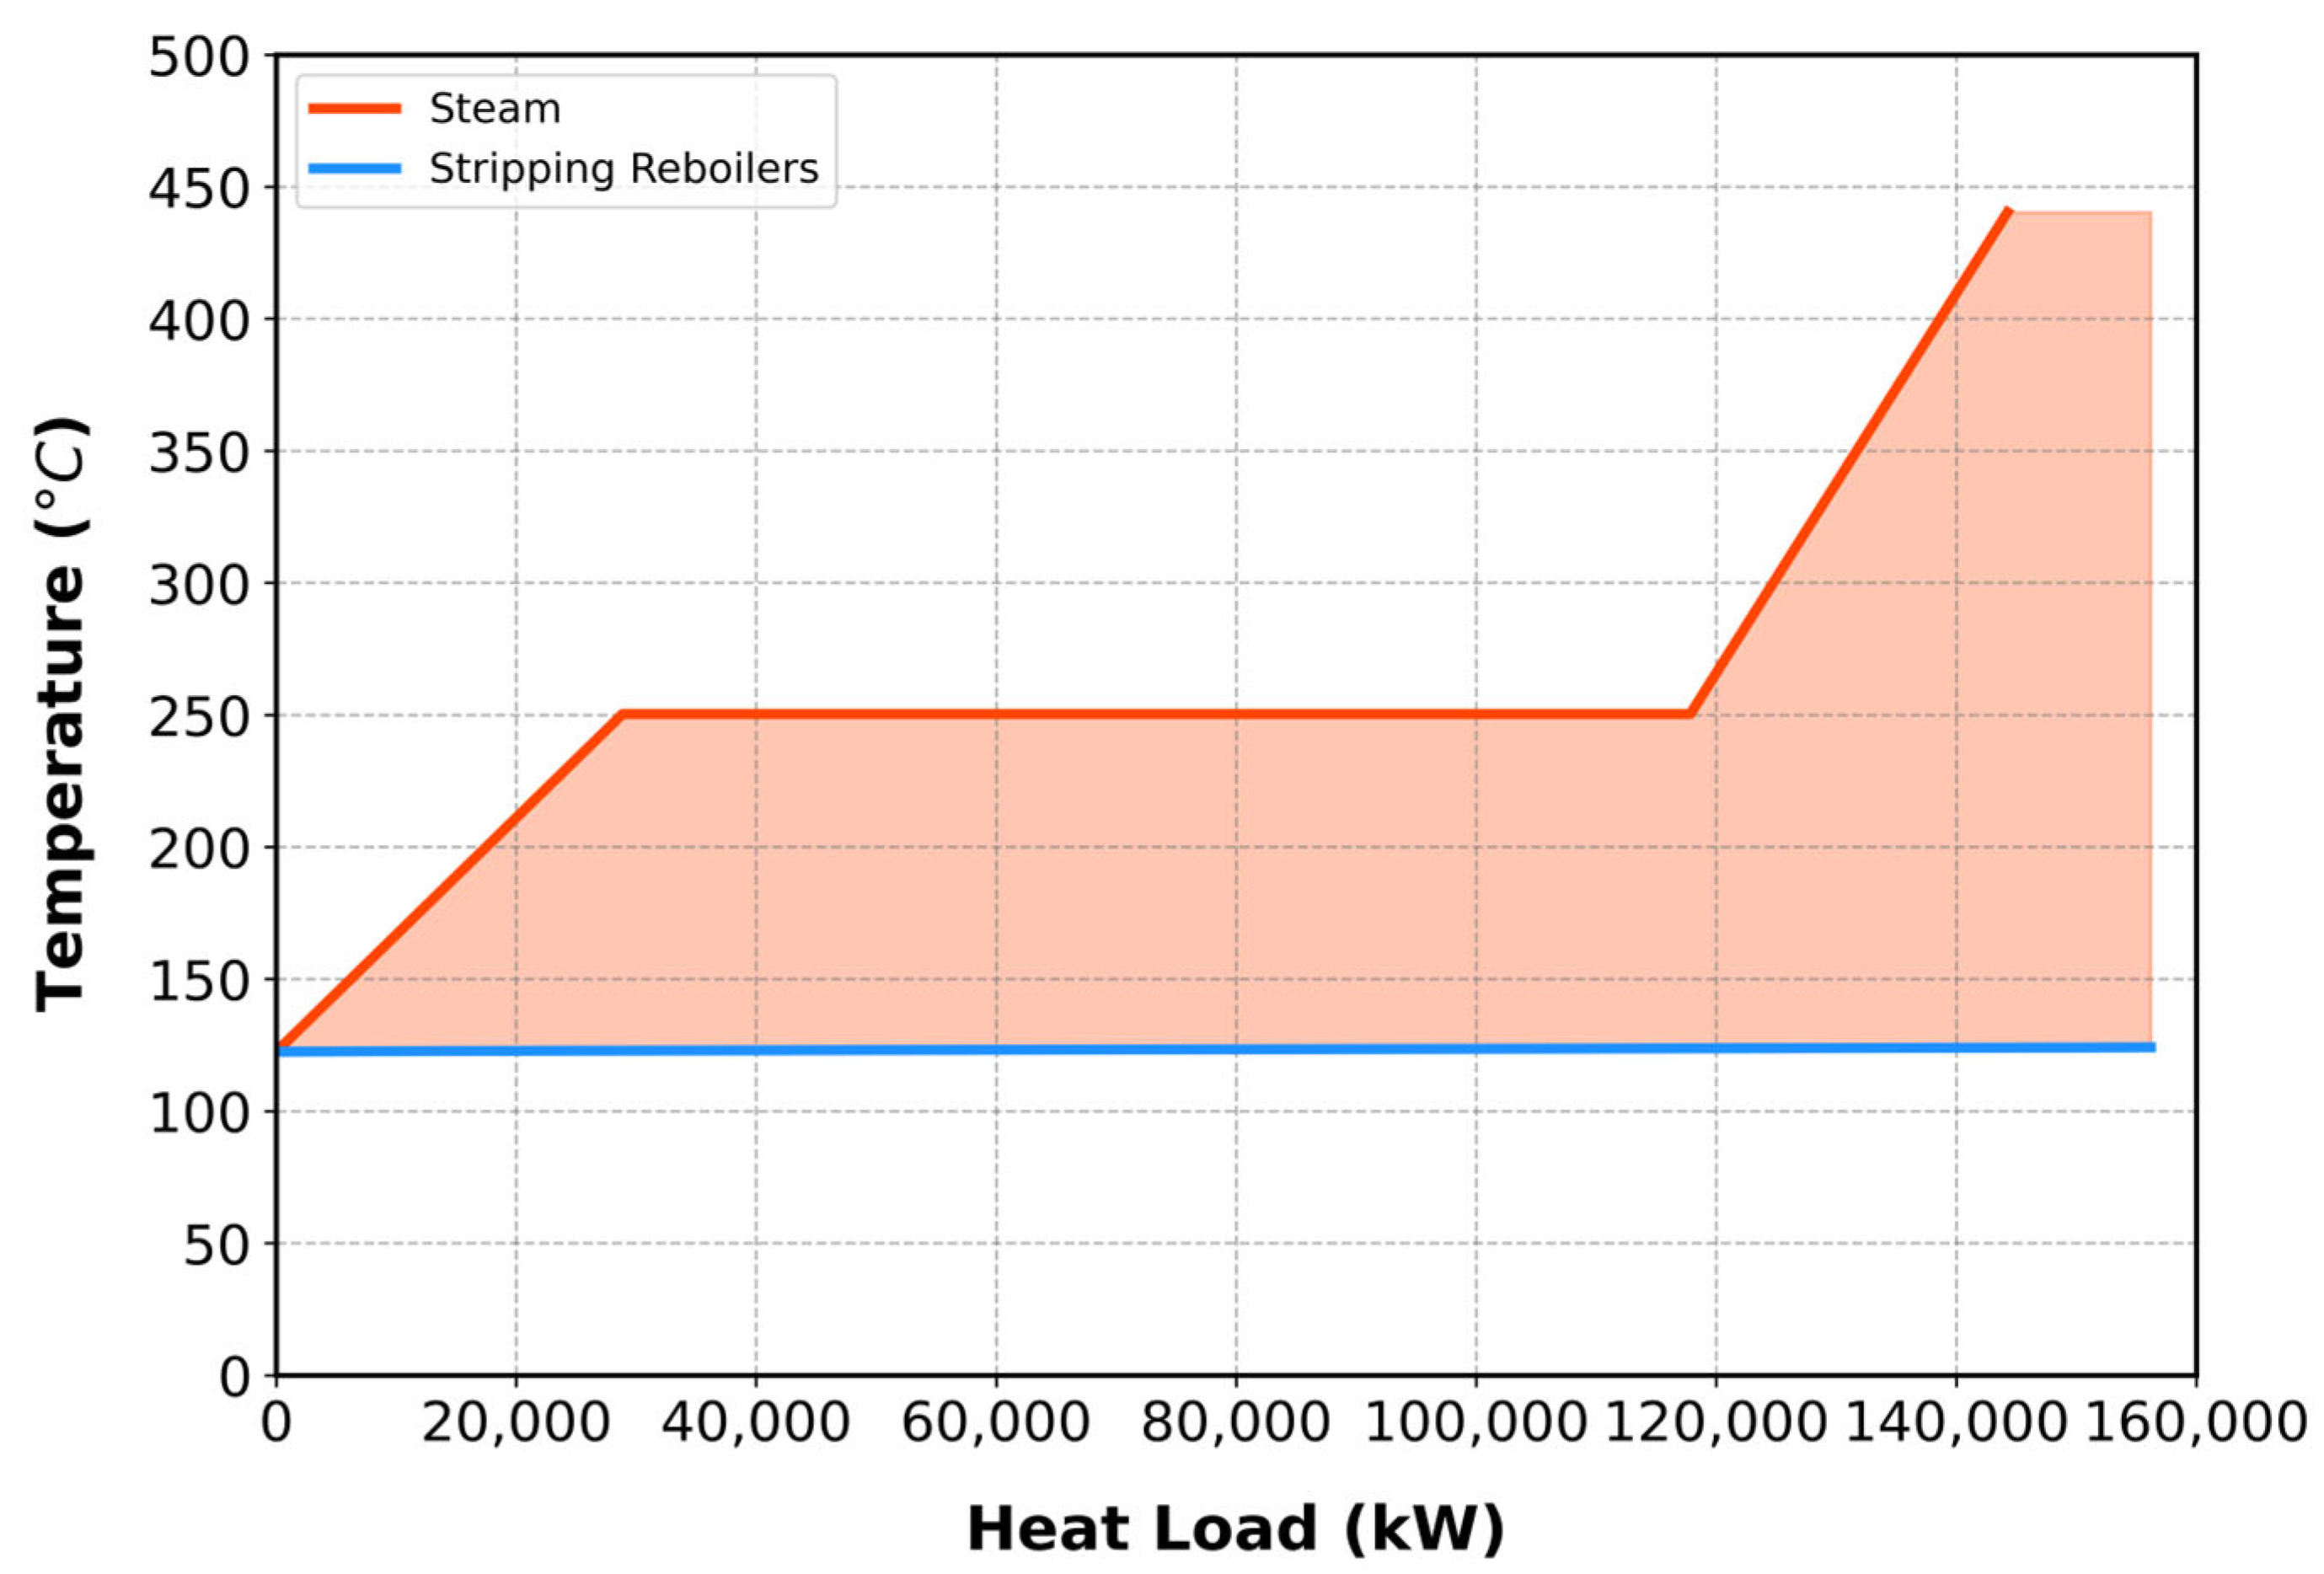
Steam generation occurs in two stages: liquid wastewater is first blended in mixer M-204 and pressurized from 1.1 to 40 bar by pump P-201, then heated via reactor cooling jackets to produce superheated steam for process heating. Molar flow rates are converted to mass flow rates to enable steam table calculations under isobaric conditions. At 40 bar, the steam temperature reaches 440.3 °C, indicating efficient heating below the reactor’s operational limit. To avoid freezing at elevated pressures, the outlet water temperature is limited to 2 °C. The total heat duty comprises sensible heating, latent vaporization, and sensible cooling, each evaluated separately. Using steam tables, the heat capacity and heat load were extracted for pinch analysis, treating water as a hot stream. Table S9 presents the steam stream data used for heat integration to minimize energy consumption and the number of exchangers in distillation and stripping reboilers, while Table S10 summarizes the cold streams.
The superheated steam generated from the process was integrated with boilers S-101 and S-102. Thermal pinch analysis, shown in Figure 5, identified a pinch point at 122.45 °C. Using the Aspen Energy Analyzer, 20 scenarios were assessed to determine the optimal condensed water outlet temperature of 126.45 °C, corresponding to the minimum annualized cost. Figure S10 presents the cost index evaluation results.
The integration of the water utility stream with reboilers S-101 and S-102 was successfully achieved, reducing dependence on external steam sources. Figure S11 presents the heat exchanger network illustrating the stream-to-boiler integration, where the heat is reduced by 91.78%.
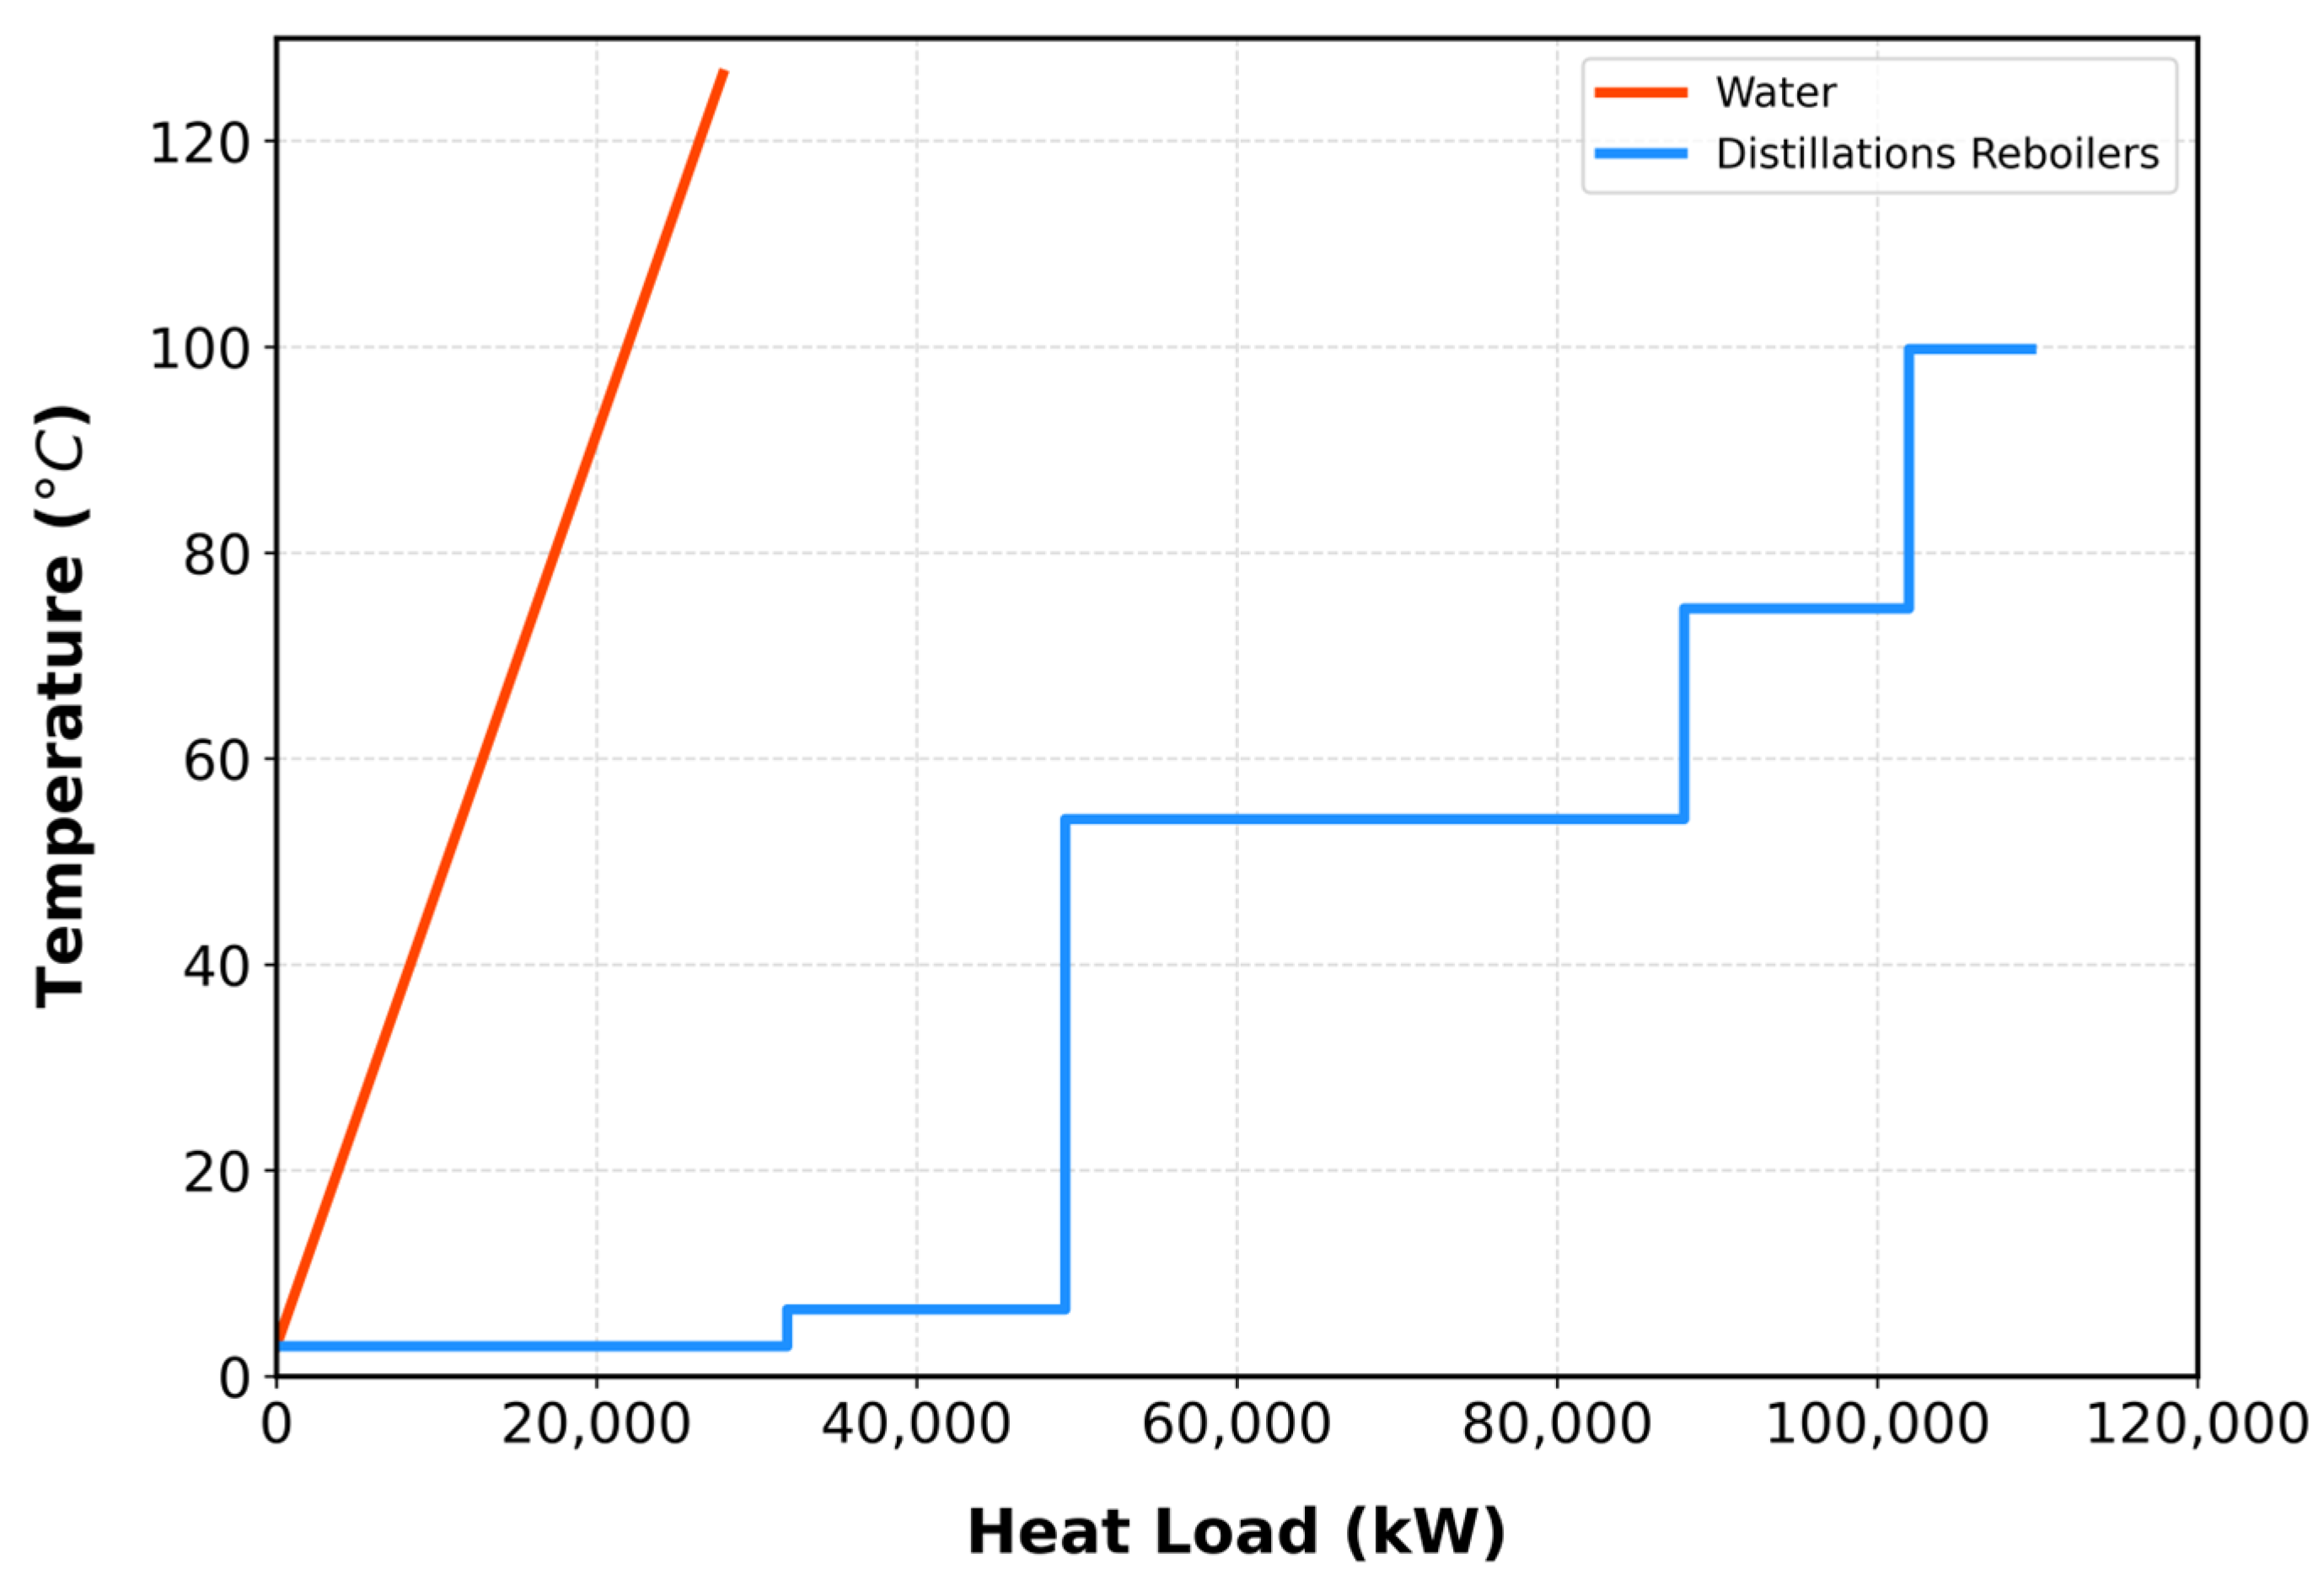
Further heat integration was achieved by utilizing the remaining portion of the water utility stream. As shown in Figure 6, the utility stream acted as a hot stream, while the distillation reboilers served as cold streams. Pinch point analysis identified a thermal pinch with a temperature difference of 2.91 °C. Using the Aspen Energy Analyzer, the optimal outlet temperature was determined to be 7.91 °C, as summarized in Figure S12. Figure S13 illustrates the heat exchanger network integrating the utility stream with the T-101 reboiler, achieving a 24.11% energy reduction for T-101 and an overall 63.68% reduction in energy consumption across all columns.

4.3.2. Indirect Recycling of Hydrogen-Captured Carbon Dioxide

Hydrogen is indirectly recycled to provide the heat necessary for elevating methane to the fired heaters’ operating conditions. High-temperature hydrogen from unit MB-101 is utilized to preheat the methane stream, enhancing overall energy efficiency without affecting the streams’ physical or chemical characteristics. To satisfy a thermal duty of 36.181 kW, the hydrogen outlet temperature was maintained at 622.14 K.
Similarly, the captured CO2 stream exiting condensers S-101 and S-102 at high flow rate and low temperature serves as a low-grade heat source, effectively used to cool flue gases prior to their entry into AB-103. Using the same methodology applied to the hydrogen stream, the CO2 outlet temperature was determined. As the flue gas undergoes partial condensation, pinch analysis was conducted to detect possible thermal constraints. The analysis revealed no pinch points, confirming the elimination of additional cooling utilities. Figure S14 presents the composite curves for the flue gas and cooling streams, illustrating heat integration potential, while Figure 7 shows the revised MTO process flowsheet reflecting the process integration, and Figure S15 reflects the continued utility process flow diagram of indirect recycling of wastewater.

5. Economic Analysis

With the design phase completed, covering material and energy requirements, equipment design, and compliance with local and international safety and environmental standards. The project now proceeds to one of its later stages: the economic analysis of the proposed plant.

5.1. Equipment, Raw Materials, and Utilities Costs

Estimating equipment cost is the initial step in determining the plant’s capital cost. Various methods are available, differing in accuracy. The most reliable thing is obtaining vendor quotations. Alternatively, past purchase orders can be used with appropriate cost index adjustments. Published data and software tools offer less accurate but acceptable estimates when other sources are unavailable. In this work, equipment costs were estimated using correlations from Analysis, Synthesis, and Design of Chemical Processes by Turton. Table S11 represents the summary of the purchased equipment, showing a total CAPEX of USD 550.30 million.
It is important to note that the costs associated with CO2 emissions, such as carbon taxes or sequestration fees, were excluded from this analysis. This exclusion is justified because a comprehensive CO2 capture infrastructure is required primarily for internal process needs—specifically, to prevent freezing in downstream cryogenic separation units. Additionally, this infrastructure functions as an internal cooling utility for economic optimization, rather than being used solely for environmental compliance.
Raw material cost represents a major portion of total manufacturing expenses and is calculated annually to reflect steady-state operation. Methanol serves as the main feedstock with approximately 2,953,500 tonnes/year (8950 tonnes/day), producing around 585,800 tonnes/year (1775 tonnes/day) of ethylene and 414,800 tonnes/year (1257 tonnes/day) of propylene under steady-state operation (based on 330 operating days per year). In comparison, sodium hydroxide (NaOH) is required for the caustic wash with 119,080 tonnes/year (360 tonnes/day). For this preliminary analysis, price estimates were obtained from Chemanalyst and ICIS. A 30% tooling discount is applied to methanol [43], reflecting local incentives to promote downstream olefins production, resulting in a total OPEX of USD 719.04 million.
In addition, utility costs constitute a significant portion of operating expenses, primarily covering the consumption of cooling water, steam, electricity, and refrigerants. Table 7 presents the utility costs applied in this analysis [29], while Table S12 details the utility cost distribution per equipment.

5.2. Profitability Analysis

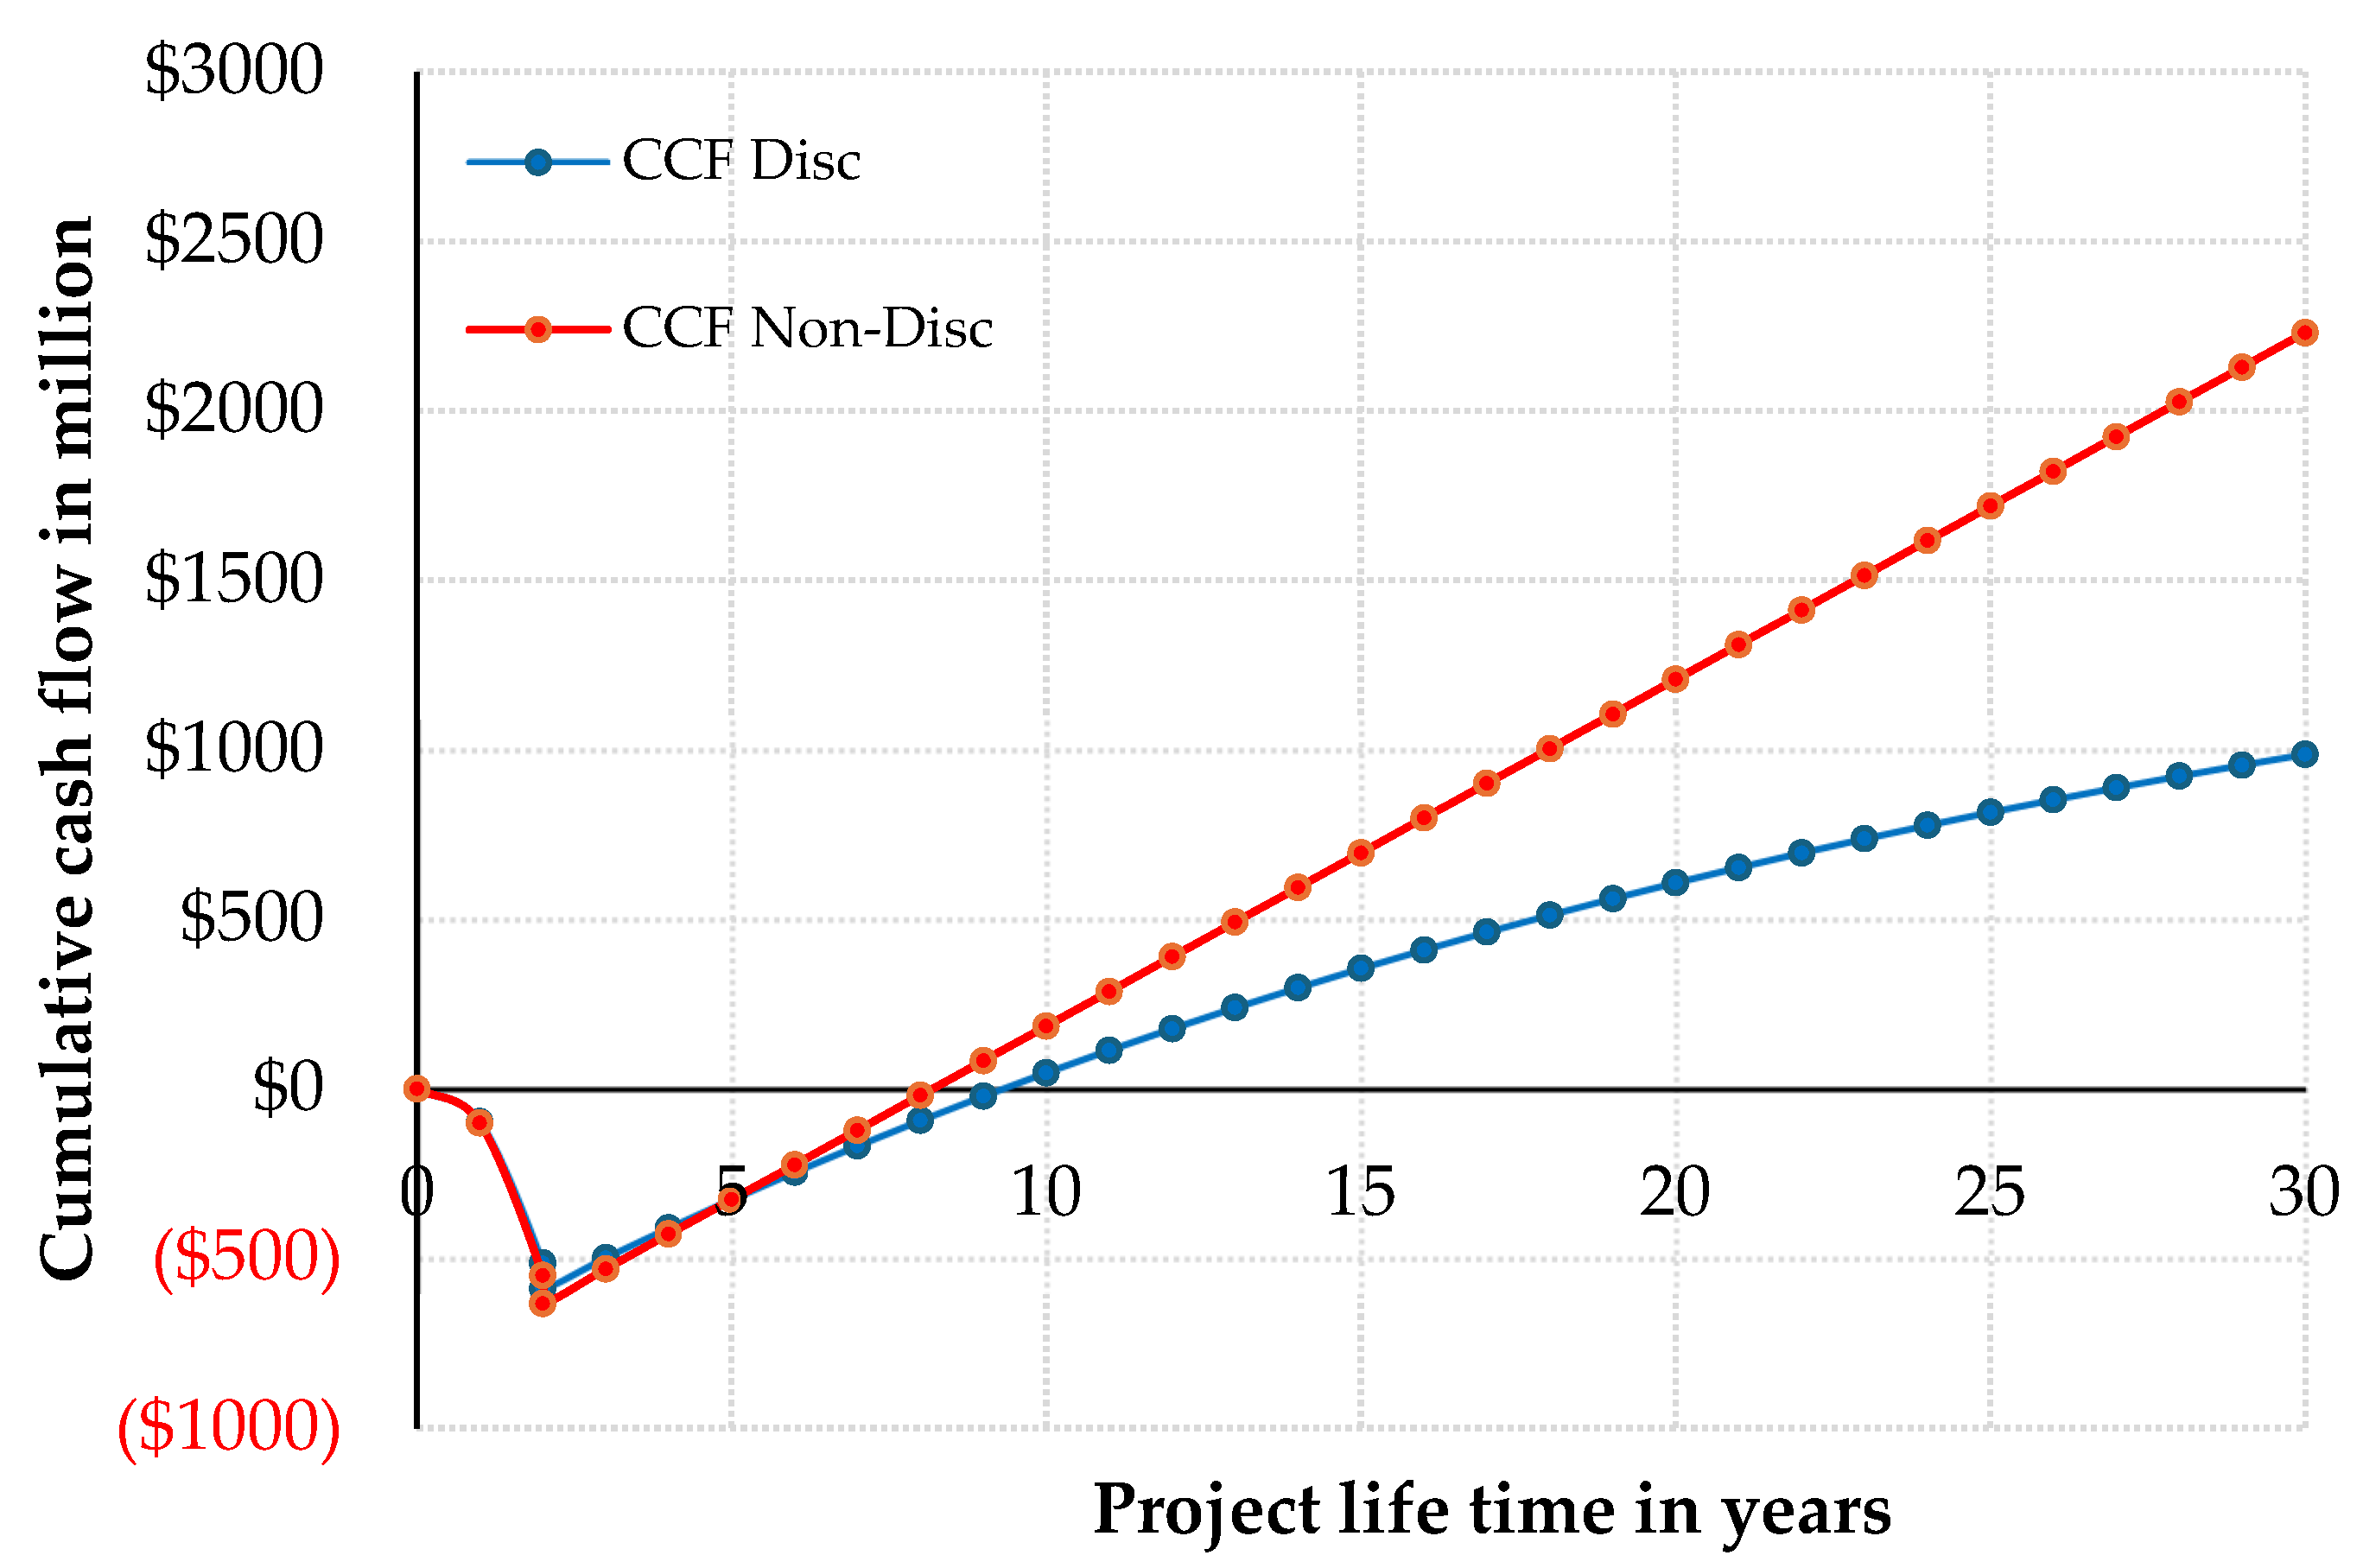
A cash flow diagram is used to represent the movement of money across the project life cycle, as shown in Figure 8.
The economic evaluation yielded a payback period of 5.38 years, calculated as the ratio of total capital investment to annual profit. The discounted payback period, obtained by interpolating the cumulative discounted cash flow between Years 9 and 10, was 6.82 years. The rate of return on investment reached 15.75%, while the discounted cash-flow rate of return determined using the zero-net present value condition was 15.85%. The project also achieved a net present value of 1069.538 million USD and a cumulative cash position of 2517.757 million USD at Year 32, demonstrating strong profitability and resilience over the project lifetime.

5.3. Comparison with Conventional Technologies

The CAPEX for the grassroots plant is estimated at USD 550.30 million, and OPEX is estimated at USD 719.04 million. The analysis of economic and performance indicators shows that the integrated MTO process is highly competitive compared to conventional olefin production methods. The design presented here demonstrates the ability to produce light olefins at a cost competitive with that of a conventional naphtha steam cracker of equivalent capacity. The analysis indicates that the production cost of ethylene and propylene in the MTO plant, under current assumptions for methanol and product prices, is estimated between USD 800 and USD 1000 per tonne of olefin [44]. This cost falls within the typical range for olefins produced from a naphtha cracker at moderate crude oil prices and may be lower when methanol is available at a reduced cost. The capital investment required for the MTO plant is significantly lower than that for a conventional world-scale naphtha cracker. The financial requirement for the MTO facility is estimated at several hundred million USD, due to the use of less complex, smaller-scale equipment and the absence of high-severity furnaces. In contrast, investment for a steam cracker with similar olefin output typically reaches multi-billion USD levels. The analysis shows that operating costs are favorable for the MTO route when low-cost methanol is available, as assumed in this study. Methanol can be sourced economically from natural gas or coal, unlike naphtha, which is subject to price fluctuations tied to crude oil markets.
The integrated MTO process developed in this study demonstrates production efficiency and economic viability, positioning it as a strong competitor to traditional olefin technologies. The combination of high conversion rates and selectivity, energy integration that achieves more than a 50% reduction in external energy consumption, and efficient stream recycling results in a process capable of producing polymer-grade ethylene and propylene while maintaining a favorable profit margin. The calculated payback period of approximately 5.4 years and an internal rate of return between 15% and 16% match or exceed the performance metrics commonly observed in conventional petrochemical projects. This highlights the potential of MTO as a viable alternative source for olefins. The findings of this study support the industrial viability and competitiveness of the integrated MTO process for producing sustainable olefins, especially considering the flexibility in feedstock sourcing and the increasing need to reduce carbon emissions in the petrochemical industry.

5.4. Process Integration Effect on Profitability

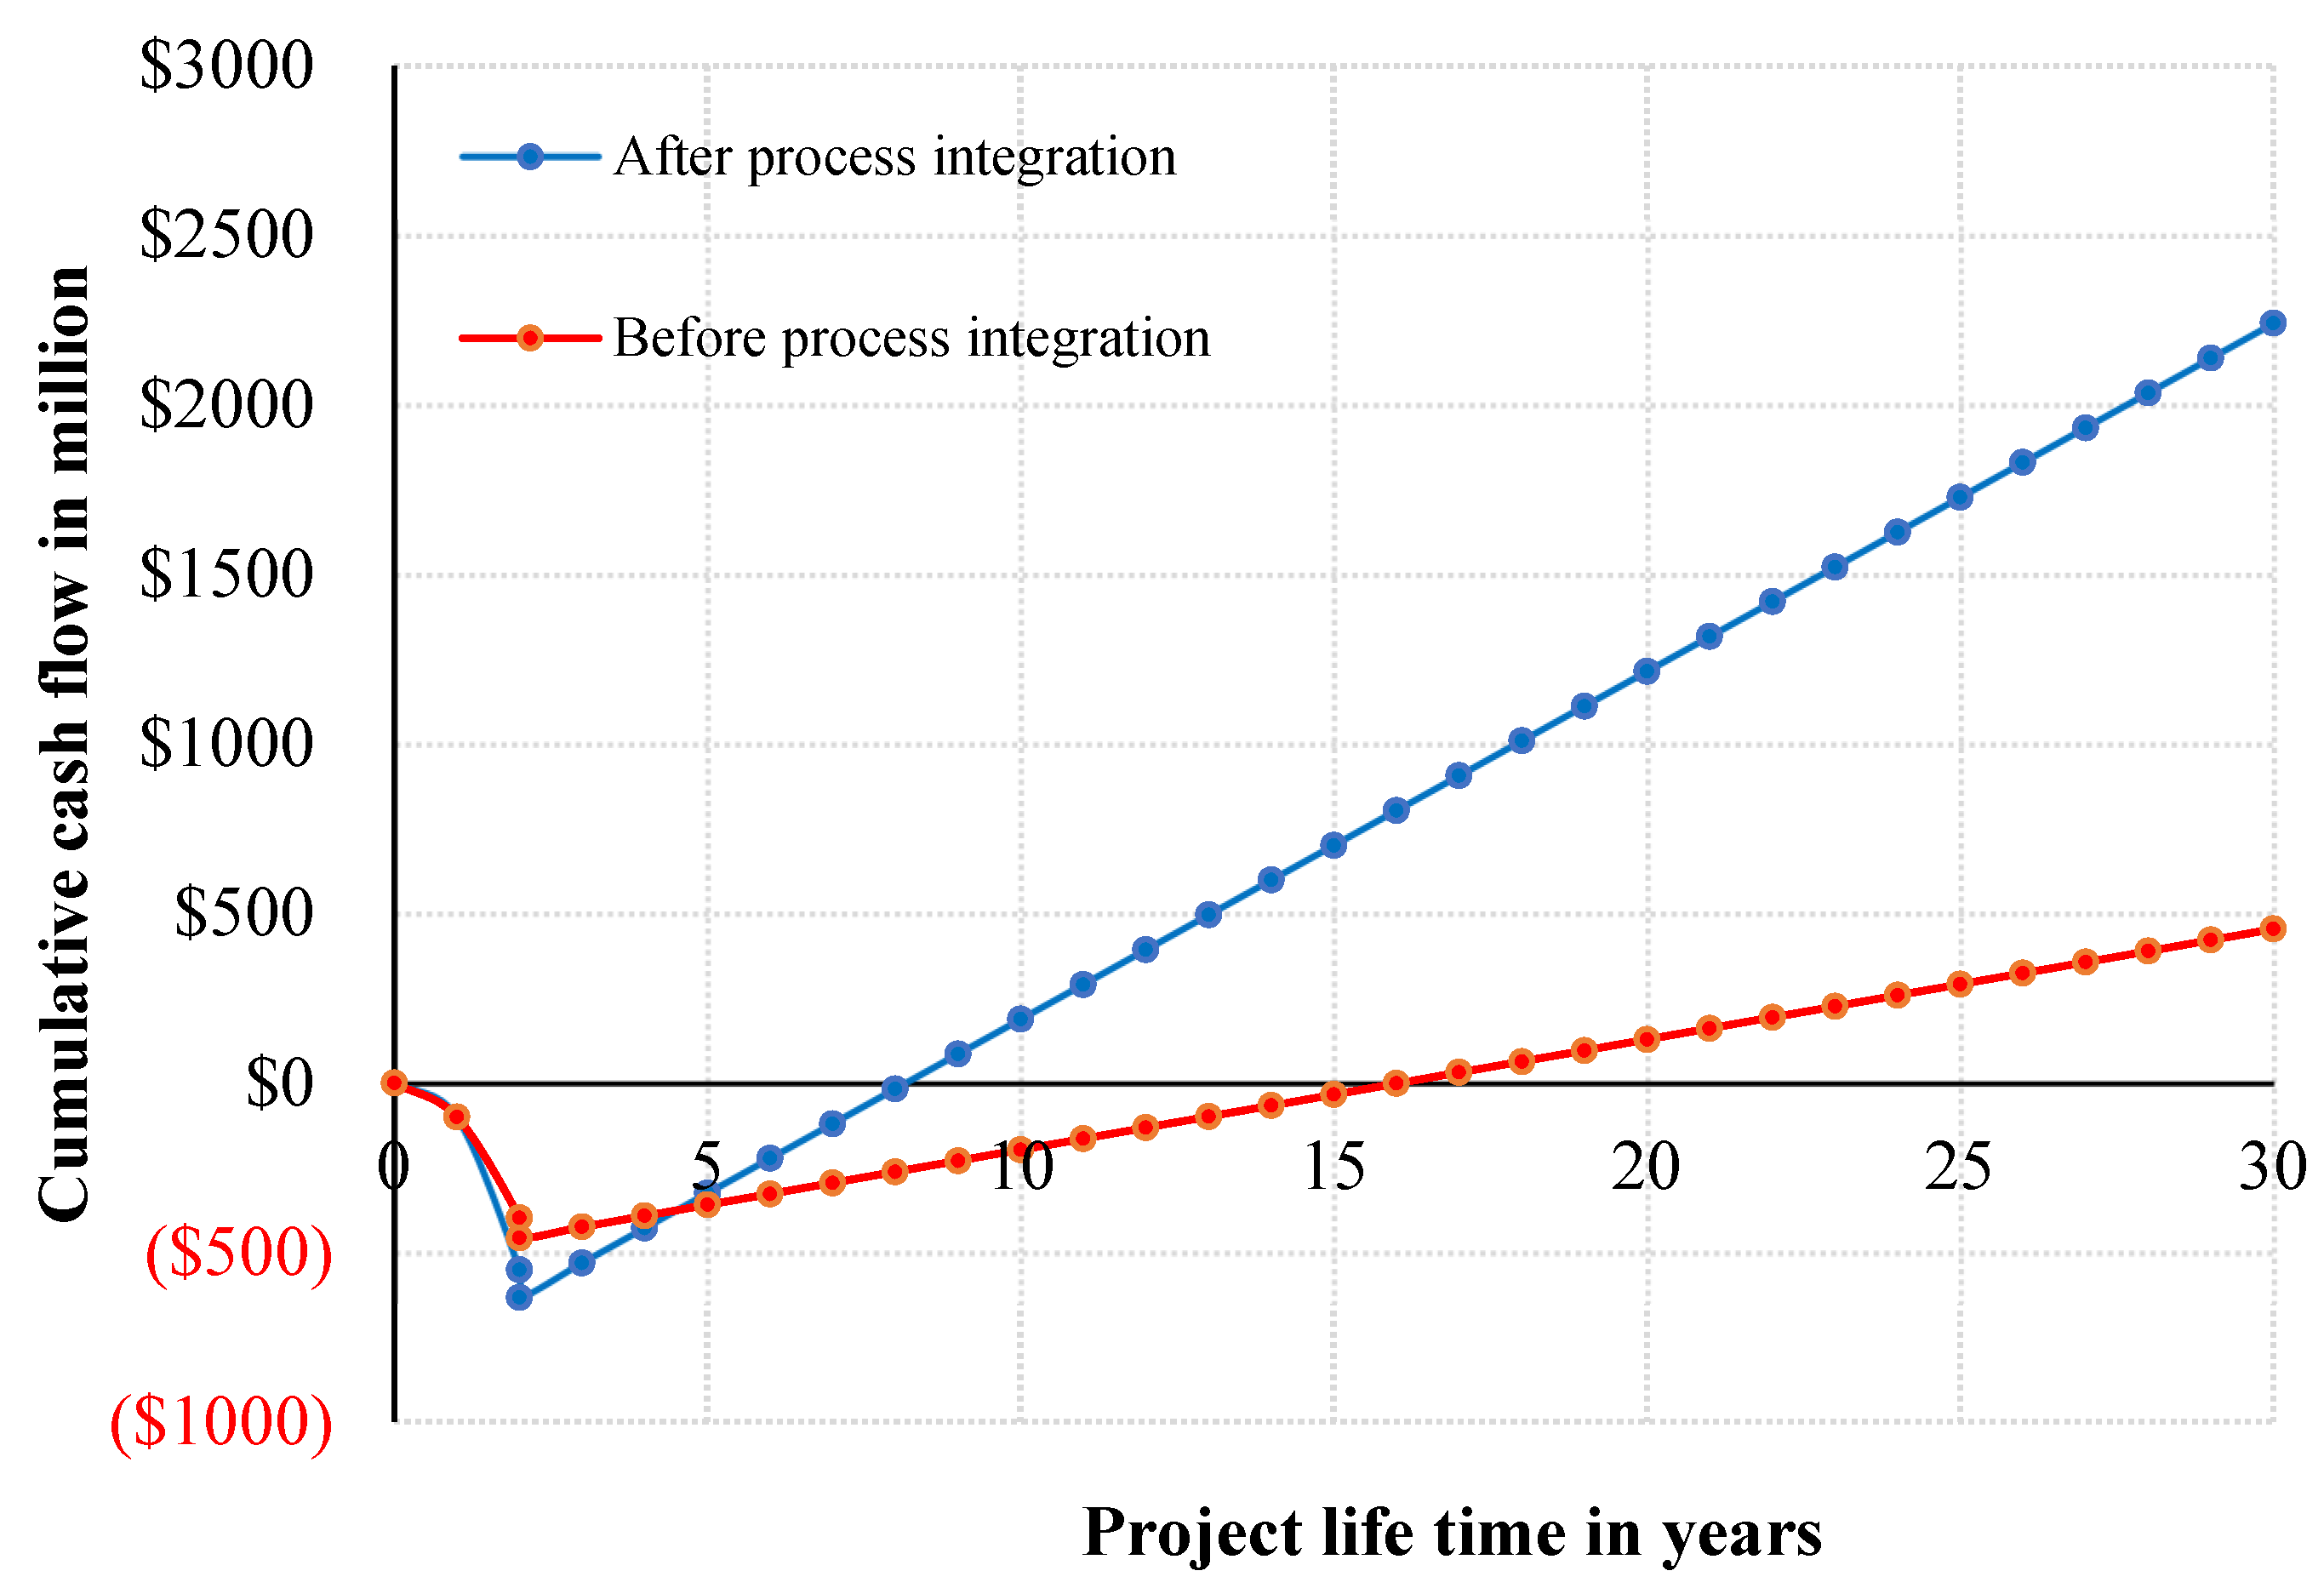
Process integration plays a critical role in enhancing the economic performance of the MTO plant. Without integration, the utility cost was approximately $147 million per year, whereas after heat and mass integration, this figure was reduced substantially to $66.4 million per year, achieving an annual saving of nearly $80 million.
Figure 9 compares the non-discounted cumulative cash flow at base case conditions for both scenarios. The integrated process not only reaches the breakeven point faster but also continues to generate substantially higher returns over the project’s lifetime.
6. Conclusions

This study presents a fully integrated MTO process design that significantly improves olefin production efficiency and sustainability compared to traditional methods. By optimizing the reactor system—using a fluidized-bed reactor with controlled coke management at 775 K and 4.5 bar—and implementing a carefully designed separation train, the plant achieves a high conversion rate of methanol to light olefins and produces a propylene-rich product slate that meets polymer-grade purity standards. Comprehensive heat and mass integration, including pinch-analysis-driven heat exchanger networks, recycling of methane-rich off-gas as fuel, and repurposing waste heat to generate steam for reboilers, greatly reduces the need for external utilities. The integrated MTO process meets production targets with much higher energy efficiency, resulting in a reduction in annual utility costs by more than 50% and a shorter breakeven period. Economic analysis shows that the optimized plant is financially robust, with a substantial net present value and an attractive rate of return, making it competitive with traditional olefin processes. The results confirm the industrial feasibility of MTO technology and demonstrate that comprehensive process integration and optimization can make MTO a more cost-effective and sustainable pathway for light olefin production, using various carbon feedstocks while addressing energy and environmental challenges.

Supplementary Materials

The following supporting information can be downloaded at https://www.mdpi.com/article/10.3390/pr13123806/s1, Figure S1: Block flow diagram of distillation sequence; Figure S2: Yield of olefins in mass vs. coke content in catalyst for at different temperatures; Figure S3: Yield of olefins in mass vs. temperature; Figure S4: Yield of olefins in mass vs. weight of catalyst at different pressures; Figure S5: Yield of each component in mol vs. weight of catalyst; Figure S6: Revised composite curves of MTO main heat exchangers process; Figure S7: Optimum minimum temperature difference; Figure S8: Temperature interval diagram; Figure S9: Heat exchanger network; Figure S10: Optimum temperature outlet for stripping reboilers section; Figure S11: First utility heat exchanger network; Figure S12: Optimum temperature outlet for distillation columns reboilers section; Figure S13: Second utility heat exchanger network; Figure S14: Flue of gases and CO2 composite curves; Figure S15: Continued utility PFD; Table S1: Material balance summary; Table S2: Summary of Energy Balance; Table S3: Cold streams specifications; Table S4: Hot streams specifications; Table S5: Hot streams specifications revised; Table S6: Shifted temperature and revised residuals; Table S7: Summary of Mass Integration Calculations for Methane Recycle and Flue Gas Treatment; Table S8: Summary of Wastewater Recycle Integration; Table S9: Steam-water stream specifications; Table S10: Distillations and stripping columns reboilers streams specifications; Table S11: Summary of the purchased equipment; Table S12: Summary of the utility costs.

Author Contributions

Conceptualization, M.B. and M.K.H.-K.; methodology, N.S.A., A.A., and M.K.H.-K.; software, N.S.A., A.A., and I.W.; validation, N.S.A., A.A., and I.W.; formal analysis, N.S.A. and A.A.; investigation, N.S.A. and A.A.; resources, M.B. and M.K.H.-K.; data curation, I.W., M.B., and M.K.H.-K.; writing—original draft preparation, N.S.A., A.A., and I.W.; writing—review and editing, I.W., M.B., and M.K.H.-K.; visualization, N.S.A., A.A., and I.W.; supervision, M.B. and M.K.H.-K.; project administration, M.K.H.-K.; funding acquisition, M.K.H.-K. All authors have read and agreed to the published version of the manuscript.

Funding

This work was financially supported by the Ongoing Research Funding program (ORF-2025–361), King Saud University, Riyadh, Saudi Arabia.

Data Availability Statement

The original contributions presented in this study are included in the article. Further inquiries can be directed to the corresponding author.

Conflicts of Interest

The authors declare no conflicts of interest.

Abbreviations

The following abbreviations are used in this manuscript:
A , B, DDeactivation function constants.
C i Molar concentration of component i.
E Activation energy or overall energy of the process.
FCCFluid Catalytic Cracking.
H Cumulative heat load.
HENHeat exchanger network.
K W Water effect’s constant in reaction kinetics.
k o Arrhenius pre-exponential factor of the chemical reaction.
l C H 2 Stands for the loading (ratio) of coke over the weight of the catalyst.
MEAMonoethanolamine.
MTOMethanol to Olefins.
P O 2 Oxygen partial pressure.
PFDProcess Flow Diagram.
Q ˙ Heat added or removed from the system.
R Universal gas constant, reflux ratio, or thermal correction coefficient.
r i Rate of reaction i.
T Temperature.
T m i n Minimum temperature difference.
X W Mass fraction of water in the feed to the reactor.
α i Deactivation factor for reaction i.
θ W Water effect function.
ν i Stoichiometric coefficient number in the reaction for component i.
φ i Deactivation function for reaction i.
Shows the difference between initial and final states for a term.

References

  1. Hinton, Z.R.; Talley, M.R.; Kots, P.A.; Le, A.V.; Zhang, T.; Mackay, M.E.; Kunjapur, A.M.; Bai, P.; Vlachos, D.G.; Watson, M.P. Innovations toward the valorization of plastics waste. Annu. Rev. Mater. Res. 2022, 52, 249–280. [Google Scholar] [CrossRef]
  2. Amghizar, I.; Vandewalle, L.A.; Van Geem, K.M.; Marin, G.B. New trends in olefin production. Engineering 2017, 3, 171–178. [Google Scholar] [CrossRef]
  3. Yadav, V.G.; Yadav, G.D.; Patankar, S.C. The production of fuels and chemicals in the new world: Critical analysis of the choice between crude oil and biomass vis-à-vis sustainability and the environment. Clean Technol. Environ. Policy 2020, 22, 1757–1774. [Google Scholar] [CrossRef] [PubMed]
  4. Keyvanloo, K.; Sedighi, M.; Towfighi, J. Genetic algorithm model development for prediction of main products in thermal cracking of naphtha: Comparison with kinetic modeling. Chem. Eng. J. 2012, 209, 255–262. [Google Scholar] [CrossRef]
  5. Chauhan, R.; Sartape, R.; Minocha, N.; Goyal, I.; Singh, M.R. Advancements in environmentally sustainable technologies for ethylene production. Energy Fuels 2023, 37, 12589–12622. [Google Scholar] [CrossRef]
  6. Najafabadi, A.T.; Fatemi, S.; Sohrabi, M.; Salmasi, M. Kinetic modeling and optimization of the operating condition of MTO process on SAPO-34 catalyst. J. Ind. Eng. Chem. 2012, 18, 29–37. [Google Scholar] [CrossRef]
  7. Chen, J.Q.; Bozzano, A.; Glover, B.; Fuglerud, T.; Kvisle, S. Recent advancements in ethylene and propylene production using the UOP/Hydro MTO process. Catal. Today 2005, 106, 103–107. [Google Scholar] [CrossRef]
  8. Barger, P. Methanol to olefins (MTO) and beyond. In Zeolites for Cleaner Technologies; World Scientific Publishing Co Pte Ltd.: Singapore, 2002; pp. 239–260. [Google Scholar]
  9. Tian, P.; Wei, Y.; Ye, M.; Liu, Z. Methanol to olefins (MTO): From fundamentals to commercialization. Acs Catal. 2015, 5, 1922–1938. [Google Scholar] [CrossRef]
  10. Roode-Gutzmer, Q.I.; Kaiser, D.; Bertau, M. Renewable methanol synthesis. ChemBioEng Rev. 2019, 6, 209–236. [Google Scholar] [CrossRef]
  11. Sedighi, M.; Bahrami, H.; Towfighi, J. Kinetic modeling formulation of the methanol to olefin process: Parameter estimation. J. Ind. Eng. Chem. 2014, 20, 3108–3114. [Google Scholar] [CrossRef]
  12. Chang, C.D.; Silvestri, A.J. The conversion of methanol and other O-compounds to hydrocarbons over zeolite catalysts. J. Catal. 1977, 47, 249–259. [Google Scholar] [CrossRef]
  13. Svelle, S.; Joensen, F.; Nerlov, J.; Olsbye, U.; Lillerud, K.-P.; Kolboe, S.; Bjørgen, M. Conversion of methanol into hydrocarbons over zeolite H-ZSM-5: Ethene formation is mechanistically separated from the formation of higher alkenes. J. Am. Chem. Soc. 2006, 128, 14770–14771. [Google Scholar] [CrossRef]
  14. Olsbye, U.; Svelle, S.; Bjørgen, M.; Beato, P.; Janssens, T.V.; Joensen, F.; Bordiga, S.; Lillerud, K.P. Conversion of methanol to hydrocarbons: How zeolite cavity and pore size controls product selectivity. Angew. Chem. Int. Ed. 2012, 51, 5810–5831. [Google Scholar] [CrossRef]
  15. Dubois, D.R.; Obrzut, D.L.; Liu, J.; Thundimadathil, J.; Adekkanattu, P.M.; Guin, J.A.; Punnoose, A.; Seehra, M.S. Conversion of methanol to olefins over cobalt-, manganese-and nickel-incorporated SAPO-34 molecular sieves. Fuel Process. Technol. 2003, 83, 203–218. [Google Scholar] [CrossRef]
  16. Hart, A. Modern techniques to minimize catalyst deactivation due to coke deposition in catalytic upgrading of heavy oil in situ processes. Pet. Chem. 2022, 62, 714–731. [Google Scholar] [CrossRef]
  17. Lin, F.; Xu, M.; Ramasamy, K.K.; Li, Z.; Klinger, J.L.; Schaidle, J.A.; Wang, H. Catalyst deactivation and its mitigation during catalytic conversions of biomass. ACS Catal. 2022, 12, 13555–13599. [Google Scholar] [CrossRef]
  18. Oloruntoba, A.; Zhang, Y.; Hsu, C.S. State-of-the-art review of fluid catalytic cracking (FCC) catalyst regeneration intensification technologies. Energies 2022, 15, 2061. [Google Scholar] [CrossRef]
  19. Choi, S.; Moon, H.; Lee, N.; Kim, K.; Park, Y.-K.; Cho, H.H. Thermal design of dual circulating fluidized bed reactors for a large-scale CO2 capture system. Appl. Therm. Eng. 2020, 171, 115114. [Google Scholar] [CrossRef]
  20. Alwahabi, S.M.; Froment, G.F. Single event kinetic modeling of the methanol-to-olefins process on SAPO-34. Ind. Eng. Chem. Res. 2004, 43, 5098–5111. [Google Scholar] [CrossRef]
  21. Park, T.-Y.; Froment, G.F. Kinetic modeling of the methanol to olefins process. 1. Model formulation. Ind. Eng. Chem. Res. 2001, 40, 4172–4186. [Google Scholar] [CrossRef]
  22. Zhuang, Y.-Q.; Gao, X.; Zhu, Y.-P.; Luo, Z.-H. CFD modeling of methanol to olefins process in a fixed-bed reactor. Powder Technol. 2012, 221, 419–430. [Google Scholar] [CrossRef]
  23. Klemeš, J.J.; Varbanov, P.S.; Walmsley, T.G.; Jia, X. New directions in the implementation of Pinch Methodology (PM). Renew. Sustain. Energy Rev. 2018, 98, 439–468. [Google Scholar] [CrossRef]
  24. Green, D.W.; Southard, M.Z. Perry’s Chemical Engineers’ Handbook, 9th ed.; McGraw Hill LLC: Columbus, OH, USA, 2018. [Google Scholar]
  25. Yaws, C.L.; Gabbula, C. Yaws” Handbook of Thermodynamic and Physical Properties of Chemical Compounds; Knovel: Singapore, 2003. [Google Scholar]
  26. Yaws, C.L. The Yaws Handbook of Vapor Pressure: Antoine Coefficients; Gulf Professional Publishing: Houston, TX, USA, 2015. [Google Scholar]
  27. Ying, L.; Yuan, X.; Ye, M.; Cheng, Y.; Li, X.; Liu, Z. A seven lumped kinetic model for industrial catalyst in DMTO process. Chem. Eng. Res. Des. 2015, 100, 179–191. [Google Scholar] [CrossRef]
  28. Jiang, H.; Liao, D.; Li, D.; Chen, Y. Industrial regenerator model for SMTO technology. ACS Omega 2023, 8, 9334–9345. [Google Scholar] [CrossRef]
  29. Yu, B.Y.; Chien, I.L. Design and Optimization of the Methanol-to-Olefin Process. Part I: Steady-State Design and Optimization. Chem. Eng. Technol. 2016, 39, 2293–2303. [Google Scholar] [CrossRef]
  30. Turton, R.; Bailie, R.C.; Whiting, W.B.; Shaeiwitz, J.A. Analysis, Synthesis and Design of Chemical Processes; Pearson Education: London, UK, 2008. [Google Scholar]
  31. Chemanalyst, Market Analysis and Price Data Platform, Noida, India. Available online: https://www.chemanalyst.com (accessed on 20 October 2025).
  32. ICIS. Independent Commodity Intelligence Services. Reed Business Information Ltd., London, U.K. Available online: https://www.icis.com (accessed on 20 October 2025).
  33. Guo, L.; Ding, Y.; Li, X.; Zhu, X.; Liao, Q.; Yuan, S. Simulation and optimization study on aqueous mea-based CO2 capture process. Chem. Eng. Trans. 2018, 70, 751–756. [Google Scholar] [CrossRef]
  34. Üresin, E.; Saraç, H.İ.; Sarıoğlan, A.; Ay, Ş.; Akgün, F. An experimental study for H2S and CO2 removal via caustic scrubbing system. Process Saf. Environ. Prot. 2015, 94, 196–202. [Google Scholar] [CrossRef]
  35. Ben-Shebil, S.M. Effect of heat of adsorption on the adsorptive drying of solvents at equilibrium in a packed bed of zeolite. Chem. Eng. J. 1999, 74, 197–204. [Google Scholar] [CrossRef]
  36. Nordio, M.; Melendez, J.; van Sint Annaland, M.; Tanaka, D.A.P.; Tanco, M.L.; Gallucci, F. Comparison between carbon molecular sieve and Pd-Ag membranes in H2-CH4 separation at high pressure. Int. J. Hydrogen Energy 2020, 45, 28876–28892. [Google Scholar] [CrossRef]
  37. Levenspiel, O. Chemical Reaction Engineering; John Wiley & Sons: Hoboken, NJ, USA, 1998. [Google Scholar]
  38. Smith, R.; Jobson, M. Distillation. In Encyclopedia of Separation Science; Academic Press: London, UK, 2000; pp. 84–103. [Google Scholar]
  39. Dutta, B.K. Principles of Mass Transfer and Seperation Processes; PHI Learning Pvt. Ltd.: Delhi, India, 2007. [Google Scholar]
  40. El-Halwagi, M.M. Sustainable Design Through Process Integration: Fundamentals and Applications to Industrial Pollution Prevention, Resource Conservation, and Profitability Enhancement; Elsevier: Amsterdam, The Netherlands, 2025. [Google Scholar]
  41. Minnich, K.R.; Nicholson, M.C.; Karlapudi, R.; Schoen, R.M. Method for Production of High Pressure Steam from Produced Water. U.S. Patent US7591309B2, 22 September 2009. [Google Scholar]
  42. Carpenter, K.; Ng, W.K. Singapore’s chemicals industry: Engineering an island. Chem. Eng. Prog. 2013, 109, 56–60. [Google Scholar]
  43. Methanex Sets March 2025 Methanol Prices for Asian Customers. Available online: https://www.argaam.com/en/reports/methanol-prices/47345 (accessed on 19 November 2025).
  44. Simplified Levelised Cost of Petrochemicals for Selected Feedstocks and Regions. 2017. Available online: https://www.iea.org/data-and-statistics/charts/simplified-levelised-cost-of-petrochemicals-for-selected-feedstocks-and-regions-2017 (accessed on 19 November 2025).
Figure 1. Block flow diagram of the MTO process.
Processes 13 03806 g001
Figure 2. Flowsheet of the MTO process.
Processes 13 03806 g002
Figure 3. Composite curve at 15 °C minimum temperature difference.
Processes 13 03806 g003
Figure 4. Grand composite curve.
Processes 13 03806 g004
Figure 5. Steam-water and S-101-102 reboilers composite curves.
Processes 13 03806 g005
Figure 6. Steam-water and distillation columns reboilers composite curves.
Processes 13 03806 g006
Figure 7. Revised MTO process flowsheet reflecting process integration.
Processes 13 03806 g007
Figure 8. Discounted and non-discounted project worth for the base case.
Processes 13 03806 g008
Figure 9. Cumulative cash flow with and without process integration.
Processes 13 03806 g009
Table 1. Reactions of the MTO process.
ReactorReaction No.Reaction Stoichiometry
R-101 (MTO Reactor)1 C H 3 O H C H 2 + H 2 O
2 C H 3 O H + H 2 C H 4 + H 2 O
3 C H 3 O H 1 2 C 2 H 4 + H 2 O
4 C H 3 O H + 1 2 H 2 1 2 C 2 H 6 + H 2 O
5 C H 3 O H 1 3 C 3 H 6 + H 2 O
6 C H 3 O H + 1 3 H 2 1 3 C 3 H 8 + H 2 O
7 C H 3 O H 1 4 C 4 H 8 + H 2 O
8 C H 3 O H 1 5 C 5 H 10 + H 2 O
9 C H 3 O H C O + 2 H 2
10 C O + H 2 O C O 2 + H 2
R−102 (Regenerator)11 * C + O 2 C O 2
12 * H + 1 4 O 2 1 2 H 2 O
* Coke is represented as CH2 in Reaction 1. During the regeneration process, the carbon and hydrogen components undergo separate oxidation reactions (Reactions 11–12), based on kinetic data from the literature [28].
Table 2. MTO kinetics information.
Reaction No. k o   m 3 / k g × m i n E / R ( K ) a i ( )
Rate FormulaParameters
K W = 3.05 ;
A = 9 ;
B = 2 ;
D = 7.8 ;
1–9 r i = v i k i C C H 3 O H φ i θ W
φ i = exp α i l C H 2 1 + A e x p B l C H 2 D
θ W = 1 1 + K W X W
10 r 10 = v 10 k 10 C C O C H 2 O
1 e x p ( 9.702 ) 6410.80.31
2 e x p ( 7.327 ) 6549.80.06
3 e x p ( 11.633 ) 7150.00.14
4 e x p ( 0.45 ) 1064.80.27
5 e x p ( 9.064 ) 5023.50.21
6 e x p ( 3.423 ) 2804.20.2
7 e x p ( 5.345 ) 3069.20.24
8 e x p ( 0.02 ) 1064.80.27
9 e x p ( 17.098 ) 13,591.50.06
10 e x p ( 24.229 ) 14,313.2-
Table 3. Coke combustion kinetics information.
Reaction No. k o   1 / P a × h E   ( J / m o l )
Rate Formula
11–12 r i = v i k i l C H 2 P O 2
11 3.853 × 10 4 1.620 × 10 5
12 1.093 × 10 8 1.574 × 10 5
Table 4. Optimal Operating Conditions and Performance of MTO Reactor (R-101) and Regenerator (R-102).
ParameterValueUnit
Optimal Operating Conditions
Reactor/Regenerator Temperature775K
Reactor Pressure4.5bar
Optimal Catalyst Coke Content Ratio7.5(Mass of coke/Mass of catalyst) %
Reactor System Performance
Methanol Conversion (R-101)>99.9%
Olefin (Ethylene + Propylene) Mass Yield33.87%
Produced Coke Conversion (R-102)100%
Table 5. Performance Summary of Separation and Purification Units.
UnitDescriptionPerformance MetricValue (%)
AB-101Primary CO2 Absorber (Olefins)CO2 Removal Efficiency95
AB-102Polishing CO2 Absorber (Olefins)CO2 Removal Efficiency100
AB-103Regenerator Flue Gas AbsorberCO2 Removal Efficiency96.2
T-103Ethylene/Ethane SplitterEthylene Purity99.95
T-105Propylene/Propane SplitterPropylene Purity99.5
T-106Butene/Pentene SplitterButene Purity99.5
Table 6. Reactors’ heat load summary.
Reactor Heat   Load   ( kW ) Temperature   ( ° C )
R-10165,906.71501.85
R-10297,054.11501.85
Table 7. Utility price.
UtilityCost ($/GJ)
Cooling Water0.354
Chilled Water4.43
LP Steam7.78
Propylene Refrigerant 20   ° C 8.2
Ethylene Refrigerant 101   ° C 21
Electricity16.8
Disclaimer/Publisher’s Note: The statements, opinions and data contained in all publications are solely those of the individual author(s) and contributor(s) and not of MDPI and/or the editor(s). MDPI and/or the editor(s) disclaim responsibility for any injury to people or property resulting from any ideas, methods, instructions or products referred to in the content.