Abstract
The optimal utilization of manganese sand as a substrate is crucial for enhancing the performance of constructed wetlands (CWs) in the advanced treatment of secondary effluent. This study systematically investigated the effects of manganese sand mass ratios (0%, 20%, and 60%) on nutrient removal and microbial community in vertical flow CWs planted with Acorus calamus L. and Canna indica L. The results showed that ammonia nitrogen (NH4+-N) removal was highly efficient (94.5–96.0%) and unaffected by the manganese sand proportion. In contrast, total nitrogen (TN) and total phosphorus (TP) removal were significantly enhanced at the 20% ratio, synchronously reaching optimum levels (TN: 25.3%; TP: 97%). A unique coral-like porous structure was observed on the manganese sand at this proportion. Microbial analysis indicated the 20% unit supported the highest microbial diversity (Shannon index = 9.24) and was enriched with key functional genera like the denitrifying bacterium Pseudomonas. These studies confirm that a 20% manganese sand proportion enhances nutrient removal by optimizing the substrate microstructure and shaping a beneficial microbial community, providing a scientific basis for the parameter optimization of manganese sand-enhanced CWs.
1. Introduction
The discharge of treated wastewater from wastewater treatment plants (WWTPs), while often compliant with regulatory standards, introduces considerable amounts of residual nutrients—particularly nitrogen (N) and phosphorus (P)—into receiving water bodies [1]. This treated wastewater, known as secondary effluent, results from biological processes that effectively reduce organic matter but often leave residual nitrogen and phosphorus in stable forms, necessitating advanced treatment [2]. This nutrient loading can overwhelm the self-purification capacity of aquatic ecosystems, accelerate eutrophication and trigger adverse effects such as algal blooms and overall water quality deterioration [3]. Against the backdrop of global water scarcity, there is a growing impetus to reuse this secondary effluent for non-potable purposes (e.g., agricultural irrigation, urban greening), necessitating advanced treatment to ensure water safety. To mitigate these risks in water reuse scenarios, advanced purification processes are essential. While conventional technologies such as membrane filtration and advanced oxidation processes can achieve high removal efficiencies, they often involve substantial energy consumption, high operational costs, and the risk of chemical by-product formation [4,5]. In this context, constructed wetlands (CWs) have emerged as robust, eco-friendly, and cost-effective technology for the advanced treatment of WWTPs effluent [6,7]. They facilitate the removal of conventional and emerging pollutants through integrated processes including substrate adsorption, microbial activities, and plant uptake [6]. CWs are generally categorized into surface flow (SF), horizontal subsurface flow (HSSF), and vertical subsurface flow (VSSF) systems. The VSSF configuration, which was adopted in this study, is particularly noted for its high oxygen transfer rate and compact footprint, making it well-suited for nutrient removal from secondary effluent [8]. For example, full-scale integrated CW systems have demonstrated stable long-term performance in treating domestic and industrial wastewater, consistently meeting stringent discharge limits [9]. More recent innovations, such as CWs coupled with microbial fuel cells utilizing specialized electrodes and salt-tolerant plants, have also shown promising results in the treatment of saline effluent [10], underscoring the adaptability and potential of CW-based systems.
Aquatic plants represent a fundamental component of CW systems, directly influencing treatment efficiency through physical, chemical, and biological mechanisms [11]. A variety of plant species are employed in CWs globally, with typical examples including robust emergent macrophytes such as the common reed (Phragmites australis), cattails (Typha spp.), and rushes (Juncus spp.), which are renowned for their pollutant removal capabilities and well-developed root systems. In regions such as the middle and lower reaches of the Yangtze River in China—characterized by abundant water resources and high biodiversity—native species including Acorus calamus L. (A. calamus L.) and Canna indica L. (C. indica L.) are widely distributed in riparian zones and natural wetlands. Their ecological adaptability and established roles in local ecosystems make them suitable candidates for use in CWs. In such systems, plants contribute to water purification not only through direct nutrient uptake but also by supporting microbial processes. The stratified root architecture of mixed plantings increases the interfacial area with wastewater, thereby promoting the development of diverse microbial communities essential for nitrogen and phosphorus removal. For instance, Zhu et al. [12] reported that a combination of Cyperus alternifolius and C. indica enhanced pollutant removal in mineralized refuse-based CWs by approximately 1.3-fold compared to systems planted with Phragmites spp. and A. calamus. These findings underscore the importance of species-specific and combinatory plant effects in optimizing CW performance.
While natural manganese sand has shown promise as a substrate in CWs due to its adsorption capacity and redox activity [12,13,14], current understanding remains fragmentary. Existing research has predominantly focused on its intrinsic properties and removal efficacy for specific pollutants [14,15], but critical knowledge gaps persist regarding the optimal proportion of manganese sand in composite substrates and the underlying synergistic mechanisms between this proportion and wetland plants in shaping functional microbial communities for nutrient cycling [16].China possesses substantial manganese ore resources, with national reserves estimated at 280 million tons [17]. Against the backdrop of increasing emphasis on waste resource utilization, leveraging such natural minerals for wastewater treatment is of significant practical value. As an essential micronutrient, manganese plays a vital role in various plant physiological processes, including photosynthesis and nitrogen metabolism [18]. When released at appropriate concentrations from the substrate, manganese ions can be absorbed by wetland plants, potentially supporting their growth [19]. However, manganese bioavailability and its effects are species-specific [20,21]. The differential responses of the selected species—where A. calamus L., demonstrates a notable uptake capacity and tolerance, while C. indica L. exhibits greater sensitivity to excess manganese [21,22]—directly underscore the importance of optimizing manganese sand proportions to concurrently support plant health and promote wastewater treatment.
Therefore, this study was designed to identify the optimal manganese sand proportion (0%, 20%, and 60%) for CWs treating secondary effluent. We systematically evaluated its impact on purification efficiency, with the specific objectives to: (1) determine the optimal ratio for synchronous nitrogen and phosphorus removal, (2) correlate treatment performance with changes in the substrate’s surface microstructure, and (3) identify the associated shifts in the microbial community, particularly the key functional taxa. We anticipated that an optimal proportion would enhance performance by creating a favorable microenvironment for microbial processes. The findings aim to provide both mechanistic insights and practical guidance for optimizing natural manganese sand application in CWs.
2. Materials and Methods
2.1. Experimental Materials and Setup
Eight laboratory-scale vertical flow constructed wetlands (VFCWs) were established in this study. Each VFCW unit was constructed using a polyvinyl chloride (PVC) column with an internal diameter of 16 cm and a height of 50 cm. A schematic diagram illustrating the setup of the VFCW units is presented in Figure 1. The substrate was configured with a layered structure: a 5-cm thick supporting layer of gravel (8–12 mm in diameter) at the bottom, a 30-cm thick functional layer consisting of a mixture of natural manganese sand, zeolite, and ceramsite (4–8 mm in diameter) at different mass ratios (see Table 1), and a 10-cm thick top layer of fine sand and gravel (<2 mm in diameter) for plant root stabilization. Natural manganese sand is primarily composed of manganese oxides (MnOx). Under the wetland conditions, these oxides can release divalent manganese ions (Mn2+), a bioavailable form of manganese that plays a role in various microbial and plant physiological processes.
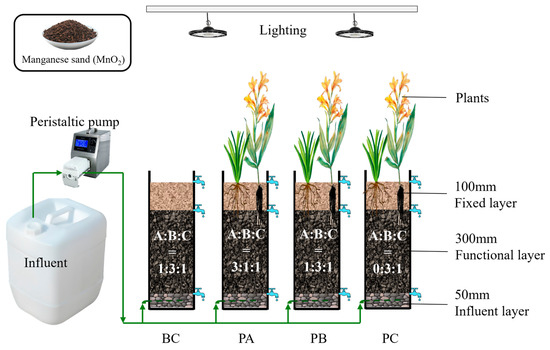
Figure 1.
Schematic diagram of the laboratory-scale VFCW system (operating in up-flow mode). Labels A, B, and C in the functional layer represent the substrate components: (A) natural manganese sand, (B) zeolite, and (C) ceramsite. Arrows indicate the direction of water flow.

Table 1.
Summary of substrate-plant combinations for experimental units.
Four substrate treatments were implemented: units with manganese sand mass fractions of 60% (Unit PA), 20% (Unit PB), and0% (Unit PC), along with an unplanted control unit (Unit BC). Each treatment was duplicated, resulting in a total of eight experimental units. The selected gradient of manganese sand proportions (0%, 20%, 60%) was designed to systematically evaluate its impact, ranging from a baseline (0%) to an intermediate (20%) and a high loading level (60%). This design allowed for the identification of an optimal level while assessing potential limitations associated with both deficiency and excess. All experiments were conducted in a controlled indoor environment under a 12 h/12 h light/dark cycle simulated using artificial lighting. The main experimental period ran from May to August 2024, with indoor ambient temperature fluctuating naturally.
The manganese sand ratios (0%, 20%, 60%) were selected to establish a gradient encompassing a control (0%), an intermediate level (20%) hypothesized to optimize the trade-off between manganese benefits and potential system drawbacks, and a high level (60%) to assess the effects of excessive loading.
The wetland plants selected for the experiment were A. calamus L. and C. indica L., procured from a local nursery. Uniform and healthy individuals were selected, rinsed with deionized water, and acclimatized for 30 days in dechlorinated tap water (achieved by solar exposure) prior to the formal experiment. Transplanting was conducted at a density of 98 individuals per square meter, equating to 2 plants per unit.
The influent was synthetic wastewater simulating the characteristics of WWTPs effluent, prepared by adding NH4Cl, KNO3, and K2HPO4·3H2O (all analytical grade) to deionized water. The main water quality parameters ranged as follows: NH4+-N 4.4–5.0 mg/L, TN 13.7–15.0 mg/L, TP 0.43–0.49 mg/L, and pH 7.31–8.65. These concentrations were selected to represent the critical nitrogen levels found in secondary effluent that requires advanced treatment to meet the Chinese Grade IA discharge standard (GB 18918-2002) [23]. The systems operated in a continuous-flow mode with a hydraulic loading rate of 0.075 m3/(m2·d) and a theoretical hydraulic retention time (HRT) of 3 days. An up-flow configuration was employed to ensure uniform water distribution and intimate contact between the wastewater and the functional substrates—particularly the manganese sand—across the entire bed depth. This flow direction aids in establishing redox gradients that are conducive to the microbial processes involved in nitrogen and phosphorus removal. No artificial aeration was supplied during the operational period. All systems underwent a 33-day start-up and acclimation phase, followed by a 68-day period of demonstrated stable performance, which was selected as the core operational period for data collection and analysis. The data analyzed in this study were all obtained from the stable operational phase, commencing on 26 June 2024.
2.2. Water Quality Indicator Measurement and Analysis
During the stable operation period, influent and effluent samples were collected every three days. This sampling interval was synchronized with the system’s hydraulic retention time (HRT) to ensure that each effluent sample corresponded to a complete treatment cycle of its respective influent, thereby providing a representative assessment of steady-state performance. After filtration through 0.45 μm polyethersulfone (PES) membranes, the samples were analyzed according to the standard methods issued by the Ministry of Ecology and Environment of China: ammonium nitrogen (NH4+-N) was measured using Nessler’s reagent spectrophotometry, total nitrogen (TN) was determined by alkaline potassium persulfate digestion-UV spectrophotometric method, and total phosphorus (TP) was analyzed via potassium persulfate digestion-ammonium molybdate spectrophotometry. All measurements were performed with replicates to ensure data accuracy.
2.3. Microbial Sample Collection and Detection
Upon conclusion of the experiment, substrate samples were aseptically collected from the functional layer of each wetland unit. Total genomic DNA was extracted from approximately 0.5 g of sample using a commercial DNA extraction kit (ALFA-SEQ Soil DNA Kit), and its concentration and purity were assessed with a NanoDrop One microvolume spectrophotometer. The V4 hypervariable region of the bacterial 16S rRNA gene was amplified, and the resulting amplicon libraries were sequenced on an Illumina NovaSeq 6000 platform (PE250) by Guangdong Magigene Biotechnology Co., Ltd. (Guangzhou, China). Raw sequencing reads were quality-filtered (mean Q-score ≥ 20) and processed using the QIIME2 bioinformatics pipeline [24]. Amplicon sequence variants (ASVs) were generated and taxonomically classified against the SILVA 138 NR99 database with a confidence threshold of 0.8 [25].
Additionally, small quantities of manganese sand samples were subjected to ultrasonic cleaning (with deionized water and anhydrous ethanol) and low-temperature vacuum drying. The surface micromorphology of these samples was then examined using scanning electron microscopy (SEM; Siemens-Sirion 300). Bacterial taxonomy is presented according to the genome-based nomenclature proposed by Parks et al. [26].
2.4. Data Statistics and Analysis
The purification efficiency (removal rate) was calculated based on the influent and effluent concentrations using the following equation:
where and are the influent and effluent concentrations (mg/L), respectively. Conventional data processing and graph generation were performed using Microsoft Excel 2021 and Origin 2021 software, respectively. Experimental results are presented as the mean ± standard deviation. Differences in water quality indicators and plant growth parameters among treatments were assessed using one-way analysis of variance (ANOVA), followed by Tukey’s honest significant difference (HSD) post hoc test for multiple comparisons. The significance level was set at p < 0.05.
Microbial community structure was analyzed based on the processed 16S rRNA gene sequencing data. Within the QIIME2 bioinformatics pipeline [24], alpha diversity (Chao1 and Shannon indices) was calculated, and beta diversity was evaluated through principal coordinate analysis (PCoA) based on Bray–Curtis distance and analysis of similarities (ANOSIM).
3. Results
3.1. Comparison of Plant Growth Adaptation
The growth of A. calamus L. and C. indica L. was significantly influenced by manganese sand proportion (p < 0.05). The changes in plant height and root length are presented as percentage change relative to their initial measurements at the beginning of the experiment. A. calamus L. showed limited shoot growth (height increase: 2–16%) but highly variable root length (−42% to +43%). The observed net decrease in root length for some A. calamus individuals could be attributed to root tip mortality or senescence under specific substrate conditions, which was compensated by new root generation in other individuals, leading to an overall positive change in some cases. In contrast, C. indica L. exhibited vigorous growth, with plant height and root length increasing by 245–280% and 350–416%, respectively. A significant positive correlation was found between the final height of C. indica L. and the removal rates of both TN and TP (Pearson r > 0.9, p < 0.05), suggesting a synergy between its growth and purification performance. Dynamically, A. calamus L. maintained stable growth, whereas C. indica L. consistently showed a unique adaptation pattern of main stem senescence followed by lateral stem regeneration.
3.2. Long-Term Nitrogen and Phosphorus Removal Performance
The long-term nutrient removal performance of CWs with different manganese sand proportions, highlighting key temporal trends and stabilization, is shown in Figure 2. The proportion of manganese sand had no statistically significant impact on the removal of NH4+-N, but it played a decisive role in the removal of TN and TP. Furthermore, the presence of plants significantly enhanced the system’s overall purification capacity.
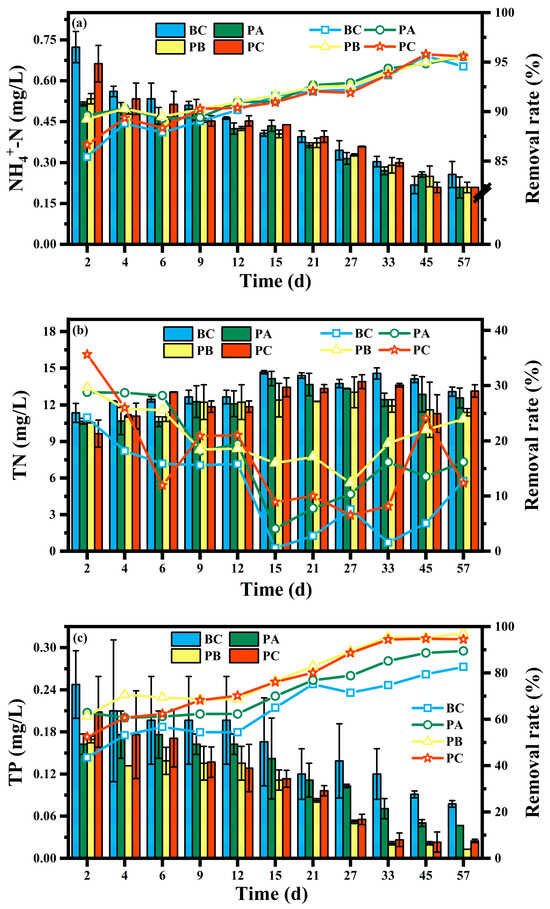
Figure 2.
Temporal variations in (a) NH4+-N, (b) TN, and (c) TP concentrations and their removal efficiency under different manganese sand proportions. For clarity, the time series displays a curated selection of data points at varying intervals to illustrate key dynamic trends and the establishment of stable performance.
As shown in Figure 2a, all experimental units achieved highly efficient and stable NH4+-N removal. After 36 days of stable operation, the effluent NH4+-N concentration was maintained between 0.19 and 0.25 mg/L, with an average removal rate of 94.5% to 96.0%. No significant differences were observed among the units (p > 0.05). This effluent concentration is comparable to the level characteristic of oligotrophic water bodies as defined by international criteria.
In contrast, TN removal was significantly influenced by both the manganese sand proportion and plant presence (Figure 2b). The PB unit (with 20% manganese sand) demonstrated the best performance, achieving an effluent TN concentration of 11.3 mg/L and an average removal rate of 25.3%, which was significantly higher than that of all other units (p < 0.01). The unplanted control (BC) exhibited the lowest removal (8.1–16.1%), while the PA and PC units showed similar, intermediate efficiency (18.6–19.6%). This pattern underscores that the 20% manganese sand proportion was uniquely beneficial for TN removal.
For TP removal (Figure 2c), the PB unit (20% manganese sand) also exhibited the highest performance, with an average removal rate of 97.0% and an effluent concentration of only 0.014 mg/L, significantly superior to other units (p < 0.01). A key finding was that the PC unit (the 0% manganese sand control) showed a higher TP removal efficiency (95%) than the PA unit (90%), implying that an excessively high proportion of manganese sand could inhibit phosphorus removal. All planted units achieved TP removal rates above 90%, which were significantly higher than the 83% removal in the unplanted BC unit.
3.3. Substrate Surface Morphology
The surface morphology of the manganese sand substrate was examined using scanning electron microscopy (SEM) to visualize microstructural differences. SEM revealed distinct changes in the surface morphology of the manganese sand substrate across different treatments (Figure 3). The pristine manganese sand exhibited a rough, granular surface with uniformly distributed pores (Figure 3a). After the experimental period, the substrate from the unplanted control unit (BC) displayed a smoother surface with evident pore blockage or enlargement (Figure 3b). Among the planted units, the substrate with a high manganese sand proportion (60%, PA) was largely covered by dense sediment deposits (Figure 3c). In contrast, the substrate from the PB unit (20% manganese sand) developed a distinctive, highly porous coral-like structure, which was extensively colonized by a dense microbial biofilm (Figure 3d).
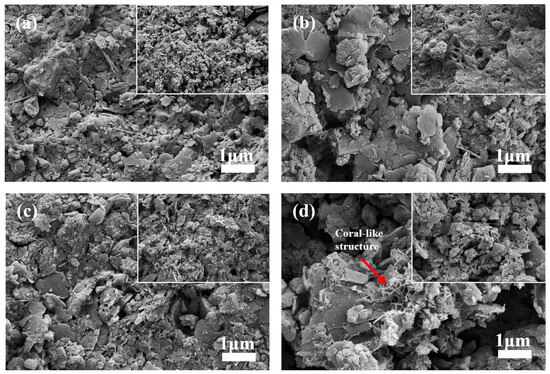
Figure 3.
Scanning electron microscopy (SEM) images of the manganese sand substrate: (a) pristine; (b) from the unplanted BC unit (20% manganese sand); (c) from the planted PA unit (60% manganese sand); (d) from the planted PB unit (20% manganese sand), showing a porous coral-like structure with biofilm attachment.
3.4. Microbial Community
3.4.1. Microbial Diversity Analysis
The alpha diversity of microbial communities was significantly influenced by both planting conditions and manganese sand proportion (Table 2). The planted PB unit with 20% manganese sand demonstrated the highest microbial diversity, with maximum values for both the Shannon index (9.24) and Chao1 richness index (2068). In comparison, the PA (60% manganese sand) and PC (0% manganese sand) units showed intermediate but comparable Shannon indices (8.92), though the PA unit exhibited notably higher species richness (Chao1 = 1961) than the PC unit (Chao1 = 1818). The unplanted BC control unit consistently yielded the lowest values across all diversity metrics (Shannon = 8.34; Chao1 = 1472), confirming the crucial role of plants in supporting microbial diversity. The Simpson indices further reinforced these trends, with the PB unit showing the lowest value (0.0051), indicating the most even community distribution among the treatments.
Table 2.
Alpha diversity indices of microbial communities in CW units with different manganese sand proportions and planting conditions.
Principal coordinate analysis (PCoA) further revealed a clear separation in community structure (Figure 4). The microbial community in the BC unit was distinctly separated from those in all planted units (PA, PB, PC), which clustered more closely together. This pattern underscores the dominant role of plant presence in shaping the microbial community structure.
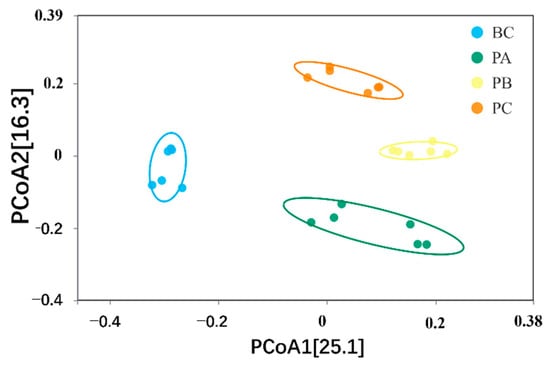
Figure 4.
Principal coordinate analysis (PCoA) illustrating the separation of microbial communities between planted and unplanted units.
Collectively, these findings on microbial diversity directly address our objective to identify community shifts. They demonstrate a hierarchical influence on the microbiome: plant presence establishes the primary structural framework, while the manganese sand proportion acts as a secondary modulator within this framework. The 20% manganese sand proportion (PB unit) emerged as the optimal condition, uniquely supporting the highest level of microbial diversity and community evenness, which aligns with its superior nutrient removal performance.
3.4.2. Microbial Community Composition
At the phylum level, Pseudomonadota (33.0–40.5%), Bacteroidota (7.7–14.5%), and Nitrospirota (6.1–12.8%) were the dominant taxa across all samples (Figure 5a). Notably, the relative abundance of Nitrospirota was highest in the BC unit (12.8%) but significantly decreased in the planted units (PA: 8.2%; PB: 6.5%; PC: 6.1%). Furthermore, Verrucomicrobiota and Planctomycetota, both known for their roles in nitrogen cycling and organic matter degradation, reached their maximum abundances in the PB unit (6.6% and 6.8%, respectively).
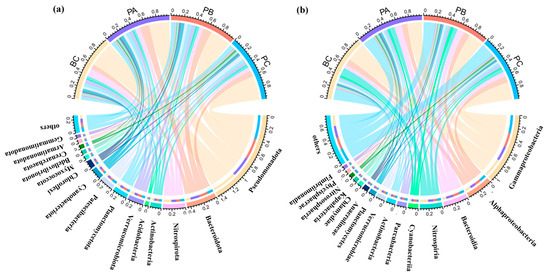
Figure 5.
Microbial community composition at different taxonomic levels across the experimental units. (a) Relative abundance of the dominant bacterial phyla. (b) Relative abundance of the dominant bacterial classes.
At the class level (Figure 5b), Gammaproteobacteria was the most dominant group, with relative abundances of 30.8% in BC, 23.8% in PA, 23.4% in PB, and 28.4% in PC. Alphaproteobacteria attained its highest abundance in the PB unit (10.1%). Bacteroidia was more abundant in the PA and PB units (11.6% and 11.1%) than in the BC and PC units (6.2% and 7.5%). These two dominant classes (Gammaproteobacteria and Alphaproteobacteria) encompass many functional microorganisms involved in nitrogen/phosphorus cycling and manganese oxidation, and their dynamics were closely associated with the system’s nutrient removal performance.
3.4.3. OTU Distribution
Venn diagram analysis (Figure 6) revealed 1395 OTUs common to all units. The number of unique OTUs was highest in the PB unit (1933), followed by the PA (1774), PC (1634), and BC (1103) units. This result indicates that the 20% manganese sand proportion (PB unit) fostered the most distinct microbial community by supporting the highest number of niche-specific species, which contributed to its unique functional profile.
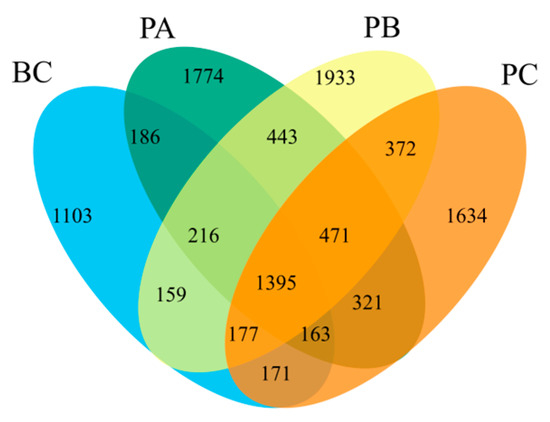
Figure 6.
Venn diagram of microbial OTUs across experimental units.
3.4.4. Functional Microbial Communities
The relative abundances of three core functional phyla—Pseudomonadota, Nitrospirota, and Bacteroidota—were quantified across the systems (Figure 5a). Pseudomonadota was most abundant in the BC unit (40.5%), followed by the PC (38.5%), PB (33.6%), and PA (33.0%) units. In contrast, Bacteroidota showed the opposite trend, with the highest abundance in the PA unit (14.5%), then PB (13.8%), PC (9.4%), and BC (7.7%) units. The abundance of Nitrospirota was significantly higher in the BC unit (12.8%) than in the planted units (PA: 8.2%; PB: 6.4%; PC: 6.1%). These trends at the phylum level were consistent at the class level (Gammaproteobacteria, Nitrospiria, Bacteroidia).
Critically, although the overall abundance of Pseudomonadota was lower in the PB unit, a deeper analysis at the genus level revealed significant enrichment of key functional taxa, including the denitrify Pseudomonas and the polyphosphate-accumulating organism Cupriavidus.
4. Discussion
4.1. Mechanisms of Nutrient Removal
The differential removal of NH4+-N, TN and TP under varying manganese sand proportions indicates distinct governing mechanisms. The consistently high NH4+-N removal (>94.5%) across all units was primarily attributed to the composite substrate, where zeolite’s superior adsorption capacity (1.41 mg/g) dominated the removal process [27]. This substrate-driven mechanism was confirmed by the high efficiency in unplanted controls, demonstrating the limited role of plants in NH4+-N removal under these conditions [28].
For TN removal, the optimal performance at 20% manganese sand (PB unit) resulted from synergistic effects addressing carbon limitation. Plant activity provided essential organic carbon through root exudates, particularly during vigorous growth of C. indica L. [29]. Concurrently, the 20% manganese sand proportion created an optimal microenvironment by releasing beneficial Mn2+ levels that stimulated denitrifying bacteria like Pseudomonas [30], while maintaining porous structure for biofilm colonization.
Similarly, peak TP removal at 20% manganese sand balanced chemical and biological pathways. This proportion enabled efficient chemical precipitation without inducing excessive clogging [31], while plant activity complemented through direct uptake and support of phosphorus-accumulating organisms [32]. The integrated approach at 20% manganese sand avoided limitations of both higher (clogging) and lower (lack of a strong chemical precipitation pathway, as in the PC unit (0% manganese sand control)), achieving optimal phosphorus removal through coordinated physicochemical and biological processes.
Based on the non-linear performance trends observed between the 20% and 60% manganese sand units, the nutrient removal efficiency of an intermediate 40% proportion can be reasonably inferred. It is anticipated that a 40% unit would exhibit performance intermediate to the 20% (PB) and 60% (PA) units. However, it would likely trend towards the lower efficiency of the 60% unit, as this higher loading may begin to induce the pore-clogging and mass transfer limitations that were detrimental to the microbial habitat and nutrient removal processes in the PA unit. This inference underscores that the 20% proportion represents a distinct optimum for synchronous nitrogen and phosphorus removal, rather than an arbitrary point on a linear gradient. The mechanistic pathways elucidated here provide a clear baseline for system optimization. It should be noted that the presence of complex organic matter and competing ions in real secondary effluent, as well as lower operational temperatures, may influence these interactions, and thus, the optimal manganese sand proportion identified serves as a guiding principle for future pilot-scale studies.
This study robustly identifies 20% as the optimal manganese sand proportion within the tested gradient (0%, 20%, 60%). The sharp decline in treatment efficiency from 20% to 60% underscores that the drawbacks of excessive loading (e.g., pore clogging [33]) rapidly outweigh the benefits beyond this optimum. Furthermore, from a practical application perspective, the 20% proportion is inferred to be the most cost-effective. It achieves superior treatment performance while using only one-third of the manganese sand required for the 60% unit, thereby minimizing material costs. The reduced risk of clogging also implies potential long-term operational savings. While the possibility of a marginally different optimum between 0% and 20% warrants investigation, the superior performance of 20% over both 0% and 60% establishes it as a robust reference point for system design. Future research should focus on fine-tuning the proportion within a narrower range to pinpoint the ultimate optimum, and equally importantly, on evaluating the long-term stability and determining the regeneration intervals for the optimized system, which are critical for assessing its full-scale economic viability.
4.2. Substrate Morphology and System Performance
SEM analysis revealed direct correlations between manganese sand morphology and nutrient removal. The unplanted BC unit exhibited smoother surfaces with pore blockage, explaining its poor TN removal and demonstrating how plant absence accelerates structural deterioration [16]. The PA unit (60% manganese sand) showed dense sediment coverage that limited mass transfer, indicating that excessive manganese sand causes clogging that outweighs its precipitation benefits [34]. In contrast, the optimal PB unit (20% manganese sand) developed a unique porous, coral-like structure with extensive biofilm, confirming this proportion creates ideal microbial habitats that enhance nutrient removal through synergistic processes.
4.3. Regulation of Microbial Community Structure
Beta diversity analysis confirmed plant presence as the dominant factor shaping microbial communities, showing clear separation between planted and unplanted units [35]. This established the fundamental framework for community assembly through root-mediated microenvironment modification.
Within this plant-established framework, manganese sand proportion served as a critical environmental filter. The 20% proportion achieved optimal microbial diversity by providing beneficial Mn2+ levels that stimulated microbial metabolic activity and cell growth [36], while effectively avoiding the growth inhibition associated with excessively high Mn2+ concentrations [37]. This balance resulted in the highest observed microbial diversity and richness (e.g., Chao1 index = 2068) in the PB unit, confirming 20% as the optimal manganese sand proportion for structuring a robust and diverse microbial community.
Critically, the shifts in dominant bacterial phyla delineate a clear ecological strategy underpinning this optimized community structure. The significant reduction in Nitrospirota (nitrifying bacteria) in planted units, concurrent with a marked increase in Bacteroidota (organic matter degraders), signals a fundamental metabolic shift from autotrophy-dominated to heterotrophy-dominated processes. This shift was likely driven by plant root exudates, which supplied labile carbon that favored heterotrophic Bacteroidota, while the anoxic microsites in the rhizosphere suppressed aerobic nitrifiers (Nitrospirota) [38,39].
These community-level changes establish the direct microbial mechanism behind the superior performance of the PB unit. The enhanced nutrient removal was further explained by phylogenetic shifts: decreased Nitrospirota abundance indicated reduced nitrification, while increased Bacteroidota facilitated organic matter degradation for denitrification [40].
This community restructuring, particularly the enrichment of organic-degrading Bacteroidota, established a metabolic foundation that facilitated the subsequent denitrifying and phosphorus-removing processes performed by specialized bacteria in the PB unit.
4.4. Linking Functional Microorganisms to Enhanced Nutrient Removal
The integration of microbial community analysis with the SEM results indicates that the optimal performance of the 20% manganese sand unit (PB) stemmed from a well-structured microenvironment. This supports a hierarchical model of microbial assembly: plant presence established the primary community structure, while the manganese sand proportion, optimized at 20%, served as a critical secondary filter. This optimal condition fostered the highest microbial diversity and evenness (Section 3.4.1), creating a foundational habitat that enabled the strategic enrichment of key functional taxa, as detailed below.
The superior nutrient removal in the PB unit was directly facilitated by the strategic enrichment of key functional microorganisms operating in synergy with optimized manganese sand conditions. For nitrogen removal, the elevated abundance of Bacteroidota in planted units enhanced degradation of root exudates to supply essential carbon for denitrification, while the targeted enrichment of Pseudomonas, a ubiquitous denitrifying genus commonly found in engineered ecosystems [41], created an efficient denitrification pathway potentially activated by Mn2+ as electron mediator [29,42]. This explains the paradox of high nitrifying bacteria but low TN removal in the unplanted BC unit where carbon limitation constrained denitrification.
For phosphorus removal, the PB unit demonstrated a multi-mechanism strategy with enrichment of Cupriavidus, a model polyphosphate-accumulating organism (PAO) frequently identified in wastewater treatment systems [43], enhancing biological phosphorus uptake, while Mn2+ released from the 20% manganese sand enabled simultaneous chemical precipitation [44]. The porous substrate structure at this optimal proportion provided ideal attachment sites for these functional bacteria, creating an integrated system that avoided both the precipitate blockage in the PA unit (60% manganese sand) and the lack of chemical precipitation in the PC unit (0% manganese sand) [16,44]. This coordinated action of biological and chemical processes resulted in the highest TP removal rate through optimal microbial-physicochemical synergy.
5. Conclusions
This study demonstrates that the proportion of manganese sand is a critical design parameter for optimizing nutrient removal in CWs treating secondary effluent. While robust NH4+-N removal (>94.5%) was universally achieved and governed primarily by the zeolite-dominated substrate, the synchronous removal of TN and TP was maximized at a specific manganese sand proportion of 20%. The optimal performance of this configuration (25.3% TN and 97.0% TP removal) was underpinned by a synergistic mechanism: the 20% proportion fostered the development of a unique porous, coral-like substrate microstructure that supported dense microbial biofilm colonization. This favorable physical habitat, combined with the development of a highly diverse microbial community and the targeted enrichment of key functional genera (e.g., Pseudomonas for denitrification and Cupriavidus for phosphorus accumulation), created an efficient microbial system for nutrient transformation. Therefore, a 20% manganese sand proportion is recommended as an optimal strategy, as it effectively balances the electrochemical benefits of manganese with the physical structure required for microbial processes and plant synergy, providing a scientific basis for parameter optimization in advanced wastewater treatment.
Author Contributions
Conceptualization, L.H. and Y.P.; methodology, L.H. and Y.P.; validation, Y.P. and K.Z.; formal analysis, Y.P.; investigation, Y.P. and K.Z.; resources, L.H.; data curation, Y.P.; writing—original draft preparation, Y.P.; writing—review and editing, L.H. and Y.P.; visualization, Y.P.; supervision, L.H.; project administration, L.H. All authors have read and agreed to the published version of the manuscript.
Funding
This research received no external funding.
Data Availability Statement
The data presented in this study is available on request from the corresponding author.
Acknowledgments
The authors express their sincere gratitude to Huang Lei for his academic guidance and invaluable support throughout this research. Special thanks are extended to Shi Yi for providing the research platform and technical assistance. The authors also acknowledge Zhou Ke for his exceptional help with the experimental work.
Conflicts of Interest
The authors declare no conflicts of interest.
Abbreviations
The following abbreviations are used in this manuscript:
| CWs | constructed wetlands |
| NH4+-N | ammonium nitrogen |
| TN | total nitrogen |
| TP | total phosphorus |
| WWTPs | wastewater treatment plants |
| MnOx | manganese oxide |
| VFCWs | vertical flow constructed wetlands |
| PVC | polyvinyl chloride |
| HRT | hydraulic retention time |
| PES | polyethersulfone |
| PCoA | Principal coordinate analysis |
| SEM | Scanning electron microscopy |
References
- Bischel, H.N.; Lawrence, J.E.; Halaburka, B.J.; Plumlee, M.H.; Bawazir, A.S.; King, J.P.; McCray, J.E.; Resh, V.H.; Luthy, R.G. Renewing Urban Streams with Recycled Water for Streamflow Augmentation: Hydrologic, Water Quality, and Ecosystem Services Management. Environ. Eng. Sci. 2013, 30, 455–479. [Google Scholar] [CrossRef]
- Smith, V.H. Eutrophication of freshwater and coastal marine ecosystems: A global problem. J. Environ. Sci. Pollut. Res. Int. 2003, 10, 126–139. [Google Scholar] [CrossRef]
- Fengle, Y.; Xianzhi, Z.; Jinhua, L.; Hongfeng, Z.; Fangming, J.; Zhou, B. Analysis and evaluation of the treatment and reuse of tailwater: A case study in Erhai Lake. J. Clean. Prod. 2021, 327, 129435. [Google Scholar] [CrossRef]
- Bayoumi, A.I.; Radawy, M.M.; Mahmoud, R.M.; Gabr, S.M. Effect of Salinity Stress on Growth and Metabolomic Profiling of Cucumis sativus and Solanum lycopersicum. J. Plants 2020, 9, 1626. [Google Scholar] [CrossRef]
- Jan, V. Constructed wetlands for wastewater treatment: Five decades of experience. J. Environ. Sci. Technol. 2011, 45, 61–69. [Google Scholar] [CrossRef]
- Zhao, L.; Zhang, J.; Guo, Z.; Hu, Z.; Wu, H. Recycling various wastes as substrates in constructed wetlands: A review on enhancing contaminants removal and potential risks. Sci. Total Environ. 2024, 957, 177749. [Google Scholar] [CrossRef]
- Shutes, R.B.E. Artificial wetlands and water quality improvement. Environ. Int. 2001, 26, 441–447. [Google Scholar] [CrossRef]
- Wu, H.; Zhang, J.; Ngo, H.H.; Guo, W.; Hu, Z.; Liang, S.; Fan, J.; Liu, H. A review on the sustainability of constructed wetlands for wastewater treatment: Design and operation. J. Bioresour. Technol. 2015, 175, 594–601. [Google Scholar] [CrossRef]
- Wu, Y.; Han, R.; Yang, X.; Zhang, Y.; Zhang, R. Long-term performance of an integrated constructed wetland for advanced treatment of mixed wastewater. Ecol. Eng. 2017, 99, 91–98. [Google Scholar] [CrossRef]
- Xu, D.; Zhang, S.; Tian, W.; Zhang, D.; Chu, M.; Cao, H.; Chen, Z.; Zhang, R. Efficacy and power production performance of constructed wetlands coupled with microbial fuel cells for the advanced treatment of saline tailwater from wastewater treatment plants. J. Water Process. Eng. 2024, 60, 105228. [Google Scholar] [CrossRef]
- Shelef, O.; Gross, A.; Rachmilevitch, S. Role of Plants in a Constructed Wetland: Current and New Perspectives. Water 2013, 5, 405–419. [Google Scholar] [CrossRef]
- Zhu, D.; Sun, C.; Zhang, H.; Wu, Z.; Jia, B.; Zhang, Y. Roles of vegetation, flow type and filled depth on livestock wastewater treatment through multi-level mineralized refuse-based constructed wetlands. Ecol. Eng. 2012, 39, 7–15. [Google Scholar] [CrossRef]
- Islam, M.A.; Morton, D.W.; Johnson, B.B.; Mainali, B.; Angove, M.J. Manganese oxides and their application to metal ion and contaminant removal from wastewater. J. Water Process. Eng. 2018, 26, 264–280. [Google Scholar] [CrossRef]
- Xu, G.M.; Li, Y.; Hou, W.H.; Wang, S.; Kong, F.L. Effects of substrate type on enhancing pollutant removal performance and reducing greenhouse gas emission in vertical subsurface flow constructed wetland. J. Environ. Manag. 2021, 280, 8. [Google Scholar] [CrossRef]
- Hu, P.Y.; Hsieh, Y.H.; Chen, J.C.; Chang, C.Y. Characteristics of manganese-coated sand using SEM and EDAX analysis. J. Colloid. Interface Sci. 2004, 272, 308–313. [Google Scholar] [CrossRef]
- Yang, Y.; Liu, J.; Zhang, N.; Xie, H.; Zhang, J.; Hu, Z.; Wang, Q. Influence of application of manganese ore in constructed wetlands on the mechanisms and improvement of nitrogen and phosphorus removal. Ecotox. Environ. Safe. 2019, 170, 446–452. [Google Scholar] [CrossRef]
- Xiang, J.; Chen, J.P.; Bagas, L.; Li, S.; Wei, H.T.; Chen, B.H. Southern China’s manganese resource assessment: An overview of resource status, mineral system, and prediction model. Ore Geol. Rev. 2020, 116, 13. [Google Scholar] [CrossRef]
- Schmidt, S.B.; Husted, S. The Biochemical Properties of Manganese in Plants. Plants 2019, 8, 381. [Google Scholar] [CrossRef]
- Alejandro, S.; Holler, S.; Meier, B.; Peiter, E. Manganese in Plants: From Acquisition to Subcellular Allocation. Front. Plant Sci. 2020, 11, 300. [Google Scholar] [CrossRef]
- Wang, J.F.; Zhu, C.Y.; Weng, B.S.; Mo, P.W.; Xu, Z.J.; Tian, P.; Cui, B.S.; Bai, J.H. Regulation of heavy metals accumulated by Acorns calamus L. in constructed wetland through different nitrogen forms. Chemosphere 2021, 281, 10. [Google Scholar] [CrossRef] [PubMed]
- Bose, S.; Jain, A.; Rai, V.; Ramanathan, A.L. Chemical fractionation and translocation of heavy metals in Canna indica L. grown on industrial waste amended soil. J. Hazard. Mater. 2008, 160, 187–193. [Google Scholar] [CrossRef]
- Ozurumba, Z.N.; Tanee, F.B.G.; Agbagwa, I.O. Phytoextraction potential of Canna indica (L.) for Cd removal from a hydroponic system. Chem. Ecol. 2024, 40, 466–485. [Google Scholar] [CrossRef]
- GB 18918-2002; Discharge Standard of Pollutants for Municipal Wastewater Treatment Plant. Ministry of Ecology and Environment: Beijing, China, 2002.
- Bolyen, E.; Rideout, J.R.; Dillon, M.R.; Bokulich, N.A.; Abnet, C.C.; Al-Ghalith, G.A.; Alexander, H.; Alm, E.J.; Arumugam, M.; Asnicar, F.; et al. Reproducible, interactive, scalable and extensible microbiome data science using QIIME 2. J. Nat. Biotechnol. 2019, 37, 852–857. [Google Scholar] [CrossRef]
- Quast, C.; Pruesse, E.; Yilmaz, P.; Gerken, J.; Schweer, T.; Yarza, P.; Peplies, J.; Glöckner, F.O. The SILVA ribosomal RNA gene database project: Improved data processing and web-based tools. J. Nucleic Acids Res. 2013, 41, D590–D596. [Google Scholar] [CrossRef] [PubMed]
- Parks, D.H.; Chuvochina, M.; Waite, D.W.; Rinke, C.; Skarshewski, A.; Chaumeil, P.-A.; Hugenholtz, P. A standardized bacterial taxonomy based on genome phylogeny substantially revises the tree of life. J. Nat. Biotechnol. 2018, 36, 996–1004. [Google Scholar] [CrossRef] [PubMed]
- Duan, P.; Ding, S.; Jiao, L.; Wang, M.; Zhang, Y.; Qian, C. Simultaneous immobilization of ammonia and phosphorous by thermally treated sediment co-modified with hydrophilic organic matter and zeolite. J. Environ. Manage. 2023, 339, 117800. [Google Scholar] [CrossRef]
- Li, X.; Zhou, L.; Zhuang, L.-L.; Zhang, J.; Li, M.; Yang, Y. High-efficient nitrogen and phosphorus removal and its mechanism in a partially unsaturated constructed wetland with Fe-C micro-electrolysis substrate. Chem. Eng. J. 2022, 431, 133252. [Google Scholar] [CrossRef]
- Qian, X.; Huang, J.; Xv, J.; Yao, J. Macrophytes stimulate microbial interaction and carbon, nitrogen, sulfur, and iron cycling in iron-carbon micro-electrolysis constructed wetlands. Environ. Res. 2025, 286, 122982. [Google Scholar] [CrossRef]
- Feng, J.; Wang, Y.; Bai, Y.; Su, J.; Zhang, H.; Cao, M.; Cheng, W. Manganese oxidation-reduction coupling denitrification performance of strain Pseudomonas sp. XFQ: Dual-function comparison and potential mechanisms. J. Hazard. Mater. 2025, 495, 138839. [Google Scholar] [CrossRef]
- Shu, J.; Wu, H.; Chen, M.; Peng, H.; Li, B.; Liu, R.; Liu, Z.; Wang, B.; Huang, T.; Hu, Z. Fractional removal of manganese and ammonia nitrogen from electrolytic metal manganese residue leachate using carbonate and struvite precipitation. Water Res. 2019, 153, 229–238. [Google Scholar] [CrossRef]
- Luo, B.; Yang, K.; Lyu, X.; Deng, X.; Yun, W.; Li, S.; Ye, X.; Sun, R. Fulvic acid increases rice resistance to phosphorus deficiency by increasing plant P uptake and rhizosphere P mobilization. Crop J. 2025, 13, 1619–1630. [Google Scholar] [CrossRef]
- Haukelidsaeter, S.; Boersma, A.S.; Kirwan, L.; Corbetta, A.; Gorres, I.D.; Lenstra, W.K.; Schoonenberg, F.K.; Borger, K.; Vos, L.; van der Wielen, P.W.; et al. Influence of filter age on Fe, Mn and NH4+ removal in dual media rapid sand filters used for drinking water production. J. Water Res. 2023, 242, 120184. [Google Scholar] [CrossRef] [PubMed]
- Liang-Tong, Z.; Li, Z.; Yuqing, Y.; Na, H.; Bate, B. Investigation of aqueous Fe(III) and Mn(II) removal using dolomite as a permeable reactive barrier material. Environ. Technol. 2023, 44, 2039–2053. [Google Scholar] [CrossRef] [PubMed]
- Zhao, X.; He, W.; Xiang, F.; Zhu, J.; Li, J. Effects of Different Land-Use Types on Soil Properties and Microbial Communities in a Southeastern Tibetan Valley. Agronomy 2025, 15, 2317. [Google Scholar] [CrossRef]
- Ye, T.; Liu, H.; Qi, W.; Qu, J. Removal of pharmaceutical in a biogenic/chemical manganese oxide system driven by manganese-oxidizing bacteria with humic acids as sole carbon source. J. Environ. Sci. 2023, 126, 734–741. [Google Scholar] [CrossRef]
- Wang, X.; Wang, Q.; Zhang, D.; Liu, J.; Fang, W.; Li, Y.; Cao, A.; Wang, Q.; Yan, D. Fumigation alters the manganese-oxidizing microbial communities to enhance soil manganese availability and increase tomato yield. Sci. Total Environ. 2024, 919, 170882. [Google Scholar] [CrossRef]
- Vymazal, J. Plants used in constructed wetlands with horizontal subsurface flow: A review. J. Hydrobiol. 2011, 674, 133–156. [Google Scholar] [CrossRef]
- Philippot, L.; Raaijmakers, J.M.; Lemanceau, P.; van der Putten, W.H. Going back to the roots: The microbial ecology of the rhizosphere. J. Nat. Rev. Microbiol. 2013, 11, 789–799. [Google Scholar] [CrossRef]
- Mehrani, M.-J.; Sobotka, D.; Kowal, P.; Ciesielski, S.; Makinia, J. The occurrence and role of Nitrospira in nitrogen removal systems. Bioresour. Technol. 2020, 303, 122936. [Google Scholar] [CrossRef]
- Ji, B.; Yang, K.; Zhu, L.; Jiang, Y.; Wang, H.; Zhou, J.; Zhang, H. Aerobic denitrification: A review of important advances of the last 30 years. J. Biotechnol. Bioprocess. Eng. 2015, 20, 643–651. [Google Scholar] [CrossRef]
- Neupane, A.; Herndon, E.M.; DeBruyn, J.M.; Chhetri, A.; Jagadamma, S. Manganese concentration influences nitrogen cycling in agricultural soil. Appl. Soil. Ecol. 2025, 215, 106460. [Google Scholar] [CrossRef]
- Su, J.F.; Wang, Z.; Huang, T.L.; Zhang, H.; Zhang, H. Simultaneous removal of nitrate, phosphorous and cadmium using a novel multifunctional biomaterial immobilized aerobic strain Proteobacteria Cupriavidus H29. J. Bioresour. Technol. 2020, 307, 123196. [Google Scholar] [CrossRef]
- Zhong, L.; Yang, S.-S.; Sun, H.-J.; Cui, C.-H.; Wu, T.; Pang, J.-W.; Zhang, L.-Y.; Ren, N.-Q.; Ding, J. New insights into substrates shaped nutrients removal, species interactions and community assembly mechanisms in tidal flow constructed wetlands treating low carbon-to-nitrogen rural wastewater. Water Res. 2024, 256, 121600. [Google Scholar] [CrossRef] [PubMed]
Disclaimer/Publisher’s Note: The statements, opinions and data contained in all publications are solely those of the individual author(s) and contributor(s) and not of MDPI and/or the editor(s). MDPI and/or the editor(s) disclaim responsibility for any injury to people or property resulting from any ideas, methods, instructions or products referred to in the content. |
© 2025 by the authors. Licensee MDPI, Basel, Switzerland. This article is an open access article distributed under the terms and conditions of the Creative Commons Attribution (CC BY) license (https://creativecommons.org/licenses/by/4.0/).