Article

Effect of Dairy Powders and Sorbitol-Based Encapsulation Systems on Functional, Thermal, and Microstructural Quality of Probiotic Ice Cream

Department of Food Engineering, Engineering Faculty, Afyon Kocatepe University, Afyonkarahisar 03204, Türkiye
*
Author to whom correspondence should be addressed.
Processes 2025, 13(12), 3803; https://doi.org/10.3390/pr13123803
Submission received: 4 October 2025 / Revised: 5 November 2025 / Accepted: 10 November 2025 / Published: 25 November 2025
(This article belongs to the Special Issue Advances in Food Processing Techniques and Nutritional Analysis)

Abstract

This study investigated the effects of different microencapsulation wall materials on the physicochemical, textural, thermal, and microstructural properties of probiotic ice cream during frozen storage. Lactobacillus acidophilus ATCC 4356 was encapsulated using lyophilization with whole milk powder, skim milk powder, whey powder, or sorbitol, and added to the ice cream mix at 1% (w/w). Five formulations were produced (control and four encapsulated variants) and analyzed over 90–150 days of storage at −18 °C. The highest firmness (41.96 g) and consistency (58.65 g·s) values were observed in the skim milk powder group, whereas sorbitol decreased viscosity and increased overrun. Melting resistance improved during storage, particularly in skim milk powder samples, where the complete melting time increased to 87.35 min. DSC results showed significantly higher enthalpy in whey powder samples, while sorbitol reduced ice crystal growth. Cryo-SEM images confirmed smoother, denser microstructures in formulations with milk powders and sorbitol. Encapsulation markedly enhanced probiotic survival: while the control decreased from 5.04 to 2.18 log CFU/g, encapsulated samples maintained counts above the therapeutic threshold (≥6 log CFU/g) up to 150 days, with the highest viability in whole and skim milk powder. Overall, milk-based encapsulation systems provided both cryoprotection and quality enhancement, demonstrating that microencapsulation is an effective strategy to produce stable probiotic ice creams with improved structural and technological attributes.

1. Introduction

The convergence of consumer health consciousness and food science innovation has propelled the functional foods sector to the forefront of the global market. Central to this movement are probiotics, defined as live microorganisms that, when consumed in adequate quantities, confer a demonstrable health benefit upon the host [1]. Among them, Lactobacillus acidophilus is one of the most well-characterized and trusted probiotic species, recognized for its significant role in maintaining gut homeostasis, modulating immune responses, and contributing to overall digestive wellness [2]. Recent studies further emphasize its relevance for dairy-based functional products due to high consumer acceptance and strain compatibility with lactose-rich systems [3].
Ice cream, with its universal appeal and dairy-based matrix, represents a highly attractive but technologically complex medium for probiotic delivery. Its composition, rich in proteins and fats, offers a degree of innate protection against gastric acidity, while its frozen state can potentially preserve microbial viability over time [4]. However, the viability of probiotics like L. acidophilus is acutely threatened by the harsh conditions inherent in ice cream manufacturing and storage. The primary obstacle is cryoinjury, a multifaceted phenomenon encompassing mechanical damage from ice crystal formation, cellular dehydration due to the freeze-concentration of solutes, and osmotic shock, all of which can lead to a drastic decline in live cell counts during frozen storage [5]. Recent research consistently shows that free-cell probiotic survival in ice cream often declines below therapeutic levels after 60–120 days of storage [6]. Consequently, maintaining the minimum therapeutic dose, typically cited as 106–107 CFU/g, throughout the product’s shelf life remains a major technological challenge [7].
To mitigate these viability losses, microencapsulation has been widely adopted as a key enabling technology [8]. By entrapping probiotic cells within a protective wall material, this technique creates a micro-barrier that shields the cells from osmotic stress, acidic conditions, and cryoinjury [9]. While traditional hydrocolloids like alginate were extensively studied and proven effective in many applications [9], recent studies focus on food-grade, label-friendly encapsulation matrices derived from natural ingredients, particularly dairy components, because they enhance both probiotic stability and product quality [10].
This study focuses on a novel and highly relevant approach: utilizing a composite matrix derived from dairy solids, specifically whole milk powder, skim milk powder, and whey powder, protein fractions of which are known to have significant cryoprotective effects [11], in conjunction with sorbitol as a cryoprotectant designed to increase the glass transition temperature of the matrix and protect against freezing damage [12]. Contemporary findings report that milk protein–based encapsulation can limit ice recrystallization, stabilize cell membranes, and improve frozen-storage survival in dairy systems [13]. Additionally, polyols such as sorbitol have been shown to modulate unfrozen water mobility, reduce structural stress, and create a more stable glassy phase during freezing [14].
Beyond enhancing probiotic survival, these encapsulation materials actively influence ice cream quality. Milk proteins contribute to creaminess, overrun stability, and texture, while sorbitol affects freezing point depression, sweetness profile, and total solids level [15]. Therefore, a comprehensive evaluation must address both the viability of encapsulated L. acidophilus and the cascading effects of the encapsulation matrix on physicochemical parameters (pH, acidity), textural behavior (hardness, viscosity), thermal stability (melting resistance), and microstructure (ice crystal and air-cell architecture) [16].
This study addresses a critical knowledge gap. Even though the cryoprotective effects of milk solids and sorbitol are known individually, their combined use as a composite microencapsulation matrix for probiotics in a complex food system like ice cream has not been thoroughly investigated. This study aims to provide a holistic assessment, evaluating the dual functionality of this novel encapsulation system, both as an instrument for ensuring probiotic efficacy and as a functional ingredient blend that shapes the final quality of the ice cream during frozen storage.

2. Materials and Methods

2.1. Materials

Milk, sugar, cream (60% milk fat), salep, and emulsifier (mono- and diglycerides; E471) were obtained from the local market; skim milk powder (≈96% total solids) from Ova Süt Ürünleri Inc. (Konya, Türkiye); whole milk powder (≈96% total solids) and whey powder (≈94% total solids) from Enka Süt Ürünleri Inc. (Konya, Türkiye); and Lactobacillus acidophilus ATCC 4356 was supplied as an ATCC kit. Moreover, sorbitol (Sigma Aldrich, Merck KGaA (Darmstadt, Germany) 98% purity) was used for coating.

2.2. Method

2.2.1. Production of Lyophilized L. acidophilus Cultures

Microencapsulated L. acidophilus cultures were produced using a lyophilization (freeze-drying) technique at −80 °C pre-freezing followed by vacuum drying. After the bacterial inoculum was prepared and mixed with the protective media, the suspension was frozen at −80 °C for 24 h and then lyophilized at −52 °C under 0.04 mbar pressure for 48 h to obtain microencapsulated cultures.
Preparation of Microorganism Inoculum
To prepare the inoculum, 0.1 µL of frozen L. acidophilus ATCC 4356 culture was added to 10 mL of MRS broth and incubated at 37 °C for 20 h under static conditions. The activated cultures were then subcultured into 1000 mL of MRS broth and incubated for 20 h under the same conditions. The cells were harvested via centrifugation at 3000× g for 15 min at 4 °C. The supernatant was discarded, and the cells were washed twice using a sterile saline solution (0.85% NaCl, w/v) [17].
Preparation of Protective Media
Whole and skim milk powders were first rehydrated in a skim milk medium for half an hour at room temperature using a magnetic stirrer. The temperature of the mixture was gradually increased to 60 °C and stirred for an additional 1.5 h to ensure complete dissolution. Whole milk powder and skim milk powder were reconstituted to a final concentration of 10% (w/v). Whey powder and D-sorbitol were prepared by direct addition to the skim milk medium at a concentration of 9% (w/v) and mixed for 15 min with a magnetic stirrer. All final mixtures were heated to 90 °C and held for 30 min for sterilization, then cooled to room temperature [17].
Lyophilization Process
After the L. acidophilus cells were activated, propagated by subculturing in MRS broth, separated by centrifugation, and washed twice using sterile saline solution, the resulting biomass was directly added to the prepared protective media and mixed. The cultures were held at room temperature for 1 h, frozen at −80 °C for 24 h, and then lyophilized under vacuum for 48 h (Operon FDB-5503, Operon Co., Ltd., Gimpo, Republic of Korea). The samples were pre-frozen at −80 °C for 24 h and lyophilized at −52 °C under 0.04 mbar pressure for 48 h. The lyophilized cultures were ground into a powder for 1 min in a sample grinder and stored in light-proof vacuum packages at −18 °C until used for ice cream production [17].

2.2.2. Ice Cream Production

The ice cream production flowchart is illustrated in Figure 1. Raw milk was heated to 40 °C, after which 5.71% skim milk powder, 17.86% sugar, 0.5% salep, and 0.21% emulsifier were added. The temperature of the mix was brought to 60 °C with continuous and effective stirring, and 4.29% cream was added at this temperature. Pasteurization was then conducted by holding the mix at 85 °C for 5 min. The mix was then first cooled to 20 °C with continuous stirring, and 1% microencapsulated L. acidophilus was added. Subsequently, it was placed in a refrigerator (4 ± 1 °C) and aged for 24 h. The aged mix was churned in an ice cream machine (Telme CRM, Gel 25 °C, Codogno, Italy) and stored in a deep freezer (Uğur, Aydın, Turkey) at −18 °C. After churning, ice creams were filled into 500 mL polypropylene containers and stored at −18 °C. Five groups were produced: control (no encapsulated probiotics) and treatments containing microencapsulated L. acidophilus prepared with whey powder, sorbitol, whole milk powder, and skim milk powder. All formulations were produced in triplicate (n = 3).

2.2.3. Enumeration of Microencapsulated L. acidophilus

A 25 g powder and ice cream samples were homogenized using 225 mL of sterile MRD (Maximum Recovery Diluent) Sigma-Aldrich, Merck KGaA (Darmstadt, Germany) to prepare serial dilutions from 10−1 to 10−7. Aliquots from all dilutions were placed onto MRS agar (Merck, 110660, Germany) containing 50 μg/L of cycloheximide (CAS 66-81-9, Sigma-Aldrich, Darmstadt, Germany) using the spread plate method. The inoculated Petri dishes were vacuum-packaged to ensure the removal of oxygen. Colony counting was performed after incubation at 30 °C for 3 days under anaerobic conditions. The results were expressed as colony-forming units per gram (CFU/g) [17]. Enumeration was performed on days 1, 30, 60, 90, and 150 of frozen storage. All microbiological measurements were carried out in triplicate (n = 3). A 0.1 mL aliquot from each dilution was spread onto MRS agar plates.

2.2.4. Texture Analysis of the Ice Cream Mix

The firmness, consistency, cohesiveness, and index of viscosity of the mix were determined using a TA.XT Plus Texture Analyzer (Stable Micro Systems, Surrey, UK) equipped with a back extrusion rig [19].

2.2.5. Analyses Performed on Ice Cream

Physicochemical Analyses
Physicochemical analyses were performed on day 1 and repeated on days 30, 60, and 90 of frozen storage.
Dry Matter
The total dry matter content of ice cream was determined using the gravimetric method [18].
Protein
The total nitrogen content was determined using the Kjeldahl method. The percentage of protein was calculated using a conversion factor of 6.38, which is commonly applied for dairy products [18].
pH
The pH values were measured using an Ohaus ST3100F model pH meter equipped with an ST270 glass electrode.
Titratable Acidity
To a 9 g sample of ice cream, 9 mL of room-temperature distilled water and phenolphthalein indicator (1%) were added. The samples were titrated using 0.1 N NaOH until a persistent light pink color was observed, and the result was calculated as % lactic acid using the following formula [20,21].
% LA = (N × 0.09 × V) / m × 100
V: Volume of 0.1 N NaOH solution consumed (mL)
m: Weight of the sample (g)
N: Normality of NaOH
First Drip Time
A 10 g sample of ice cream was placed on a wire mesh over a tared beaker and left to melt at 20 °C on a 0.2 cm wire mesh screen placed over a beaker. The time until the first drop fell was recorded [22].
Complete Melting Time
Hardened ice cream samples were left to melt at 20 °C on a 0.2 cm wire mesh screen placed over a beaker, and the time (min) required for the ice cream to melt completely was recorded [23].
Overrun
A specific volume of ice cream was carefully packed into a tared graduated cylinder to avoid voids and then weighed. The same ice cream sample was placed in a beaker and melted in a water bath. The melted mix was transferred into the cleaned graduated cylinder up to the same volume and weighed again [24,25]. The overrun percentage was determined using the following formula.
Overrun (%) = ((Volume of ice cream − Volume of melted ice cream))/(Volume of melted ice cream) × 100
Color Analysis
Color values were measured using a colorimeter (CR-400; Minolta Co., Osaka, Japan). The L* (lightness), a* (redness), and b* (yellowness) values were recorded after calibrating the device [26].
Hardness Measurement
The hardness of the samples was measured using a (Stable Micro Systems Ltd., Godalming, Surrey, UK) with a 5 mm diameter cylindrical stainless-steel probe (Stable Micro Systems, Part Code: P/5). Prior to measurement, the samples were tempered at −15 °C for 24 h. At the end of the tempering period, three measurements were taken from three separate containers for each sample, and the average of these measurements was calculated [27,28].
Rheological Properties
In oscillation tests, samples were subjected to a sinusoidal oscillation stress or strain to determine the storage modulus (G′) and loss modulus (G″) against specific frequency values. The total reaction to the sinusoidal stress was characterized by the complex modulus (G*) and complex viscosity (η*) equations [29,30].
G* = [(G′)2 + (G′′)2]1/2
η* = G*/ω
Differential Scanning Calorimetry (DSC)
The thermal properties of the samples, such as the degree of crystallization and melting enthalpy, were determined using a differential scanning calorimeter (DSC). The DSC analyses on the ice creams were performed according to the method of Soukoulis et al. [31].
Cryo-SEM Analysis
The samples prepared with different formulations were examined without any pre-treatment using a FEI Company, Hillsboro, OR, USA (FE-SEM). The examination was conducted in ESEM™ (Environmental Scanning Electron Microscopy) mode (Thermo Fisher Scientific, Waltham, MA, USA), which allows for the study of aqueous samples and those with true shape and form distorted upon drying, using a WetSTEM II detector (Thermo Fisher Scientific). The samples were pre-cooled to −5 °C using a Peltier cooling stage, prepared by pouring them onto special sample holders, and imaging was performed at this temperature. The main advantage of this system is its ability to produce SEM micrographs that are very close to the sample’s true image at maximum resolution by manipulating the system’s pressure values, without altering the original form of the samples (i.e., without pre-treatments like drying). In this study, the samples were examined without being fully dried, thus preserving their original forms, at a chamber pressure of 300–450 Pascals and at appropriate accelerating voltages, and were imaged under working conditions where maximum resolution was achieved.
Statistical Analysis
In this study, descriptive statistics were calculated as mean and standard deviation for quantitative data. The Kruskal–Wallis test was used for comparisons between groups in the evaluation of quantitative data. For the evaluation of variables involving repeated measures, Repeated Measures Analysis of Variance (ANOVA) was used to determine if the data were normally distributed. In cases where the H1 hypothesis was accepted as a result of the k-sample tests, multiple comparison tests were used to identify the group or groups causing the difference. A significance level was set at p = 0.05, and the SPSS 20.0 software package was used for data analysis.

3. Results and Discussion

3.1. Textural Properties of the Ice Cream Mix

The textural properties of the mix are presented in Table 1. The textural parameters of the mixes, including firmness, consistency, cohesiveness, and viscosity index, varied significantly by the formulation (p < 0.05). These differences can be attributed to the distinct functional roles of milk powders, sweeteners, and microencapsulated Lactobacillus acidophilus in the ice cream matrix.
Firmness, which reflects the structural rigidity of the mix, was highest in the sample containing skimmed milk powder (41.96 g) and lowest in the control (21.98 g). The increase in firmness with skimmed milk powder can be related to its high protein content, which enhances the formation of a stronger gel matrix. This finding is consistent with previous studies indicating that milk proteins improve structural integrity and water-binding capacity in frozen dairy systems [32].
Consistency followed a similar trend, with the highest value also observed in the skimmed milk powder group (58.65 g·s). Skim milk powder’s ability to increase viscosity and contribute to a more stable texture was well documented in dairy literature [33]. In contrast, the sample containing sorbitol exhibited the lowest consistency (27.13 g·s), which was significantly lower than the control and all milk powder groups. This can be attributed to its low molecular weight and lack of protein structure, which produces a more fluid serum phase and reduces network resistance.
Cohesiveness, represented by negative force values, was most pronounced in the whey powder (microencapsulated L. acidophilus) sample (−19.99 g), suggesting a more elastic and unified internal structure. This could be due to interactions between the encapsulating matrix (often involving proteins or polysaccharides) and milk proteins, which reinforce the internal structure of the mix. Similar effects were reported where encapsulated probiotics increased matrix integrity in fermented dairy systems [34].
Interestingly, the viscosity index was highest in the whole milk powder sample (−19.65 g·s), suggesting that fat also plays a role in the structural resistance of the mix. Fat interacts with milk proteins to form a denser matrix, which can improve viscosity and textural stability during storage and processing [26].
Overall, these results confirm that the type of milk powder and the presence of microencapsulated probiotics significantly affect the rheological and textural properties of ice cream mixes. The combination of high-protein ingredients (like skimmed milk powder) and probiotic encapsulates offers a promising approach for improving structural and sensory attributes in functional frozen dairy products. Compared to the control, skim milk powder showed significantly higher firmness and consistency due to its higher milk solids-non-fat content and protein gel network formation. Whey powder also increased firmness, while sorbitol resulted in a softer mix due to its low molecular weight and cryoprotective behavior [13,14,17,21].

3.2. Physicochemical Properties of the Ice Creams

3.2.1. Dry Matter

The total solids contents of the ice cream samples are presented in Table 2. The total solids content varied between 39.99% and 40.80%, with no significant differences among the formulations (p > 0.05). The highest total solids were observed in the whole milk powder (40.80%) and sorbitol (40.67%) groups. These values fall within the typical range reported for commercial ice creams, which is typically between 36% and 42% depending on formulation and overrun [35].
Interestingly, despite the inclusion of sorbitol, a sugar alcohol with a lower molecular weight and different water-binding behavior compared to sucrose, the total solids content remained comparable. This suggests that sorbitol, though different in sweetness and freezing point depression, can maintain structural dry matter contributions similar to traditional sugars, as previously reported by Homayouni et al. [30].

3.2.2. Protein

The protein contents of the ice cream samples are presented in Table 2. The protein contents of the samples ranged narrowly between 3.78% and 3.81%, with no significant difference among the groups (p > 0.05). The highest protein content was found in the sample containing skimmed milk powder (3.81%), while the lowest was in the sorbitol-added sample (3.78%). These values are consistent with previous studies, which reported protein contents of traditional dairy-based ice creams typically between 3.5% and 4.0% [36].
The slight increase observed in the skimmed milk powder sample is likely due to its high protein concentration and low fat content, which allows for more contribution of milk solids-non-fat (MSNF). This is consistent with the findings reported by El-Salam et al. [18], who emphasized that skim milk powder supplementation enhances the protein profile of frozen dairy desserts due to its casein and whey protein richness. The skim milk powder contained 34.1% protein, higher than whole milk powder (26.3%) and whey powder (12.5%), which explains its superior effect compared to the control and other treatments (see Table 2).

3.2.3. TA and pH

Titratable acidity (TA), expressed as % lactic acid, remained relatively stable in all formulations throughout 90 days of frozen storage. Values ranged between 0.260% and 0.267% (Table 3), with no significant differences among groups (p > 0.05) (Table 4). Similarly, pH values were maintained between 6.28 and 6.32 (Table 3), indicating minimal post-acidification or microbial activity during storage.
Frozen storage inherently limits acid development and metabolic activity, contributing to stable pH values. Additionally, the high-fat, high-solids matrix of ice cream provides a protective environment that reduces osmotic stress and shields probiotic cells from direct ice crystal damage. This barrier effect supports the long-term survival of encapsulated cultures [17,21].
The stability of TA and pH is especially noteworthy in the whey powder group, which contained microencapsulated Lactobacillus acidophilus. This suggests that encapsulation effectively prevented early probiotic metabolism and acid release. These findings are consistent with those of Adhikari et al. [1], who observed pH retention in yogurts fortified with encapsulated bifidobacteria, and Homayouni et al. [30], who reported similar buffering effects in symbiotic ice cream.

3.2.4. Color Stability (L, a, b*)**

The colorimetric parameters (L*, a*, b*) remained stable across all formulations and time points (p > 0.05) (Table 4). The L* values, representing lightness, ranged between 87.07 and 90.53 (Table 3), with a slight increase over storage. This increase may reflect ice recrystallization and light scattering due to protein matrix rearrangements. The a* (red-green) and b* (yellow-blue) coordinates showed minimal fluctuations, remaining within visually acceptable ranges.
This color stability can be attributed to the milk protein and fat matrix, which buffers oxidative or structural changes. Similar findings were reported by Goff [23] and Toker et al. [37], who noted that color retention in frozen dairy products is supported by ingredient emulsification and stable colloidal structure.

3.2.5. Melting Behavior

Melting resistance improved significantly across storage in all formulations. The initial melting time increased from 13–15 min on day 1 to up to 25 min by day 90 (Table 3), particularly in the skimmed milk powder (SMP) and whey powder groups. Similarly, complete melting times increased from approximately 75 to 87 min, indicating structural reinforcement.
Milk and whey powder formulations exhibited melting resistance values comparable to the control during the early stages of storage (day 1), indicating that initial structural properties were similar across treatments. Differences became more pronounced only after extended storage, likely due to protein-stabilized networks that resisted recrystallization. Improved melting resistance slows moisture migration and reduces the rate of ice crystal coarsening. Smaller and more uniform crystals minimize mechanical injury to encapsulated probiotics, thereby supporting cell viability during storage and consumption [13,38,39].
These results suggest enhanced water-holding capacity and matrix rigidity, particularly in protein-enriched and encapsulated formulations. Goff and Sahagian [25] observed that casein and whey proteins enhance melting resistance by creating a tighter gel matrix. Muse and Hartel [39] further emphasized that slower melting is linked to higher solids and lower free water mobility. Encapsulation, as shown by Gbassi et al. [22], can also introduce hydrophilic barriers that retain structure under heat stress.

3.2.6. Overrun

Overrun percentages ranged between 28.79% and 39.22%, with the highest values observed in the skimmed milk powder group at day 90 Table 3. The whey powder group also maintained relatively high overrun (~35.58%), whereas the control and sorbitol groups exhibited lower values. Higher overrun reduces the relative density but does not reduce total solids; dry matter remains unchanged because overrun introduces air, not water.
High protein content in SMP improves emulsification and foam stability, enhancing air retention. El-Salam et al. [18] and Akalin et al. [5] reported that milk solids-non-fat (MSNF) not only boost overrun but also contribute to smoother texture and reduced iciness. Furthermore, encapsulation materials may support overrun indirectly by increasing the viscosity of the mix, thus slowing air bubble coalescence.

3.2.7. Hardness

Hardness values increased significantly during the frozen storage in all groups. Hardness increased from 10.43 N to 19.37 N in the control and from 9.95 N to 21.97 N in the sorbitol group over 90 days, indicating a progressive structural reinforcement. The whey powder group also demonstrated significant structural strengthening (up to 35.58 N) (Table 3).
Since each ice cream formulation contained the same proportion of microencapsulated L. acidophilus (1%, w/w), the observed differences in textural and physicochemical characteristics cannot be attributed to variations in probiotic concentration. Instead, these effects are driven by the functional properties of the encapsulating matrices. Milk protein–based wall materials form stronger gel networks and bind more water, resulting in higher hardness and melting resistance, whereas sorbitol, lacking protein structure, produces a softer matrix despite the same probiotic ratio. Therefore, the improvements observed in structural stability are directly linked to encapsulant composition rather than probiotic percentage [18,21,23].
Although total solids and protein contents did not differ significantly among samples (p > 0.05), milk protein functionality—particularly casein micelle interactions and water-binding capacity—produced stronger gel structures in skim milk and whole milk powder formulations compared to the control. Thus, the textural differences are due to protein quality and its network-forming ability rather than total protein quantity [18,23].
This behavior is attributed to the protein-induced reduction in unfrozen water and formation of dense matrix structures. As stated by Muse and Hartel [39], higher protein and lower fat increase ice phase volume and reduce matrix flexibility. The encapsulation matrix in the whey powder group may have functioned as a reinforcing agent, similar to the results reported by Adhikari et al. [1] and Homayouni et al. [30].

3.2.8. Differential Scanning Calorimetry (DSC)

DSC measurements were carried out on ice cream samples containing microencapsulated L. acidophilus, immediately after production (day 1) and after 90 days of storage. Reported parameters included Tonset, Tend, and ΔH. A Tukey Q multiple comparison test was conducted to evaluate the effect of wall materials (control, whey powder, sorbitol, whole milk powder, skim milk powder).
Across all formulations and both storage points, Tonset ranged from approximately −16 to −12 °C, Tend from ~9 to 12 °C, and ΔH from ~124 to 142 J g−1. Mean values obtained via Tukey grouping were Tonset: −15.12 to −12.71 °C, Tend: 9.42 to 12.00 °C, and ΔH: 126.23 to 140.00 J g−1 (Table 5). Only ΔH differed significantly among treatments, with whey powder (140.00 J g−1) > control (126.23 J g−1) (p < 0.05) (Table 6); all other pairwise differences were not statistically significant. These magnitudes are in line with classic reports on ice cream systems, where ΔH typically falls between ~120–150 J g−1 depending on solids, sugars, and stabilizers [40].
Whey proteins increase total solids but contribute fewer effective osmoles than small carbohydrates; hence, for a fixed total solids target, systems richer in proteins may show slightly higher ΔH (more ice forms at the same temperature program). The significantly higher ΔH (140.00 J g−1) compared with the control (126.23 J g−1) is consistent with this rationale. Protein matrices can also structure water via hydrogen bonding without strongly depressing the freezing point, leaving Tonset largely unchanged while allowing more bulk water to crystallize, which explains why Tonset/Tend differences were not significant. These observations are consistent with previous studies demonstrating protein-rich or biopolymer-rich matrices modifying the extent but not the temperature span of melting [41].
Whole milk powder introduces both proteins and milk fat. Although fat can dilute the aqueous phase and stabilize air cells (altering hardness/melting behavior macroscopically), its direct impact on DSC ice melting peaks is minor compared to the colligative effects of low-molecular-weight solutes. The ΔH of 137.68 J g−1 (not significantly different from other noncontrol groups) indicates a slightly higher ice fraction than the control but lower than whey powder, possibly reflecting a balance between protein driven water structuring and the fat phase’s dilution of the serum phase [38].
Skim milk powder adds proteins and lactose, but no fat. Its ΔH (136.77 J g−1) was close to that of whole milk powder, again higher than the control but lower than whey powder, and statistically indistinguishable from most treatments. This supports the notion that milk proteins, irrespective of fat, tend to yield slightly higher ice fractions than the control, given similar soluble solids profiles. Tonset/Tend remained within the shared statistical group (p > 0.05), underlining that the main differentiator here is the extent (ΔH), not the temperature window, of melting.
Polyols such as sorbitol typically depress freezing point and increase the fraction of unfrozen/bound water, often reducing ΔH and mitigating recrystallization during storage [40]. In your dataset, sorbitol’s Tukey mean ΔH (129.44 J g−1) sits between the control and protein-rich systems, and day 90 ΔH (127.28 J g−1) trended slightly downward from day 1 (131.60 J g−1), consistent with a cryoprotective trajectory over storage. However, due to variability between samples, this effect did not translate into a statistically unique group in the multiple comparison test.
DSC analysis revealed that encapsulation wall composition, more than storage time, drives differences in the thermal signature of probiotic ice cream. Whey powder increased ΔH significantly compared to the control, indicating a higher ice fraction, whereas sorbitol tended to reduce ΔH during storage, consistent with its cryoprotective role. Whole and skim milk powders occupied an intermediate position. These findings are consistent with the literature on the roles of proteins (structuring, modest colligative impact) and polyols (strong water binding and freezing-point depression) in frozen dairy matrices. Future studies should include glass transition (Tg′) mapping and modeling of ice fraction vs. temperature to more precisely quantify bound/unfrozen water contributions of each encapsulant.

3.2.9. Rheological Properties

The fact that G′ > G″ (tanδ < 1) in all formulations indicates that the systems behave with weak gel character and predominantly elastic behavior; this is the profile expected in the literature for multiphase ice cream structures consisting of partially coagulated fat globules, ice crystals, and a high-viscosity serum phase [42]. The fact that the most significant difference between the groups in your reported values in Table 7 and Table 8 (e.g., Tukey means: G′ ≈ 16.7–28.1 Pa; G″ ≈ 11.9–18.7 Pa; apparent viscosity ≈ 21–27 Pa s) is on G′ and G″, but not on apparent viscosity, supports this view; This is because small-amplitude oscillation tests better distinguish subtle differences in the fat network and ice/serum phase connectivity than viscosity measured at a single shear rate [43]. Capsules containing whole and skim milk powder formed the stiffest/weakest gel structures, significantly increasing the elastic (G′) and viscous (G″) moduli (p < 0.05). This is consistent with the partial coalescence of milk proteins (casein-whey) and fat (in fatty ST), enhancing network integrity [44]. It is frequently reported in the literature that higher milk solids and fat destabilization increase the elastic response of ice cream, reduce the melting rate, and enhance the body/chew sensation [45]. In this study, these two groups were ranked highest in terms of G′/G″.
The whey powder formulation showed lower G′ and G″ than the milk powder groups and was in the same statistical group as the control and sorbitol. It was reported in the literature that even with increased protein content, the type of protein/degree of aggregation and the lack of a fat phase can be limiting in enhancing the small-amplitude elastic response [46]. Therefore, the formation of a “moderate” network by the whey powder group is an expected result.
Sorbitol, a low-molecular-weight polyol, lowers the freezing point of the serum phase during freezing and binds water; The initial lower G′ (softer structure), but the observed increase in G′, G″, and G* during storage, along with a tendency to restructure/harden over time, is consistent with the cryoprotective effects of polyols, which can also stabilize the microstructure in the long term [47]. In this context, the significant strengthening of the sorbitol group on day 90 in this study is an expected result.
The storage effect is formulation-specific and heterogeneous: The increase in moduli in the sorbitol and skim milk powder groups may indicate that the network strengthens over time; the slight decrease in whole milk powder may indicate an ice/oil structural thickening (coarsening) that reduces the small-amplitude elastic response. A small decrease in G′ and an increase in G″ were observed in the control, and a mixed pattern was observed in whey powder. These different storage responses in direction and magnitude are well known in the literature; this may be due to the competing effects of ice recrystallization, fat destabilization, and changes in serum-phase viscosity [48]. In conclusion, rheometry data indicate that the encapsulation wall material (especially milk powders) significantly affects the elastic/viscous nature of the ice cream matrix, while the use of a polyol (sorbitol) produces a structure that is initially softer but strengthens over time. The lack of statistical separation of apparent viscosity further underscores the need for rheometric measurements to understand the structural integrity of ice cream under small deformations. Our findings are fully consistent with the literature, suggesting that protein/fat-rich systems strengthen the network, while polyols modulate the structure through a different axis (cryoprotection) through water binding and freezing point depression.

3.2.10. L. acidophilus Count and Viability Rates

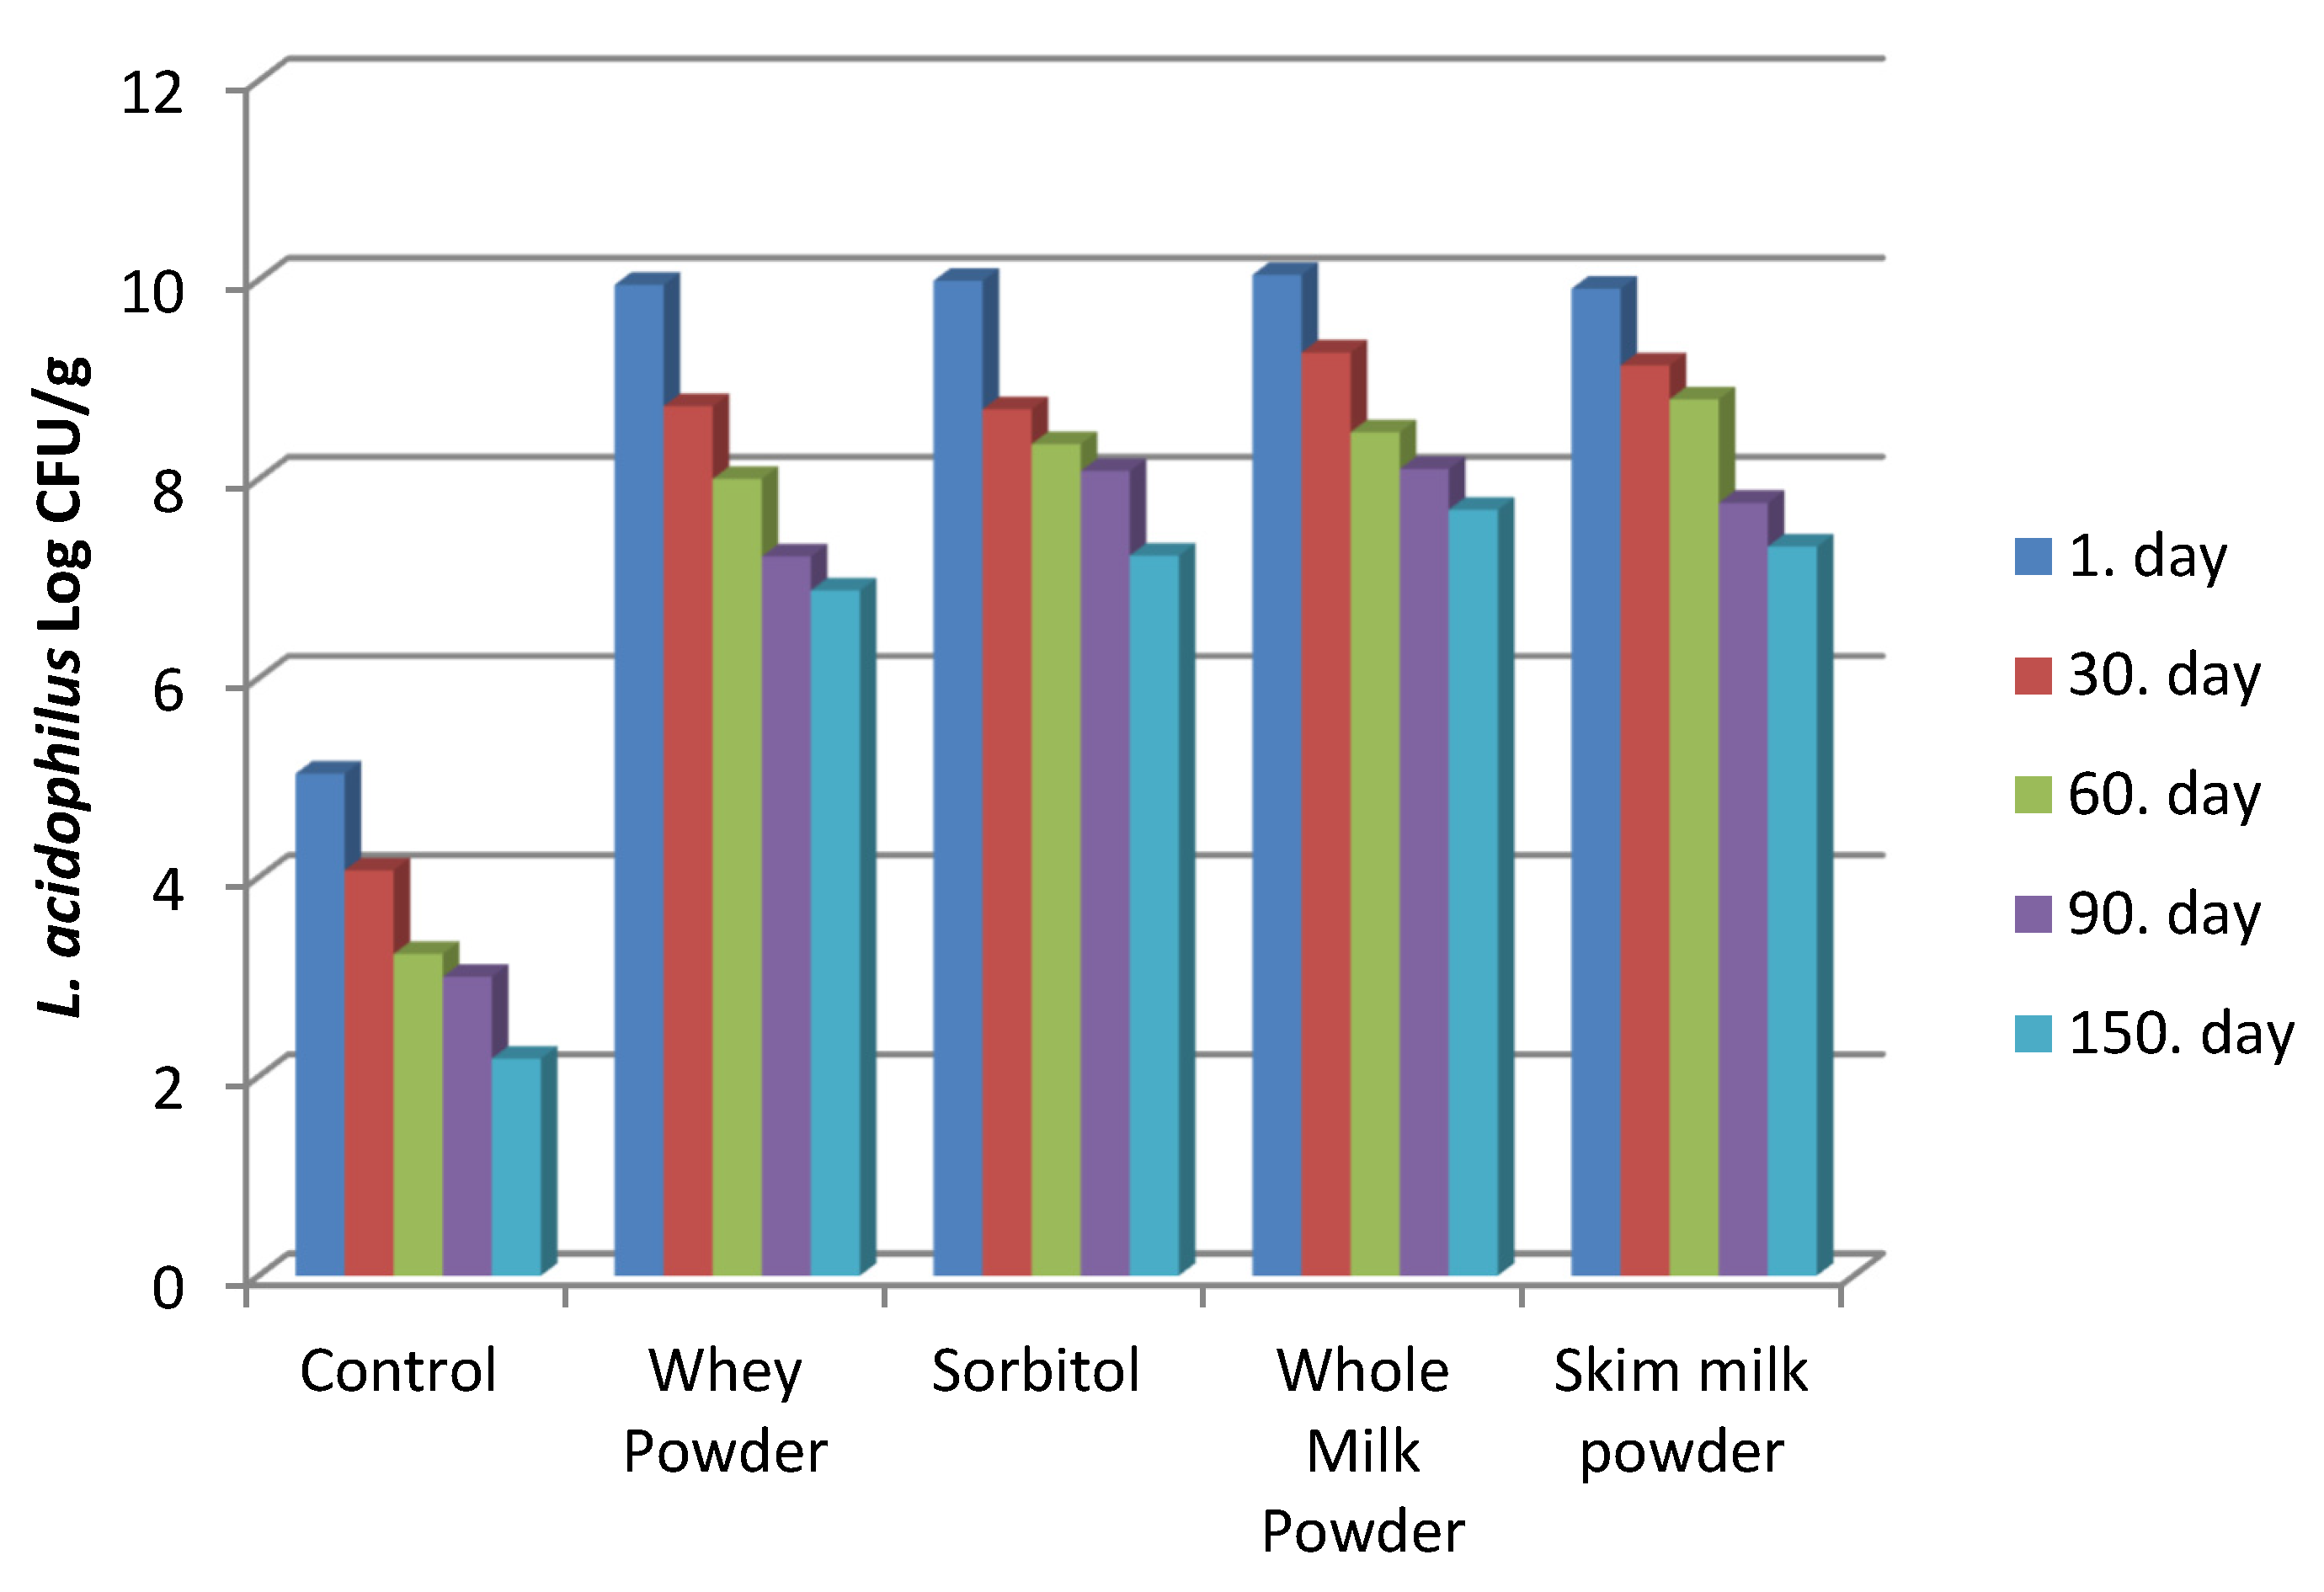
The viability data of Lactobacillus acidophilus in the samples (Table 9) revealed that microencapsulation significantly improved bacterial survival compared to the non-encapsulated control, which encapsulated samples showed higher initial counts (≈9.9–10.0 log CFU/g) compared to the control (5.04 log CFU/g), indicating that microencapsulation protected the cells from mechanical shear, aeration, and osmotic shock during freezing and churning. This demonstrates that damage occurs primarily during ice cream manufacturing, and encapsulation effectively prevents early-stage viability losses. This reduction is consistent with studies reporting that free L. acidophilus cells are highly sensitive to freezing stress, oxygen exposure, pH fluctuations, and mechanical damage from ice crystals [49,50]. Similar losses of 2–4 log units were observed in frozen desserts without encapsulation within 2–3 months of storage [31].
Viability analyses were performed throughout 150 days of storage at −18 °C. Microencapsulated samples maintained >6 log CFU/g during storage, while the free-cell control dropped below 3 log CFU/g. This demonstrates that microencapsulation protects probiotic cells against cryoinjury during manufacturing and storage, and performance varied depending on wall material composition.
In contrast, encapsulated samples maintained high initial counts (~9.9–10.0 log CFU/g) and preserved viability above the recommended probiotic threshold of 6 log CFU/g even after 150 days of frozen storage [43]. For instance, whole milk powder (10.05 → 7.69 log CFU/g) and skim milk powder (9.91 → 7.32 log CFU/g) exhibited only ~2.3–2.6 log reductions during 5 months, which is significantly lower than the control’s >2.8 log reduction within the first 90 days (Figure 2). This is consistent with Kailasapathy [33], who emphasized that encapsulation in protein- or carbohydrate-based matrices can prevent direct exposure to damaging freezing interfaces, thus maintaining probiotic viability over extended storage.
Whole and skim milk powders achieved the highest average viable counts (8.71 log and 8.59 log, respectively, Table 10), significantly higher than whey powder (8.16 log) and sorbitol (8.47 log) (p < 0.05). The superior performance of milk powders can be attributed to their balanced combination of casein, whey proteins, lactose, and fat, which provides multiple protective mechanisms:
Milk fat acts as a protective layer around probiotic cells, reducing ice-induced damage [51]. Casein micelles and lactose increase osmotic stability and buffer pH, both critical for cell membrane integrity [51]. The protein network from milk powders can act as a physical barrier against oxygen and free radicals, which otherwise decrease probiotic viability [50].
Sorbitol demonstrated notable cryoprotective properties, maintaining 7.23 log CFU/g at day 150 with a survival rate of ~67%. Sorbitol’s ability to lower the freezing point, reduce water activity, and minimize ice crystal growth helps prevent mechanical damage to the cells [52]. Similar polyols (e.g., glycerol) have been widely used in probiotic and lactic acid bacterial preservation due to these mechanisms [53].
Whey powder, while still offering significant protection compared to the control, exhibited slightly lower counts (6.88 log CFU/g at day 150) relative to milk powders or sorbitol. Whey proteins (β-lactoglobulin, α-lactalbumin) form protective films around cells, but their cryoprotective effect may be less pronounced than that of polyols or whole milk components when used alone [11]. This aligns with findings reported by Kailasapathy [33], who noted that multi-component encapsulants (e.g., milk + polyol combinations) are generally more effective than single-protein systems.
This trend is consistent with the gradual loss of viability reported in other frozen dairy products, where encapsulated probiotics typically lose 1–3 log units over 3–6 months [49]. The decrease is attributed to osmotic stress, prolonged exposure to low temperatures, and residual oxygen within the ice matrix, but encapsulation slows down these detrimental effects compared to free cells.
Whole and skim milk powders provided the highest stability due to casein micelles, lactose, and fat globules forming a protective matrix around cells. Sorbitol acted as a polyol cryoprotectant, lowering freezing point and reducing intracellular ice damage. Whey powder showed moderate protection, suggesting that single-protein systems are less effective than multi-component matrices. These differences highlight the synergistic effects of protein–fat systems in enhancing probiotic tolerance to frozen storage [11,13,14,17,21].
Homayouni et al. [30] found that alginate-encapsulated L. acidophilus maintained 6.5–7 log CFU/g after 90 days of frozen storage, similar to the whole and skim milk powder results found in this study at 90 days (8.10 and 7.76 log, respectively).
Mousavi et al. [38] highlighted the efficacy of sorbitol as a cryoprotectant, which aligns with the strong performance of the sorbitol formulation in this study (8.08 log at 90 days, 7.23 log at 150 days).
Shah [47] and Kailasapathy [33] emphasized that protein-fat matrices (like milk powders) outperform free cells in frozen products due to combined mechanical and biochemical protection. This is evident in the results achieved in the present study, where both milk powders maintained >7 log after 5 months.
The findings suggest that microencapsulation is essential to ensure the long-term probiotic viability required for functional ice creams, especially when aiming for extended shelf-life (>90 days). Whole milk powder- and skim milk powder-based capsules are particularly effective thanks to their dual role as protective agents and nutritional components. Sorbitol provides complementary cryoprotection and could be combined with milk powders to further enhance stability, as some studies [17] suggested a synergistic effect between protein matrices and polyols.

3.2.11. SEM Images of the Ice Creams

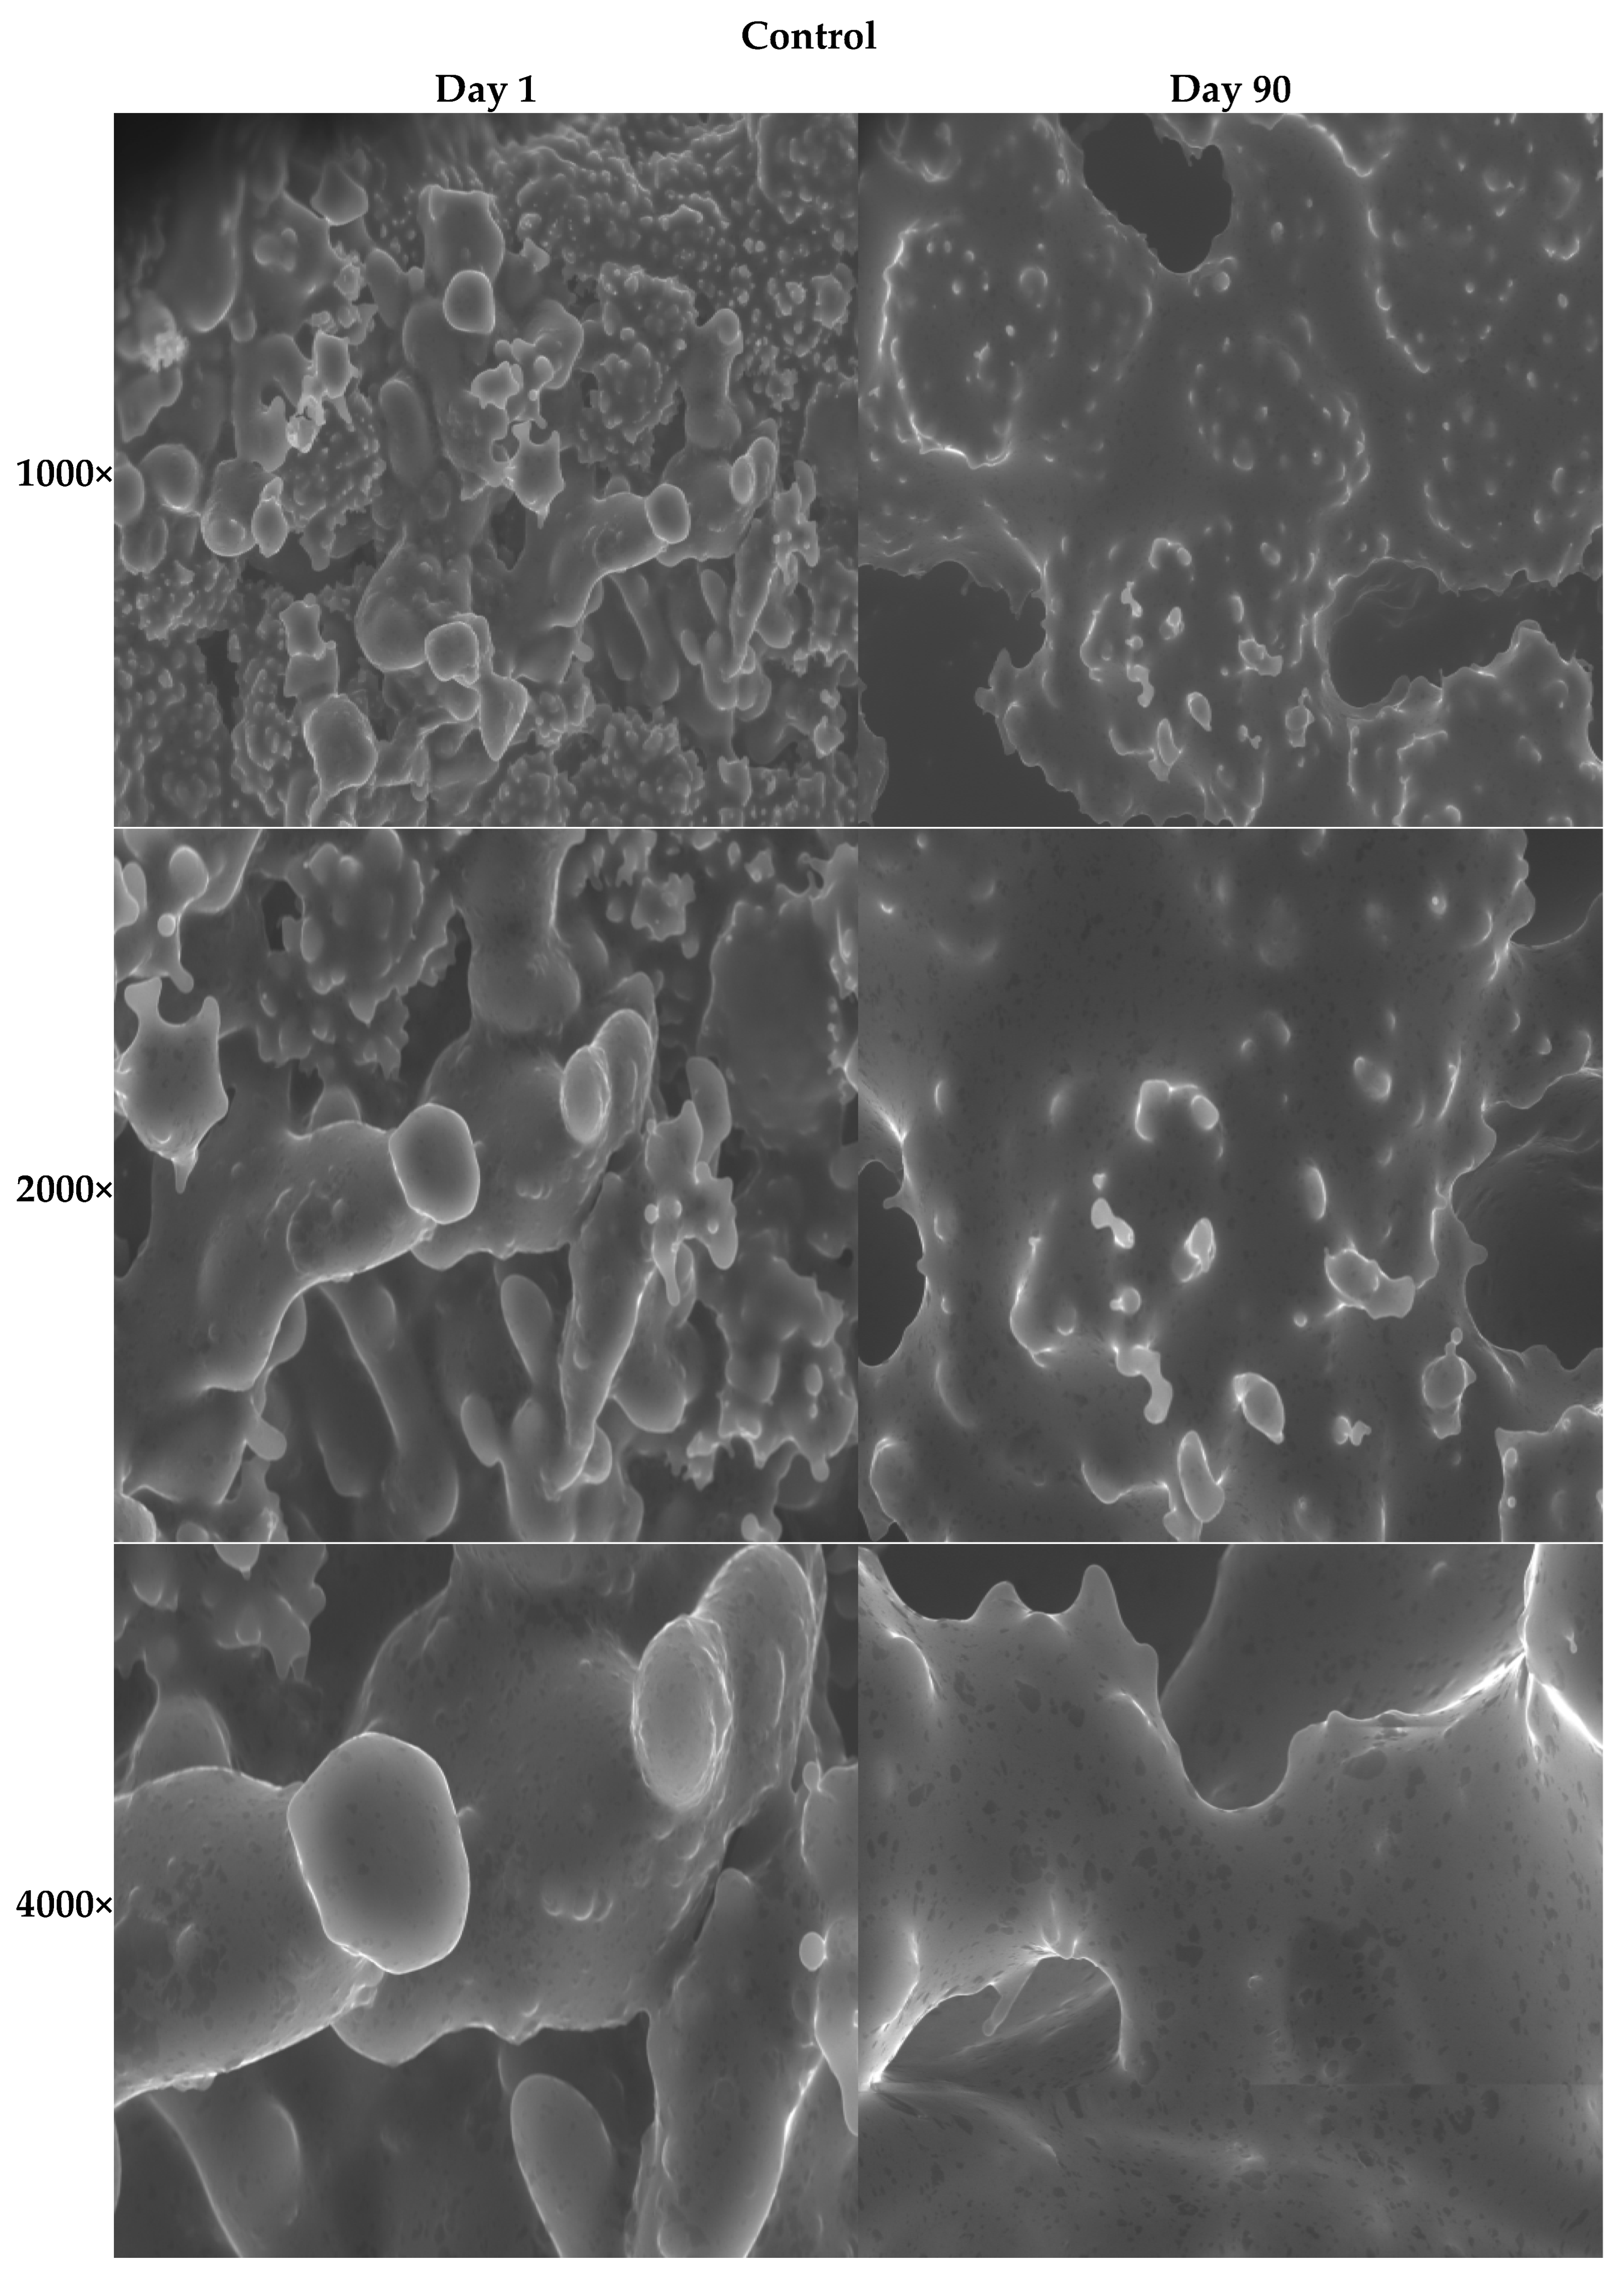
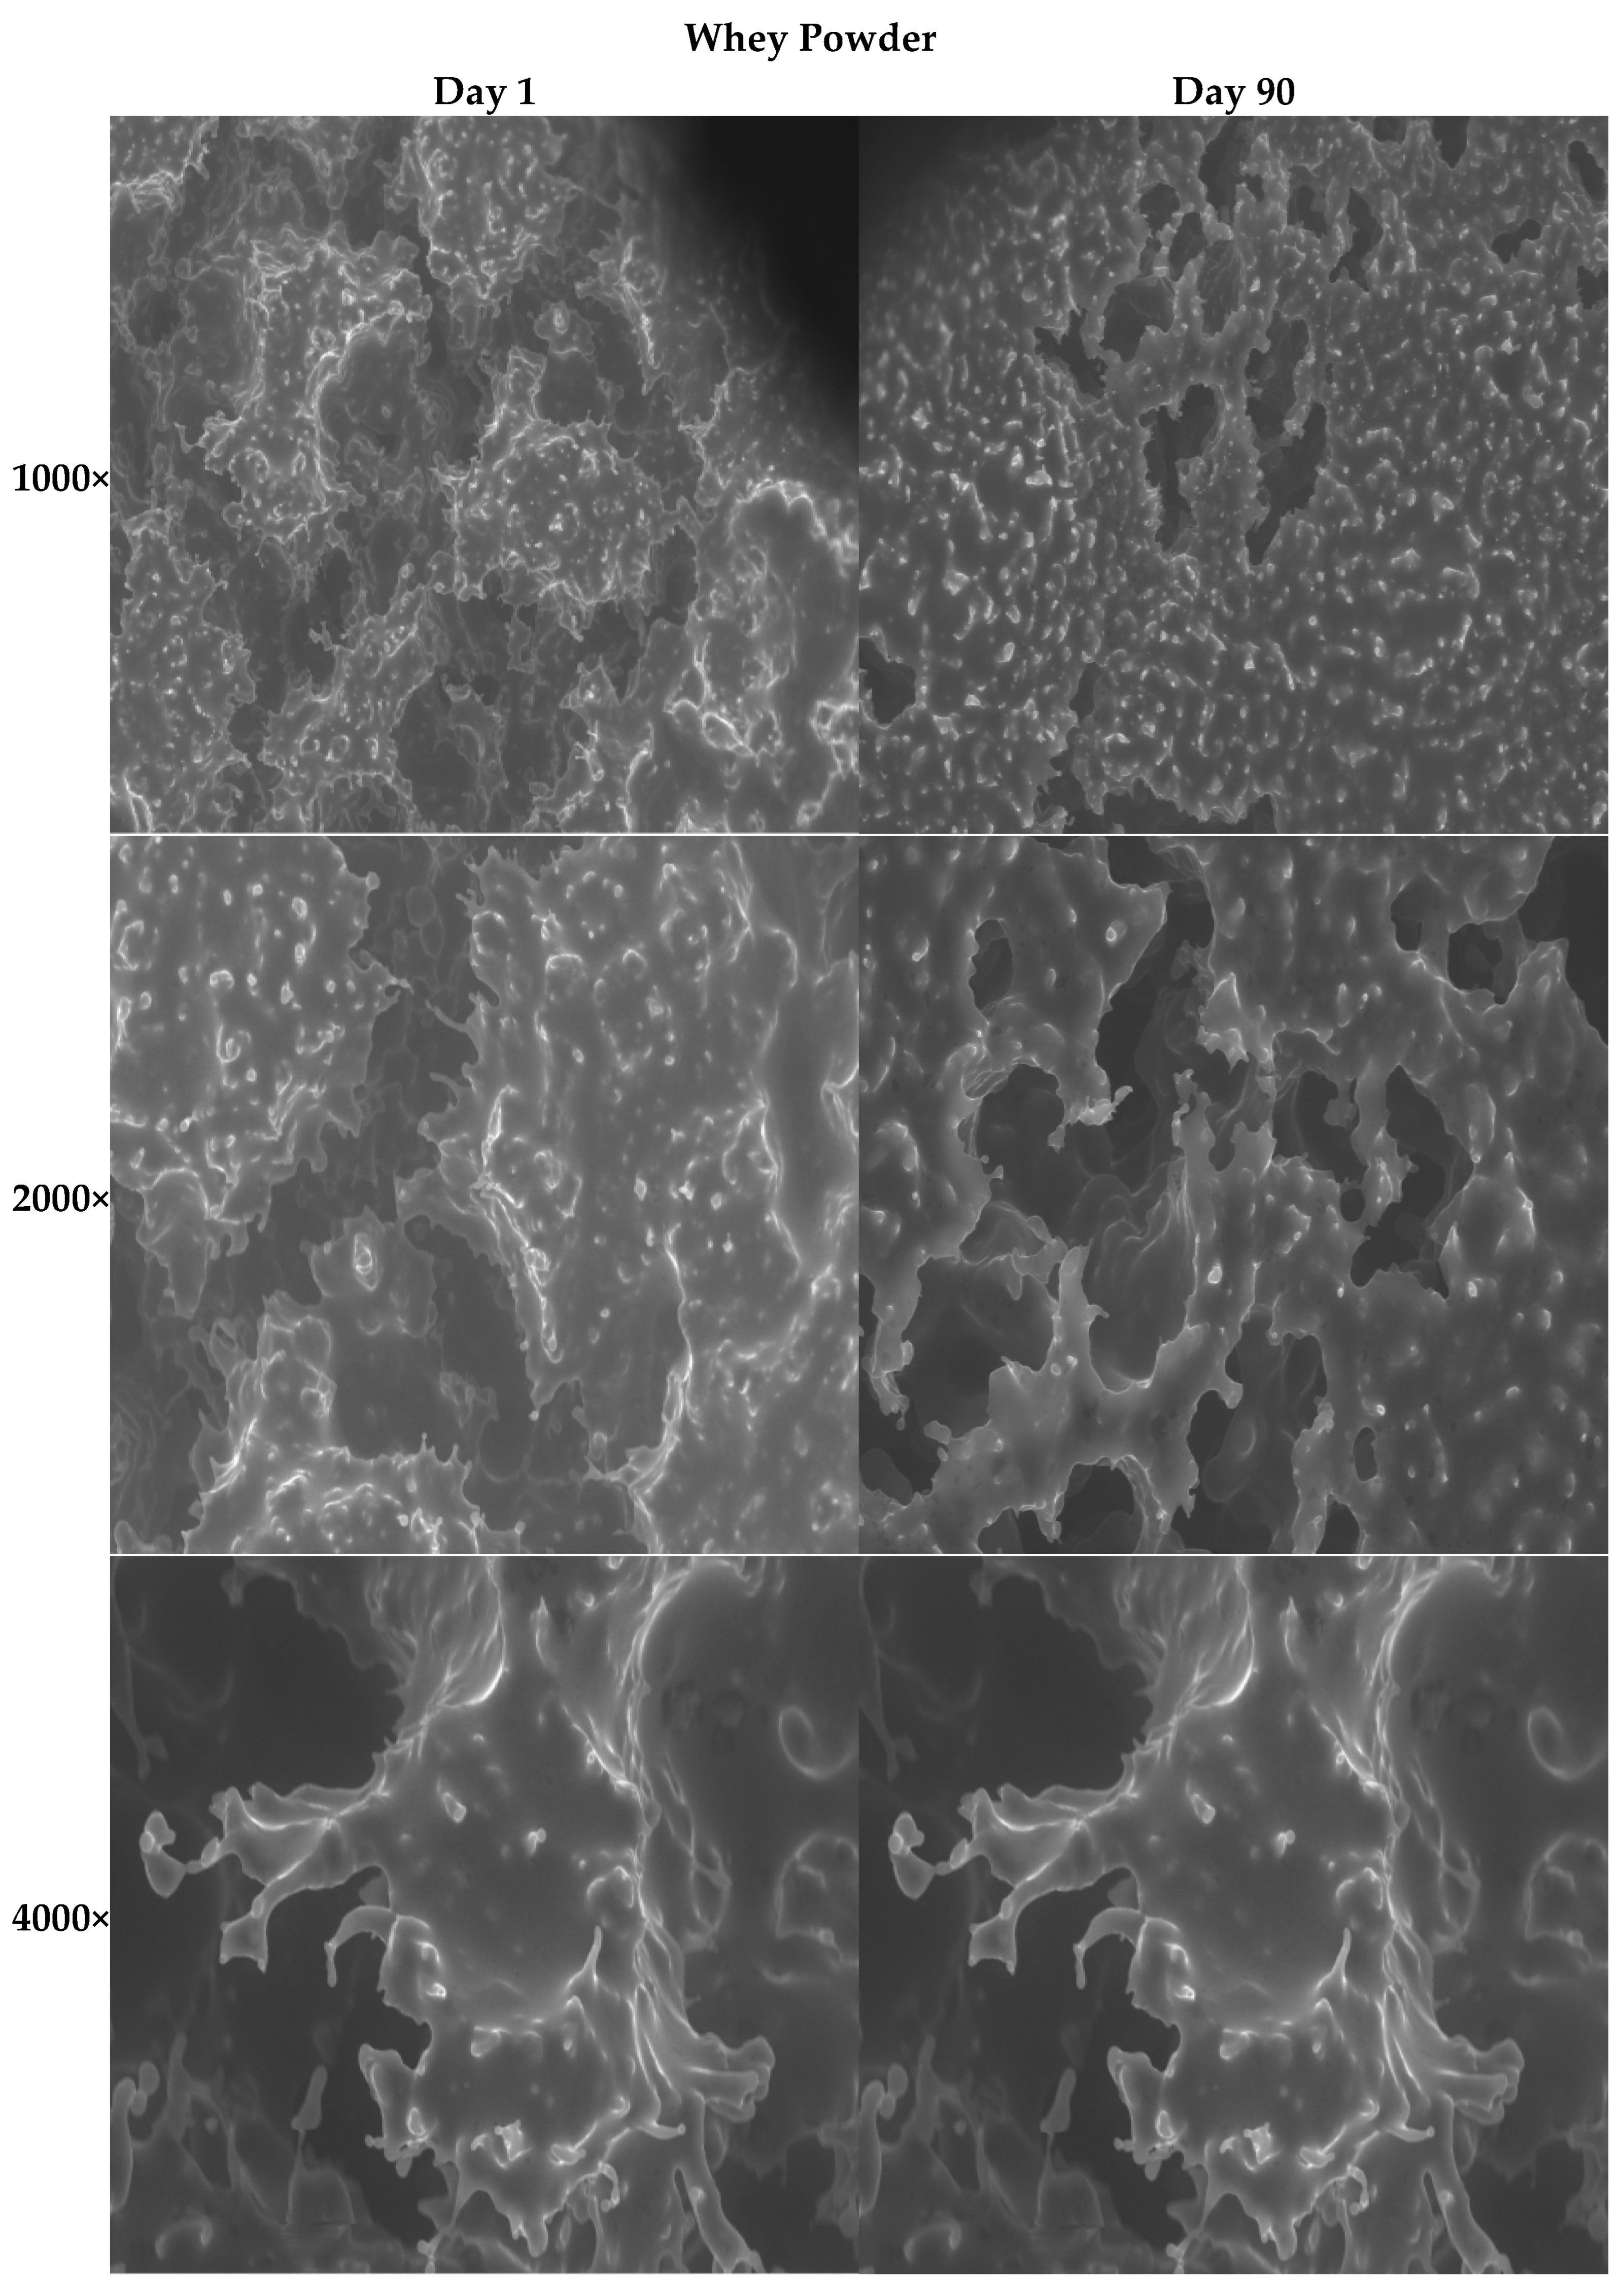
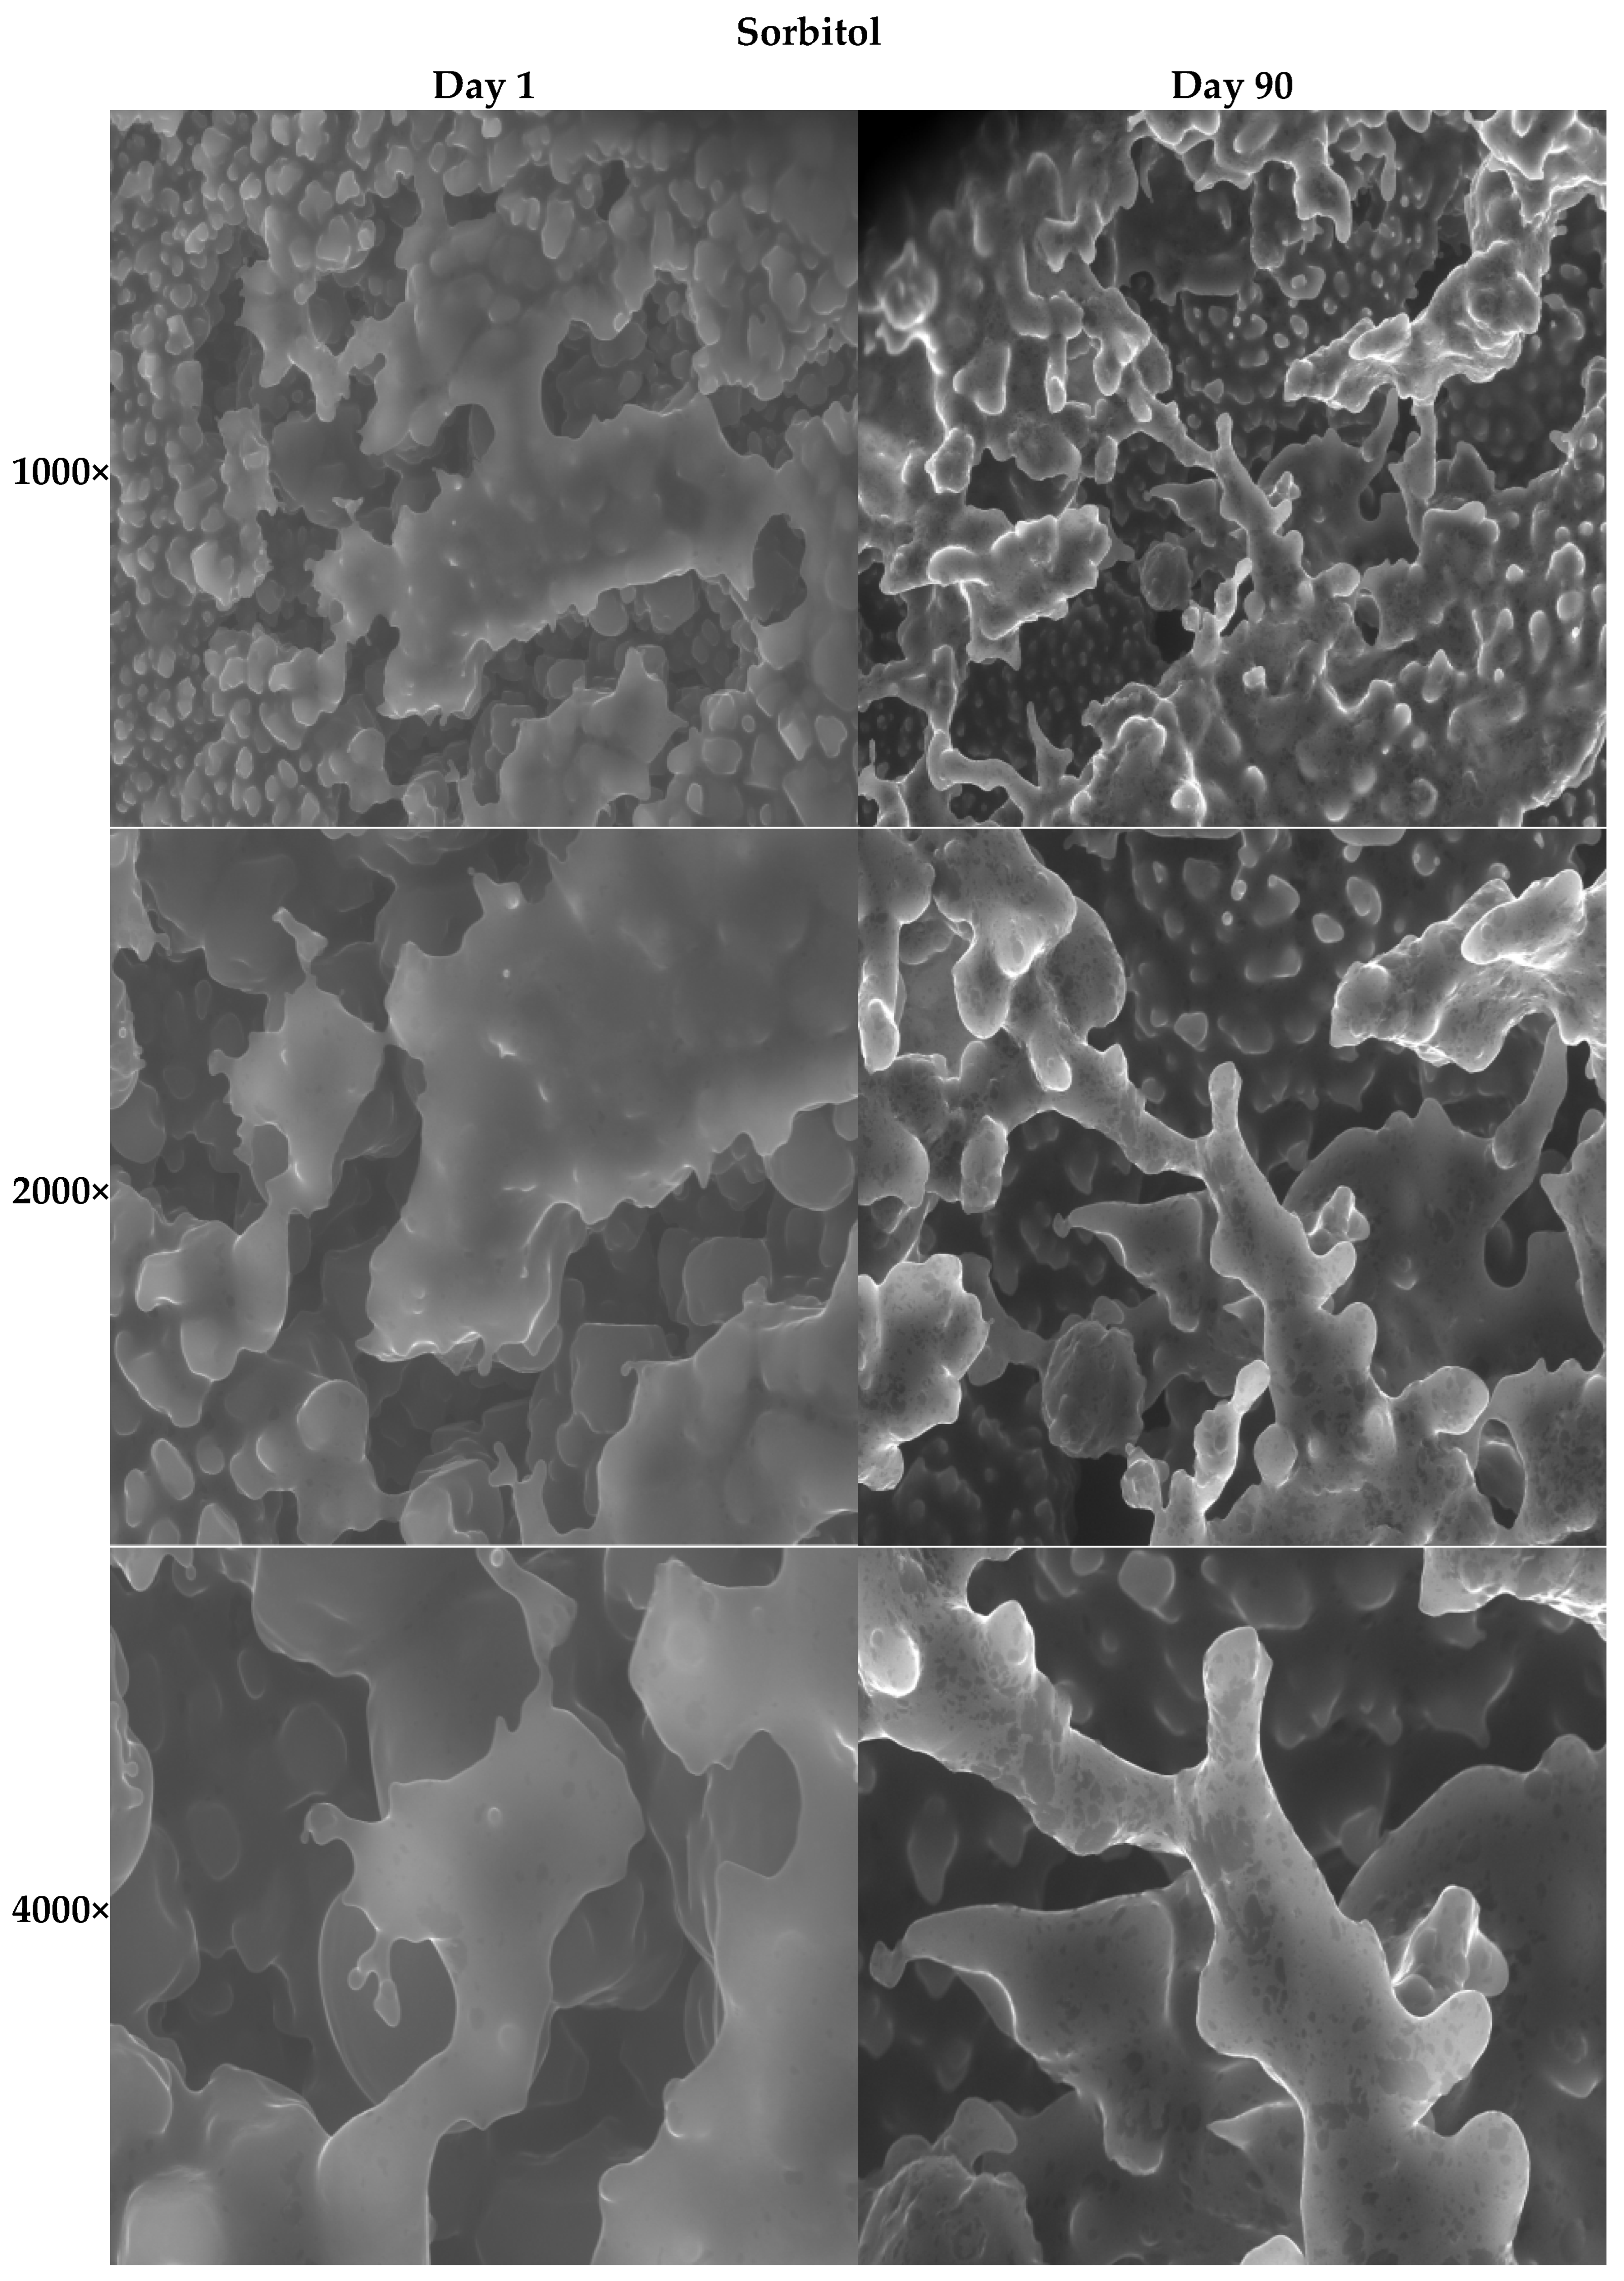
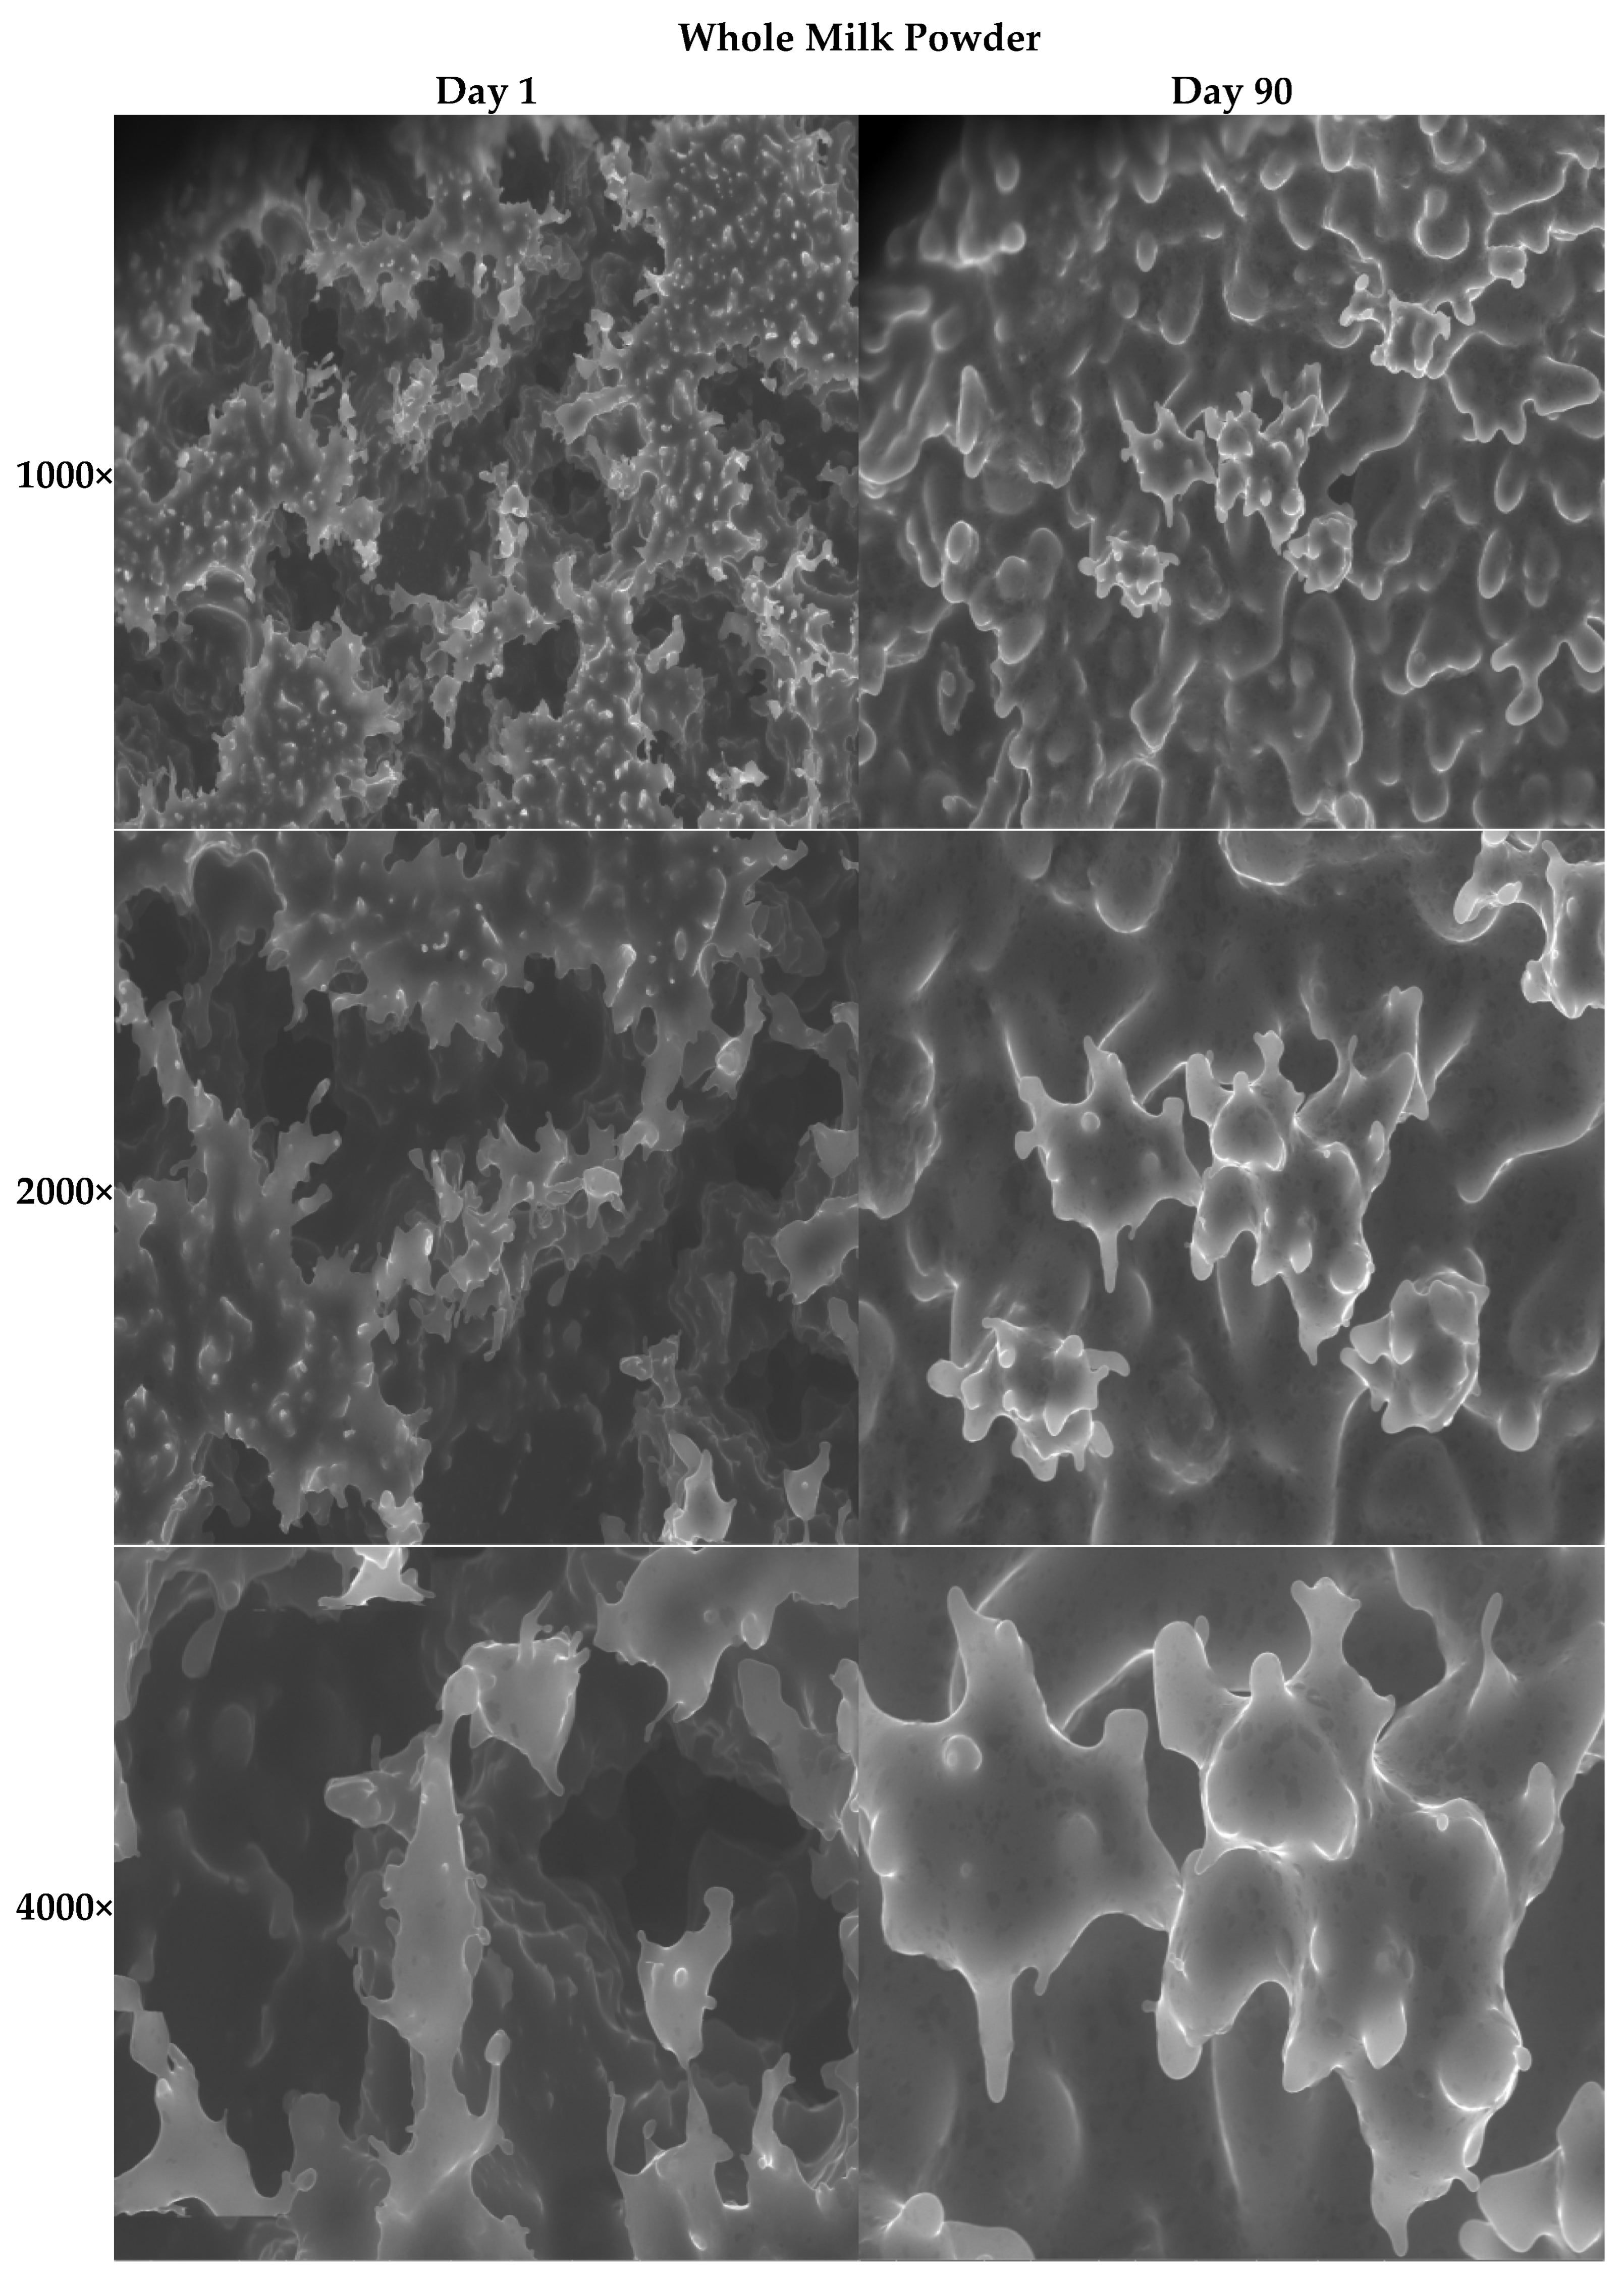
The Cryo-SEM micrographs (Figure 3) provide a detailed view of the microstructural evolution of ice cream samples containing microencapsulated Lactobacillus acidophilus during 90 days of frozen storage. Observations at 1000×, 2000×, and 4000× magnifications reveal differences in ice crystal size, air cell distribution, fat destabilization, and matrix integrity between formulations and over time.
On day 1, the control sample exhibits a relatively fine and uniform ice crystal distribution, with small air pockets embedded in the continuous matrix. By day 90, Cryo-SEM images indicate significant ice crystal coarsening and coalescence, with larger and more irregular crystals visible. This structural degradation is typical in frozen desserts due to ice recrystallization during storage, which occurs when smaller ice crystals melt and refreeze, forming larger crystals [43]. Studies reported that without stabilizers or cryoprotectants, ice crystal sizes can double during frozen storage, leading to a coarse and sandy texture [46].
The whey powder formulation displays smaller, more rounded ice crystals on day 1, with evidence of a smoother continuous phase compared to the control. By day 90, although ice crystals are larger than initially, the increase in crystal size appears less severe than in the control sample, suggesting some cryoprotective role of whey proteins. Whey proteins are known to bind water and slow ice recrystallization by stabilizing the serum phase [17]. Similar findings were reported by Adhikari et al. [2], who observed that whey protein concentrates can reduce ice crystal growth and improve microstructure in ice cream.
The sorbitol-containing sample shows a fine, well-dispersed network with small ice crystals at day 1. Even after 90 days, the crystal structure remains relatively stable, with limited coarsening compared to both the control and whey powder samples. Sorbitol acts as a polyol cryoprotectant, lowering the freezing point and increasing the unfrozen water fraction, which reduces the rate of ice crystal growth and limits mechanical damage to the matrix. Similar effects of sorbitol and glycerol in frozen dairy products were documented [11,49]. The Cryo-SEM evidence supports sorbitol’s role in preserving a smoother microstructure over prolonged storage.
The whole milk powder formulation exhibits a dense fat-protein matrix with small ice crystals and well-defined air cells on day 1. By day 90, although ice crystals have grown slightly, the matrix remains compact and less porous compared to the control. The presence of milk fat globules, partially coalesced during freezing, contributes to the stabilization of air cells and reduction in ice crystal mobility [43]. Clarke [15] and Regand and Goff [44] similarly reported that fat destabilization and protein-fat interactions help maintain microstructural integrity, improving texture stability.
Skim milk powder samples show a structured protein network with fine ice crystals and smaller voids compared to control and whey powder samples. Over 90 days, some ice crystal growth is observed but remains moderate, indicating that milk proteins provide cryoprotection despite the absence of fat. Literature indicates that casein and whey proteins in skim milk act as stabilizers, forming a viscous serum phase that reduces ice recrystallization rates [2,24].
Sorbitol provides the best microstructural stability, making it ideal for long-term storage of probiotic ice creams. Whole milk powder creates a dense and stable matrix with synergistic fat-protein protection, enhancing sensory attributes like creaminess. Whey powder and skim milk powder offer moderate cryoprotection, better than the control but slightly less effective than sorbitol or whole milk powder.

4. Conclusions

Microencapsulation of L. acidophilus had a substantial positive impact on the technological properties and probiotic stability of ice cream during frozen storage. Encapsulated samples maintained viable counts above 6 log CFU/g throughout 150 days, whereas non-encapsulated controls rapidly declined below functional levels. Milk-based wall materials—particularly whole and skim milk powder—provided the highest protection, due to the combined effects of protein–fat matrices, water binding, and cryoprotective behavior. Sorbitol also contributed to effective stabilization by reducing ice recrystallization and enhancing microstructural uniformity.
Beyond microbial survival, encapsulation significantly improved melting resistance, hardness, viscoelasticity, and structural stability. Cryo-SEM results verified smaller ice crystals and more compact matrices in encapsulated samples compared to the control. These findings indicate that the choice of wall material plays a dual role—preserving probiotic viability and enhancing product quality. The results demonstrate that microencapsulation is a practical and efficient approach for producing functional frozen dairy products with extended shelf-life and desirable physicochemical characteristics. Future work may focus on combining milk proteins and polyols to further optimize performance and sensory quality.

Author Contributions

Conceptualization, M.K. and R.S.; methodology, M.K.; software, M.K.; validation, M.K. and R.S.; formal analysis, M.K.; investigation, M.K.; resources, M.K.; data curation, M.K.; writing—original draft preparation, M.K.; writing—review and editing, M.K.; visualization, M.K.; supervision, R.S.; project administration, R.S.; funding acquisition, R.S. All authors have read and agreed to the published version of the manuscript.

Funding

This project was supported by Afyon Kocatepe University Scientific Research Projects Coordination Unit with project number 18.FEN.BİL.32.

Data Availability Statement

The original contributions presented in this study are included in the article. Further inquiries can be directed to the corresponding author.

Conflicts of Interest

The authors declare no conflicts of interest.

References

  1. Adhikari, K.; Mustapha, A.; Grun, I.U.; Fernando, L.N. Viability of microencapsulated bifidobacteria in set yogurt during refrigerated storage. J. Dairy Sci. 2000, 83, 1946–1951. [Google Scholar] [CrossRef]
  2. Liu, Y.; Wei, X.; Li, X.; Zhang, L.; Wang, Y.; Chen, J.; Zhou, H. Health-Promoting Effects of Lactobacillus acidophilus and Its Applications in Food and Beverage. Fermentation 2024, 10, 380. [Google Scholar] [CrossRef]
  3. Lisboa, H.M.; Sarinho, V.; Barros, M.; Pascoal, A.; Dias, C. Probiotic Ice Cream: Formulation Innovations, Stability Challenges, and Future Perspectives. Food Humanit. 2025, 5, 100780. [Google Scholar] [CrossRef]
  4. Zeashan, M.; Afzaal, M.; Saeed, F.; Ahmed, A.; Tufail, T.; Ahmed, A.; Anjum, F.M. Survival and Behavior of Free and Encapsulated Probiotic Bacteria under Simulated Human Gastrointestinal and Technological Conditions. Food Sci. Nutr. 2020, 8, 2419–2426. [Google Scholar] [CrossRef] [PubMed]
  5. Akalın, A.S.; Fenderya, S.; Akbulut, N. Viability and activity of bifidobacteria in yogurt containing fructo-oligosaccharide during refrigerated storage. Int. J. Food Sci. Technol. 2004, 39, 613–621. [Google Scholar] [CrossRef]
  6. Kareem, R.A.; Razavi, S.H.; Mousavi, Z. Survival of Free and Encapsulated Probiotics in Healthy Gummy Candy as a Carrier for Probiotic Capsules. Arch. Food Nutr. Sci. 2024, 8, 29–37. [Google Scholar] [CrossRef]
  7. Akalın, A.S.; Erisir, D. Effects of Inulin and Oligofructose on the Rheological Characteristics and Probiotic Culture Survival in Low-Fat Probiotic Ice Cream. J. Food Sci. 2008, 73, 184–188. [Google Scholar] [CrossRef]
  8. Akalın, A.S.; Karagözlü, C.; Ender, G.; Ünal, G. Effects of Aging Time and Storage Temperature on the Rheological and Sensory Characteristics of Whole Ice Cream. Milchwiss. —Milk Sci. Int. 2008, 63, 293–295. Available online: https://www.cabidigitallibrary.org/doi/full/10.5555/20083201016 (accessed on 27 October 2025).
  9. AOAC. Official Methods of Analysis, 15th ed.; Association of Official Analytical Chemists: Arlington, VA, USA, 1990; ISBN 0-935584-42-0. Available online: https://www.aoac.org/official-methods-of-analysis/ (accessed on 27 October 2025).
  10. Yu, S.; Wang, Z.; Li, Q.; Zhao, W. The First Di-D-Fructofuranose 1,2′:2,3′-Dianhydride Hydrolase (DFA-IIIase) from the Genus of Non-Arthrobacter (Pathogen Salmonella enterica subsp. enterica Serovar Mbandaka): Molecular Cloning, Expression, Identification, and Characterization. Food Biosci. 2023, 55, 103093. [Google Scholar] [CrossRef]
  11. BahramParvar, M.; Tehrani, M.M. Application and functions of stabilizers in ice cream. Food Rev. Int. 2011, 27, 389–407. [Google Scholar] [CrossRef]
  12. Carvalho, A.S.; Silva, J.; Ho, P.; Teixeira, P.; Malcata, F.X.; Gibbs, P. Protective Effect of Sorbitol and Monosodium Glutamate during Storage of Freeze-Dried Lactic Acid Bacteria. Lait 2003, 83, 203–210. [Google Scholar] [CrossRef]
  13. Afzal, A.; Afzaal, M.; Saeed, F.; Shah, Y.A.; Raza, M.A.; Khan, M.H.; Asres, D.T. Milk Protein Based Encapsulation of Probiotics and Other Food Material: Comprehensive Review. Int. J. Food Prop. 2024, 27, 245–262. [Google Scholar] [CrossRef]
  14. Chang, L.L.; Shepherd, D.; Sun, J.; Tang, X.; Pikal, M.J. Effect of Sorbitol and Residual Moisture on the Stability of Lyophilized Antibodies: Implications for the Mechanism of Protein Stabilization in the Solid State. J. Pharm. Sci. 2005, 94, 1445–1455. [Google Scholar] [CrossRef] [PubMed]
  15. Clarke, C. The Science of Ice Cream, 2nd ed.; Royal Society of Chemistry: Cambridge, UK, 2012; 213p. [Google Scholar] [CrossRef]
  16. Cotrell, J.I.L.; Pass, G.; Philips, G.O. Assessment of polysaccharides as ice cream stabilizers. J. Sci. Food Agric. 1979, 30, 1085–1088. [Google Scholar] [CrossRef]
  17. Ding, W.K.; Shah, N.P. Effect of various encapsulating materials on the stability of probiotic bacteria. J. Food Sci. 2009, 74, M100–M107. [Google Scholar] [CrossRef]
  18. El-Salam, M.H.A.; El-Shibiny, S.; Salem, A. Effects of milk powder addition on the quality of frozen dairy desserts. Dairy Sci. Technol. 2018, 98, 355–371. [Google Scholar]
  19. El-Salam, M.H.A.; El-Shibiny, S.; Mehanna, N. Iron Fortification of Milk and Dairy Products. Egypt. J. Dairy Sci. 2017, 45, 15–28. Available online: https://www.researchgate.net/profile/Mohamed-Abd-El-Salam 4/publication/330999278_iron_fortification/links/5c6053a9a6fdccb608b75998/ironfortification? Origin=scientificContributions&__cf_chl_tk=JXaO61.I6v81OgoKu7EeEFQFN_q985cmxOHuNjt9GeY-1763729693-1.0.1.1-J6qbf.Z99TmG2wi2gC5ExtDZa.BxyXZK6zC8HQi39Hs (accessed on 27 October 2025).
  20. FAO/WHO. Joint FAO/WHO Working Group Report on Drafting Guidelines for the Evaluation of Probiotics in Food, London, Ontario, Canada, 30 April–1 May 2002; Food and Agriculture Organization of the United Nations & World Health Organization. Available online: https://www.fao.org/3/a-a0512e.pdf (accessed on 27 October 2025).
  21. Fonseca, F.; Cenard, S.; Passot, S. Freeze-Drying of Lactic Acid Bacteria. In Cryopreservation and Freeze-Drying Protocols; Wolkers, W.F., Oldenhof, H., Eds.; Methods in Molecular Biology; Springer: New York, NY, USA, 2015; Volume 1257, pp. 477–488. [Google Scholar] [CrossRef]
  22. Gbassi, G.K.; Vandamme, T.; Ennahar, S.; Marchioni, E. Microencapsulation of Lactobacillus plantarum spp. in an alginate matrix coated with whey proteins. Int. J. Food Microbiol. 2011, 129, 103–105. [Google Scholar] [CrossRef]
  23. Goff, H.D. Formation and stabilisation of structure in ice-cream and related products. Curr. Opin. Colloid Interface Sci. 2002, 7, 432–437. [Google Scholar] [CrossRef]
  24. Goff, H.D.; Hartel, R.W. Ice Cream, 7th ed.; Springer: New York, NY, USA, 2013; ISBN 978-1-4614-6097-3. [Google Scholar] [CrossRef]
  25. Sahagian, M.E.; Goff, H.D. Thermal, Mechanical and Molecular Relaxation Properties of Stabilized Sucrose Solutions at Sub-Zero Temperatures. Food Res. Int. 1995, 28, 1–8. [Google Scholar] [CrossRef]
  26. Kavaz Yüksel, A.; Yüksel, M.; Şat, İ.G. Determination of certain physicochemical characteristics and sensory properties of green tea powder (matcha) added ice creams and detection of their organic acid and mineral contents. Gıda 2017, 42, 116–126. [Google Scholar] [CrossRef]
  27. Güven, M.; Karaca, O.B. Effects of varying sugar content and fruit concentration on the physical properties of vanilla and fruit-flavored frozen yogurts. Int. J. Dairy Technol. 2002, 55, 27–31. [Google Scholar] [CrossRef]
  28. Heidebach, T.; Först, P.; Kulozik, U. Influence of casein-based microencapsulation on freeze-thaw and storage stability of Bifidobacterium lactis Bb-12. J. Food Eng. 2010, 98, 309–316. [Google Scholar] [CrossRef]
  29. Hill, C.; Guarner, F.; Reid, G.; Gibson, G.R.; Merenstein, D.J.; Pot, B.; Morelli, L.; Canani, R.B.; Flint, H.J.; Salminen, S.; et al. The International Scientific Association for Probiotics and Prebiotics consensus statement on the scope and appropriate use of the term “probiotic”. Nat. Rev. Gastroenterol. Hepatol. 2014, 11, 506–514. [Google Scholar] [CrossRef]
  30. Homayouni, A.; Azizi, A.; Ehsani, M.R.; Yarmand, M.S.; Razavi, S.H. Effect of microencapsulation and resistant starch on the probiotic survival and sensory properties of symbiotic ice cream. Food Chem. 2008, 111, 50–55. [Google Scholar] [CrossRef]
  31. Soukoulis, C.; Lebesi, D.; Tzia, C. Enrichment of ice cream with dietary fibre: Effects on rheological properties, ice crystallisation and glass transition phenomena. Food Chem. 2009, 115, 665–671. [Google Scholar] [CrossRef]
  32. Jimenez-Florez, R.; Klipfel, N.J.; Tobias, J. Ice creams and frozen desserts. In Dairy Science and Technology Handbook, Volume 2: Product Manufacturing; Hui, Y.H., Ed.; VCH Publishers: New York, NY, USA, 1993; pp. 57–102. ISBN 978-1560812653. [Google Scholar]
  33. Kailasapathy, K. Encapsulation technologies for functional foods and nutraceutical product development. CAB Rev. 2009, 4, 1–19. [Google Scholar] [CrossRef]
  34. Karaman, S.; Toker, O.S.; Yüksel, F.; Çam, M.; Kayacier, A.; Dogan, M. Physicochemical, bioactive, and sensory properties of persimmon-based ice cream: Technique for Order Preference by Similarity to Ideal Solution to determine optimum concentration. J. Dairy Sci. 2011, 97, 97–110. [Google Scholar] [CrossRef]
  35. Kurt, A. Guide to the Examination and Analysis Methods of Milk and Dairy Products; Atatürk University Publications: Erzurum, Turkey, 1993; ISBN 975-401-384-1. Available online: https://www.atauni.edu.tr/ (accessed on 27 October 2025).
  36. Leslie, S.B.; Israeli, E.; Lighthart, B.; Crowe, J.H.; Crowe, L.M. Trehalose and sucrose protect both membranes and proteins in intact bacteria during drying. Appl. Environ. Microbiol. 1995, 61, 3592–3597. [Google Scholar] [CrossRef]
  37. Toker, O.S.; Doğan, M.; Canıyılmaz, E.; Ersöz, N.B.; Kaya, Y. The Effects of Different Gums and Their Interactions on the Rheological Properties of a Dairy Dessert: A Mixture Design Approach. Food Bioprocess Technol. 2013, 6, 896–908. [Google Scholar] [CrossRef]
  38. Mousavi, M.; Heshmati, A.; Garmakhany, A.D.; Vahidinia, A.; Taheri, M. Optimization of the Viability of Lactobacillus acidophilus and Physico-Chemical, Textural and Sensorial Characteristics of Flaxseed-Enriched Stirred Probiotic Yogurt by Using Response Surface Methodology. LWT—Food Sci. Technol. 2019, 102, 80–88. [Google Scholar] [CrossRef]
  39. Muse, M.R.; Hartel, R.W. Ice cream structural elements that affect melting rate and hardness. J. Dairy Sci. 2004, 87, 1–10. [Google Scholar] [CrossRef]
  40. Mandal, S.; Puniya, A.K.; Singh, K. Effect of alginate concentrations on survival of microencapsulated Lactobacillus casei NCDC-298. Int. Dairy J. 2006, 16, 1190–1195. [Google Scholar] [CrossRef]
  41. Marshall, R.T.; Goff, H.D.; Hartel, R.W. Ice Cream, 6th ed.; Springer: New York, NY, USA, 2003; ISBN 978-0-387-95471-1. [Google Scholar] [CrossRef]
  42. Patist, A.; Zoerb, H. Preservation mechanisms of trehalose in food and biosystems. Colloids Surf. B Biointerfaces 2005, 40, 107–113. [Google Scholar] [CrossRef] [PubMed]
  43. Plaza-Diaz, J.; Ruiz-Ojeda, F.J.; Gil-Campos, M.; Gil, A. Mechanisms of action of probiotics. Adv. Nutr. 2019, 10 (Suppl. S1), S49–S66. [Google Scholar] [CrossRef] [PubMed]
  44. Regand, A.; Goff, H.D. Effect of biopolymers on structure and ice recrystallization in dynamically frozen ice cream model systems. J. Dairy Sci. 2002, 85, 2722–2732. [Google Scholar] [CrossRef]
  45. Rodrigues, D.; Sousa, S.; Soares, J.C. Microencapsulation of Probiotics for Food Application. In Encapsulation of Active Molecules and Their Delivery System; Sonawane, S.H., Bhanvase, B.A., Sivakumar, M., Eds.; Elsevier: Amsterdam, The Netherlands, 2020. [Google Scholar]
  46. Sert, D.; Mercan, E.; Dertli, E. Characterization of lactic acid bacteria from yogurt-like product fermented with pine cone and determination of their role on physicochemical, textural and microbiological properties of product. LWT 2017, 78, 70–76. [Google Scholar] [CrossRef]
  47. Shah, N.P.; Ravula, R.R. Microencapsulation of Probiotic Bacteria and Their Survival in Frozen Fermented Dairy Desserts. Aust. J. Dairy Technol. 2000, 55, 139–144. Available online: https://www.proquest.com/scholarly-journals/microencapsulation-probiotic-bacteria-their/docview/199496413/se-2?accountid=15333 (accessed on 27 October 2025).
  48. Sofjan, R.P.; Hartel, R.W. Effects of overrun on structural and physical characteristics of ice cream. Int. Dairy J. 2004, 14, 255–262. [Google Scholar] [CrossRef]
  49. Soukoulis, C.; Chandrinos, I.; Tzia, C. Study of the Functionality of Selected Hydrocolloids and Their Blends with κ-Carrageenan on Storage Quality of Vanilla Ice Cream. LWT—Food Sci. Technol. 2008, 41, 1816–1827. [Google Scholar] [CrossRef]
  50. Talwalkar, A.; Kailasapathy, K. The role of oxygen in the viability of probiotic bacteria with reference to Lactobacillus acidophilus and Bifidobacterium spp. Curr. Issues Intest. Microbiol. 2004, 5, 1–8. [Google Scholar]
  51. Terpou, A.; Papadaki, A.; Lappa, I.K.; Kachrimanidou, V.; Bosnea, L.A.; Kopsahelis, N. Probiotics in food systems: Significance and emerging strategies for encapsulation and delivery. J. Funct. Foods 2019, 56, 1591. [Google Scholar] [CrossRef]
  52. Üçok, G. Determination of Cryoprotective Roles of Different Dairy By-Products During Freeze-Drying of Lactobacillus plantarum Strains Isolated from Sourdoughs. Ph.D. Thesis, Necmettin Erbakan University, Konya, Turkey, 2020. Available online: https://www.proquest.com/dissertations-theses/ekşï-hamurlardan-ïzole-edïlen-i-lactobacillus/docview/2600230218/se-2?accountid=15333 (accessed on 27 October 2025).
  53. Yılmaz, T.M. Effects of Exopolysaccharide (EPS)-Producing Lactic Acid Bacteria on Textural, Rheological and Microstructural Properties of Certain Foods; TÜBİTAK Project Report No. 12O169; TÜBİTAK: Istanbul, Turkey, 2014; 175p. Available online: https://www.tubitak.gov.tr/ (accessed on 27 October 2025).
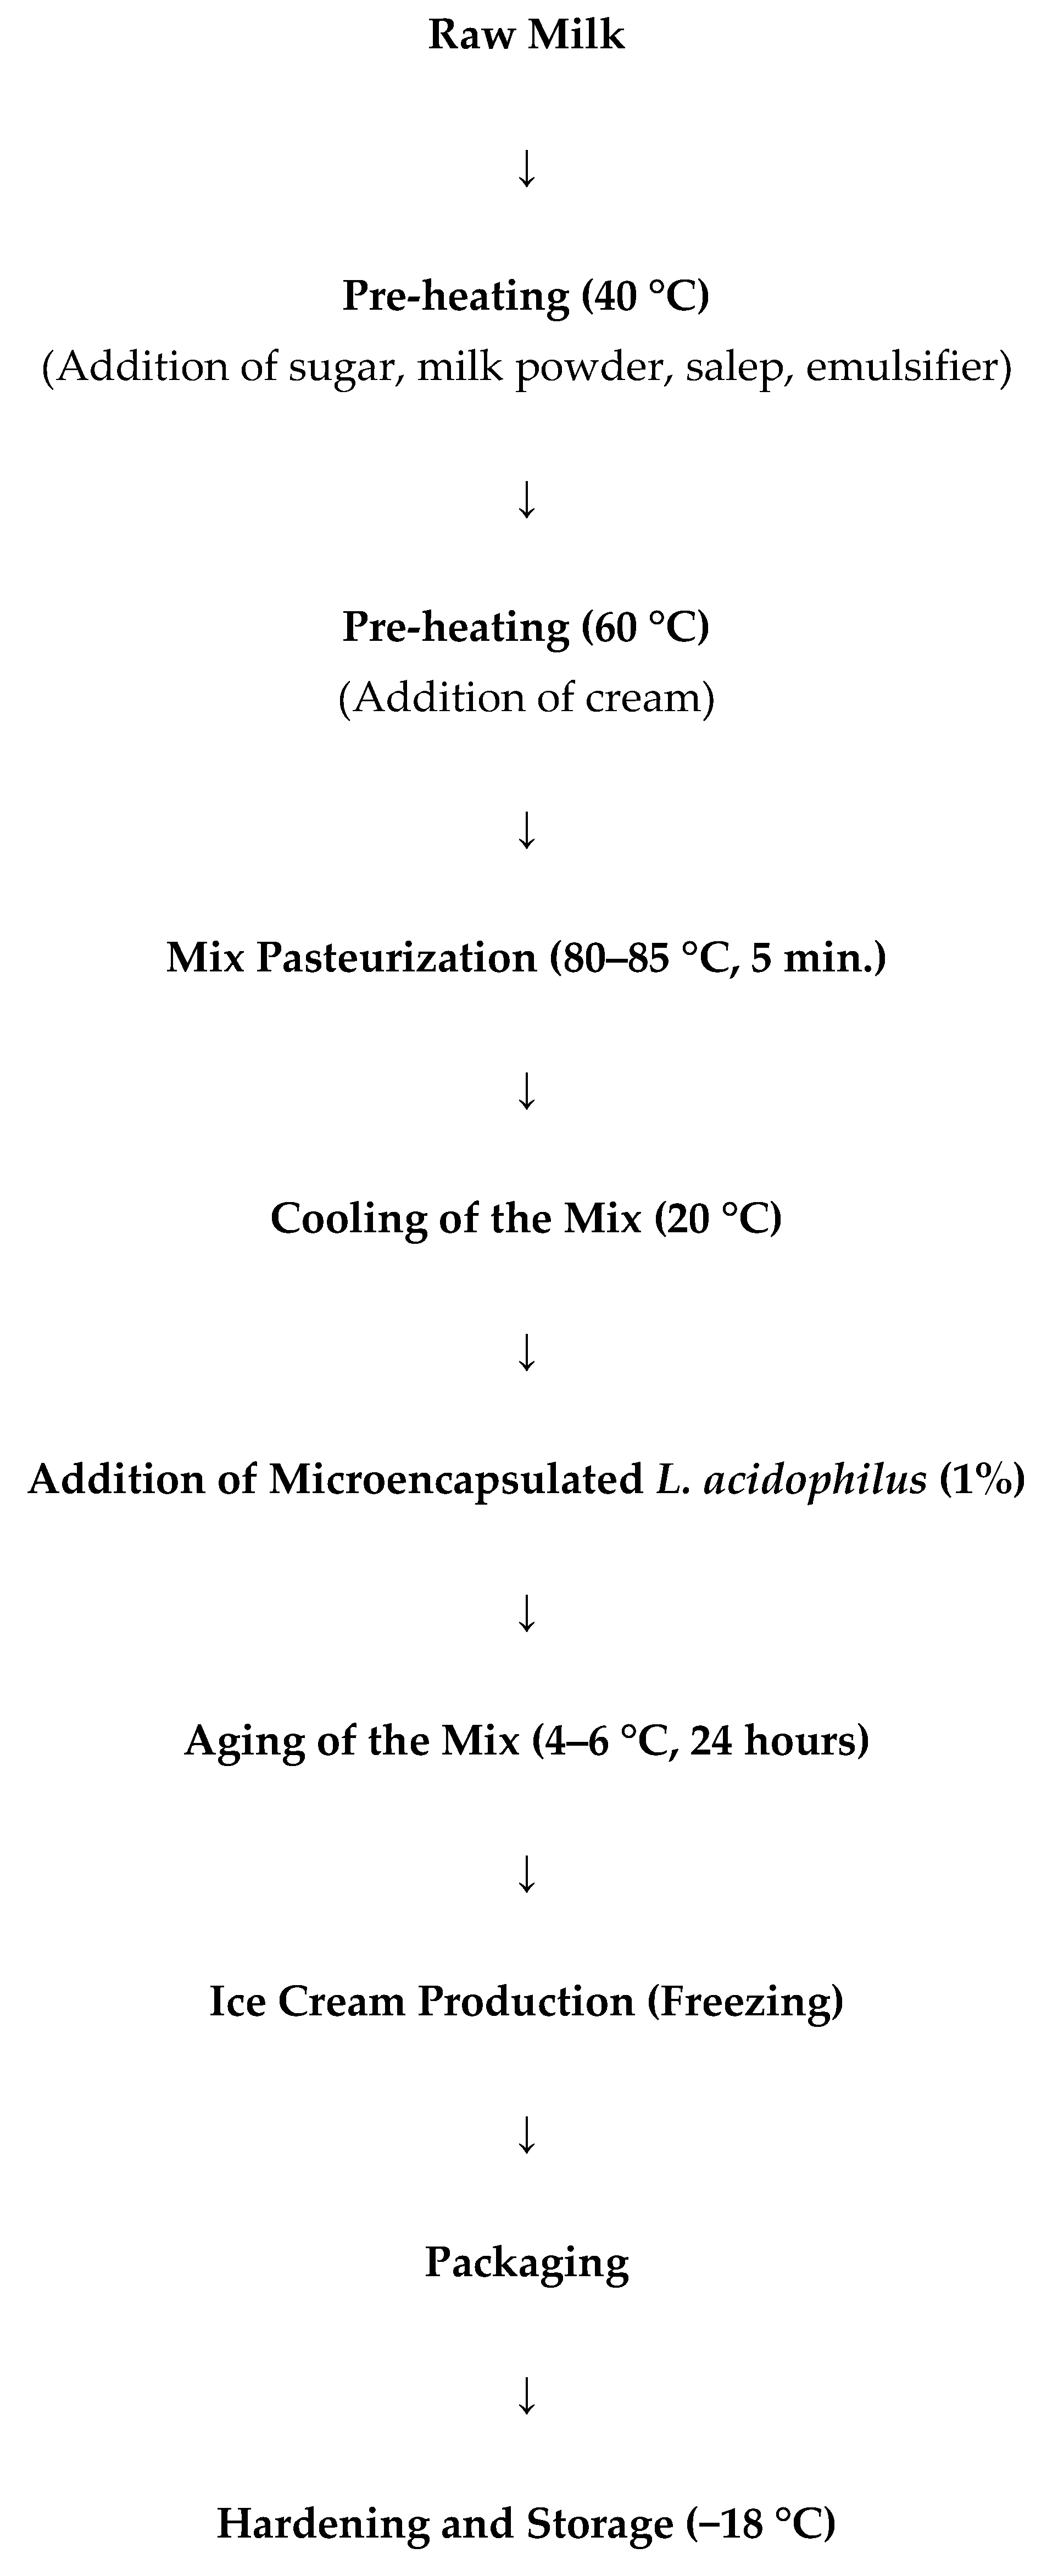
Figure 1. Ice Cream Production Flow Chart [18].
Processes 13 03803 g001
Figure 2. L. acidophilus counts in ice cream samples.
Processes 13 03803 g002
Figure 3. Cryo-SEM Images of the Ice Cream Samples.
Processes 13 03803 g003aProcesses 13 03803 g003bProcesses 13 03803 g003cProcesses 13 03803 g003d
Table 1. Textural Properties of the Ice Cream Mix.
Firmness
(g)
Consistency
(g.s)
Cohesiveness
(g)
Index of Viscosity (g.s)
Control21.98 ± 1.16 e32.57 ± 2.26 d−18.34 ± 2.80 bc−17.72 ± 1.37 a
Whey Powder 27.88 ± 0.32 c40.85 ± 2.99 c−19.99 ± 0.24 a−15.77 ± 0.52 b
Sorbitol25.34 ± 1.36 d27.13 ± 1.10 e−15.73 ± 1.49 bc−14.05 ± 0.57 c
Whole Milk Powder36.30 ± 1.73 b48.07 ± 3.80 b−15.11 ± 1.55 c−19.65 ± 0.95 a
Skim Milk Powder41.96 ± 1.98 a58.65 ± 2.09 a−18.69 ± 2.31 a−18.30 ± 2.81 a
Different letters in the same column indicate a statistically significant difference between the data (p < 0.05).
Table 2. Dry Matter and Protein Content of the Ice Cream Samples.
Protein
(%)
Drymatter
(%)
Control3.79 ± 0.03 a40.58 ± 0.79 a
Whey Powder 3.79 ± 0.02 a40.32 ± 1.99 a
Sorbitol3.78 ± 0.03 a40.67 ± 2.00 a
Whole Milk Powder3.80 ± 0.04 a40.80 ± 1.84 a
Skim Milk Powder3.81 ± 0.03 a39.99 ± 1.78 a
Different letters in the same column indicate a statistically significant difference between the data (p < 0.05).
Table 3. Some Physicochemical Properties of the Ice Cream Samples.
DayTA (% as Lactic Acid)pHL*a*b*First Drip (min.)Complete Melting (min.)Overrun (%)Hardnes (N)
ControlDay 10.260 ± 0.0036.30 ± 0.0387.39 ± 4.381.65 ± 0.128.72 ± 0.3113.97 ± 1.4575.10 ± 2.0038.67 ± 1.9710.43 ± 0.58
Day 300.262 ± 0.0026.30 ± 0.0287.07 ± 5.331.63 ± 0.138.69 ± 0.4616.22 ± 1.8076.50 ± 1.5036.99 ± 1.6610.35 ± 1.38
Day 600.263 ± 0.0046.28 ± 0.0289.82 ± 1.331.08 ± 0.0810.09 ± 0.6217.63 ± 1.4078.73 ± 1.7831.52 ± 1.1512.22 ± 1.42
Day 900.264 ± 0.0036.30 ± 0.0190.53 ± 1.281.41 ± 0.258.74 ± 0.5118.40 ± 1.6079.58 ± 1.9830.16 ± 0.7519.37 ± 8.25
Whey PowderDay 10.261 ± 0.0066.31 ± 0.0287.51 ± 1.391.67 ± 0.148.22 ± 0.7215.25 ± 1.8875.68 ± 1.4538.15 ± 0.9013.53 ± 4.79
Day 300.264 ± 0.0056.31 ± 0.0387.78 ± 2.261.64 ± 0.178.44 ± 0.5916.48 ± 1.3076.94 ± 1.4736.47 ± 0.8918.89 ± 1.23
Day 600.264 ± 0.0036.30 ± 0.0288.84 ± 1.081.32 ± 0.148.89 ± 0.6819.42 ± 1.0282.03 ± 2.6730.30 ± 2.1130.60 ± 1.99
Day 900.267 ± 0.0076.31 ± 0.0190.17 ± 0.101.54 ± 0.128.41 ± 0.5222.37 ± 0.8083.67 ± 1.4626.52 ± 0.7835.58 ± 2.97
SorbitolDay 10.262 ± 0.0046.31 ± 0.0287.12 ± 2.591.65 ± 0.128.60 ± 0.4013.31 ± 1.1771.72 ± 1.8141.98 ± 1.629.95 ± 1.53
Day 300.262 ± 0.0066.30 ± 0.0287.28 ± 1.851.66 ± 0.118.69 ± 0.3815.34 ± 0.8674.47 ± 0.6739.55 ± 0.7112.84 ± 1.81
Day 600.261 ± 0.0046.30 ± 0.0289.38 ± 2.080.98 ± 0.1910.08 ± 1.4516.46 ± 0.9977.23 ± 1.6335.71 ± 0.7619.88 ± 5.73
Day 900.262 ± 0.0056.32 ± 0.0389.46 ± 3.431.48 ± 0.098.42 ± 0.9218.39 ± 0.8878.40 ± 0.9231.52 ± 0.8921.97 ± 6.23
Whole Milk PowderDay 10.262 ± 0.0056.30 ± 0.0288.80 ± 1.051.56 ± 0.049.02 ± 0.4515.80 ± 1.6176.17 ± 1.1537.30 ± 1.1814.93 ± 5.14
Day 300.263 ± 0.0046.30 ± 0.0288.96 ± 1.211.61 ± 0.118.70 ± 0.8216.60 ± 1.1177.57 ± 1.0635.95 ± 1.1416.74 ± 2.96
Day 600.261 ± 0.0036.29 ± 0.0387.38 ± 3.461.21 ± 0.229.28 ± 0.6319.04 ± 1.4279.30 ± 0.8834.20 ± 0.5419.41 ± 4.74
Day 900.262 ± 0.0046.31 ± 0.0188.07 ± 1.301.83 ± 0.317.33 ± 1.3722.15 ± 1.6181.84 ± 1.6831.82 ± 1.2125.27 ± 2.44
Skim Milk PowderDay 10.261 ± 0.0046.30 ± 0.0388.37 ± 3.661.52 ± 0.149.24 ± 0.3717.74 ± 1.0479.82 ± 0.4534.54 ± 0.8719.62 ± 1.14
Day 300.262 ± 0.0056.29 ± 0.0288.27 ± 2.851.65 ± 0.198.46 ± 0.4820.39 ± 0.9881.34 ± 0.8330.57 ± 0.5725.69 ± 2.44
Day 600.262 ± 0.0036.31 ± 0.0288.68 ± 1.551.27 ± 0.219.04 ± 0.5423.57 ± 1.0784.43 ± 0.8827.04 ± 1.3729.55 ± 1.25
Day 900.261 ± 0.0056.31 ± 0.0189.53 ± 1.481.61 ± 0.258.11 ± 0.3925.18 ± 1.5787.35 ± 0.8323.94 ± 0.7839.22 ± 1.13
Table 4. Tukey Q Multiple Comparison Test Results of Some Physicochemical Properties of the Ice Cream Samples.
TApHL*a*b*First Drip (min.)Complete Melting (min.)Overrun (%)Hardnes (N)
Control0.263 a6.30 a88.70 a1.44 a9.06 a16.55 ab77.48 ab34.33 b13.09 a
Whey Powder 0.263 a6.31 a88.58 a1.54 a8.49 a18.37 b79.58 b32.86 b24.65 bc
Sorbitol0.262 a6.30 a88.31 a1.44 a8.95 a15.88 a75.46 a37.19 c16.16 a
Whole Milk Powder0.262 a6.31 a88.30 a1.55 a8.58 a18.40 b78.72 b34.82 b19.09 ab
Skim Milk Powder0.262 a6.31 a88.71 a1.51 a8.71 a21.72 c83.23 c29.02 a28.52 c
Different letters in the same column indicate a statistically significant difference between the data (p < 0.05).
Table 5. DSC Values of the Ice Cream Samples.
DayTonset (°C)Tend (°C)Enthalpy (J/g)
ControlDay 1−16.02 ± 1.369.89 ± 0.44127.70 ± 3.54
Day 90−12.99 ± 0.7610.99 ± 0.42124.76 ± 3.39
Whey PowderDay 1−15.25 ± 1.3412.31 ± 2.19140.57 ± 7.98
Day 90−15.00 ± 1.0812.00 ± 1.02141.68 ± 3.15
SorbitolDay 1−13.71 ± 0.779.91 ± 1.82131.60 ± 0.69
Day 90−14.25 ± 1.0610.62 ± 0.59127.28 ± 9.79
Whole Milk PowderDay 1−14.02 ± 1.3111.29 ± 0.89139.18 ± 4.29
Day 90−14.23 ± 1.3711.96 ± 2.41136.18 ± 5.86
Skim Milk PowderDay 1−13.29 ± 1.299.31 ± 1.05139.13 ± 3.86
Day 90−12.12 ± 2.649.54 ± 0.69134.41 ± 5.81
Table 6. Tukey-Q Multiple Comparison Test Results of the Effect of Ingredients on the DSC Values of the Ice Cream Samples.
TonsetTendEnthalpy
Control−14.50 a10.44 a126.23 a
Whey Powder −15.12 a12.00 a140.00 b
Sorbitol−13.98 a10.26 a129.44 ab
Whole Milk Powder−14.12 a11.62 a137.68 ab
Skim Milk Powder−12.71 a9.42 a136.77 ab
Different letters in the same column indicate a statistically significant difference between the data (p < 0.05).
Table 7. Rheometer Values of the Ice Cream Samples.
DayG′ (Elastic) (Pa)G″ (Viscos) (Pa)G* (Complex) (Pa)Viscosity (Pa.s)
ControlDay 121.97 ± 2.1911.28 ± 1.4525.87 ± 0.6620.92 ± 3.21
Day 9020.50 ± 2.1315.34 ± 1.2229.28 ± 1.5924.50 ± 1.84
Whey PowderDay 116.07 ± 0.6411.58 ± 1.0230.40 ± 2.4121.18 ± 3.17
Day 9017.30 ± 1.7013.53 ± 3.9523.68 ± 3.8524.73 ± 4.82
SorbitolDay 114.64 ± 1.109.43 ± 1.1022.35 ± 2.7619.95 ± 0.42
Day 9019.04 ± 1.8114.38 ± 1.2430.87 ± 4.7922.88 ± 3.42
Whole Milk PowderDay 129.51 ± 1.3419.96 ± 0.5739.30 ± 1.2729.27 ± 2.93
Day 9026.75 ± 2.0517.35 ± 1.2036.37 ± 5.9823.25 ± 4.17
Skim Milk PowderDay 123.38 ± 4.2116.85 ± 2.1238.35 ± 5.4426.68 ± 2.32
Day 9028.93 ± 4.9920.57 ± 0.6431.53 ± 10.0027.33 ± 4.20
Table 8. Tukey-Q Multiple Comparison Test Results of the Effect of Ingredients on the Rheometer Values of the Ice Cream Samples.
G′G″G*Viscosity
Control21.05 a13.31 a27.57 ab22.71 a
Whey Powder 16.69 b12.55 a27.04 a22.95 a
Sorbitol16.84 b11.90 a26.61 a21.41 a
Whole Milk Powder26.15 c18.66 b37.84 b26.26 a
Skim Milk Powder28.13 c18.71 b34.94 ab27.01 a
Different letters in the same column indicate a statistically significant difference between the data (p < 0.05).
Table 9. L. acidophilus Count and Viability Rates of the Ice Cream Samples.
DayL. acidophilus (log CFU/g)Viability Rate (%)
ControlDay 15.04 ± 0.02
Day 304.07 ± 0.06
Day 603.23 ± 0.06
Day 903.00 ± 0.03
Day 1502.18 ± 0.06
Whey PowderDay 19.95 ± 0.1496.79
Day 308.73 ± 0.0684.92
Day 608.00 ± 0.0377.82
Day 907.22 ± 0.0970.23
Day 1506.88 ± 0.0266.93
SorbitolDay 19.99 ± 0.0792.67
Day 308.70 ± 0.0380.71
Day 608.35 ± 0.0877.46
Day 908.08 ± 0.0874.95
Day 1507.23 ± 0.0867.07
Whole Milk PowderDay 110.05 ± 0.0990.30
Day 309.27 ± 0.0583.29
Day 608.47 ± 0.0376.10
Day 908.10 ± 0.0372.78
Day 1507.69 ± 0.0969.10
Skim Milk PowderDay 19.91 ± 0.1293.14
Day 309.14 ± 0.0785.90
Day 608.80 ± 0.0382.71
Day 907.76 ± 0.0672.93
Day 1507.32 ± 0.0568.80
Table 10. Tukey-Q Multiple Comparison Test Results for the Effect of Ingredients on the L. acidophilus Counts of the Ice Cream Samples.
L. acidophilus
Control3.51 a
Whey Powder 8.16 b
Sorbitol8.47 c
Whole Milk Powder8.71 e
Skim Milk Powder8.59 d
Different letters in the same column indicate a statistically significant difference between the data (p < 0.05).
Disclaimer/Publisher’s Note: The statements, opinions and data contained in all publications are solely those of the individual author(s) and contributor(s) and not of MDPI and/or the editor(s). MDPI and/or the editor(s) disclaim responsibility for any injury to people or property resulting from any ideas, methods, instructions or products referred to in the content.