Abstract
The escalating accumulation of waste printed circuit boards (WPCBs) underscores the urgent need for efficient recovery of valuable resources. Notably, WPCBs harbor a considerable number of intact electronic components that remain functional or could be repurposed. Nevertheless, the automated recognition and sorting of these components remain highly challenging, owing to their miniature dimensions, diverse model types, and the absence of publicly available, high-quality datasets. To address these challenges, this paper introduces a novel image dataset of discarded electronic components and proposes a deep learning-based data augmentation model that combines classical augmentation methods with DCGAN and SRGAN to achieve dataset size augmentation. This paper further conducts Peak Signal-to-Noise Ratio (PSNR) and Structural Similarity Index Measure (SSIM) evaluation on the generated images to ensure their suitability for downstream classification tasks. Experimental results demonstrate significant improvements in classification accuracy, with AlexNet, VGG19, ResNet18, ResNet101, and ResNet152 achieving increases of 6.6%, 9.7%, 4%, 5.4%, and 6.2%, respectively, compared to classical augmentation. This method enables precise identification to facilitate the downstream recovery of intact electronic components, thereby contributing to the conservation of natural resources and the effective mitigation of environmental pollution.
1. Introduction
The global digitalization era has led to a simultaneous increase in the generation of electronic waste (e-waste). Within the electronics sector, the electronic components are becoming obsolete at a rate considerably higher than their designed lifespan, resulting in massive resource idling and discard [1]. However, a significant proportion of discarded electronic components retain considerable value; through standardized recycling and remanufacturing processes, components recovered from waste printed-circuit-boards (WPCBs) can be re-embodied into new devices, thereby enhancing resource efficiency [2,3,4]. Nevertheless, during the recycling of WPCBs, the existing computer-vision identification and sorting technologies are simultaneously constrained by limited speed and accuracy when confronted with electronic components that are extremely diverse in type, divergent in model, miniature in size, and intricate in architecture, thereby directly restricting recycling efficiency and the high-value utilization of secondary resources.
In vision-based sorting of electronic components, dataset construction and optimization underpins model training and performance advancement [5]. Atik [6] relied on a public dataset that does not subdivide resistance values for resistors, capacitance values for capacitors, or package types. Sayeedi et al. [7] introduced the ElectroCom61 dataset covering 61 common component classes with 2121 finely annotated images, yet it omits intra-class micro-differences such as 0402 versus 0603 surface-mount resistor packages. This absence of granular discrimination constrains the ability of visual-recognition models to deliver the taxonomic resolution required in real recycling streams, limiting their efficacy and reliability for precision sorting.
In recent years, data augmentation (DA) has been introduced into the image-processing domain to enlarge dataset scales; the current mainstream paradigms cluster around two approaches: classical image transformations and deep generative models [8,9,10]. Krizhevsky et al. [11] alleviated over-fitting on ImageNet by injecting rotation, random cropping, horizontal flipping, and Gaussian-noise addition—classical transformations that have since been widely adopted for augmenting electronic-component images. Zhang et al. [12] proposed a generative adversarial network (GAN) that integrates multi-scale progressive training, perceptual loss, and an attention mechanism to synthesize photo-realistic facial images with pore-sharp details and accurate five-sense landmarks, which can be directly fed to film-grade virtual-character rendering pipelines. Ledig et al. [13] proposed the super-resolution generative adversarial network (SRGAN), which comprises a deep residual generator, a VGG-based perceptual loss and a discriminator; the adversarial training produced photo-realistic high-resolution imagery whose sharp details are barely distinguishable from genuine photos. Karras et al. [14] advanced the StyleGAN architecture, producing high-fidelity samples and enabling fine-grained control over the generated outputs. However, the StyleGAN is optimized primarily for natural images such as human faces and scenes; its latent mapping exhibits pronounced limitations when handling electronic-component imagery. The generator shows insufficient capacity to capture component-specific textural and structural nuances—including lead-frame pitch, silk-screen legend variations, and package-surface reflectance—often yielding blurred textures or misaligned edges [15]. Moreover, the StyleGAN architecture is deep and parameter-intensive, demanding large-scale training data and substantial GPU memory, which hampers its deployment in the small-sample regimes typical of electronic-waste recycling scenarios.
Image classification is a technical process that assigns an image to a predefined label based on its visual content and has been widely applied in medical-image analysis, autonomous-driving perception, industrial quality inspection, and remote-sensing land-cover recognition [16,17]. Electronic-component classification analogously labels components according to differences in their physical characteristics and model specifications. Traditional manual sorting relies on naked-eye inspection and subjective experience to place components into designated collection containers, inherently suffering from low throughput, poor consistency, and high labor intensity [18]. With the massive retirement of WPCBs products, this conventional approach can no longer meet the requirements of large-scale, high-precision processing. Prior studies have demonstrated the successful application of machine learning methods, such as decision trees and support vector machines, for specific component recognition [19]. However, the machine learning methods require high-resolution images and manual feature engineering and have limitations in terms of processing speed and data dependency. Deep learning algorithms have provided efficient, flexible, and cost-effective solutions in the field of image processing. Foo et al. [20] employed convolutional neural networks (CNNs) to identify and classify mixed components, thereby improving the e-waste processing efficiency. Furthermore, improved models incorporating 3D shape features have enhanced the accuracy of complex component identification [21]. Lu et al. [22] developed an automated sorting system that utilizes deep learning techniques to automatically identify and classify e-waste components. However, high-performance models typically require a large number of training images, which is a significant challenge due to the scarcity of image data corresponding to e-waste components.
This paper addressed the aforementioned challenges by enhancing image datasets through the integration of deep learning techniques with conventional DA methods, thereby contributing to e-waste recycling in the following ways: First, a novel image dataset of discarded electronic components comprising five major categories and 19 subcategories was introduced, which addressed the current scarcity of finely classified datasets in this domain. Second, A GAN-based image augmentation method for electronic components is proposed, which integrates classical DA methods, Deep Convolutional Generative Adversarial Networks (DCGAN), and Super-Resolution Generative Adversarial Networks (SRGAN) models, enabling the generation of high-quality and photorealistic electronic component images. The images generated by this method closely resembled real electronic components and could be utilized for increasing the size of the dataset. Based on this, we have established four different image datasets. Third, we performed classification on these four image datasets using five deep learning models: AlexNet, VGG19, ResNet18, ResNet101, and ResNet152. Finally, PSNR and SSIM were employed to evaluate the quality of images generated by GAN. The experimental results demonstrate that the distribution of generated images is highly similar to that of real images.
In summary, the main contributions of this paper can be summarized as follows:
- Creation of a waste electronic component image dataset comprising five major categories and nineteen subcategories.
- Proposal of a deep learning-based image data augmentation method for electronic components.
- The electronic component images generated by this method are highly similar to real electronic component images.
- The generated electronic component images significantly improve the classification accuracy of deep learning models.
2. Methodology
This study captured images of five types of electronic components: Surface Mount Device (SMD) Capacitor, through-hole Capacitor, diode, SMD Resistors, and through-hole Resistors. Subsequently, the collected images are first augmented using classical augmentation methods. The augmented dataset is then used to generate images via the DCGAN model, and finally, SRGAN is applied to perform super-resolution reconstruction on the generated images, thereby enhancing image resolution and features. For classification, the dataset was randomly split into 70% training, 15% validation, and 15% testing sets. Subsequently, pre-trained CNN models, including AlexNet, VGG19, ResNet18, ResNet101, and ResNet152, were employed for classification. Figure 1 shows the experimental workflow.
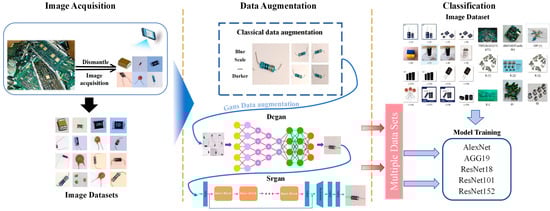
Figure 1.
Block diagram of experimental flow.
2.1. Image Dataset Construction
Images are acquired using a self-built image acquisition box, as illustrated in Figure 2. The box is constructed from white styrofoam to enhance light diffusion, ensuring uniform illumination of the electronic components. A 102 mm × 38 mm strip white light was used as the light source, with brightness adjustable according to indoor and outdoor environments. The color temperature is 5000–6600 k, and the surface luminance is about 40 klux. The image acquisition device was an iPhone 14 with a 12-megapixel camera, and its height could be freely adjusted according to the size of the components to capture clear, well-characterized images.
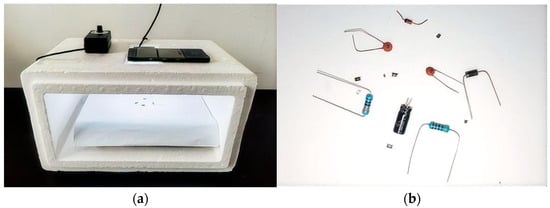
Figure 2.
Electronic component image acquisition system: (a) Homemade image acquisition box. (b) Various images of used electronic components.
2.2. Classical DA Methods
Deep learning models typically require extensive datasets to achieve optimal performance, where these datasets are ideally characterized by image diversity. Research has shown the critical importance of dataset scale and diversity for deep learning model performance, particularly in image recognition tasks [23].
DA is a widely employed technique in deep learning. It primarily involves various transformations applied to existing datasets to enhance diversity, effectively addressing scenarios where there are limited image data. This technique has been proven to significantly improve model performance and generalization capabilities [24]. Classical DA methods involve diverse operations, encompassing rotation, saturation adjustments, noise injection, horizontal and vertical flipping, scaling, translation, and cropping [25]. Rotation involves image reorientation by specific or random angles. Saturation adjustment modifies color purity within the HSV color space by altering image color intensity to enhance the model’s adaptability to color variations [26]. Noise injection simulates real-world complexities and improves model robustness by introducing random or structured disturbances, such as Gaussian or salt-and-pepper noise [27].
Although conventional DA techniques are widely employed and straightforward to implement, their application to electronic component images presents certain limitations. One such limitation is faced because the specifications of electronic components adhere to stringent standards. For instance, the resistance value of through-hole resistors is indicated by variations in the color bands, as illustrated in Figure 3. Additionally, the sizes of these resistors increase with higher power ratings. On the other hand, the resistance values of SMD resistors are marked using alphanumeric codes, and the labeling methods differ across various resistor specifications. These standards are defined by the International Electrotechnical Commission [28].
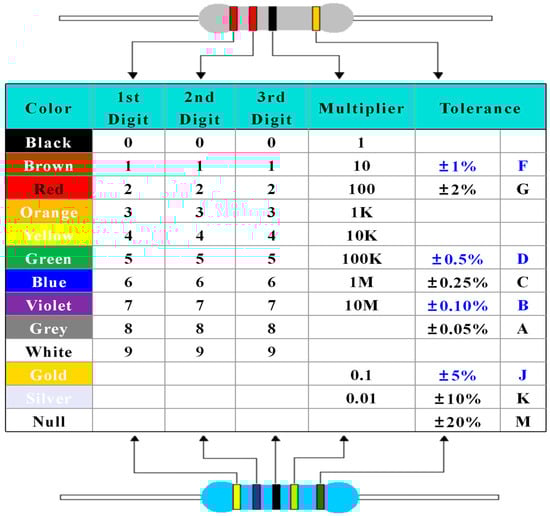
Figure 3.
Plug-in resistor resistance value comparison table.
In this study, we observe that the DA of electronic component images is constrained by specific factors. For example, image rotation at certain angles results in cropping due to the typically elongated shape of through-hole components. Moreover, as the resistance values of through-hole resistors are differentiated by the color of the bands, saturation adjustment methods could lead to significant color shifts impacting subsequent classification tasks. Therefore, certain DA techniques are not universally applicable to all electronic components.
2.3. Generative Adversarial Networks DA Methods
2.3.1. Generative Adversarial Networks
Generative adversarial networks represent a game-theoretic deep learning model architecture, comprising a generator and a discriminator that evolve through adversarial training [29], as illustrated in Figure 4. The objective of the generator is to maximize its ability to deceive the discriminator by producing realistic sample data from random noise, so that the discriminator is unable to distinguish between real and generated data. Conversely, the discriminator learns to differentiate between generated and real data, aiming to maximize its discrimination capability to accurately classify inputs as either real or generated [30]. During training, the generator generates data that progressively approximate the real data distribution with higher accuracy, while the discriminator simultaneously keeps on enhancing its recognition capabilities, culminating in generated data that are nearly indistinguishable from real data [31].
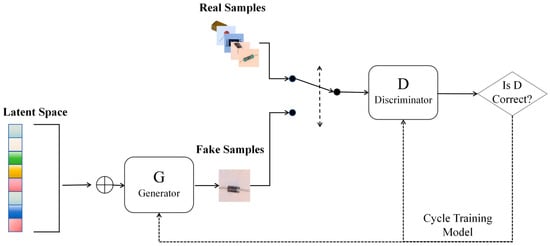
Figure 4.
The architecture of generative adversarial networks (GANs) includes a generator to generate fake images and a discriminator to distinguish them.
However, GANs frequently encounter issues such as mode collapse, where the generator repeatedly produces similar images, non-convergence where the generator and discriminator fail to improve each other, vanishing gradients where the generator’s gradients diminish and consequently hinder weight updates, and overfitting. These problems can result in a deterioration in the generation quality, instability in the training process, and ultimately, degradation of model performance. Improvements have been proposed recently, including the use of modified loss functions, more stable optimization algorithms, and regularization techniques to mitigate these issues [32,33].
2.3.2. Deep Convolutional Generative Adversarial Networks
Deep convolutional GANs are an advanced form of the GAN architecture, specifically designed for high-fidelity image generation. They enhance training stability by integrating deep convolutional networks in place of fully connected layers, along with Batch Normalization and ReLU activation functions. Furthermore, DCGAN uses optimized generator and discriminator architectures, which can mitigate mode collapse as they are better suited for handling high-dimensional image data. As Figure 5 shows, the generator of a DCGAN employs multi-layer transposed convolutions to progressively construct realistic images, while the discriminator utilizes convolutional layers to differentiate between generated and real images [34]. The DCGAN can efficiently extract image features by leveraging the local perception capabilities of convolutions, generating higher-resolution and more detailed images through layer-by-layer upsampling [35]. However, they may still encounter issues during training, such as vanishing gradients and mode collapse [36,37].
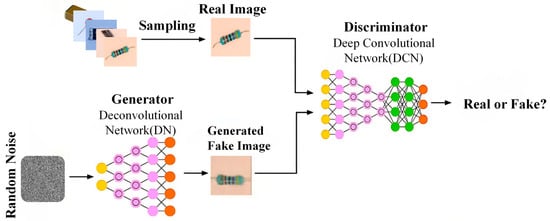
Figure 5.
Structure of deep convolutional generative adversarial networks (DCGANs): Generator and discriminator conduct adversarial training via CNNs.
2.3.3. Super Resolution Generative Adversarial Network
Despite the improved stability and image quality of DCGAN compared to standard GANs, it still has limited capability to generate detailed features and color characteristics of electronic components. Recent research has proposed SRGAN, which is emerging as a widely adopted solution to address these shortcomings [38]. The underlying principles of SRGAN are rooted in the GAN framework, leveraging perceptual and adversarial losses to significantly enhance the image super-resolution quality [39]. This approach has demonstrated efficacy in generating high-fidelity, detail-rich images. The SRGAN generator employs deep residual networks (Residual Blocks) to extract multi-level features from low-resolution images, utilizing upsampling layers to elevate these features to the target resolution [40]. Perceptual loss is a critical component of this process, which employs high-level feature representations from a VGG network to ensure that the generated high-resolution images approximate the real images at the pixel level while simultaneously aligning with human visual perception [41,42]. Furthermore, as shown in Figure 6, the discriminator uses adversarial training to optimize the generator’s performance, resulting in richer and more natural texture details in the generated images [43].
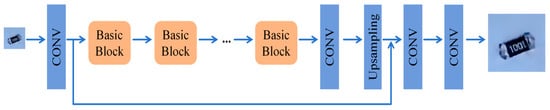
Figure 6.
Structure of super-resolution generative adversarial networks (SRGANs): Generator incorporates residual blocks and upsampling modules.
The core formulation of SRGAN primarily involves two components: perceptual loss and adversarial loss.
1. Perceptual Loss: The objective of perceptual loss is to align the high-level features of the generated images with those of the real images. This aim is achieved by extracting features using a pre-trained CNN, e.g., VGG, and computing the high-dimensional feature discrepancy between the generated and target images. Its mathematical expression is given as follows:
where denotes the feature maps extracted by the VGG, represents high-resolution images, represents the super-resolution images generated by the generator, and W and H represent the width and height of the feature maps, respectively.
2. Adversarial Loss: The adversarial loss employs the GAN framework that allows the generator and discriminator to train competitively, thereby producing more realistic high-resolution images. The expression for the adversarial loss is
where D denotes the discriminator, represents real high-resolution images, and represents images generated by the generator.
3. Final loss function: The total loss function of SRGAN is given as a weighted sum of perceptual loss, adversarial loss, and mean squared error (MSE) loss. It can be written as
where and represent the weights for the perceptual and adversarial losses, respectively. The above formulation ensures that the generator produces realistic high-resolution images by approximating real images at the pixel level as well as in terms of perceptual similarity and fine-grained details.
3. Experiments
3.1. Image Dataset Preparation
3.1.1. Material Preparation
Several WPCBs populated with SMD resistors, SMD capacitors, through-hole resistors, through-hole capacitors, and diodes are manually selected. Subsequently, a hot air gun is utilized to manually remove the required electronic components from the WPCBs. This paper focuses on three specifications of SMD resistors: 0603, 0805 and 1206. Different resistor models have different dimensions, as illustrated in Table 1. In the constructed image dataset, resistance values of 510 Ω, 470 Ω and 1 kΩ are included. Through-hole resistors with values of 330 Ω, 510 Ω, 10 kΩ and 4.7 kΩ, a power rating of 0.5 W, and a resistance tolerance of 1% are also selected. Selected through-hole capacitors include electrolytic and ceramic capacitors, while SMD capacitors of various sizes are used. Diodes include zener diodes and rectifier diodes. Figure 7 shows that the front faces of SMD resistors display their unique resistance value and characteristics, while their rear faces exhibit uniform characteristics. On the other hand, both faces of SMD capacitors exhibited identical characteristics. The creation of a dataset for through-hole components involved high complexity and diversity. This complexity arose from the varying degrees of bending caused by various factors in the component leads. Furthermore, the printed text on the component surfaces could be distorted or faded due to various reasons, which resulted in the enhancement of the dataset’s diversity.

Table 1.
Specifications of different resistor packages.
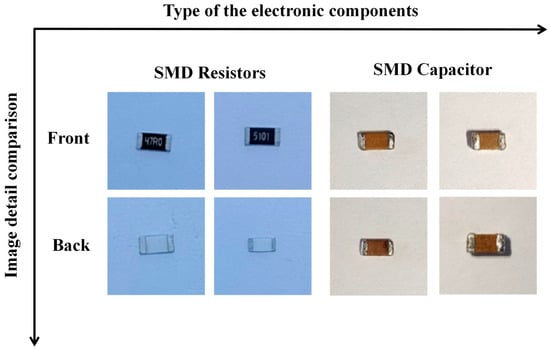
Figure 7.
SMD Resistor and SMD Capacitor front and back comparison.
3.1.2. Original Dataset Acquisition
In this experiment, the raw electronic component images (with 3072 × 4096 resolution) were gathered by Section 2.1 image acquisition device. A total of 1610 images were collected to form Dataset I. Table 2 shows the quantity distribution of components of various models in the original dataset. We observed during image acquisition that a warmer camera white balance setting enhanced the color contrast of the resistor color bands, closely approximating the actual object colors. However, insufficient ambient light, excessive brightness, or a cooler color temperature caused a color shift. An example of a color shift was the misrepresentation of brown as black. Furthermore, the ceramic capacitors exhibited potential silk-screen discontinuities due to material properties, while some SMD resistors displayed yellowing of the resistance silk-screen printing due to environmental factors. These distinct feature variations not only resulted in a more diverse dataset but also served as primary targets for feature extraction in our visual models.
Table 2.
Distribution of the number of various electronic components in the original dataset.
3.2. Data Augmentation
3.2.1. Classic DA Methods
Considering the requirements of electronic component feature extraction outlined in Section 2.2 and the limitations of classical data augmentation techniques, this experiment exclusively employs blurring, brightening, darkening, horizontal flipping, vertical flipping, 180-degree rotation, and scaling methods. These classical enhancements are used to augment the original dataset of 1610 images sevenfold, producing a total of 11,270 images. The two types of images are mixed to form a new dataset, namely Dataset II, with a total of 12,880 images. It is observed that blurring, brightening, and darkening methods modify the original images. Consequently, fundamental features on the electronic components, such as numerals and color band colors, become blurred, darker, or more vivid, which results in a more effective simulation of real-world conditions. Conversely, flipping and rotation do not alter the fundamental features of the original images, as illustrated in Figure 8. The aforementioned classical image augmentation techniques significantly increase the diversity of the dataset.
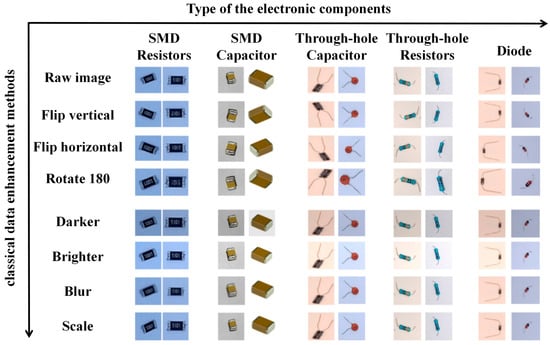
Figure 8.
Dataset generated by different classical data enhancement methods.
3.2.2. Generative Adversarial Networks DA
Subsequently, Dataset II is utilized to train a DCGAN model for image generation. Figure 9 shows the images of electronic components generated by the DCGAN, which appear partially blurred compared to the original images. However, they largely retain the shape, numerals, color, and line characteristics of the electronic components, which are crucial for subsequent classification tasks. We preserved the images with the highest color fidelity, clearest numerals, and closest resemblance to real-world components. Subsequently, the SRGAN applies super-resolution reconstruction to these images, enhancing their clarity and increasing their similarity with the original images. The electronic component images generated after these two steps are nearly identical to the real images and are subsequently used for classification tasks. The GAN-based augmentation method expands the dataset to twice its original size (3220 images), resulting in Dataset III, which includes the original 1610 images.
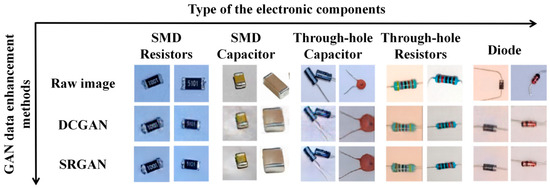
Figure 9.
Dataset generated by different GAN data enhancement methods.
3.2.3. Datasets and Configuration
In this study, we categorize the dataset into four distinct groups to investigate the impact of classical DA and GAN-based DA on the classification of e-waste component images using deep learning models. Table 3 shows the classification dataset configuration. Dataset I represents the original dataset, comprising 1610 images. Dataset II is the augmented dataset obtained using classical methods. It contains a total of 12,880 images and thus its size is eight times the size of the original dataset. Dataset III is the GAN-augmented dataset, whose size is twice the size of the original dataset, containing 3220 images. Dataset IV is a hybrid dataset that incorporates both classical and GAN augmentation techniques. It contains a total of 14,490 images, and its size is nine times the size of the original dataset.
Table 3.
Dataset settings, including Dataset I (original dataset), Dataset II (with classic DA), Dataset III (with GAN-based DA), and Dataset IV (with hybrid DA).
All models are implemented using the PyTorch (2.0.1) framework in Python 3.9 within the PyCharm 2023.2.3 integrated development environment and trained on a Windows 10 HP Omen 15 laptop. The hardware configuration of the laptop includes an Intel i5-8300H processor, an NVIDIA GeForce GTX1050Ti graphics card, and 24 GB of RAM.
3.2.4. Evaluation Metrics
We use three key metrics to evaluate the performance of models for imbalanced classification tasks: F1-score, AUC-PR (Area Under the Precision-Recall Curve), and mAP (mean Average Precision). These metrics are particularly suitable for imbalanced datasets—they effectively mitigate the bias of classical metrics (e.g., Accuracy) toward majority classes and accurately reflect the model’s ability to identify minority classes (which are often the core targets in imbalanced classification scenarios). The F1-score comprehensively balances Precision and Recall for each class, AUC-PR focuses on the trade-off between Precision and Recall across different thresholds (especially suitable for imbalanced data), and mAP summarizes the average precision across all classes to reflect overall stability. For multi-classification tasks, we compute these metrics for each class, with their definitions as follows:
TP (True Positives), FP (False Positives), and FN (False Negatives) represent correctly predicted positive samples, incorrectly predicted positive samples, and incorrectly predicted negative samples for class i, respectively; () denotes the Precision value corresponding to a given Recall level in the Precision-Recall curve; is the Average Precision for class i, and is the total number of classes.
4. Experimental Results and Analysis
4.1. Model Selection
The models employed for DA in this study are DCGAN and SRGAN. The former adopts an input image size of 256 × 256 pixels, a batch size of 8, and 400 epochs, the Adam optimizer, a learning rate of 0.0003, a LeakyReLU slope of 0.2, and a momentum of 0.5. After training, the model achieves excellent performance, with the loss minimized and tending to stabilize. The CNN models used for image classification are VGG19, AlexNet, ResNet18, ResNet101, and ResNet152.
Due to the imbalance of the dataset, we will perform independent hyperparameter tuning for each dataset during the training of CNN models. Furthermore, the SGD algorithm is used as the optimizer with the cross-entropy loss function.
In this experiment, five deep learning models of varying complexity and network depth, i.e., AlexNet, VGG19, ResNet18, ResNet101, and ResNet152, are selected to classify images of e-waste components. Subsequently, the classification accuracies of these five models are compared and analyzed. Table 4 provides the parameters of each model. AlexNet consists of five convolutional layers and three fully connected layers, with a total of 61 million parameters; VGG19 has 16 convolutional layers and three fully connected layers, with a total of 139 million parameters; ResNet18 has four convolutional blocks, a total of 17 convolutional layers, and a single fully connected layer, with approximately 11.67 million parameters; ResNet101 has 100 convolutional layers and one fully connected layer, with a total of 44.7 million parameters; and the ResNet152 model has a depth of 151 layers, with a total of approximately 60.1 million parameters. The advantages of GAN-based image enhancement techniques over classical DA techniques can be effectively evaluated by using these models with varying structures and numbers of parameters for classification.
Table 4.
Model architecture of VGG 19, AlexNet, ResNet 18, ResNet 101, and ResNet 152.
4.2. CNN Model Evaluation
This study conducts systematic experiments to evaluate the classification performance and optimization of AlexNet, VGG19, ResNet18, ResNet101, and ResNet152 models across four electronic component image datasets. The training and validation accuracies of each model are recorded, with the latter serving as the metric for classification performance, and the difference between both accuracies is used to assess model overfitting. As Figure 10 shows, ResNet18 achieves validation accuracies of 86%, 83.8%, 82%, and 72% on Dataset IV, Dataset III, Dataset II, and Dataset I, respectively. These results indicate that ResNet18 achieves the best performance on Dataset IV, surpassing the performance on Datasets III, II, and I by 2.4%, 4%, and 14%, respectively. The validation accuracy obtained on Dataset III exceeds that on Dataset II by 1.8%, as shown in Figure 10a. Similarly, ResNet101 also achieves optimal classification performance on Dataset IV, with a validation accuracy of 89.7%, outperforming the performance on Datasets III, II, and I by 5.4%, 5.1%, and 11.7%, respectively. The validation accuracy on Dataset III is 5.1% higher than that on Dataset II, as illustrated in Figure 10b. These findings suggest that both classical and GAN-based DA can effectively enhance the model classification accuracy, with the latter proving superior to classical methods. The ResNet152 model, with its deeper convolutional layers, achieves validation accuracies of 84%, 81.6%, 77.8%, and 66.7% on Datasets IV, III, II, and I, respectively, as shown in Figure 10c. These accuracies are lower than those achieved with ResNet18, indicating that ResNet18 may outperform ResNet152 on electronic component images with uniform backgrounds. Nonetheless, the highest validation accuracy is consistently achieved on Dataset IV, followed by Datasets III, II, and I. For ResNet18 and ResNet152, the training accuracies on Dataset I exceed the validation accuracies by 9.3% and 8.7%.
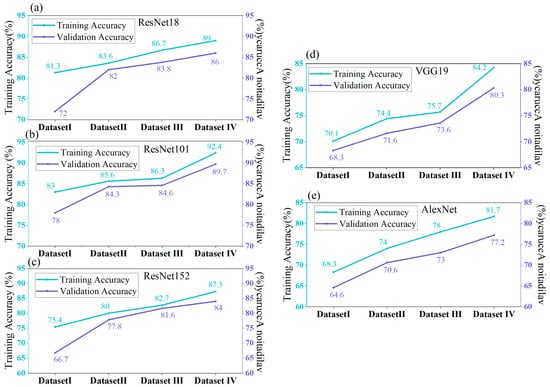
Figure 10.
Comparison of training accuracy versus validation accuracy across four electronic component image datasets for different models. (a) ResNet18 model. (b) ResNet101 model. (c) ResNet152 model. (d) VGG19 model. (e) AlexNet model.
The VGG19 model does not have very deep convolutional layers; however, it utilizes a large number of convolutional kernels at each layer, with the channel numbers increasing significantly as the network depth increases. However, VGG19’s classification accuracy is only slightly better than that of AlexNet, and its training time is significantly longer. The VGG19 model achieves the highest validation accuracy of 80.3% on Dataset IV, followed by 73.6% and 71.6% on Datasets III and II, respectively. The validation accuracy on Dataset I is the lowest at 68.3%, as shown in Figure 10d.
The AlexNet model struggles to capture finer features due to its limited number of convolutional layers, resulting in the lowest classification accuracy among the models. Nevertheless, it also achieves the highest validation accuracy of 77.2% on Dataset IV, with 73%, 70.6%, and 64.6% on Datasets III, II, and I, respectively, as depicted in Figure 10e.
Table 5 presents a comparison of the average metric scores of five models (AlexNet, VGG19, ResNet18, ResNet101, and ResNet152) across four datasets under the imbalanced data scenario. ResNet101 achieves the optimal comprehensive performance, with the highest values in average Accuracy, Area Under the Precision–Recall Curve (AUC-PR), average F1-score, and average Mean Average Precision (mAP), which are 84.1%, 0.983, 0.734, and 0.895, respectively. Compared with the other four models, ResNet 101 exhibits the best performance in imbalanced data classification tasks. Ranking second in performance is ResNet18 (comprising 17 convolutional layers), followed by ResNet152 in third place, and VGG19 in fourth. In contrast, AlexNet—with the fewest convolutional layers—obtains the lowest scores across all four metrics, indicating that it is insufficiently robust for the classification of imbalanced image data.
Table 5.
Performance comparison of different models on various datasets (imbalanced classification).
In conclusion, GAN-based DA methods outperform classical augmentation techniques in enhancing the classification performance, and a mixed augmentation strategy can further improve a classification model’s performance.
4.3. Data Augmentation Comparison
Figure 11 illustrates the validation accuracy of AlexNet, VGG19, ResNet18, ResNet101, and ResNet152 across different datasets. It can be observed that all five models exhibit superior validation accuracy on Dataset III compared to Dataset II, and achieve significantly improved performance compared to Dataset I. This performance indicates that both Datasets II and III effectively enhance the classification accuracy of visual models, with GAN-based augmentation providing a more pronounced improvement than classical methods.
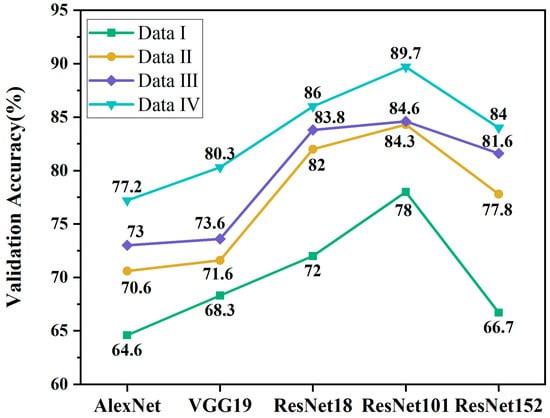
Figure 11.
Comparison of validation accuracy differences across various models (AlexNet, VGG19, ResNet18, ResNet101, and ResNet152) on four electronic component image datasets.
Furthermore, the validation accuracies of ResNet101, ResNet18, ResNet152, VGG19, and AlexNet on Dataset IV are the highest at 89.7%, 86%, 84%, 80.3%, and 77.2%, respectively. These results surpass those obtained on Dataset III by 5.1%, 2.2%, 2.4%, 6.7%, and 4.2%, respectively; on Dataset II by 5.4%, 4%, 6.2%, 8.7%, and 6.6%, respectively; and on Dataset I by 11.7%, 14%, 17.3%, 12%, and 12.6%, respectively, demonstrating a significant improvement in the classification accuracy.
The aforementioned findings suggest that both GAN-based and classical DA methods substantially improve the model classification accuracy. The hybrid DA delivers the most effective results, thereby offering considerable gains in model training.
4.4. Generated Image Quality Analysis
The performance of the combination of DCGAN and SRGAN in generating images of each electronic component was evaluated using Peak Signal-to-Noise Ratio (PSNR) and Structural Similarity Index Measure (SSIM) metrics. A higher PSNR value indicates better resolution and quality of the generated images, while an SSIM value closer to 1 means the generated images are more similar to the real images.
Table 6 presents the evaluation results of each electronic component in terms of PSNR and SSIM. The table demonstrates that our method can effectively construct electronic component images with distinct features.
Table 6.
Comparison of image metrics generated by GANs.
5. Conclusions
Manual sorting of waste electronic component images is gradually being replaced by deep learning technology, which benefits from its ability to automatically extract features in component classification. However, in practical applications, the analysis of electronic component images in recycling scenarios often faces the problems of scarce high-quality fine-grained datasets and difficulty in distinguishing features of fine-grained categories. Most of the current public datasets do not cover the fine-grained specifications of components, and the subtle differences between different components make it difficult for the model to accurately learn through conventional data, resulting in limited classification accuracy. To address this deficiency, this study proposes solutions from three aspects: dataset construction, data augmentation, and data classification, providing data support for the efficient classification and recycling of waste electronic components.
The experimental results obtained in this study indicated that the combination of classical data augmentation methods with GAN-based data augmentation methods effectively optimized data augmentation outcomes. During the image generation process, the DCGAN and SRGAN successfully retained key feature information of electronic component images, such as texture, color, contour, and edge details, ensuring the authenticity and diversity of the generated data. Additionally, experiments conducted on five distinct deep learning classification models demonstrated that data augmentation substantially boosted the classification performance of these models. Notably, the proposed GAN-based DA method outperformed classical DA methods, with the ResNet series models exhibiting particularly prominent performance improvements. Further analysis indicated that hybrid DA, namely the integration of GAN-generated images and classical DA, yielded the highest classification accuracy during model training, as this approach effectively enhanced the diversity of the image dataset. Finally, results based on the PSNR and SSIM evaluation of the quality of generated images showed that the GAN-generated images and real images exhibited similar feature distributions, ensuring the reliability of classification task results.
Although the method excels in generating images of electronic components with subtle variations, the research was only conducted in a laboratory environment and did not cover the complex scenarios of real-world electronic component recycling production lines. In the future, we will bridge the gap between laboratory and real production conditions by expanding real-scenario samples and optimizing complex-scenario DA strategies, while focusing on improving model classification accuracy and operational efficiency to integrate the models into sorting equipment, thereby further enhancing the practical application value, feasibility, and intelligence level of the proposed method.
Author Contributions
B.C.: Data curation, Validation, Writing—original draft; S.Z.: Project administration, Investigation, Writing—review and editing; S.L.: Software, Visualization; Y.W.: Conceptualization, Investigation, Methodology, Writing—original draft, Funding acquisition; J.G.: Methodology, Writing—review and editing, Funding acquisition; X.Z.: Resources, Validation; Y.G.: Conceptualization, Project administration; Q.X.: Data curation, Software; W.D.: Resources, Validation; W.G.: Resources. All authors have read and agreed to the published version of the manuscript.
Funding
This work was supported by the National Natural Science Foundation of China (NSFC 52070127, NSFC 52370142, NSFC 52270129). This work was also supported by the Science and Technology Development Fund of Pudong New Area (PKJ2024-N03), Shanghai Shuguang Program (23SG52) and Scientific Research Fund Project of Shanghai Polytechnic University (A10GY25G004-02).
Data Availability Statement
Data will be made available on request.
Conflicts of Interest
Author Weixing Gu was employed by the Julang Environmental Protect Co., Ltd. The remaining authors declare that the research was conducted in the absence of any commercial or financial relationships that could be construed as a potential conflict of interest.
References
- Magnier, L.; Mugge, R. Replaced too soon? An exploration of Western European consumers’ replacement of electronic products. Resour. Conserv. Recycl. 2022, 185, 106448. [Google Scholar] [CrossRef]
- Zhao, W.; Xu, J.; Fei, W.; Liu, Z.; He, W.; Li, G. The reuse of electronic components from waste printed circuit boards: A critical review. Resour. Conserv. Recycl. 2023, 2, 196–214. [Google Scholar] [CrossRef]
- Alkouh, A.; Keddar, K.A.; Alatefi, S. Remanufacturing of industrial electronics: A case study from the GCC region. Electronics 2023, 12, 1960. [Google Scholar] [CrossRef]
- Sharma, H.; Kumar, H. A computer vision-based system for real-time component identification from waste printed circuit boards. J. Environ. Manag. 2024, 351, 119779. [Google Scholar] [CrossRef]
- Ren, C.; Ji, H.; Liu, X.; Teng, J.; Xu, H. Visual sorting of express packages based on the multi-dimensional fusion method under complex logistics sorting. Entropy 2023, 25, 298. [Google Scholar] [CrossRef] [PubMed]
- Atik, S.O. Classification of electronic components based on a convolutional neural network. Electronics 2022, 11, 2347. [Google Scholar] [CrossRef]
- Sayeedi, M.F.A.; Osmani, A.M.I.M.; Rahman, T.; Deepti, J.F.; Rahman, R.; Islam, S. ElectroCom61: A multiclass dataset for detection of electronic components. Data Brief 2025, 59, 111331. [Google Scholar] [CrossRef] [PubMed]
- Mikołajczyk, A.; Grochowski, M. Data augmentation for improving deep learning in image classification problem. In Proceedings of the 2018 International Interdisciplinary PhD Workshop (IIPhDW), Białystok, Poland, 14–15 June 2018; IEEE: Piscataway, NJ, USA, 2018; pp. 117–122. [Google Scholar]
- Sarswat, P.K.; Singh, R.S.; Pathapati, S.V.S.H. Real time electronic-waste classification algorithms using the computer vision based on convolutional neural network (cnn): Enhanced environmental incentives. Resour. Conserv. Recycl. 2024, 207, 107651. [Google Scholar] [CrossRef]
- Dornaika, F.; Barrena, N. HSMix: Hard and soft mixing data augmentation for medical image segmentation. Inf. Fusion 2025, 115, 102741. [Google Scholar]
- Krizhevsky, A.; Sutskever, I.; Hinton, G.E. ImageNet classification with deep convolutional neural networks. In Advances in Neural Information Processing Systems; NIPS: San Diego, CA, USA, 2012; Volume 25, pp. 1097–1105. [Google Scholar]
- Zhang, Z.; Pan, X.; Jiang, S.; Zhao, P. High-quality face image generation based on generative adversarial networks. J. Vis. Commun. Image Represent. 2020, 71, 102719. [Google Scholar] [CrossRef]
- Ledig, C.; Theis, L.; Huszár, F.; Caballero, J.; Cunningham, A.; Acosta, A.; Aitken, A.; Tejani, A.; Totz, J.; Wang, Z.; et al. Photo-Realistic Single Image Super-Resolution Using a Generative Adversarial Network. In Proceedings of the 2017 IEEE Conference on Computer Vision and Pattern Recognition, Honolulu, HI, USA, 21–26 July 2017; pp. 105–114. [Google Scholar]
- Karras, T.; Laine, S.; Aittala, M.; Hellsten, J.; Lehtinen, J.; Aila, T. Analyzing and improving the image quality of StyleGAN. In Proceedings of the 2020 IEEE/CVF Conference on Computer Vision and Pattern Recognition, Seattle, WA, USA, 13–19 June 2020; pp. 8107–8115. [Google Scholar]
- Yang, S.; Zhang, Y.; Yan, J.; Liu, Y.; Xu, H.; Guo, Y. StyleGANEX: StyleGAN-based manipulation beyond cropped aligned faces. In Proceedings of the 2023 IEEE/CVF International Conference on Computer Vision, Paris, France, 2–3 October 2023; pp. 1987–1997. [Google Scholar]
- Zhang, Y.; Fang, K.; Xu, X.; Deng, L. Deep learning-based recovery and management after total hip arthroplasty. Curr. Probl. Surg. 2025, 69, 101796. [Google Scholar] [CrossRef]
- Song, Y.; Zhang, J.; Liu, Z.; Xu, Y.; Quan, S.; Sun, L.; Bi, J.; Wang, X. Deep learning for hyperspectral image classification: A comprehensive review and future predictions. Inf. Fusion 2025, 123, 103285. [Google Scholar] [CrossRef]
- Zhang, Y.; Wang, S.; Liu, H. Deep learning for image classification: A comprehensive review of techniques, applications, and future directions. Arch. Comput. Methods Eng. 2023, 30, 1645–1668. [Google Scholar]
- Sterkens, W.; Diaz-Romero, D.; Goedemé, T. Detection and recognition of batteries on X-Ray images of waste electrical and electronic equipment using deep learning. Resour. Conserv. Recycl. 2021, 168, 105246. [Google Scholar] [CrossRef]
- Foo, G.; Kara, S.; Pagnucco, M. Screw detection for disassembly of electronic waste using reasoning and re-training of a deep learning model. Procedia CIRP 2021, 98, 666–671. [Google Scholar] [CrossRef]
- Koyanaka, S.; Kobayashi, K. Individual model identification of waste digital devices by the combination of CNN-based image recognition and measured values of mass and 3D shape features. J. Mater. Cycles Waste Manag. 2024, 26, 2214–2225. [Google Scholar] [CrossRef]
- Lu, Y.; Yang, B.; Gao, Y.; Xu, Z. An automatic sorting system for electronic components detached from waste printed circuit boards. Waste Manag. 2022, 137, 1–8. [Google Scholar] [CrossRef]
- Deng, J.; Dong, W.; Socher, R.; Li, L.J.; Li, K.; Fei-Fei, L. ImageNet: A large-scale hierarchical image database. In Proceedings of the 2009 IEEE Conference on Computer Vision and Pattern Recognition, Miami, FL, USA, 20–25 June 2009; pp. 248–255. [Google Scholar]
- Shorten, C.; Khoshgoftaar, T.M. A survey on image data augmentation for deep learning. J. Big Data 2019, 6, 60. [Google Scholar] [CrossRef]
- Maharana, K.; Mondal, S.; Nemade, B. A review: Data pre-processing and data augmentation techniques. Glob. Transit. Proc. 2022, 3, 91–99. [Google Scholar] [CrossRef]
- Suto, J. Using data augmentation to improve the generalization capability of an object detector on remote-sensed insect trap images. Sensors 2024, 24, 4502. [Google Scholar] [CrossRef]
- Perez, L.; Wang, J. The effectiveness of data augmentation in image classification using deep learning. arXiv 2017, arXiv:1712.04621. [Google Scholar] [CrossRef]
- IEC 60062:2016; Marking Codes for Resistors and Capacitors. International Electrotechnical Commission: Geneva, Switzerland, 2016.
- Kalita, D.; Sharma, H.; Mirza, K.B. Continuous glucose, insulin and lifestyle data augmentation in artificial pancreas using adaptive generative and discriminative models. IEEE J. Biomed. Health Inform. 2024, 28, 4963–4974. [Google Scholar] [CrossRef] [PubMed]
- Goodfellow, I.; Pouget-Abadie, J.; Mirza, M.; Xu, B.; Warde-Farley, D.; Ozair, S.; Bengio, Y. Generative adversarial nets. In Advances in Neural Information Processing Systems; NIPS: San Diego, CA, USA, 2014; Volume 27, pp. 1097–1105. [Google Scholar]
- Karras, T.; Aila, T.; Laine, S.; Lehtinen, J. Progressive growing of GANs for improved quality, stability, and variation. In Proceedings of the International Conference on Learning Representations, Vancouver, VA, Canada, 30 April–3 May 2018. [Google Scholar]
- Miyato, T.; Maeda, S.; Koyama, M.; Ishii, S. Spectral normalization for generative adversarial networks. In Proceedings of the International Conference on Learning Representations, Vancouver, VA, Canada, 30 April–3 May 2018. [Google Scholar]
- Radford, A.; Metz, L.; Chintala, S. Unsupervised representation learning with deep convolutional generative adversarial networks. In Proceedings of the International Conference on Machine Learning, Lille, France, 6–11 July 2015. [Google Scholar]
- Fathallah, M.; Sakr, M.; Eletriby, S. Stabilizing and improving training of generative adversarial networks through identity blocks and modified loss function. IEEE Access 2023, 11, 43276–43285. [Google Scholar] [CrossRef]
- Zhang, L.; Zhao, L. High-quality face image generation using particle swarm optimization-based generative adversarial networks. Future Gener. Comput. Syst. 2021, 122, 98–104. [Google Scholar] [CrossRef]
- Kushwaha, V.; Nandi, G.C. Study of prevention of mode collapse in generative adversarial network (GAN). In Proceedings of the IEEE 4th Conference on Computing, Communication and Security, Mehsana, India, 9–13 November 2020. [Google Scholar]
- Roy, A.; Dasgupta, D. A novel conditional Wasserstein deep convolutional generative adversarial network. IEEE Trans. Artif. Intell. 2023, 1–13. [Google Scholar] [CrossRef]
- Liu, B.; Chen, J. A super resolution algorithm based on attention mechanism and SRGAN network. IEEE Access 2021, 9, 139138–139145. [Google Scholar] [CrossRef]
- Guo, S.; Zheng, X. Improved SRGAN for remote sensing image super-resolution across locations and sensors. Remote Sens. 2021, 12, 1263. [Google Scholar]
- Song, J.; Yi, H.; Xu, W.; Li, X.; Li, B.; Liu, Y. ESRGAN-DP: Enhanced super-resolution generative adversarial network with adaptive dual perceptual loss. Heliyon 2023, 9, e15134. [Google Scholar] [CrossRef]
- Zhao, L.; Chi, H.; Zhong, T.; Jia, Y. Perception-oriented generative adversarial network for retinal fundus image super-resolution. Comput. Biol. Med. 2024, 168, 107708. [Google Scholar] [CrossRef] [PubMed]
- Zhang, W.; Hou, Y.; Fan, W.; Yang, X.; Zhou, D. Perception-oriented single image super-resolution network with receptive field block. Neural Comput. Appl. 2022, 34, 14845–14858. [Google Scholar] [CrossRef]
- Rad, M.S.; Bozorgtabar, B.; Marti, U.V.; Basler, M.; Ekenel, H.K.; Thiran, J.P. Srobb: Targeted perceptual loss for single image super-resolution. In Proceedings of the 2019 IEEE/CVF International Conference on Computer Vision, Seoul, Republic of Korea, 27 October–2 November 2019; pp. 2710–2719. [Google Scholar]


Disclaimer/Publisher’s Note: The statements, opinions and data contained in all publications are solely those of the individual author(s) and contributor(s) and not of MDPI and/or the editor(s). MDPI and/or the editor(s) disclaim responsibility for any injury to people or property resulting from any ideas, methods, instructions or products referred to in the content. |
© 2025 by the authors. Licensee MDPI, Basel, Switzerland. This article is an open access article distributed under the terms and conditions of the Creative Commons Attribution (CC BY) license (https://creativecommons.org/licenses/by/4.0/).