Abstract
The study of mechanical response and crack propagation behavior of layered composite rock mass is helpful for the efficient extraction of geological energy and the safety and stability of underground space structures. The shale is a heterogeneous rock, which is often mixed with mudstone and sandstone. Studying the propagation law of cracks in layered composite rock mass can better serve underground engineering. In this paper, three different strength rock materials (coarse sandstone, red sandstone, and gray sandstone) were spliced together to make three-point bending specimens with prefabricated cracks in the middle, and three-point bending experiments under different loading rates were carried out. The digital image correlation method was used to visualize the strain distribution in the three-point bending experiment, and the difference in crack propagation in different layered composite rock masses was studied. The numerical simulation is established by the cohesive element, and the correctness of the simulation is verified by the displacement-load data. Then the crack propagation speed under different conditions is studied. The results show that there are differences and similarities in the crack propagation process in different strength gradient composite rock masses. When the crack propagates from strong to weak, the crack tip receives more complex tensile shear force, which facilitates the crack crossing the interface. As the loading speed increases, the earlier the prefabricated crack initiates, the shorter the time it stays at the joint surface. When the crack propagates from strong to weak, the crack propagation is more penetrating.
1. Introduction
Natural rock is a random porous medium containing a variety of defects and complex structures [1,2]. In-depth understanding of crack initiation and propagation behavior in complex geologic environments contributes to the efficient extraction of geoenergy and the long-term safety of underground projects [3,4,5]. Many scholars have created initial defects in natural rocks (e.g., sandstone, marble, etc.) by hydrodynamic cutting and wire cutting for laboratory mechanical testing. They have investigated the effects of the number of prefabricated cracks (e.g., single, double, and multiple cracks) and crack morphology (e.g., crack angle, length, spacing, and filler material) on the mechanical properties and deformation-cracking response of the rock samples by using uniaxial compression tests, conventional triaxial compression tests, Brazilian disk tests, and cyclic loading tests [6,7,8,9,10,11,12]. The results confirmed that the initial defects reduced the strength of rock samples, and the weakening degree was affected by the geometrical parameters of the fractures. The densification of fractured cores was investigated by injecting chemically reactive brines (e.g., magnesium chloride brine) into the fractured cores, and it was found that the cracking of the cores had a significant effect on the changes in their porosity and permeability [13]. However, the disordered and heterogeneous pore structure of natural rock adopted in these studies were not controllable, which means it was difficult to avoid the differences in the mechanical properties even if the intact rock samples were assumed to be homogeneous [14,15,16,17,18].
The fracture characteristics of layered composite rocks in shale gas extraction directly affect the efficiency of energy extraction [19,20,21]. Layered rock, which consists of two or more distinct rock layers, is frequently found in underground engineering and slope operations. Due to the different ages of formation, the mechanical properties of each layer are not the same. The most typical layered rock layer is a composite rock layer with a gradient in strength [22,23]. The mechanical properties of the composite rock layers vary, and the interlayers between the layers have an effect on the properties of the rock mass, with the lower bonding of the interlayers reducing the strength of the rock mass [24,25]. In underground energy extraction, more layered composite rock bodies are faced. Compared with intact rock bodies, the extension characteristics of cracks in layered composite rock bodies are affected by joint surfaces and lithological strength. Therefore, it is important to study the crack extension in layered composite rock bodies.
Finite element is one of the widely used numerical simulation methods, including four methods to simulate fracture [26,27,28,29], which are debond, collapse element, XFEM, and cohesive element. Where the debond technique is based on the linear elastic fracture mechanics (LEFM) theory, XFEM and cohesive element techniques rely on the damage theory, and collapse element technique depends on the two theories above. All four methods can be used to model brittle fracture, but only the last three can be used to model ductile fracture. It is also worth noting that these methods either require predefined cracks or can only propagate along specific paths when modeling rock fracture. Therefore, in layered composite rock bodies, the above methods cannot simulate the random germination and extension of cracks [30,31,32]. For these reasons, we propose a secondary development scheme for finite elements, i.e., globally embedding zero-thickness cohesive elements and setting up the properties of nodal surfaces and cells to enable the generation and extension of stochastic cracks in layered composite rock bodies.
In this paper, the crack propagation characteristics of strength gradient composite rock mass are experimentally and numerically simulated. Composite rock mass specimens with gradient strength were made of three different sandstones and used for three-point bending experiments. The digital image correlation method is used to visualize the full-field strain distribution during the crack propagation process, and the influence of joint surface and rock strength on the failure mode is studied when the prefabricated crack propagates from strong to weak or from weak to strong. The cohesive element is used to model and verify the three-point bending simulation, and the crack propagation speed under different conditions is studied.
2. Materials and Methods
2.1. Experimental System
The experimental system used in this paper is shown in Figure 1, using the DIC system developed by Correlated Solution (CSI) company in the United States, including a CCD (Prosilica GT3400) industrial camera. The image resolution of the camera is 3384 pixels × 2704 pixels. The 8-bit grayscale image uses an 80 mm fixed-focus lens and a 25 mm telescopic focusing cylinder to adjust the focal length. The image correlation analysis software is VIC-2D. The subset size is 17 pixel × 17 pixel, and the stepsize is 8. The illumination source uses two vertical Bescor LED white lights with adjustable brightness of 500 W to achieve uniform illumination on the surface of the specimen. The loading device uses a universal testing machine used in conventional mechanical testing to uniformly load the specimen.
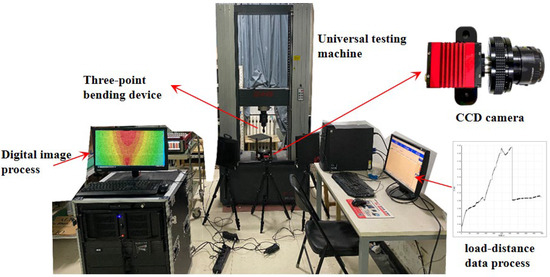
Figure 1.
Three-point bending static loading experimental system.
2.2. Specimen Preparation and Scheme Design
The specimen is a strength gradient composite rock mass composed of coarse sandstone (C), red sandstone (R), and gray sandstone (G) in order, which is cut into three-point bending standard specimens, as shown in Figure 2, and the physical properties of each sandstone are shown in Table 1. The overall size of the specimen is 200 mm × 51 mm × 7 mm, the height of each layer of sandstone is 17 mm, and a 5 mm long penetrating crack is prefabricated in the middle and lower part of the specimen. To ensure uniform bonding thickness and strength across all specimens, the three rock types were first processed into 17 mm thick plates. These plates were then bonded together using epoxy resin adhesive, with weight applied to expel air bubbles from the adhesive. After curing, the bonded assembly was uniformly cut into specimens measuring 200 mm × 17 mm × 7 mm. Once cured, the epoxy resin exhibits good strength and brittleness, closely resembling the fracture surfaces of the rock. Among the three kinds of sandstone, the strength of coarse sandstone is the lowest, the strength of gray sandstone is the highest, and the strength of red sandstone is in the middle. When the prefabricated crack is located on the side of the coarse sandstone, the crack will expand from the weak medium to the strong medium (C-R-G). When the prefabricated crack is located on the side of the gray sandstone, the crack will expand from the strong medium to the weak medium (G-R-C). In order to study the influence of loading rate on crack propagation characteristics, three loading rates are designed in this paper, which are 0.1 mm/min, 0.2 mm/min, and 0.3 mm/min.
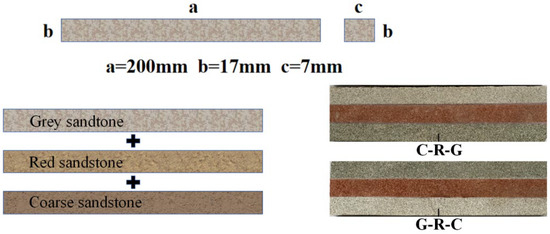
Figure 2.
Gradient composite sandstone specimens.

Table 1.
Mechanical properties of materials.
3. Results
3.1. Fracture Morphology Analysis of Gradient Composite Rock Mass
Figure 3 shows the failure modes of two gradient composite rock masses. It can be seen from the figure that there is a certain angle between the initial stage of crack propagation and the prefabricated crack. After passing through the joint surface, there is also an “inflection point” in the propagation path. There are two main aspects that affect the propagation angle of the initial crack. The first is that the tip of the prefabricated crack is not an ideal symmetrical ‘sharp angle’, and the stress concentration in the local area will be deviated. The second is that the specimens are made of rock, a naturally heterogeneous material. Although it appears to be uniform on the surface, considering the distribution of internal components, there is randomness in the meso-structure.
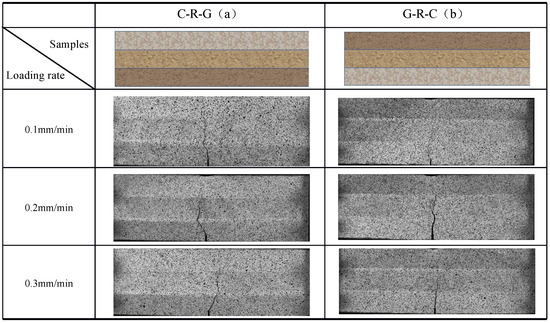
Figure 3.
Failure mode of gradient composite sandstone.
On the whole, there is only one crack in the specimen after failure. The cracks begin to expand from the prefabricated defects. At the end of the experiment, the cracks basically run through the whole specimen. When the crack propagates from weak to strong, with the increase in loading speed, the final fracture morphology of the crack is not much different, and there is a certain angle in the initial stage of crack propagation and when passing through the joint surface. When the crack propagates from strong to weak, the crack propagation path becomes more straight with the increase in loading speed.
3.2. Crack Propagation Analysis of Gradient Composite Sandstone
The displacement load curve in the experiment is extracted and compared. Figure 4 shows the displacement load curve when the crack propagates from weak to strong. The crack propagation is divided into four stages: (I) Compaction stage: Under the action of the indenter, the rock specimen becomes denser, and the displacement increases rapidly and the load increases slowly on the curve. (II) Elastic deformation stage: There is a significant linear relationship between the loading displacement and the load, and the rock undergoes elastic deformation. (III) Elastic–plastic stage: when the speed is low, there will be an elastic–plastic stage, and there is a nonlinear relationship between the loading displacement and the load. With the increase in the loading speed, the elastic–plastic stage becomes smaller and smaller, and the material gradually develops in the direction of brittleness. (IV) Rupture unloading stage: The load on the curve shows a “cliff-like” decrease, and the material is destroyed, but there is still a certain amount of load. This is because there is a joint surface in the composite rock mass, which leads to the initial expansion of the crack arrest, and the structure also has a certain degree of bearing capacity.
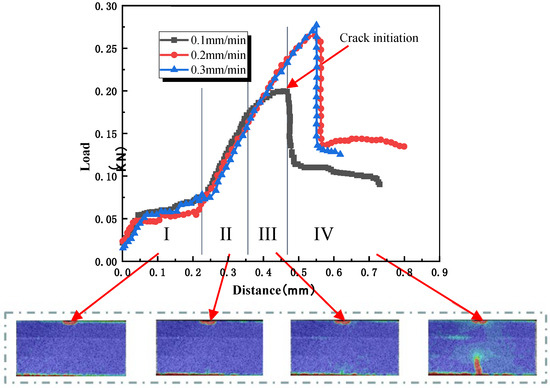
Figure 4.
C-R-G rock mass displacement load curve.
Figure 5 shows the displacement load curve when the crack propagates from strong to weak. The process of crack propagation can also be divided into four stages: (I) Compaction stage: Consistent with the first stage of the forward gradient material, which belongs to the compaction process of the specimen. (II) Elastic deformation stage: Load and displacement show a linear growth relationship. (III) Fracture unloading stage: The energy stored in the elastic stage exceeds the fracture limit of the material, causing the prefabricated crack to begin to expand, and the curve is expressed as a sharp drop in load. (IV) Under the action of residual load, the initial expansion crack does not extend stably, but continues to expand after a short stay in the transition zone.
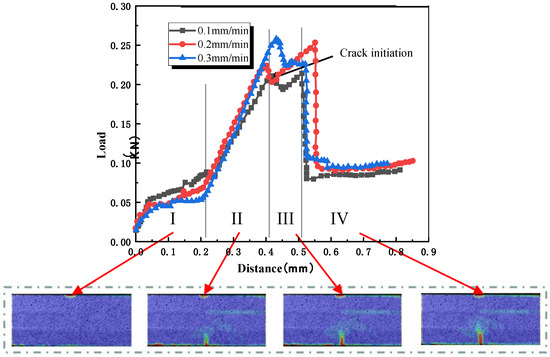
Figure 5.
G-R-C rock mass displacement load curve.
In the strength gradient composite rock mass, the crack propagation characteristics of different paths are similar and different. The similarity is reflected in the compaction stage, elastic deformation stage, and fracture loading stage. The difference is reflected in two aspects: (1) When the crack expands from strong to weak, it is basically elastic during the loading process. When the crack expands from weak to strong, the elastic–plastic stage will appear in the loading process, especially when the loading speed is low. (2) When the crack propagates from strong to weak, there are two obvious peaks in the displacement load curve, indicating that the crack propagation process is not coherent.
3.3. Fracture Strain Evolution Law of Gradient Composite Sandstone
Taking the loading speed of 0.2 mm/min as an example (Figure 6 and Figure 7), when the crack expands from weak to strong (C-R-G), as the load continues to increase, the force continues to transfer downward, and the displacement field cloud map gradually distributes symmetrically in the region. When the crack propagates to the first joint surface at 37.5 s, the displacement field at the crack tip and the joint surface shows discontinuity. In the strain field cloud diagram, the white arrow represents the direction of the corresponding vector. Before 32.5 s, the maximum principal strain direction near the crack tip is in the horizontal direction, and the second principal strain direction is in the vertical direction. As the crack begins to deflect, the directions of the first and second principal strains also change. When t = 37.5 s, the crack extends to the first joint plane, and when t = 42.5 s, the crack extends to the second section plane. The minimum principal stress contour map indicates that forces still exist between rock strata, but these forces are relatively minor.
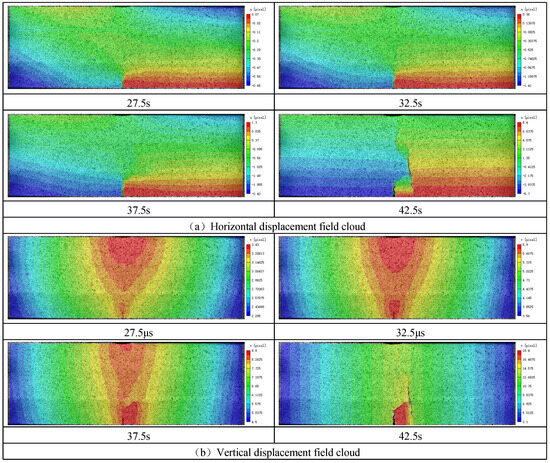
Figure 6.
C-G-R rock mass displacement field cloud.
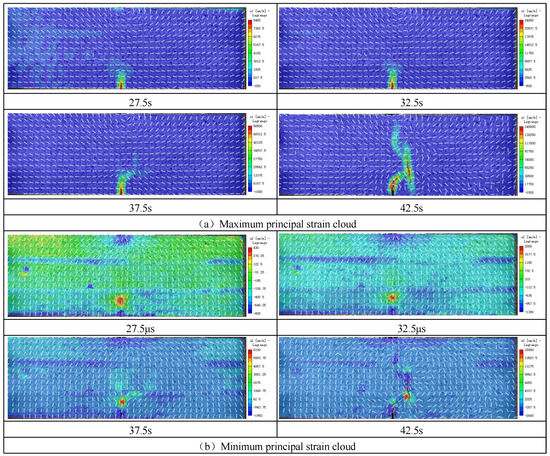
Figure 7.
The main strain cloud of the C-G-R specimen.
Taking the loading speed of 0.2 mm/min as an example, when the crack propagates from strong to weak (G-R-C), the displacement field and strain field in the strength gradient composite rock mass are shown in Figure 8 and Figure 9. The displacement fields in the horizontal and vertical directions of the crack are basically symmetrically distributed along the loading direction, and the crack propagates upward along the prefabricated crack. Before the crack propagation, the crack tip has shown a more obvious phenomenon of tensile strain concentration. With the crack initiation and propagation, a more concentrated strain concentration zone is formed on both sides of the crack.
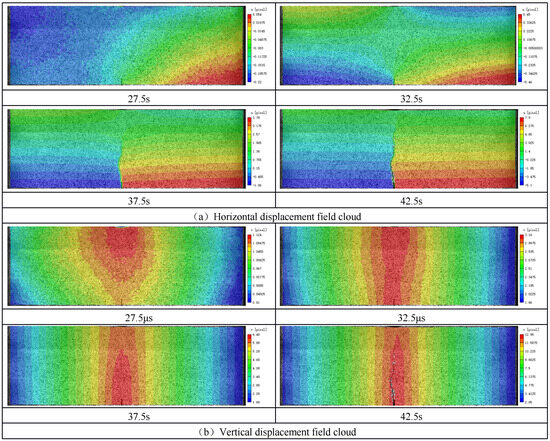
Figure 8.
G-R-C rock mass displacement field cloud diagram.
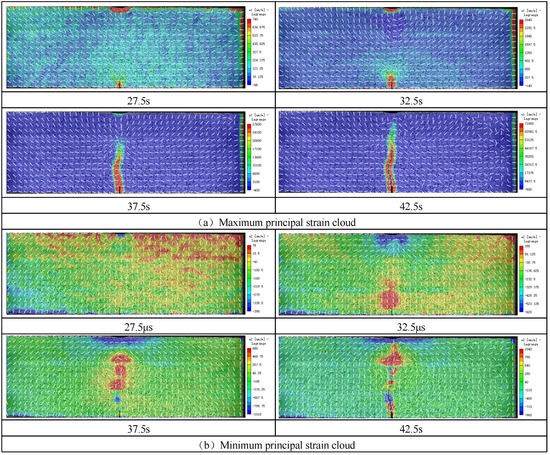
Figure 9.
G-R-C rock mass strain field cloud diagram.
In the strain cloud, the white arrow represents the direction of the corresponding vector. There is only slight stress concentration on the joint surface, indicating that the continuity between different materials is good. At the initial stage of crack initiation, the horizontal displacement near the crack tip increases, and the corresponding maximum principal strain concentration zone is formed at the crack tip, which is perpendicular to the direction of the crack surface. At the same time, the second principal strain is also concentrated at the crack tip, indicating that the crack is affected by the heterogeneity of the rock mass. During the propagation process, the crack is subjected to the combined action of the tensile–shear composite stress field, resulting in the propagation direction of the initial crack being not completely along the direction of the prefabricated crack surface. When the crack propagates to the joint surface, it is also affected by the tensile–shear composite stress field, resulting in a change in the propagation angle of the crack at the joint surface.
As shown in Figure 10, we compare the strain of the contact joint surface of the extended crack in the two cases. In the C-R-G specimen, the second principal strain in the crack tip region is smaller; in the G-R-C specimen, the second principal strain at the crack tip is larger, indicating that when the crack propagates from strong to weak, the crack is subjected to a more complex tensile–shear composite force when crossing the joint surface, resulting in the crack more easily crossing the joint surface, and the crack staying shorter on the joint surface.
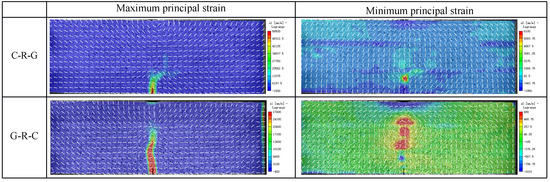
Figure 10.
Comparison of maximum principal strain and second principal strain.
3.4. Fracture Toughness Analysis
Due to the randomness and complexity of rock materials, many scholars at home and abroad have used a variety of methods to measure the fracture toughness of rock. In order to provide a standard method for measuring the fracture toughness of rock, the American Society for Materials and Measurements (ASTM) proposed a three-point bending method for unilateral prefabricated cracks in 1994, as shown in Figure 11, and the geometric size of the specimen and the related calculation process are given. This method has been widely recognized by rock engineering scholars. The calculation method of rock fracture toughness is shown in Formula (1); is the geometric parameter of time, which is related to the height of the specimen and the length of the prefabricated crack in Formula (2).
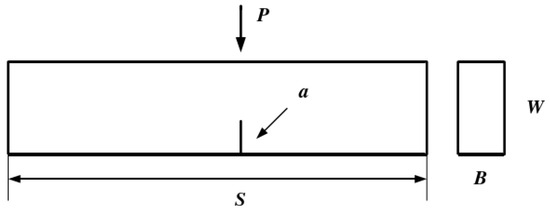
Figure 11.
Specimen size diagram.
The calculated results are shown in Figure 12. It can be seen from the law reflected in the figure that the fracture toughness of the material increases with the increase in the loading rate. When the loading speed is 0.1 mm/min, the fracture toughness of the two gradient rock masses is basically the same. With the increase in the loading speed, the fracture toughness of the forward gradient is gradually higher than that of the reverse gradient.
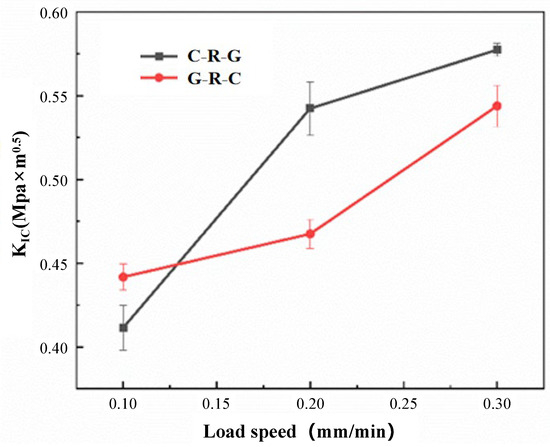
Figure 12.
Fracture toughness of gradient composite rock mass.
4. Numerical Simulation
Due to the mutability of crack propagation during the experiment, it is difficult to find the location of the crack tip in the photo. In order to capture the propagation path of the crack, the numerical simulation of the experiment under the same conditions is carried out. The location of the crack tip is determined by the failure of the cohesive element, and then the propagation speed of the crack is calculated.
4.1. Parameter Design
The 2D three-point bending joint model was constructed using ABAQUS finite element software as shown in the figure. The model uses a plane strain model, as shown in Figure 13. Firstly, a rectangular model with two gradient directions is established in the Part module. The size is 200 mm × 51 mm, and the height of each layer of sandstone is 17 mm. In addition, three circular discrete rigid bodies are established as the indenter and fulcrum in the three-point bending experiment. A 5 mm prefabricated crack is cut in the middle of the bottom of each gradient rock specimen. Then the mesh is divided. In order to truly reflect the randomness of the sandstone microstructure, the rock of the model is divided into triangular meshes using the advanced algorithm. The approximate global size of the mesh is 0.5 mm, and then assigned to different lithology groups. The cohesive element with zero thickness is embedded between the solid elements. The mechanical properties of the cohesive element in the bedding plane are weaker than those in the rock. Pre-damaged cohesive elements are placed at the pre-cracked locations, with the cohesive strength of these elements set to zero.
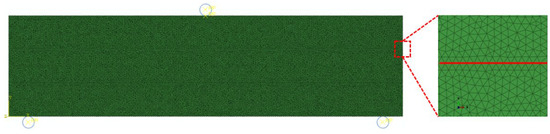
Figure 13.
Three-point bending layered gradient sandstone model.
The cylindrical fulcrum and indenter are set as surface-to-surface contact with the upper and lower surfaces of the specimen, and the indenter reference point is coupled with the upper surface area of the rock.
In numerical simulations employing a linear elastic model, cohesive elements must satisfy linear elastic stress–strain relationships prior to damage occurrence.
The subscript n denotes the normal direction; subscripts s and t denote the two tangential directions; K represents the stiffness of viscous elements. For uncoupled constitutive relationships, only Knn, Kss, and Ktt need to be defined. This paper employs a damage evolution criterion based on effective displacement, defining the damage variable D as Formula (4).
In the equation, represents the effective displacement at failure, defined as 0.05 in this model; denotes the effective displacement during initial damage evolution; and indicates the maximum effective displacement during loading.
The parameters in the numerical model are shown in Table 2. The total number of units in the model is 63,310, including 31,450 rock solid units and 31,860 cohesive units. The analysis step type is selected as static universal, the total time length is set to 2 s, and the minimum time step increment is 2 × 10⁻⁹. Then set the load, according to the displacement loading, by changing the amplitude curve to adjust the loading speed of the indenter to 0.1 mm/min, 0.2 mm/min, and 0.3 mm/min.
Table 2.
Cohesive unit parameters.
4.2. Numerical Simulation Results Analysis
A comparative analysis was conducted between the numerical simulation results (Figure 14a) and experimental results (Figure 14b) for the positive gradient specimen. The displacement–pressure diagram reveals that, since the numerical simulation employs a homogeneous elastic medium, no consolidation phase occurs during the initial stage. Both methods exhibit excellent agreement in the pressure rise phase and peak pressure point. However, gradual divergence emerges post-peak, attributed to the use of a non-rigid testing machine in the experiment, which prevents capturing the complete post-peak curve. Overall, the numerical simulation results are considered to effectively characterize the material’s deformation process under loading.
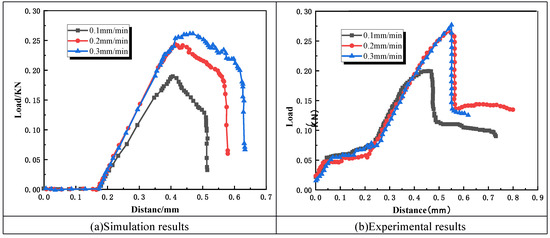
Figure 14.
Comparison of simulation results.
As the load approaches the peak value, a crack tip failure zone begins to form. Once the peak load is reached, the crack initiates and propagates. The fracture process of the crack can be observed in the post-peak fracture stage. Therefore, the horizontal stress nephograms at three time points of peak load stage, post-peak 80% stage, and post-peak residual stage are extracted, respectively, as shown in Figure 15, and the stress changes in the process of crack initiation, propagation, and penetration are analyzed. In the peak load stage, the prefabricated crack tip has a strong stress concentration phenomenon. At this time, the crack has not yet expanded, and a large amount of energy is concentrated at the tip position. In the post-peak 80% stage, because the crack has expanded, the energy at the crack tip is released, the stress concentration phenomenon is no longer obvious, and the crack propagation path at the first joint surface stops. The cracks in the post-peak residual stage basically run through the entire specimen, and the joint surface in the middle of the specimen cracks due to uncoordinated deformation. Due to the different rock strength gradients during the crack penetration process, the bedding fracture sequence is also inconsistent.
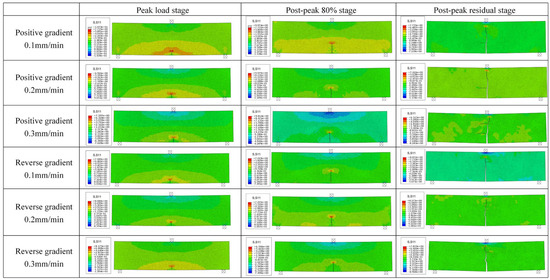
Figure 15.
Gradient composite rock mass strain cloud diagram.
When the crack extends to the joint surface, the propagation speed is paused. When the loading speed is faster, the crack in the joint surface retention time is shorter. Whether it is a positive gradient or a reverse gradient, two kinds of joint surfaces are involved, which are gray sandstone–red sandstone joint surface and coarse sandstone–red sandstone joint surface. By comparison, it is found that when the strength of the media on both sides is low, the joint surface is more prone to cracking, that is, whether it is the C-R-G test piece or G-R-C test piece, the joint structure of coarse sandstone and red sandstone is more unstable.
The crack propagation lengths under different conditions were statistically analyzed, as shown in Figure 16. It can be seen that the higher the loading speed, the earlier the crack initiation time of the prefabricated crack, the shorter the stay time on the joint surface, and the greater the propagation speed of the interlayer crack. At the same loading speed, the crack initiation time in the G-R-C specimen is later, but the crack propagation speed is faster, which means that the crack is more penetrating when it expands from strong to weak.
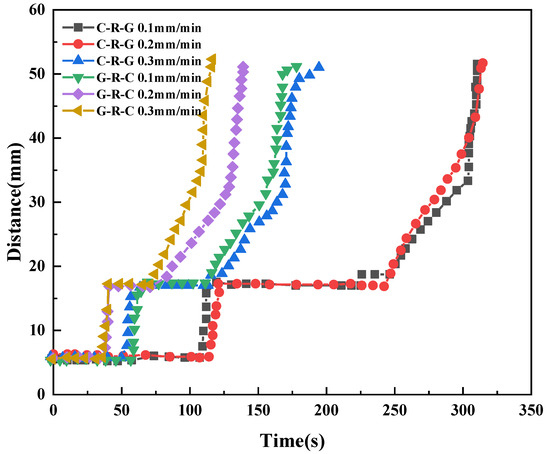
Figure 16.
Statistics of crack propagation length in gradient composite rock mass.
5. Conclusions
In this paper, the crack propagation characteristics of strength gradient composite rock mass under low loading rate are studied. The three-point bending loading experiments of gradient composite rock mass in different directions are carried out, respectively. The fracture toughness and crack propagation speed are compared and analyzed. The following conclusions are obtained:
(1) The propagation characteristics of cracks from strong to weak or from weak to strong are similar and different. The similarity is reflected in the compaction stage, elastic deformation stage, and fracture loading stage. The difference is reflected in two aspects: first, under the condition of low-speed loading, the crack propagation from weak to strong exhibits an elastoplastic stage; when the crack expands from strong to weak, the displacement load curve will have multiple peaks, indicating that the crack propagation process is not continuous.
(2) When the crack propagates from weak to strong, the second principal strain at the crack tip region is smaller. When the crack propagates from strong to weak, the second principal strain at the crack tip is larger, indicating that in the process of crack propagation from strong to weak, when the crack passes through the joint surface, it is subjected to more complex tensile–shear composite force, which makes the crack more likely to pass through the joint surface, and the shorter the crack stays on the joint surface.
(3) By comparing the crack propagation speed, it can be seen that the higher the loading speed, the earlier the crack initiation time of the prefabricated crack, the shorter the stay time on the joint surface, and the greater the propagation speed of the interlayer crack. When the crack propagates from strong to weak at the same loading speed, crack initiation occurs later, but the subsequent propagation speed is higher.
Author Contributions
Conceptualization, Y.Z. and X.Z.; methodology, W.R. and P.G.; software, B.W. and B.Z.; validation, Y.C.; formal analysis, Y.Z.; resources, X.Z.; data curation, Y.C.; writing—original draft preparation, Y.Z.; writing—review and editing, Y.Z. All authors have read and agreed to the published version of the manuscript.
Funding
The authors gratefully acknowledge the support of the National Natural Science Foundation of China (51934001, 52004290, 52208384), the China Postdoctoral Science Foundation (2025T038ZGMK, 2025T001ZGMK).
Data Availability Statement
The original contributions presented in this study are included in the article. Further inquiries can be directed to the corresponding author.
Conflicts of Interest
Authors Xiufeng Zhang, Wentao Ren, Peng Gu, Yang Chen were employed by the company Shandong Energy Group Co., Ltd. The remaining authors declare that the research was conducted in the absence of any commercial or financial relationships that could be construed as a potential conflict of interest. The company had no role in the design of the study; in the collection, analyses, or interpretation of data; in the writing of the manuscript, or in the decision to publish the results.
References
- Yang, C.; Liu, J. Petroleum rock mechanics: An area worthy of focus in geo-energy research. Adv. Geo-Energy Res. 2021, 5, 351–352. [Google Scholar] [CrossRef]
- Ishola, O.; Alexander, A.; Vilcaez, J. Statistical and neural network analysis of the relationship between the stochastic nature of pore connectivity and flow properties of heterogeneous rocks. J. Nat. Gas Sci. Eng. 2022, 105, 104719. [Google Scholar] [CrossRef]
- Pardoen, B.; Bésuelle, P.; Dal Pont, S.; Cosenza, P.; Desrues, J. Accounting for small-scale heterogeneity and variability of clay rock in homogenised numerical micromechanical response and microcracking. Rock Mech. Rock Eng. 2020, 53, 2727–2746. [Google Scholar] [CrossRef]
- He, L.; Xiao, H.; Cui, Y.; Liu, S.; Chen, J. Review of visualisation methods of studying the seepage mechanism in fractured rocks. Geomech. Geophys. Geo-Energy Geo-Resour. 2021, 7, 102. [Google Scholar] [CrossRef]
- Song, R.; Liu, J.; Yang, C.; Sun, S. Study on the multiphase heat and mass transfer mechanism in the dissociation of methane hydrate in reconstructed real-shape porous sediments. Energy 2022, 254, 124421. [Google Scholar] [CrossRef]
- Haeri, H.; Shahriar, K.; Marji, M.F.; Moarefvand, P. On the strength and crack propagation process of the pre-cracked rocklike specimens under uniaxial compression. Strength Mater. 2014, 46, 140–152. [Google Scholar] [CrossRef]
- Yang, S. Strength Failure and Crack Evolution Behavior of Rock Materials Containing Pre-Existing Fissures; Science Press: Beijing, China, 2015. [Google Scholar]
- Zhuang, X.; Zhou, S. An experimental and numerical study on the influence of filling materials on double-crack propagation. Rock Mech. Rock Eng. 2020, 53, 5571–5591. [Google Scholar] [CrossRef]
- Jacobsson, L.; Ivars, D.M.; Kasani, H.A.; Johansson, F.; Lam, T. Experimental program on mechanical properties of large rock fractures. IOP Conf. Ser. Earth Environ. Sci. 2021, 833, 012015. [Google Scholar] [CrossRef]
- Liang, W.; Zhao, Y.; Liu, J.; Elsworth, D.; Feng, Z.; Cai, J. Advances in in-situ modified mining by fluidization and in unconventional geomechanics. Adv. Geo-Energy Res. 2021, 5, 1–4. [Google Scholar] [CrossRef]
- Rashid, F.; Hussein, D.; Lorinczi, P.; Glover, P. The effect of fracturing on permeability in carbonate reservoir rocks. Mar. Pet. Geol. 2023, 152, 106240. [Google Scholar] [CrossRef]
- Khoshmagham, A.; Alaee, N.H.; Shirinabadi, R.; Tabrizi, A.H.B.; Gholinejad, M.; Kianoush, P. Investigating the Time-Dependent Behavior of Intact Rocks and Fractured Rocks Using Unconfined Relaxation Testing in Underground Coal Mines. Geotech. Geol. Eng. 2024, 42, 6889–6922. [Google Scholar] [CrossRef]
- Kallesten, E.; Andersen, P.Ø.; Berawala, D.S.; Korsnes, R.I.; Madland, M.V.; Omdal, E.; Zimmermann, U. Modeling of permeability and strain evolution in chemical creep compaction experiments with fractured and unfractured chalk cores conducted at reservoir conditions. SPE J. 2020, 25, 2710–2728. [Google Scholar] [CrossRef]
- Lan, H.; Martin, C.D.; Hu, B. Effect of heterogeneity of brittle rock on micromechanical extensile behavior during compression loading. J. Geophys. Res. Solid Earth 2010, 115, B01202. [Google Scholar] [CrossRef]
- Sousa, L.M. The influence of the characteristics of quartz and mineral deterioration on the strength of granitic dimensional stones. Environ. Earth Sci. 2013, 69, 1333–1346. [Google Scholar] [CrossRef]
- Ghasemi, S.; Khamehchiyan, M.; Taheri, A.; Nikudel, M.R.; Zalooli, A. Crack evolution in damage stress thresholds in different minerals of granite rock. Rock Mech. Rock Eng. 2020, 53, 1163–1178. [Google Scholar] [CrossRef]
- Xu, Y.; Yao, W.; Xia, K. Numerical study on tensile failures of heterogeneous rocks. J. Rock Mech. Geotech. Eng. 2020, 12, 50–58. [Google Scholar] [CrossRef]
- Abdelaziz, A.; Ha, J.; Li, M.; Magsipoc, E.; Sun, L.; Grasselli, G. Understanding hydraulic fracture mechanisms: From the laboratory to numerical modelling. Adv. Geo-Energy Res. 2023, 7, 66–68. [Google Scholar] [CrossRef]
- Zhu, H.; Ju, Y.; Qi, Y.; Huang, C.; Zhang, L. Impact of tectonism on pore type and pore structure evolution in organic-rich shale: Implications for gas storage and migration pathways in naturally deformed rocks. Fuel 2018, 228, 272–289. [Google Scholar] [CrossRef]
- Zhu, H.; Ju, Y.; Huang, C.; Han, K.; Qi, Y.; Shi, M.; Yu, K.; Feng, H.; Li, W.; Ju, L.; et al. Pore structure variations across structural deformation of silurian longmaxi shale: An example from the chuandong thrust-fold belt. Fuel 2019, 241, 914–932. [Google Scholar] [CrossRef]
- Zhu, H.; Ju, Y.; Huang, C.; Chen, F.; Chen, B.; Yu, K. Microcosmic gas adsorption mechanism on clay-organic nanocomposites in a marine shale. Energy 2020, 197, 117256. [Google Scholar] [CrossRef]
- Liu, Q.S.; Shi, K.; Huang, X. Feasibility of application of TBM in construction of deep coal mine and its key scientific problems. J. Min. Saf. Eng. 2013, 30, 633–641. [Google Scholar]
- Cheng, J.L.; Yang, S.Q.; Du, L.K.; Wen, S.; Zhang, J.Y. Three-dimensional numerical simulation on interaction between double-shield TBM and surrounding rock mass in composite ground. Chin. J. Rock Mech. Eng. 2016, 35, 511–523. [Google Scholar]
- Su, X.G.; Li, Y.B.; Yang, Y.K. A Research into Extra-thick compound mudstone roof roadway failure mechanism and security control. Procedia Eng. 2011, 26, 516–523. [Google Scholar] [CrossRef][Green Version]
- Jiang, L.S.; Ma, N.J.; Bai, L.; Li, Y.J.; Zhang, L. Deformation and failure characteristics and roof caving hidden danger classification of roadways compound roof. J. China Coal Soc. 2014, 39, 1205–1211. [Google Scholar]
- Chen, L.; Rabczuk, T.; Bordas, S.P.A.; Liu, G.R.; Zeng, K.Y.; Kerfriden, P. Extended fnite element method with edge-based strain smoothing (ESm-XFEM) for linear elastic crack growth. Comput. Methods Appl. Mech. Eng. 2012, 209, 250–265. [Google Scholar] [CrossRef]
- Park, K.; Paulino, G. Cohesive zone models: A critical review of traction-separation relationships across fracture surfaces. Appl. Mech. Rev. 2013, 64, 060802. [Google Scholar] [CrossRef]
- Motamedi, M.H.; Weed, D.A.; Foster, C.D. Numerical simulation of mixed mode (I and II) fracture behavior of pre-cracked rock using the strong discontinuity approach. Int. J. Solids Struct. 2016, 85–86, 44–56. [Google Scholar] [CrossRef]
- Haeri, H.; Sarfarazi, V.; Ebneabbasi, P.; Maram, A.N.; Shahbazian, A.; Marji, M.F.; Mohamadi, A. XFEM and experimental simulation of failure mechanism of non-persistent joints in mortar under compression. Constr. Build. Mater. 2019, 236, 117500. [Google Scholar] [CrossRef]
- Meschke, G.; Dumstorf, P. Energy-based modeling of cohesive and cohesionless cracks via X-FEM. Comput. Methods Appl. Mech. Eng. 2007, 196, 2338–2357. [Google Scholar] [CrossRef]
- Lens, L.N.; Bittencourt, E.; D’Avila, V.M.R. Constitutive models for cohesive zones in mixed- mode fracture of plain concrete. Eng. Fract. Mech. 2009, 76, 2281–2297. [Google Scholar] [CrossRef]
- Jiang, H.; Meng, D. 3D numerical modelling of rock fracture with a hybrid fnite and cohesive element method. Eng. Fract. Mech. 2018, 199, 280–293. [Google Scholar] [CrossRef]


Disclaimer/Publisher’s Note: The statements, opinions and data contained in all publications are solely those of the individual author(s) and contributor(s) and not of MDPI and/or the editor(s). MDPI and/or the editor(s) disclaim responsibility for any injury to people or property resulting from any ideas, methods, instructions or products referred to in the content. |
© 2025 by the authors. Licensee MDPI, Basel, Switzerland. This article is an open access article distributed under the terms and conditions of the Creative Commons Attribution (CC BY) license (https://creativecommons.org/licenses/by/4.0/).