Abstract
A thermodynamic model of an ammonia–water absorption refrigeration cycle with heat integration was developed using Aspen Plus to investigate the impact of selected process variables on the energy efficiency and operational feasibility of the system. The coefficient of performance (COP), evaporator temperature, and refrigeration cycle heat flows were analyzed as a function of the high and low pressures of the system, as well as ammonia concentration in the generator feed, and UA, which is the product of the overall heat transfer coefficient (U) and the heat transfer area (A) of the solution heat exchanger. This article presents parametric studies that reveal the interdependence of these factors and quantifies their effects on system performance. The results indicate the feasibility of driving the cycle using low-temperature heat sources (e.g., solar thermal energy) for a range of cooling temperatures.
1. Introduction
A significant amount of industrial residual heat is dissipated into the environment, leading to energy waste and environmental pollution. The recovery of this waste heat to activate an absorption heat pump is an attractive solution to this problem that provides both environmental and economic benefits, garnering the attention of researchers [1,2]. Additionally, these absorption systems can be activated by various thermal sources such as solar thermal, geothermal, biomass, exhaust streams, and fossil fuel combustion [3,4,5].
Over the past decades, absorption heat pumps have been extensively studied in various configurations. A notable focus of this study is the ammonia–water absorption cooling system, which has applications in air conditioning, refrigeration, and freezing, offering the advantage of lower electricity consumption compared to conventional devices. The simplest configuration, known as the single-effect or one-stage system, has been the most widely analyzed. However, its performance capacities and efficiencies are limited by its configuration, prompting the exploration of advanced cycles [6] such as the dual-stage cycle [7], dual-effect [8,9], triple-effect [10], GAX [11,12,13], systems with an ejector [14], multi-effect systems [15], internal heat recovery systems [16], and combined systems [17]. Boer et al. [18] have found the internal heat recovery system to be more effective and practical for enhancing the performance of a single-stage ammonia–water absorption refrigeration system by reducing irreversible internal energy losses [19].
Other techniques to improve the efficiency of ammonia–water absorption refrigeration systems include optimization and enhancement of absorption processes. Absorption improvements encompass altering absorption modes [20,21], utilizing nanofluids [22], and employing large specific area heat exchangers [23]. Several authors have conducted optimization studies on internal heat recovery. Du et al. [19] developed a model to achieve an optimal cycle with maximum internal heat recovery derived from an integral method of pinch technology (a method for energy integration by coupling hot and cold process streams). Their findings demonstrated a 20% improvement in the cycle coefficient of performance (COP) compared to a traditional cycle under typical operating conditions. They also determined that the COP improvement is more significant at lower evaporator temperatures and higher generator temperatures. In another study, Du et al. [24] conducted a theoretical analysis to identify the best cycle with the highest internal heat recovery based on feeding the strong solution under saturated, superheated, and subcooled conditions. The results indicated that a saturated feed is optimal due to minimal irreversible loss of heat. A recent study by Du et al. [25] presented a theoretical analysis of the maximum internal heat recovery for a dual-stage ammonia–water absorption cooling system using pinch technology, finding improvements in COP by 14.5% and 34.1% compared to a conventional system for two studied conditions.
In this article, we present parametric studies of an ammonia–water absorption cooling system with internal heat recovery. Previous research on this cycle includes a study by Klein [26], who developed a mathematical model to determine steady-state performance, validated against experimental data at evaporator air temperatures of 26.6 °C, 35 °C, and 37.7 °C. The COP values obtained by the model for these temperatures were 0.6244, 0.5582, and 0.5284, respectively. Sensitivity analysis revealed that the machine is designed to operate optimally at 35 °C. Klein recommended a more fundamental model capable of calculating heat transfer coefficients. Lazzarine et al. [27] conducted a theoretical study on the same commercial cycle to achieve cooling temperatures of −23 °C to −13 °C, predicting internal parameters and system behavior, with model predictions aligning well with experimental data from the manufacturer. They suggested modifications to solution concentration in the commercial machine and protecting fluids from undercooling to prevent pump issues. Darwish et al. [28] used the Aspen Plus simulator to model the thermodynamic cycle, analyzing the COP and detailed generator operation. The predicted results compared favorably with Lazzarine et al.’s experimental data [27], showing a 1.8% deviation. The model indicated that COP could be improved by up to 15% by increasing the number of theoretical stages in the generator from one to five, thus improving refrigerant separation.
Mansouri et al. [29] developed a model of the same commercial machine, validated with Klein’s data [26]. They used Klein’s experimental temperatures [26] in heat exchangers to determine the product UA of the overall heat transfer coefficient (U) and the heat transfer area (A), incorporating these as input parameters to a new model. The results were compared with experimental data from the literature [26,30] at cooling air temperatures of 26.7 °C and 38 °C, showing good agreement. However, some reported differences in temperatures between experimental values and model predictions indicated potential for model and/or experimental data collection improvement.
To improve recent modeling efforts, phase equilibrium, in addition to mass and energy balances, is considered in this article. The proposed model of an ammonia–water absorption cooling cycle with an internal heat recovery configuration similar to a commercial cycle is employed in parametric analysis by varying system pressure, the ammonia vapor fraction leaving the generator, and the UA product in the solution heat exchanger. Based on this analysis, the system operating conditions resulting in the highest COP given appropriate human thermal comfort conditions for a selected ambient temperature are calculated. Aspen Plus v7 was utilized for this study due to its convenient platform for energy analysis, integrating physical property models and databases with unit operation models [27,29,31].
2. Materials and Methods
2.1. Basic Absorption Cooling System
Figure 1 shows the thermodynamic cycle of a basic single-acting ammonia–water absorption cooling system with pressure levels versus temperature, ammonia being the refrigerant and water the absorbent. The cycle starts by supplying heat to the generator (QGE) at the highest system temperature (TGE). Under pressure and temperature conditions, the ammonia–water solution reaches its saturation condition where a vapor phase with a high concentration of ammonia is separated and enters a rectifier (REC) where heat (QREC) is removed to condense the remaining water content and return it to the generator (GE). The solution that is not vaporized is considered to be a weak solution because of its low ammonia concentration. The pure ammonia vapor (refrigerant) leaving the rectifier enters the condenser (CO) where heat (QCO) is removed at condenser temperature (TCO) to obtain liquid at the same pressure as the generator. The liquid refrigerant passes through the expansion valve where its pressure and consequently its temperature decreases before reaching the evaporator (EV). Therefore, in this component, the refrigeration is available (QEV) at the low system temperature (TEV). At the thermodynamic conditions of PEV and TEV, the absorber is fed by the ammonia in vapor phase coming from the evaporator and by the weak solution coming from the generator which passes through an expansion valve to enter the same vapor pressure. The ammonia is absorbed by the water, producing an exothermic reaction, which is controlled by an external heat source that removes this heat (QAB) at intermediate system temperature (TAB). The new strong solution resulting from the absorption is driven by the pump to finally return to the generator where the cycle starts again.
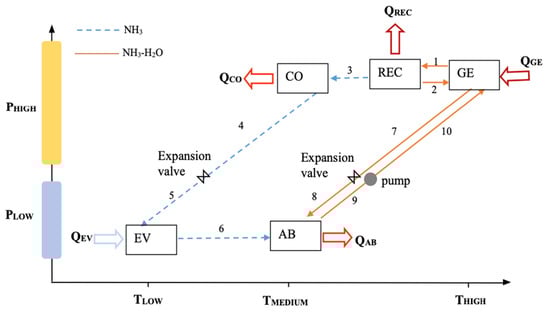
Figure 1.
Schematic diagram of a basic single-acting ammonia–water absorption cooling system.
2.2. Absorption Cooling System with Internal Heat Recovery
Figure 2 shows the process diagram of a single-effect absorption cooling system with internal heat recovery, modeled in ASPEN PLUS v7. The basic processes described in the cycle in Figure 1 are also carried out in the proposed configuration. This cycle partially exploits the heat that is rejected into the environment through the condenser, rectifier and absorber in a basic absorption cooling system. The heat used is recycled internally into the system through additional heat exchangers, which are a pre-cooler, a rectifier, and a solution heat exchanger (SHX) as shown in Figure 2. The pre-cooler is located between the condenser flow output and the evaporator flow output. In this exchanger, the condenser flow gives up heat to the evaporator outlet flow and consequently decreases its enthalpy before entering the expansion valve, while the steam outlet in this exchanger reaches a steam fraction equal to 1. Therefore, the vapor output flow in the evaporator has a vapor quality of less than 1, which indicates that the enthalpy decreases, and consequently the cooling load benefits of the evaporate increases. The rectifier has the function of condensing the water contained in the ammonia vapor formed in the generator to guarantee correct operation in the rest of the cycle. The heat from the rectifier is recovered in heat exchanger number 2 (INTERCM2) by preheating the strong solution flowing from the absorber. Subsequently, the strong solution again gains thermal level by accepting heat due to the high temperature of the weak solution coming from the generator interacting in the solution heat exchanger (SHX) identified as INTERCM1. In this way the internal heat recovery to the system through the INTERCM1 and INTERCM2 reduces the thermal load of the generator supply and therefore improves the efficiency of the complete system.
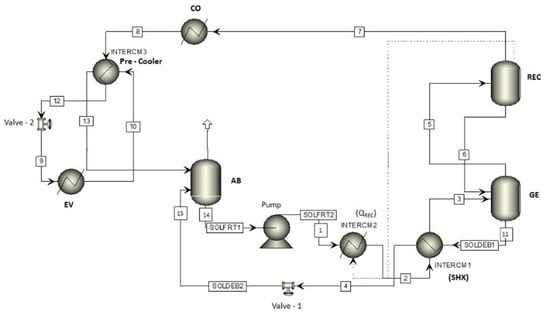
Figure 2.
Process diagram of a single-effect absorption cooling system with internal heat recovery, modeled in Aspen Plus.
Table 1 lists the elements that constitute the cycle shown in Figure 2 and the Aspen Plus block used to model their behavior.

Table 1.
Aspen Plus blocks used in the model with their label.
2.3. Assumptions and Development of the Thermodynamic Model
ASPEN-PLUS v7 was the software used to make the process model of the single-effect absorption cooling system with internal heat recovery, as shown in Figure 2. Bernards and Overney [32] and ASPEN Technology [33] report valuable information for the management and selection criteria of the unit operations for this software. The advantage of ASPEN-PLUS is that it has chemical bases and pre-programmed components, and it also shows the flexibility to make modifications to the model for parametric analysis.
The thermodynamic cycle model was made under the following assumptions:
- Thermodynamic equilibrium and steady-state condition exist throughout the system.
- There is no heat exchange with the environment.
- Pressure drops in components and pipes are negligible.
- There are saturated conditions at the outlet of the condenser and evaporator.
- The solutions at the generator and absorber outlet are in phase balance.
- The steam leaving the rectifier is pure ammonia (0.999 wt.)
- The expansion process in the throttle valves is isenthalpic.
- Kinetic and potential energy are negligible.
The reader should be aware that these assumptions may deviate the results from the actual operating conditions to different extents. For example, as Klein et al. [34] and Constantino et al. [35] mention in their works, the pressure drop in components (particularly in the absorber and the evaporator) and pipes, as well as the undesired heat exchange with the surroundings, decrease the refrigeration capacity of the cycle. Also, the actual expansion process before the evaporator may present throttling losses due to friction in the valve, causing reduced refrigeration capacity and COP [36,37,38].
The reader should consider that although these assumptions deviate the analysis from the real-world conditions, it is common [39,40,41,42,43] to use them due to the complexity of the physical phenomena present in the refrigeration absorption systems and because their effect on the calculated ideal results may satisfactorily approximate the actual system measurements.
The procedure to develop the model and selection of the different process units available to ASPEN-PLUS was carried out under the following scenario:
- The software was configured to operate and calculate the thermodynamic and transport properties of the ammonia–water mixture:The configuration was based on an exercise with known thermal data, where the 12 available Aspen-plus methods of activity coefficients were evaluated. The selected method was UNIFAC (Universal Functional Activity Coefficient) because it presented among the methods the minimum deviation of 1.53% with respect to the results of known temperatures of the exercise.
- The absorber, generator, and rectifier are represented by a FLASH2 block. This block is used for single-stage separation processes, with sufficient space for the vapor to be released from the liquid. FLASH2 performs rigorous calculations on phase equilibrium (vapor–liquid), produces one output flow in vapor phase and another in liquid state.
- The valve and pump are selected by the same name in the software menu.
- For the first heat recovery carried out in the rectifier, the unitary HEATER operation was used. This block allows dew point or bubble calculations to be performed. Add or remove any amount of heat specified by the user, establish the level of overheating or undercooling of a flow, and determine the heat or cooling load required to reach a certain fraction of vapor.
- The condenser and evaporator are also represented by a HEATER block, in which the vapor fraction of 0 and 1 is assumed for the condenser and evaporator, respectively.
- The solution heat exchanger (SHX) was developed by the unitary HEATX operation. For the input data of this module, the direct method and countercurrent configuration for fluid heat exchange was chosen. In the HEATX module a temperature difference of 9.5 °C (conventional design criterion) is assumed between the output flows of the SHX. The suitability of this first assumption is discussed below.
- According to each device in the system, high and low pressure were considered as initial conditions of 19.75 and 3.94 bar, respectively. This data was obtained by Manrique [44] in an experimental way from a refrigeration machine with thermodynamic cycle similar to this study.
- The flows connect the unit operation models or blocks, carrying material or energy flow between them. Because the program requires an initial assumption from which to start, the following initial assumptions were made for the flow leaving the solution pump (SOLFRT2): water mass fraction of 0.62, ammonia mass fraction of 0.38, pressure of 17.95 bar, solution mass flow of 200 kg/h, and solution temperature of 43.28 °C. These assumptions only serve as a starting point for the ASPEN numerical procedure, then it calculates these conditions to meet the various considerations of the model.
- The Design Spec submenu was used to define operating conditions from known operating conditions of a commercial absorption cooling machine. The generator specification was 22.1 kW heat flow to calculate the vapor fraction in this device. A design specification procedure was applied to the rectifier to know the vapor fraction with which it must operate to obtain an output flow with an ammonia mass fraction close to 0.999. In the ASPEN Plus environment, the validity of this ammonia concentration value is ensured by calculating the heat that must be removed in the rectifier using a FLASH2 block which performs strict thermodynamic equilibrium calculations and rigorous mass and energy balances. The resulting heat duty of 8.63 kW in the rectifier will then guarantee that the ammonia concentration would be achieved, within the assumptions in the model. As Klein et al. [34] mention, a lower concentration value would negatively impact the pressure of the evaporator and the absorber, which in turn would affect the refrigeration capacity of the system. To ensure the refrigeration load of the commercial machine, the design specification was assigned to the 10.551 kW evaporator to know the mass flow of the solution leaving the pump.
- To determine if the results from our simulation runs may be accepted, convergence criteria were established in the Convergence menu. This last section also allows us to indicate the maximum number of iterations that the program will use to find the solution of the developed model; for the single-effect absorption equipment that was worked on in this section, a maximum of 1400 iterations were reached.
2.4. Thermodynamic Analysis
The principles of mass and energy in the different control volumes based on the first law of thermodynamics were used to carry out the parametric study of the complete system:
- Mass balance
- Species balance
- Energy balance
According to Equations (1)–(3), the energy balances for the heat exchangers are shown in Table 2. The numerical sub-index in the equations indicates the input or output flow according to the numbering in Figure 2.
Table 2.
Energy balances on system components.
The coefficient of performance (COP) indicates the cooling capacity of the system, and it is defined as the useful heat in the evaporator relative to the sum of the heat supplied to the generator and solution pump work.
3. Results and Discussion
The data obtained by the single-effect ammonia–water absorption cooling system model with internal heat recovery was validated with the data of the model carried out by Darwish et al. [28], where the relative maximum error for the COP was 4%, which represents an acceptable difference as it does not significantly affect the data obtained. Other comparisons between relevant cycle data can be observed in Table 3.
Table 3.
Relevant refrigerant cycle parameters reported by Darwish et al. [28] and corresponding values obtained in this study.
The following parametric analysis aims to show the changes and behaviors of the system in the face of changing operating conditions, to point out possible areas of opportunity from either an energy, design, or even construction feasibility point of view. The system was analyzed according to variables such as high and low pressure, steam fraction in the generator, ammonia concentration in the strong solution, and the solution heat exchanger product UA (SHX). Subsequently, a heat exchanger, called a pre-cooler, is added to the model between the flows leaving the evaporator and condenser.
Figure 3 shows the COP and Q-value of the heat exchangers (generator—GE, absorber—AB and condenser—CO) as a function of the low pressure (PLOW). The pressure range of 2 bar to 6 bar is proportional to a refrigeration temperature range in the evaporator of −2 °C to 19 °C. As the pressure increases, the COP increases from 0.442 to 0.495. This occurs because increasing PLOW raises the saturation temperature of ammonia at the outlet of the evaporator; then, this increase in temperature is related to the increase in solution temperature at the outlet of the absorber; therefore, the strong ammonia–water solution that reaches the generator demands less QGE (from 24 to 21 kW) to reach the saturation condition and consequently the COP increases. Mathematically, it can be deduced from Equation (3). On the other hand, the electrical power required by the pump was almost constant at 0.37 kW. For this reason, Wpump is considered negligible, as it does not significantly impact the COP results. QAB tends to decrease similarly to QGE to satisfy the energy balance in the system.
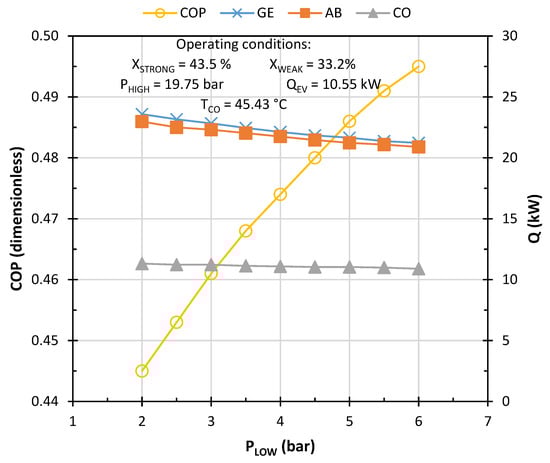
Figure 3.
Coefficient of performance (COP) and heat (Q) behavior of the system as a function of low pressure (PLOW). No pre-cooler in the system.
Figure 4 shows the behavior of the COP and heat Q of the main heat exchangers as a function of the high pressure of the refrigeration cycle. As the PHIGH pressure of the system increases, the COP tends to decrease. This happens because the generator demands more heat to reach the new saturation temperature condition of the weak solution corresponding to the PHIGH. On the other hand, it is observed that the heat of the condenser is not significantly modified, since the heat of refrigeration by the evaporator is kept at 10.55 kW. For this scenario, the pressure range corresponds to a saturation temperature range of 41 °C to 50 °C at the condenser, which indicates a thermal level that is transferable and operational to an external ambient circuit.
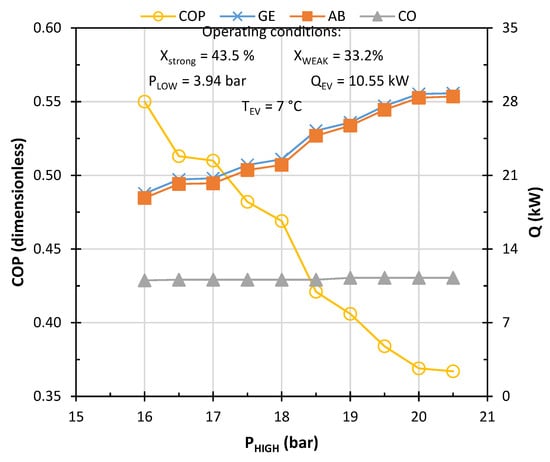
Figure 4.
Effect of the coefficient of performance (COP) and heat (Q) of the system components as a function of high pressure (PHIGH). No pre-cooler in the system.
COP versus PHIGH is analyzed in Figure 5 using two concentrations of the strong solution. A strong solution concentration of 46% allows a greater operating range of the high pressure in the system; in addition, a COP of 14.5% higher than the maximum COP of the concentration at 43.5% is obtained. The solution concentrations to maintain the thermodynamic equilibrium of the system, correspond to 35 and 33% for weak solution and 46% and 43.5% for strong solution.
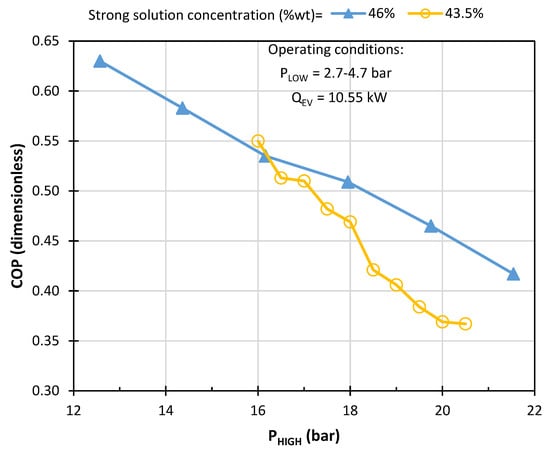
Figure 5.
COP as a function of high pressure for two concentrations of the strong ammonia–water solution at the absorber outlet. No pre-cooler in the system.
The behaviors of the COP, QGE, QAB, and Wpump as a function of the vapor fraction produced in the generator are analyzed in Figure 6. It is shown that the COP tends to increase when the vapor fraction is greater, that is, when the ammonia vapor production increases. The reason is because the heat in the generator decreases, as shown in the same figure. By continuously increasing steam production, the remaining solution mass in the generator requires less heat, because the thermodynamic equilibrium of the system requires a lower amount of solution mass flow and lower saturation temperature in the generator; therefore, slightly less pump work (W) to circulate the solution from the absorber to the generator is required. This is an important study for the design and operation of the generator, because it indicates producing the maximum amount of ammonia vapor possible to achieve the best efficiencies in the system. Also, by increasing the vapor fraction from 0.33 to 0.85, the COP increases by 71.9%, while the generator heat decreases from 28 to 14 kW, representing 50% less. On the other hand, to satisfy the energy balance of the system, the heat from the absorber has the same tendency as the QGE, and the heat from the condenser is similar to the heat from the evaporator.
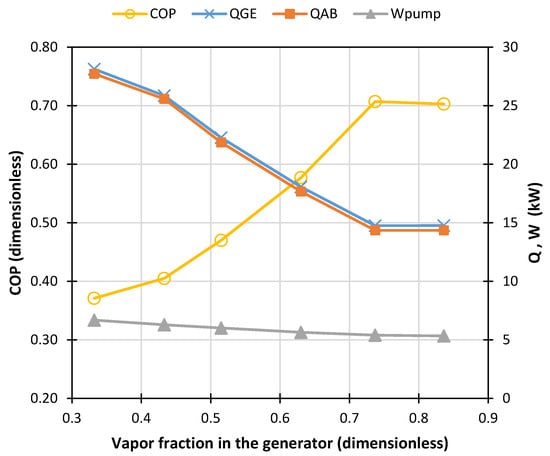
Figure 6.
Study of COP, QGE, QAB, Wpump as a function of the fraction of vapor produced in the generator. No pre-cooler in the system.
Figure 7 shows the impact of the solution heat exchanger (SHX), in which the sensitivity of COP and QGE against the UA value of the SHX can be seen. For this analysis the condensing and evaporating temperatures correspond to 45.43 °C and 6.85 °C, respectively. The strong concentration is 43.5% and the weak concentration is 33.2% in weight of ammonia. It can be seen in the figure that the COP increases and QGE decreases as the UA value increases. Under this scenario, the COP can reach a maximum value of 0.522 to 2800 W/°C of UA; however, the higher the UA, the solution heat exchanger requires more heat transfer area, which implies an increase in costs, space, and construction criteria. The UA value can be considered adequate up to 2200 W/°C, since from this value the increase in the COP is only 1% when reaching 0.522.
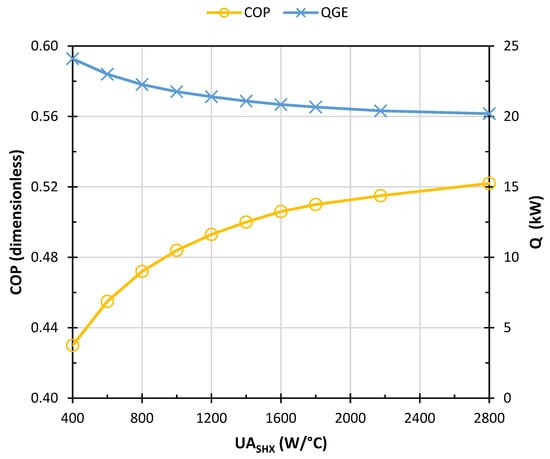
Figure 7.
Analysis of COP and QGE with respect to the change in UA from the SHX. No pre-cooler in the system.
Based on the results of these parametric studies, a multiple linear regression analysis was conducted, revealing that the resulting model was statistically significant in representing COP values. Notably, the coefficient related to the high-pressure term was found to have the greatest statistical significance in the prediction of COP of the refrigeration absorption system. This analysis is included in the Supplementary Materials.
The use of a pre-cooler gives the opportunity for the ammonia vapor fraction in the evaporator to be less than 1 since it ends up in the vapor phase at the exit of the pre-cooler. The main objective of this component is to reduce the enthalpy at the exit of the evaporator, and, therefore, to reduce the range of operating temperatures, which will allow a selected space to cool to a lower temperature or to have more energy available for such cooling, producing a performance benefit. Table 4 shows the values of the main operating parameters of each system current with and without the use of the pre-cooler. The table identifies that the temperature at the outlet of the evaporator without the use of the pre-cooler is 6.85 °C, while with the use of the pre-cooler the evaporator operates from −2.2 to −1.8 °C. It should be remembered that without the use of the pre-cooler (flow 10a), flows 12 and 13 do not exist. With and without the use of the pre-cooler the rest of the operating flow values are maintained and only the cooling temperature capacity is affected.
Table 4.
Operating conditions of the flows of the absorption cooling system. Without the use of the pre-cooler (10a), material streams 12 and 13 are omitted.
On the other hand, to achieve a lower temperature cooling, the pre-cooler must absorb part of the heat from the condenser outlet flow (line 8 in Figure 2); this quantity and the rest of the heat from the heat exchangers are shown in Figure 8, which corresponds to the thermodynamic cooling cycle with internal heat recovery under the operating conditions shown in Table 4. In this figure, the amount of heat that is recycled to the generator through the SHX and REC heat exchangers can be observed. The total internal heat recovery was 19.65 kW for all heat exchangers (SHX, REC, and pre-cooler), of which 94.1% is recycled into solution flows before they enter the generator to obtain a COP of 0.477.
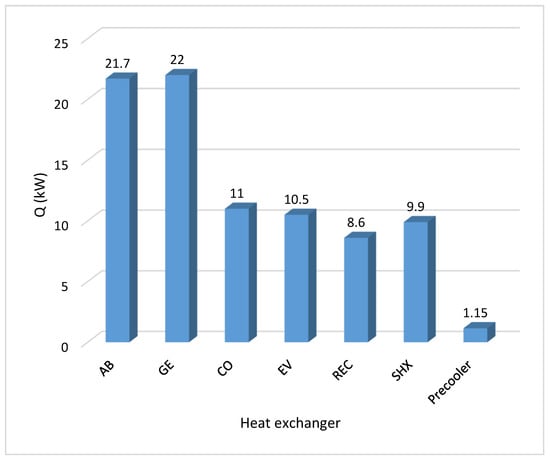
Figure 8.
Heat recuperators (REC, SHX, and pre-cooler) and heat loads in the heat exchangers of the single-acting absorption cooling system with pre-cooler.
Figure 9 shows the behavior of the COP as a function of the evaporator vapor fraction using the pre-cooler in the system. The trend indicates that the system’s coefficient of performance presents an optimum point of operation, where for the established conditions, the best panorama is presented in the vapor fraction whose value is 0.99, when a COP of 0.508 is reached.
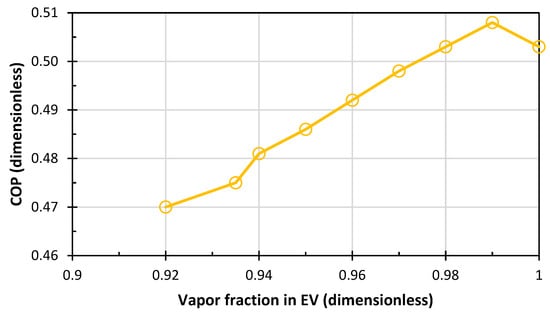
Figure 9.
COP as a function of the vapor fraction in the evaporator. No pre-cooler in the system.
Characterization of the Model to Operate Under Weather Conditions in Monterrey, NL, Mexico
The model made is a very useful tool that can be used in the design of heat exchangers or to find the right operating conditions to achieve human thermal comfort through the production of air conditioning.
For example, the historical average maximum temperature in the Monterrey metropolitan area is 35 °C [45], while human thermal comfort is 20 °C according to ASHRAE [46]. Then, the application of the single-effect absorption cooling system should produce air conditioning in a room for daily use at a temperature of 20 °C from a room temperature of 35 °C.
Table 4, with the use of the pre-cooler, shows the pressure (17.95 bar) and temperature (45.43 °C) conditions required for the condenser. Also, in the case of low pressure equal to 3.94 bar and using the pre-cooler, a temperature in the evaporator of −1.87 °C is reached, which allows this pressure to increase until reaching a temperature in the evaporator of 10 °C. For a new simulation according to the required operating conditions, the model is evaluated, and the results of the process flows are presented in Table 5. The temperature of flow 14 (absorber outlet) equal to 29.6 °C, which indicates a need to remove heat through a secondary circuit instead of using ambient air, which does not meet the temperature level required to use the latter fluid as a cooling medium.
Table 5.
Results of operating conditions of the single-effect absorption cooling system for air conditioning in the city of Monterrey, N. L., Mexico.
Figure 10 shows the amount of heat exchanger energy required to meet the air conditioning of a room at 20 °C from a room temperature of 35 °C. The COP of the cycle was 0.542, which represents an improvement of 14.6% with respect to the result of the graph in Figure 7.
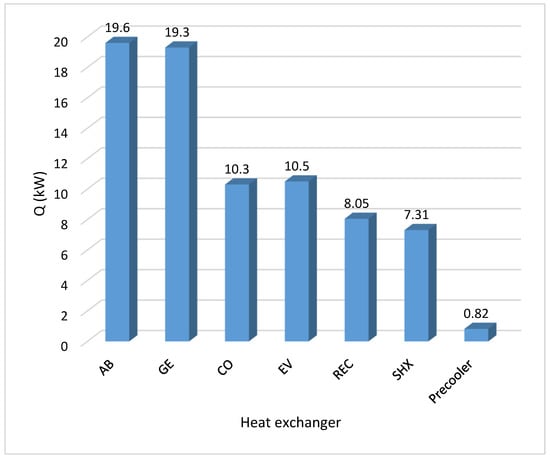
Figure 10.
Energy from the single-effect absorption cooling system with heat recovery to produce cooling to 20 °C from a room temperature of 35 °C.
For a study of similar operational and weather conditions, Vargas et al. [47] conducted an economic study that demonstrates that a solar-driven ammonia-absorption refrigeration system achieves an IRR (internal rate of return) between 9% and 15%. Other authors [48,49] have demonstrated the technical and economic feasibility of refrigeration systems similar to the one analyzed in this section.
4. Conclusions
Although maintaining steady-state conditions in actual operation is complex, the results obtained in the base case are quite close to the experimental data available in the literature [27,50]. This indicates that the model is valuable for analyzing such real scenarios. After the validation step, the model was used to calculate the performance of the absorption system for weather conditions in Monterrey, Mexico. The predicted COP was 0.542, a 14.6% improvement from the base case. In order to obtain this value of COP, the high and low pressure were set to 17.95 and 3.94 bar, respectively, and the strong solution concentration was found to be 43.5 mass % ammonia.
The parametric analysis that was carried out gave rise to the following considerations in the search for the best possible performance in the cycle: the low pressure level of the equipment should be as high as possible, but it will be limited by the temperature at which a certain space or substance is expected to be cooled, since this determines the value of the temperature at which the evaporator needs to operate. The high pressure of the system needs to be as low as possible; however, the limit value will be set by the temperature of the ambient air because this fluid is used to remove the heat expelled by the condenser, which determines the operating temperature of this device. When modifying the vapor fraction with which the generator works, it must be considered that this determines the ammonia concentrations in the flows of the generator absorber; in turn, the ammonia mass fraction in the strong solution establishes the operating temperature in the absorber and, therefore, the characteristics of the fluid that will be used to remove the heat that this element needs to release. Regarding the pre-cooler, the convenience of its use was observed by increasing the cooling load of the equipment (without greater outflow of thermal or electrical energy) or, failing that, by lowering the operating temperature of the evaporator if the cooling capacity is to be kept constant.
The characterization that was carried out ensures the proper functioning for cooling, which represents a way to encourage the general use of this equipment, since high coefficients of performance are translated sooner or later into economic benefits through the saving of electrical and/or thermal energy.
Finally, as future work, a similar model could be applied to other working fluid pairs such as those appearing in the recent literature [51,52], which demonstrate promising results for refrigeration absorption systems.
Supplementary Materials
The following supporting information can be downloaded at https://www.mdpi.com/article/10.3390/pr13123790/s1.
Author Contributions
Conceptualization, S.L.P.-G. and A.J.G.-C.; methodology, S.L.P.-G. and A.J.G.-C.; software, S.L.P.-G.; validation, A.M.-N. and S.L.P.-G.; formal analysis, A.J.G.-C.; investigation, A.M.-N., S.L.P.-G. and A.J.G.-C.; resources, A.J.G.-C.; data curation, A.J.G.-C.; writing—original draft preparation, A.M.-N.; writing—review and editing, S.L.P.-G. and A.J.G.-C.; visualization, A.M.-N.; supervision, A.J.G.-C.; project administration, A.J.G.-C.; funding acquisition, S.L.P.-G. and A.J.G.-C. All authors have read and agreed to the published version of the manuscript.
Funding
This research was funded by NOVUS, Institute for the Future of Education, Tecnologico de Monterrey, Mexico, grant number 35, Consejo Nacional de Ciencia y Tecnología (CONACYT) and Secretaría de Energía (SENER) through “Fondo de Sustentabilidad Energética”, grant number CEMIE-SOL P09, and Tecnologico de Monterrey through the Sustainable Energy Research Group. We also gratefully acknowledge the Departamento de Mecánica y Materiales Avanzados for APC funding.
Data Availability Statement
The original contributions presented in this study are included in the article. Further inquiries can be directed to the corresponding author.
Acknowledgments
A.M.-N. acknowledges support from CONACYT through the program “Estancias Posdoctorales Vinculadas al Fortalecimiento de la Calidad del Posgrado Nacional, 2018 (1)” for a postdoctoral fellowship. During the preparation of this manuscript, the authors used GPT 4o for the purpose of polishing the Abstract and Introduction. The authors have reviewed and edited the output and take full responsibility for the content of this publication.
Conflicts of Interest
The authors declare no conflicts of interest.
Abbreviations
The following abbreviations are used in this manuscript:
| A | Heat transfer area (m2) |
| COP | Coefficient of performance (dimensionless) |
| h | Specific enthalpy (kJ/kg) |
| Mass flow rate (kg/s) | |
| NH3 | Ammonia |
| P | Pressure (bar) |
| Q | Heat load (kW) |
| SHX | Solution heat exchanger |
| T | Temperature (°C) |
| U | Overall heat transfer coefficient (W/°C m2) |
| W | Mechanical work (kW) |
| X | Solution concentration (% wt) |
| Subscripts | |
| AB | Absorber |
| CO | Condenser |
| EV | Evaporator |
| GE | Generator |
| REC | Rectifier |
| 1–15 | Stream lines |
References
- Brückner, S.; Liu, S.; Miró, L.; Radspieler, M.; Cabeza, L.F.; Lävemann, E. Industrial waste heat recovery technologies: An eco-nomic analysis of heat transformation technologies. Appl. Therm. Eng. 2015, 151, 157–167. [Google Scholar] [CrossRef]
- Xu, Z.Y.; Wang, R.Z. Absorption heat pump for waste heat reuse: Current states and future development. Front. Energy 2017, 11, 414–436. [Google Scholar] [CrossRef]
- Garimella, S.; Ponkala, M.J.; Goyal, A.; Staedter, A. Waste-heat driven ammonia-water absorption chiller for severe ambient operation. Appl. Therm. Eng. 2019, 154, 442–449. [Google Scholar] [CrossRef]
- Yan, C.; Abed, A.; Chaturvedi, R.; Dahari, M.; Abdullaev, S.; Zhou, X.; Mahariq, I.; Elmasry, Y. Sustainable commercially-scaled greenhouse building cooling solution: Integrating PCM storage, desiccant wheels, and absorption chillers powered by dual-source solar/biomass energy. J. Energy Storage 2024, 101, 113871. [Google Scholar] [CrossRef]
- Alhuyi-Nazari, M.; Mukhtar, A.; Md Yasir, A.; Ahmadi, M.; Kumar, R.; Luong, T. Applications of geothermal sources for absorption chillers as efficient and clean cooling technologies for buildings: A comprehensive review. J. Build. Eng. 2024, 82, 108340. [Google Scholar] [CrossRef]
- Xu, Z.; Mao, H.; Liu, D.; Wang, R. Waste heat recovery of power plant with large scale serial absorption heat pumps. Energy 2018, 165, 1097–1105. [Google Scholar] [CrossRef]
- Du, S.; Wang, R.; Lin, P.; Xu, Z.; Pan, Q.; Xu, S. Experimental studies on an air-cooled two-stage NH3-H2O solar absorption air-conditioning prototype. Energy 2012, 45, 581–587. [Google Scholar] [CrossRef]
- Izquierdo, M.; Marcos, J.; Palacios, M.; González-Gil, A. Experimental evaluation of a low-power direct air-cooled double-effect LiBr–H2O absorption prototype. Energy 2012, 37, 737–748. [Google Scholar] [CrossRef]
- Yin, H.; Qu, M.; Archer, D. Model based experimental performance analysis of a microscale LiBr–H2O steam-driven double-effect absorption chiller. Appl. Therm. Eng. 2010, 30, 1741–1750. [Google Scholar] [CrossRef]
- Matsushima, H.; Fujii, T.; Komatsu, T.; Nishiguchi, A. Dynamic simulation program with object-oriented formulation for absorption chillers (modelling, verification, and application to triple-effect absorption chiller). Int. J. Refrig. 2010, 33, 259–268. [Google Scholar] [CrossRef]
- Gómez, V.; Vidal, A.; Best, R.; García-Valladares, O.; Velázquez, N. Theoretical and experimental evaluation of an indirect-fired GAX cycle cooling system. Appl. Therm. Eng. 2008, 28, 975–987. [Google Scholar] [CrossRef]
- Jawahar, C.; Saravanan, R. Experimental studies on aircooled NH3–H2O based modified gax absorption cooling system. Int. J. Refrig. 2011, 34, 658–666. [Google Scholar] [CrossRef]
- Priedeman, D.; Garrabrant, M.; Mathias, J.; Stout, R.; Christensen, R. Performance of a Residential Sized GAX Absorption Chiller. Am. Soc. Mech. Eng. Adv. Energy Syst. Div. AES 1998, 277–279. [Google Scholar]
- Eames, I.; Wu, S. Experimental proof-of-concept testing of an innovative heat-powered vapour recompression–absorption refrigerator cycle. Appl. Therm. Eng. 2000, 20, 721–736. [Google Scholar] [CrossRef]
- Kang, Y.; Kunugi, Y.; Kashiwagi, T. Review of advanced absorption cycles: Performance improvement and temperature lift enhancement. Int. J. Refrig. 2000, 23, 388–401. [Google Scholar] [CrossRef]
- Wu, W.; Zhang, H.; You, T.; Li, X. Performance comparison of absorption heating cycles using various low-GWP and natural refrigerants. Int. J. Refrig. 2017, 82, 56–70. [Google Scholar] [CrossRef]
- Xu, Z.; Wang, R. Absorption refrigeration cycles: Categorized based on the cycle construction. Int. J. Refrig. 2016, 62, 114–136. [Google Scholar] [CrossRef]
- Boer, D.; Gebreslassie, B.; Medrano, M.; Nogués, M. Effect of internal heat recovery in ammonia-water absorption cooling cycles: Exergy and structural analysis. Int. J. Thermodyn. 2009, 12, 17–27. [Google Scholar]
- Du, S.; Wang, R.; Xia, Z. Optimal ammonia water absorption refrigeration cycle with maximum internal heat recovery derived from pinch technology. Energy 2014, 68, 862–869. [Google Scholar] [CrossRef]
- Kang, Y.; Akisawa, A.; Kashiwagi, T. Analytical investigation of two different absorption modes: Falling film and bubble types. Int. J. Refrig. 2000, 23, 430–443. [Google Scholar] [CrossRef]
- Mendes, L.; Collares-Pereira, M.; Ziegler, F. A rich solution spray as a refining method in a small capacity, single effect, solar assisted absorption machine with the pair NH3/H2O: Experimental results. Energy Convers. Manag. 2007, 48, 2996–3000. [Google Scholar] [CrossRef]
- Kim, J.; Jung, J.; Kang, Y. Absorption performance enhancement by nanoparticles and chemical surfactants in binary nanofluids. Int. J. Refrig. 2007, 30, 50–57. [Google Scholar] [CrossRef]
- Garimella, S.; Determan, M.; Meacham, J.; Lee, S.; Emst, T. Microchannel component technology for system-wide application in ammonia/water absorption heat pumps. Int. J. Refrig. 2011, 34, 1184–1196. [Google Scholar] [CrossRef]
- Du, S.; Wang, R.; Xia, Z. Graphical analysis on internal heat recovery of a single stage ammonia-water absorption refrigeration system. Energy 2015, 80, 687–694. [Google Scholar] [CrossRef]
- Du, S.; Wang, R.; Chen, X. Analysis on maximum internal heat recovery of a mass-coupled two-stage ammonia water absorption refrigeration system. Energy 2017, 133, 822–831. [Google Scholar] [CrossRef]
- Klein, S. A Model of the Steady-State Performance of an Absorption Heat Pump; National Bureau of Standards: Gaithersburg, MD, USA, 1982; Volume 83, p. 29471. [Google Scholar]
- Lazzarin, R.; Gasparella, A.; Longo, G. Ammonia-water absorption machines for refrigeration: Theoretical and real performances. Int. J. Refrig. 1996, 19, 239–246. [Google Scholar] [CrossRef]
- Darwish, N.; Al-Hashimi, S.; Al-Mansoori, A. Performance analysis and evaluation of a commercial absorption–refrigeration water–ammonia (ARWA) system. Int. J. Refrig. 2008, 31, 1214–1223. [Google Scholar] [CrossRef]
- Mansouri, R.; Boukholda, I.; Bourouis, M.; Bellagi, A. Modelling and testing the performance of a commercial ammonia/water absorption chiller using Aspen-Plus platform. Energy 2015, 93, 2374–2383. [Google Scholar] [CrossRef]
- El May, S.; Boukholda, I.; Bellagi, A. Energetic and exergetic analysis of a commercial ammonia-water absorption chiller. Int. J. Exergy 2011, 8, 33–50. [Google Scholar] [CrossRef]
- Shena, Y.; Tang, Z.; Guo, D.; Wu, C.; Wang, D.; Jiang, A.; Wen, Y. A simulation and experimental study on primary cooler for COG heat pump. Appl. Therm. Eng. 2019, 160, 113983. [Google Scholar] [CrossRef]
- Overney, R.; Bernards, M. Aspen Plus 12.1 Instructional Tutorials; Department of Chemical Engineering, University of Washington: Washington, DC, USA, 2004. [Google Scholar]
- ASPEN Technology, Inc. ASPEN Plus® User Guide; ASPEN Technology, Inc.: Cambridge, MA, USA, 2000. [Google Scholar]
- Klein, S.; Herold, K.; Radermacher, R. Absorption Chillers and Heat Pumps; CRC Press: Boca Raton, FL, USA, 2016. [Google Scholar]
- Constantino, M.; Kanizawa, F. Evaluation of pressure drop effect on COP of single-stage vapor compression refrigeration cycles. Therm. Sci. Eng. Prog. 2022, 28, 101048. [Google Scholar] [CrossRef]
- Minh, N.; Hewitt, N.; Eames, P. Improved Vapour Compression Refrigeration Cycles: Literature Review and Their Application to Heat Pumps. In Proceedings of the International Refrigeration and Air Conditioning Conference, West Lafayette, Indiana, 17–20 July 2006; p. 795. Available online: http://docs.lib.purdue.edu/iracc/795 (accessed on 14 November 2025).
- Shovon, M.; Kim, H.; Lee, J. Study on Thermo-Fluid Dynamics of the Throttling Loss in a Refrigeration System. Master’s Thesis, Andong National University, Andong, Republic of Korea, 2020. [Google Scholar] [CrossRef]
- Adamson, K.; Gordon, T.; Carson, J.; Chen, Q.; Schlosser, F.; Kong, L.; Cleland, D. High-temperature and transcritical heat pump cycles and advancements: A review. Renew. Sustain. Energy Rev. 2022, 167, 112798. [Google Scholar] [CrossRef]
- Kaynakli, O.; Kilic, M. Theoretical study on the effect of operating conditions on performance of absorption refrigeration system. Energy Convers. Manag. 2007, 48, 599–607. [Google Scholar] [CrossRef]
- Hernández-Magallanes, J.A.; Ibarra-Bahena, J.; Rivera, W.; Romero, R.J.; Gómez-Arias, E.; Dehesa-Carrasco, U.; Espinoza-Ojeda, O.M.; Kozhiparambil Chandran, S. Thermodynamic Analysis of a Half-Effect Absorption Cooling System Powered by a Low-Enthalpy Geothermal Source. Appl. Sci. 2019, 9, 1220. [Google Scholar] [CrossRef]
- Wang, M.; Infante, C. Performance analysis of double-effect absorption heat pump cycle using NH3/ILs pairs. In Proceedings of the 12th IEA Heat Pump Conference, Rotterdam, The Netherlands, 15–18 May 2017. [Google Scholar]
- Saka, K.; Fatih, M. Parametric study and thermal sensitivity analysis of a triple effect absorption refrigeration system. Case Stud. Therm. Eng. 2025, 69, 106030. [Google Scholar] [CrossRef]
- Li, K.; Wu, W.; Liang, K.; Zhang, H. Simulation on key influencing factors of CO2-ionic liquid mixture compression-absorption refrigeration cycle based on Aspen Plus. Int. Commun. Heat Mass Transf. 2025, 161, 108506. [Google Scholar] [CrossRef]
- Manrique, J. Solar Driven Ammonia-Absorption Cooling Machine. U.S. Patent No. 5,666,818, 16 September 1997. [Google Scholar]
- Sistema Integral de Monitoreo Ambiental (SIMA). Meteorología—Historial; Gobierno del Estado de Nuevo León: Monterrey, México, 2009. [Google Scholar]
- Standard 55-1992; Thermal Environmental Conditions for Human Occupancy (ANSI Approved). American Society of Heating; Refrigerating and Air-Conditioning Engineers, Inc.: Atlanta, GA, USA, 1995.
- Vargas-Bautista, J.; García-Cuéllar, A.; Rivera-Solorio, C. Design and economic analysis of a solar air-conditioning system: Case of study in Monterrey, Mexico. In Proceedings of the 30th ISES Biennial Solar World Congress 2011, Kassel, Germany, 28 August–2 September 2011; Volume 4, pp. 2798–2809. [Google Scholar]
- Al-Alili, A.; Islam, M.; Kubo, I.; Hwang, Y.; Radermacher, R. Modeling of a solar powered absorption cycle for Abu Dhabi. Appl. Energy 2012, 93, 160–167. [Google Scholar] [CrossRef]
- Al-Falahi, A.; Alobaid, F.; Epple, B. Thermo-Economic Evaluation of Aqua-Ammonia Solar Absorption Air Conditioning System Integrated with Various Collector Types. Entropy 2020, 22, 1165. [Google Scholar] [CrossRef]
- Horuz, I.; Callander, T. Experimental investigation of a vapor absorption refrigeration system. Int. J. Refrig. 2004, 27, 10–16. [Google Scholar] [CrossRef]
- Park, Y.; Kim, J.-S.; Lee, H. Physical properties of the lithium bromide + 1,3-propanediol + water system. Int. J. Refrig. 1997, 20, 319–325. [Google Scholar] [CrossRef]
- Hernández-Magallanes, J.; Domínguez-Inzunza, L.; Gutiérrez-Urueta, G.; Soto, P.; Jiménez, C.; Rivera, W. Experimental assessment of an absorption cooling system operating with the ammonia/lithium nitrate mixture. Energy 2014, 78, 685–692. [Google Scholar] [CrossRef]


Disclaimer/Publisher’s Note: The statements, opinions and data contained in all publications are solely those of the individual author(s) and contributor(s) and not of MDPI and/or the editor(s). MDPI and/or the editor(s) disclaim responsibility for any injury to people or property resulting from any ideas, methods, instructions or products referred to in the content. |
© 2025 by the authors. Licensee MDPI, Basel, Switzerland. This article is an open access article distributed under the terms and conditions of the Creative Commons Attribution (CC BY) license (https://creativecommons.org/licenses/by/4.0/).