1. Introduction
Shale gas, a clean and efficient energy source, has gained attention within global oil and gas research [
1,
2]. Globally, shale gas has become a key component of the natural gas supply, determined by advancements in horizontal drilling and hydraulic fracturing. The United States remains the largest producer, contributing over 900 billion cubic meters (bcm) annually, accounting for more than 70% of global shale gas output (EIA, 2023 [
3]). Canada, Argentina, and China follow, with emerging production also reported in Australia and Algeria. Global shale gas production exceeded 1200 bcm in 2023, representing roughly one-third of total natural gas production worldwide [
4,
5]. Despite abundant resources, technological, geological, and economic challenges have limited large-scale development outside North America. In comparison, China’s shale gas industry, though growing rapidly, still contributes less than 10% of global output, reflecting significant untapped potential [
6,
7]. In recent years, China has achieved rapid growth in shale gas production, establishing national demonstration areas in Fuling, Changning, Weiyuan, and Zhaotong [
4,
8,
9]. Domestic shale gas output increased from 0.02 billion cubic feet per day (Bcf/d) in 2013 to 2.51 Bcf/d in 2023 (EIA, 2023 [
3]), with projections estimating production of approximately 72.4 billion cubic meters (bcm) by 2040, at an annual growth rate of 3.32–8.02% [
6]. China’s heavy reliance on imported oil and gas (151.8 bcm natural gas imports in 2022) underscores the strategic importance of expanding domestic shale gas resources to meet rising energy demands [
10]. Unconventional natural gas accounted for 38.2% of total output in 2022, and shale gas production is expected to surpass 300 bcm by 2025 and reach 400 bcm by 2035 [
11].
Lower Silurian Longmaxi Formation, an organic-rich shale formation, is a key shale gas reservoir in the southern Sichuan Basin [
1,
6]. The Wufeng–Longmaxi Formation in the Luzhou Block represents a typical deep shale reservoir characterized by high maturity, ultra-high pressure, and ultra-low porosity and permeability [
12,
13]. According to China’s “Regulation of shale gas resources/reserves estimation” (DZT 0254-2014 [
14]), shale gas reservoirs at burial depths of 3500–4500 m are classified as deep shale gas reservoirs, whereas those exceeding 4500 m depth are classified as ultra-deep [
15]. Extracting gas from such tight formations poses challenges, necessitating hydraulic fracturing to improve permeability. Unlike medium-shallow shale, deep shale is subjected to greater pressure and temperature, resulting in a more compact rock matrix and highly developed nanoscale pores [
16,
17,
18]. These nanopores are vital not only for gas storage but also for controlling fluid migration, emphasizing the importance of accurately characterizing pore systems in deep shale gas reservoirs [
19,
20].
Pore characterization in shale has been widely studied using a combination of qualitative and quantitative methods. Techniques such as scanning electron microscopy (SEM), transmission electron microscopy (TEM), small-angle neutron scattering (SANS), and focused ion beam scanning electron microscopy (FIB-SEM) provide visual insights into pore morphology [
21,
22,
23,
24,
25], while quantitative techniques such as mercury intrusion Porosimetry (MIP), low-temperature nitrogen/carbon dioxide adsorption (LTNA/LTCA), and nuclear magnetic resonance (NMR) assess pore size distribution and porosity. Loucks et al. established a widely adopted classification scheme for marine shale pores, classifying them into organic matter (OM) pores, intergranular pores, intragranular pores, and microfractures [
19,
26,
27,
28]. Other studies proposed alternative classifications based on genesis (primary vs. secondary pores) [
29,
30], matrix type (organic vs. inorganic pores) [
31], or hydrocarbon evolution [
32]. Pore structure has been linked to mineral composition (OM, clay minerals, quartz) and thermal maturity [
33,
34,
35,
36].
Despite these advances, previous research has predominantly focused on shallow and medium-depth shale reservoirs, while pore characteristics in deep shale formations have rarely been addressed. Recent studies have emphasized the complexity of pore networks in deep shale, highlighting the role of advanced imaging and image analysis techniques such as MAPS, FIB-SEM, and ImageJ 2.14.0/1.54p in investigating pore morphology, size distribution, and connectivity [
37,
38,
39]. Pore connectivity is a key determinant of gas migration from the matrix to fractures, thus a critical factor for reservoir performance [
40,
41]. Studies integrating NMR, MIP, and imaging tools have been conducted to explore pore connectivity, yet comprehensive multi-scale analyses for deep shale in the Luzhou Block remain scarce [
42,
43,
44,
45,
46].
Although pore type and morphology in shale reservoirs have been extensively studied, there is a paucity of systematic research linking pore morphology, connectivity, and fractal characteristics in deep shale reservoirs of the Wufeng–Longmaxi Formation in the Luzhou Block. Existing reservoir evaluation methods relying on organic content, porosity, gas content, and mechanical properties fail to fully explain the heterogeneity in gas productivity, particularly in unproductive intervals, despite favorable geochemical conditions [
13,
40,
41,
47]. The limited understanding of pore connectivity and its controlling factors restricts accurate reservoir quality evaluation and hinders effective shale gas exploitation.
To address the issue, this study employs MAPS imaging integrated with ImageJ analysis to qualitatively and quantitatively characterize pore types, morphology, fractal attributes, and pore connectivity in the deep shale samples from Well Y-101H10-3 in the Luzhou Block. Complementary NMR and MIP measurements are incorporated to establish a robust framework for pore connectivity evaluation. By analyzing sub-layer variations and mineralogical controls, this work provides new insights into the interplay between pore structure and gas migration pathways. The results offer an improved understanding of deep shale reservoir architecture, contributing to more accurate reservoir evaluation criteria and guiding optimized exploration and hydraulic fracturing strategies for deep shale gas development in the Sichuan Basin.
3. Materials and Methods
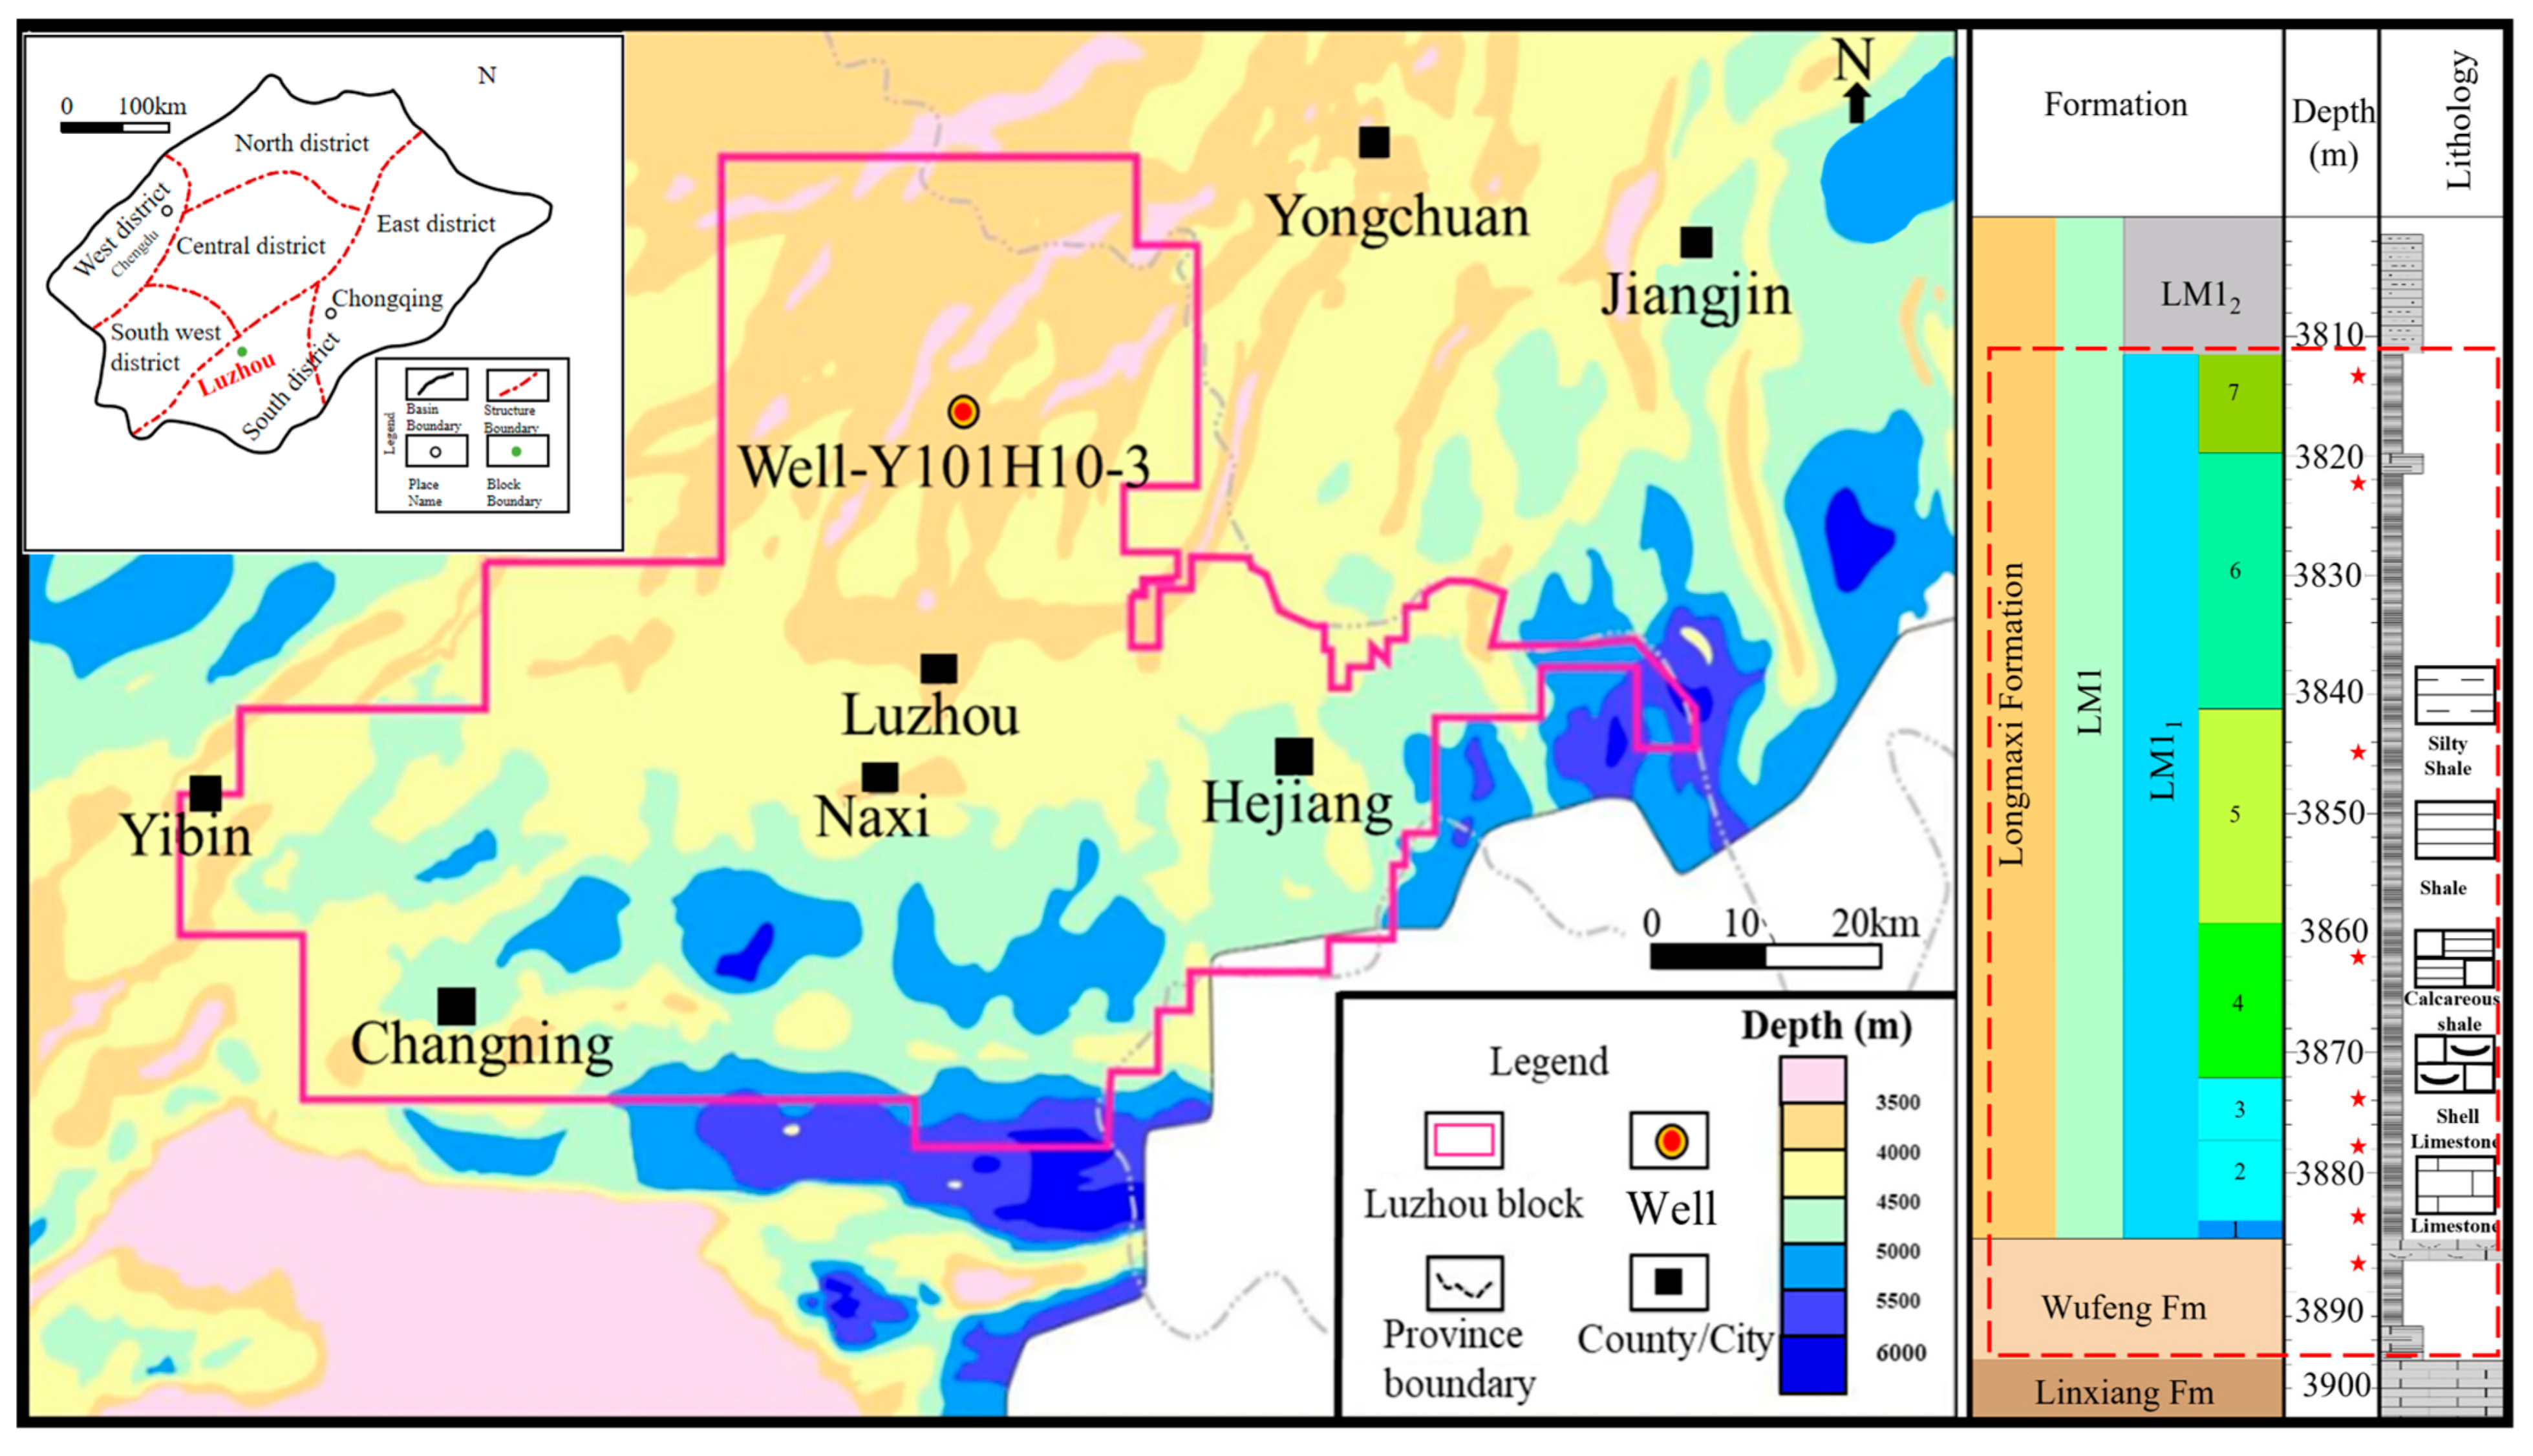
Core samples were collected from the Wufeng–Longmaxi Formation (WF-LM), LM1
11–7 of well Y-101H10-3 within the Luzhou Block, at depths ranging from 3813.82 to 3887.78 m. The total organic carbon (TOC) content of these samples ranges from 1.34% to 4.5%, with the highest organic matter concentration found in the LM1
11. In terms of mineral composition, the samples from Y-101H10-3 are primarily composed of quartz, feldspar, calcite, dolomite, pyrite, fluorapatite, and clay minerals. Quartz is the dominant mineral phase, with contents ranging from 47% to 89% in WF and LM1
13–5. LM1
14,3,7 is marked with the highest clay content, 28–51%, indicating lower brittleness and reduced reservoir quality as mentioned in
Table 1.
This study employs MAPS technology for extensive image stitching and utilizes ImageJ for the quantitative characterization of pores. NMR and MIP experiments were performed to assess pore size distribution and connectivity. This integrated approach offers a thorough evaluation of pore morphology, structure, and connectivity within the deep shale of the Wufeng–Longmaxi Formation, Luzhou Block, facilitating a more profound insight into reservoir properties.
3.1. MAPS
The application of MAPS technology has facilitated the analysis of samples ranging from the centimeter to the millimeter scale, while preserving a resolution at the nanometer scale, significantly contributing to the investigation of rock heterogeneity. MAPS technology effectively resolves the conflict between high resolution and limited field of view in traditional scanning electron microscopy, facilitating automatic high-resolution imaging of extensive analysis regions [
44]. The MAPS image of the Shale from the Longmaxi Formation covers an area of 506 μm × 506 μm, and is made up from a mosaic of hundreds of high-resolution scanning electron microscopy images. This approach allows visualization of organic matter distributions and nanoscale pore development within shale samples of millimeter-scale thickness. Image segmentation was performed in ImageJ using thresholding functions to differentiate pore structures from the mineral’s matrix. Subsequently, fractal characterization via the box-counting method was used to quantify pore complexity and morphology, enabling precise identification of pore types and pore connectivity.
3.2. High-Pressure Mercury Intrusion Porosimetry (MIP) Experiment
High-pressure mercury intrusion is the most commonly used experimental method to characterize pore structure. Since mercury can only be injected into interconnected pores, the mercury intrusion experiment reflects the pore structure of the interconnected pores. In this study, measurements were conducted using a Poremaster PM-33-13 mercury intrusion porosimeter (Autosorb iQ Analyzer, Quantachrome Instruments, Boynton Beach, FL, USA), following the industry standards SY/T5336-2006 [
54] (Conventional Analysis Methods for Core Samples) and SY/T5346-2005 [
55] (Determination of Mercury Intrusion Pressure Curves of Rock Samples). Shale samples were prepared by cutting them into 1 cm
3 cubes, drying them at 105 °C until a constant weight was achieved to remove pore moisture, and subsequently cooling them to room temperature (≈23 °C) in a desiccator maintained at a relative humidity below 10%.
3.3. Low-Field Nuclear Magnetic Resonance (NMR) Experiment
During the sedimentation process, isolated pores within the rock become saturated with formation fluids. For the NMR experiments, samples retaining their original pore fluids were further saturated with water to ensure complete pore filling. Unlike the mercury intrusion method, which characterizes only the connected pores accessible to mercury, NMR can capture the structural characteristics of both connected and isolated pores in shale. By comparing and analyzing the results of these two techniques, it is possible to qualitatively and quantitatively reveal the structural features of total pore systems as well as their interconnected pore networks [
46].
The NMR experiment was conducted on a cylindrical core sample with a diameter of 2.5 cm and a height of 3 to 6 cm. Samples were first dried in a vacuum oven at 80 °C for at least 24 h, after which their volume and weight were measured to calculate the dry density. Subsequently, the samples were saturated with 100% distilled water for at least 24 h, and their volume and weight were re-measured to calculate the wet density. Afterwards, two sets of NMR measurements were conducted, one under 100% water saturation conditions (water saturation ), and the other under optimal bound water conditions (water saturation ), gradually increasing the centrifugal force until the water content of the sample no longer decreased with increasing centrifugal force. After completing the nuclear magnetic resonance measurement of the sample under () conditions, the sample was centrifuged using a centrifuge. The optimal bound water state was obtained under a centrifuge capillary pressure of 7.26 MPa, and the nuclear magnetic resonance signal was measured under conditions. The nuclear magnetic resonance measurements were performed using the MicroMR12-040V nuclear magnetic resonance analyzer, utilizing the CPMG sequence parameters for detection.
The key to converting NMR
) spectrum into pore size distribution relies on the established correlation between relaxation time
) and pore size
), as well as signal intensity and pore volume. Conventional conversion methods for (
) relaxation, widely applied in coal and rock studies, were adopted to interpret shale NMR results in this study [
37].
spectrum data obtained from fully water-saturated () and irreducible bound water () conditions were processed to generate ) distribution curves, which were subsequently converted into cumulative ) spectra. The ) cutoff value ), representing the boundary between bound and movable fluid, was determined using a dual-projection method, which is directly related to the critical drainage pore radius ).
The relationship between the centrifugal force
) and the critical drainage pore radius
) is expressed using the Washburn equation as follows:
where
is the radius of the outflow pore at specified flow pressure, m; σ is the surface tension coefficient of water value 0.076 N/m).
θ is the contact angle between the water and the pore wall (value 60°);
is the centrifugal force, MPa. Consequently, the conversion coefficient (
relating
) to the critical drainage pore radius
) can be determined. Assuming spherical pores, the conversion factor (
is approximately three times the surface relaxation rate.
Using this conversion factor, the conversion between relaxation time
) and pore radius
) is a follows:
By determining the mass difference in the sample under dry and fully saturated conditions, the water absorption volume
) is obtained. The conversion coefficient
), which relates the water absorption volume to the difference in NMR signal intensities under saturated
)) and dry
)) conditions, is calculated as Equation (4).
The total pore volume can then be expressed as:
And the pore volume contribution corresponding to a specific relaxation time interval is given by:
Using this conversion factor, the NMR signal intensity is quantitatively related to water volume, the calculation of both total pore volume [Equation (5)] and the pore size distribution [Equation (6)] derived from the NMR () spectrum.
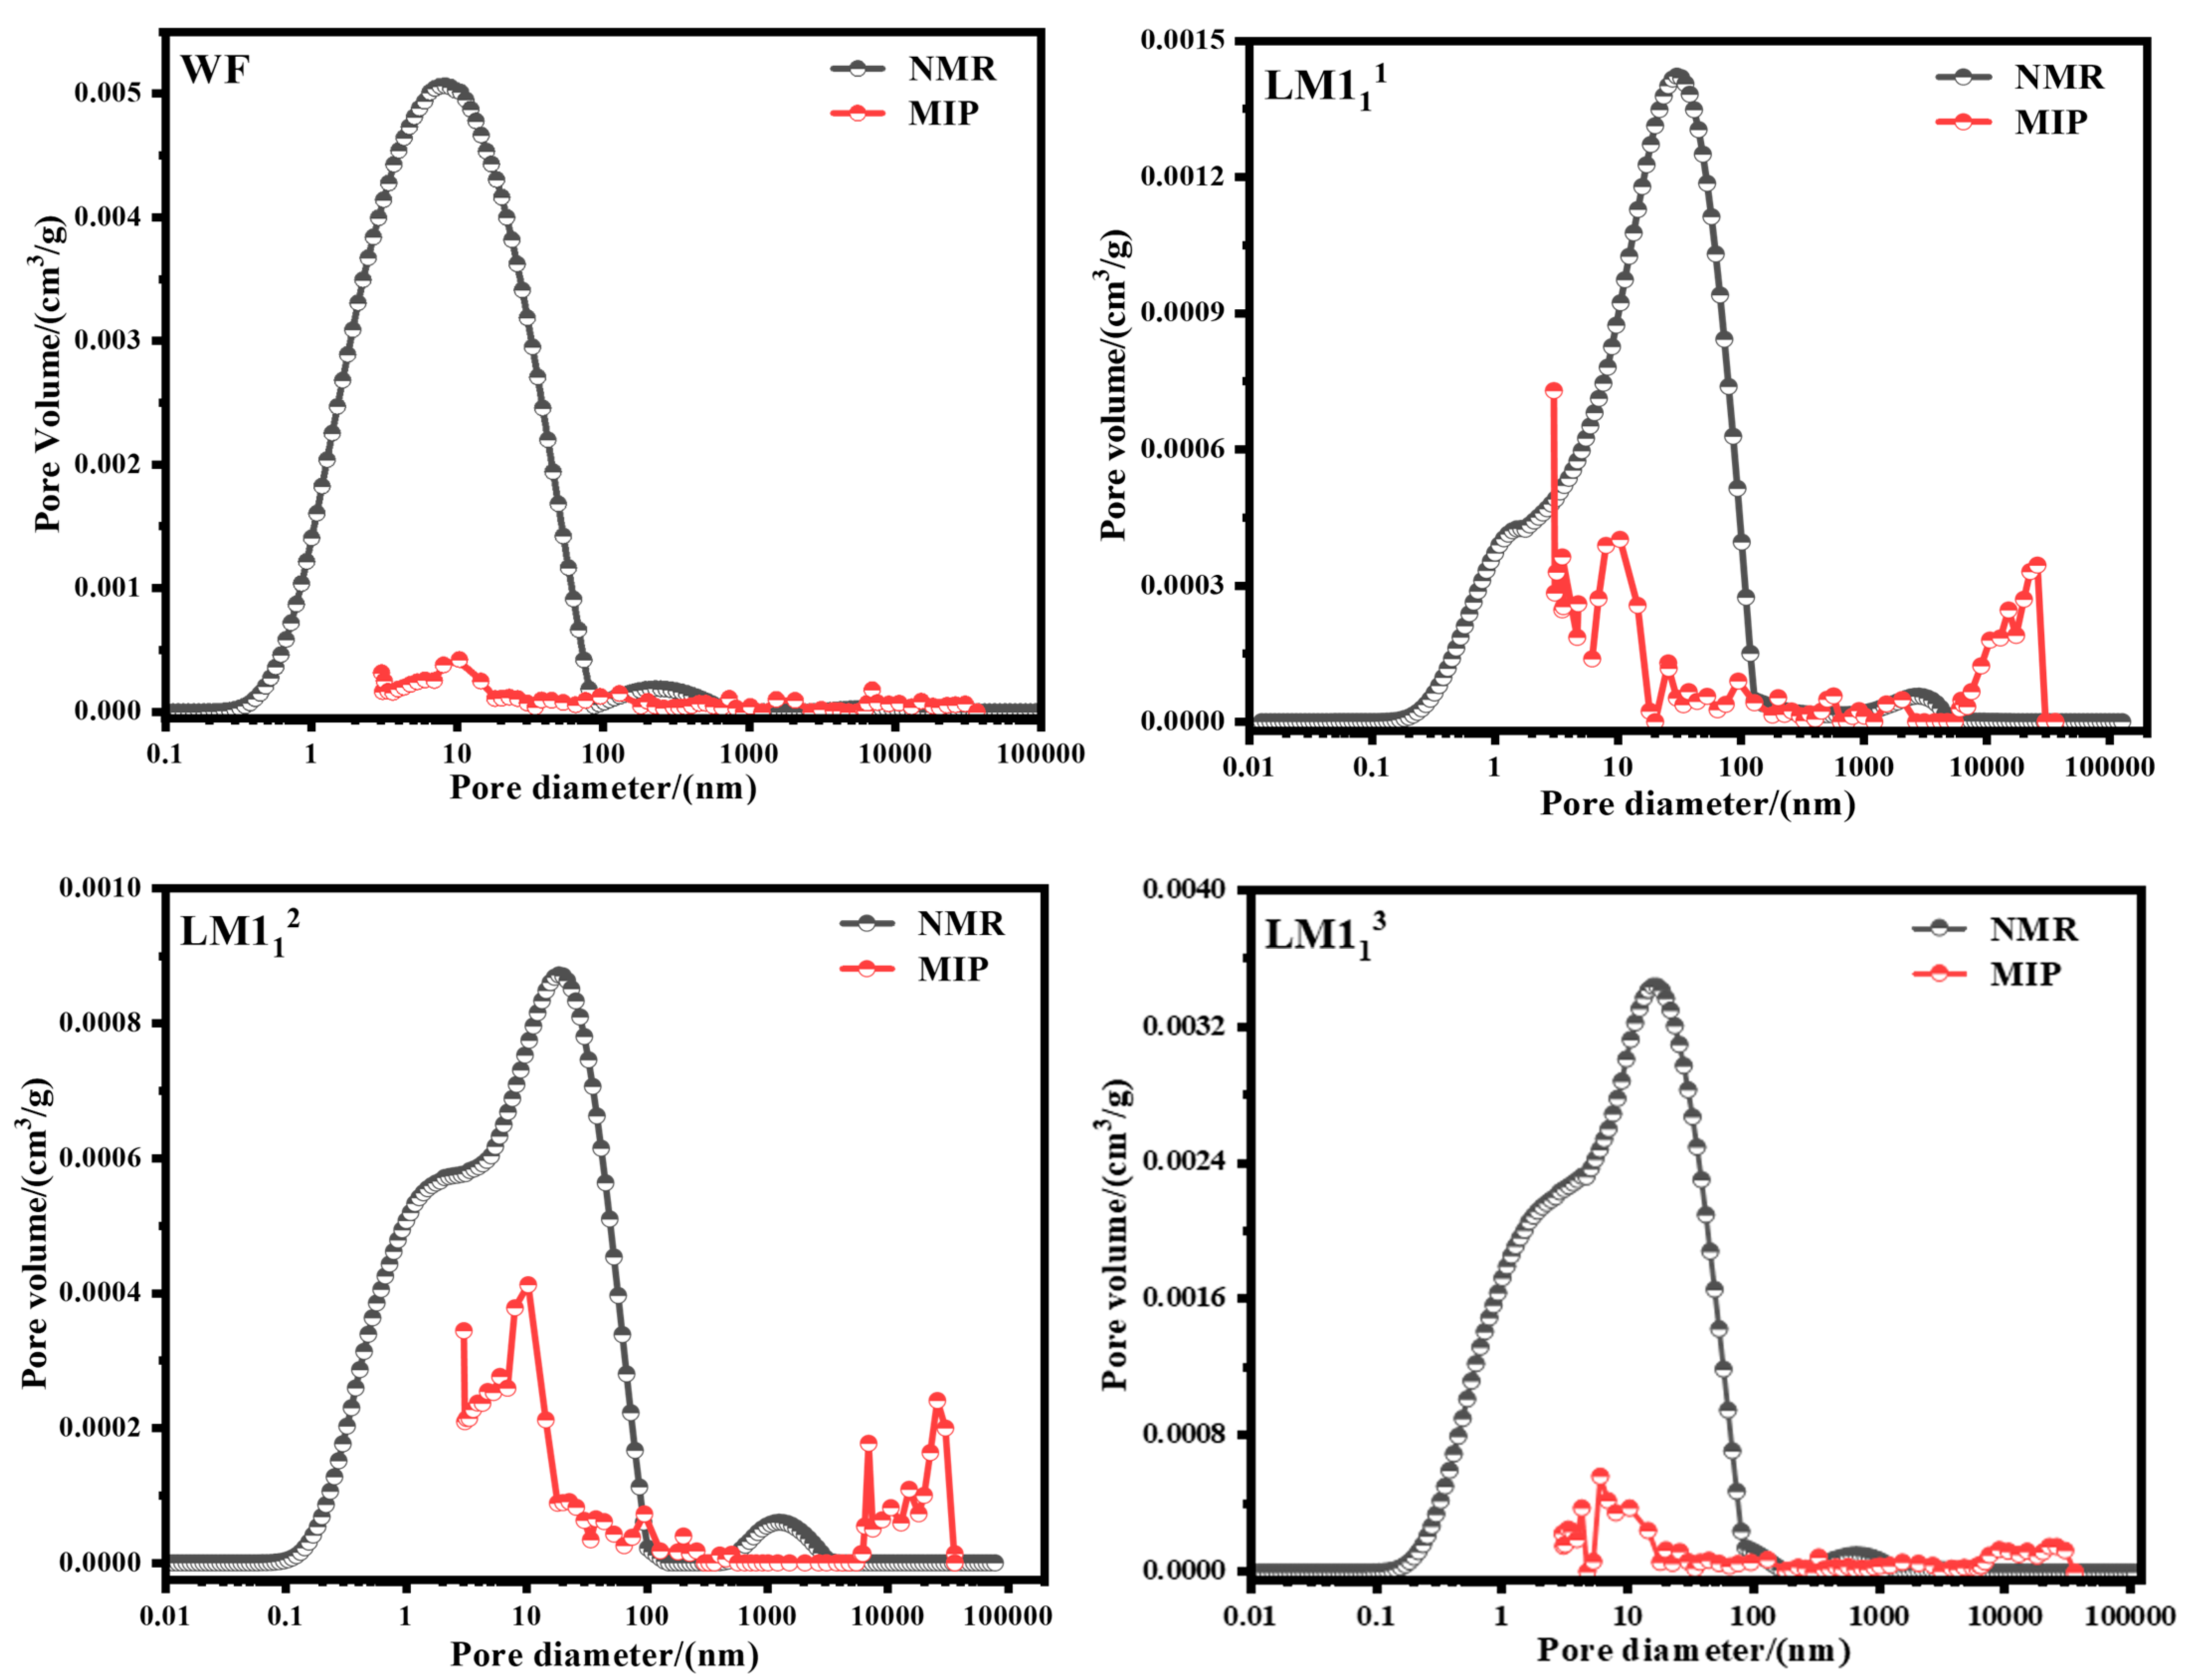
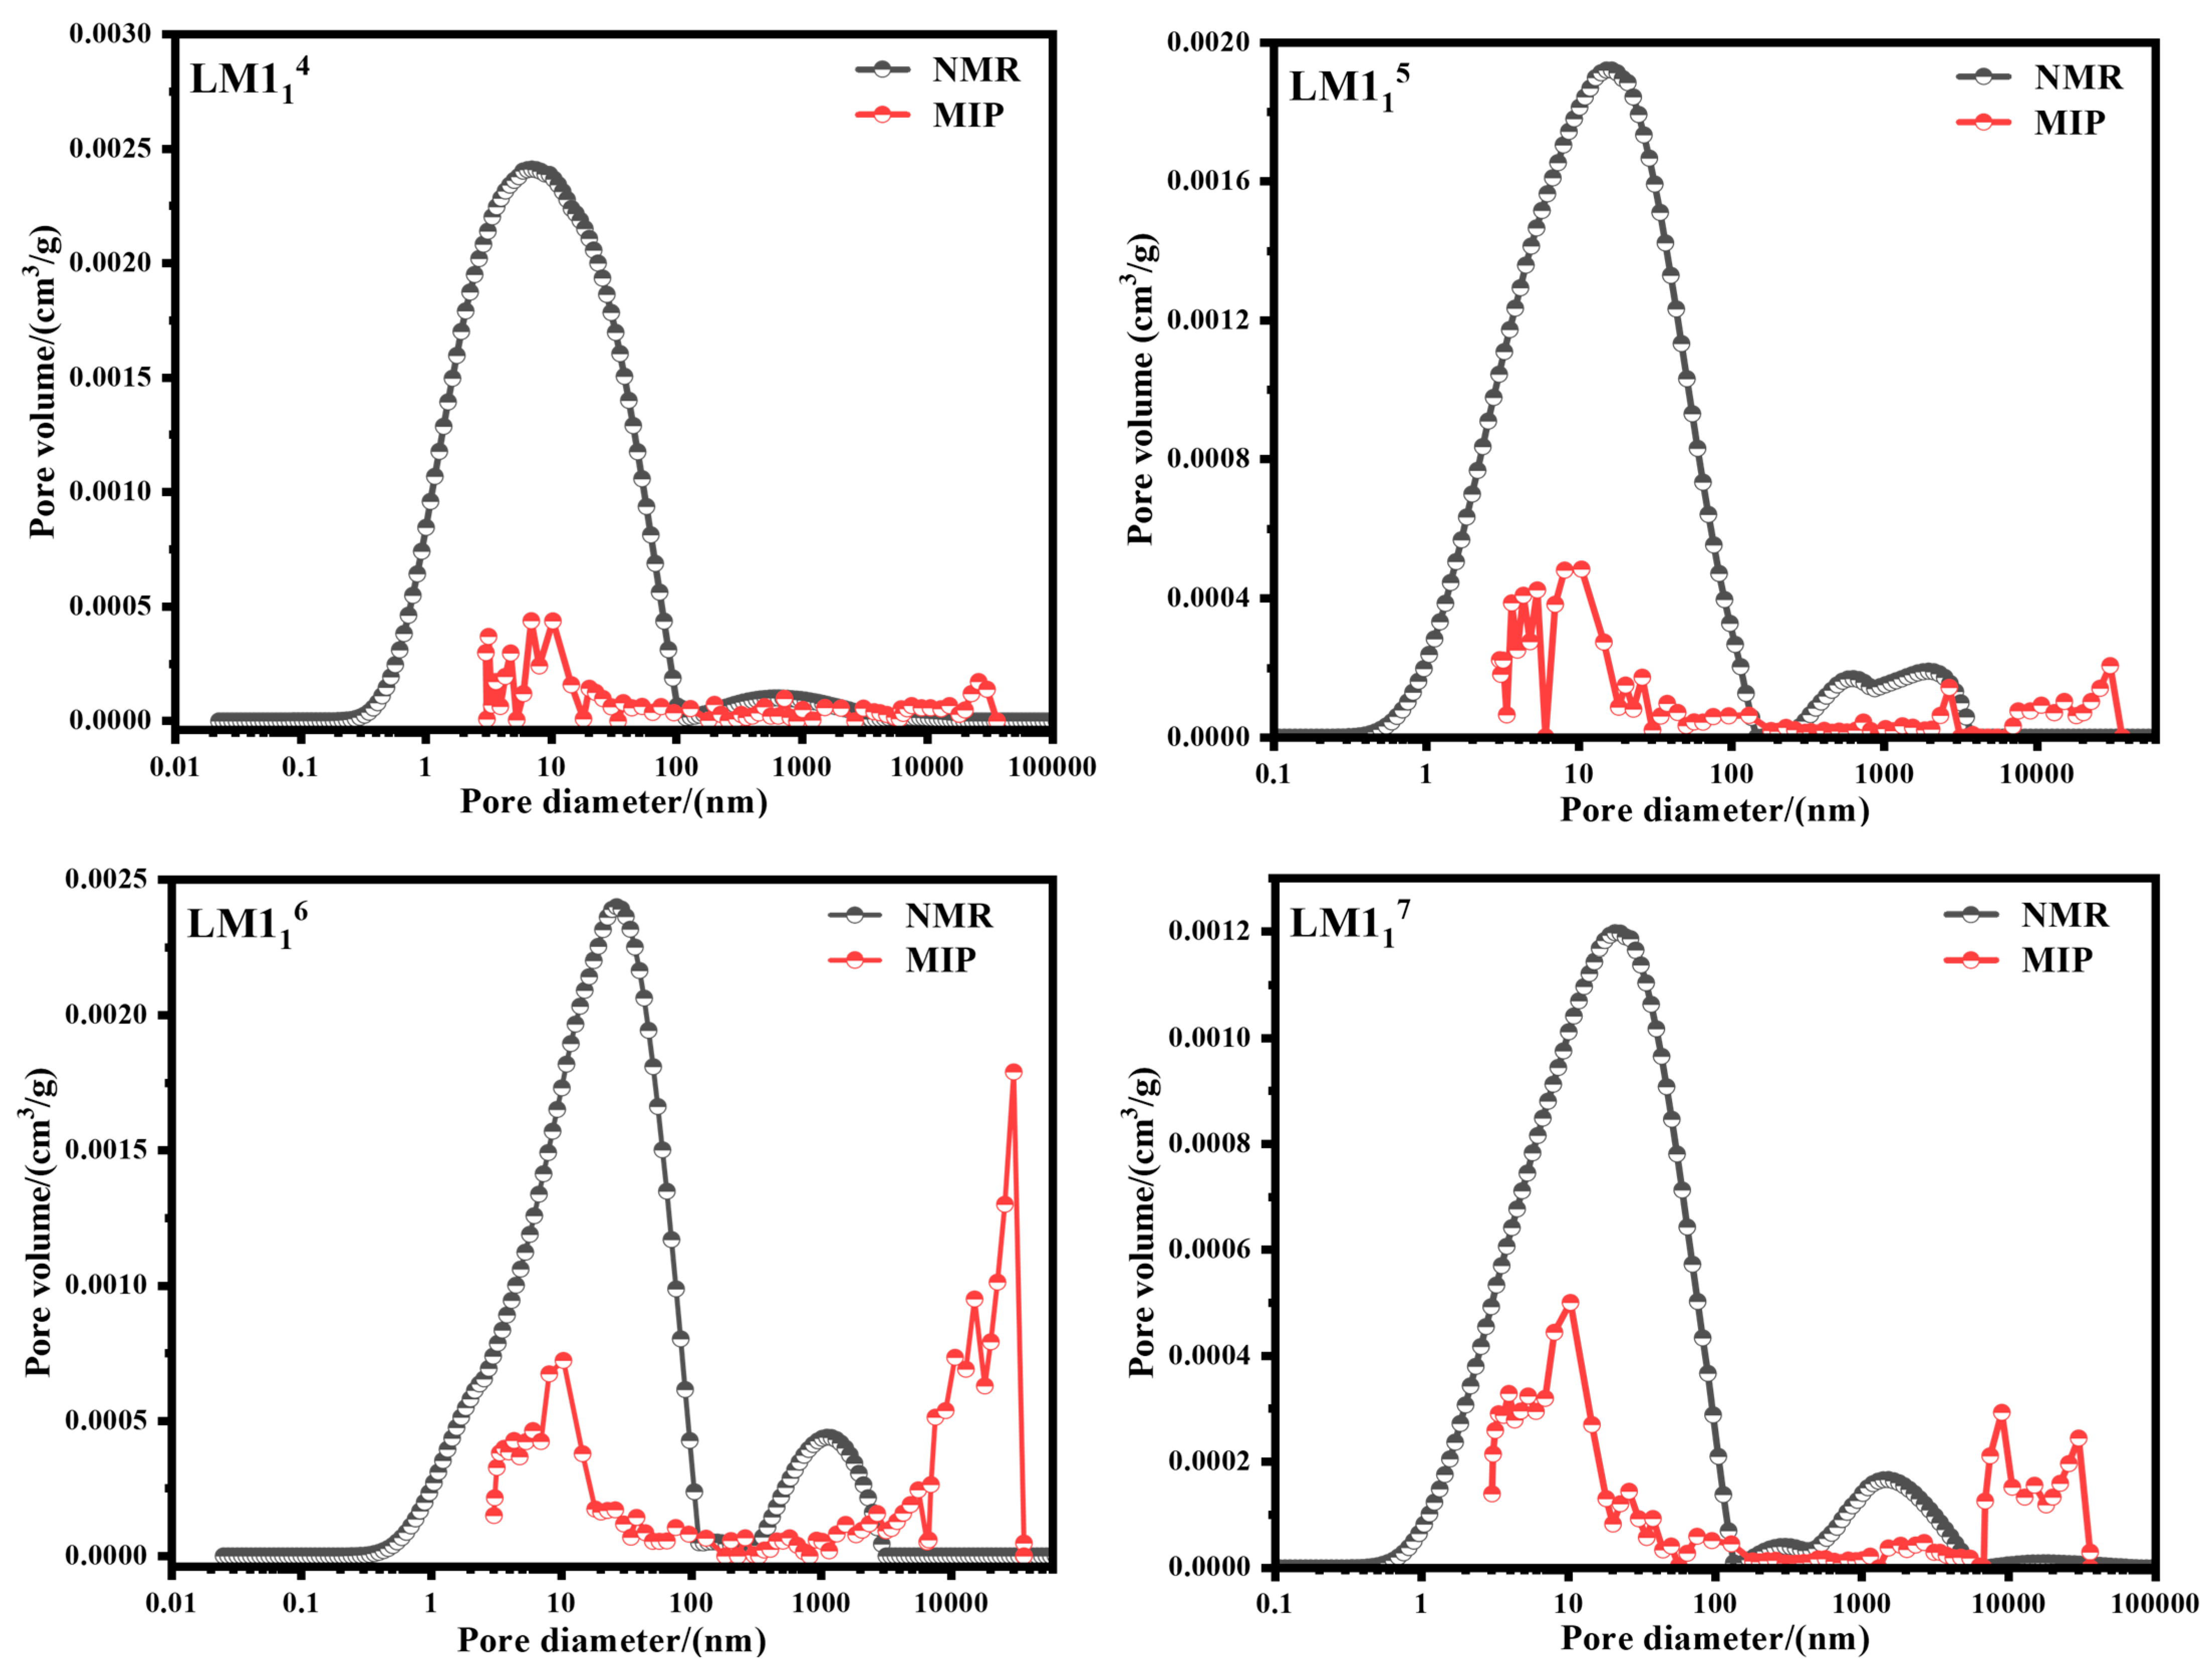
A comparison between the shale pore size distribution determined by NMR and that obtained from MIP shows distinct differences. The right-hand peak of the NMR pore size distribution lies between 1000 and 10,000 nm, which does not correspond to the right-hand peak of the MIP pore size distribution. This discrepancy arises from relaxation coupling, where water molecules carrying magnetic hydrogen nuclei diffuse between micro and macropores due to pore connectivity and thermal motion, causing coupling of NMR signals from pores of different sizes. Consequently, the peak associated with macro-pores shifts toward micropores. This coupling also provides a geophysical mechanism for qualitatively reflecting pore connectivity [
56]. Additionally, in the pore size range around 10,000 nm, the pore volume indicated by NMR is lower than that from MIP. This occurs because surface relaxation only occurs within a thin water film (0.1 µm) adjacent to the pore walls. In micropores, all water molecules are near the pore walls and undergo surface relaxation, allowing NMR to fully capture pore volume. In macropores, however, part of the water remains distant from the walls, producing weak or undetectable relaxation signals. Given that shale is dominated by micropores and macropores are sparsely developed, these effects have minimal influence on pore connectivity characterization. Overall, the pore size distribution derived from NMR (
) spectrum conversion is comparable to that obtained by MIP and is considered reliable. Furthermore, the degree of peak coupling in NMR pore size distributions provides valuable insight into pore connectivity within shale reservoirs.
4. Results
4.1. Identification of Pore Types Based on MAPS
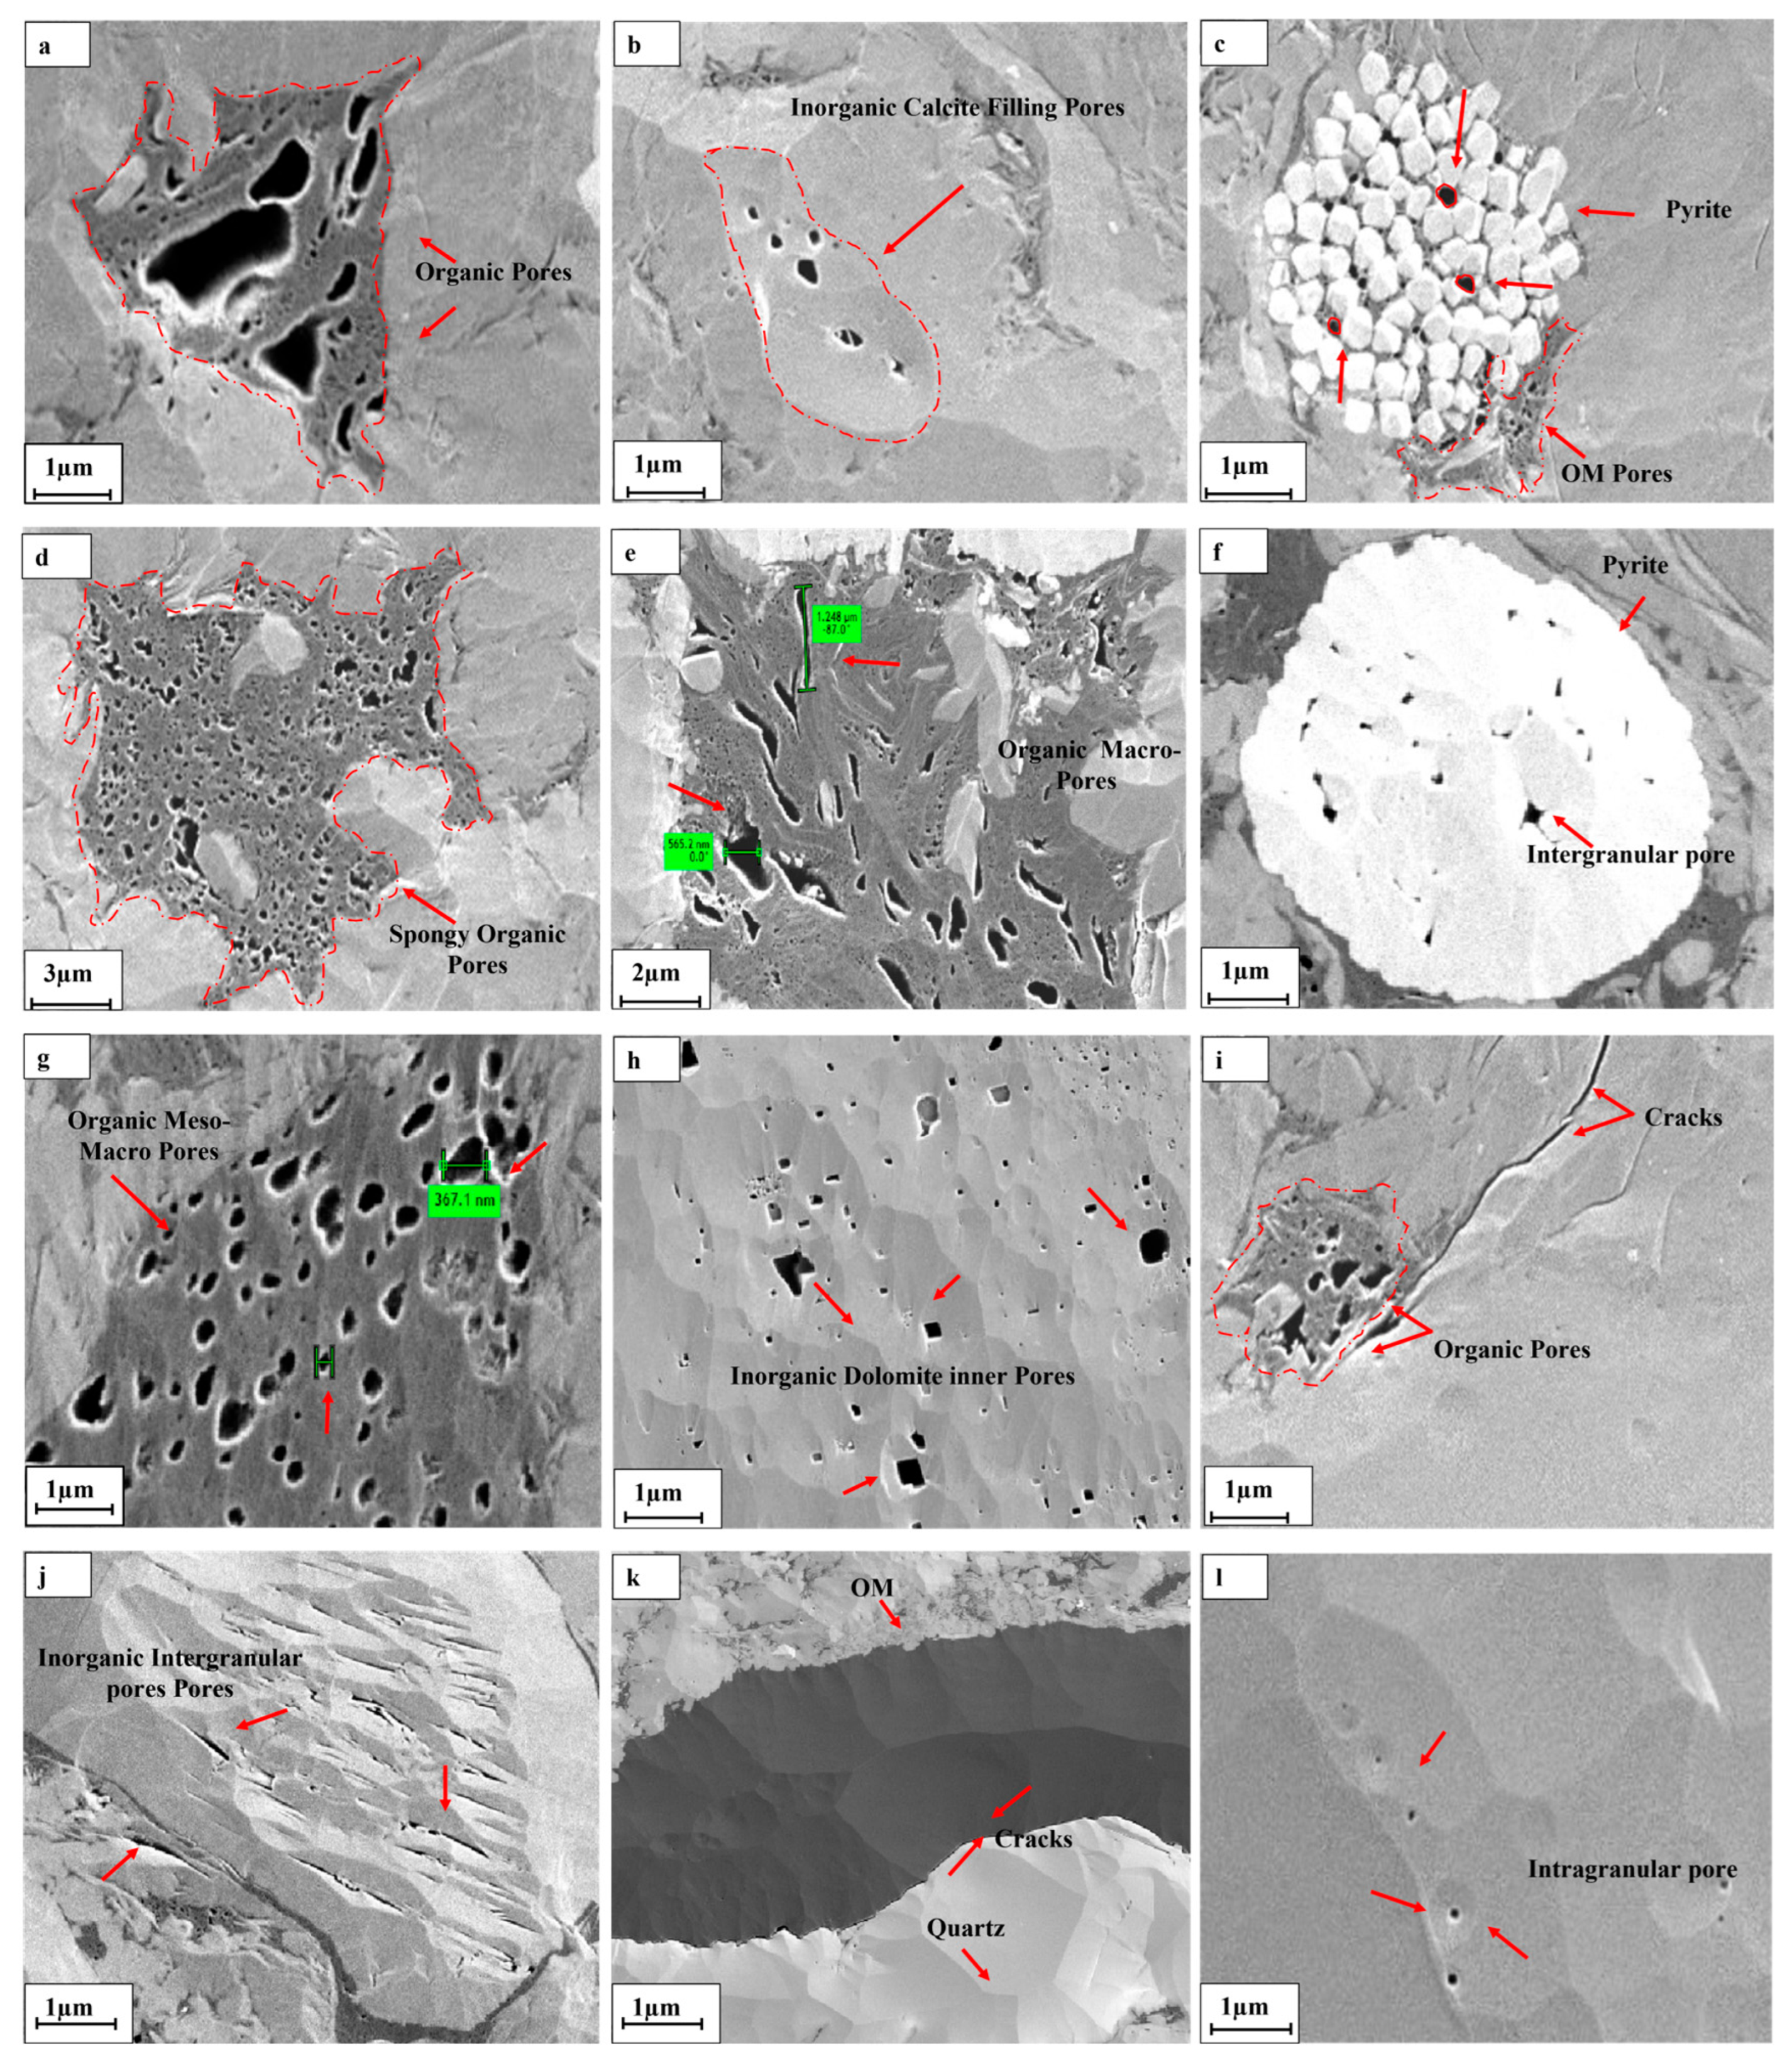
The MAPS scanning results show that the organic pores in the shale reservoir of the Luzhou block can be mainly divided into two types. The first type is sponge-like organic pores, characterized by smaller pore diameters, mostly less than 200 nm, irregular in shape, and densely developed within organic matter aggregates (
Figure 2d). The second type is bubble-like organic pores, which are larger in size, typically ranging from 400 to 650 nm, with some reaching the micron scale. These pores exhibit bubble-like, circular to sub-circular morphologies and are sparsely distributed within organic matter (
Figure 2a,e,g,i). In two-dimensional MAPS images, certain bubble-like pores display visible connectivity. Additionally, some organic matter clusters were observed to be non-porous (
Figure 2k).
Inorganic pores include intergranular pores, pyrite and calcite inner pores (
Figure 2b,f,j), inorganic dolomite inner pores (
Figure 2h), intercrystalline pores in pyrite (
Figure 2c), intragranular dissolution pores in calcite (
Figure 2l), and microfractures (
Figure 2i). Although the connectivity of inorganic mineral pores cannot be directly observed from MAPS images, it can be inferred from their spatial relationships. Dissolution and intercrystalline pores within mineral grains contribute minimally to pore connectivity, whereas intergranular pores and microfractures play a more significant role in enhancing the connectivity of the pore-fracture system in shale reservoirs.
The deep shale of the Wufeng–Longmaxi Formation is marked with complex and interconnected pore network, having organic matter, inter and intragranular mineral pores, as well as microfractures. Organic pores are most prevalent throughout the reservoir, demonstrating excellent connectivity, making them best suited for gas storage. The organic pores are primarily developed within the organic matter; however, they are often observed to be spatially associated with quartz, pyrite, and clay minerals, occurring adjacent to or between these grains due to the distribution of organic matter within the matrix. Intragranular pores, created within mineral grains, are isolated and poorly interconnected, whereas intergranular pores establish networks between clay and brittle minerals, facilitating gas migration. Microfractures connect small pores and larger fractures, enhancing shale connectivity and permeability, thereby facilitating efficient gas storage and flow.
4.2. Pore Morphology
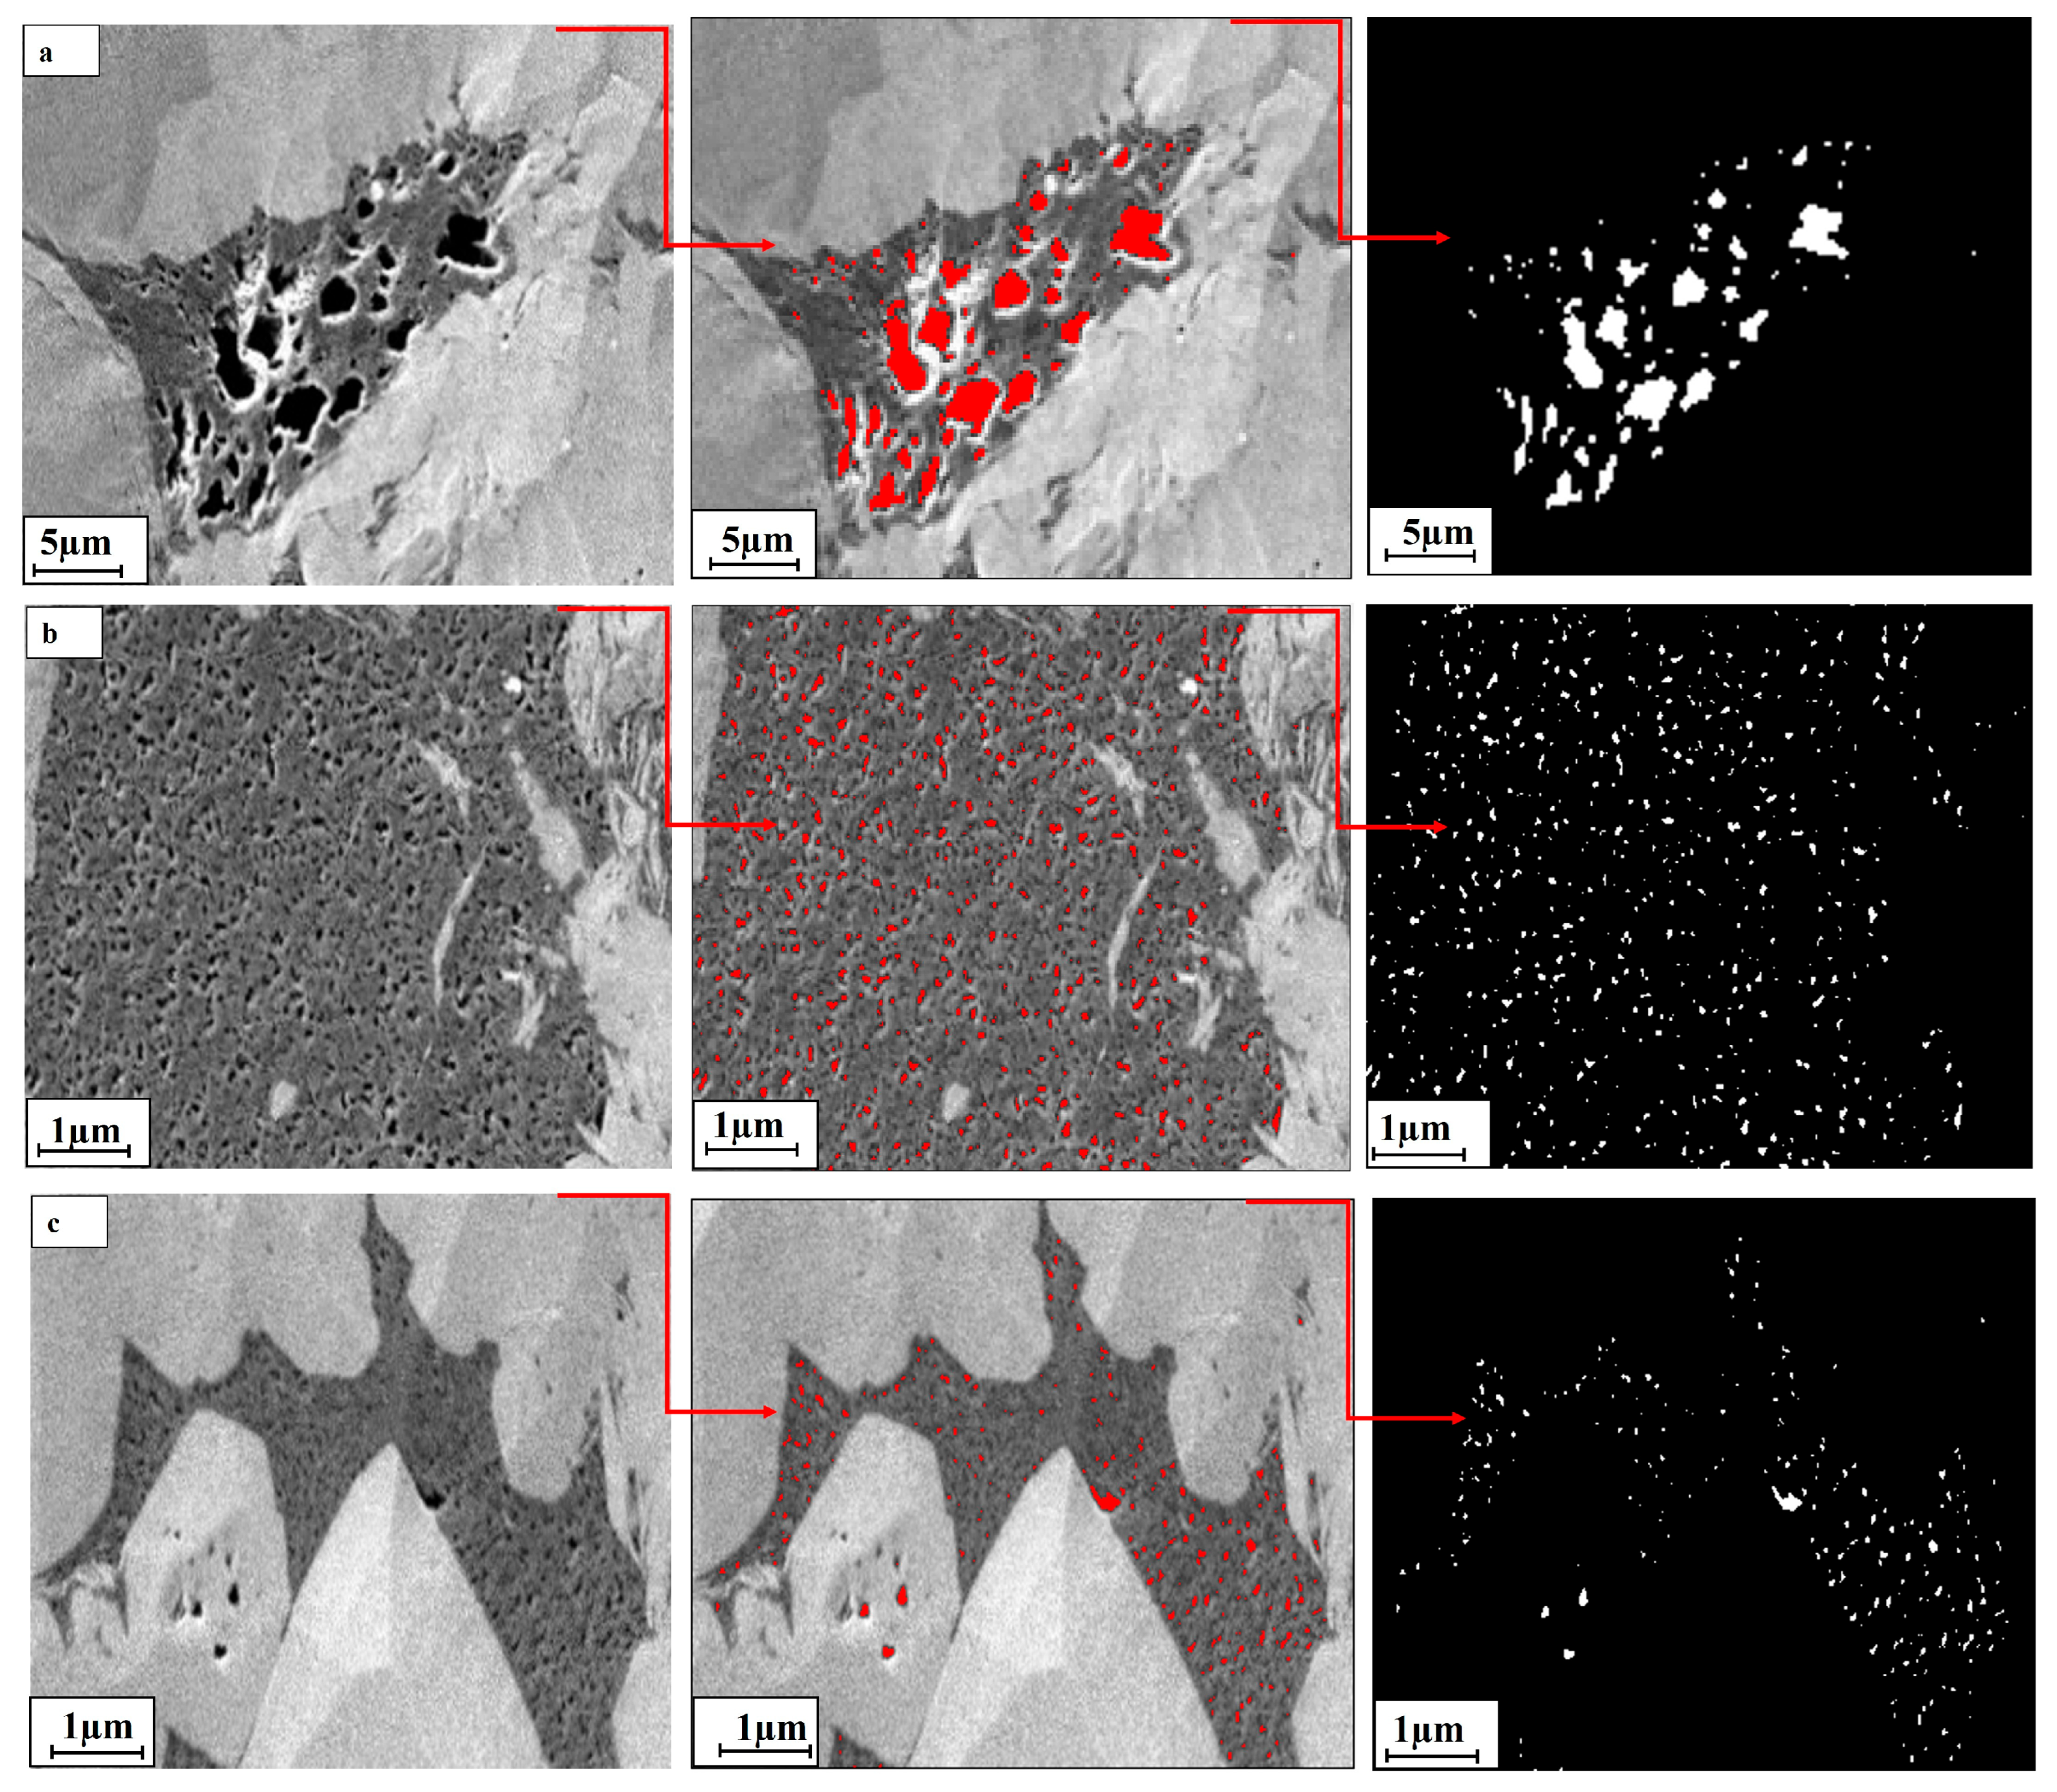
Organic pores in the study area are mostly micropores and mesopores with irregular and slit-like morphologies and strong heterogeneity. MAPS images of LM1
11 in comparison with LM1
12 and LM1
14 show that it has many organic pores in places with a lot of organic matter as shown in
Figure 3. These pores are evenly spread out and have round, elliptical, and irregular shapes.
A thorough statistical analysis of pore characteristics was performed using ImageJ to quantify and assess the contributions of different pore types in the shale reservoir. This analysis offers essential insights into the distribution, morphology, and importance of organic and inorganic pores, encompassing intergranular, intragranular, and organic-inorganic composite pores as mentioned in
Table 2.
Shale reservoirs have organic and inorganic pores, as shown by statistical analysis. The 65% organic pore area, mostly from kerogen degradation, increases gas storage capacity. Inorganic pores, including intergranular and intragranular types, contribute 35%, facilitating fluid transport and permeability [
57]. Organic pores are smaller (0.08 µm
2) and more irregular (0.72 µm
2) than inorganic pores (0.15 µm
2, 0.85), resulting from mineral composition and diagenesis [
58,
59]. Thermal maturity and hydrocarbon generation increase organic pores in deeper layers (>3500 m) [
60]. Assessing reservoir quality and hydrocarbon potential requires distinguishing these pore networks [
61].
Differentiating the organic and inorganic pore systems is important to precisely evaluate the shale gas storage and transport potential of the reservoir, governed by the reservoir quality and pore network architecture. This analysis enhances the evaluation of shale reservoir performance, based on the pore evolution, and heterogeneity.
4.3. Pore Connectivity
The shale gas migration and production efficiency demonstrated in the samples from Well Y-101H10-3 indicates the key role of pore connectivity. Gas-expansion organic pores demonstrate better connectivity as compared to the isolated sponge-like pores. Inorganic pores consisting of intergranular quartz pores and intercrystalline pyrite pores improve the connectivity within the shale matrix by acting as bridges [
62]. ImageJ technique has been widely employed to evaluate the spatial distribution of pores, revealing the significant influence of prevalent rigid minerals, i.e., quartz, and the degree of compaction on the pore connectivity [
63].
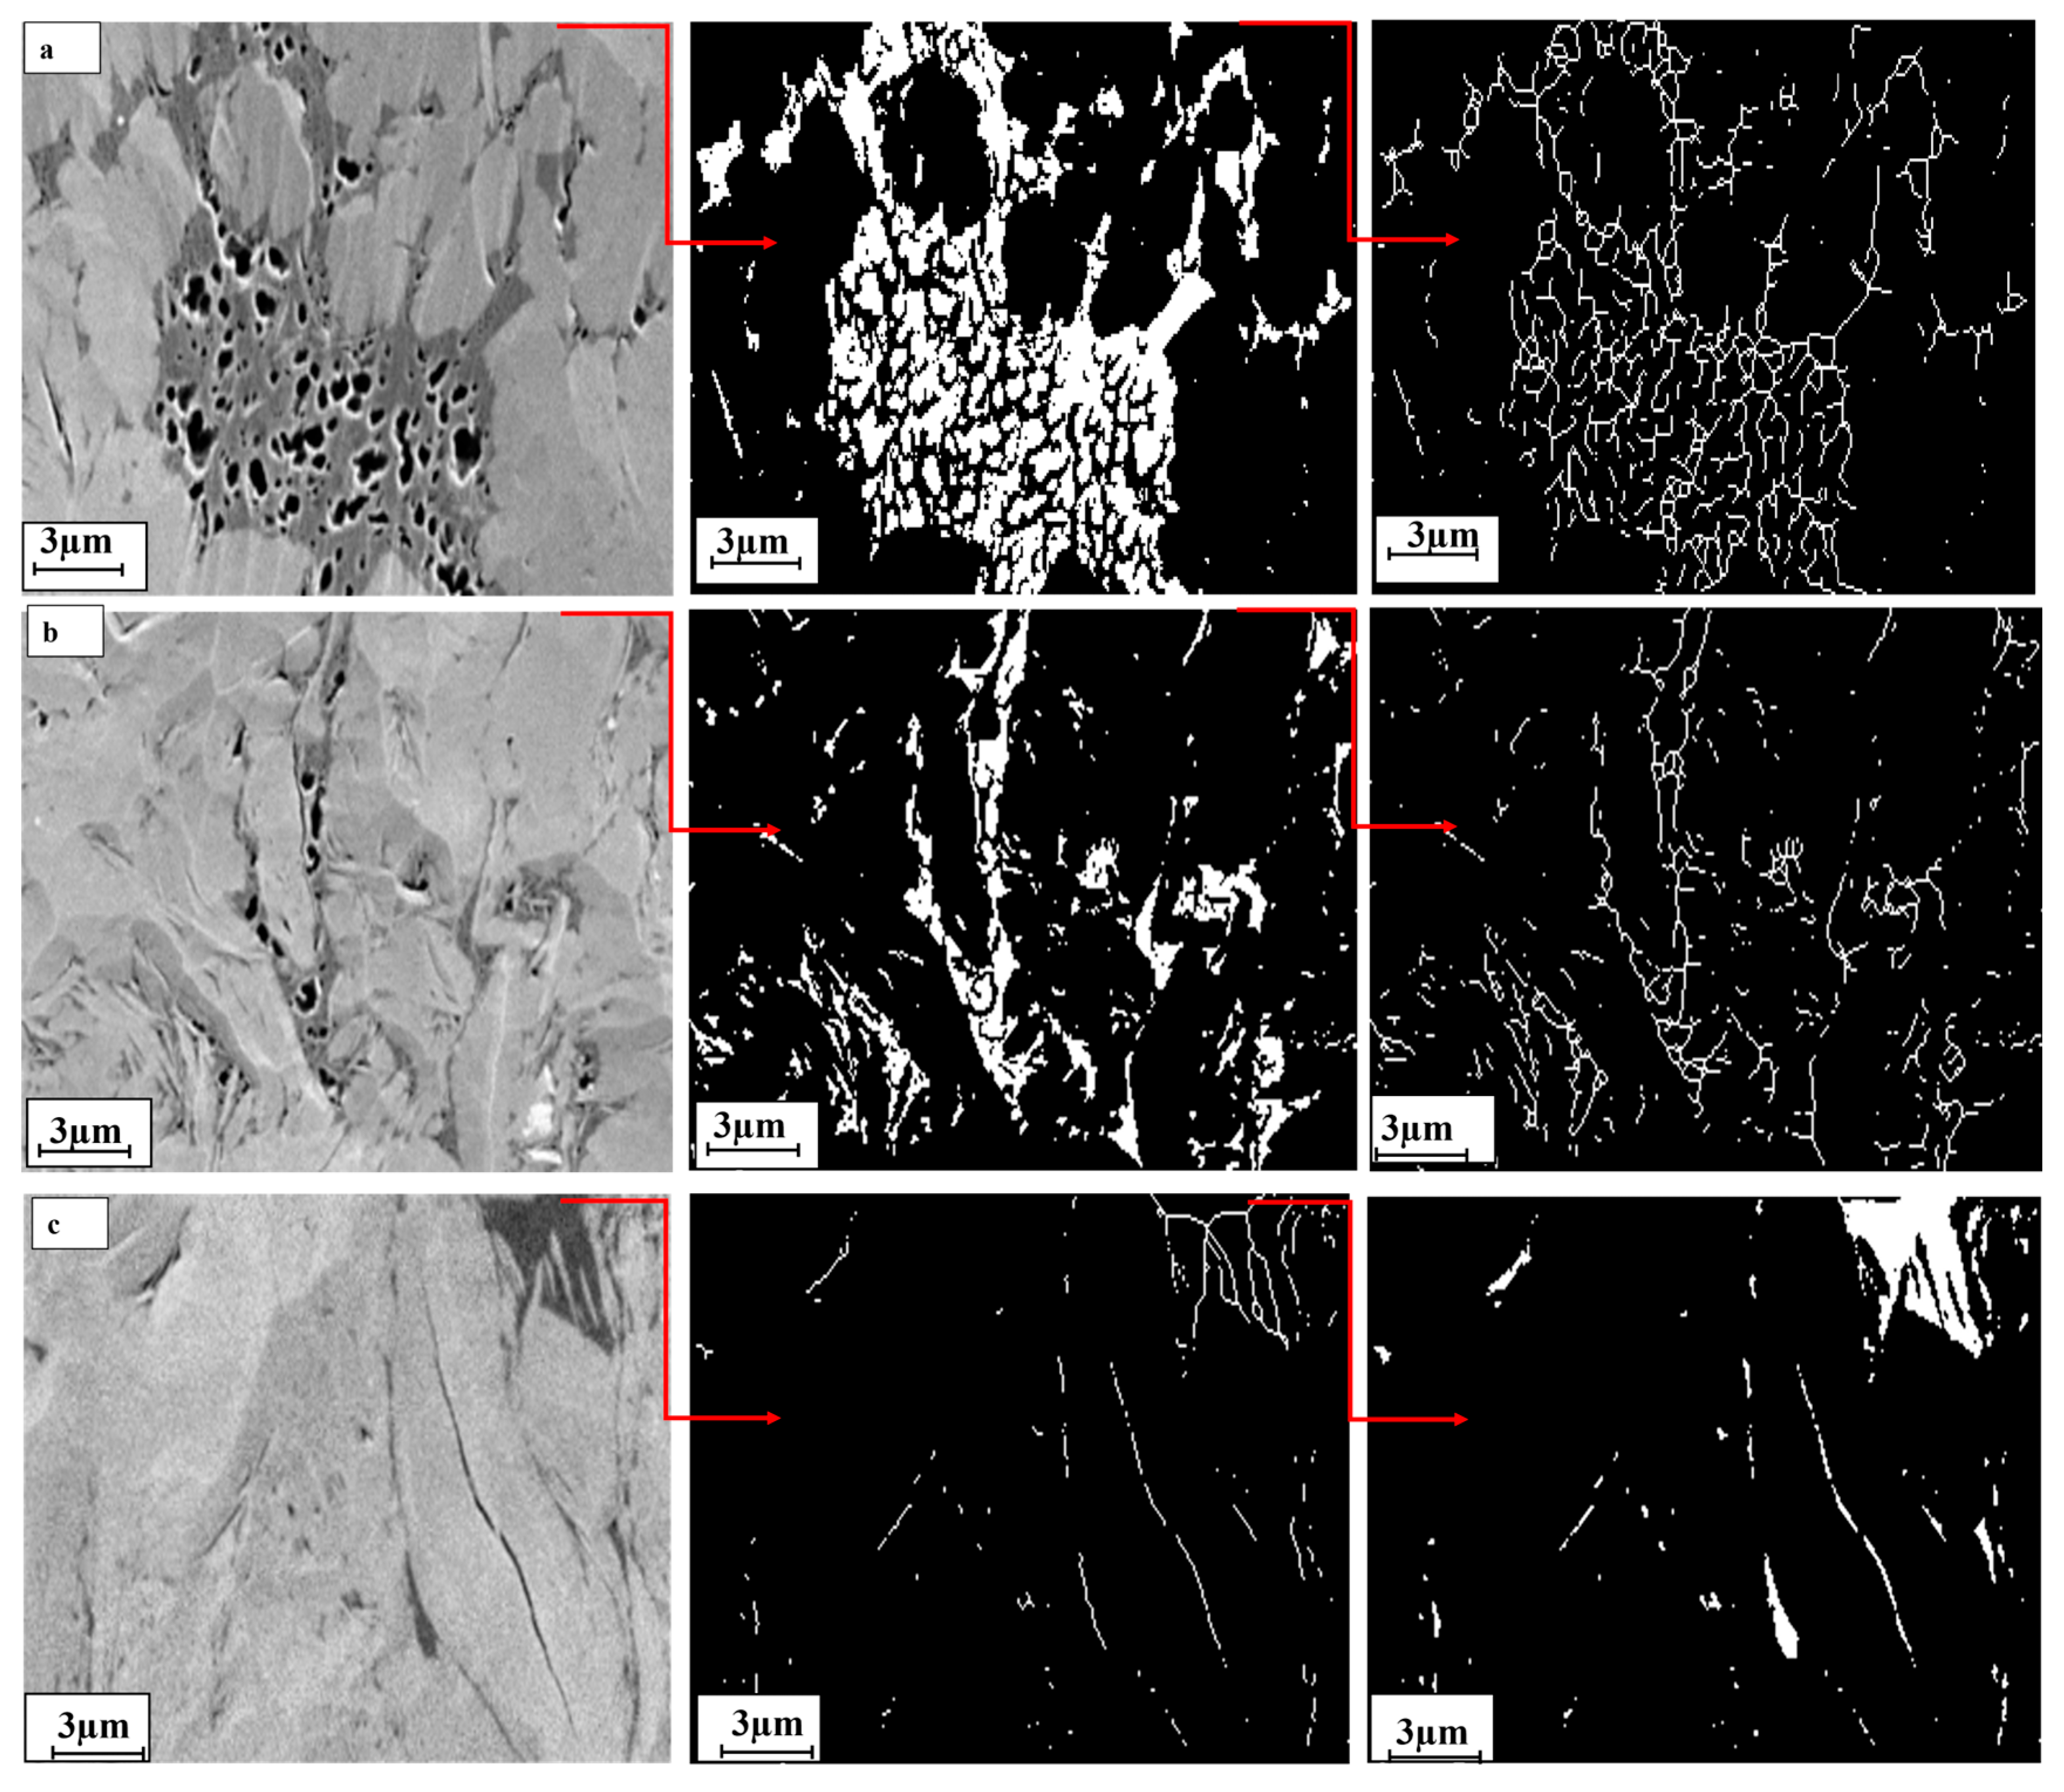
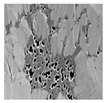
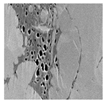
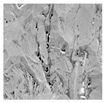
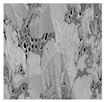
Figure 4 shows the connectivity attributes of various organic matter-hosted pores in the desired area.
The connectivity of the pore network plays a critical role in controlling fluid migration and storage behavior in shale reservoirs. In this study, pore connectivity was quantitatively analyzed across eight representative layers using binarized and skeletonized MAPS images processed in ImageJ/Fiji. Each image was pre-processed using a carefully calibrated threshold to isolate the pore structure, followed by skeletonization to convert complex pore geometries into 1-pixel-wide networks. The Skeleton Analysis (2D/3D) plugin was used to extract topological metrics, including the number of branches, number of junctions, average branch length, and the Euler characteristic, a key topological descriptor that indicates the degree of network connectedness. Euler number values closer to zero or positive imply isolated or poorly connected structures, whereas increasingly negative values reflect greater connectivity. Quantitative connectivity metrics for all layers are summarized in
Table 3.
A categorization scheme based mostly on the Euler number (χ), which represents the topological connectivity of the pore network, was adopted in order to scientifically evaluate these results. In order to indicate more complex and looping networks, layers with Euler values ≤ −5 were classified as having high connectivity. Layers with Euler numbers ≥ −1 were classified as having low connection, indicating primarily solitary or linear structures, whereas layers with values −4 to −2 were regarded as having medium connectivity. Secondary metrics like the average branch length and the number of junctions provided additional support for this classification. In particular, an Euler number ≤ −5, an average branch length ≥ 16, and a junction count ≥ 7 are all indicative of good connectivity. The range of Euler numbers for medium connectivity is −4 to −2, with an average branch length of 14–15.9, and a junction count of 4–6. Layers with Euler numbers ≥ −1, branch lengths < 14, and junction counts ≤ 3 are considered to have low connectivity. The threshold values for this classification are provided in
Table 3.
These findings from the MAPS analysis suggest that fully interconnected pore networks are absent at the micron scale, probably as a result of resolution constraints. The MAPS technique exhibits high precision, characterized by a spatial resolution limit of 2.5 nm, which requires the selection of diminutive scanning areas. Nonetheless, these randomly selected small regions may not inherently possess interconnected pores and fractures within the rock body. Despite this limitation, scans and modeling results of various samples indicate the existence of numerous locally interconnected pores within the shale matrix, predominantly composed of organic matter pores.
Figure 4b illustrates typical disconnected pores, exhibiting an isolated pore porosity of 4.72%. The pores exhibit a predominantly round to sub-round morphology and maintain a relatively uniform diameter, resembling isolated, non-communicating sponge-like organic matter pores in three-dimensional space.
Figure 4c demonstrates characteristic interconnected pores, featuring an isolated pore porosity of 0.26%, and
Figure 4a shows interconnected pore porosity of 8.27%. The pores exhibit an uneven size distribution and present sub-round to sub-ellipsoid shapes, characterized by irregular, bubble-like outgrowths that show strong connectivity.
4.4. Fractal Characterization of Pore Structure
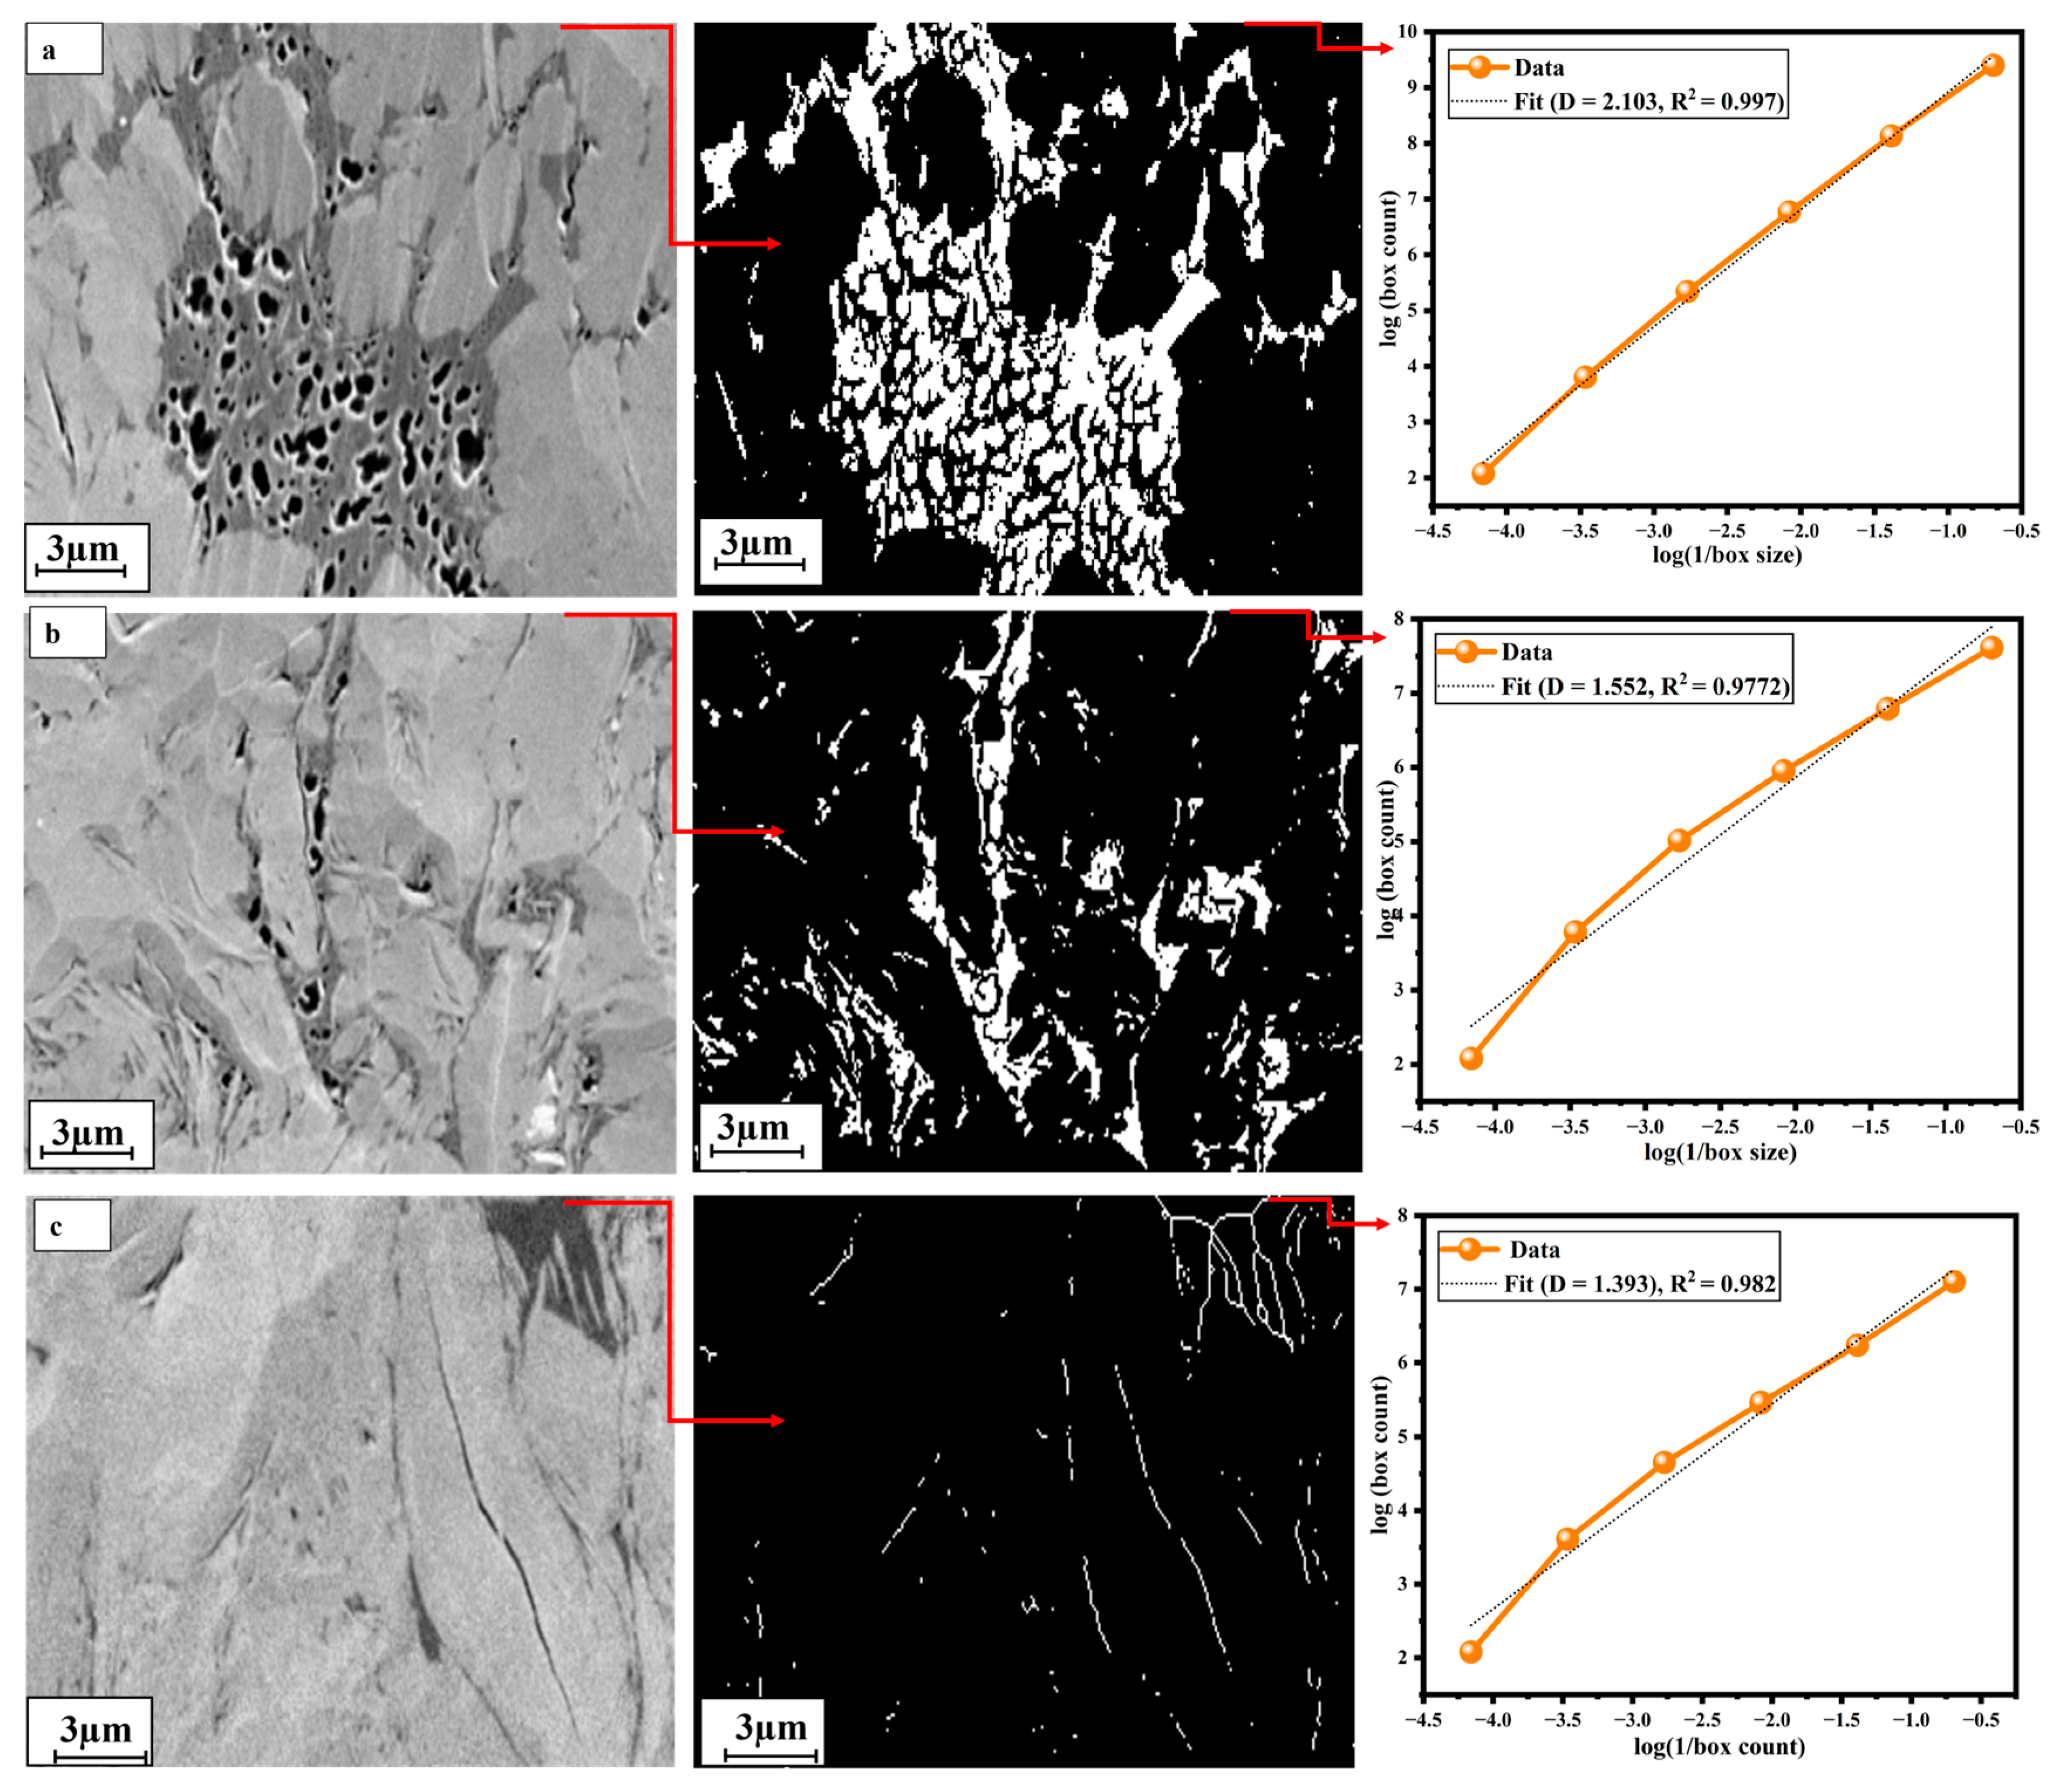
The fractal geometry of pore networks in shale provides a quantitative measurement of the irregularity, complexity, and spatial distribution of pores at multiple scales. In this study, the box-counting method was applied to binarized SEM/MAPS images using ImageJ (Fiji) to calculate the fractal dimension (D) of pore structures across representative layers (
Figure 5). The fractal analysis allows us to understand the self-similarity and roughness of the pore networks, which are critical for fluid storage and migration in shale formations.
Each layer was represented by a single high-resolution 2D grayscale MAPS image. These images were binarized to isolate pore space (pores = white, matrix = black), and processed via the box-counting plugin in ImageJ, where successive grids of decreasing box size were overlaid on the pore structures. The number of boxes (N) containing pore pixels was counted for each box size (ε), and log(N) vs. log(1/ε) plots were generated. The slope of the linear portion of this plot was taken as the fractal dimension D, and the coefficient of determination (R2) was computed to assess the goodness of fit.
This method is robust for assessing geometric irregularities in pore structures and is widely used in digital rock physics and petrophysical studies and the interpreted results are given in
Table 4.
This gradual decline in D from upper to lower layers suggests a reduction in pore complexity and connectivity, likely due to diagenetic compaction, organic matter degradation, or mineral precipitation.
Moreover,
Table 4 shows that the trend of D values varies, and the values of R
2 confirm the statistical reliability of the box-counting method. These graphs provide visual evidence of heterogeneous pore architecture throughout the shale profile.
The calculated fractal dimensions complement the pore connectivity results from ImageJ’s skeleton analysis and correlate well with NMR and MIP data (discussed in
Section 4.5 and
Section 4.6). Layers with higher D values, including LM1
11: D = 1.835, exhibited higher connectivity and potential for hydrocarbon migration, whereas the lower D value of LM1
14: D = 1.440 suggested restricted flow pathways.
4.5. MIP-Pore Size Distribution
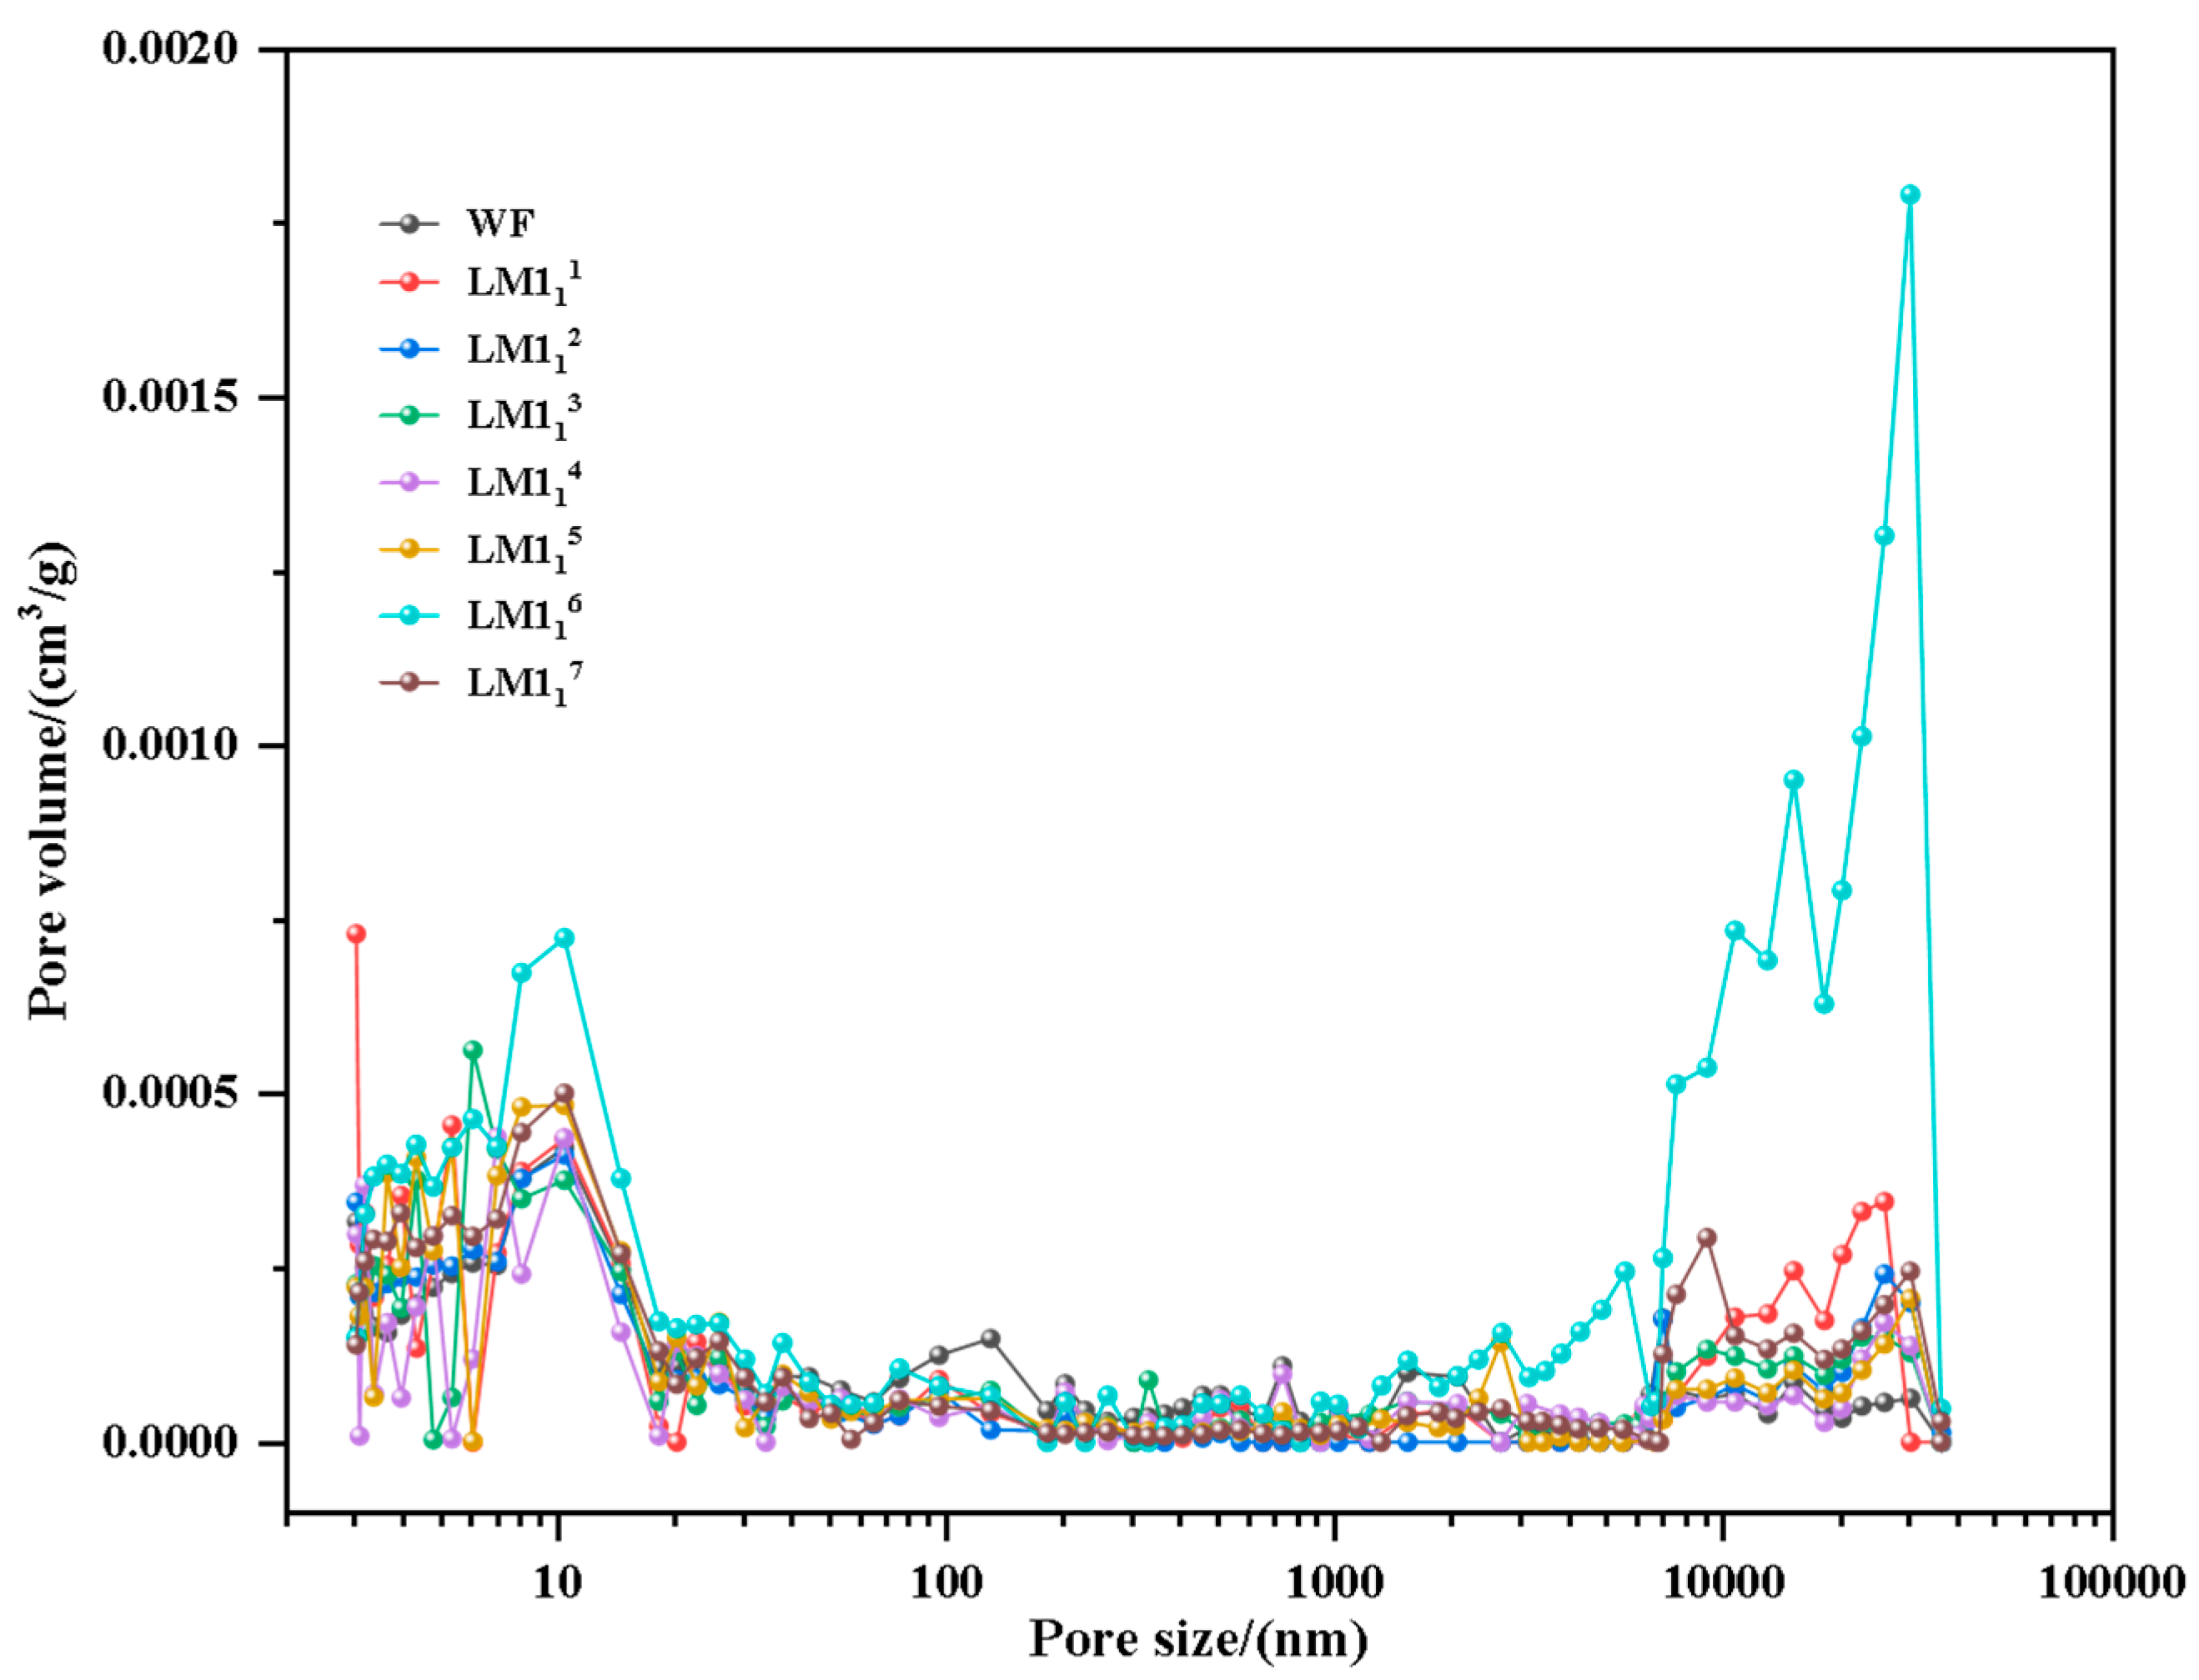
The mercury intrusion porosimetry (MIP) analysis of shale samples from Well Y-101H10-3 shows a bimodal pore size distribution, with micropores ranging from 3 to 50 nm and macropores exceeding 10,000 nm (
Figure 6). This bimodal pattern indicates the coexistence of nanopores and macropores, reflecting a dual-scale pore network within the shale matrix. The significant volume of large pores is likely linked to microfracture development, which enhances pore connectivity and contributes to improved reservoir permeability. These findings align with prior research on the Longmaxi Formation in the Luzhou block, underscoring the consistent pore structure characteristics across this region and supporting favorable reservoir conditions for shale gas storage and transport. The interacting micropores, mesopores, and macropores, and the micro-fracture development potential, indicate the complexity of the reservoir system in Well Y-101H10-3 as well as its capacity for improved gas recovery.
4.6. NMR-Pore Size Distribution
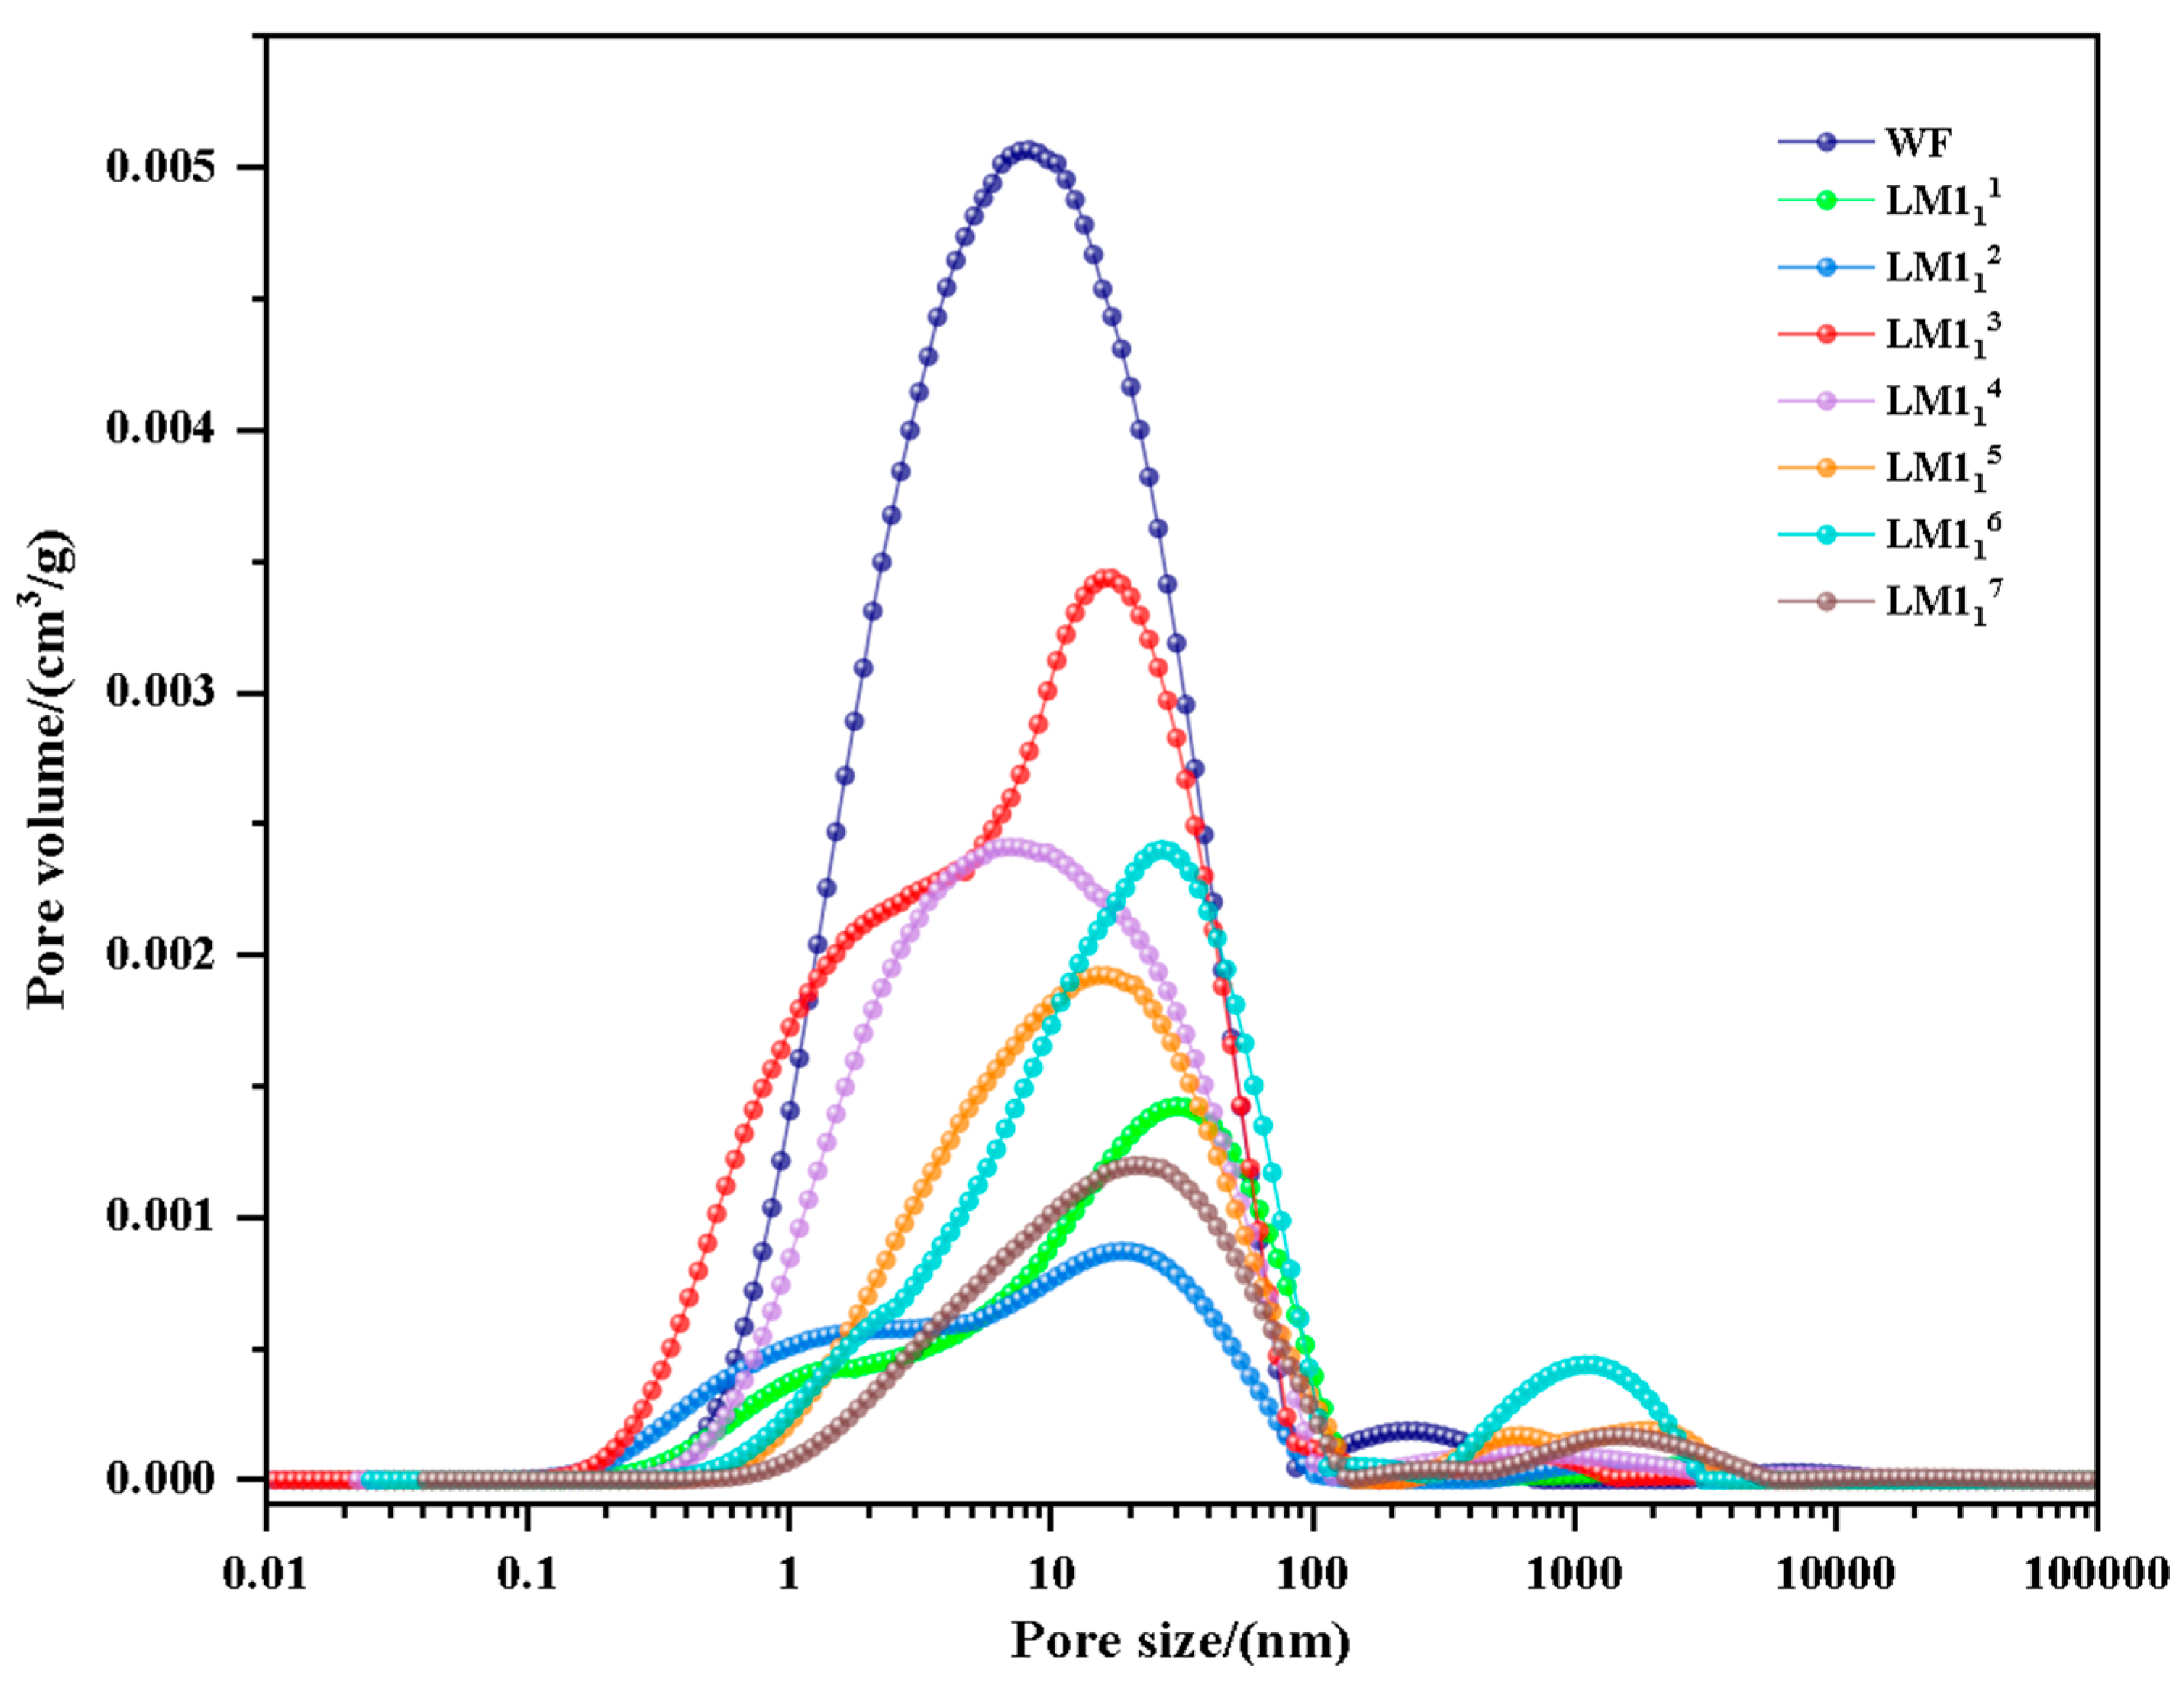
The low-field NMR pore size distribution of shale samples from the well Y-101H10-3 exhibits bimodal to trimodal patterns (
Figure 7), with pore sizes ranging from 0.1 to 5000 nm. The primary pore size peaks are intervals that range from 1 to 100 nm (micropores) and the 200 to 2000 nm range (mesopores). Among these, micropores (1–100 nm) contribute the largest proportion of the total pore volume, indicating that micropores play a dominant role in the shale reservoir’s storage capacity.
Notably, samples from the Wufeng Formation show the highest pore volume contribution from micropores (1–100 nm), suggesting that this interval serves as a key storage zone for adsorbed gas. In contrast, larger mesopores (200–2000 nm) exhibit reduced peak heights with increasing burial depth, implying a gradual decrease in larger pore volume likely caused by compaction and diagenesis.
5. Discussion
The NMR T2 spectrum patterns and MAPS scanning results provide qualitative insights into the pore connectivity characteristics of shale, whereas mercury intrusion porosimetry (MIP) experiments provide quantitative measurements, including the number of connected pore volumes and porosity. The ImageJ analysis complements these methods by enabling quantitative evaluation of pore morphology and structure. Comparative analysis of pore connectivity characteristics across NMR, MAPS, and MIP demonstrates a strong correlation among these methods. By establishing appropriate thresholds for connected pore volume and connected porosity, shale sublayers can be classified systematically, thereby elucidating connectivity modes and differences across the reservoir.
5.1. Pore Connectivity Classification
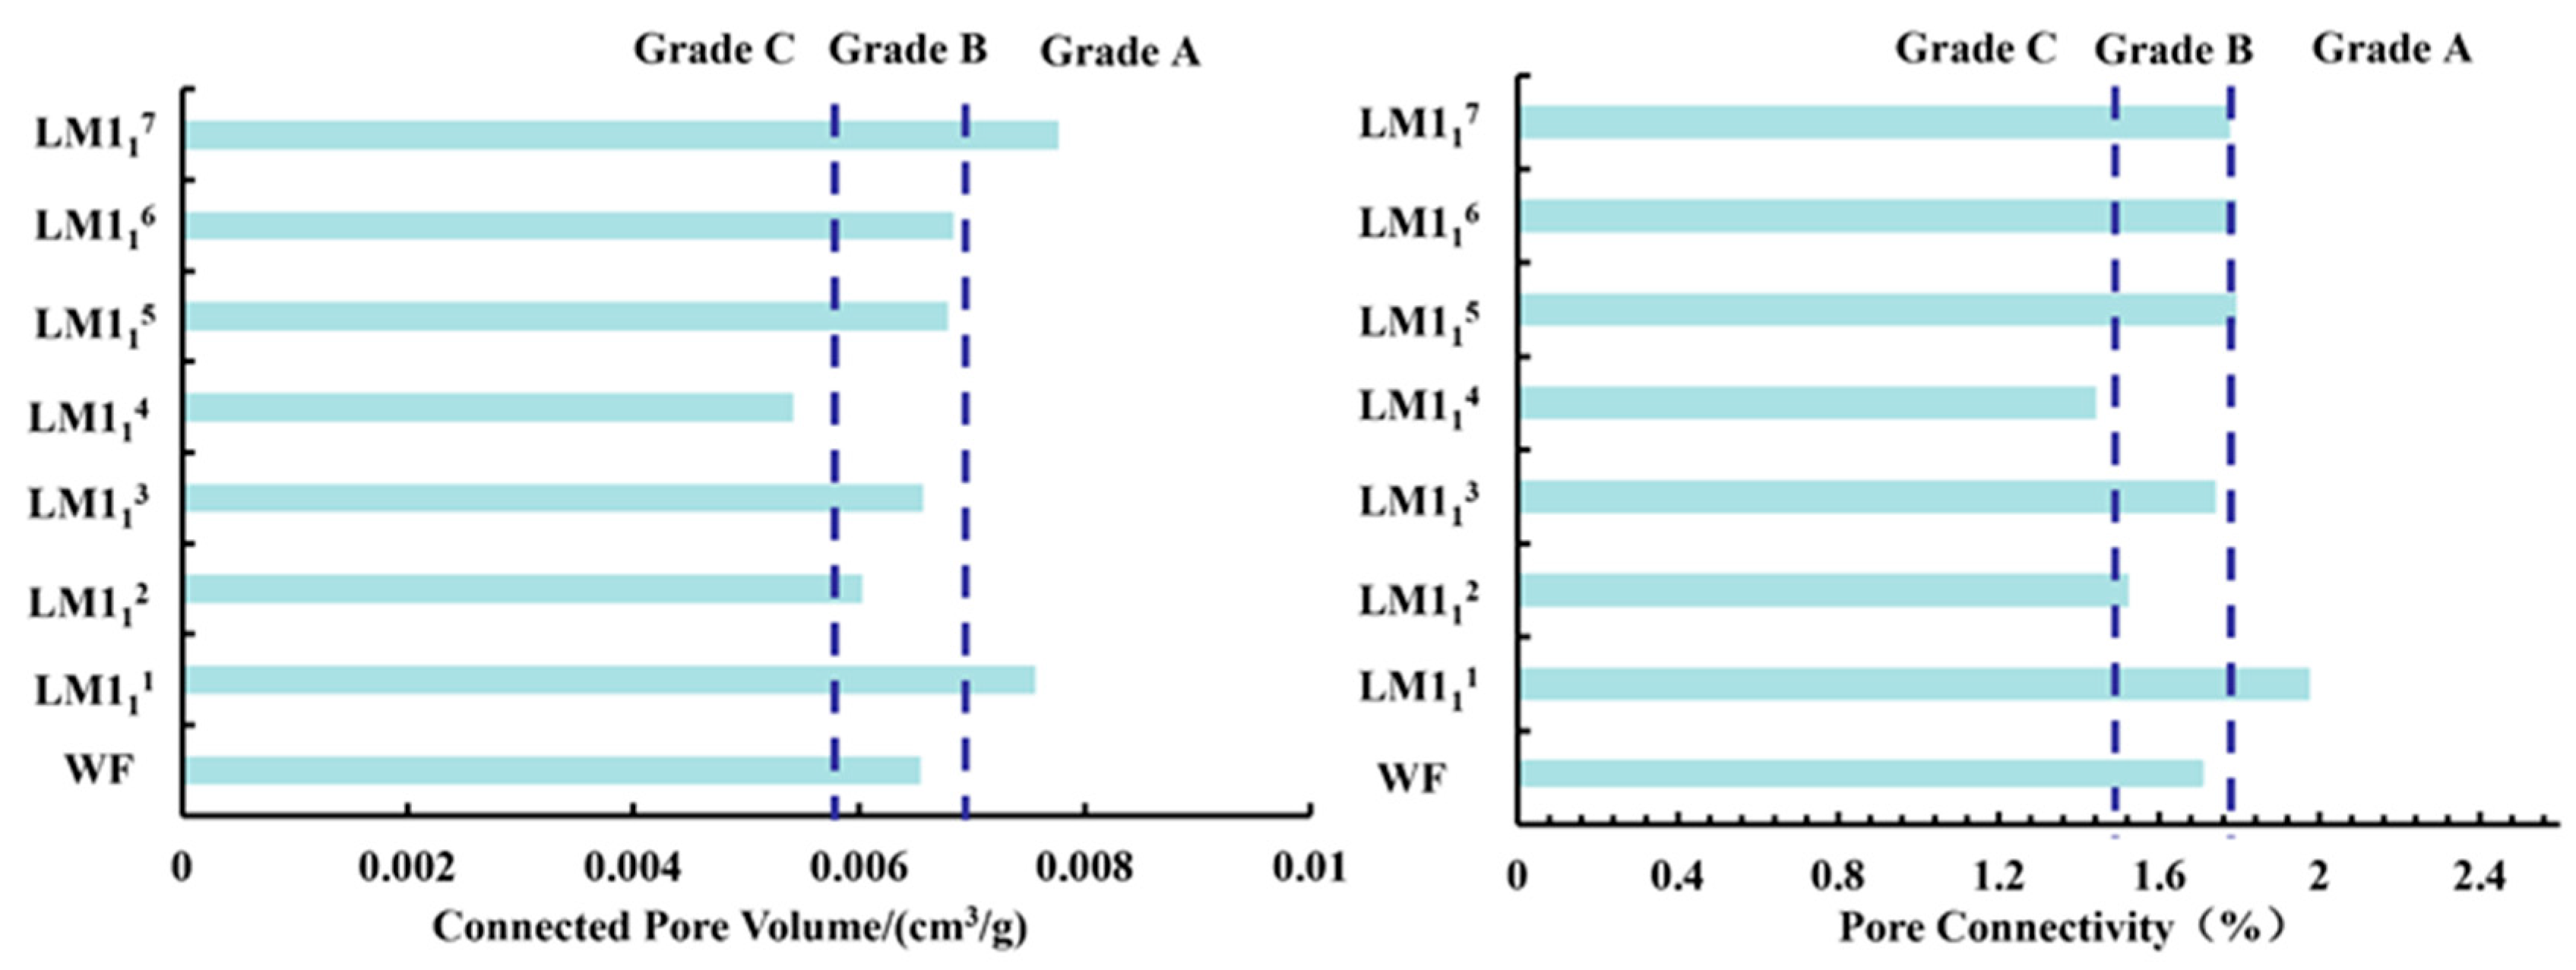
Based on the MIP experimental results, the connected pore volume and connected porosity of Well Y-101H10-3 were determined (
Figure 6). Reservoir classification was then established using threshold values derived from these parameters, supported by NMR pore size distribution characteristics and pore structure observation from MAPS imaging, as shown in
Figure 8.
The shale reservoir intervals of Well Y-101H10-3 were classified into three categories:
Grade A: Highest pore connectivity, with connected pore volume > 0.0067 cm3/g and connected porosity > 1.75%.
Grade B: Moderate pore connectivity, with connected pore volume between 0.0057 and 0.0067 cm3/g and connected porosity between 1.55% and 1.75%.
Grade C: Poor pore connectivity, with connected pore volume < 0.0057 cm3/g and connected porosity < 1.55%.
5.2. Comparison of Reservoir NMR and MIP Pore Size Distribution Curves
As previously discussed, although NMR characterizes all pores within the rock matrix, theoretical and experimental studies have demonstrated that the degree of coupling between different peaks in the NMR pore size distribution can qualitatively reflect the level of pore connectivity in shale [
64]. When two pore groups of different sizes are well connected, their peaks overlap significantly or even merge into a single peak. Conversely, if there is no connectivity between them, the NMR pore size distribution displays two distinct peaks.
According to the classification defined in
Section 5.1, the NMR pore size distribution curves for the different reservoir layers were extracted for comparison, revealing distinct differences among them.
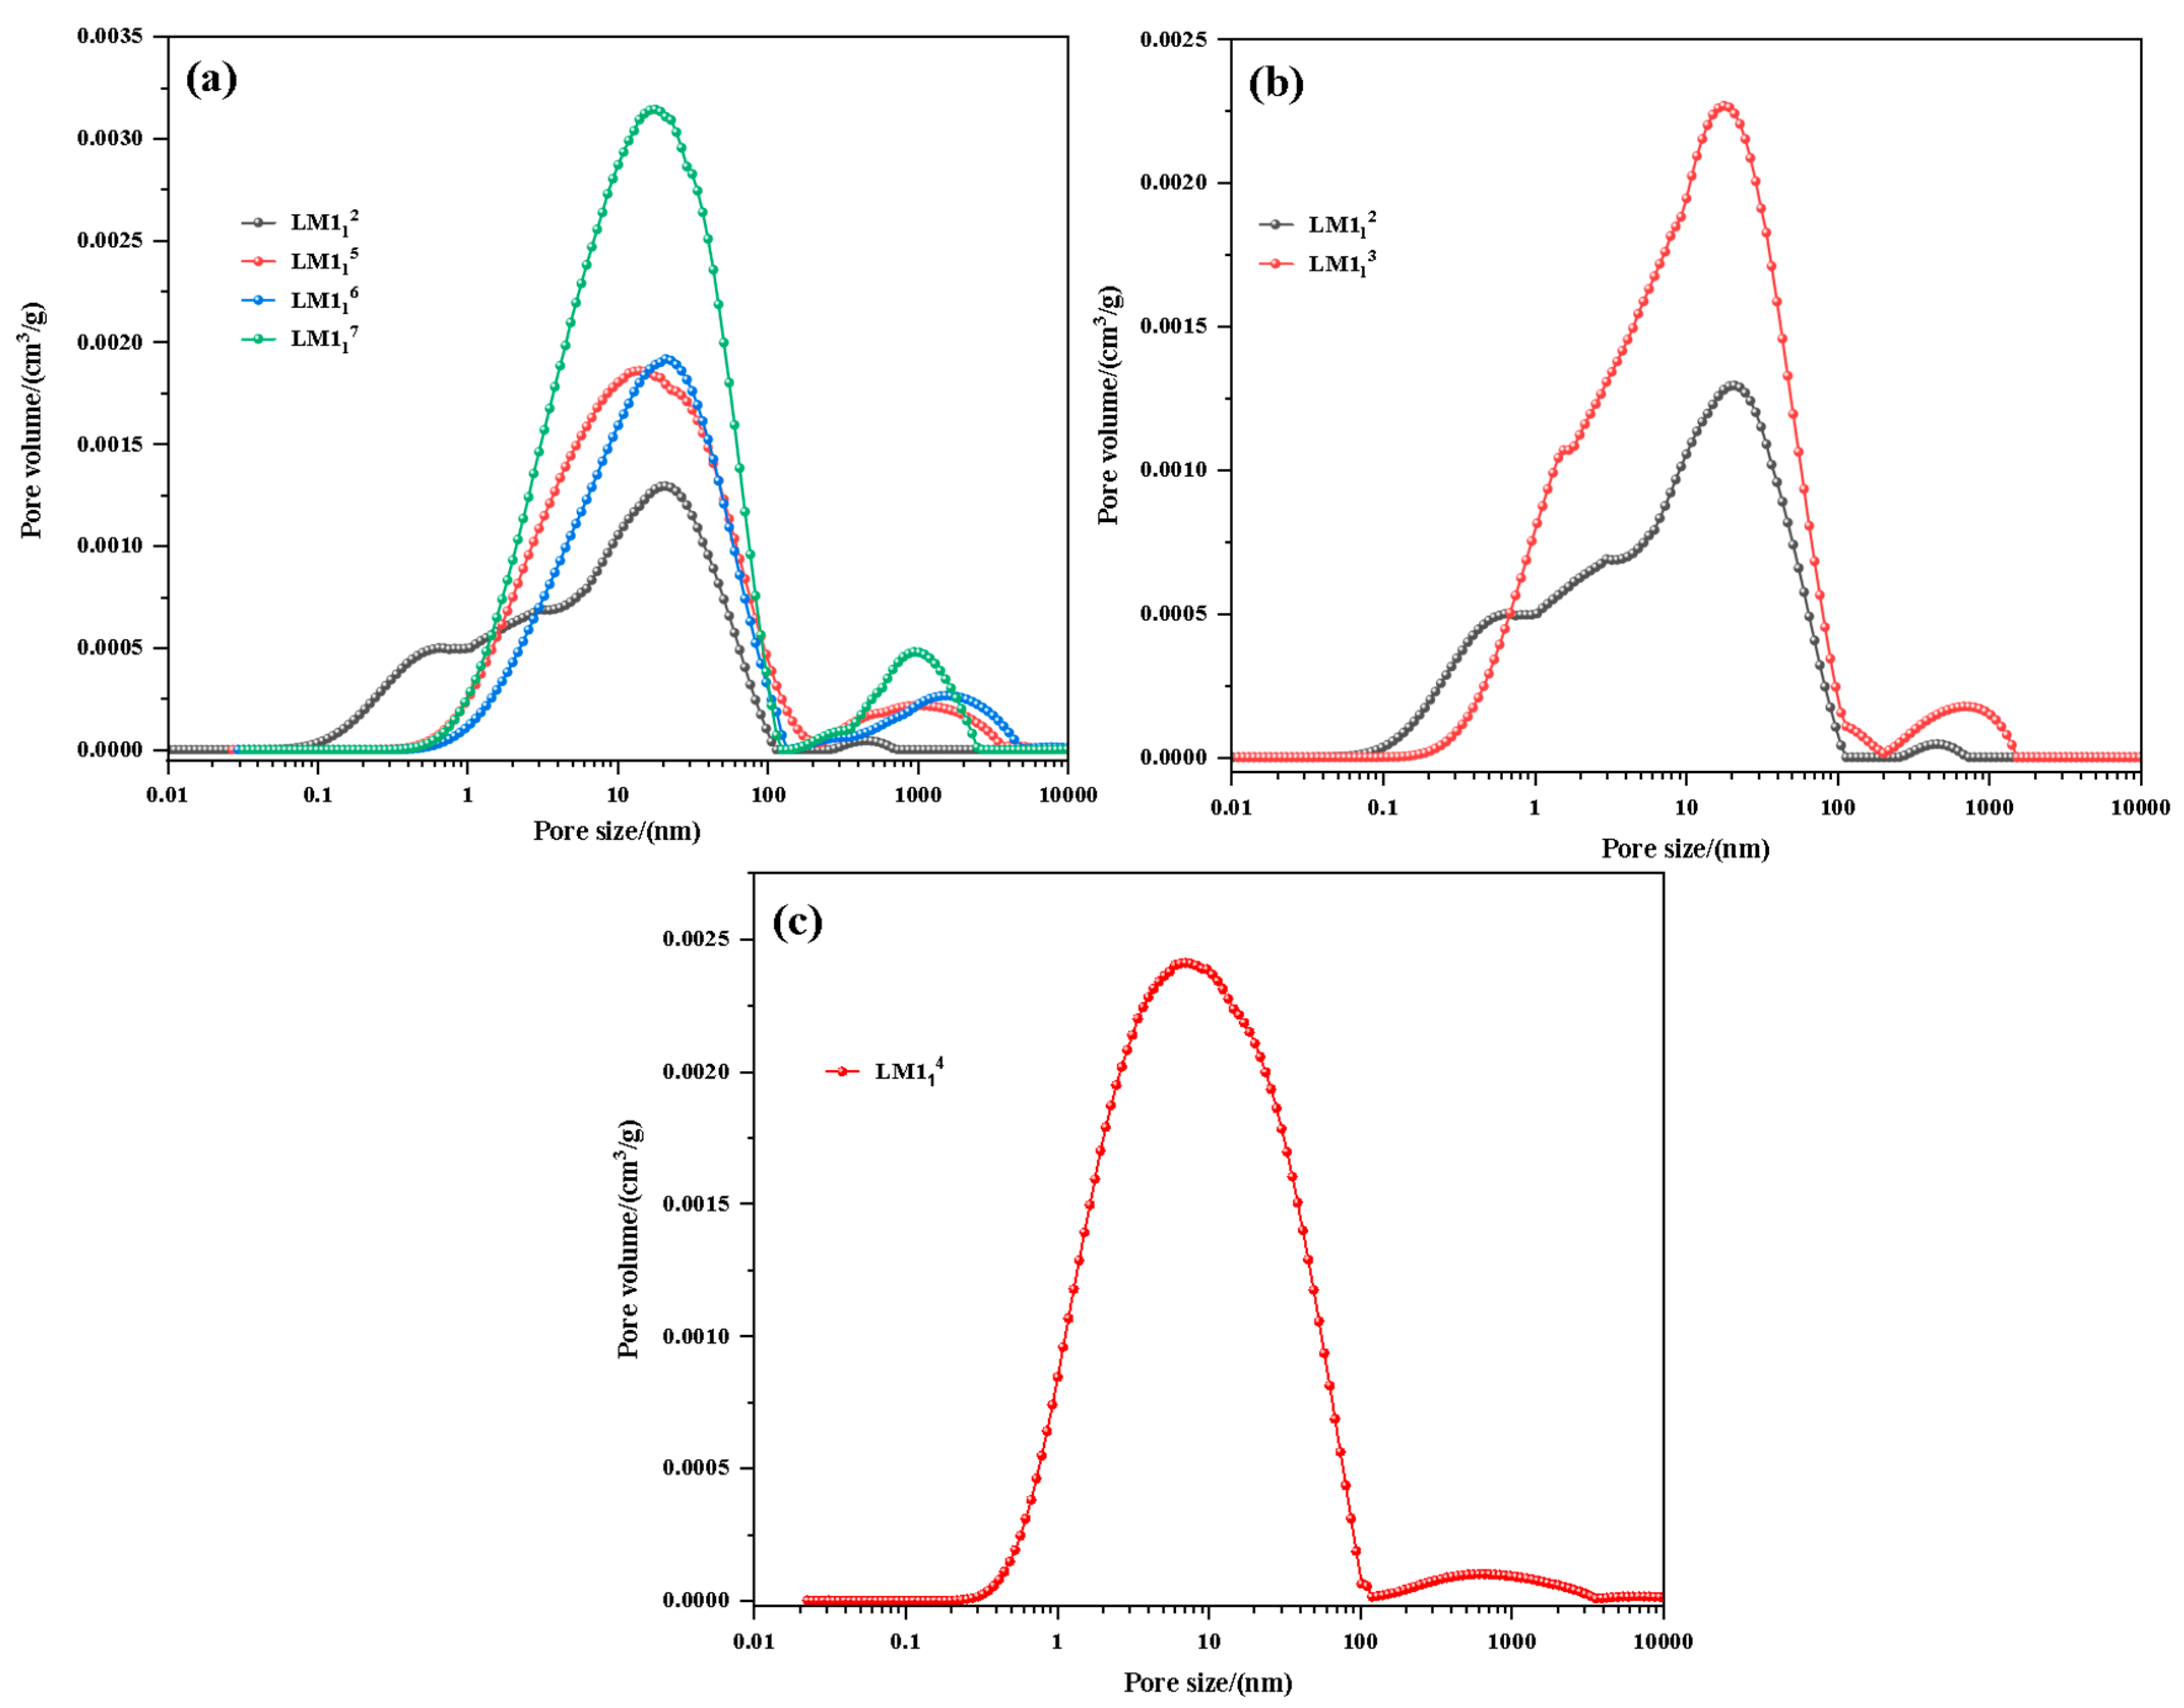
Grade A reservoir layers, including LM1
11, LM1
15, LM1
16, and LM1
17, show a trimodal distribution with a low left peak (0.1–2 nm), a dominant middle peak (2–100 nm), and a smaller right peak (200–400 nm). Strong coupling, particularly between the left and middle peaks, indicates excellent connectivity between micropores and mesopores (
Figure 9a). Grade B reservoir layers (LM1
12 and LM1
13) demonstrate bimodal or trimodal patterns, with good coupling between micropores (0.1–10 nm) and mesopores (10–100 nm) but weaker coupling between mesopores and macropores (100–4000 nm), reflecting moderate connectivity (
Figure 9b). Grade C reservoir layer LM1
14 is characterized by a unimodal distribution dominated by micropores (0.1–100 nm), lacking peak coupling and indicating poor connectivity, with minimal large-pore volume (
Figure 9c).
The qualitative pore connectivity inferred from the NMR pore size distribution curves is consistent with the connectivity trends reflected by the connected pore volume and connected porosity calculated from MIP experimental data. Furthermore, the NMR pore size distribution curves indicate that the combination of pores of different sizes is necessary to form a well-connected pore network.
A comparison of the NMR and MIP pore size distribution curves of the reservoir layers grades further highlights these differences (
Figure 10). In Grade A reservoir layers, the relaxation coupling effect is highly pronounced (
Figure 10). The MIP pore size distribution exhibits a typical trimodal pattern, with micropores, mesopores, and macropores corresponding to pore sizes of <10 nm, 10–100 nm, and >10,000 nm, respectively. While the NMR pore size distribution is expected to correspond to the MIP distribution, the relaxation coupling effect causes a notable shift: the left peak in NMR spans 0.01–100 nm, and the right peak spans 200–1200 nm. The macropore peak in NMR shifts significantly and overlaps with the mesopore peak, while the micropore and mesopore peaks nearly merge into a single left peak. The observed relaxation coupling effect may suggest the presence of relatively well-connected pore structures; however, this interpretation should be considered as a possible explanation rather than a definitive conclusion, as additional experimental verification would be required to confirm the extent of pore connectivity in Grade A reservoir layers.
The MIP pore size distribution of the Grade B reservoir layer generally shows a trimodal pattern, with micropores, mesopores, and macropores corresponding to pore sizes of 2–10 nm, 10–100 nm, and >10,000 nm, respectively. The NMR pore size distribution is also trimodal, with micropores ranging from 0.1 to 10 nm, mesopores from 10 to 100 nm, and macropores from 800 to 1200 nm. The relaxation coupling effect in the NMR curves of Grade B reservoir layers is less dominant than in Grade A reservoir layers. In most samples, the micropore and mesopore peaks do not merge into a single peak as observed in Grade A, and there is a noticeable gap between the mesopore and macropore peaks. This indicates that the pore connectivity in Grade B reservoir layers is inferior to that of Grade A. Moreover, the MIP pore size distribution of Grade C reservoir layers shows a trimodal pattern, with pore sizes mainly concentrated at 2–10 nm, 10–100 nm, and >10,000 nm. In contrast, the NMR pore size distribution shows a large separation between the mesopore and macropore peaks, and the relaxation coupling effect is not evident. This indicates that the pore connectivity of Grade C reservoir layers is poor. Overall, the qualitative pore connectivity inferred from the relaxation coupling effect in the NMR pore size distribution curves is consistent with the quantitative connectivity reflected by connected porosity and connected pore volume derived from MIP analysis.
5.3. Comparison of Pore Structure Characteristics Based on MAPS
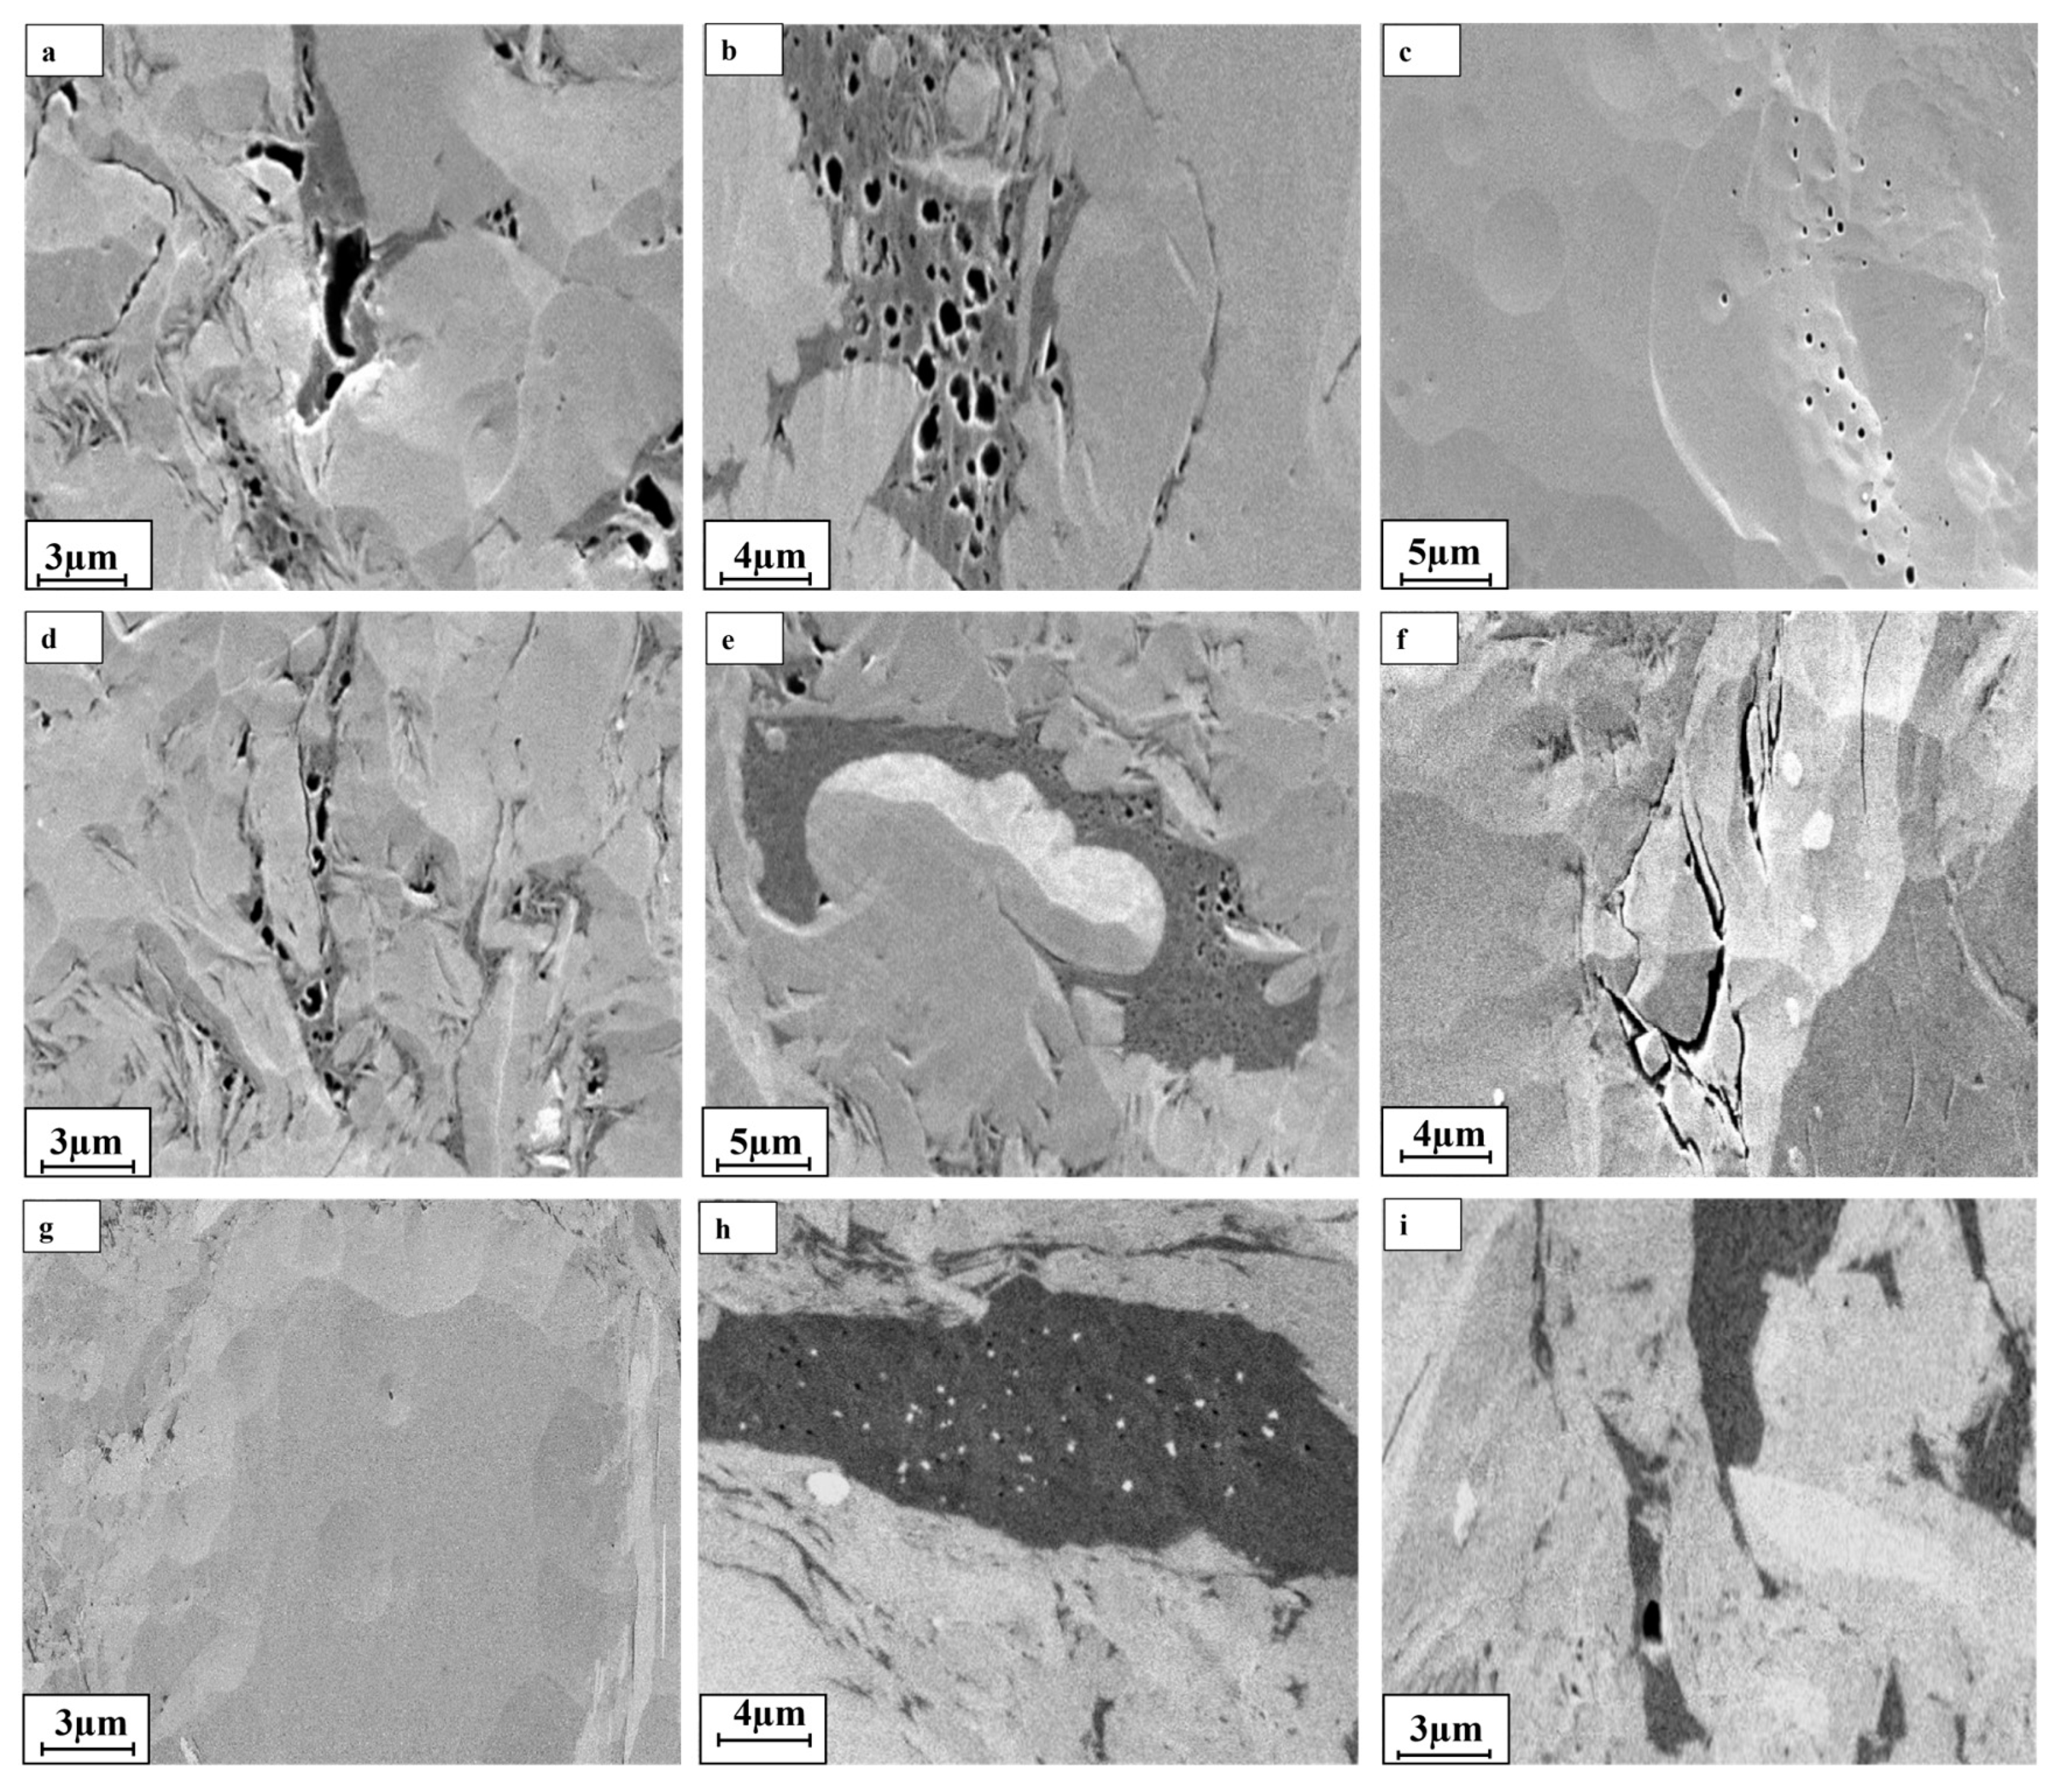
Significant differences in porosity and morphological features are observed among the various reservoir layers through MAPS imaging (
Figure 11). Grade A reservoir layers exhibit a large number of gas expansion or bubble-like organic pores that are circular to sub-circular in shape and heterogeneous in size, generally larger than those in Grade B and C reservoir layers. According to imaging observations, these pores demonstrate partial connectivity and are classified as locally connected organic pores. In addition, Grade A reservoir layers display abundant inorganic pores with diverse types, including intragranular dissolution pores in carbonate minerals, intergranular pores and fractures in quartz, feldspar, and pyrite, as well as interlayer pores within clay minerals. A considerable number of microfractures are also present, further enhancing the pore network.
In contrast, Grade B reservoir layers have fewer organic pores, predominantly exhibiting sponge-like morphologies with relatively uniform and smaller sizes. Imaging analysis reveals these to be isolated pores, lacking connectivity distinctly different from those in Grade A. Some bubble-like gas expansion pores with connectivity are present, while other organic matter regions are non-porous. Similar to Grade A, inorganic pores in Grade B are also relatively well-developed, primarily consisting of intergranular and cleavage-related pores in feldspar, with a few intragranular pores in carbonates and pyrite, along with a limited number of microfractures.
In Grade C reservoir layers, organic pores are poorly developed, and most organic matter does not contain pores. MAPS images (
Figure 11g–i) show that the organic pores that do exist are densely distributed, uniformly sized, and extremely small sponge-like pores. According to imaging observations, these pores are isolated. Inorganic mineral pores are also poorly developed in Grade C reservoir layers, with only a small number of quartz and feldspar intergranular pores and fractures, intragranular dissolution pores in carbonate minerals, and feldspar cleavage fractures. Additionally, pyrite intergranular pores are observed to be filled with organic matter. A few microfractures are also present, but they are short in length and, in some cases, filled with other minerals. These features further indicate the progressively deteriorating pore connectivity from Grade A to Grade C reservoir layers.
5.4. Qualitative and Quantitative Characteristics of Pore Connectivity Revealed by MIP, NMR, and MAPS
The qualitative and quantitative characteristics of pore connectivity in different reservoir layer grades revealed by MIP, NMR, and MAPS are highly comparable, indicating consistent features of shale reservoir pore connectivity. Based on reservoir connectivity characteristics combined with MAPS, the pore connectivity of the three types of layer grades is exhibited in
Table 5.
From the table, it is clear that the Grade A reservoir layers exhibit the best pore connectivity, with connected pore volume exceeding 0.0067 cm3/g, and connected porosity greater than 1.75%. The NMR pore size distribution curve shows a trimodal pattern, with good coupling among the three peaks, indicating strong connectivity between micropores, mesopores, and macropores. Organic pores are dominated by connected bubble-like organic pores, accompanied by abundant inorganic mineral pores. The widely distributed inorganic pores connect locally developed organic pores, forming a well-connected pore network.
The Grade B reservoir layers show a moderate pore connectivity. Their connected pore volume ranges between 0.0057 and 0.0067 cm3/g, and their connected porosity ranges between 1.55 and 1.75%. The NMR pore size distribution curve is approximately bimodal, indicating good connectivity between micropores and mesopores but poor connectivity between mesopores and macropores. Both connected bubble-like organic pores and isolated sponge-like organic pores are present, with the latter being dominant. Inorganic mineral pores are abundant and play a role in linking organic pores in different areas, forming partially connected pore networks.
Moreover, the Grade C reservoir layers exhibit the poorest pore connectivity. Their connected pore volume and connected porosity are less than 0.0057 cm3/g and 1.55%, respectively. The NMR pore size distribution curve is unimodal, with poorly developed macropores and poor connectivity between pores of different sizes. The organic matter is largely non-porous or contains isolated sponge pores, while the inorganic pores are sparse and fail to establish an interconnected pore network.
This classification framework clarifies the potential for gas storage and flow dynamics within the reservoir, thereby improving the assessment of well Y-101H10-3’s feasibility for shale gas production. Additionally, the reservoir layers with good connectivity develop numerous bubble-like connected organic pores, whereas those with poor connectivity contain fewer organic pores or isolated sponge-like organic pores. This indicates that the development degree and type of organic pores are key factors controlling shale reservoir pore connectivity. Imaging techniques reveal that nanoscale connected bubble-like organic pores are only locally connected, while NMR indicates some connectivity among micropores, mesopores, and macropores, suggesting that mineral pores (macropores and fractures) play a crucial role in linking locally connected organic pores, thereby enhancing overall pore network connectivity. By comparison, it can be seen that the pore connectivity of each sample is best in WF, LM111, LM115, LM116, and LM117, followed by LM112 and LM113, while the pore connectivity of LM114 is very poor.
6. Conclusions
This study offers a thorough evaluation of pore connectivity and morphology in the Wufeng–Longmaxi Formation from Well Y-101H10-3, located in the Luzhou Block. The multi-scale methodologies, including MIP, NMR, and MAPS analyses alongside ImageJ-based pore morphology characterization, provide valuable insights into the heterogeneity of shale reservoirs and their varying pore connectivity and structure across different layers. Pore connectivity in shale is classified into three distinct grades. Grade-A reservoir layers (LM111, LM115, LM116, and LM117) demonstrate a strong bimodal pore size distribution in both NMR and MIP analysis. The organic pores, particularly those in gas-expanded, bubble-like structures, were found to be highly interconnected, which significantly enhances gas transport efficiency. Additionally, inorganic pores, including intergranular and intragranular pores in quartz, feldspar, and carbonate minerals, contributed to overall pore network connectivity. These layers exhibited the highest connected pore volume (>0.0067 cm3/g) and high porosity (>1.75%), making them highly favorable for gas extraction. Grade-B reservoir layers (LM112 and LM113) exhibit a double-peak or three-peak (bimodal or nearly trimodal) distribution characterized by robust connectivity among micropores and mesopores, while connectivity between mesopores and macropores is restricted. Inorganic mineral pores, particularly intergranular pores and feldspar cleavage pores, are present but less abundant compared to Grade-A layers. These layers exhibited a connected pore volume between 0.0057 and 0.0067 cm3/g and porosity in the range of 1.55–1.75%. Grade-C reservoir layers (LM114) exhibit low connectivity, especially between mesopores and macropores, characterized by a reduced number of interconnected pores and a total connected pore volume of under 0.0057 cm3/g, and porosity under 1.55%. These layers are less favorable for gas production. These observations are consistent with previous studies on deep shale reservoirs, which also reported heterogeneity in micropore and mesopore networks and their importance for gas storage and migration. Compared to previous studies, the present multi-scale analysis provides a more detailed characterization of pore connectivity across different reservoir grades.
These results align with findings from other studies on similar shale formations, supporting the significance of pore heterogeneity and connectivity in influencing gas storage and migration efficiency. By combining ImageJ-based morphological analysis, MIP, and NMR data, this study highlights the critical role of organic matter and mineral composition in shaping the pore connectivity of shale reservoirs. The results show that organic matter-rich intervals with well-developed interconnected pore networks exhibit high connectivity, enhancing gas storage and migration efficiency. In contrast, low organic matter and mineral-rich layers with poor connectivity impede gas migration and production efficiency. The Fractal analysis also supported these findings by showing higher fractal dimensions (D) in layers with better connectivity, indicating complex and well-developed pore networks. Further, these findings highlight the significant influence of organic matter development and mineral composition on pore connectivity in deep shale reservoirs, offering important insights for improving shale gas exploration and production strategies. By pinpointing reservoir intervals that exhibit the highest effective connectivity, thereby facilitating enhanced gas flow and recovery.
Future investigations ought to concentrate on how mineral composition and thermal maturity influence pore connectivity and gas migration, incorporating advanced imaging techniques to improve the forecasting of shale gas reservoir potential.
