Article

Study on the Shielding Effectiveness of Airborne Navigation Equipment Enclosures Under High-Intensity Radiated Fields (HIRFs)


1
Institute of Electronic and Electrical Engineering, Civil Aviation Flight University of China, Guanghan 618307, China
2
Tianfu Jiangxi Laboratory, Chengdu 641419, China
*
Authors to whom correspondence should be addressed.
These authors contributed equally to this work.
Processes 2025, 13(12), 3782; https://doi.org/10.3390/pr13123782
Submission received: 27 September 2025 / Revised: 5 November 2025 / Accepted: 12 November 2025 / Published: 23 November 2025

Abstract

High-Intensity Radiated Fields (HIRFs) can cause severe interference to airborne GNSS equipment. This paper builds a CST model based on the real structure and evaluates shielding effectiveness (SE) with respect to frequency, material, polarization, angle of incidence, and aperture; anechoic-chamber tests combined with the DO-160G compliance method (Section 20, Class G) are then conducted, and this integrated scheme: (1) validates the simulation’s effectiveness and confirms the HIRF coupling risk; (2) reveals the GNSS failure mechanism—C/N0 decrease → DOP increase → loss of lock. Subsequently, an equation-based mechanism framework (cavity modes, slot/aperture coupling, waveguide-below-cutoff, thickness attenuation) is proposed, together with an effective-dimension correction, by which a single-point calibration can predict the remaining resonances. Accordingly, mechanism-aligned design strategies are provided (aperture control and honeycomb windows, geometric detuning and local absorbers, high-permeability inserts, multi-polarization and multi-directional protection), achieving predictable, verifiable, and quantifiable improvements in SE.

1. Introduction

1.1. Research Background and Significance

High-Intensity Radiated Fields (HIRFs) refer to electromagnetic environments with exceptionally high field strengths, exceeding those typically encountered under normal operating conditions. With characteristics such as high power, wide frequency range, intense radiation, and irregular field distribution, HIRFs can seriously threaten the normal operation of aircraft electrical and electronic systems [1]. Major sources include military and civil radar, airport-based navigation and surveillance equipment, and high-power communication or broadcasting transmitters. Electromagnetic energy from these sources may penetrate an aircraft through apertures, seams, or antennas, interfering with onboard electronics and, in severe cases, causing malfunctions or failures [2].
Among the affected onboard systems, Global Navigation Satellite System (GNSS) receivers are particularly vulnerable. They depend on weak satellite signals that can be easily overwhelmed by strong external electromagnetic fields. In an HIRF environment, radiated waves may couple into internal circuitry via the enclosure or connected cables, leading to signal distortion or complete loss. Such interference can degrade positioning accuracy, disable navigation capability, or even damage hardware permanently. Therefore, improving the shielding effectiveness of device enclosures is essential for ensuring the safe and stable operation of airborne navigation equipment in high-radiation environments. Effective electromagnetic shielding reduces field coupling and mitigates the impact of external radiation sources on onboard systems.

1.2. Overview of HIRF Airworthiness Regulations and Standards

Research on High-Intensity Radiated Fields (HIRF) began relatively early in the United States and Europe, where comprehensive and mature airworthiness certification systems have been established. Since the release of FAA Order N8110.71 [3], the Federal Aviation Administration (FAA) has successively introduced multiple regulations and technical documents addressing HIRF protection. These include FAR 25.1317 [4], Advisory Circular AC 20-158B [5], and Policy Statement PS-ACE-23-10 [6], which collectively define protection requirements and airworthiness compliance methods for aircraft electrical and electronic systems operating under HIRF conditions.
In addition, the Radio Technical Commission for Aeronautics (RTCA) has published DO-160G: Environmental Conditions and Test Procedures for Airborne Equipment [7], with its latest edition released in December 2010. This standard serves as a cornerstone in civil aviation and is widely adopted for environmental testing of airborne electronic equipment. Section 20 of DO-160G specifically addresses radiated susceptibility to electromagnetic energy, providing test methods and severity levels relevant to typical HIRF environments. These standards offer a unified framework for evaluating the electromagnetic immunity performance of onboard equipment, such as GNSS receivers, under complex radiation exposure.
In comparison, China’s development of HIRF-related airworthiness regulations started relatively later but has progressed significantly in recent years. In August 2006, the Civil Aviation Administration of China (CAAC) issued AC-21-1317 “HIRF Protection Requirements for Aircraft” [8]. Subsequently, in November 2011, the official HIRF requirement was incorporated into the Transport Category Airworthiness Regulations CCAR-25-R4 [9] through clause CCAR 25.1317, which aligns closely with standards set by the FAA and EASA. Most recently, in December 2023, CAAC published AC-25-AA-2023-03 [10], providing detailed compliance guidance for CCAR 25.1317, further promoting the alignment of China’s HIRF airworthiness system with international standards.

1.3. Research Status

With the advancement of HIRF-related theories and the continuous refinement of international airworthiness standards, the electromagnetic immunity of avionics systems under HIRF conditions has become a key research focus in electromagnetic compatibility (EMC). In recent years, scholars worldwide have carried out extensive theoretical and applied studies on HIRF coupling mechanisms, shielding structure design, and material responses. Among these efforts, the shielding effectiveness of enclosures has attracted particular attention, as it plays a crucial role in ensuring the stable operation of airborne navigation devices exposed to HIRF. Current research increasingly emphasizes the use of high-fidelity simulation tools, accurate numerical modeling, and experimental validation to evaluate the influence of structural parameters on shielding effectiveness.
Kong Shufang et al. [11,12,13,14] conducted a systematic analysis of HIRF-related airworthiness clauses and comprehensively reviewed mainstream HIRF compliance test methods currently adopted internationally. These methods are widely applied at the aircraft, system, and equipment levels, providing vital technical references for the airworthiness certification of avionics systems. Zhang Guangcan [15], based on FAA Advisory Circular AC 20-158, detailed the entire verification process and test requirements for HIRF protection in civil aircraft, although the work primarily focuses on aircraft-level assessment and lacks equipment-level electromagnetic response data. Hu Pingdao [16] proposed the Low-Level Coupling (LLC) test methodology, which includes Low-Level Direct Drive (LLDD), Low-Level Swept Current (LLSC), and Low-Level Swept Field (LLSF) tests. These techniques effectively characterize the sensitivity of systems to HIRF-induced coupling and provide critical data support for the early design stage. Schroder et al. [17] improved the Method of Moments to investigate slot-coupling effects, thereby enhancing computational accuracy. Wang Fengqi [18] examined the antenna coupling characteristics of unmanned aerial vehicle (UAV) systems under strong electromagnetic pulses (EMP), revealing that EMP can directly couple into UAV systems through antennas, adversely affecting the normal operation of navigation and communication modules. Han Zheng et al. [19] employed both time-domain and frequency-domain approaches to analyze the shielding characteristics of airborne electronic equipment enclosures under HIRF exposure, and further established the relationship between shielding effectiveness, incident panels, and HIRF frequency. Similarly, Hu Jing et al. [20] conducted simulation analyses of helicopter fuselage shielding effectiveness using CST Studio Suite 2021 software, highlighting the influence of slot structures on shielding performance and providing simulation-based validation approaches for HIRF shielding design.
In terms of practical testing, Li Hongxiang [21] conducted radiated susceptibility testing using a 3 m method in an anechoic chamber for a specific type of unmanned aerial vehicle (UAV), demonstrating the applicability of chamber-based testing in aircraft-level HIRF evaluation. Yuan Hongtao [22] investigated the HIRF response of an airborne radio system installed on a specific helicopter within the 400 MHz–2 GHz range using a reverberation chamber. By modulating the field intensity, typical fault modes and susceptibility thresholds were identified. Chen Jingping et al. [23] performed radiated immunity tests on a small radar system in a reverberation chamber and analyzed its performance degradation under HIRF conditions. Lemaire D et al. [24] studied the low-frequency HIRF transmission function of the Airbus A380, obtained coupling path response curves within the cabin, and proposed a method for extrapolating equivalent test field strengths for equipment-level evaluations. Li Ke [25] designed an integrated reverberation chamber test system for equipment-level radiated susceptibility experiments, enabling the assessment of device anti-interference capabilities under different HIRF environments. Liu Yong [26] employed a full-aircraft HIRF test system to perform low-level swept-frequency field tests on a specific type of helicopter, concluding that within the tested frequency band, slot structures on the fuselage serve as the main coupling paths for electromagnetic energy penetration. Furthermore, Wang Yanhong et al. [27] carried out low-level swept-current tests on the AC312E helicopter, deriving the transfer function between external HIRF environments and induced currents in equipment harnesses, thereby providing valuable experimental data for optimizing HIRF protection in aircraft.
Recent studies have demonstrated diverse approaches to electromagnetic shielding, including conductive polymer/graphene-based nanocomposites [28] and high-density oxide glass systems for gamma attenuation [29], providing complementary perspectives to structure-dependent shielding methods explored in this work.

1.4. Current Challenges and Limitations in HIRF Research

Most HIRF studies still emphasize aircraft-level susceptibility tests and pass/fail compliance, offering limited insight at the equipment level. Such approaches seldom provide formula-level explanations of how enclosure geometry, apertures/seams, and materials shape frequency-dependent shielding effectiveness (SE). Quantitative, band-specific analysis and predictive design criteria are often missing, especially for the 3–10 GHz resonance-prone band and >10 GHz degradation region.
Targeted optimization strategies are likewise scarce: guidance on aperture control, geometric detuning, effective thickness (below-cutoff attenuation), and material permeability matching is typically qualitative, making it difficult to translate observations into actionable enclosure design rules.
To close these gaps, this work focuses on device-level SE using a GNSS receiver enclosure modeled from actual geometry, and integrates high-fidelity CST simulations with an anechoic-chamber testing under DO-160G Section 20, Class G. We propose an equation-based mechanism (cavity modes, aperture/slot coupling, waveguide-below-cutoff, thickness attenuation) with an effective-dimension correction. A single-point calibration maps one measured/simulated resonance to geometry and predicts other resonances with 0.5–1.4% error. Chamber results reveal the GNSS failure chain (C/N0 drop → DOP rise → loss of lock), directly validating the predicted coupling. Building on this, we derive mechanism-aligned design rules—aperture size/shape and honeycomb windows, detuning plus localized absorbers, high-permeability inserts, and multi-polarization/multi-directional robustness—providing predictable and verifiable guidance for HIRF-grade EMC design.

2. Coupling Mechanisms and Theoretical Foundations

The coupling effects of High-Intensity Radiated Fields (HIRF) fundamentally involve the propagation and interaction of electromagnetic fields in free space or within shielding enclosures. Therefore, a thorough understanding of electromagnetic field theory is essential for analyzing HIRF-induced interference and its effects on onboard systems. This section outlines the theoretical foundations of HIRF coupling, providing the necessary background to support the subsequent simulation analysis and experimental validation.

2.1. Coupling Paths of HIRF Interference

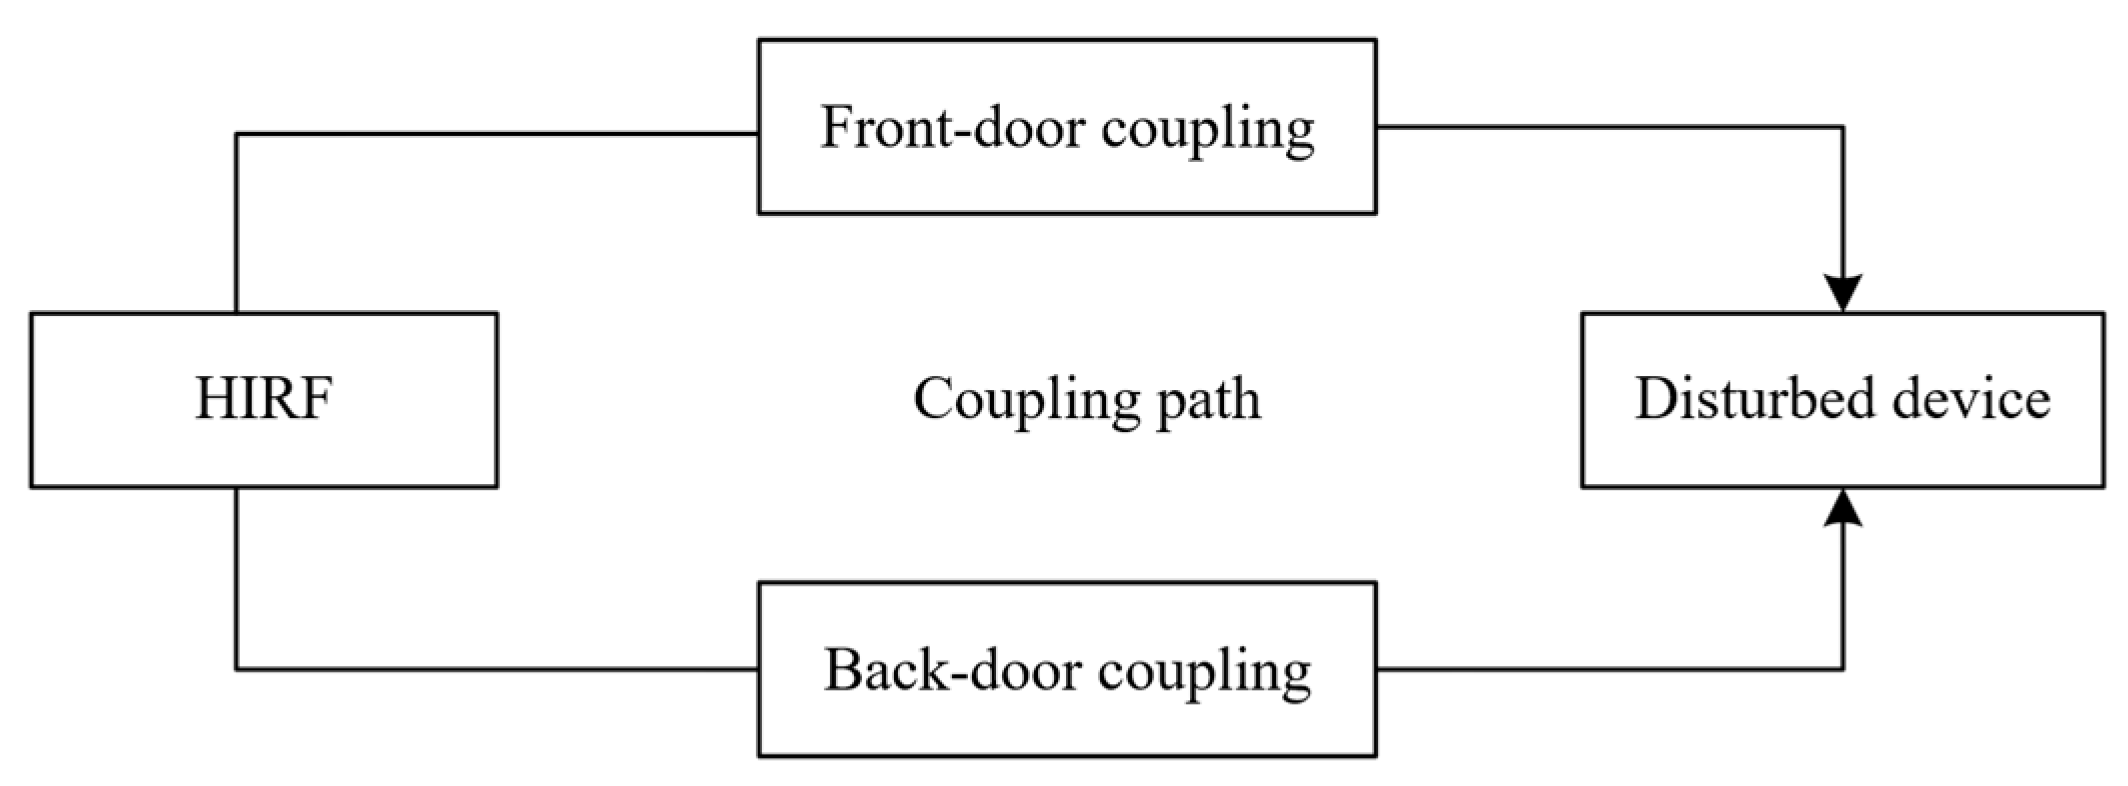
In HIRF environments, electronic equipment is highly susceptible to electromagnetic interference (EMI), which can disrupt normal operation or even cause complete functional failure. As illustrated in Figure 1, three essential elements are required for HIRF-induced interference: a strong external radiation source, an effective coupling path, and a susceptible victim device.
HIRF sources typically originate from high-power electromagnetic emissions such as radar systems, communication base stations, and broadcast transmitters. The electromagnetic energy from these sources can couple into electronic systems through two primary mechanisms. Front-door coupling occurs when HIRF energy enters the system via intentional paths such as antennas and cables; the incident wave induces unwanted currents and voltages that may suppress normal signals or even damage internal components. Back-door coupling, in contrast, arises when HIRF penetrates unintended structural openings—such as seams, windows, vents, or doors—creating internal electromagnetic fields that couple into sensitive electronics and potentially disrupt or degrade equipment performance [30].
The coupling behavior of HIRF strongly depends on frequency. At frequencies below 1 MHz, the effects are weak and generally negligible. Between 1 MHz and 400 MHz, aircraft wiring harnesses act as efficient antennas, making front-door coupling the dominant mechanism and highlighting the importance of cable shielding. Above 400 MHz, however, front-door effects diminish, and HIRF energy more readily couples through structural discontinuities and apertures. In this high-frequency regime, back-door coupling becomes the primary pathway, making enclosure and shielding design critical to preventing electromagnetic penetration [31].
Accordingly, this study focuses on shielding effectiveness in the frequency range above 400 MHz, where structural coupling dominates and effective shielding design is essential.

2.2. Electromagnetic Shielding Effectiveness

Electromagnetic Shielding Effectiveness (SE) is a key metric for evaluating the ability of materials or structures to block the propagation of electromagnetic waves. It quantifies how effectively a shield reduces external electromagnetic interference (EMI) and prevents the leakage of internal radiation. In HIRF environments, SE is particularly critical for protecting onboard electronic equipment.
SE is generally expressed in decibels (dB) as the attenuation of electromagnetic waves across the shielding boundary. It can be calculated as:
Electric Field Shielding Effectiveness:
S E = 20 log 10 E 0 E 1 .
magnetic Field Shielding Effectiveness:
S E = 20 log 10 H 0 H 1 ,
where E 0 and E 1 represent the electric field strength before and after shielding, respectively; and H 0 and H 1 represent the magnetic field strength before and after shielding, respectively.
Several factors influence electromagnetic shielding effectiveness, primarily including:
  • Material properties. Electrical conductivity and magnetic permeability are the key parameters. Higher conductivity and permeability generally enhance shielding effectiveness.
  • Shielding structure. Shield thickness, seams, and openings have a major impact. Thicker shields usually provide better protection, while gaps and apertures reduce overall performance. In addition, certain structural features can introduce resonances at specific frequencies, leading to severe degradation of shielding effectiveness.
  • Frequency range. Shielding effectiveness varies with frequency. Between 1 MHz and 400 MHz, cables can act as efficient antennas, creating strong coupling effects. Above 400 MHz, high-frequency waves are more effectively absorbed and reflected by metals and composites, often requiring multilayer shielding materials for adequate protection.
Overall, SE is a critical indicator for evaluating the performance of materials and structures, especially in HIRF environments where it directly reflects the anti-interference capability of onboard equipment. By selecting appropriate materials and optimizing structural design, shielding effectiveness can be significantly improved, thereby mitigating the impact of external electromagnetic fields and ensuring reliable system operation.

2.3. Resonance Phenomenon

The resonance phenomenon is an important factor that can significantly degrade shielding effectiveness in electromagnetic design. When the frequency of an external electromagnetic wave approaches the natural frequency of a shielding structure or material, the system response increases sharply, leading to enhanced transmission or amplification of the wave and a substantial reduction in shielding performance.
Every shielding material or structure has one or more natural, or resonant, frequencies. In enclosures, these are determined by geometric factors such as shape, dimensions, openings, and gaps, while material properties such as electrical conductivity and magnetic permeability also influence resonance behavior.
For an ideal rectangular resonant cavity made of a perfect conductor, the resonant frequency can be calculated using the following formula:
f m n p = c / 2   ( m / a ) 2 + ( n / b ) 2 + ( p / l ) 2 ,
where f m n p is the resonant frequency of the cavity (Hz), c is the speed of light (3*108 m/s), a , b , l are the length, width, and height of the cavity (m), m , n , p are positive integers representing the resonance mode numbers.
For a rectangular cavity with a single aperture or slit, the resonant frequency can be adjusted using the following modified formula:
f r = c 2 L max ,
where L max is the maximum slit or aperture length in the direction of wave propagation.
When the enclosure of an onboard device contains multiple openings or slits, its resonant frequencies may shift, and multiple resonance peaks can arise from internal reflections and interference. Therefore, in HIRF protection analysis, it is essential to use electromagnetic field simulation tools (e.g., CST) to identify the resonance characteristics of the shielding cavity and to validate their impact on shielding performance through experimental testing.
The resonance phenomenon directly affects both system immunity to interference and electromagnetic leakage. Different materials and structures exhibit distinct resonance behaviors, making their study critical for material selection and enclosure design. By adjusting parameters such as material thickness, geometry, and aperture size, resonance can be mitigated and shielding effectiveness enhanced. In this study, simulation-based analysis of enclosure resonance characteristics is carried out to support design optimization and reduce electromagnetic interference in practical applications.

2.4. Software Selection

CST Studio Suite is a comprehensive electromagnetic simulation tool capable of handling complex electromagnetic problems under High-Intensity Radiated Fields (HIRF). Its powerful simulation capabilities, multi-frequency analysis, and accurate modeling of electromagnetic wave propagation and shielding effectiveness make it an ideal choice for this study [32].
By using CST, variations in the shielding effectiveness of the onboard navigation equipment enclosure under different conditions can be effectively analyzed. This enables the prediction of shielding performance during the design phase, facilitates design optimization, and enhances the system’s immunity and reliability in high-intensity electromagnetic environments.

3. Simulation Model Construction

3.1. Modeling of the Onboard GNSS Receiver

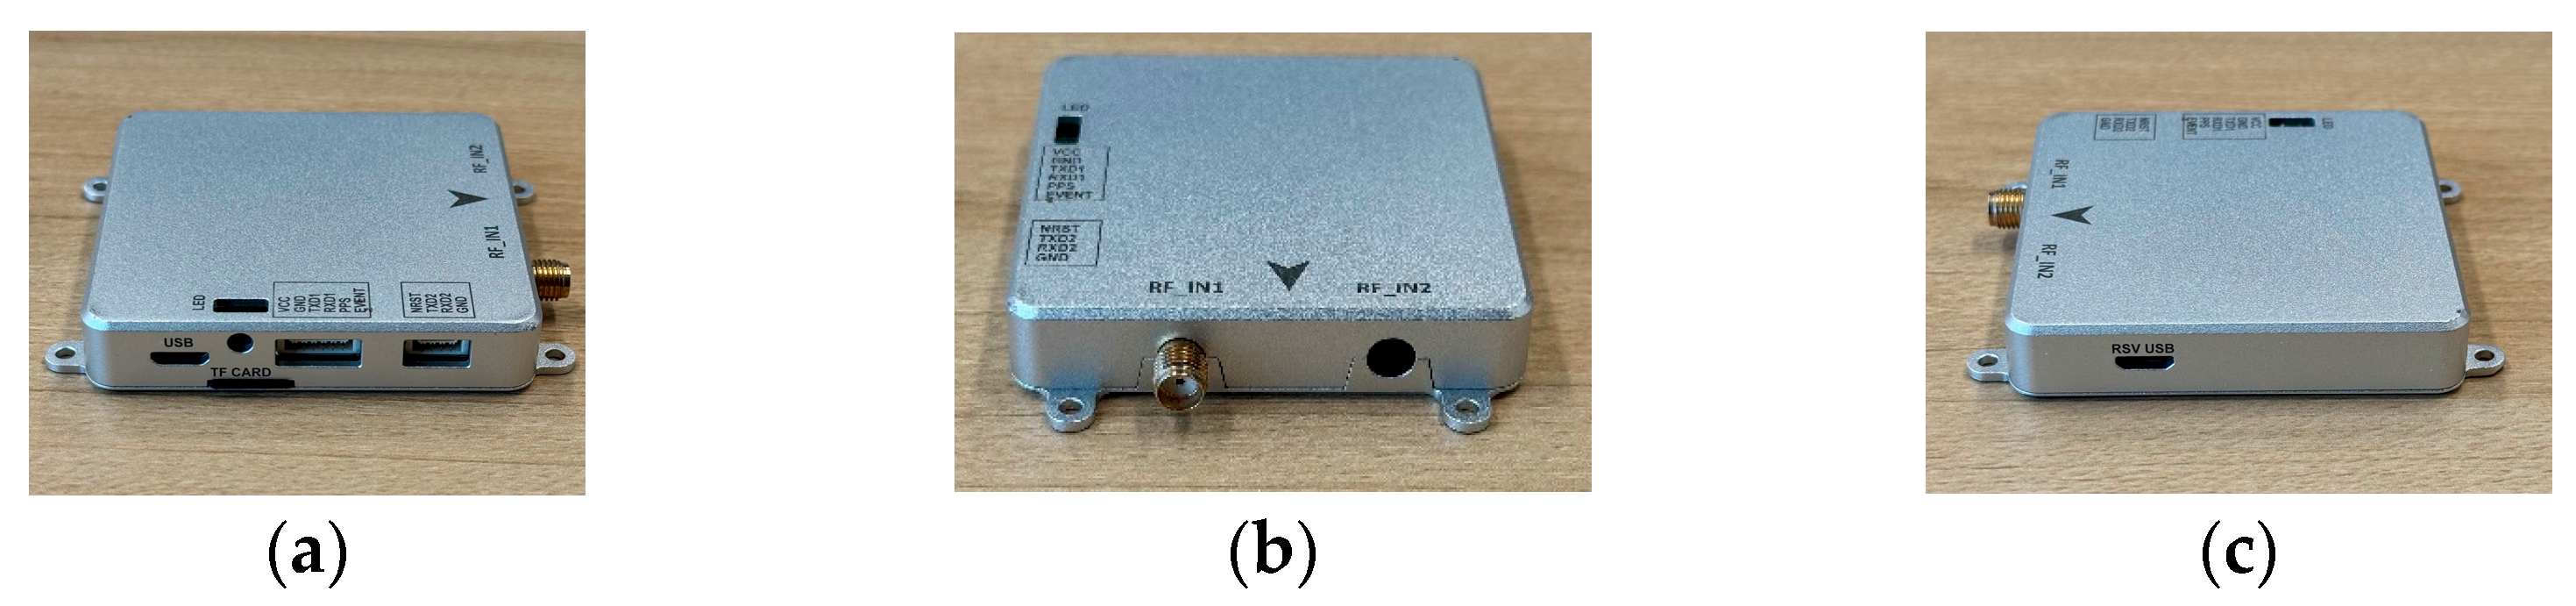
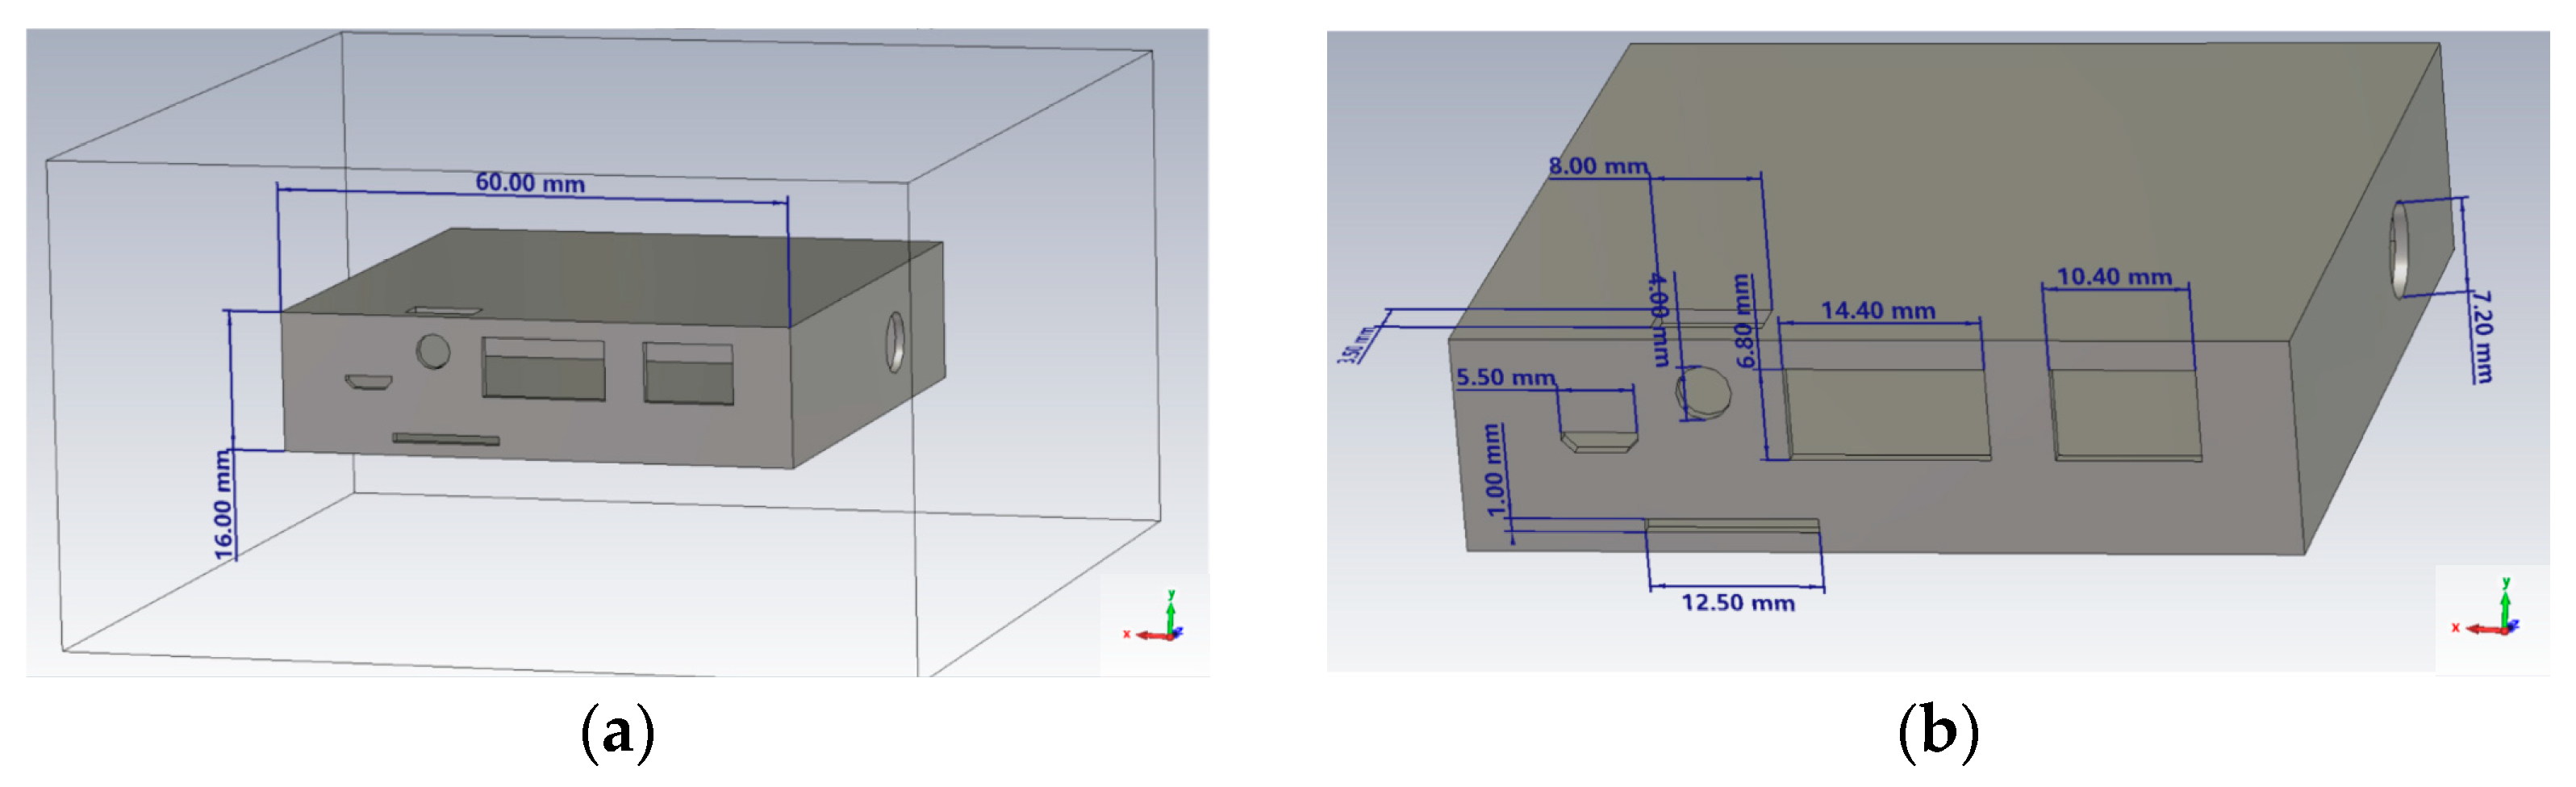
A Global Navigation Satellite System (GNSS) receiver captures satellite signals to determine position, velocity, and timing, and is a critical component of modern navigation systems, as shown in Figure 2. In this study, a receiver model was developed based on the physical dimensions and structural data of an actual device, as illustrated in Figure 3. The simulations focus on evaluating the shielding effectiveness of the enclosure under various conditions.

3.2. Simulation Environment Setup

In the simulation, the EMC/EMI Studio module in CST Studio Suite was used. The background material was set to vacuum, and the boundary conditions were defined as Open (add space). The boundary distance was set to 20 times the wavelength corresponding to the mid-band frequency of 9.2 GHz (400 MHz–18 GHz range), and the boundary reflection level was set to 0.0001 to expand the computational domain and minimize the influence of boundary reflections on the simulation results.
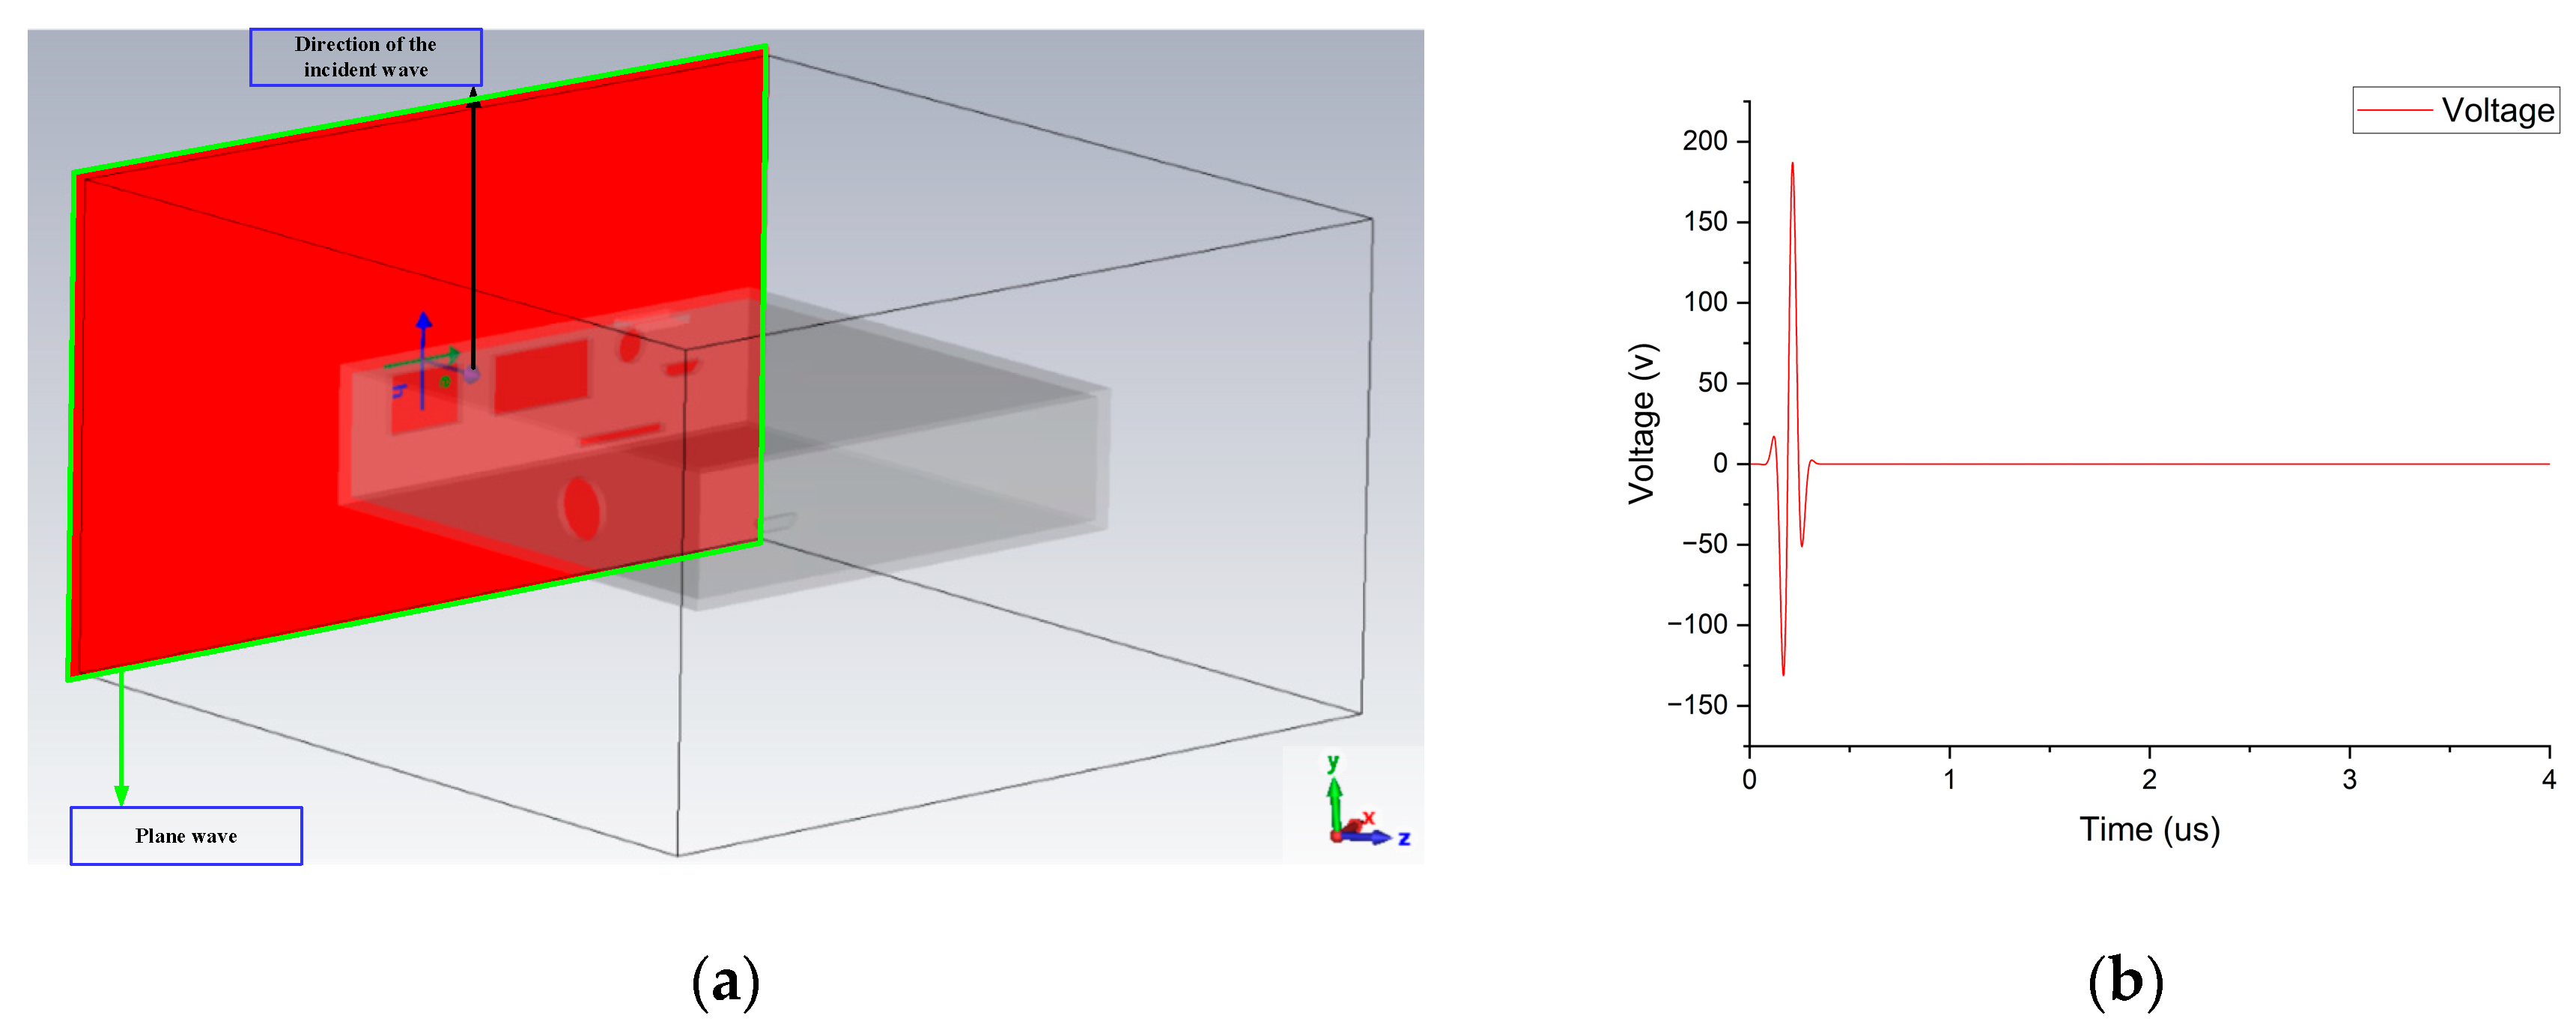
Since the shielding effectiveness of the enclosure is primarily manifested in frequencies above 400 MHz, the simulation frequency range was set from 400 MHz to 18 GHz to improve computational efficiency. A plane wave was used as the excitation source to simulate the HIRF environment, with the field strength set to 200 V/m, as illustrated in Figure 4.

3.3. Monitor and Probe Configuration

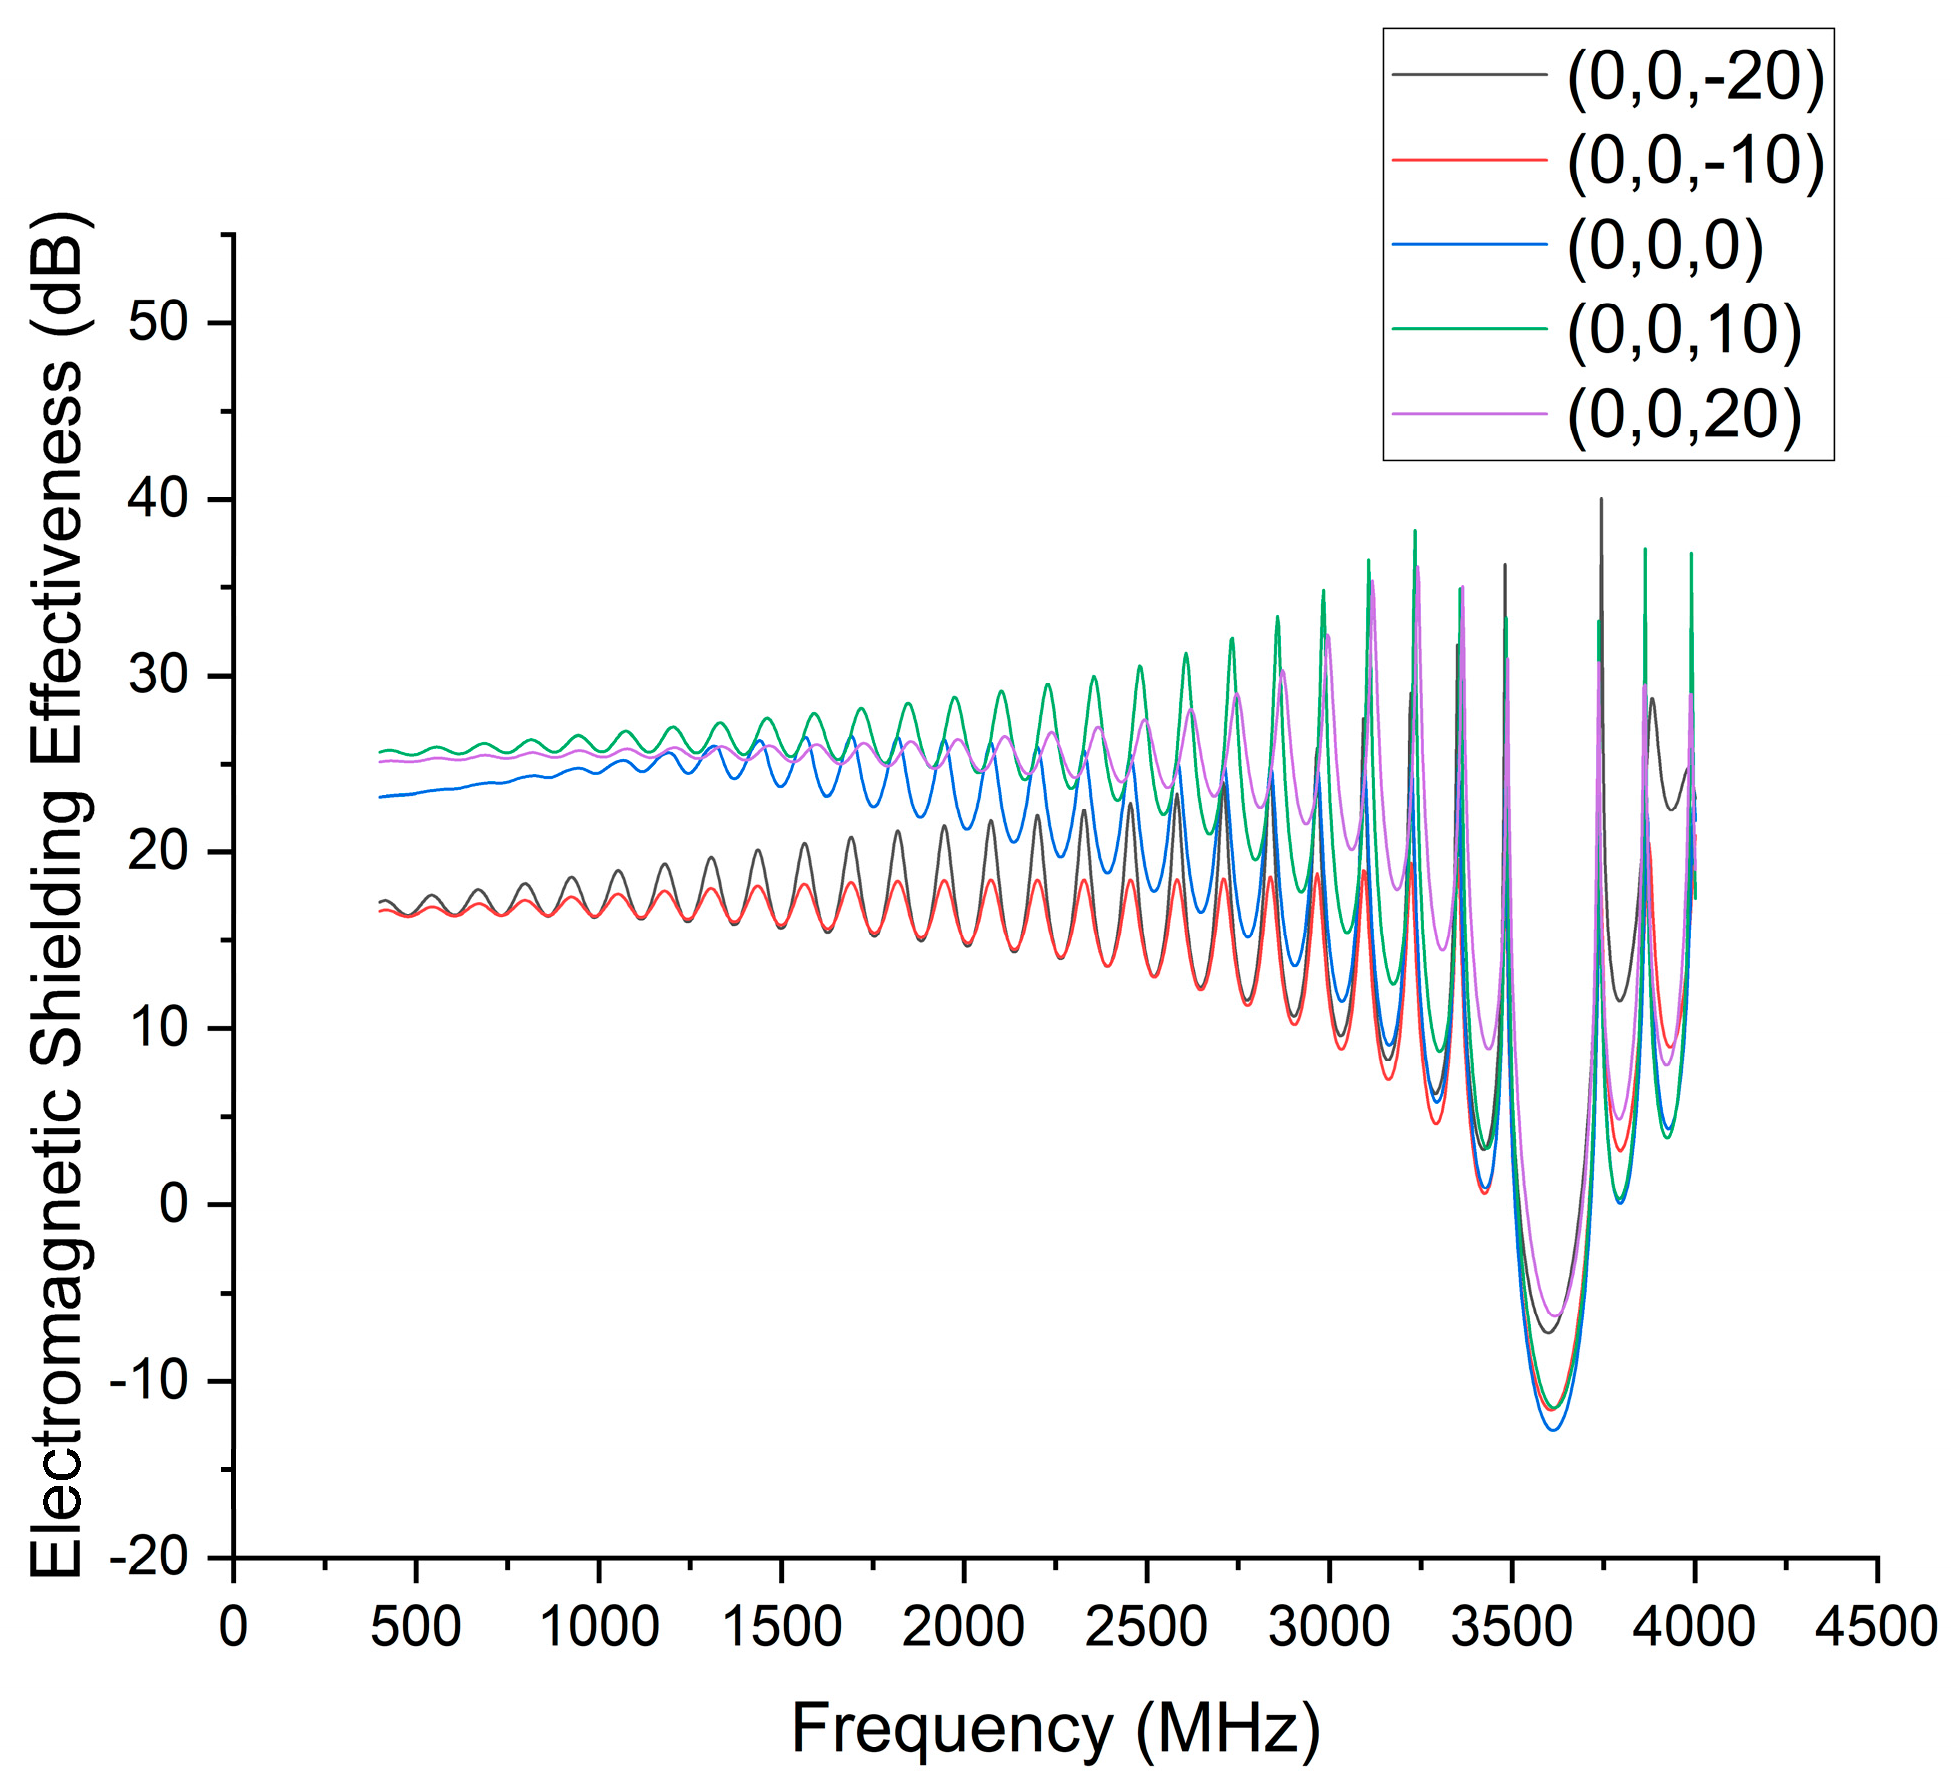
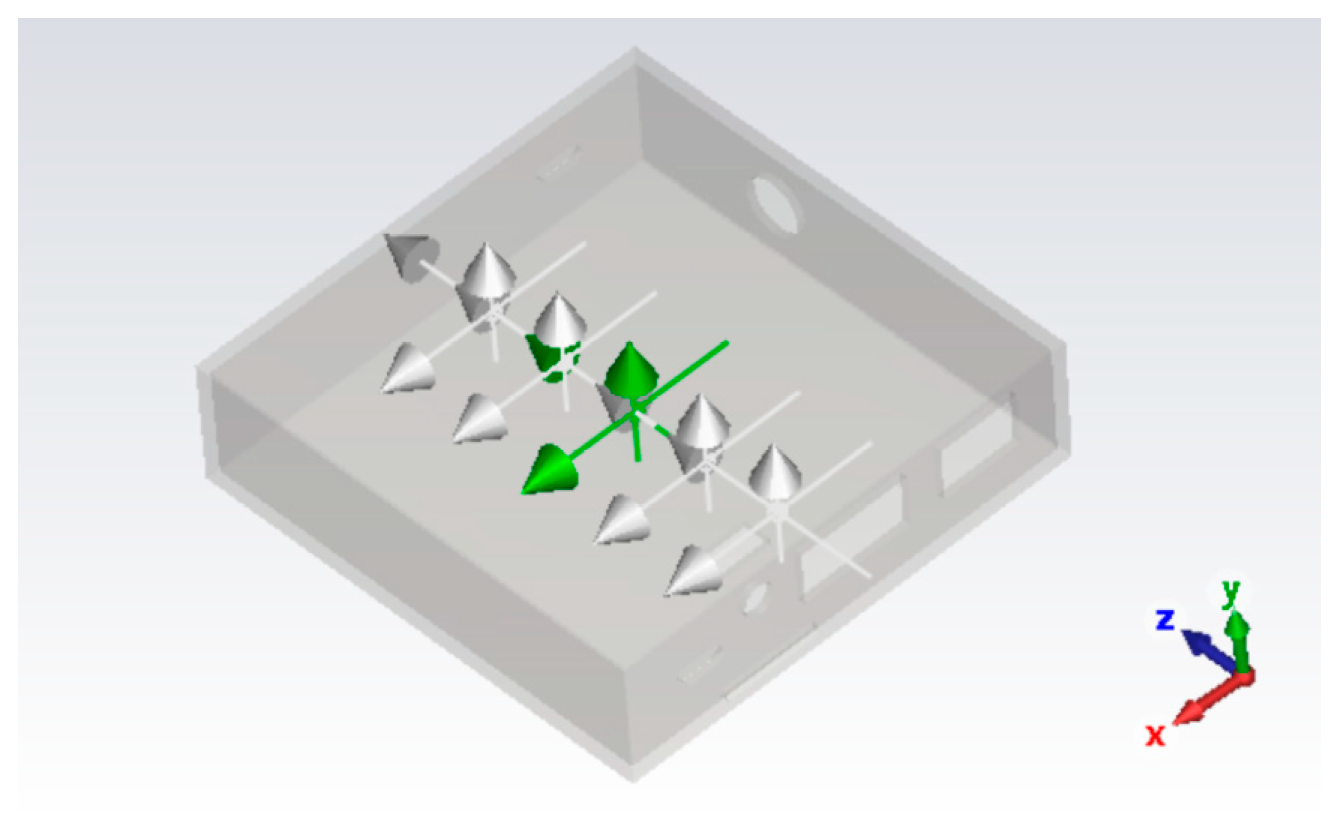
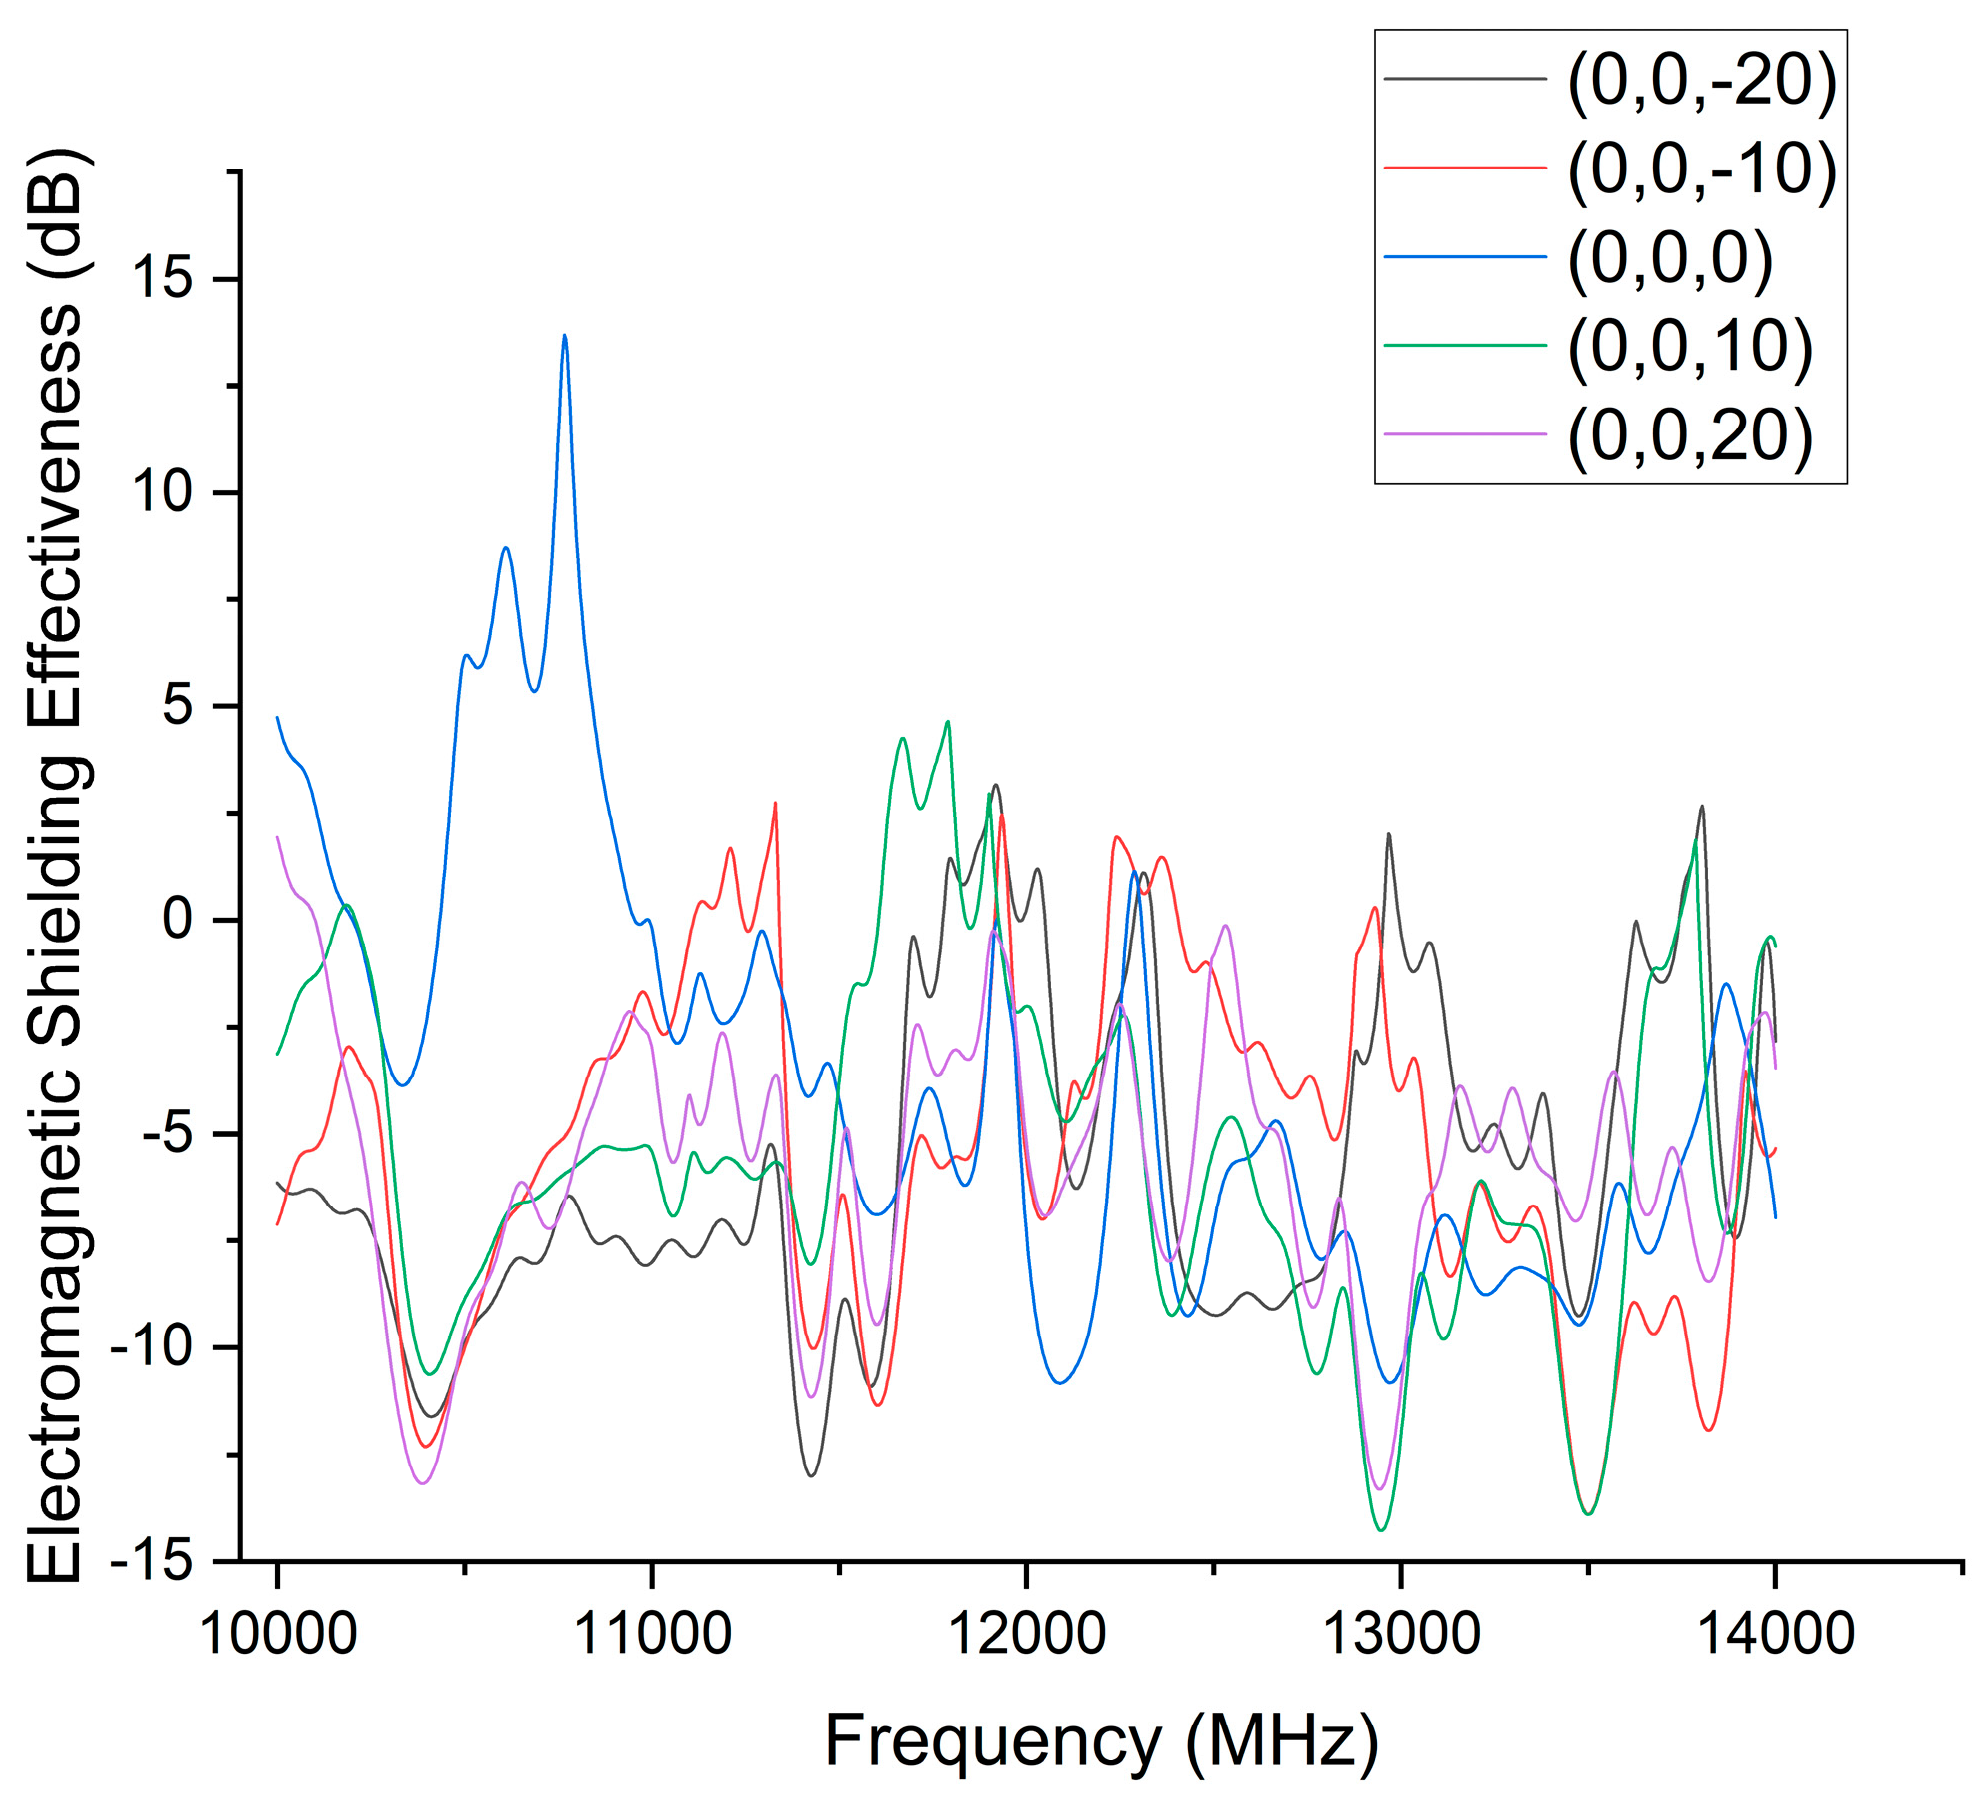
To investigate the influence of probe position on shielding effectiveness (SE) measurement, five electric field probes were placed at different locations: (0, 0, −20), (0, 0, −10), (0, 0, 0), (0, 0, 10), and (0, 0, 20). These points were arranged along the axis perpendicular to the aperture, from near to far, as illustrated in Figure 5.
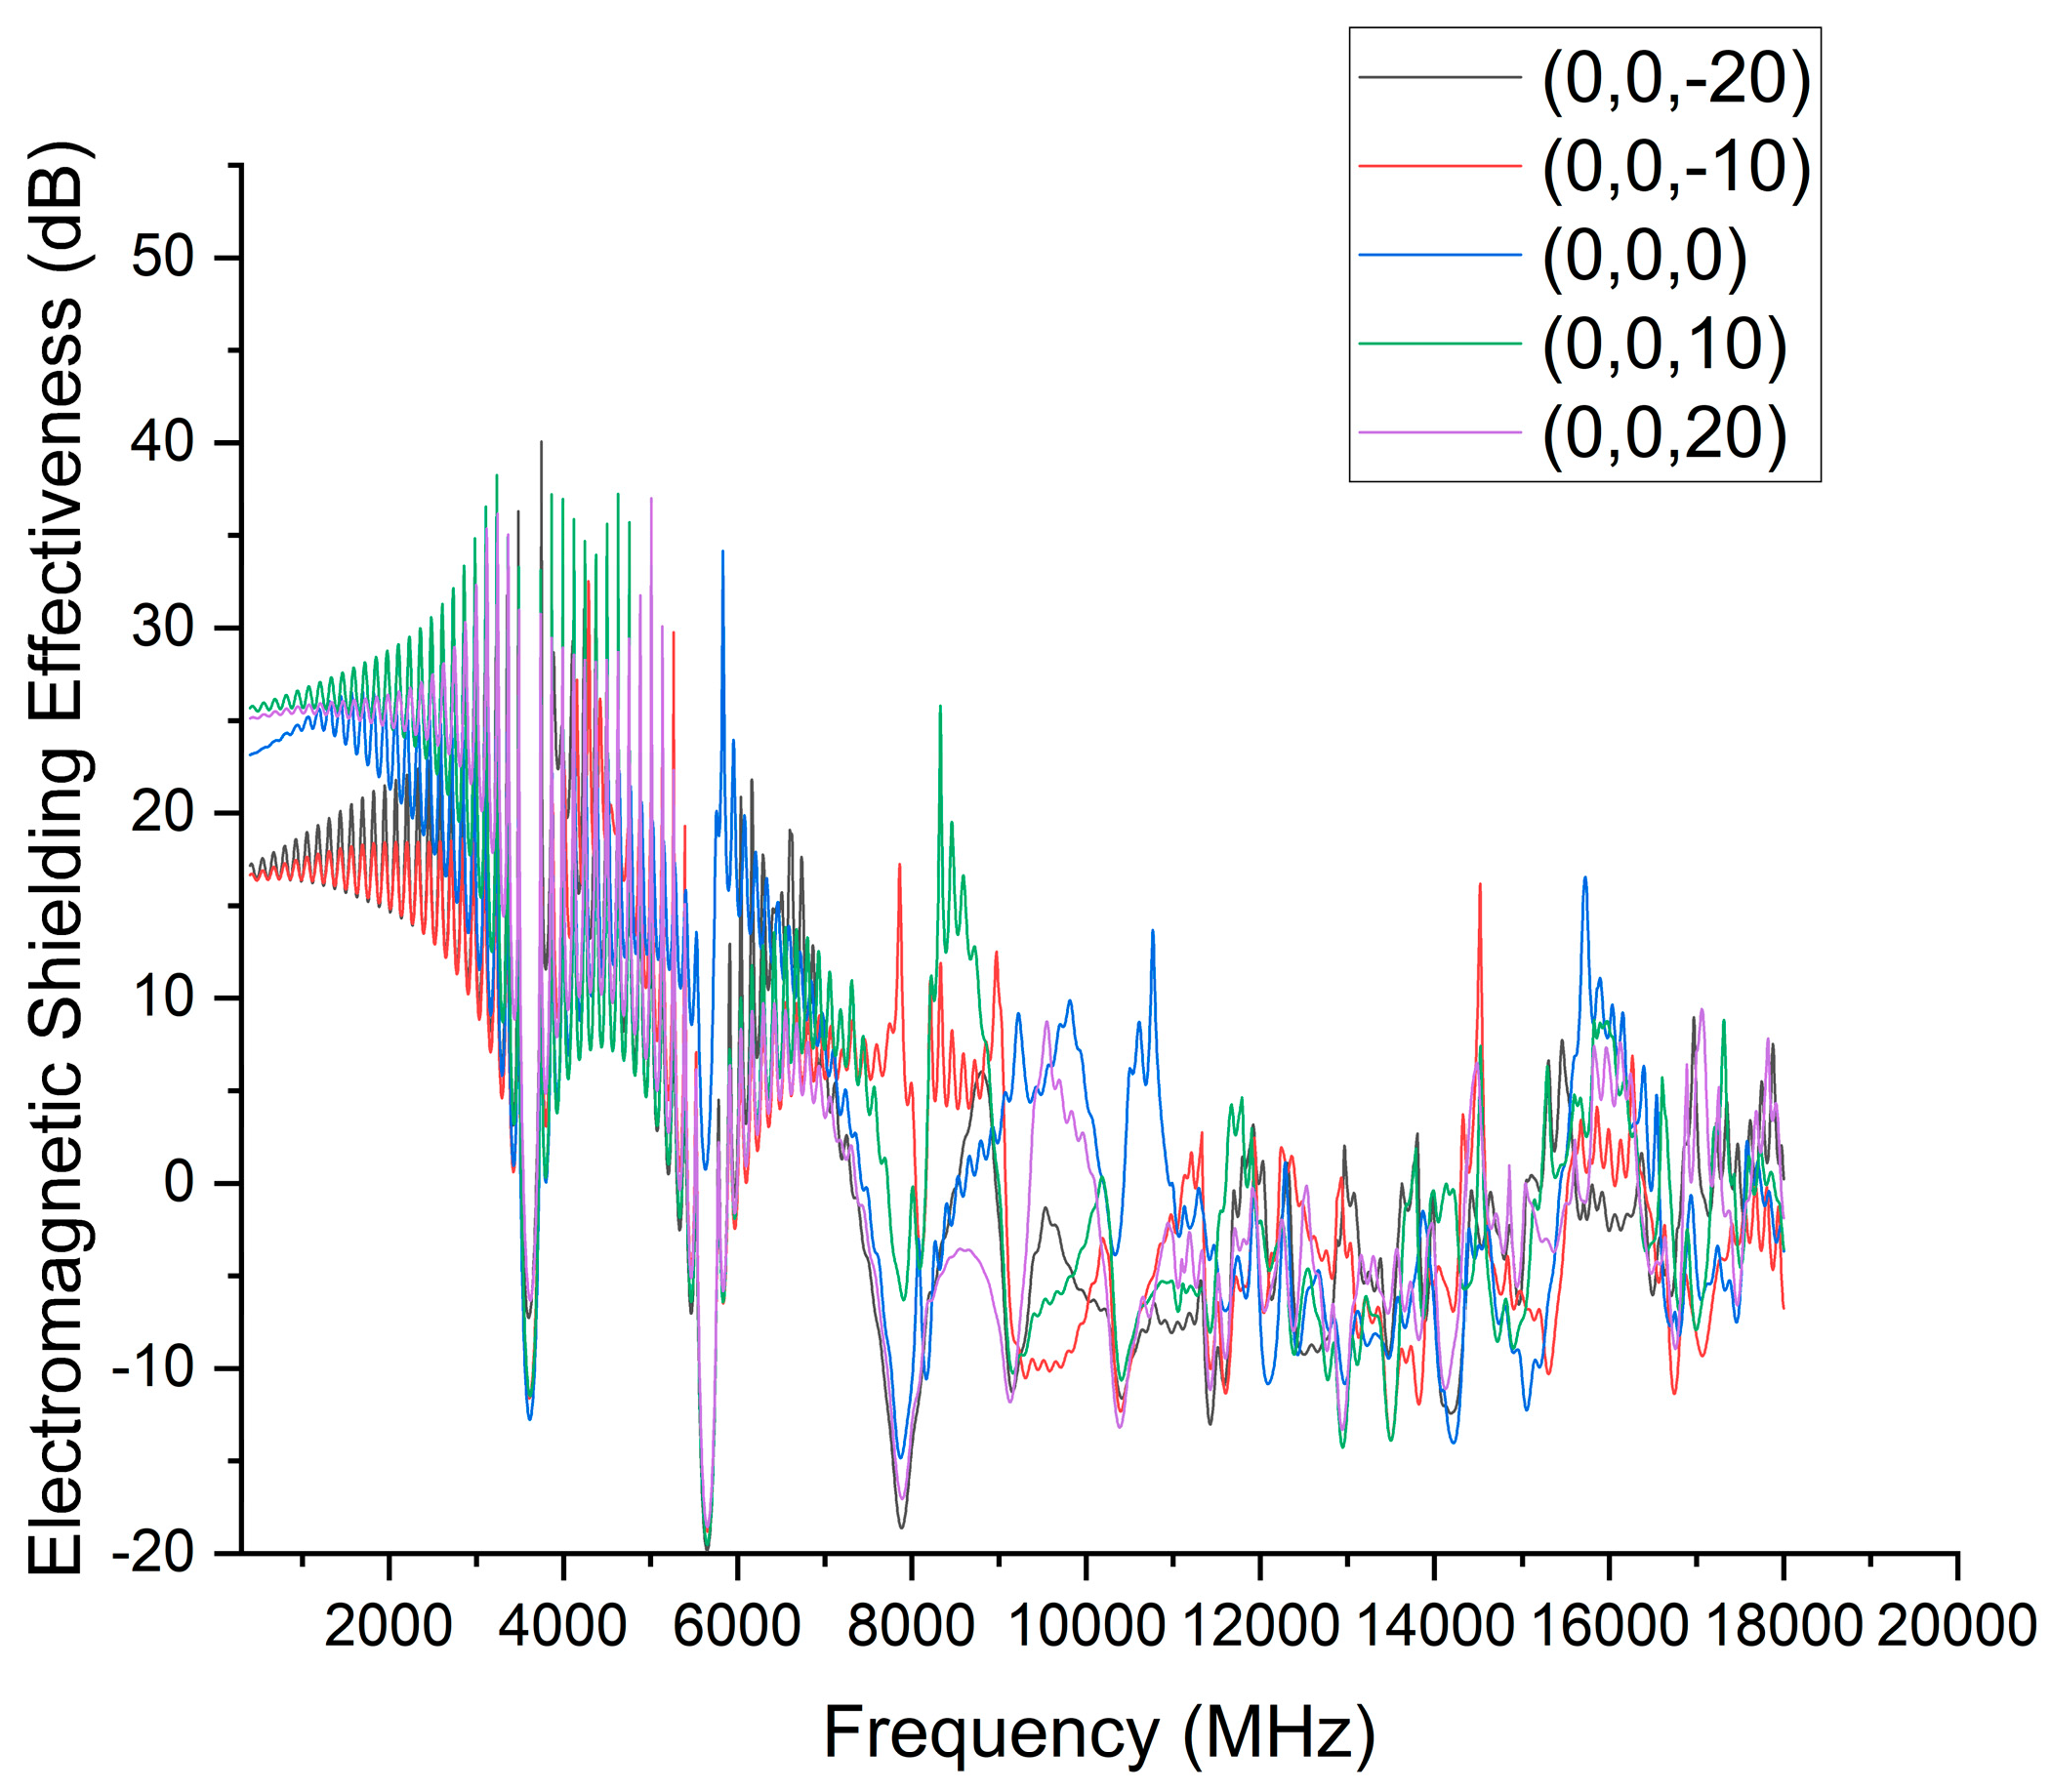
The simulation results for different probe positions are presented in Figure 6, Figure 7 and Figure 8.
At low frequencies, the SE was lowest at the central point (0, 0, 0). At higher frequencies, the overall trend shows that SE increases with distance from the aperture, because the aperture acts as the dominant coupling path for HIRF signals. Probes located closer to the aperture are more directly affected by the leakage field, resulting in lower SE values.
Considering both stability and representativeness of the measurement, the central position (0, 0, 0) was ultimately selected as the reference probe for subsequent simulations. In addition, surface current monitors were configured at multiple frequencies to observe the distribution of induced surface currents within the enclosure.

4. Simulation and Results Analysis

4.1. Surface Current Distribution

To better understand the interaction between electromagnetic waves and the device enclosure, this section first analyzes the surface current distribution at different frequencies.
All shielding effectiveness (SE) results presented in this section are pointwise frequency-dependent values obtained from CST plane-wave excitation simulations, rather than band-averaged quantities.
The distribution of surface currents reflects the coupling strength of external fields to the enclosure and highlights regions where currents tend to concentrate. These features are key indicators for assessing shielding effectiveness and identifying potential electromagnetic leakage paths.
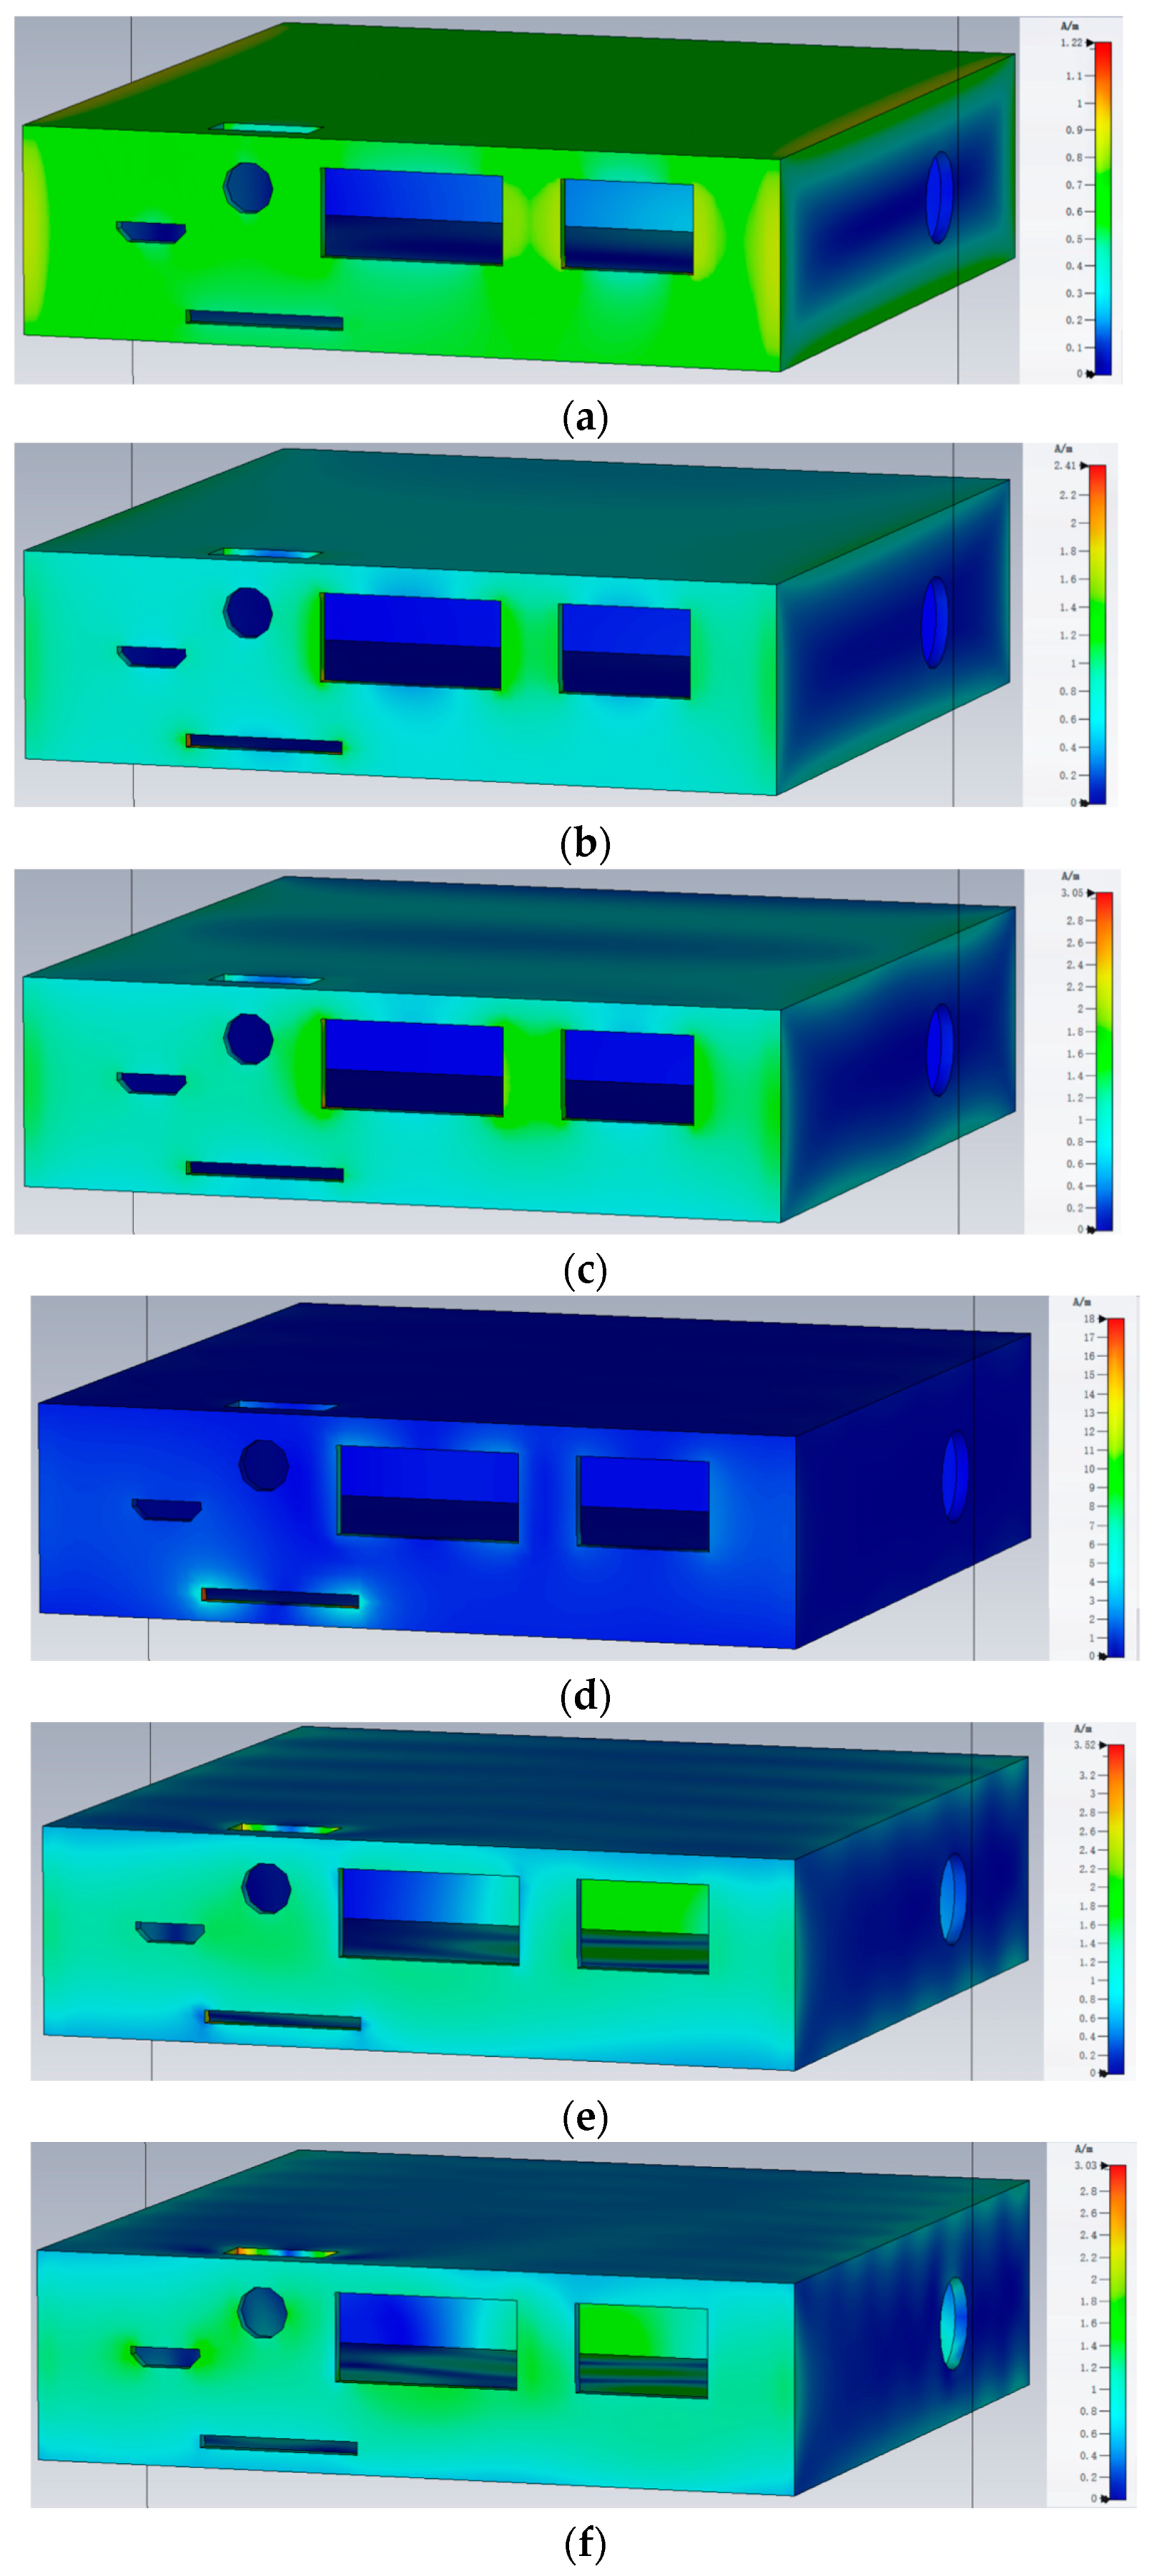
Figure 9 shows the surface current distribution on the enclosure at different frequencies, where warmer colors indicate higher current intensity. Frequency has a clear impact on both the pattern and the peak values of surface current distribution.
At 400 MHz, the current is relatively uniform with no strong local concentrations. The maximum value is only 1.22 A/m, and the long wavelength at this frequency does not couple effectively with the enclosure. As a result, shielding effectiveness is high and the risk of leakage is low. At 2000 MHz, the maximum current increases to 2.41 A/m, with localized enhancement around aperture edges and structural discontinuities. At 5000 MHz, the current further rises to 3.05 A/m.
At 10,000 MHz, the current surges to 18 A/m, concentrated around multiple front-facing apertures. This indicates resonance or strong coupling, leading to localized shielding failure. Similar trends are observed at 13,000 MHz and 18,000 MHz, where current hotspots remain near structural openings and slits.
In general, higher surface current density reflects stronger electromagnetic coupling into the interior and poorer shielding performance, while low-density regions correspond to better protection. These results show that, in high-frequency HIRF environments, shielding effectiveness is largely constrained by local coupling at structural discontinuities. Therefore, optimizing edges, current concentration zones, and seams should be prioritized to enhance overall shielding performance.

4.2. Effect of Polarization Modes

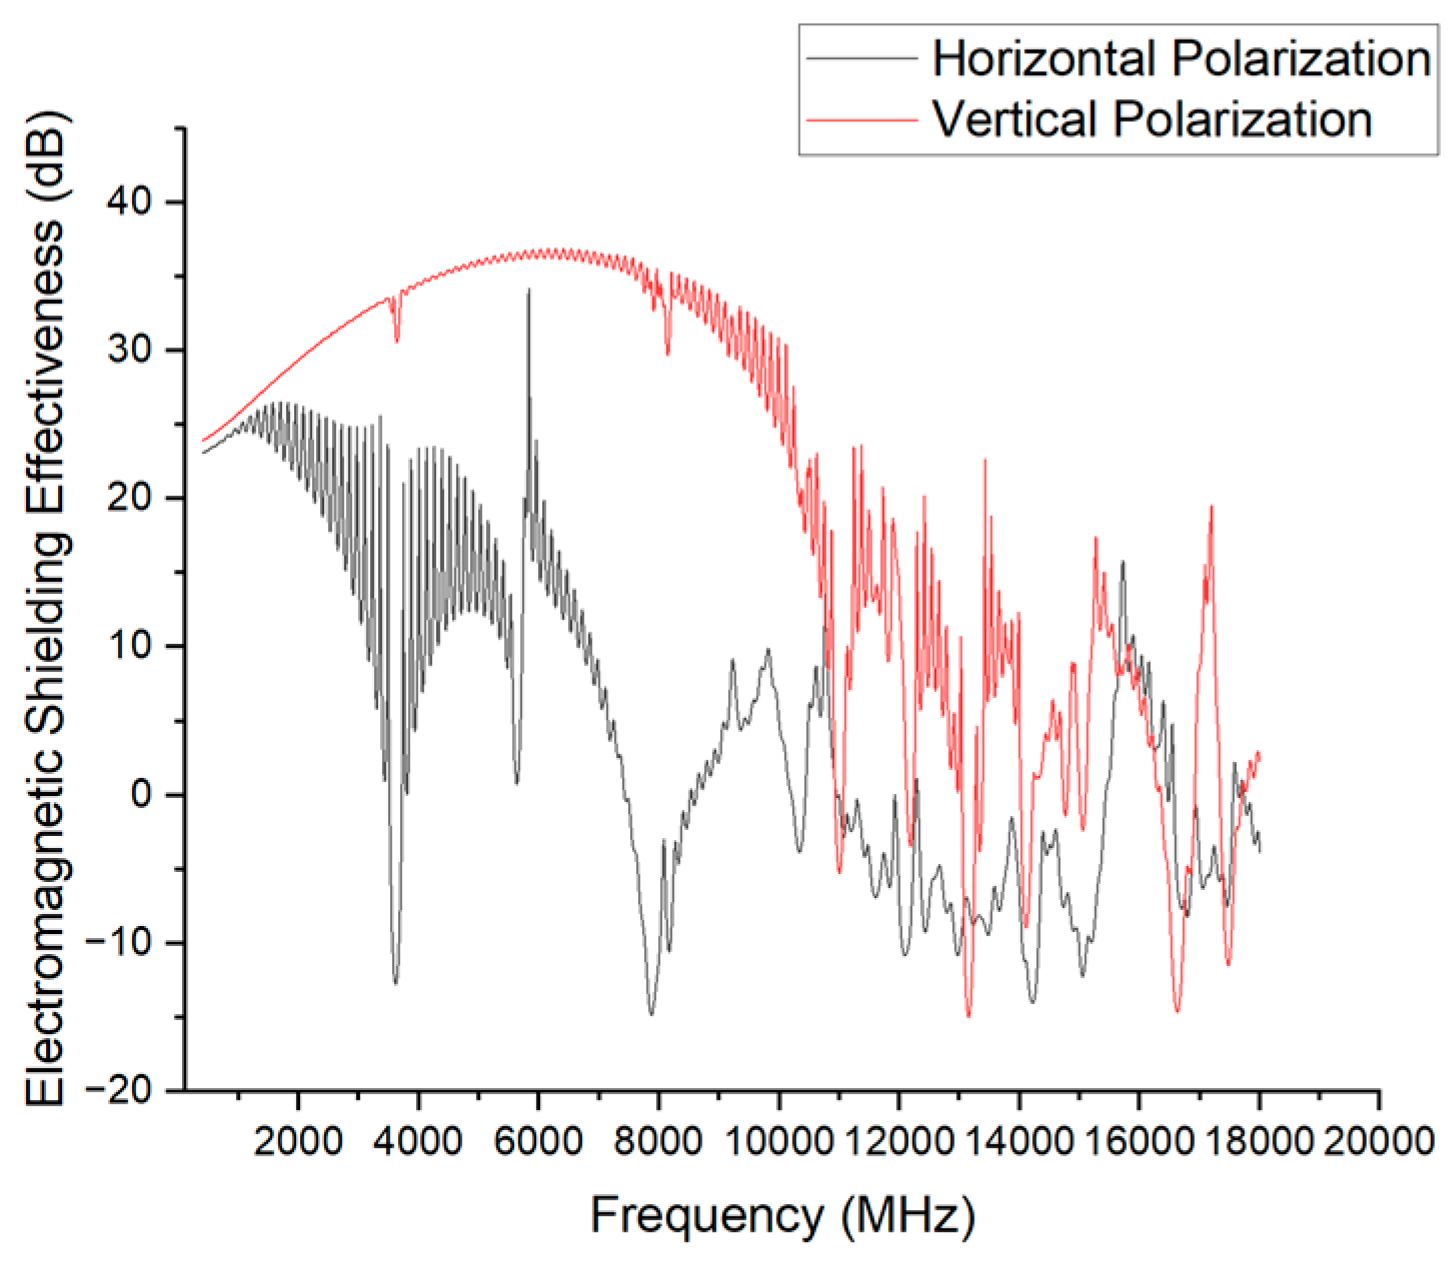
The polarization direction of an electromagnetic wave strongly influences its coupling with structural features such as seams and apertures. The shielding effectiveness (SE) results under horizontal and vertical polarization are shown in Figure 10. This comparison illustrates how polarization affects coupling paths and resonance phenomena.
The simulation results reveal significant differences in shielding effectiveness depending on both frequency and polarization mode:
  • 1–3 GHz: Shielding effectiveness remains between 20 and 35 dB for both polarizations, with minimal difference.
  • 3–6 GHz: Resonant effects emerge under horizontal polarization, especially near 3.6 GHz and 5.7 GHz, where strong coupling with enclosure gaps and openings reduces SE to below −10 dB. Vertical polarization, however, maintains SE at around 30 dB in this range.
  • 6–10 GHz: Under vertical polarization, SE gradually decreases. Horizontal polarization shows a temporary recovery but again exhibits resonance near 8 GHz, dropping below −10 dB.
  • Above 10 GHz: Both polarizations undergo strong resonance-induced fluctuations, leading to a marked reduction in SE.
Overall, horizontal polarization results in faster attenuation and a wider frequency range of shielding failures. To ensure a stringent evaluation and capture worst-case conditions, horizontal polarization is therefore adopted as the standard excitation mode in subsequent simulations.

4.3. Effect of Incidence Angle

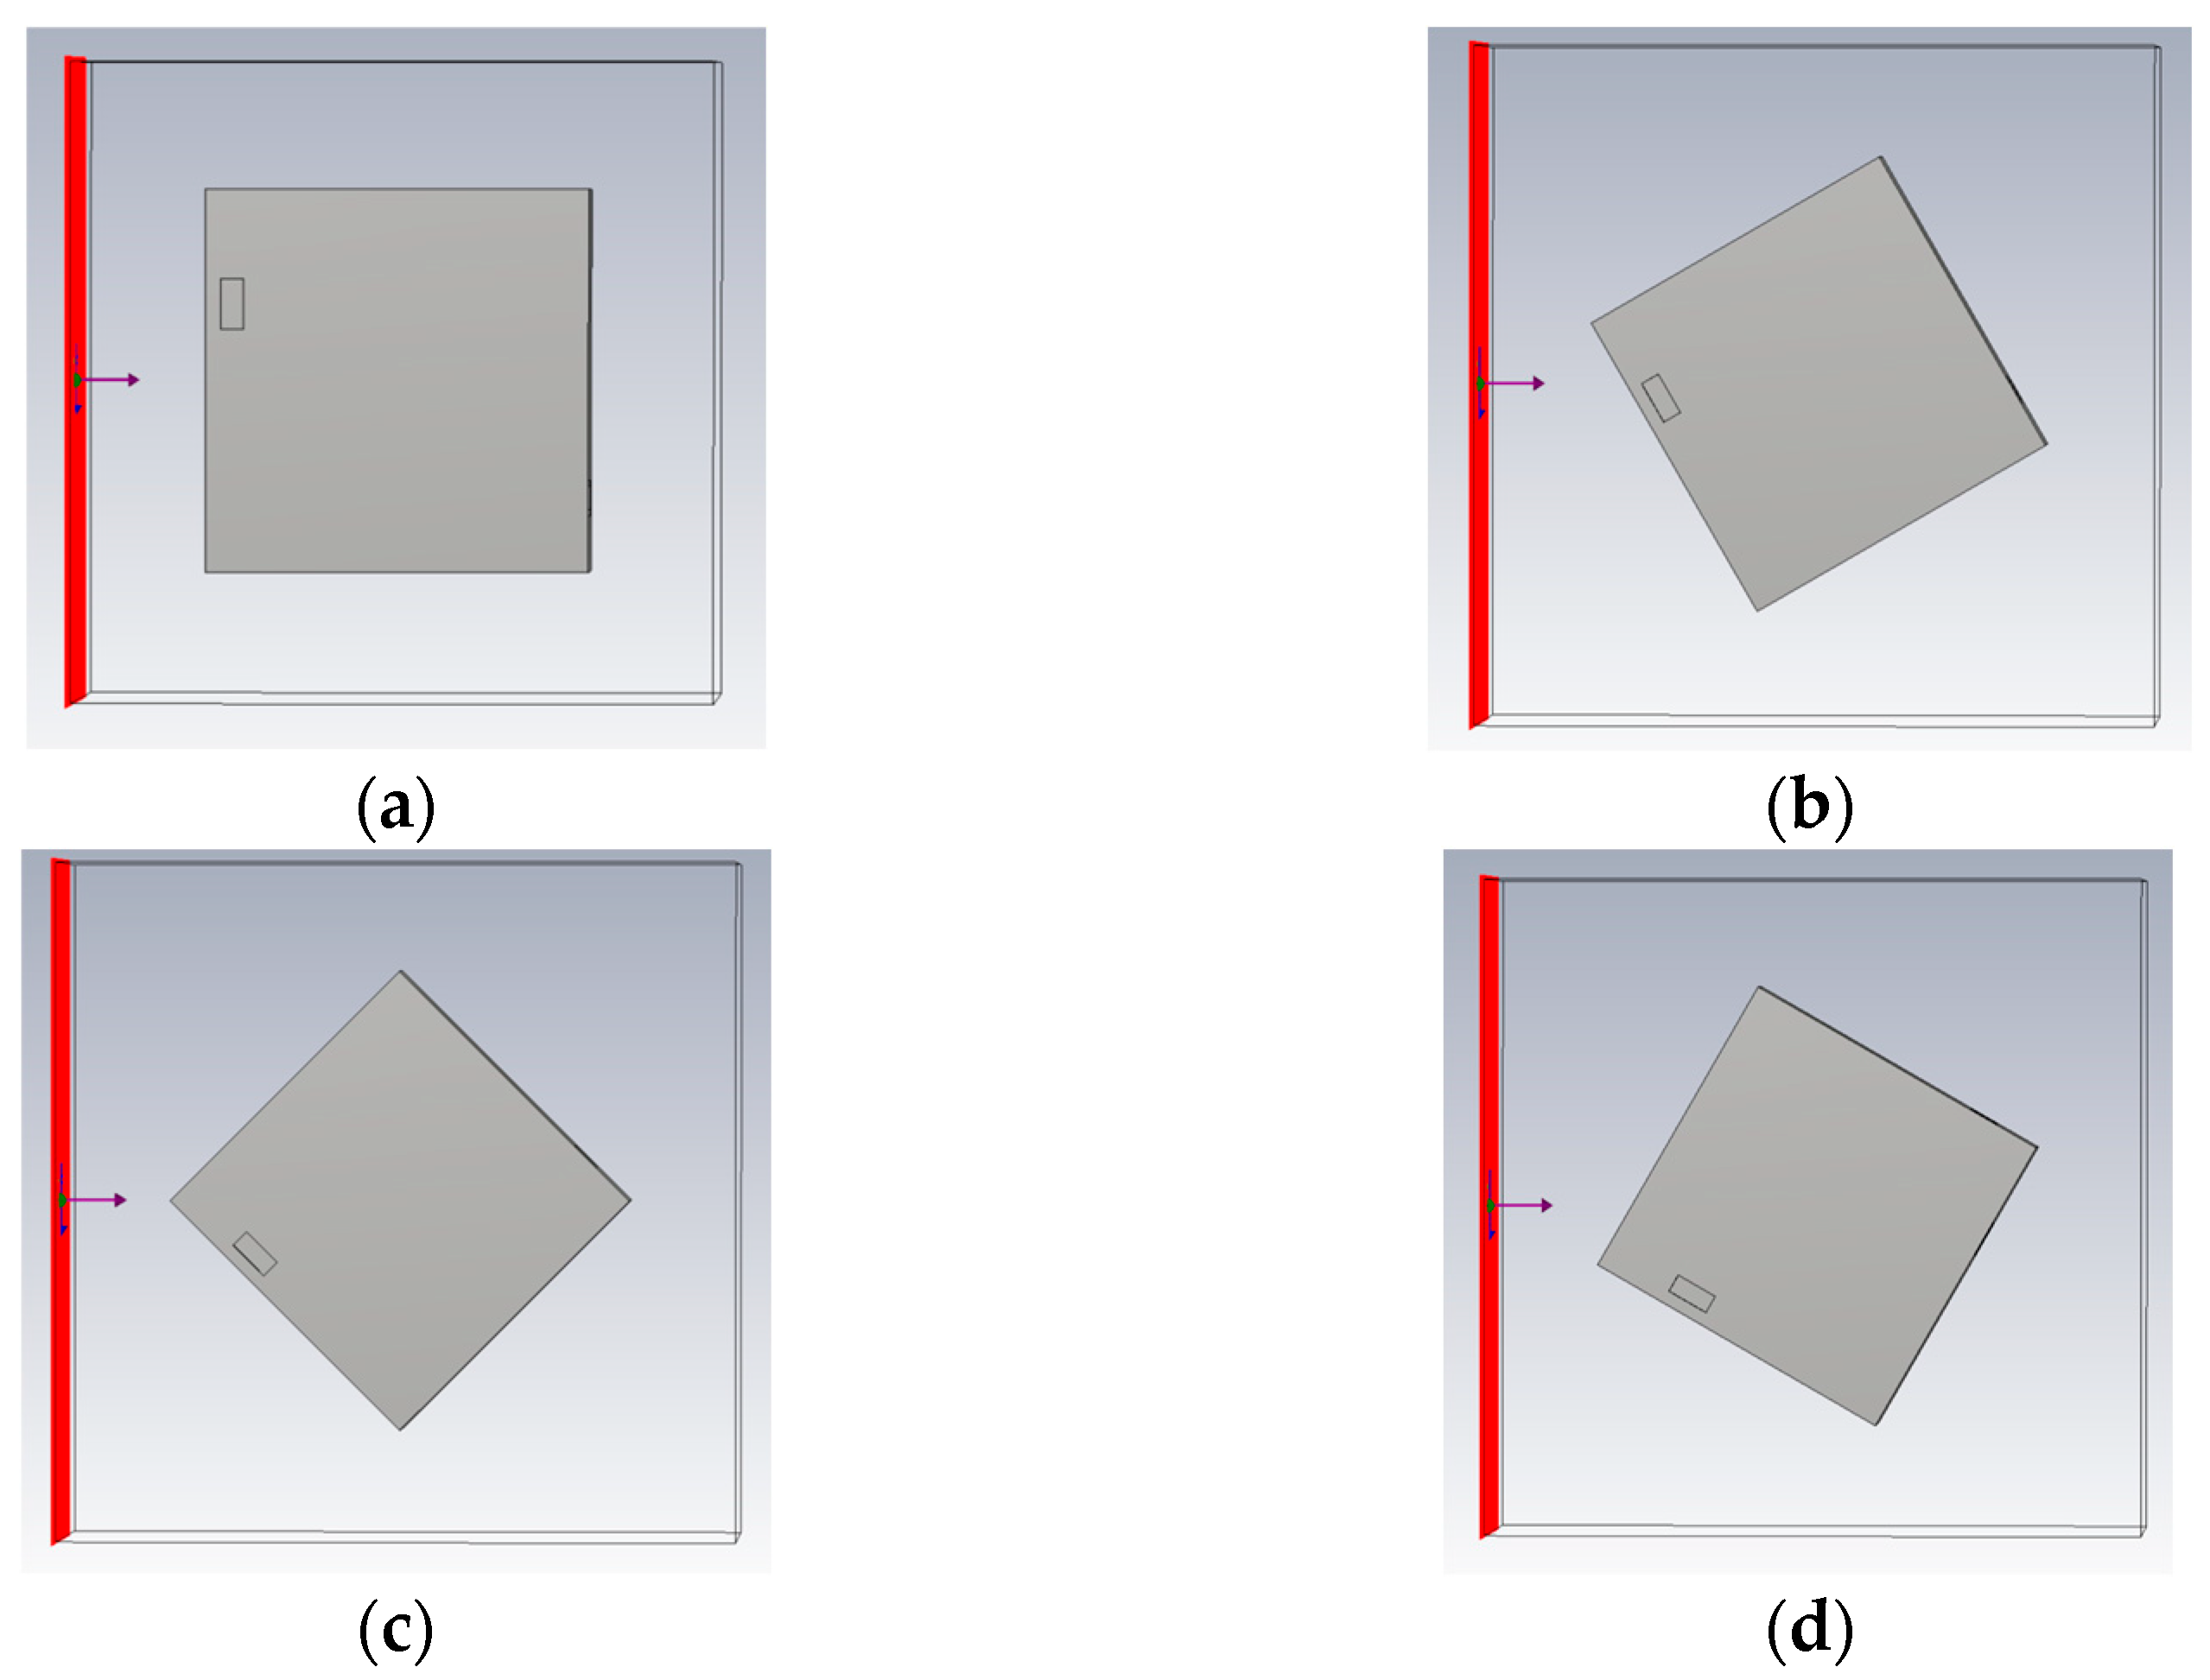
In actual High-Intensity Radiated Fields (HIRF) environments, electromagnetic waves may strike the device surface from arbitrary angles. To investigate the influence of incident angle on shielding effectiveness, this section presents simulation analyses at several typical angles to evaluate their impact on shielding performance, as illustrated in Figure 11.
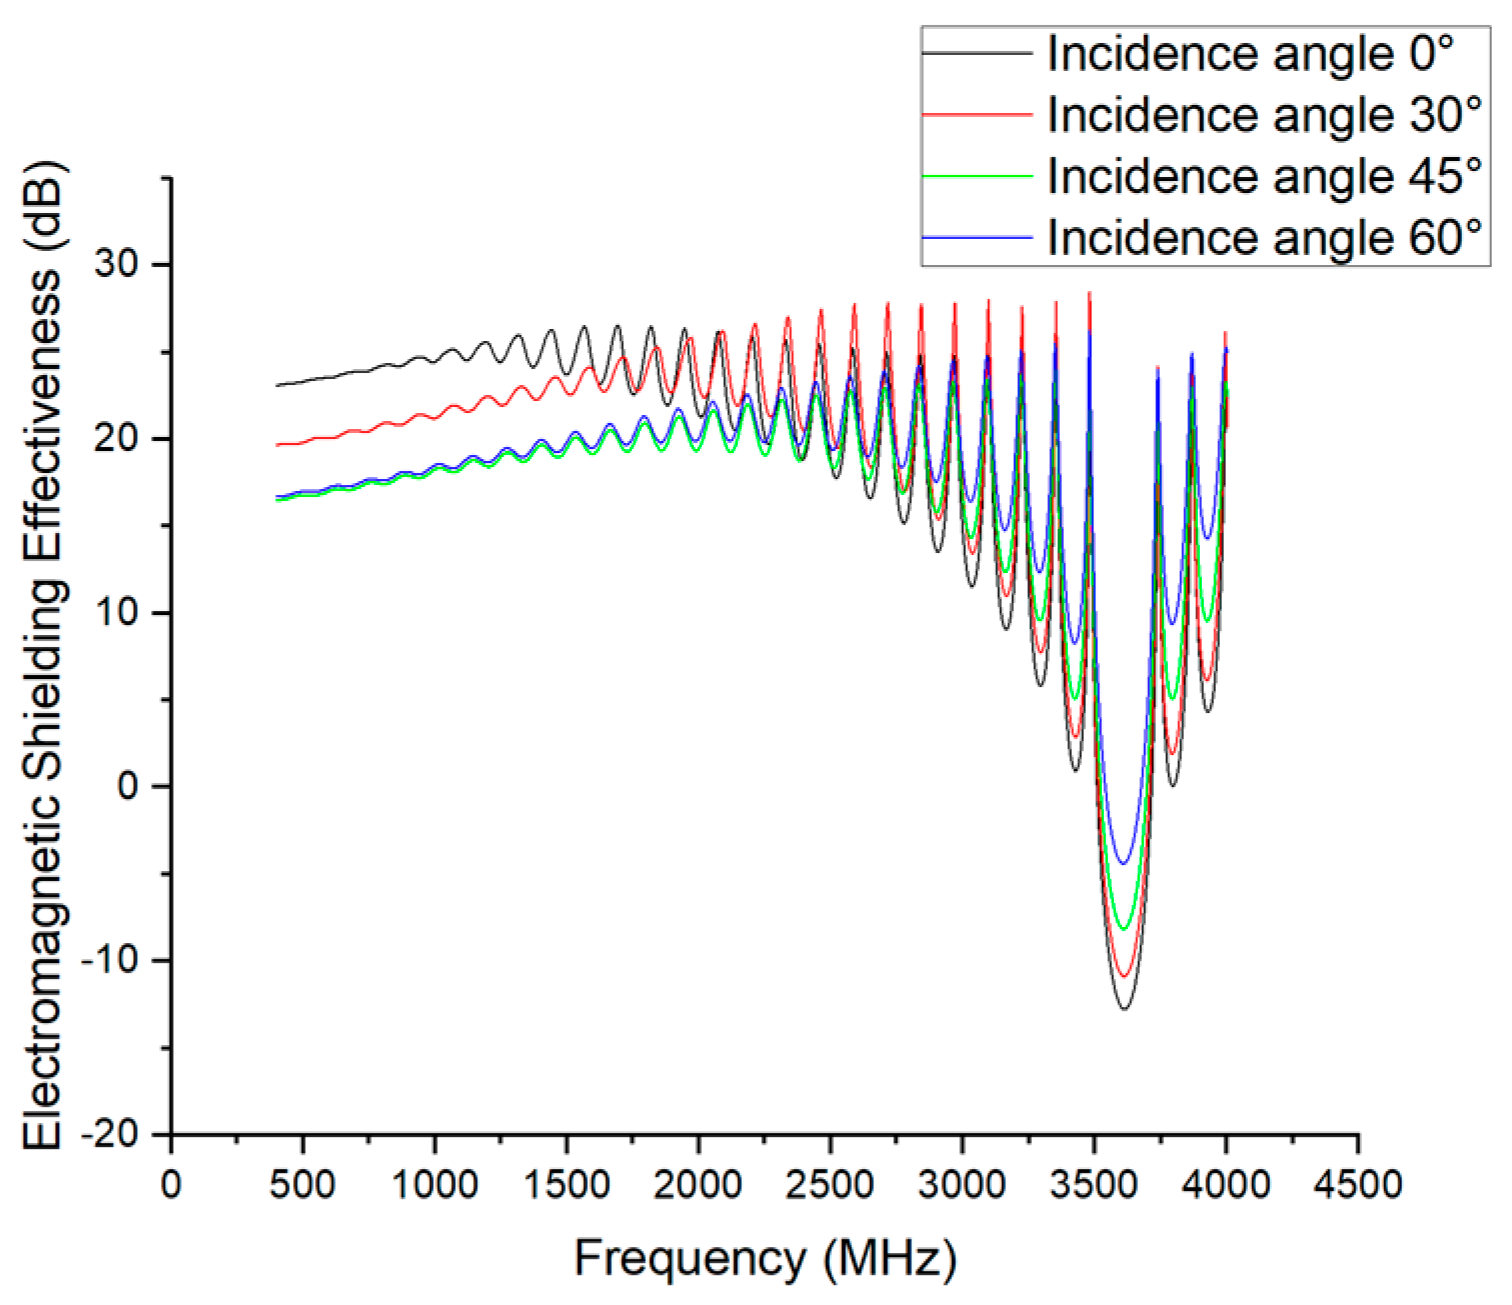
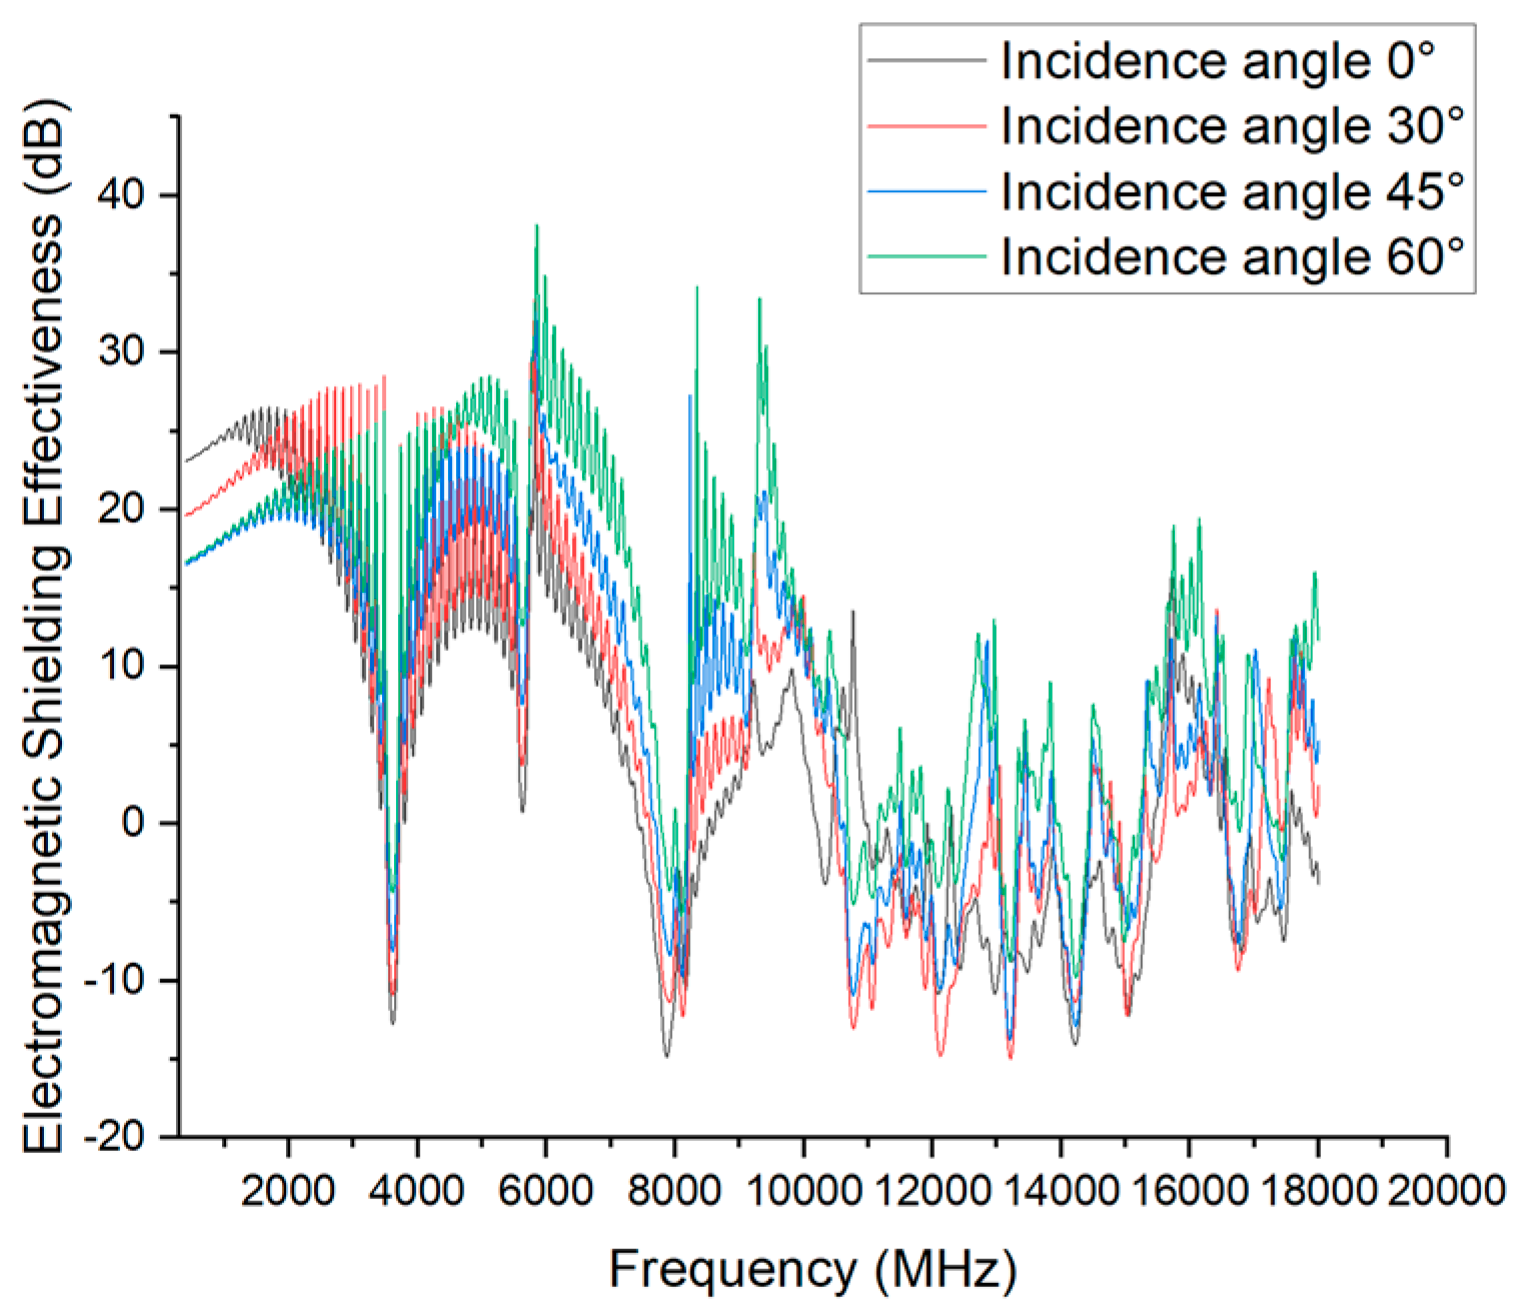
The simulation results for different incidence angles are presented in Figure 12, which shows the shielding effectiveness across the full frequency range.
The shielding effectiveness in the low-frequency range (below 1 GHz) is shown in Figure 13, where the SE curves remain largely consistent across incidence angles.
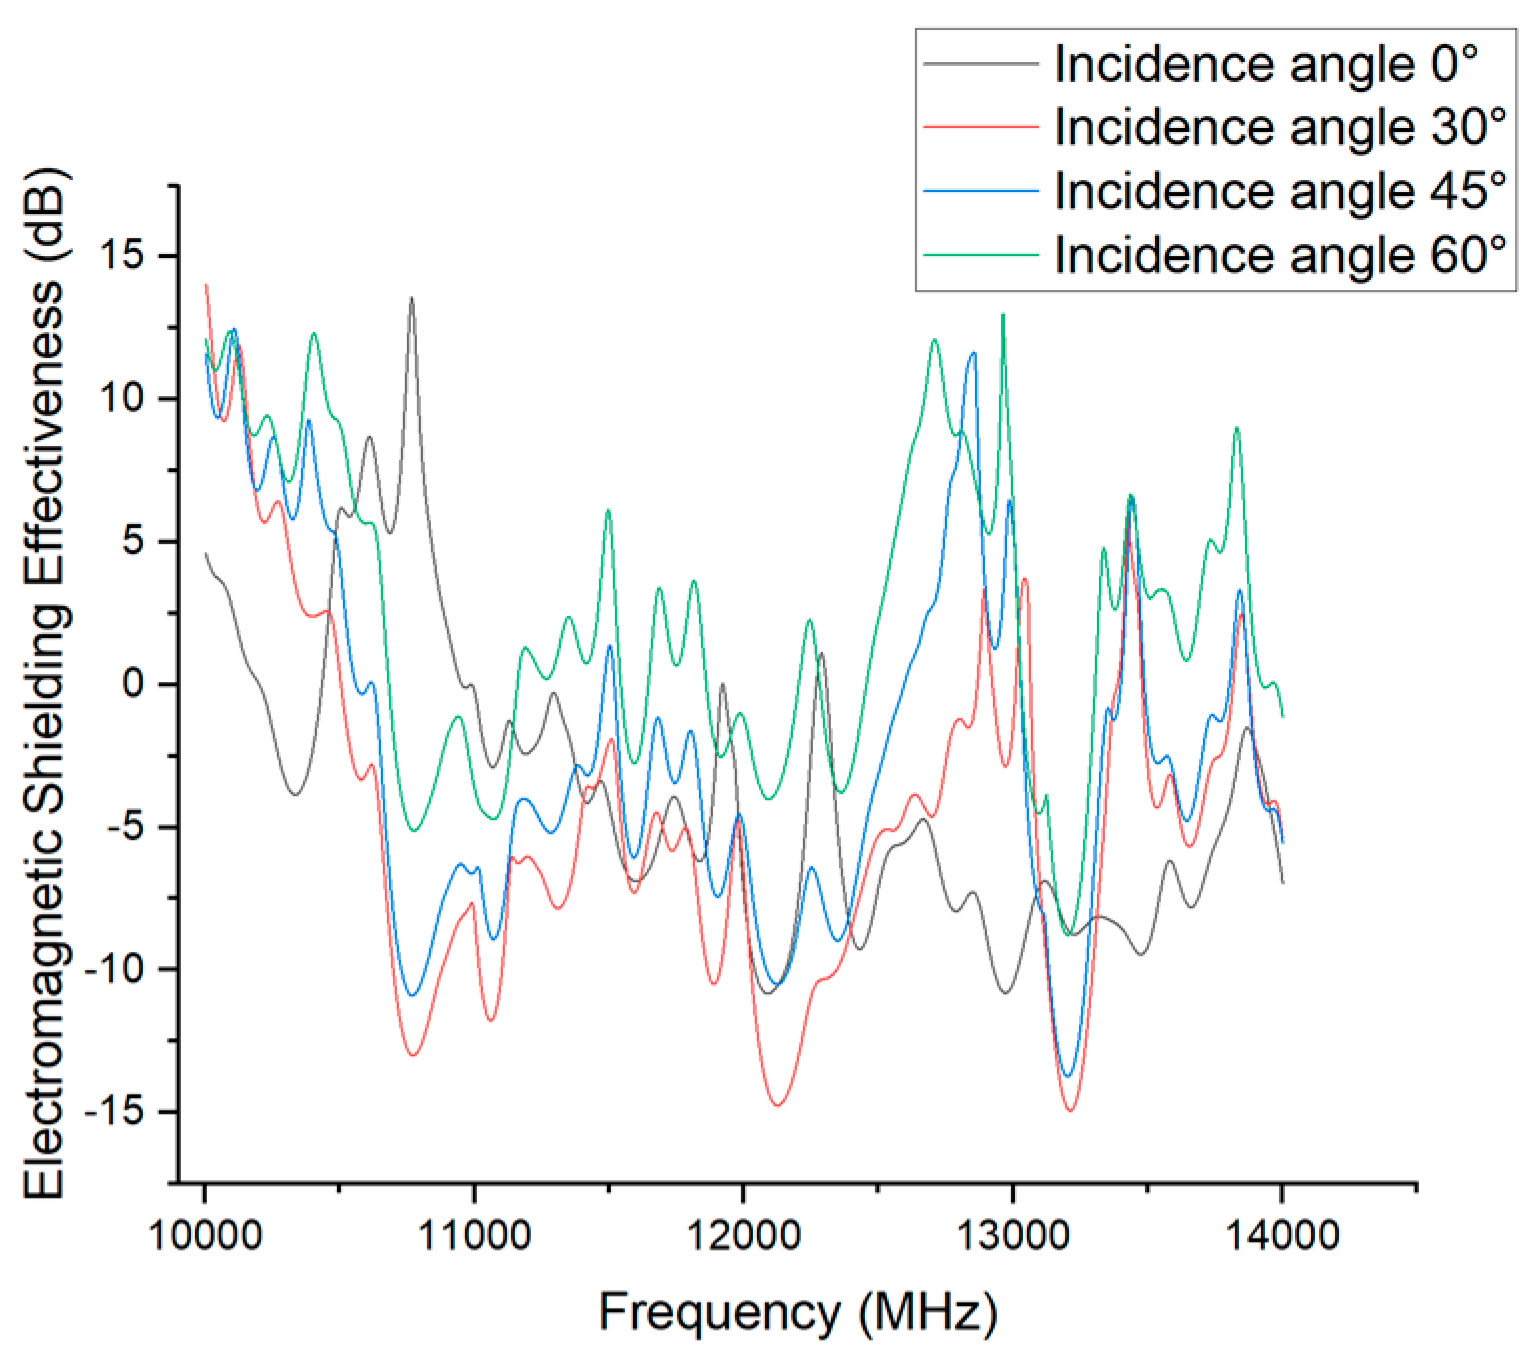
The high-frequency behavior (above 10 GHz) is illustrated in Figure 14, which reveals stronger resonance–induced fluctuations and greater angle sensitivity.
A comparison of SE curves at 0°, 30°, 45°, and 60° shows that angle sensitivity is most pronounced in the 3–10 GHz range. Near 3.6 GHz and 8 GHz, clear resonance effects appear: SE drops to about −10 dB at 0° and 30°, while the minima are mitigated to −6 dB and −3 dB at 45° and 60°, respectively. In the 6–8 GHz band, 60° incidence produces a peak SE of nearly 40 dB, approximately 25 dB higher than at 0°, with other angles falling in between. These results suggest that oblique incidence weakens the electric field component parallel to enclosure slits, thereby reducing coupling through gaps and apertures.
By contrast, in the 1–3 GHz and above 10 GHz ranges, differences among the SE curves are negligible, with variations limited to 2–4 dB. This indicates that shielding effectiveness is relatively insensitive to incident angle at low frequencies—where the wavelength is much larger than structural features—and at very high frequencies with complex multimode interactions.
In summary, incidence angle mainly influences the resonance bandwidth and the depth of SE peaks and valleys in the mid-frequency range, while its effect on the broadband average shielding effectiveness is limited.

4.4. Effect of Incident Surface

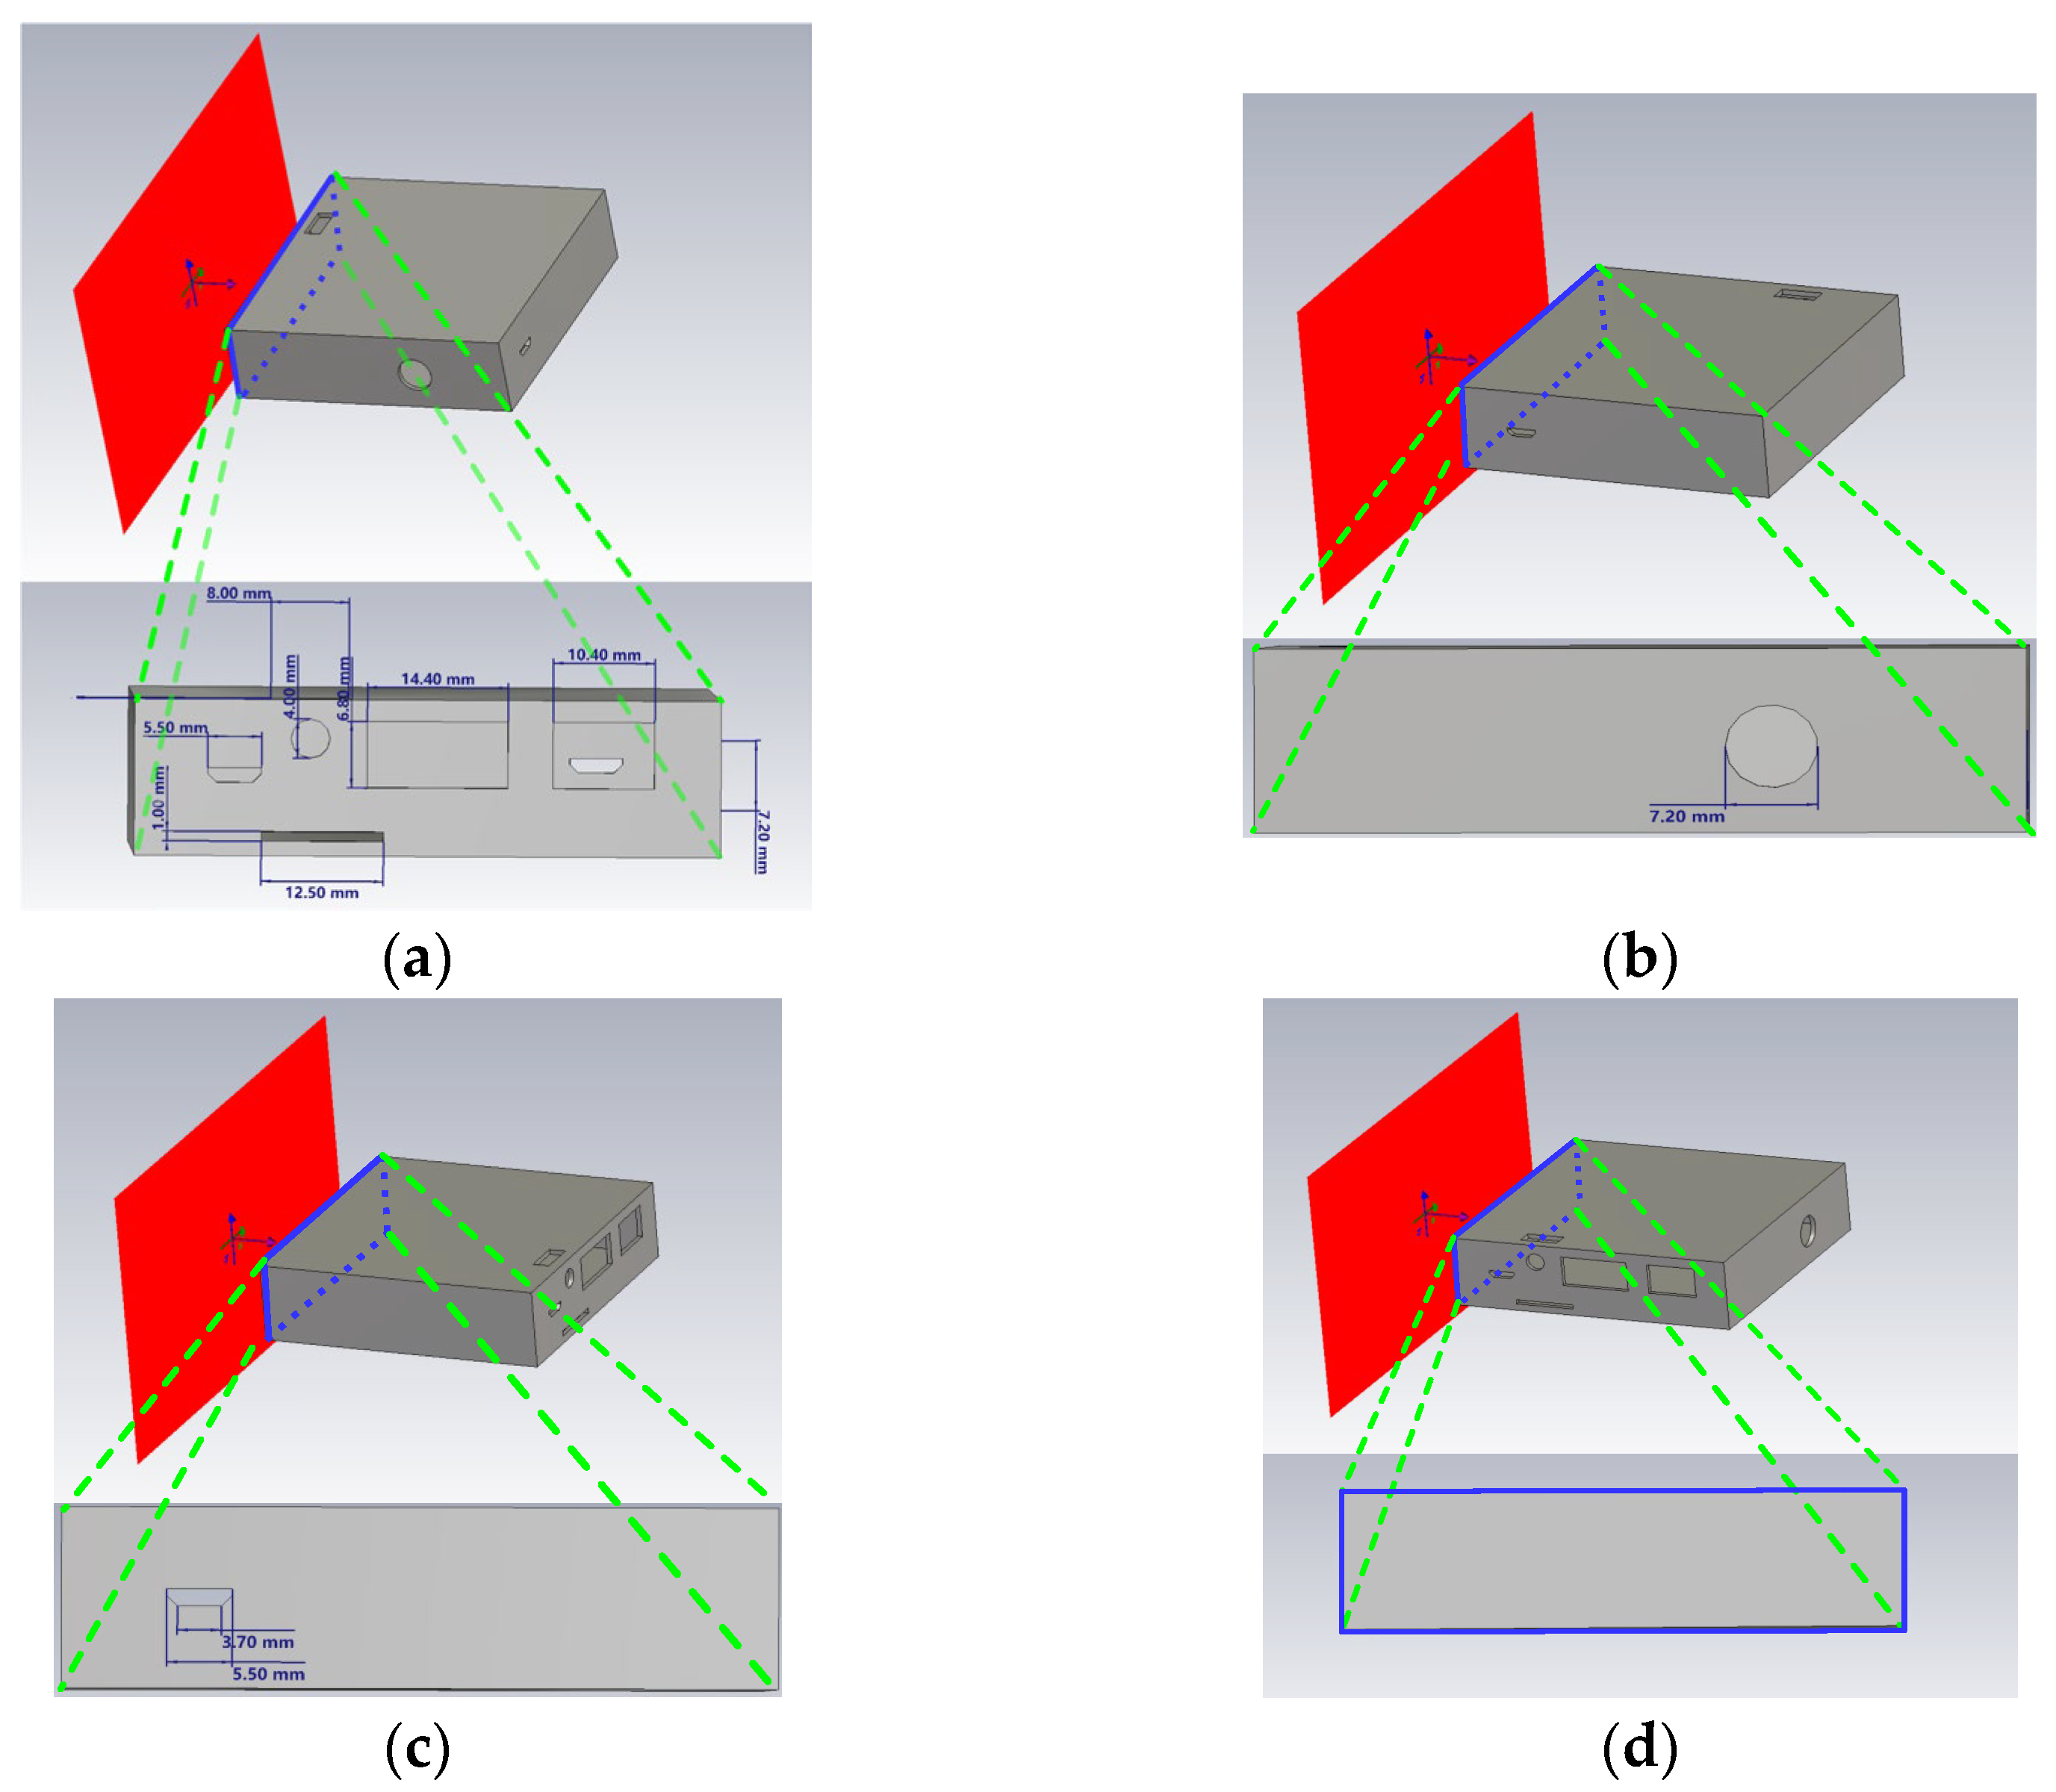
Different enclosure surfaces have distinct structural features and aperture distributions, leading to significant variations in their resistance to external electromagnetic radiation. This section compares several representative incident surfaces to examine how surface structure influences shielding effectiveness and to provide guidance for future structural optimization, as illustrated in Figure 15.
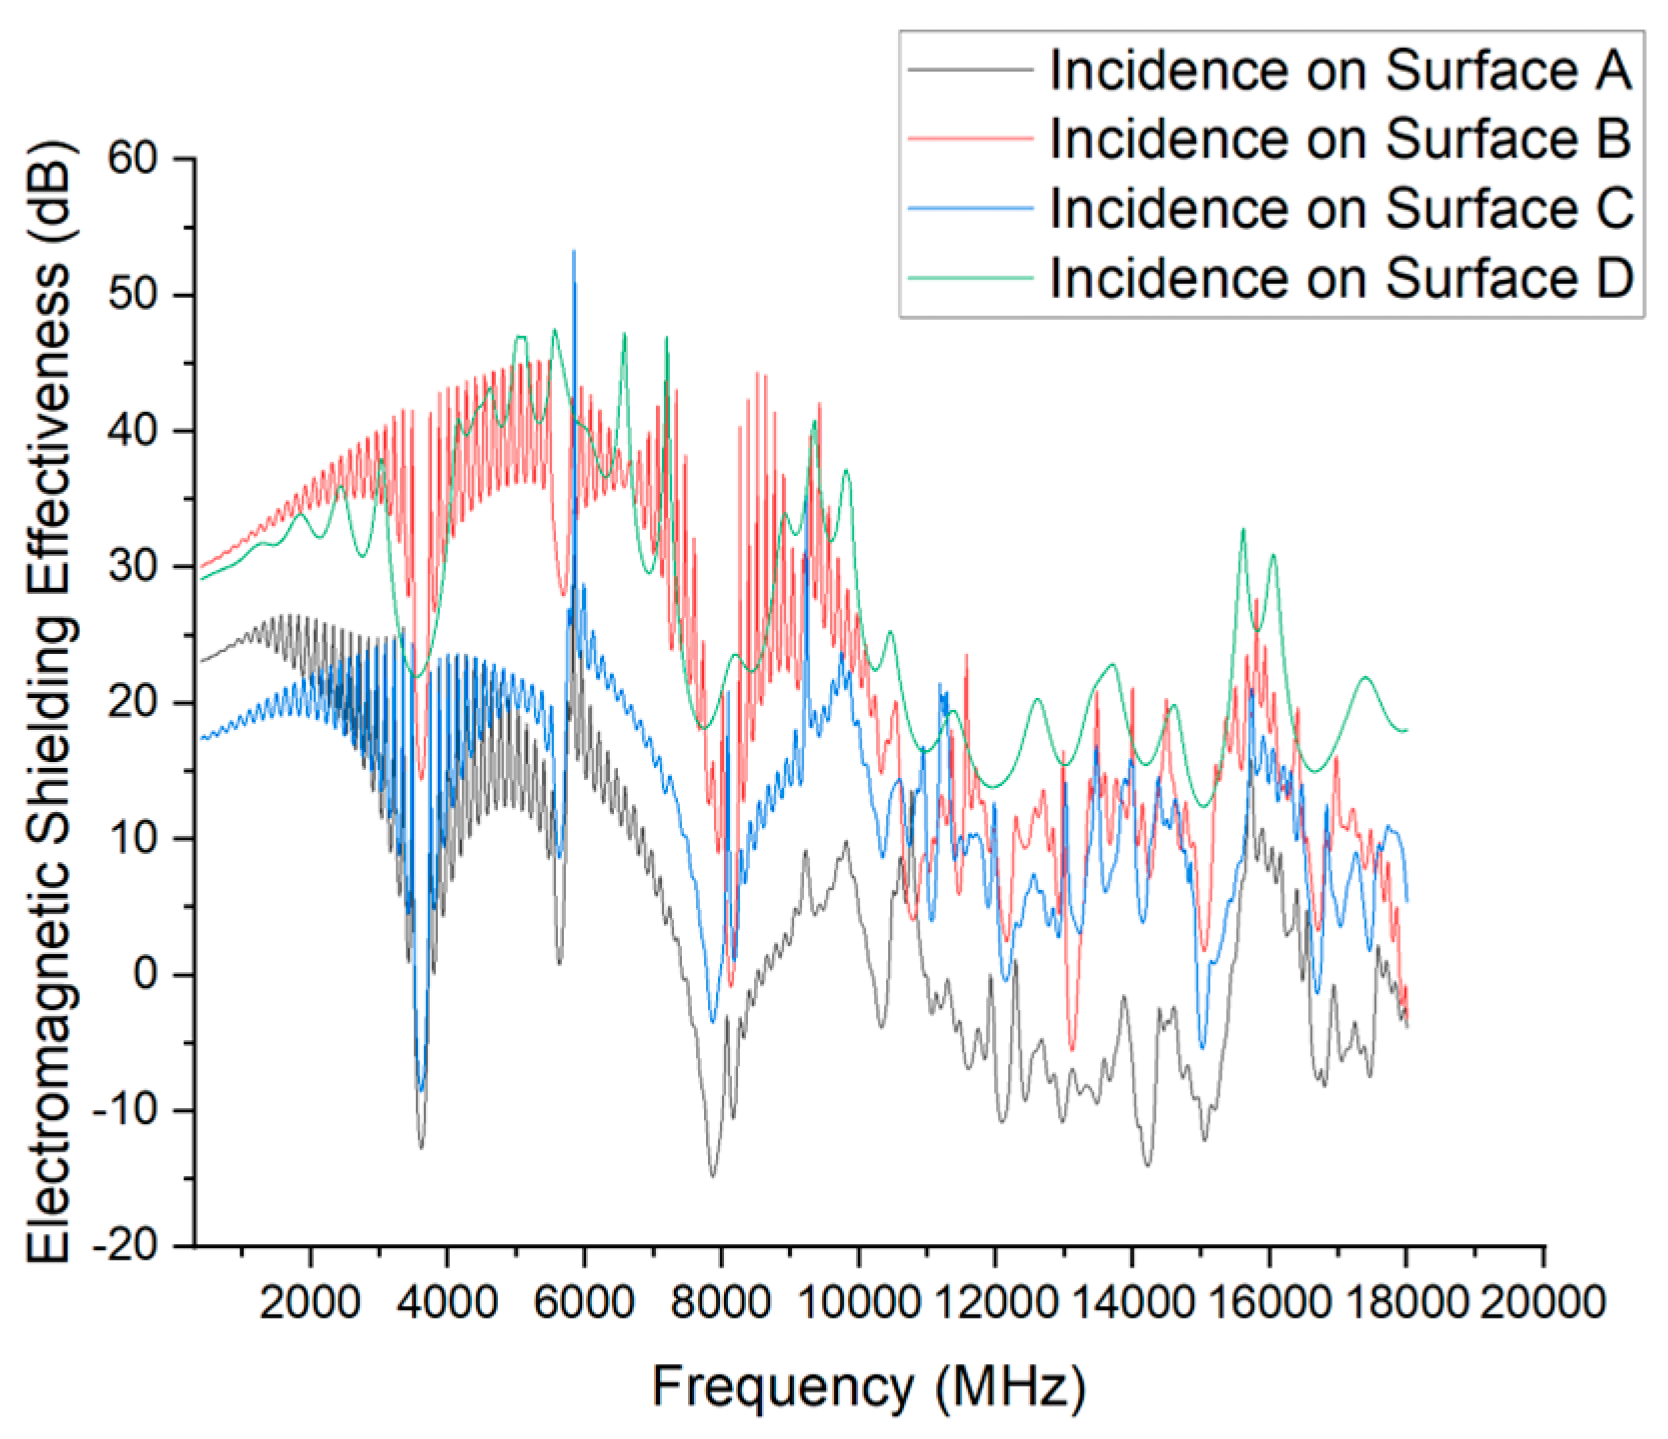
The SE under different incident surfaces across the full-frequency range is shown in Figure 16.
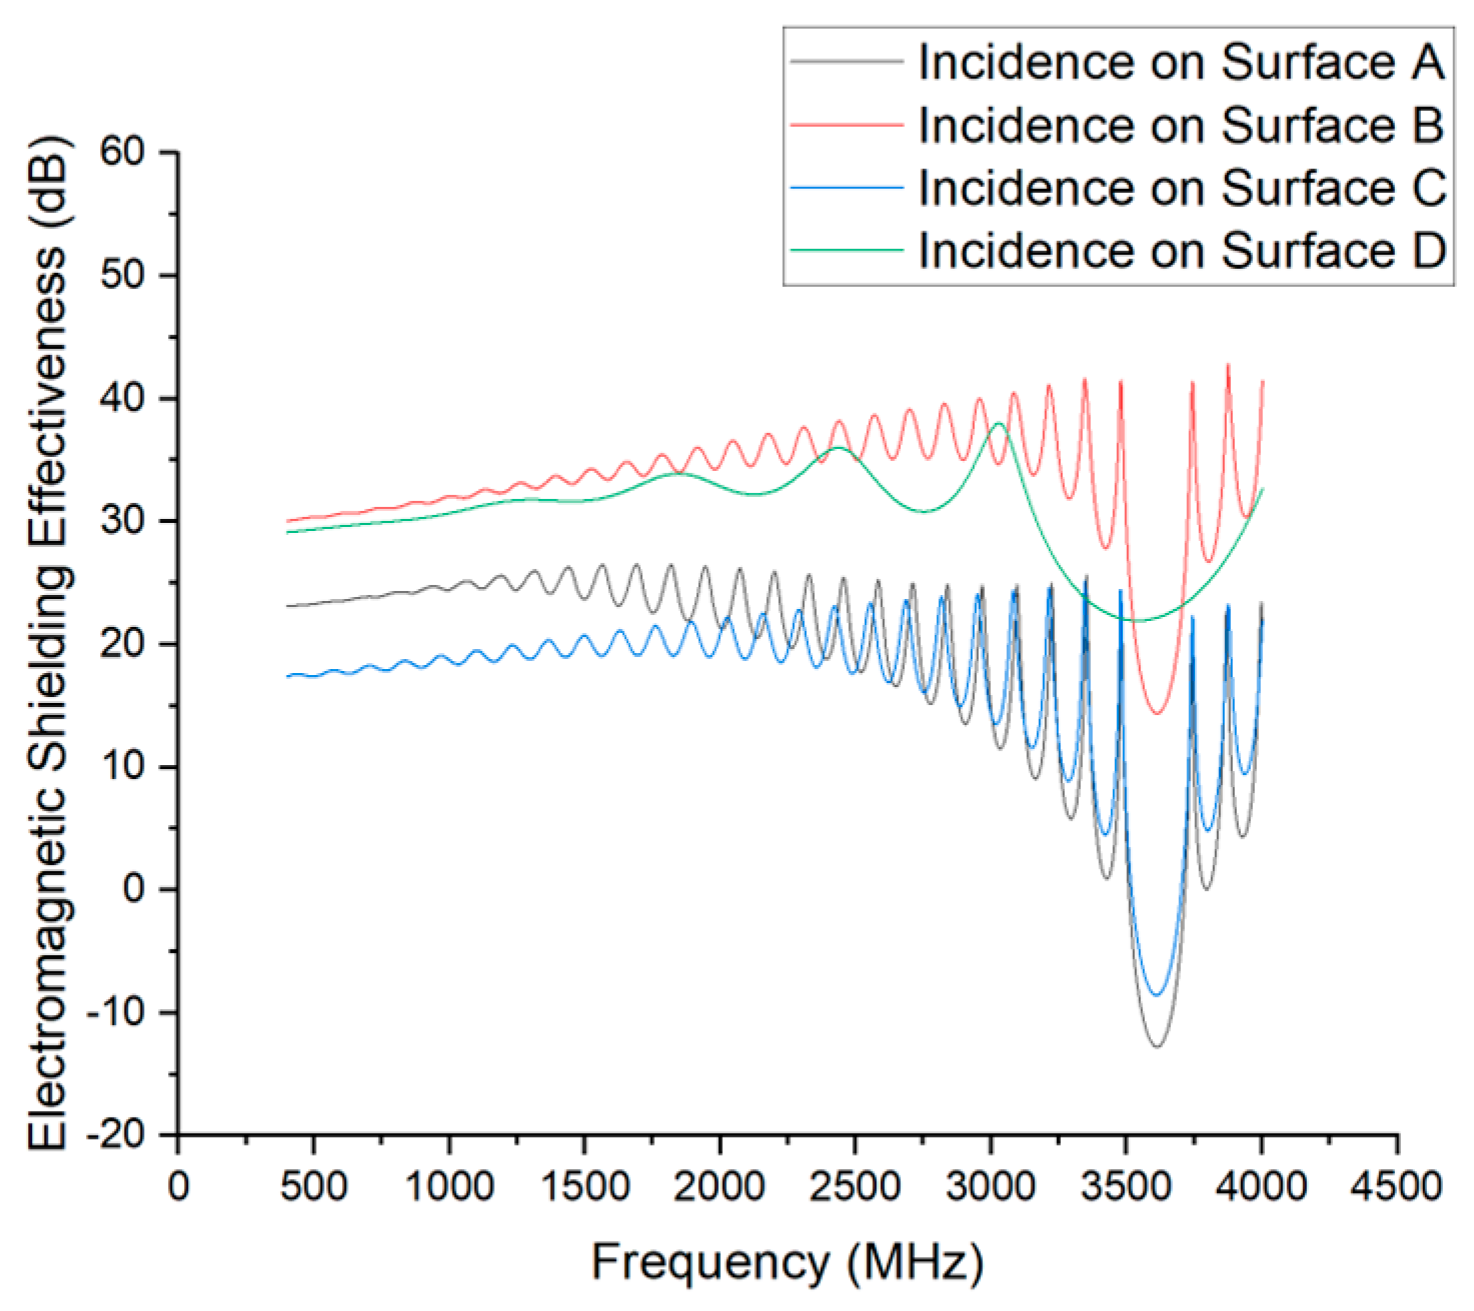
The low-frequency shielding characteristics (below 1 GHz) for each incident surface are presented in Figure 17.
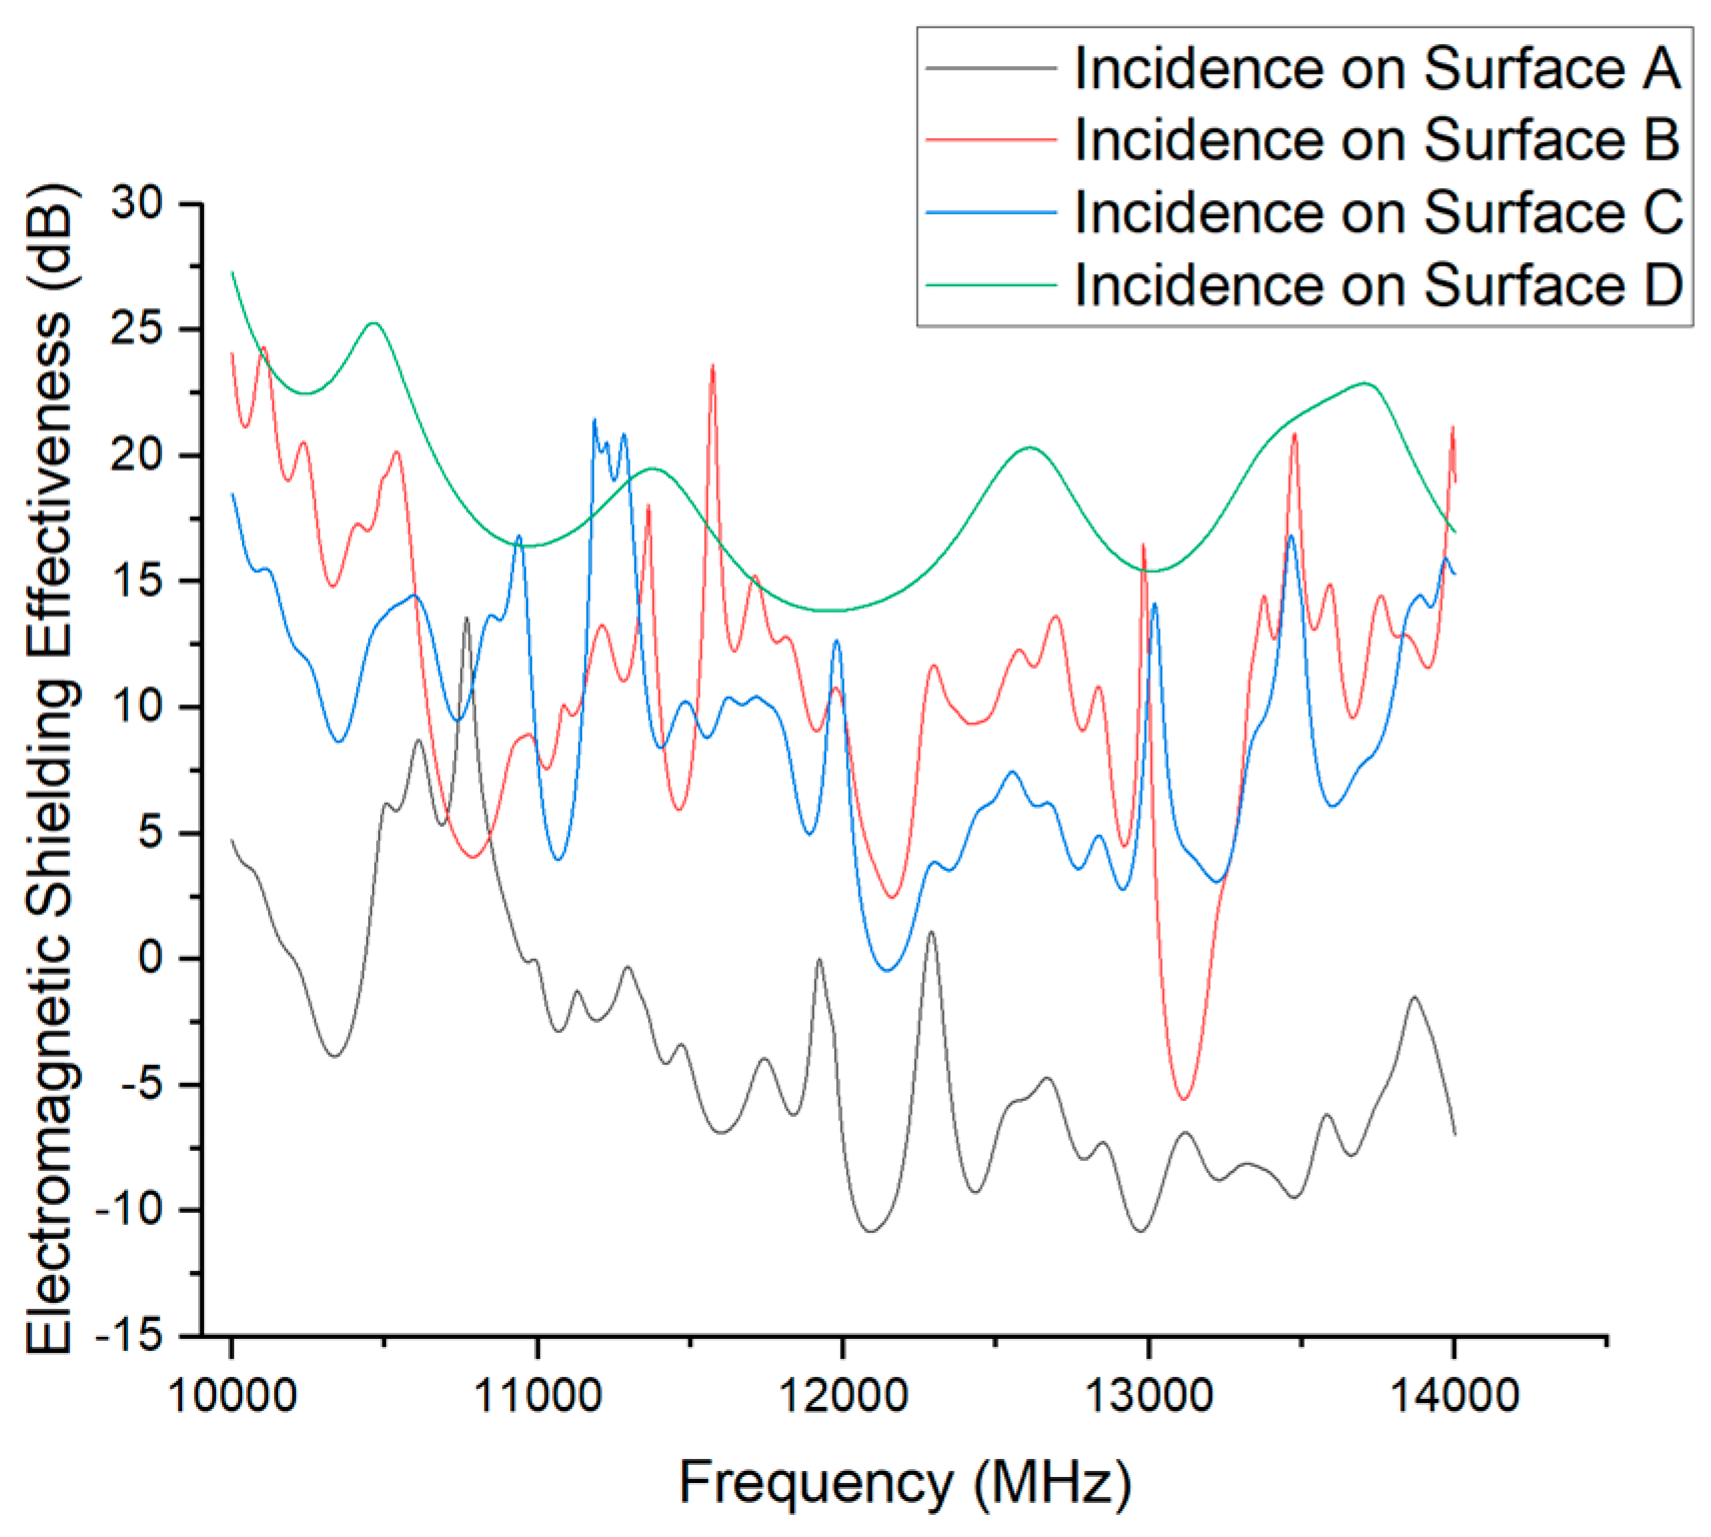
The high-frequency shielding behaviour (above 10 GHz) under different incident surfaces is illustrated in Figure 18.
The simulation results show that shielding effectiveness varies markedly with the incident surface, especially in the mid-to-high frequency range (3–12 GHz).
Surface A exhibits the poorest performance, with pronounced resonances at approximately 3.6 and 7.8 GHz where SE drops to −15 dB. Across 3–10 GHz, its SE fluctuates between 0 and 20 dB, consistently lower than the other surfaces. This weak performance is attributed to the multiple apertures on Surface A, which allow strong electromagnetic coupling through gaps and holes, leading to shielding failure.
Surface B performs better, showing only a slight dip (minimum ~10 dB) in the 5–7 GHz range and no significant resonances elsewhere, demonstrating relatively stable shielding. Surface C, despite having only one trapezoidal aperture, has a long horizontal dimension that couples strongly with horizontally polarized fields, causing an SE reduction to about 5 dB between 4 and 7 GHz. Its overall performance is slightly better than Surface A.
Surface D delivers the best results, maintaining SE above 30 dB across 3–10 GHz, with some points exceeding 40 dB. This confirms that intact surfaces without visible apertures provide the most stable shielding performance.
In summary, the number and size of apertures are the dominant factors influencing SE. Surfaces with multiple openings (e.g., Surface A) suffer severe resonant coupling and SE degradation, while those without apertures (e.g., Surface D) consistently achieve superior shielding across the spectrum.
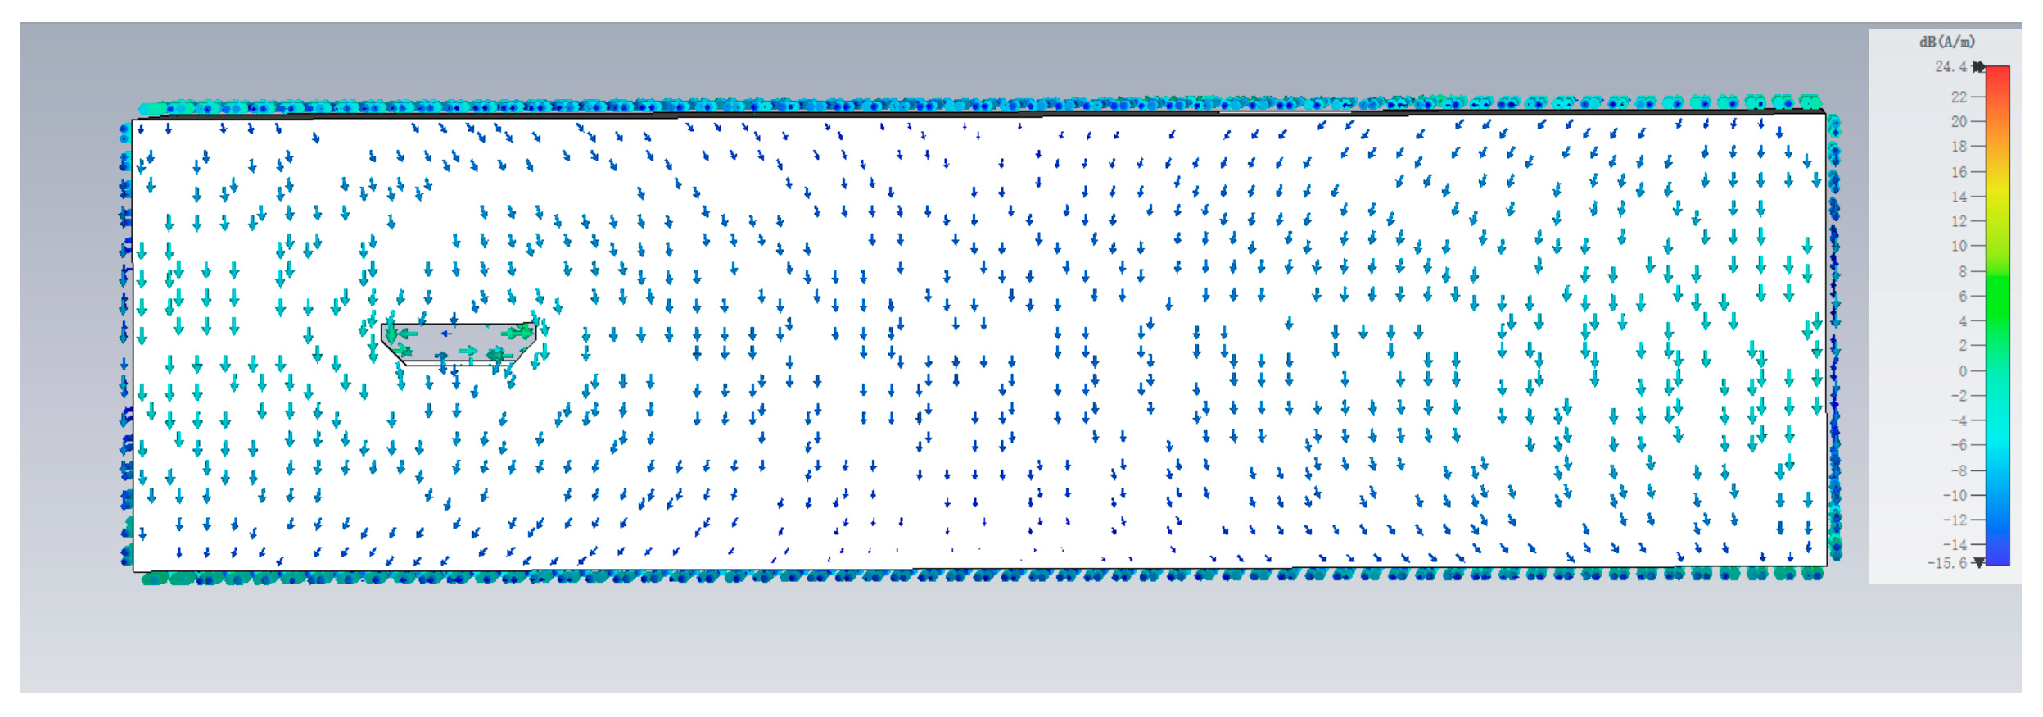
As illustrated in Figure 19, the field-mapping result at 3.6 GHz reveals strong horizontal surface currents concentrated along the trapezoidal aperture of Surface C under horizontally polarized excitation. This indicates that the horizontal aperture edges are efficiently excited by the tangential component of the electric field, resulting in enhanced coupling and reduced shielding effectiveness in the corresponding frequency range.
Although the current visualization captures the main coupling pattern, more advanced and fine-grained field-mapping techniques—such as that reported by Budnarowska and Mizeraczyk [33]—offer higher spatial detail and will be considered in future work.

4.5. Effect of Material Properties

Material properties such as electrical conductivity, magnetic permeability, and dielectric constant are among the core factors influencing electromagnetic shielding effectiveness (SE). This section compares several representative materials, including typical metals and composite materials, through simulation
The electromagnetic shielding performance of a material is primarily determined by its electromagnetic characteristics, including relative permittivity ( ε r ), relative permeability ( μ r ), and electrical conductivity ( σ ). The electromagnetic parameters used in the simulation for different materials are summarized in Table 1.
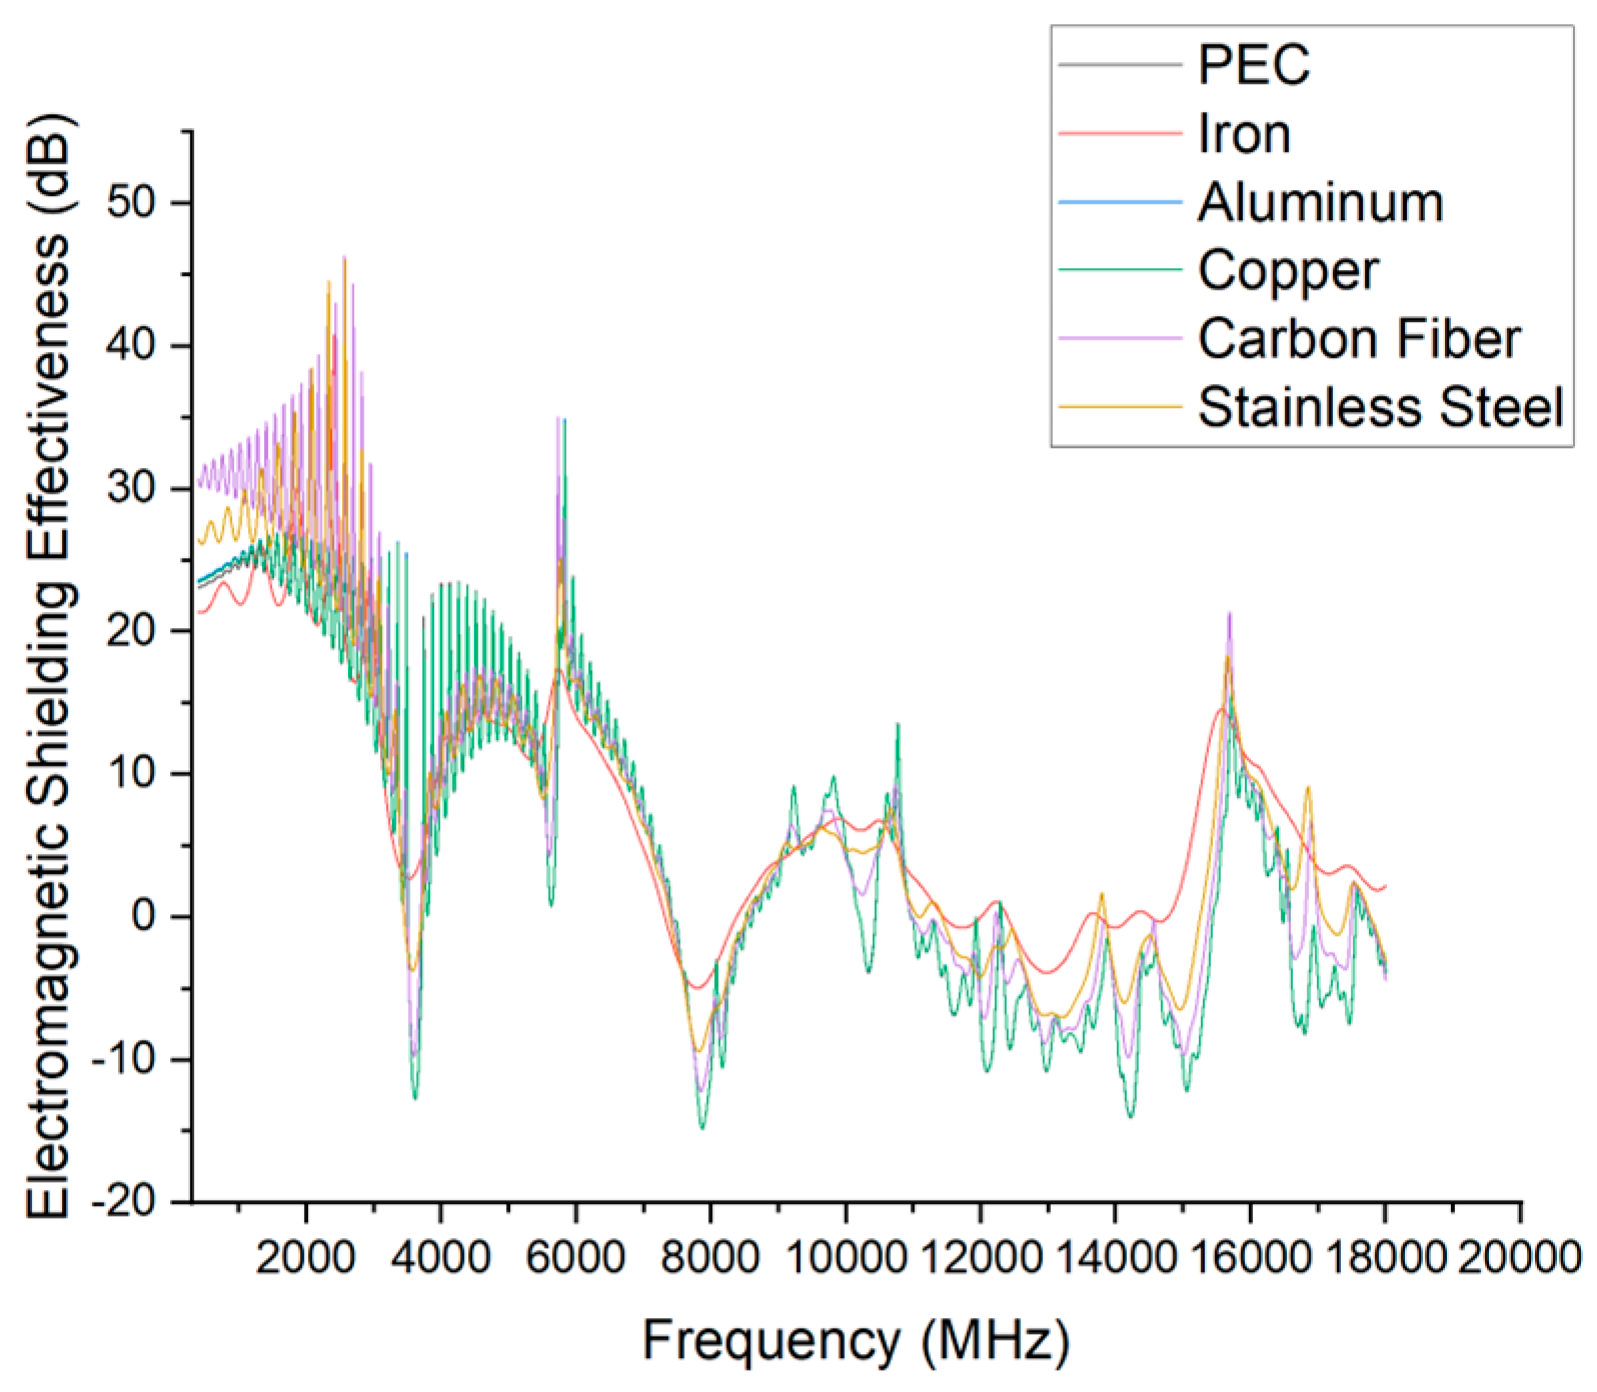
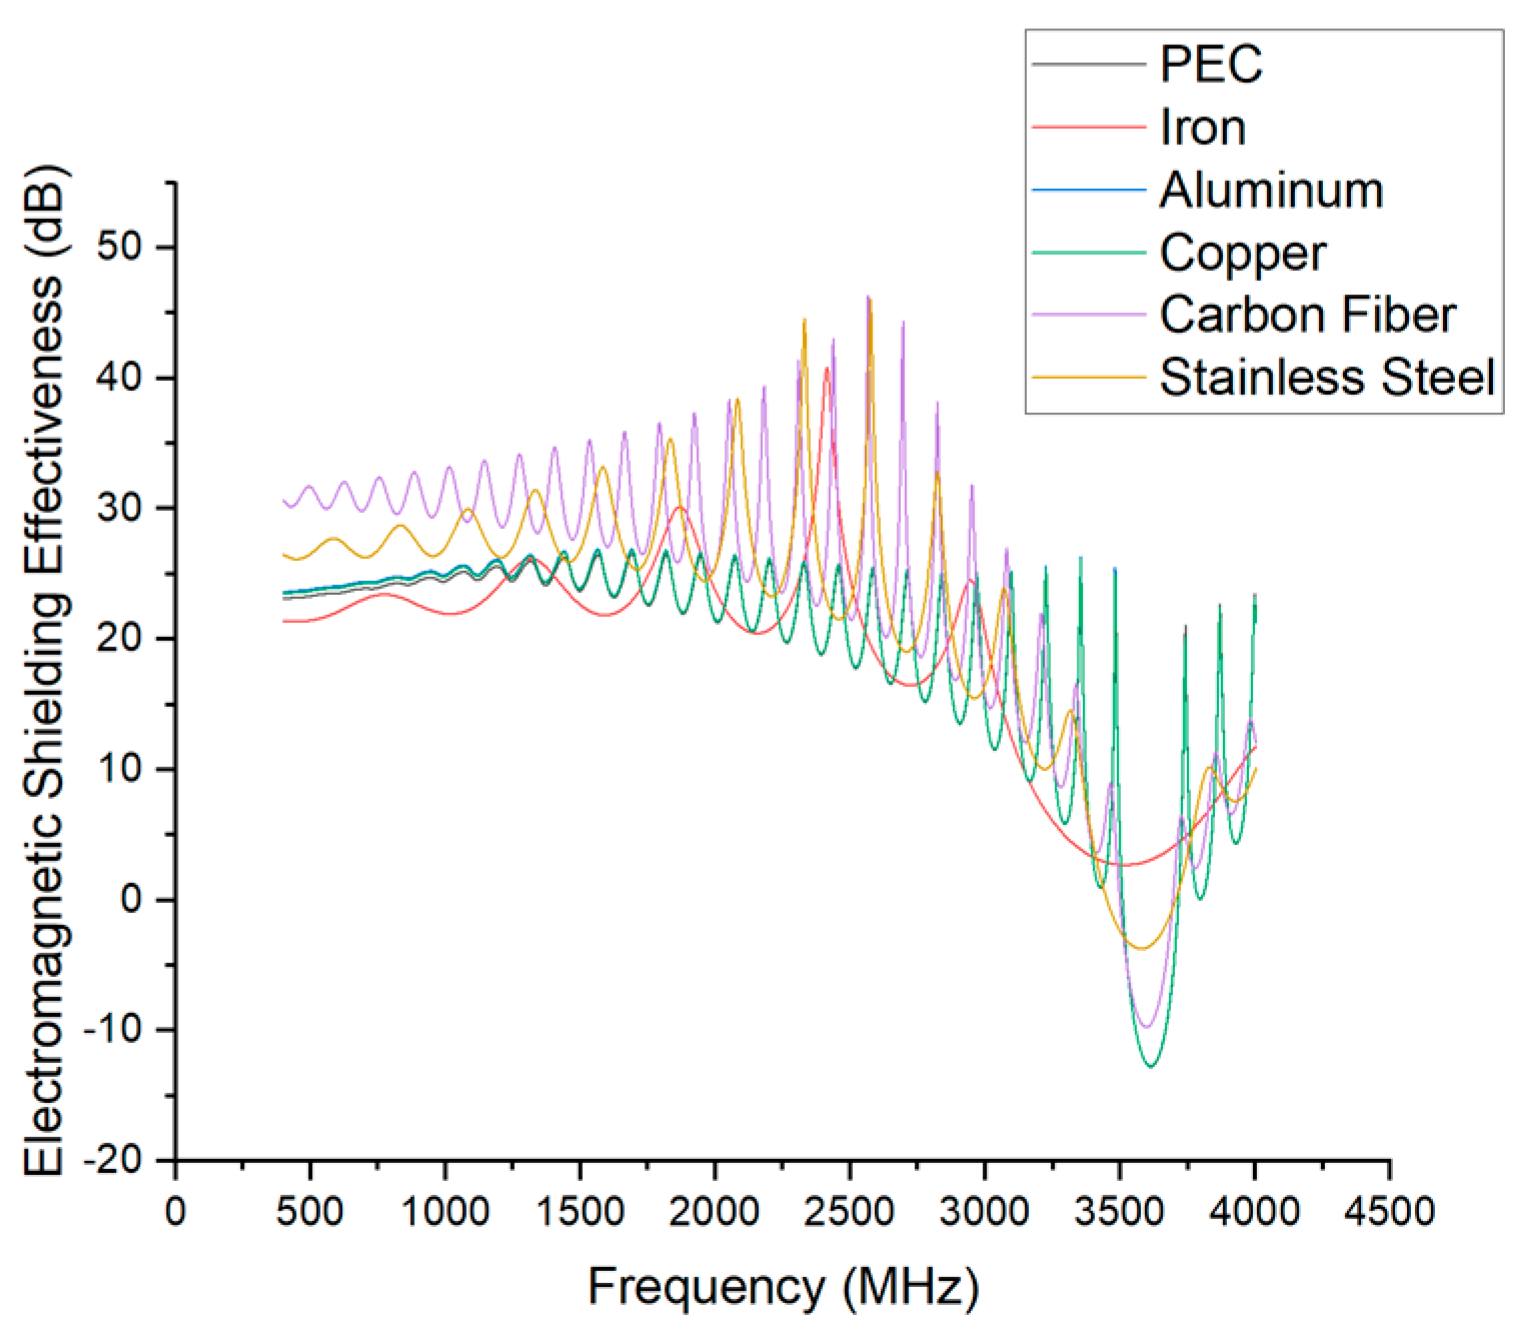
The SE results of different materials across the full-frequency range are shown in Figure 20.
The low-frequency shielding response of each material is presented in Figure 21.
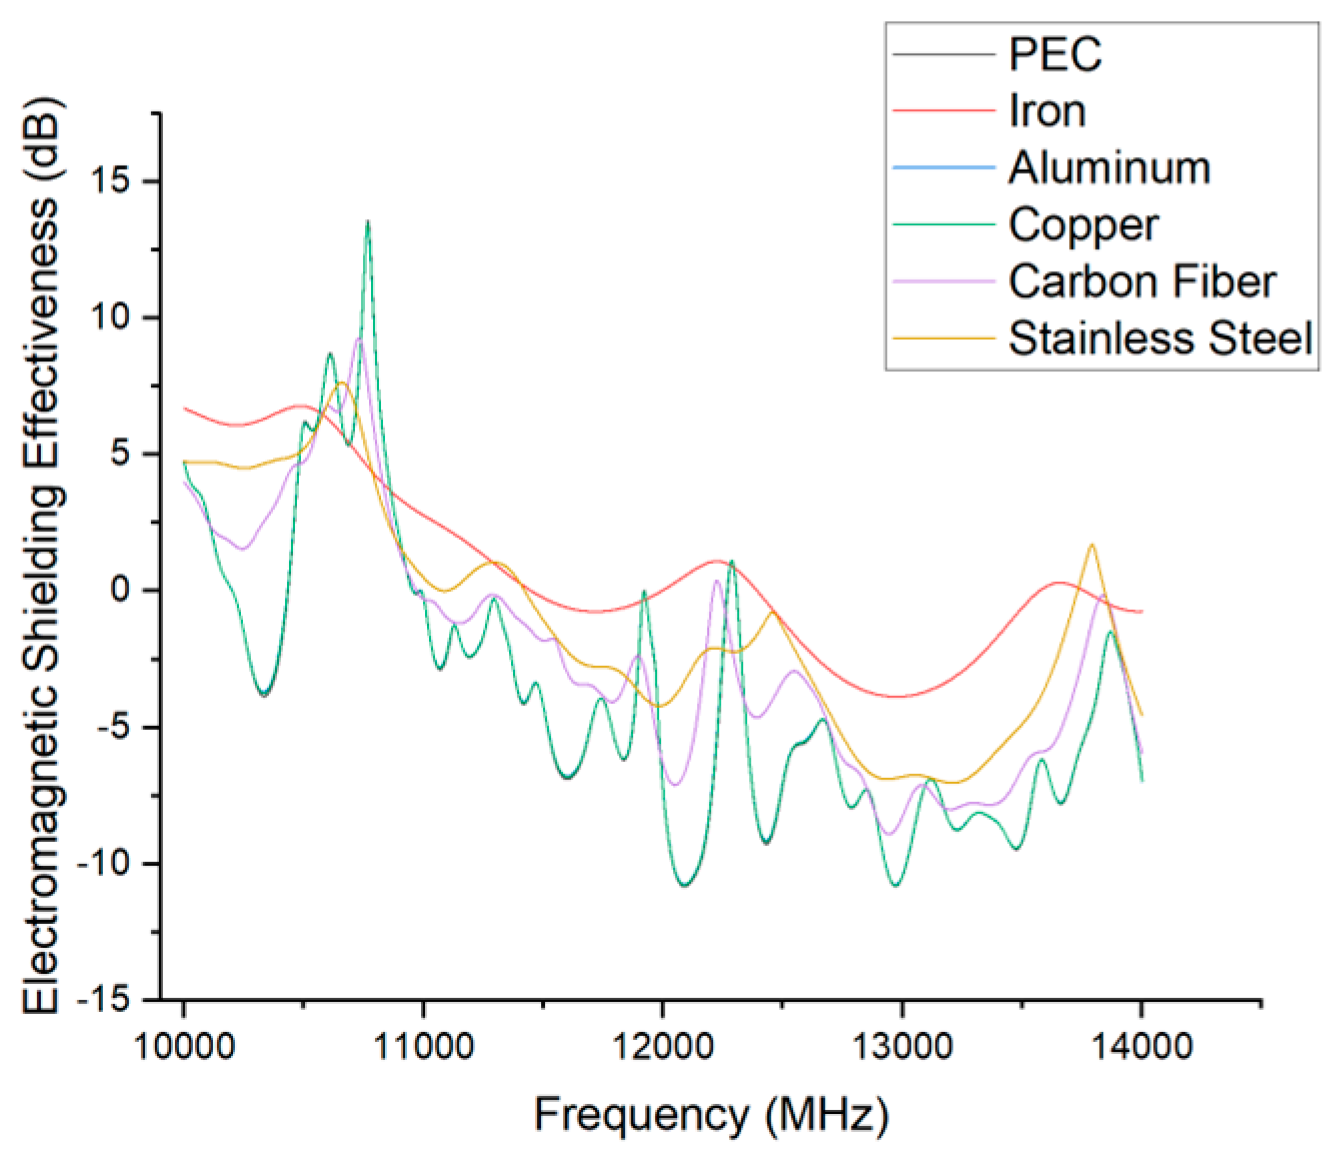
The high-frequency shielding behaviour (above 10 GHz) for the different materials is illustrated in Figure 22.
The simulation results indicate that although the overall trend of shielding effectiveness is similar across materials, the severity of resonance-induced degradation and the degree of fluctuation vary considerably.
  • Copper, aluminum, and PEC show nearly identical performance due to their high conductivity. Their SE curves largely overlap and exhibit sharp dips near 3.6 and 8 GHz, with minima around 15 dB, indicating strong resonances.
  • Carbon fiber performs best below 3 GHz but shows greater fluctuation overall. It achieves slightly better SE than copper, aluminum, and PEC in resonance zones and at frequencies above 10 GHz.
  • Iron also resonates near 3.6 and 8 GHz but with less severe drops and smoother transitions, demonstrating greater stability that extends into the high-frequency range.
  • Stainless steel performs slightly worse than carbon fiber below 3 GHz but lies between iron and the highly conductive materials across most of the spectrum.
These differences are primarily due to magnetic permeability. Iron and stainless steel, especially iron with very high permeability, can absorb the magnetic component of incident waves, suppressing resonance and stabilizing SE.
In conclusion, materials with higher magnetic permeability effectively mitigate resonance-induced SE degradation and enhance resistance to electromagnetic disturbances, explaining the relatively stable shielding performance of iron.

4.6. Effect of Aperture Shape

The shape of an aperture strongly affects the local electric field distribution and current concentration, thereby influencing electromagnetic coupling and overall shielding performance. This section compares the shielding effectiveness of circular and rectangular openings with equal effective aperture areas. The two aperture geometries used for comparison are shown in Figure 23.
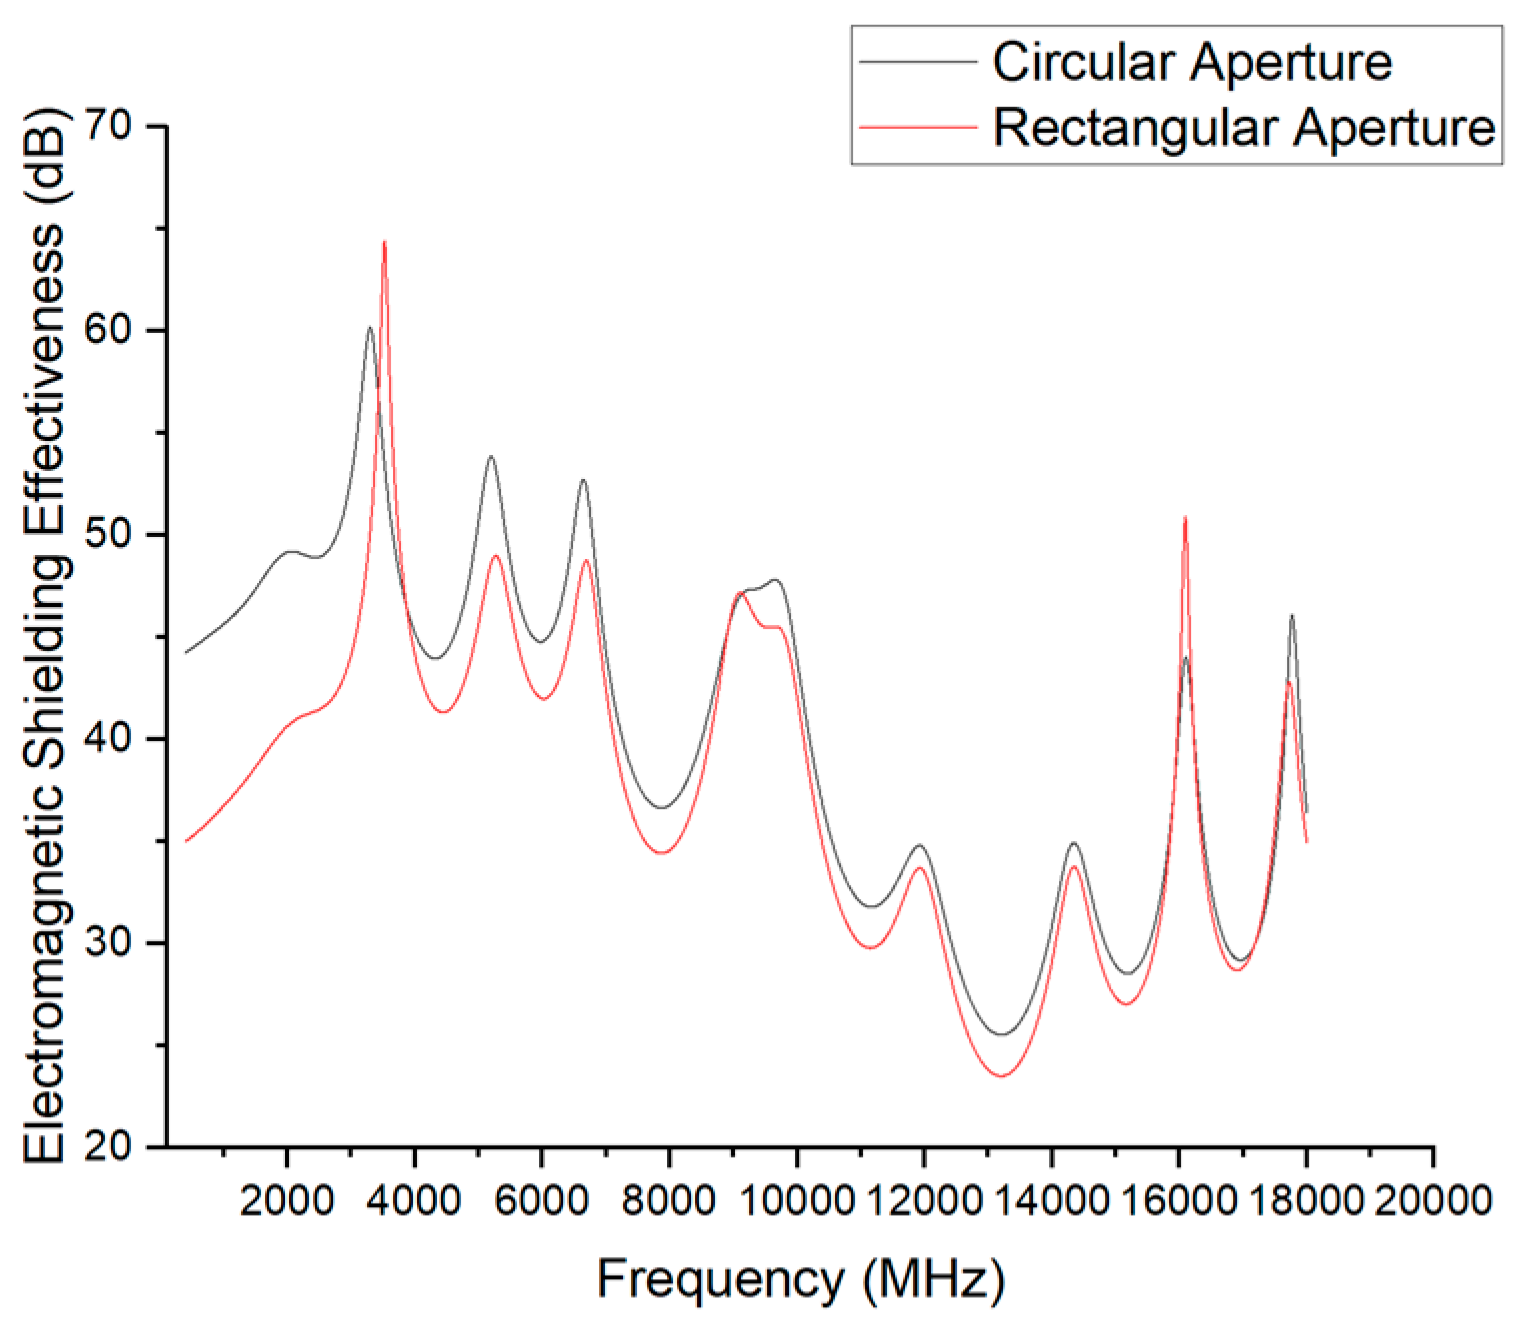
The SE results for the two aperture shapes are presented in Figure 24.
The simulation results show that even with identical aperture areas, aperture shape has a marked impact on shielding effectiveness. The circular opening (diameter = 5 mm) provides superior performance across the entire frequency range compared with the square opening (side length = 4.43 mm). This difference is most pronounced at low frequencies (2–6 GHz), where the maximum SE gap exceeds 10 dB.
As frequency increases, the difference between the two shapes gradually diminishes, and the results converge in the high-frequency range (16–20 GHz). The reason lies in field behavior: circular apertures generate weaker edge field enhancement and distribute diffraction paths more evenly, mitigating gap coupling and improving shielding. In contrast, rectangular apertures have sharp corners that concentrate fields, producing stronger coupling and resonances, and thus lower SE.
These findings demonstrate that even with equal aperture areas, geometric edge characteristics and symmetry significantly influence shielding performance. Therefore, circular or rounded apertures should be prioritized in structural design to enhance electromagnetic compatibility.

4.7. Effect of Aperture Size

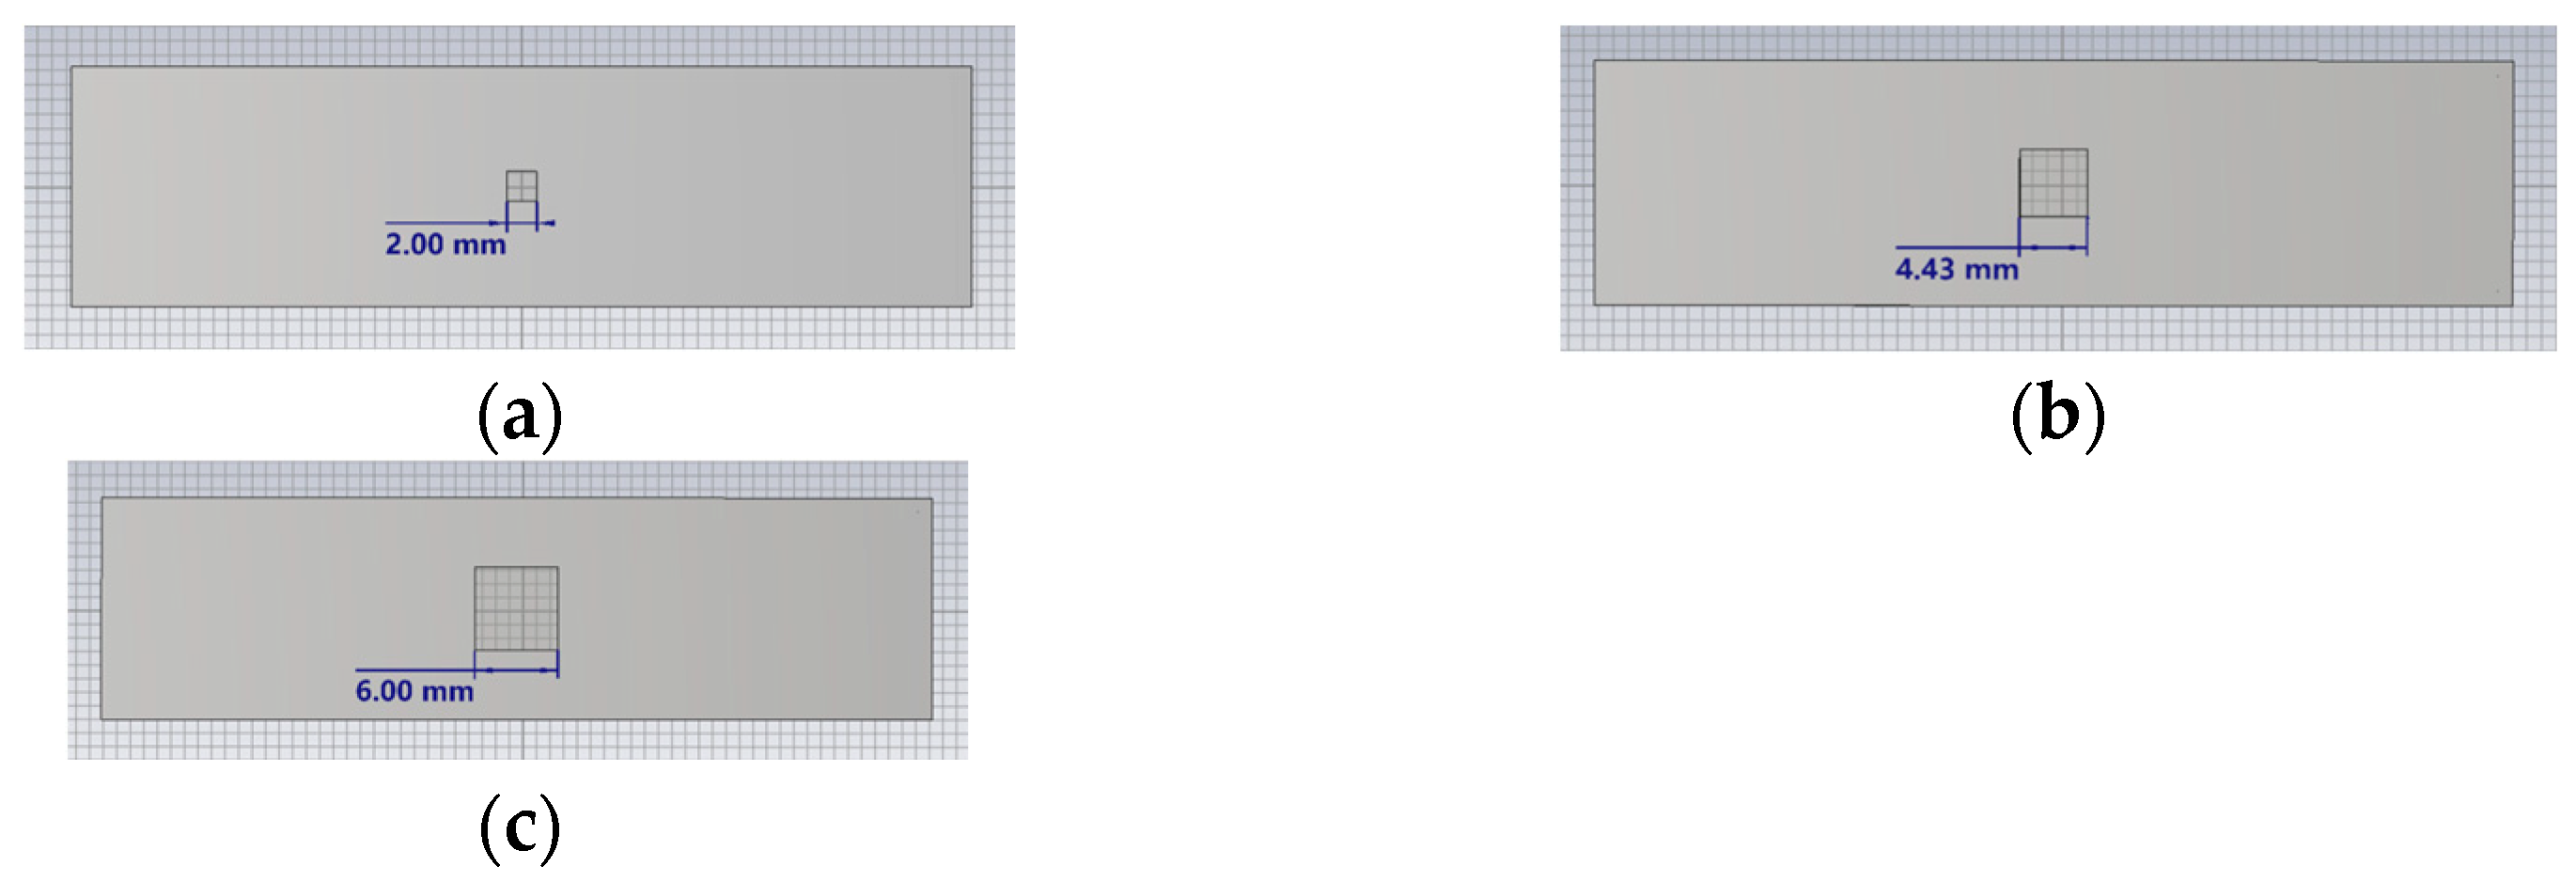
Aperture size is a critical factor that determines the local failure risk of a shielding structure. This section systematically analyzes the impact of aperture size on shielding performance and evaluates how it affects SE trends and failure mechanisms, particularly in resonance frequency bands. The aperture configurations used in this analysis are illustrated in Figure 25.
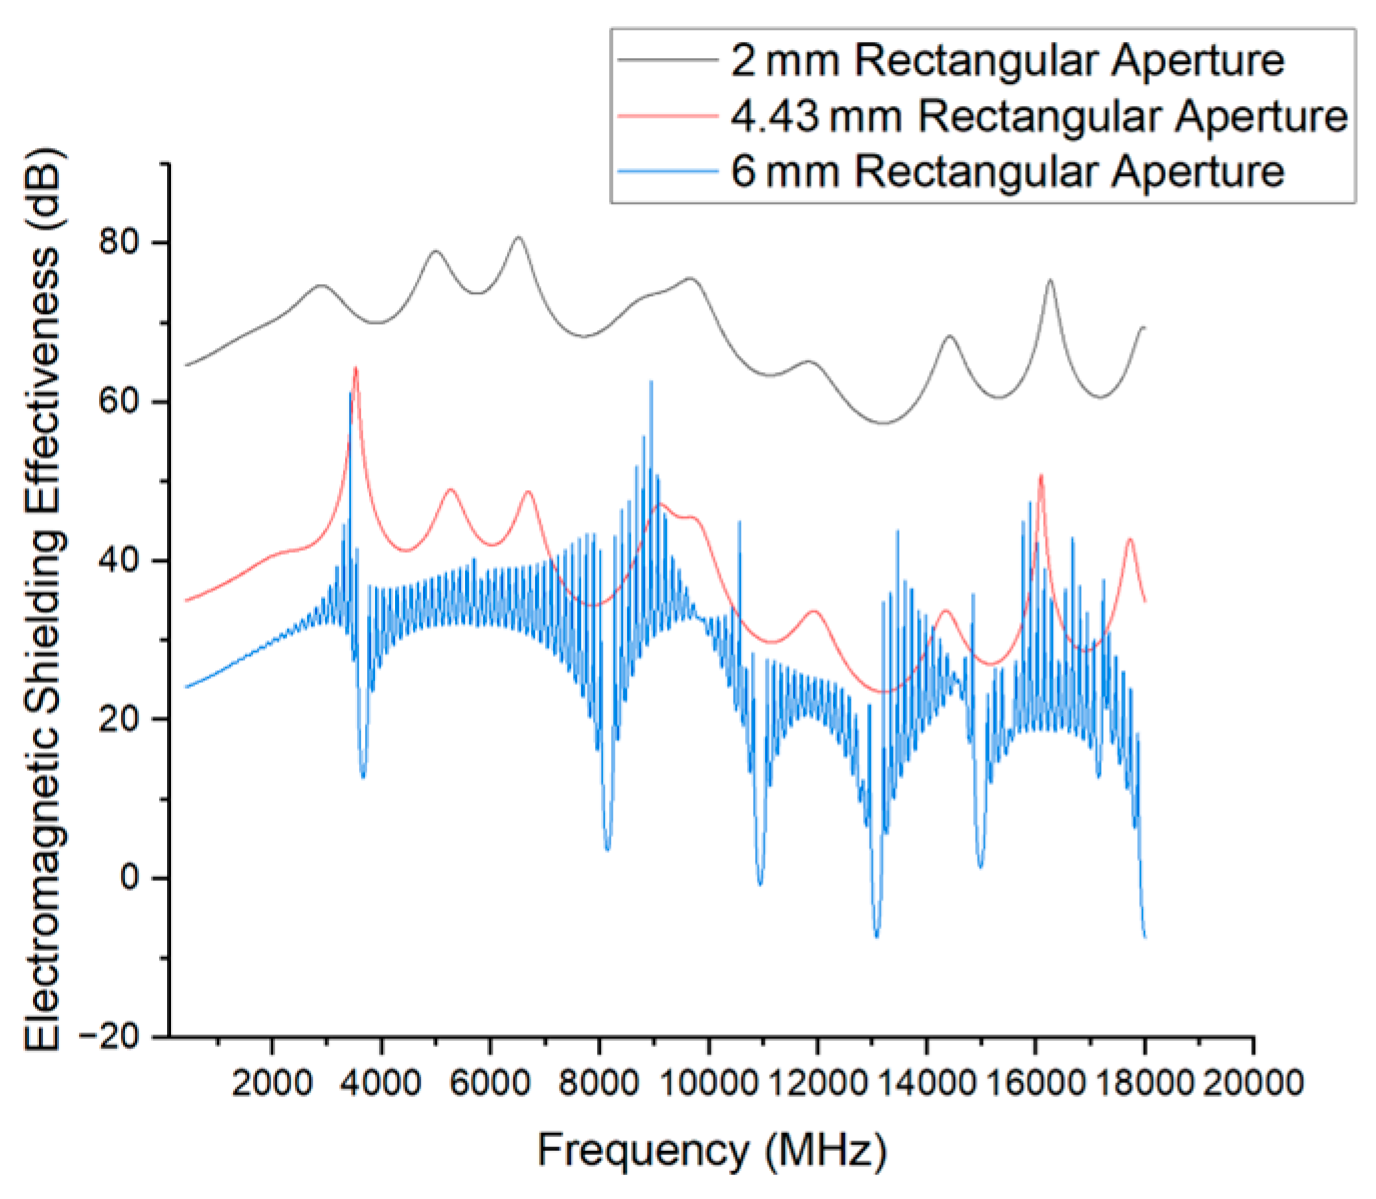
The SE results for different aperture sizes are shown in Figure 26.
The simulation results clearly show that the size of a rectangular aperture strongly affects shielding effectiveness. As the side length increases, shielding performance deteriorates significantly.
  • 2 mm aperture: Exhibits excellent shielding across the entire frequency range, with SE consistently between 60 and 75 dB, indicating strong protection.
    4.43 mm aperture: Overall SE decreases by about 20–30 dB, with localized dips at several frequencies.
  • 6 mm aperture: Produces severe SE fluctuations, with minima around –10 dB and multiple strong resonances.
This sharp degradation arises from enhanced coupling through larger apertures, which are more prone to resonance excitation and allow electromagnetic waves to penetrate more effectively, thereby undermining enclosure integrity.
Therefore, in equipment design, large apertures should be avoided, particularly in systems sensitive to mid- and high-frequency interference. Strict control of aperture size is essential to ensure stable shielding performance.

4.8. Effect of Aperture Quantity

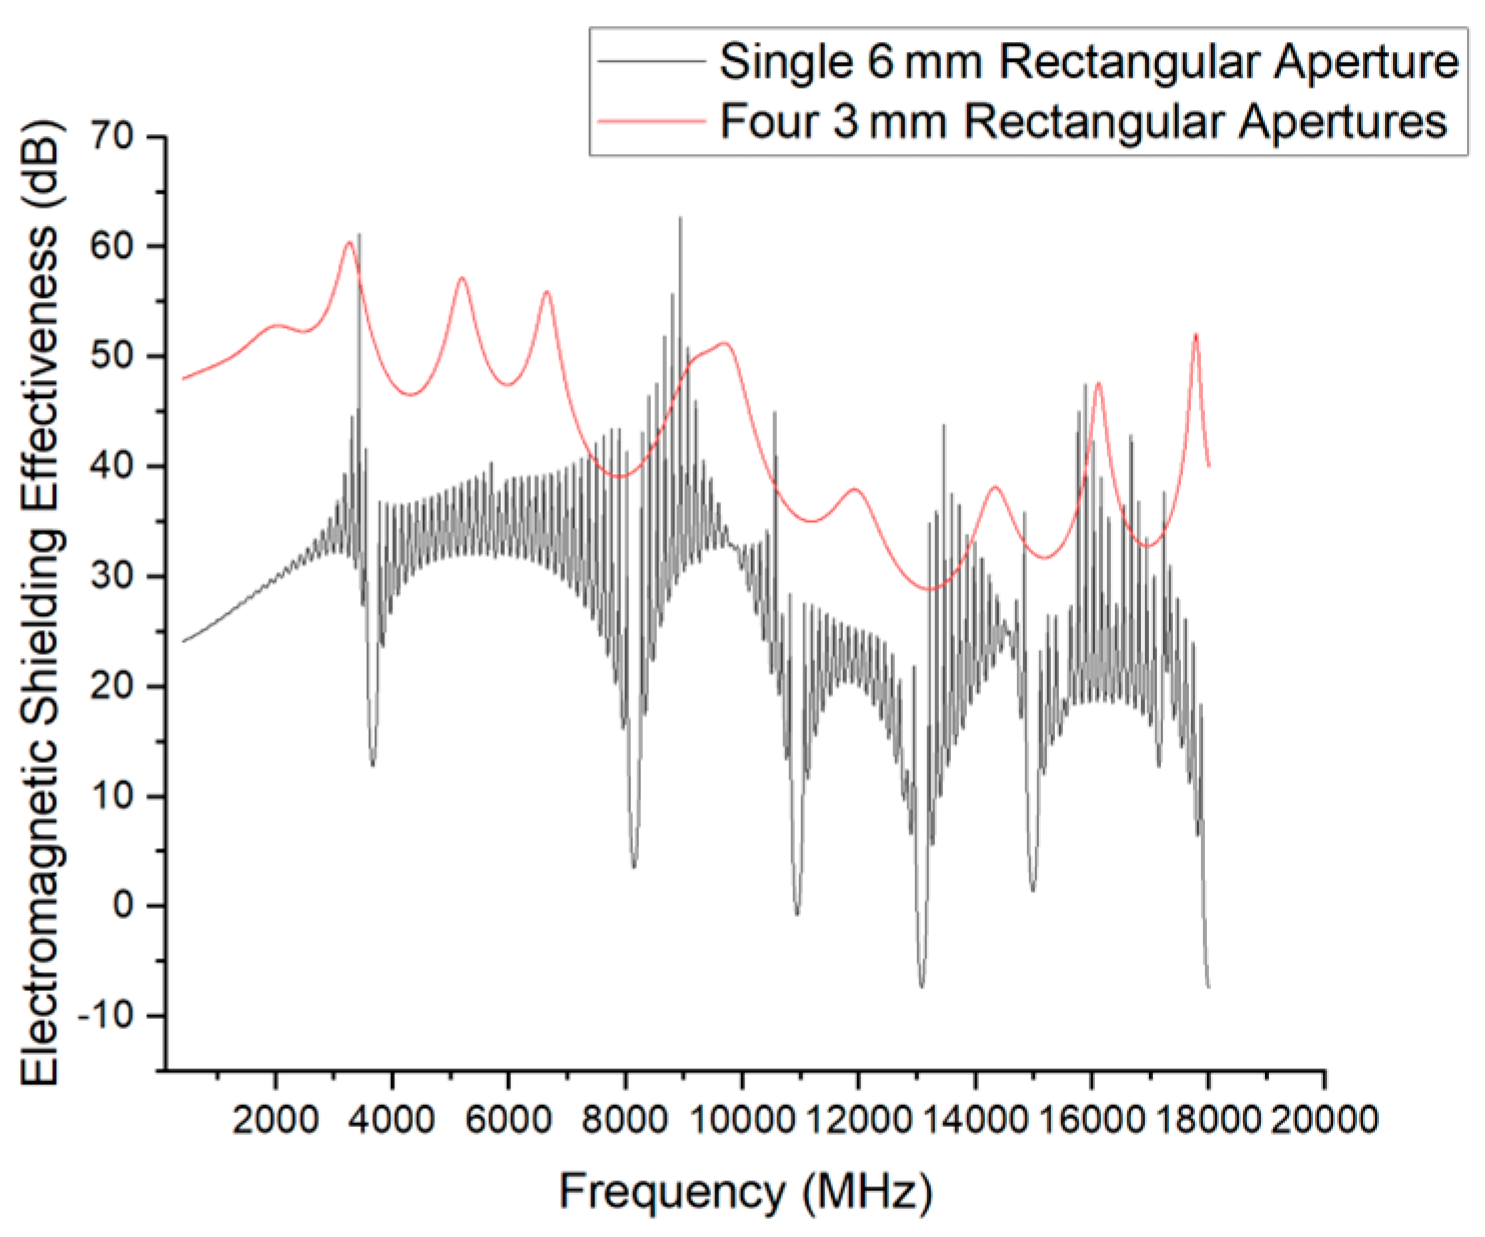
When the total aperture area is constant, the number and distribution of apertures influence the formation of electromagnetic leakage paths in different ways. This section compares concentrated and distributed multi-aperture configurations to assess their effect on shielding effectiveness over a range of frequencies, as illustrated in Figure 27.
The SE performance corresponding to these aperture configurations is presented in Figure 28, which shows the significant difference caused by aperture distribution.
The simulation results demonstrate that even with the same total aperture area, aperture quantity has a significant effect on shielding effectiveness. Compared with a single large rectangular opening (6 mm side length), a configuration with four smaller apertures (each 3 mm) provides better shielding performance across the entire frequency range.
The single-aperture model exhibits severe resonances at multiple frequencies, with SE dropping to nearly −10 dB, indicating substantial loss of shielding capability. In contrast, the four-aperture configuration maintains higher and more stable SE, with no evident resonant failures in the spectrum.
These findings indicate that concentrated apertures increase the likelihood of strong coupling and resonance, leading to greater electromagnetic leakage. Conversely, distributing the same total aperture area reduces local resonances and enhances the enclosure’s ability to suppress incident electromagnetic waves.

4.9. Effect of Aperture Spacing

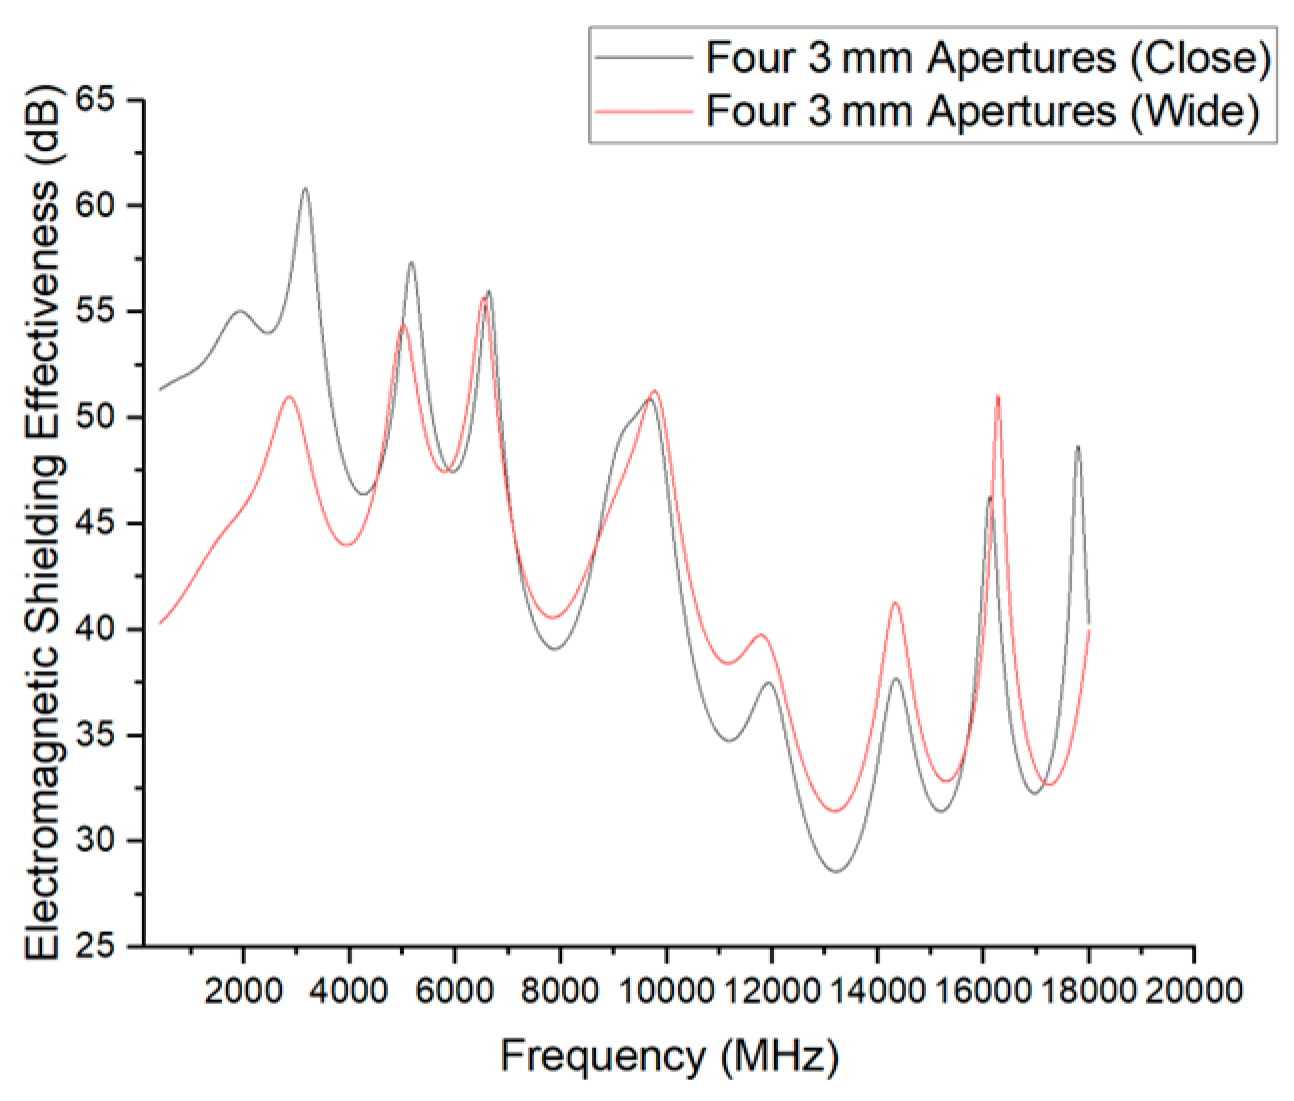
This section investigates the impact of aperture spacing on shielding effectiveness while keeping the number, shape, and total area of the aperture constant. As illustrated in Figure 29, two representative spacing configurations are considered in this study.
The corresponding shielding effectiveness for these spacing configurations is shown in Figure 30. The simulation results indicate that aperture spacing significantly affects shielding performance, with different impacts across frequency bands:
  • Below 8 GHz: Closely spaced apertures provide better shielding than widely spaced ones, with maximum SE differences exceeding 10 dB.
  • 8–16 GHz: Wider spacing yields superior performance at several frequencies, suggesting improved suppression of localized resonances.
  • Around 16 GHz and above: The SE of both configurations converges, and the influence of spacing becomes negligible.
These findings suggest that closer spacing may suppress low-frequency leakage by limiting long-wavelength resonance paths, whereas wider spacing reduces mutual coupling at higher frequencies and enhances mid- to high-band performance. At very high frequencies, however, the wavelength is short enough that spacing effects largely disappear.
ConfigurationFrequency Range (GHz)ΔSE (dB)Observation
Aperture size: 2 mm → 6 mm0.4–18~30SE decreases with larger aperture area
Shape: Rectangular → Circular (equal area)0.4–18~10Circular aperture shows higher SE
Quantity: 1 large vs. 4 small (equal area)0.4–18~12Distributed apertures yield higher SE
Spacing: close vs. wide<8~8Closer spacing improves SE at low frequency

5. Experimental Validation in a Microwave Anechoic Chamber

To verify whether the simulation results align with real-world performance and to evaluate the GNSS receiver’s immunity under actual HIRF conditions, a radiated immunity test was conducted in a microwave anechoic chamber.

5.1. Anechoic-Chamber Test Levels and Failure Definitions

5.1.1. Test Level Selection

To conduct a representative equipment-level HIRF test, an appropriate test level must first be defined. RTCA/DO-160G, Section 20 classifies radiated susceptibility test levels into Class B, D, F, G, and L. These levels apply to systems directly exposed to external HIRF and to those designated at the highest criticality level by HIRF regulations. Table 2 lists several classes and their applicable ranges.
To evaluate the receiver’s immunity under high HIRF field strengths, this study adopts Class G as the field-strength baseline for radiated susceptibility testing, so as to emulate the more extreme electromagnetic environment faced by aircraft and verify the receiver’s operational stability at elevated HIRF levels. The adopted Class G field-strength levels are given in Table 3.

5.1.2. Failure Definition

As a critical avionics component, the GNSS receiver handles satellite signal reception, decoding, and processing; its reliability directly impacts navigation, automatic flight, and overall flight safety. In compliance with HIRF airworthiness requirements, the receiver must remain operational in HIRF and shall not exhibit the following failures:
  • Power-off or restart—No power loss, reset, or reboot is permitted under HIRF, to avoid navigation data loss and adverse impact on automatic flight.
  • Signal loss—The receiver must maintain satellite signal tracking; prolonged signal loss due to HIRF can lead to navigation failure.
  • Severe accuracy degradation (DOP > 20)—HIRF may degrade solution accuracy; a large increase in DOP jeopardizes route keeping, obstacle avoidance, and landing precision.
Accordingly, this study defines three primary failure types for the test campaign, as summarized in Table 4.
Here, DOP (dilution of precision) indicates positioning accuracy: a larger DOP implies greater position error, undermining the aircraft’s navigation capability. Per RTCA/DO-229D (Minimum Operational Performance Standards for GPS/WAAS airborne equipment) [34], the receiver’s DOP should typically be <10 to ensure navigation accuracy. When DOP > 20, positioning accuracy is severely degraded and navigation may fail, posing a safety risk. Therefore, DOP > 20 is adopted as the failure criterion for the GNSS receiver under HIRF.

5.2. Experimental Procedure

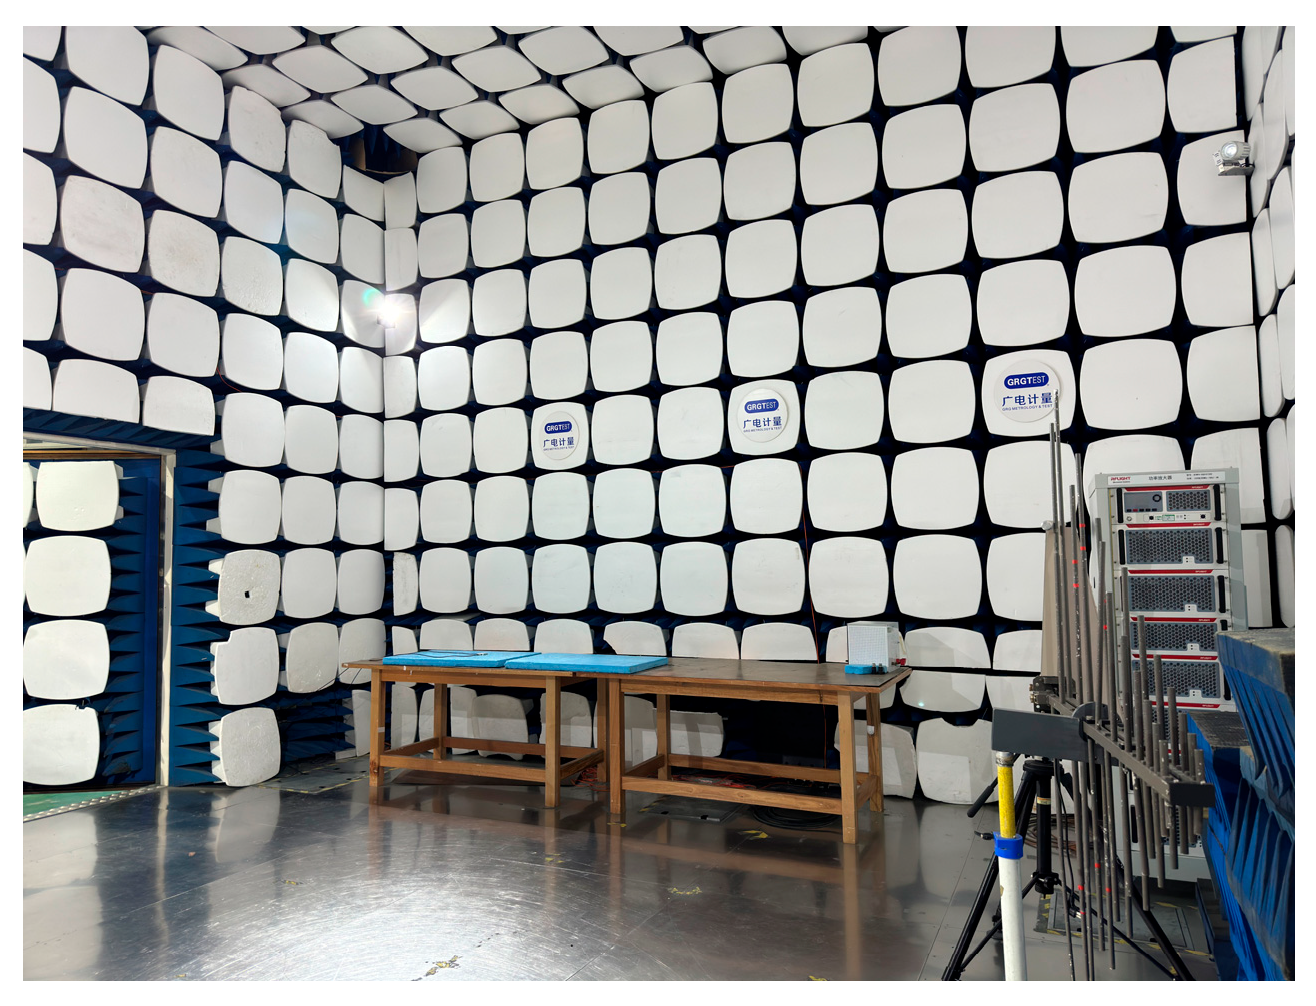
In radiated immunity testing, an anechoic chamber provides a stable and controlled electromagnetic environment for airborne electronic equipment, simulating the electromagnetic exposure conditions experienced by aircraft in HIRF scenarios. The chamber used in this study measures 10 m × 8 m × 6.4 m. The overall setup of the test environment is shown in Figure 31.
In the field of electromagnetic compatibility (EMC), immunity testing is commonly used to assess the behavior of electronic equipment under the influence of external electromagnetic fields. Immunity refers to the ability of a device to maintain normal operation in the presence of electromagnetic interference (EMI). In this study, a continuous wave (CW) signal was used to conduct the radiated immunity test, assessing the GNSS receiver’s stability under a steady-state HIRF environment. The specific experimental steps are as follows:
  • Pre-test verification.
Before the test, the GNSS receiver was confirmed to operate normally in a non-interference environment.
2.
Equipment setup.
The GNSS receiver was mounted on a test fixture inside the chamber and connected to a computer-based monitoring system to ensure stable data acquisition.
3.
Field strength definition and generation.
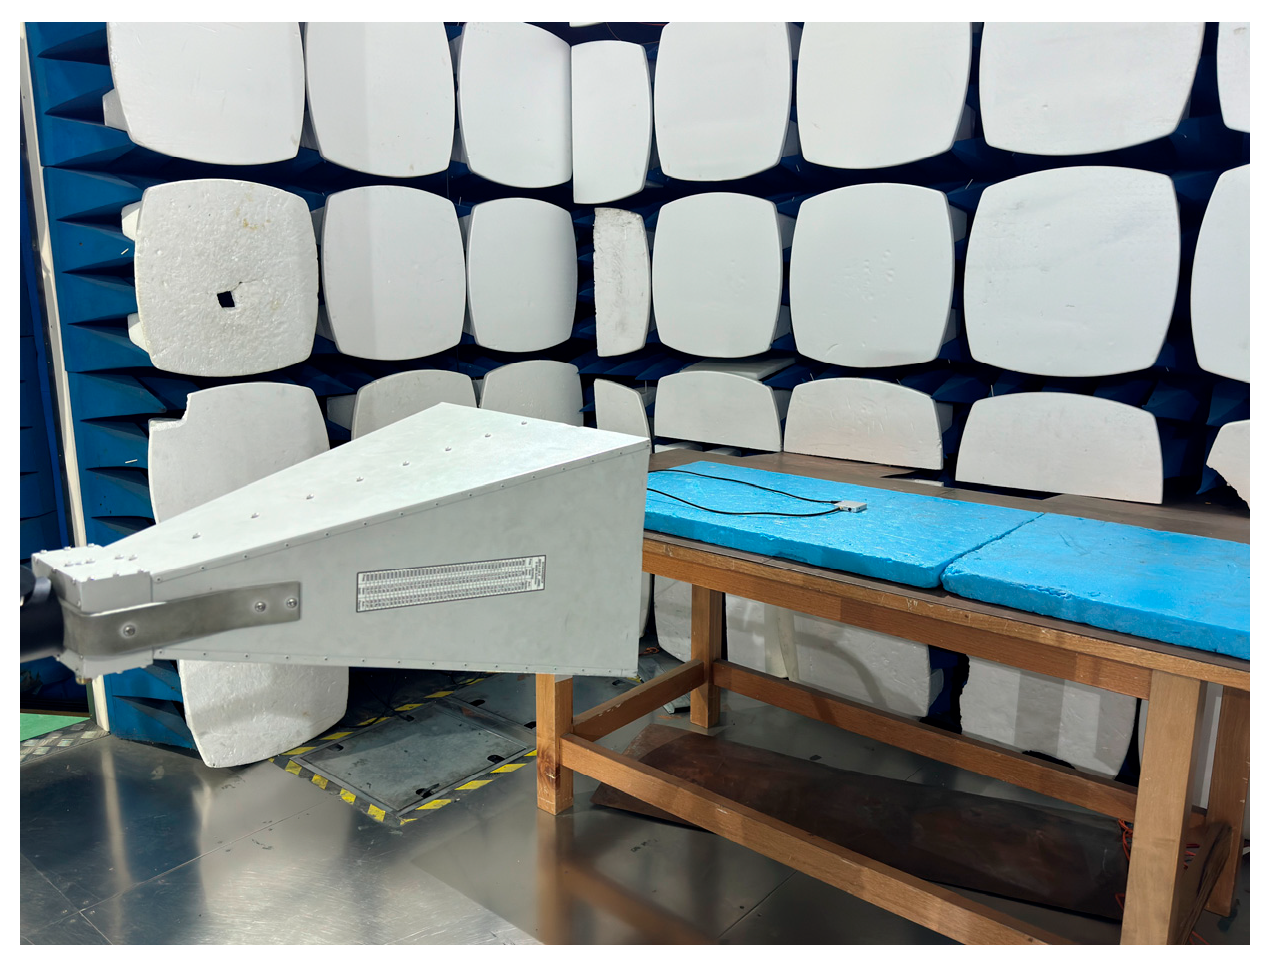
The antenna illumination configuration is illustrated in Figure 32.
A sweep test was performed across each decade band with 100 frequency points, during which the receiver’s operating status was continuously monitored to evaluate its immunity under increasing field strengths.
4.
GNSS receiver status monitoring.
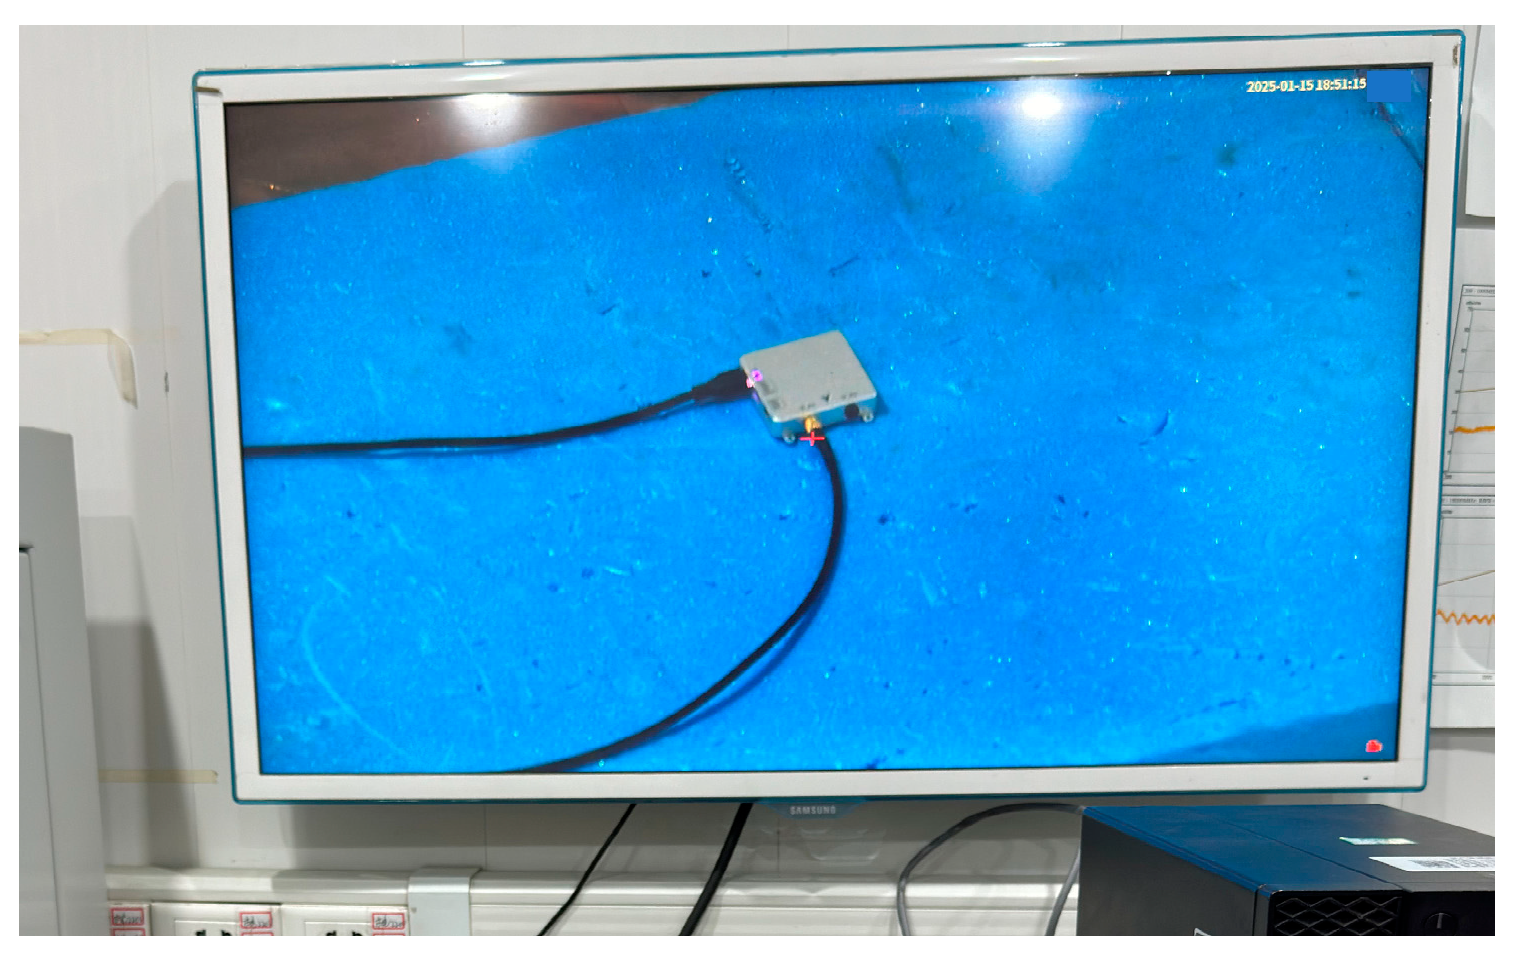
During the test, the GNSS receiver’s status indicators were observed using a camera system (see Figure 33) to detect any shutdown or reboot events. Simultaneously, the receiver’s solution parameters—including latitude, longitude, altitude, speed, and DOP—were monitored via computer software to detect signal loss or degraded accuracy.
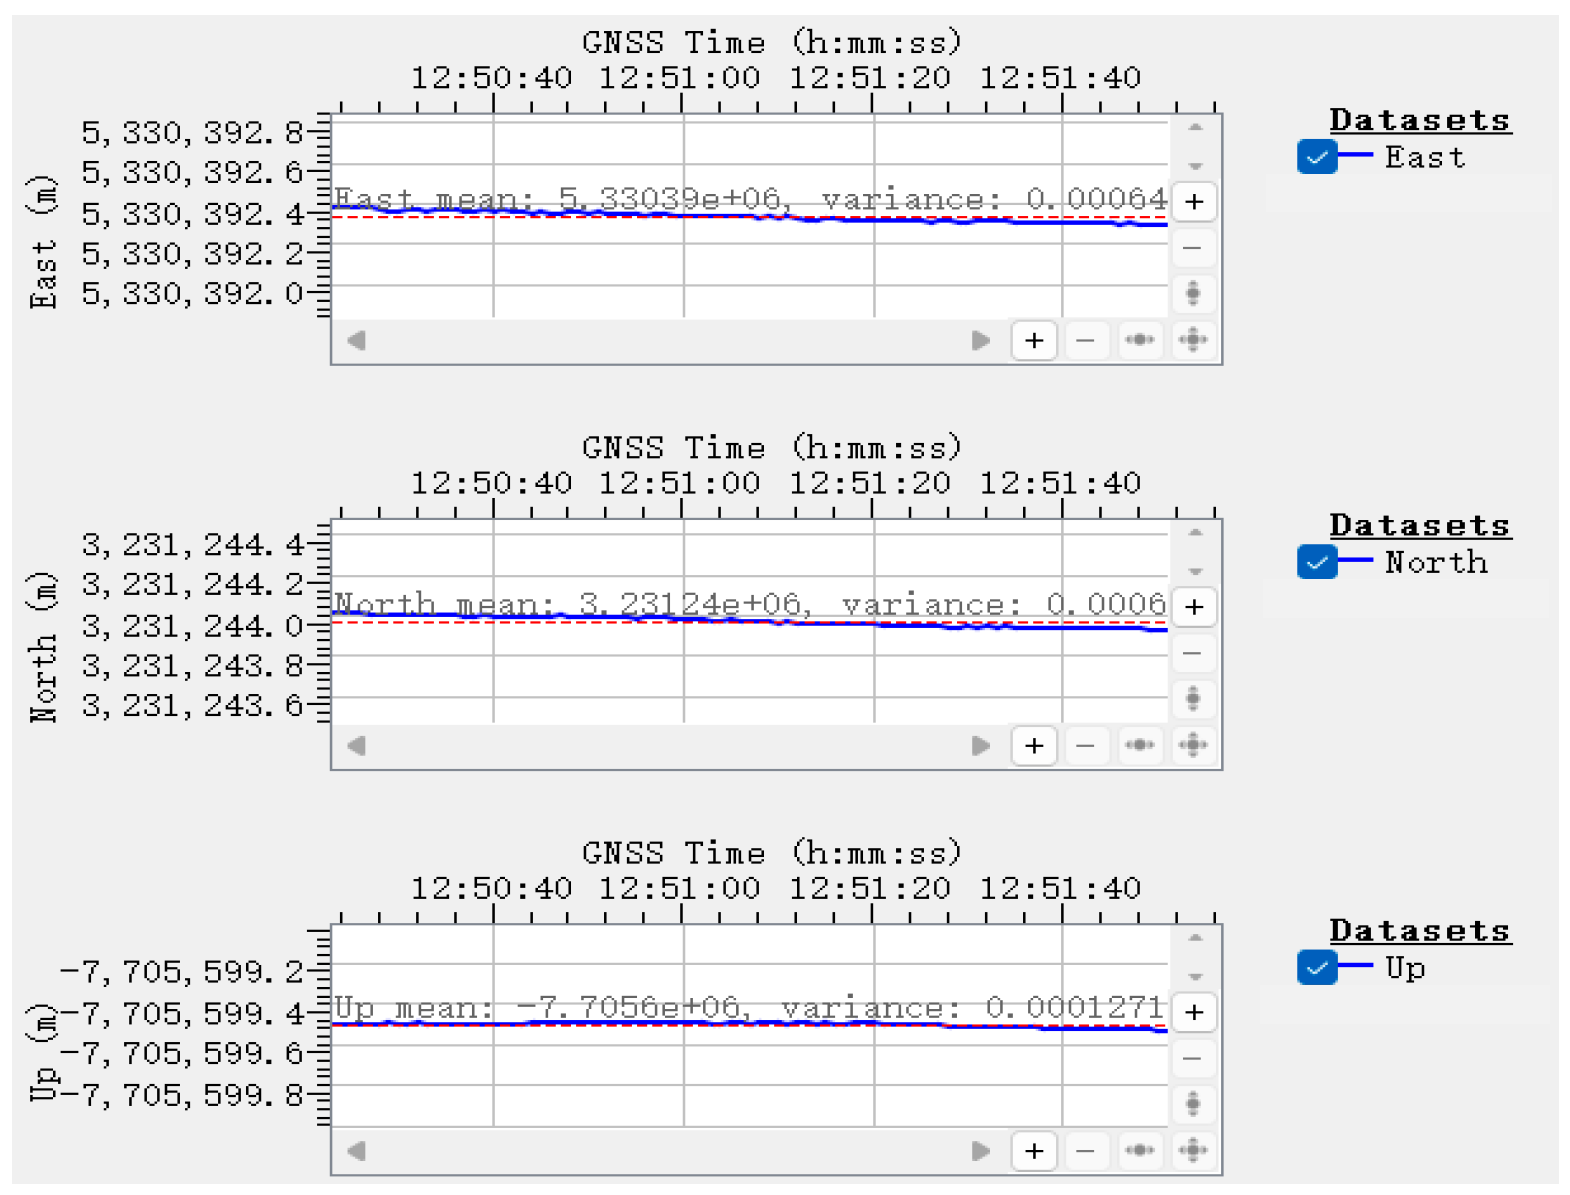
In the monitoring interface, the relative position is expressed using the East-North-Up (ENU) coordinate system, which represents the receiver’s deviation from a reference point in three orthogonal directions. The monitoring results are shown in Figure 34.
Ellipsoidal height refers to the altitude above the WGS-84 reference ellipsoid, a key parameter in GNSS positioning used for navigation and mapping. The variation is illustrated in Figure 35.
GNSS velocity is calculated in terms of velocity components along the ENU directions, represented by ∇E (eastward), ∇N (northward), and ∇U (upward or zenith). Velocity monitoring results are presented in Figure 36.
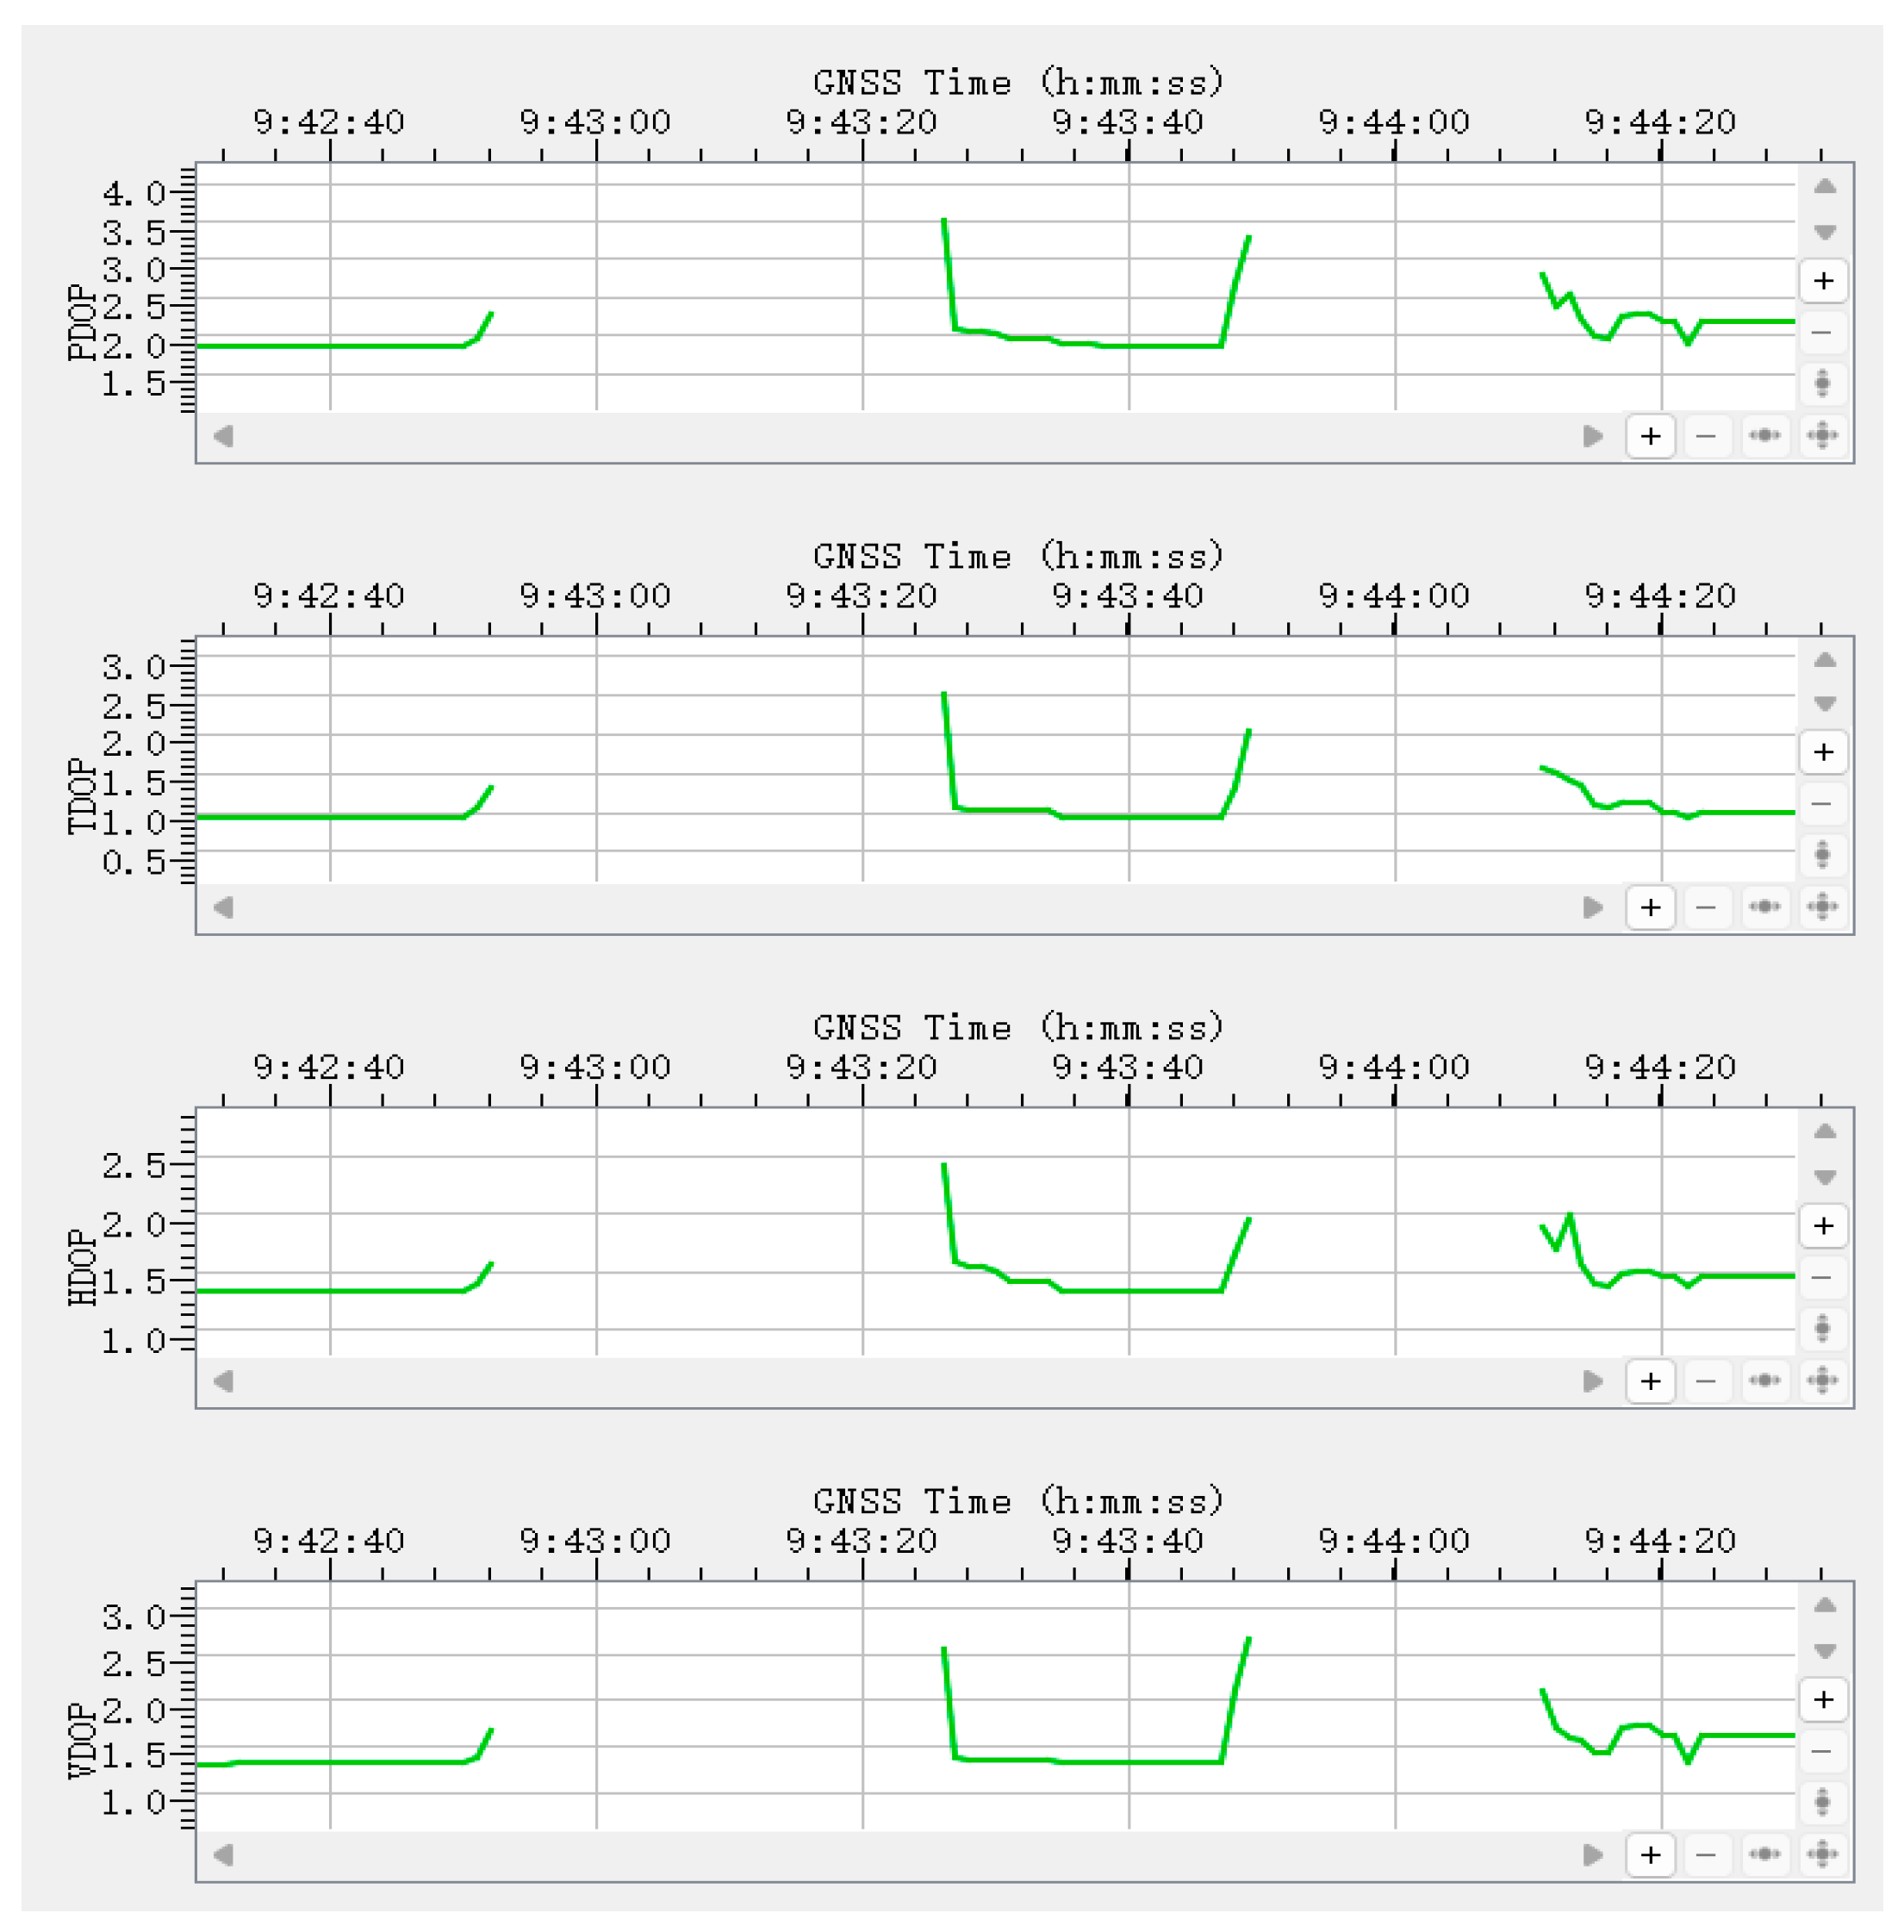
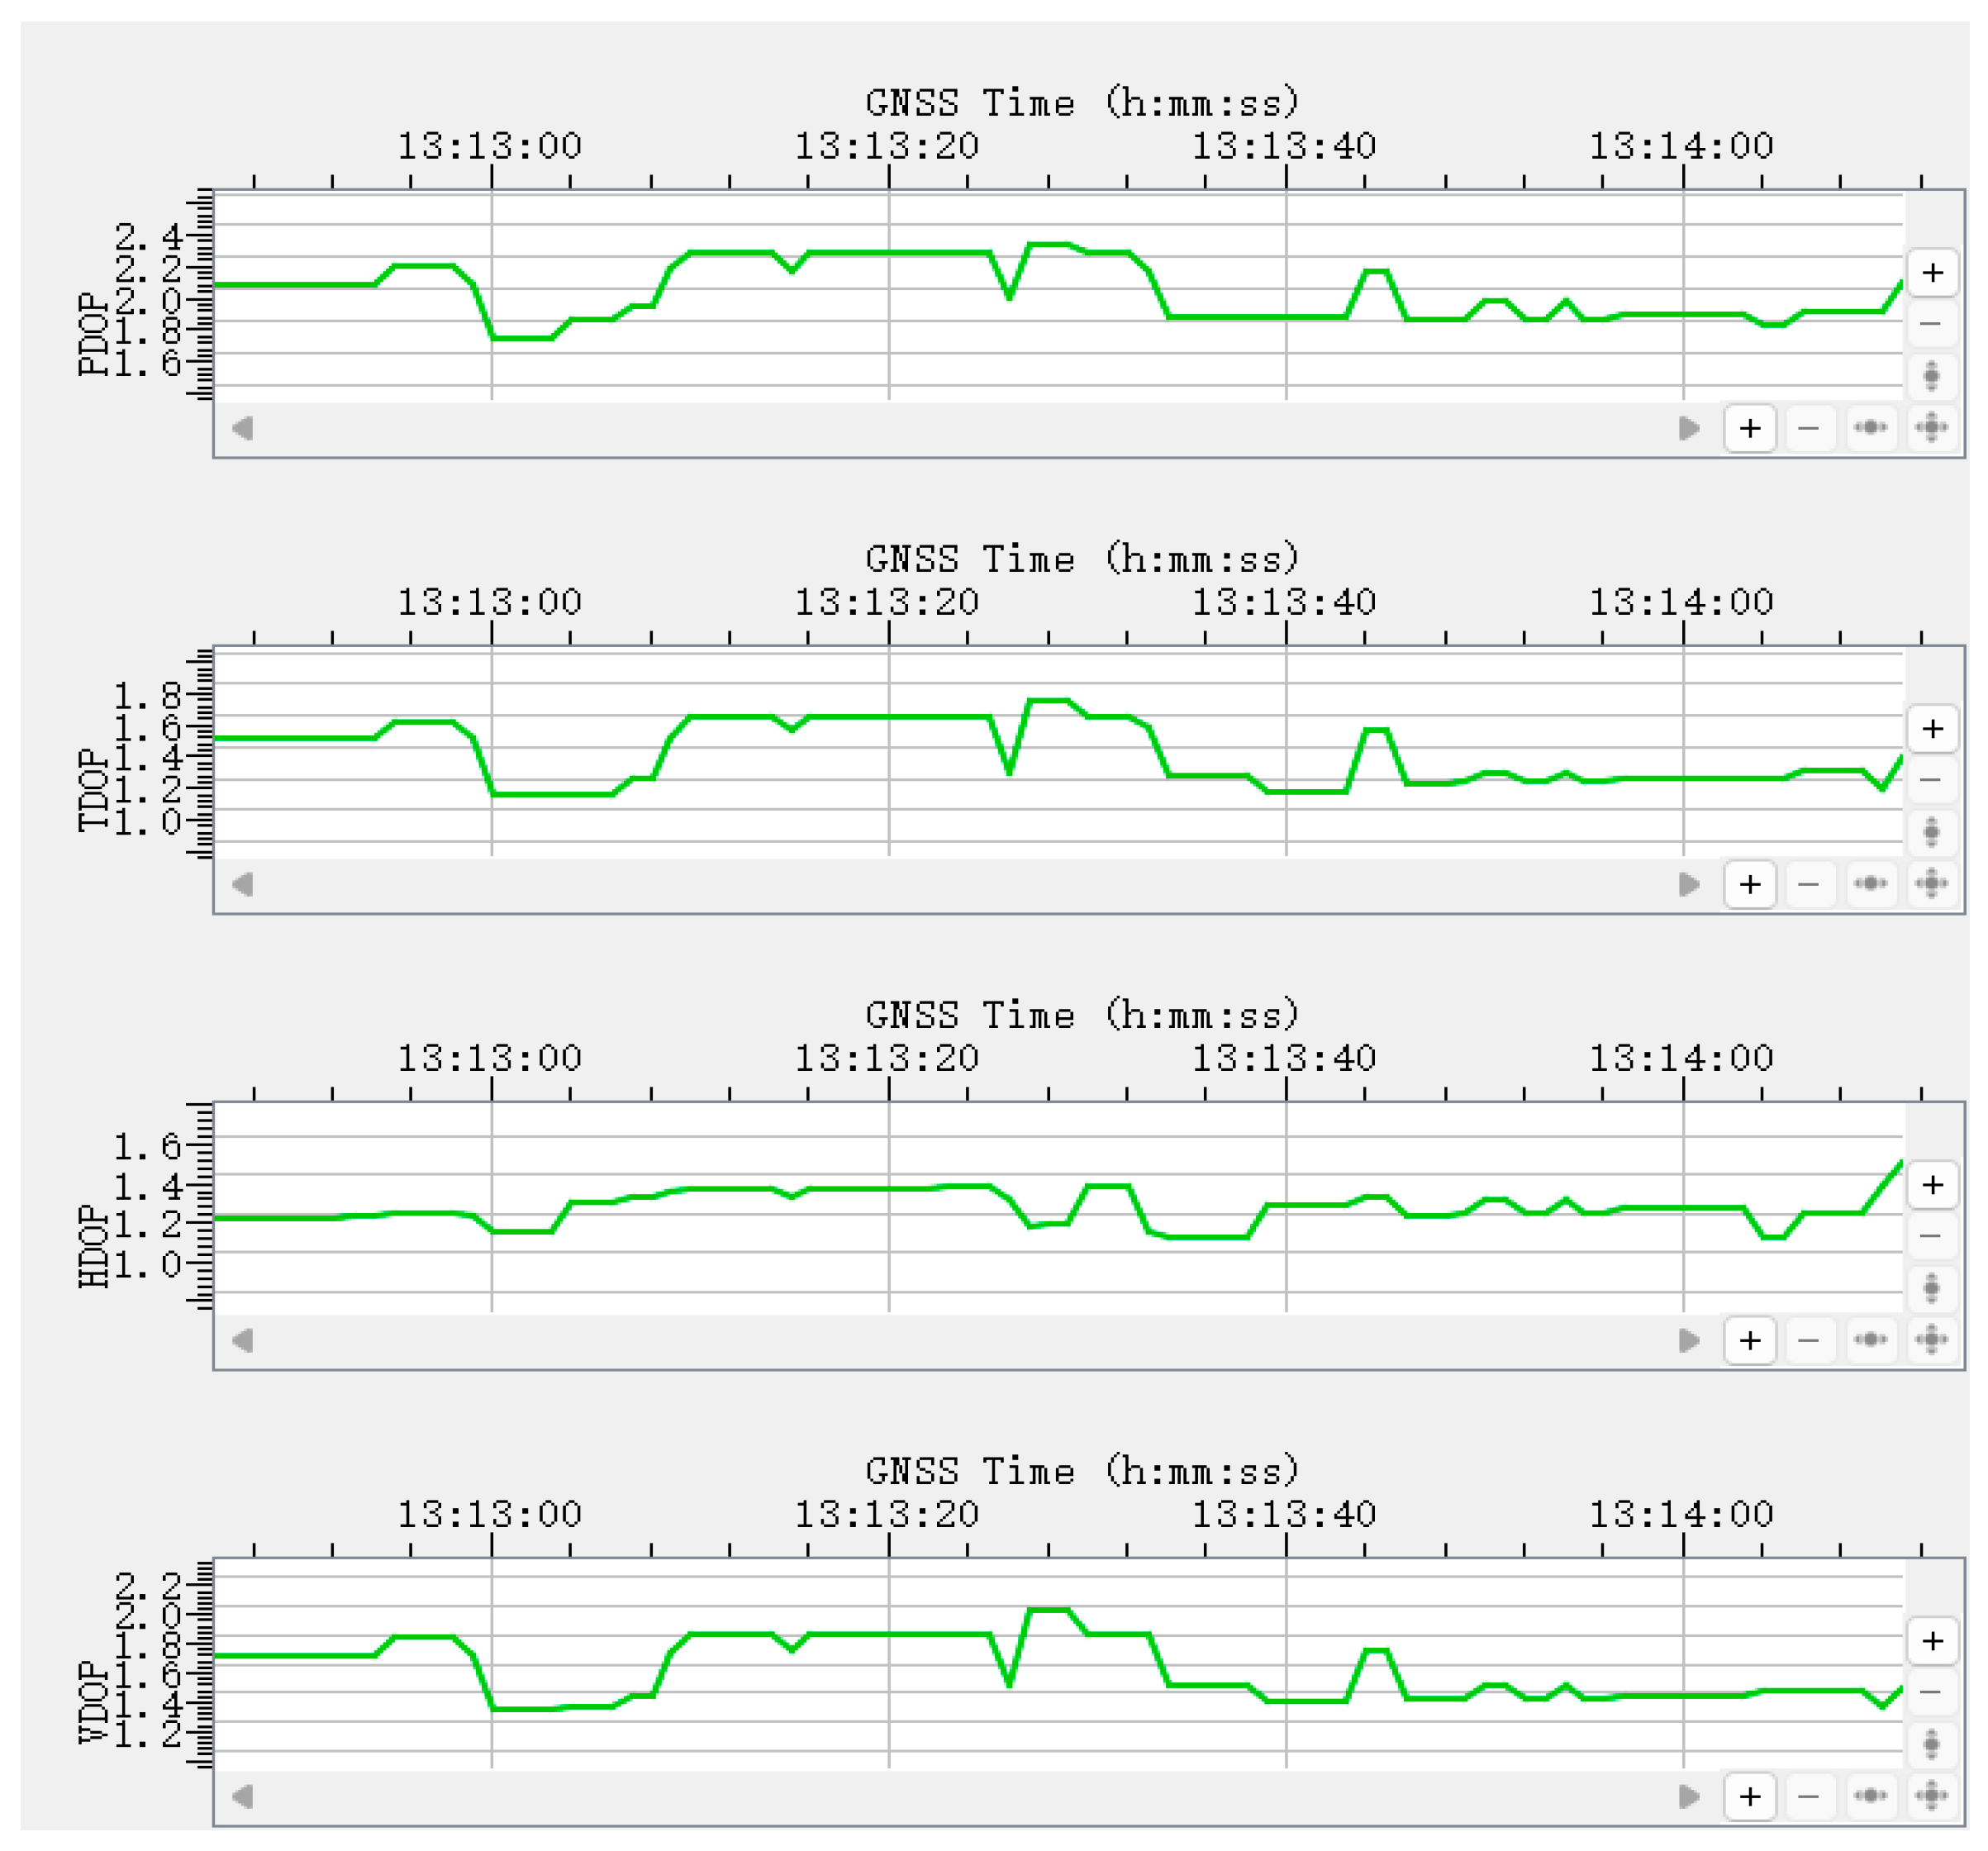
DOP is a critical metric for GNSS accuracy, reflecting the effect of satellite geometry on positioning precision. Key DOP indicators include: PDOP (3D positioning precision), TDOP (Timing precision), HDOP (Horizontal precision), VDOP (Vertical precision). DOP monitoring results are given in Figure 37.
5.
Data logging and analysis
During testing, the GNSS receiver’s status was recorded in real time for each frequency point. Three failure modes were specifically monitored: Device shutdown or reboot, Signal loss, Severe degradation in positioning accuracy.
After testing, all data were statistically analyzed to assess the GNSS receiver’s immunity performance under HIRF conditions.

5.3. Analysis of Anechoic Chamber Test Results

To evaluate the GNSS receiver’s immunity under HIRF conditions, this section analyzes and summarizes monitoring data across all test frequency bands. No shutdown or reboot events were observed during the test; however, signal loss occurred at several frequencies, indicating that the receiver was affected by the high-intensity electromagnetic environment and highlighting the need for improved HIRF protection.
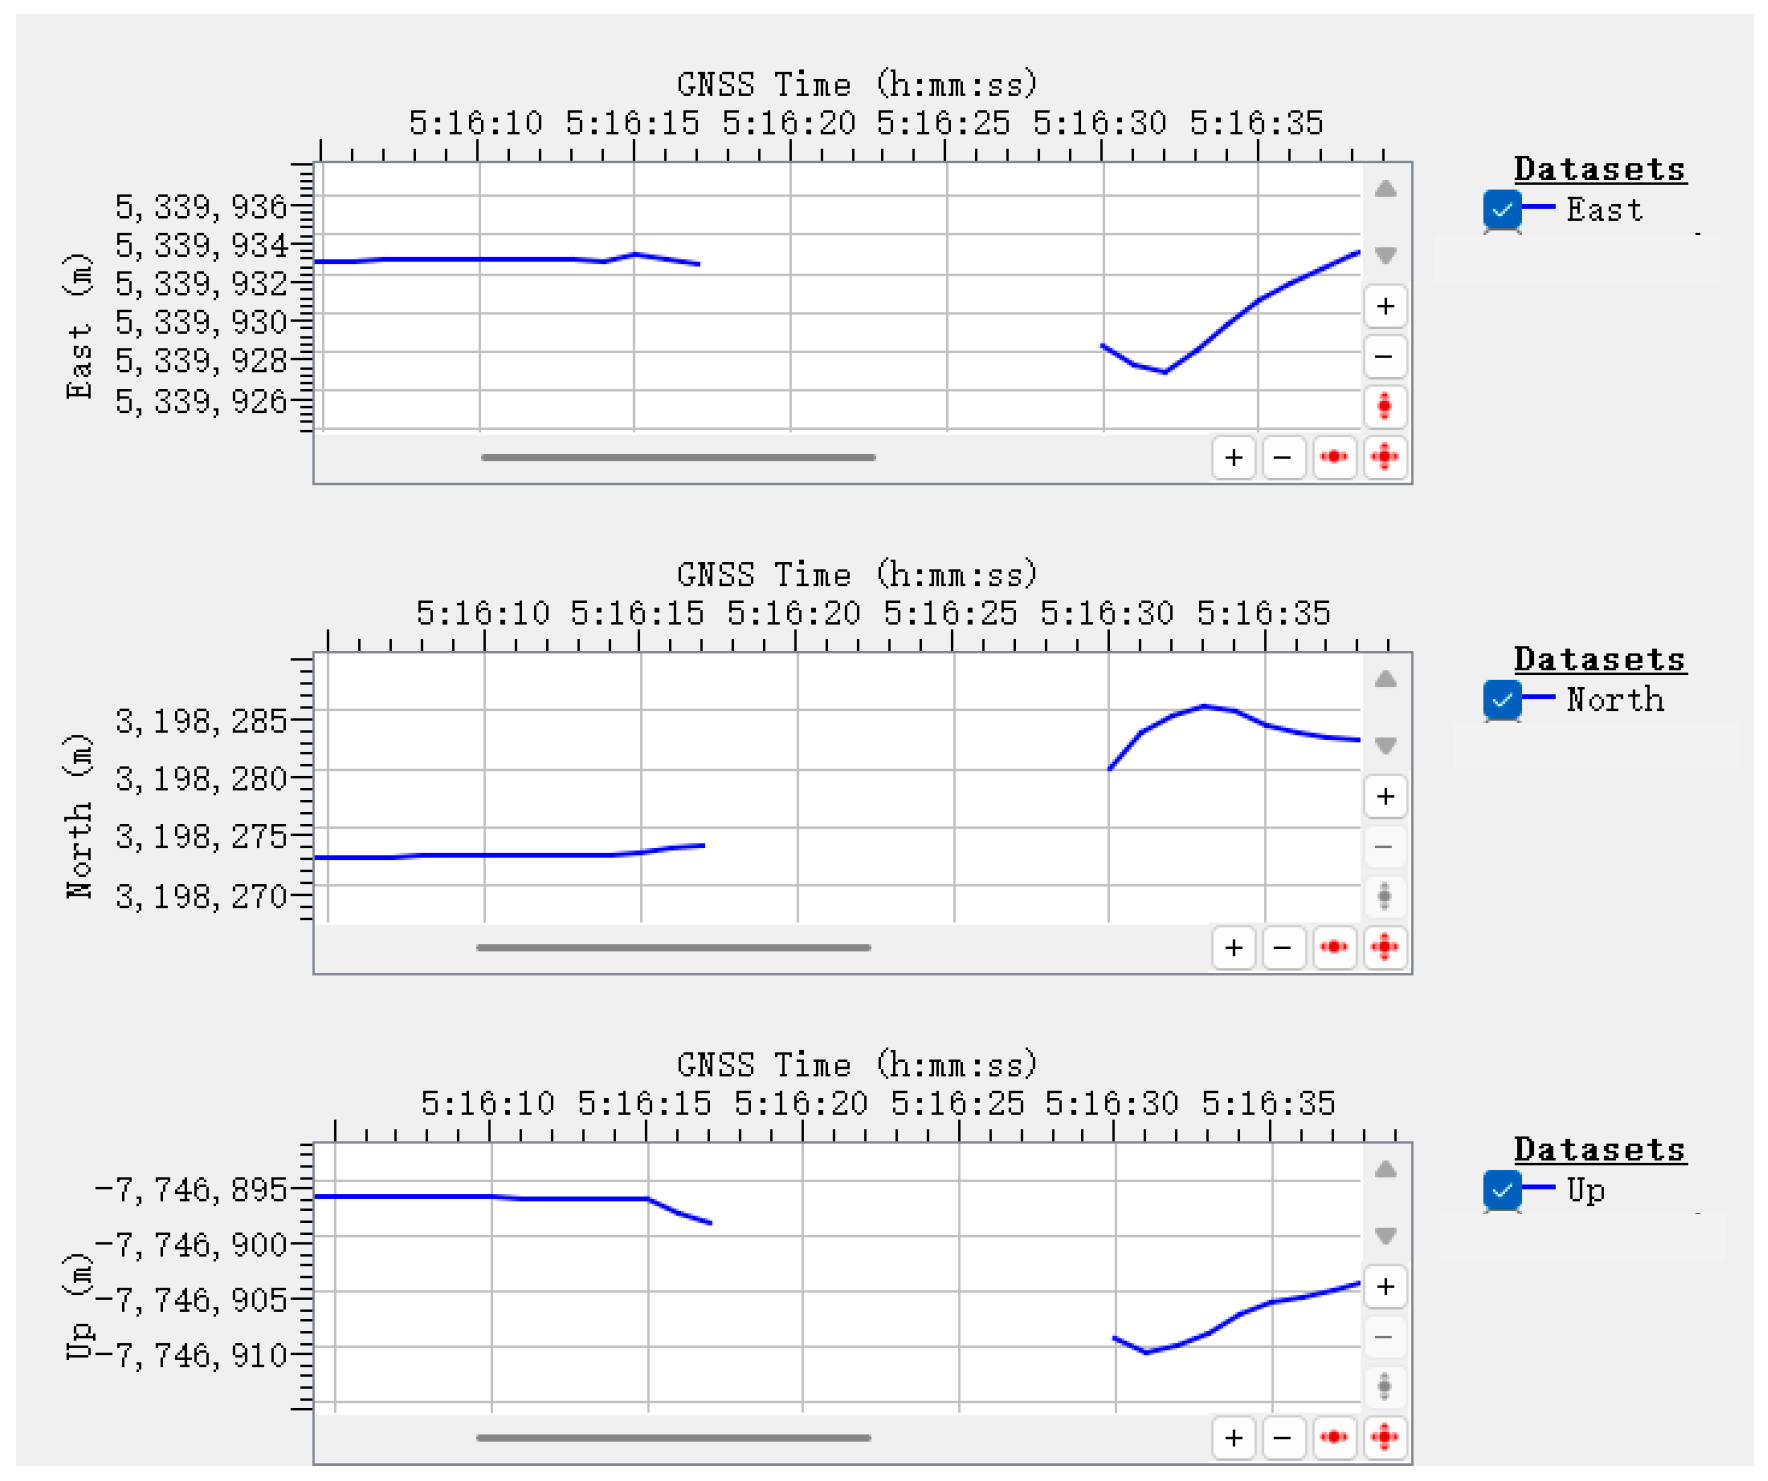
As shown in Figure 38, at 13.183 GHz under horizontal polarization, the receiver experienced repeatable signal loss. When the electromagnetic field was applied, the navigation signal disappeared, returned after the field was removed, and vanished again when the same field strength was reapplied. Although the signal eventually recovered, data discontinuities and degraded positioning accuracy were observed.
As illustrated in Figure 39, at 14.125 GHz with vertical polarization, a similar signal loss event was observed. After the electromagnetic field was removed, the signal resumed but with errors—the recovered data deviated from the stable state, indicating a temporary receiver failure accompanied by drift. The navigation data gradually returned to stability, suggesting that HIRF interference can temporarily degrade positioning accuracy and that recovery involves a noticeable latency.
Signal loss events were also recorded at other frequencies. The summary of observed failures is presented in Table 5.
As shown in Table 5, most signal loss events occurred in the 12–18 GHz range, where the receiver exhibited higher susceptibility to electromagnetic interference. These results align with the simulation predictions, particularly the identified resonance frequencies, thereby confirming the validity of the simulation model. Furthermore, the data indicate that the receiver’s high-frequency immunity remains insufficient, underscoring the need for improved HIRF shielding and enhanced design robustness.

5.4. Impact of HIRF on GNSS Receiver Performance

During testing, the GNSS receiver exhibited signal loss in the high-frequency band (12–18 GHz). To investigate the interference mechanism of HIRF on GNSS performance, this section analyzes signal reception capability and positioning accuracy, focusing on the trends of carrier-to-noise density ratio (C/N0) and dilution of precision (DOP) to reveal HIRF-induced performance changes.
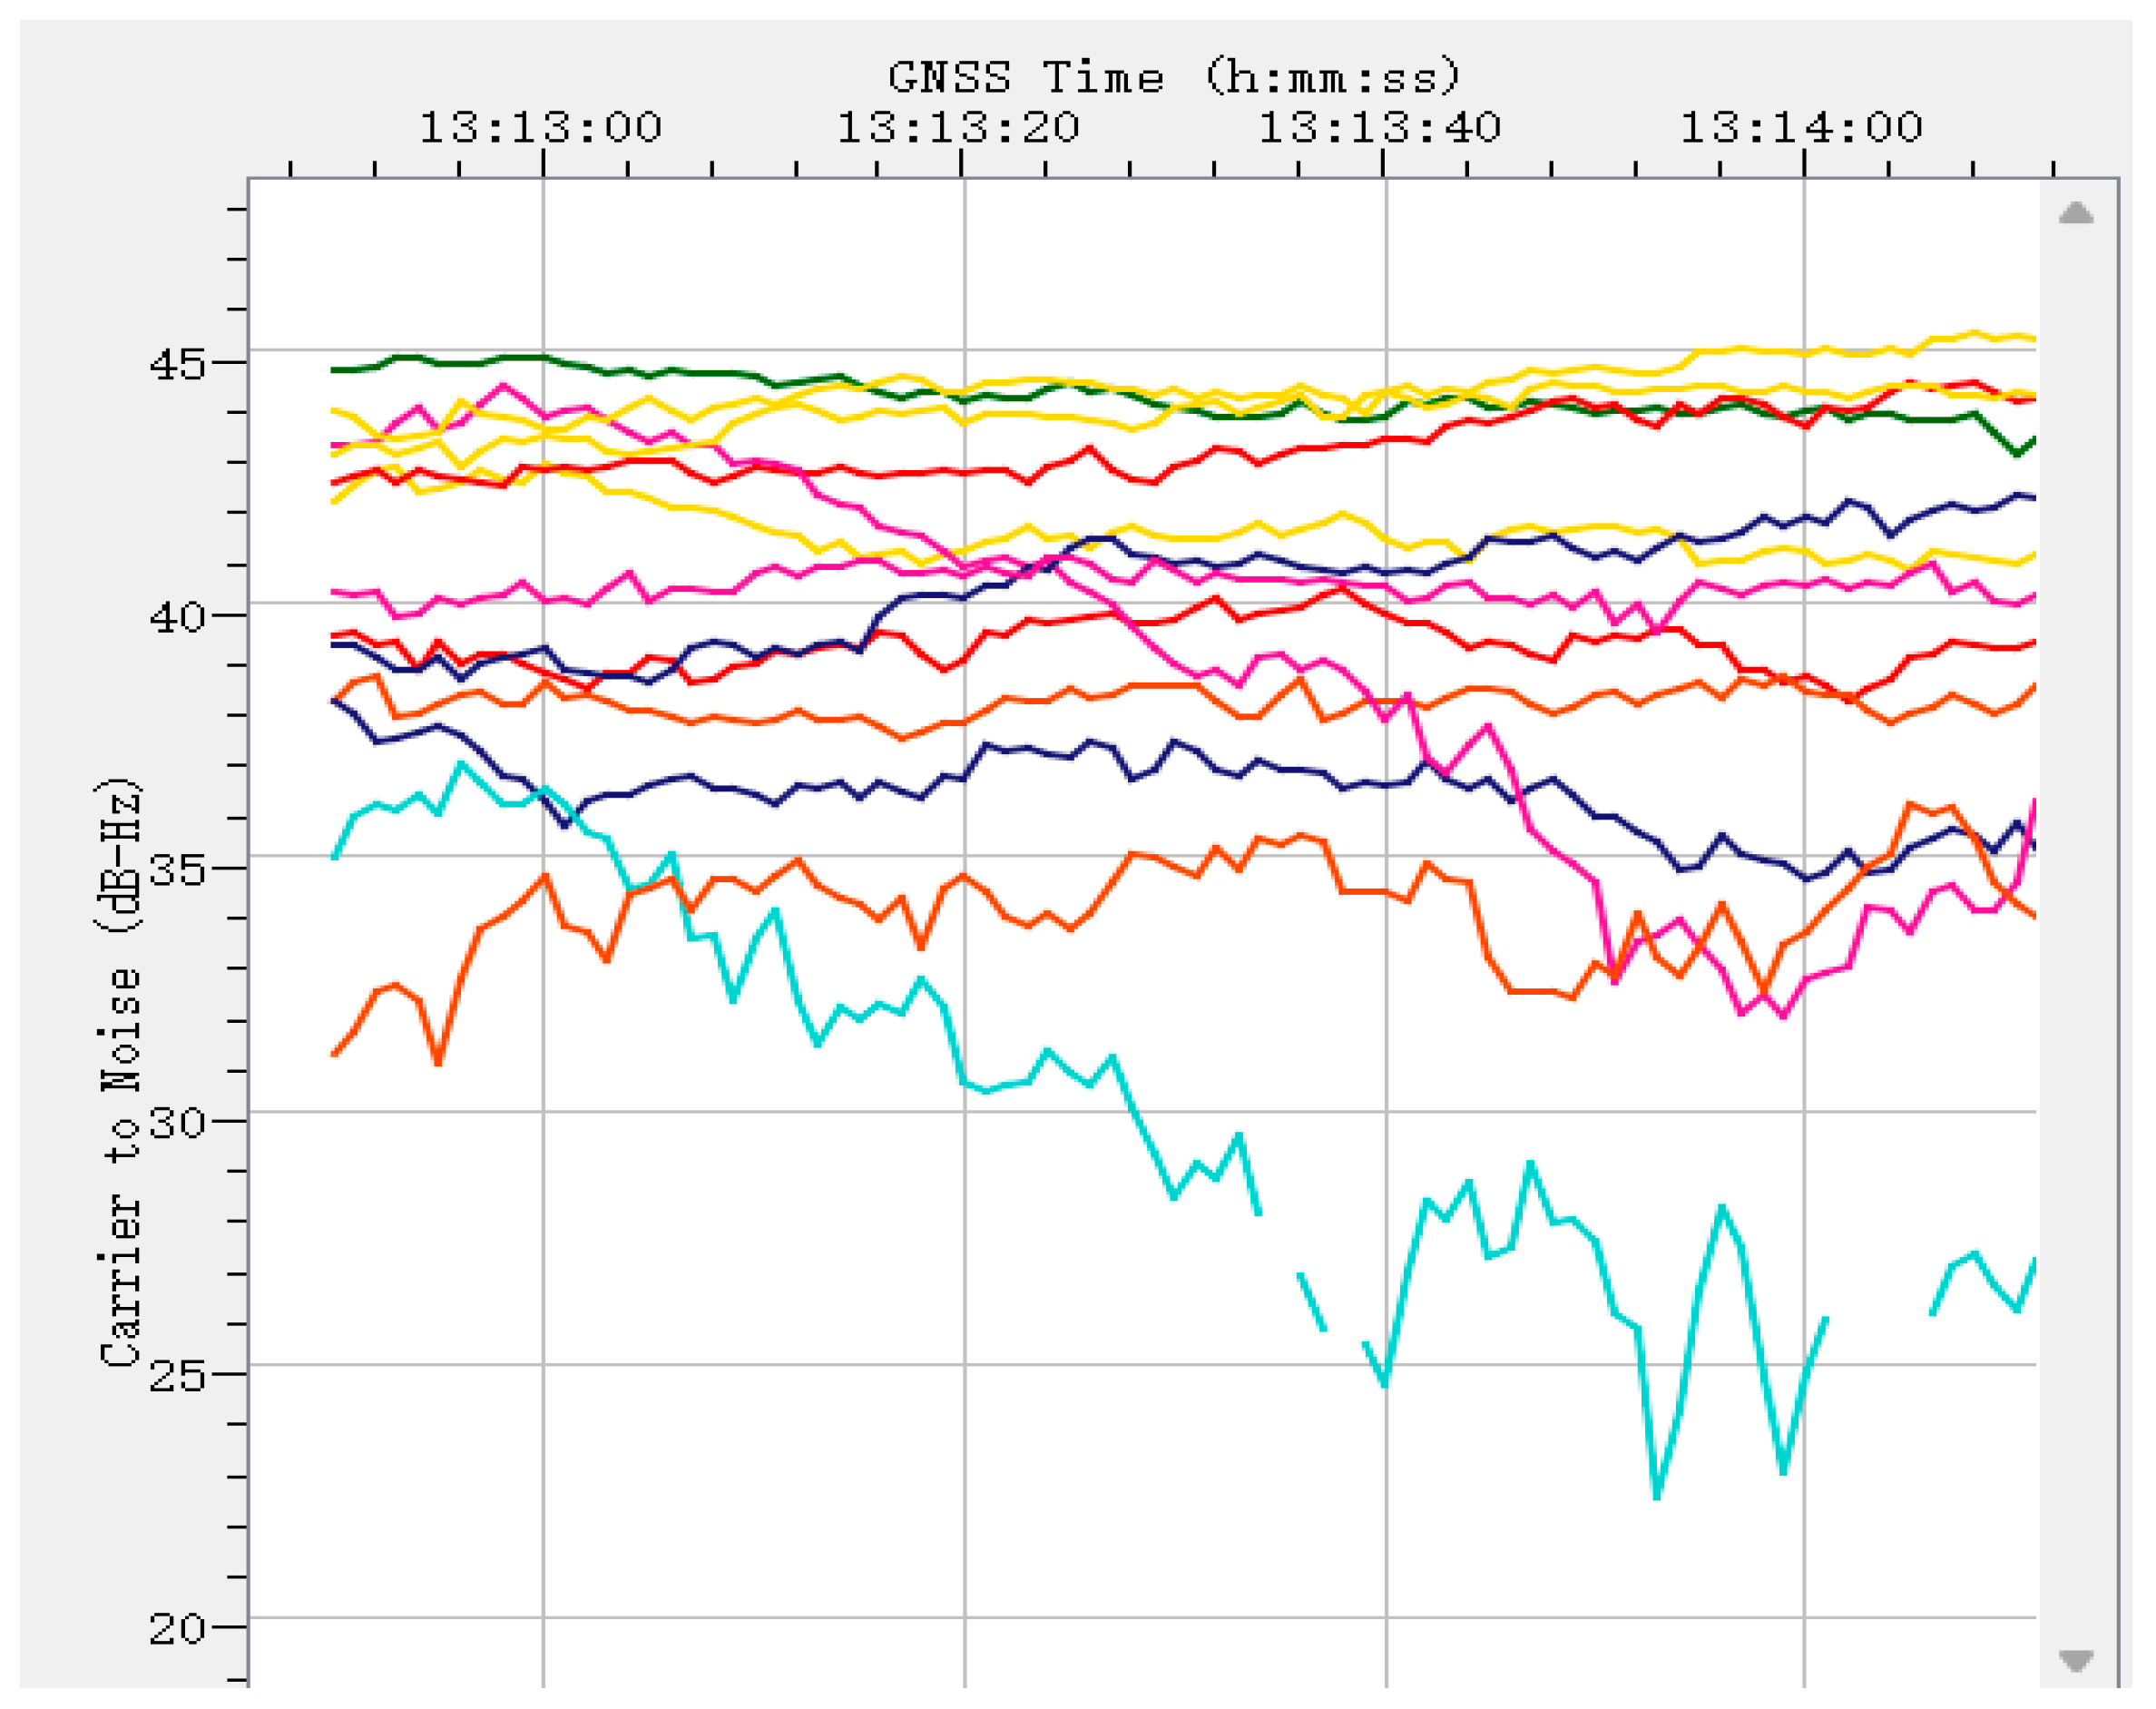
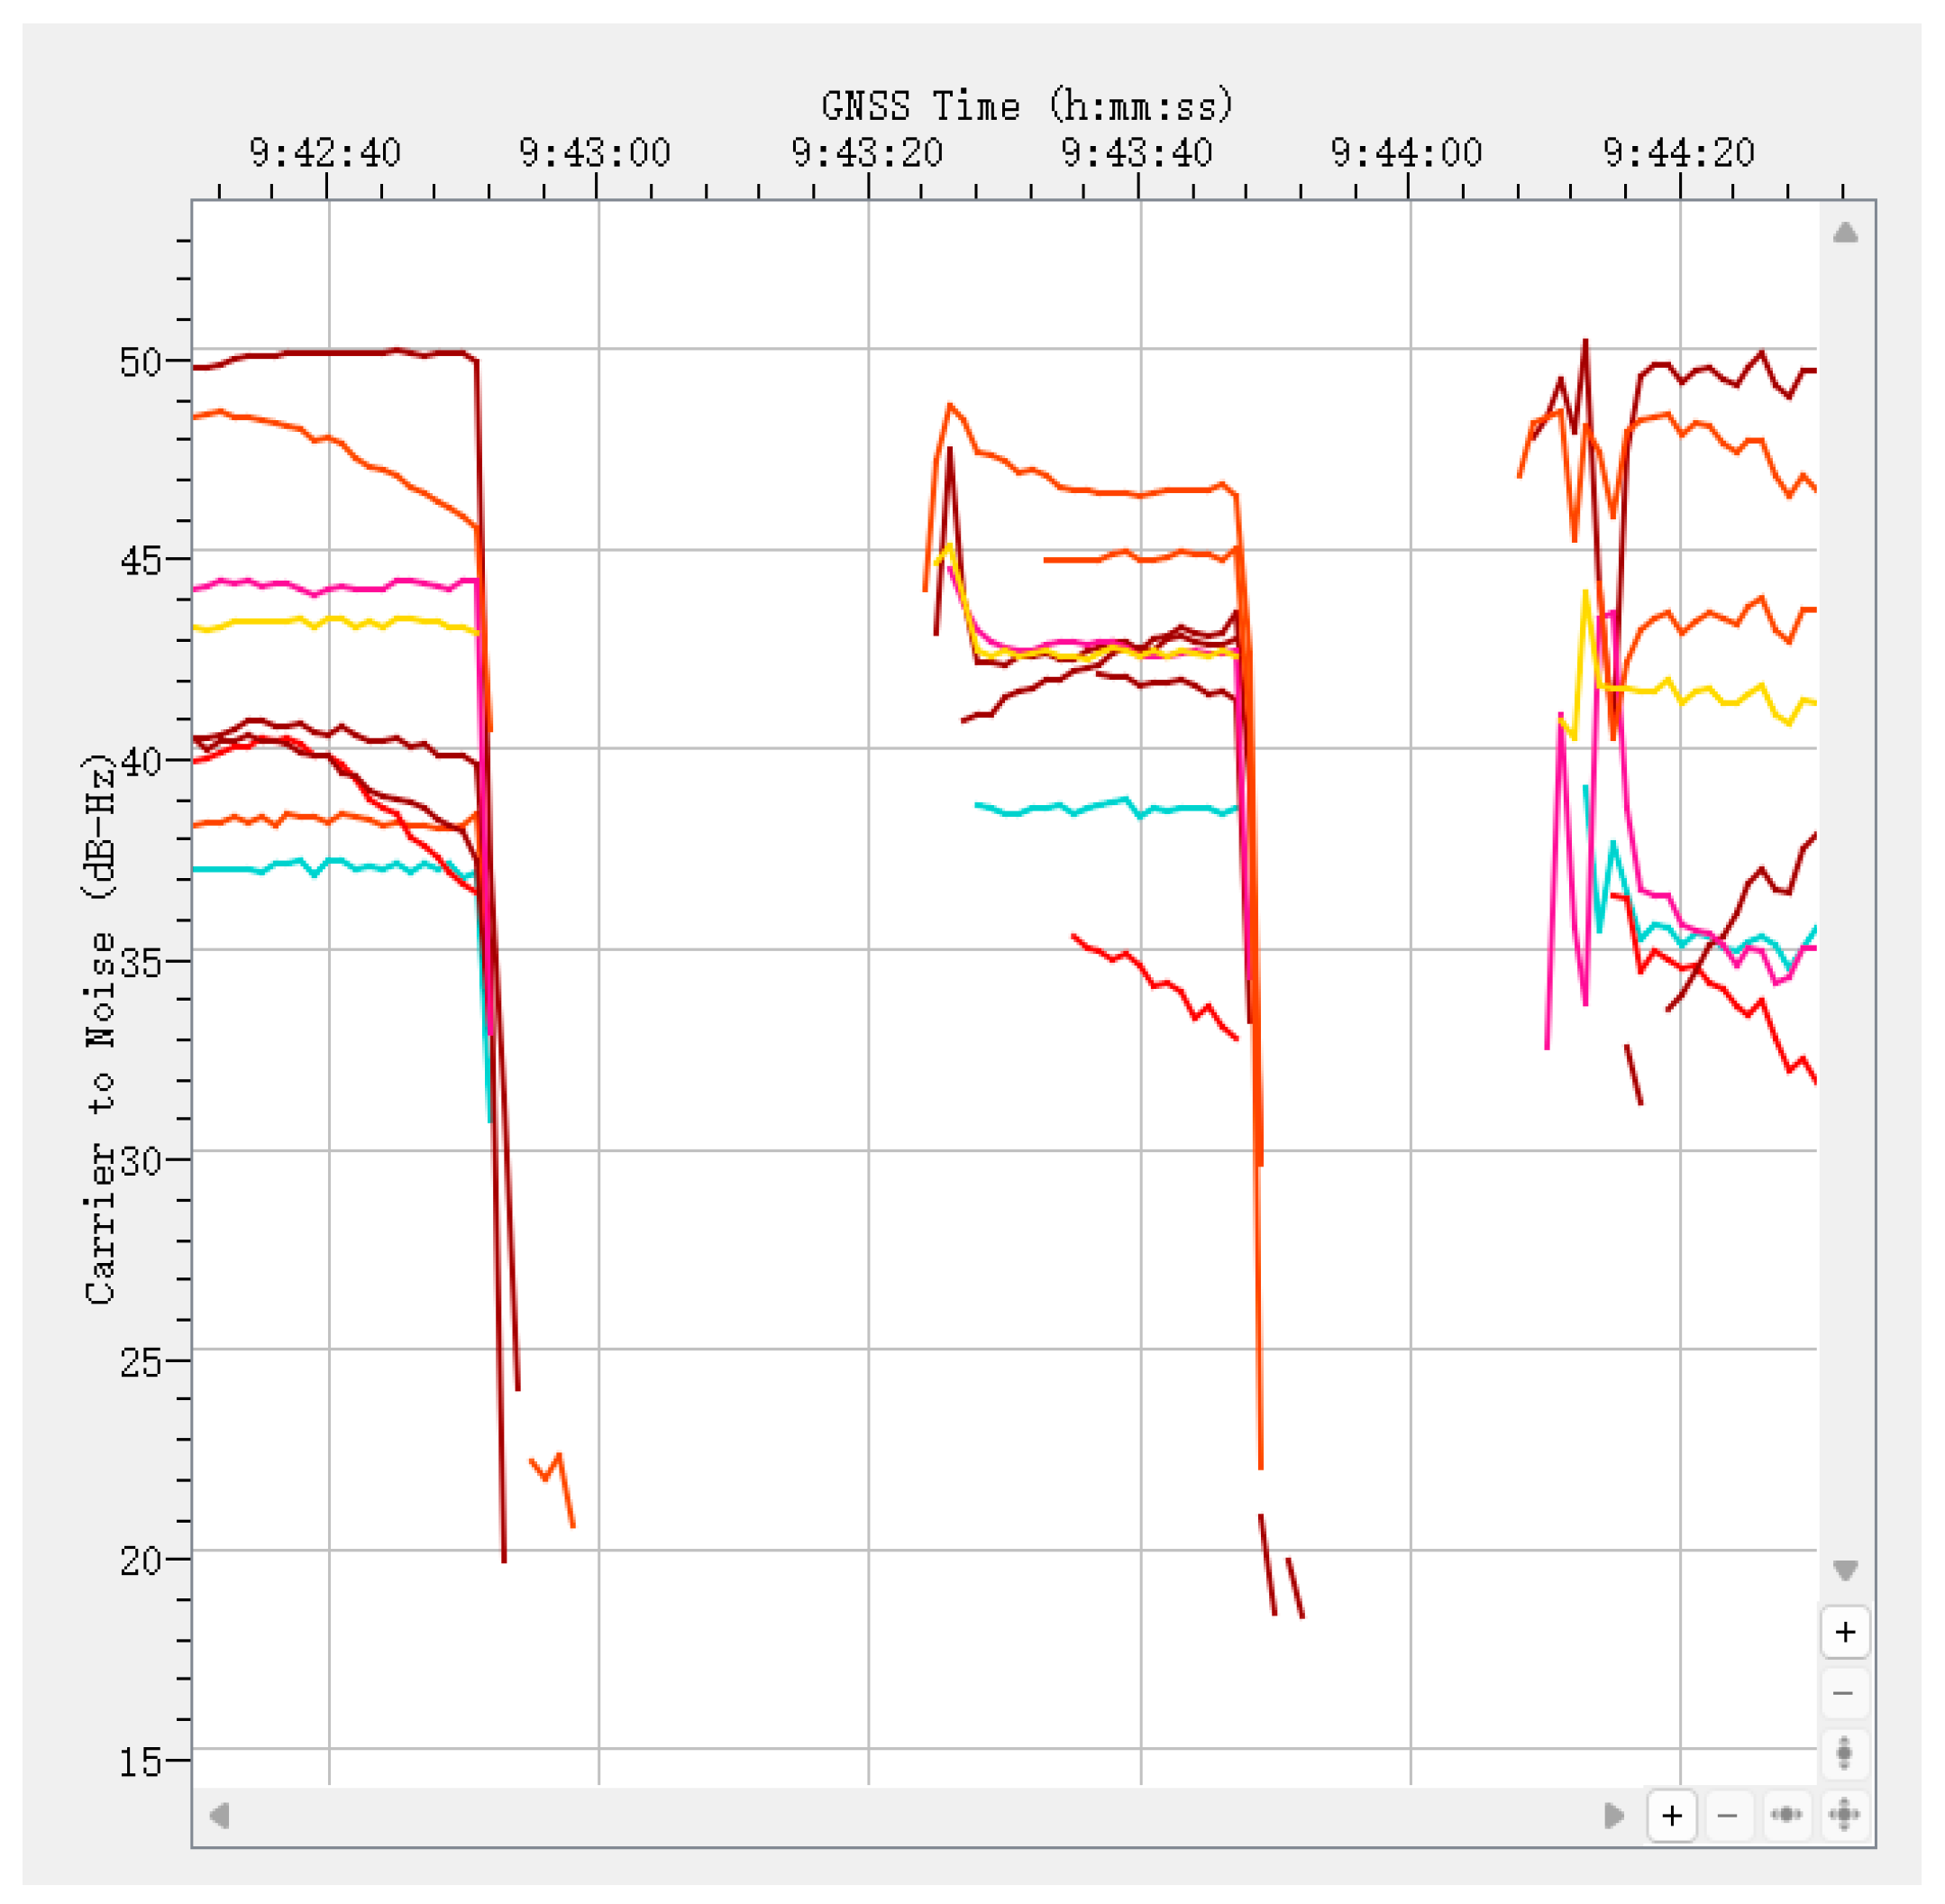
C/N0 is a key indicator of GNSS signal quality, representing the ratio of received signal power to noise power spectral density. HIRF can disturb the receiver front end, driving C/N0 downward, potentially below the tracking threshold. The navigation filter then discards low-quality satellites, reducing the usable satellite set and degrading geometry, which in turn increases DOP. As high-quality satellites further diminish, positioning accuracy deteriorates and solution failure may occur. Based on the test data, the receiver’s response under HIRF can be summarized into two coupling modes:
  • Moderate coupling degradation: partial loss of lock, C/N0 decreases, DOP rises slowly.
As illustrated in Figure 40 and Figure 41, within the 4–6 GHz horizontal-polarization band, several satellites exhibited reduced C/N0, whereas the overall DOP remained largely stable. This indicates that, despite interference to individual satellites, sufficient satellite count and geometry still supported the solution, so positioning accuracy did not markedly worsen.
2.
Severe coupling failure: C/N0 drops below threshold, multiple satellites invalid, DOP surges, leading to signal loss.
As shown in Figure 42 and Figure 43, at 13.183 GHz (horizontal polarization), applying HIRF caused C/N0 to collapse to the limit, followed by a sharp rise in DOP and eventual signal loss. When the field was turned off, the signal recovered gradually—C/N0 increased and DOP returned to a stable level. Reapplying HIRF reproduced the sequence (C/N0 down → DOP up → signal loss), and removal again restored normal values, indicating a stable coupling condition at this frequency. The mechanism is that multiple satellites simultaneously fall below the tracking threshold; after the receiver discards them, the remaining satellites are too few or geometrically unfavorable, causing solution failure and navigation interruption. Although the HIRF effect is instantaneous and reversible, recovery may involve transient data drift or jumps.
Summary. These results show that HIRF primarily degrades the receiver’s signal chain, driving C/N0 downward, which then triggers DOP increase and positioning performance loss. This mechanism is reproduced in both moderate coupling and severe failure cases; when HIRF is removed, C/N0 and DOP recover, confirming a dynamic coupling between the two metrics. Accordingly, DOP can serve as an anti-interference assessment and early-warning indicator: its rise in tandem with C/N0 degradation delineates the performance degradation–failure boundary for GNSS receivers under HIRF.

6. Mechanism Analysis and Optimization Recommendations

Building on the preceding study, this chapter addresses the shielding-failure mechanisms and engineering remedies for airborne equipment under HIRF. Section 6.1 constructs and validates an equation-based mechanism framework, cross-verified by simulation and anechoic-chamber experiments; Section 6.2 then proposes optimization strategies aligned with the mechanisms and test results, aiming for predictable, verifiable, and quantifiable improvements in shielding effectiveness (SE)

6.1. Mechanism Analysis

This section develops a complete analytical framework—combining cavity modes, slot resonance, waveguide-below-cutoff, and thickness-driven attenuation—to explain the simulation and experimental observations and to provide the theoretical basis for the subsequent design recommendations.

6.1.1. Resonance Mechanism Analysis

For the single-point resonance case, starting from Equations (3) and (4), one can derive:
f m n p = c 2 m a e f f 2 + n b e f f 2 + p l e f f 2 .
When the external radiation frequency approaches the effective eigenfrequency f m n p , the cavity stores significantly more energy and forms standing waves, leading to a pronounced drop in shielding effectiveness (SE) at the corresponding frequency. In practice, apertures/slots shift the eigenfrequency downward; therefore, an effective-dimension correction is introduced:
a e f f = a + a ,   b e f f = b + b ,   l e f f = l + l ,   η w ,
where w denotes the characteristic width of the dominant hole/slot, and η is the correction coefficient.
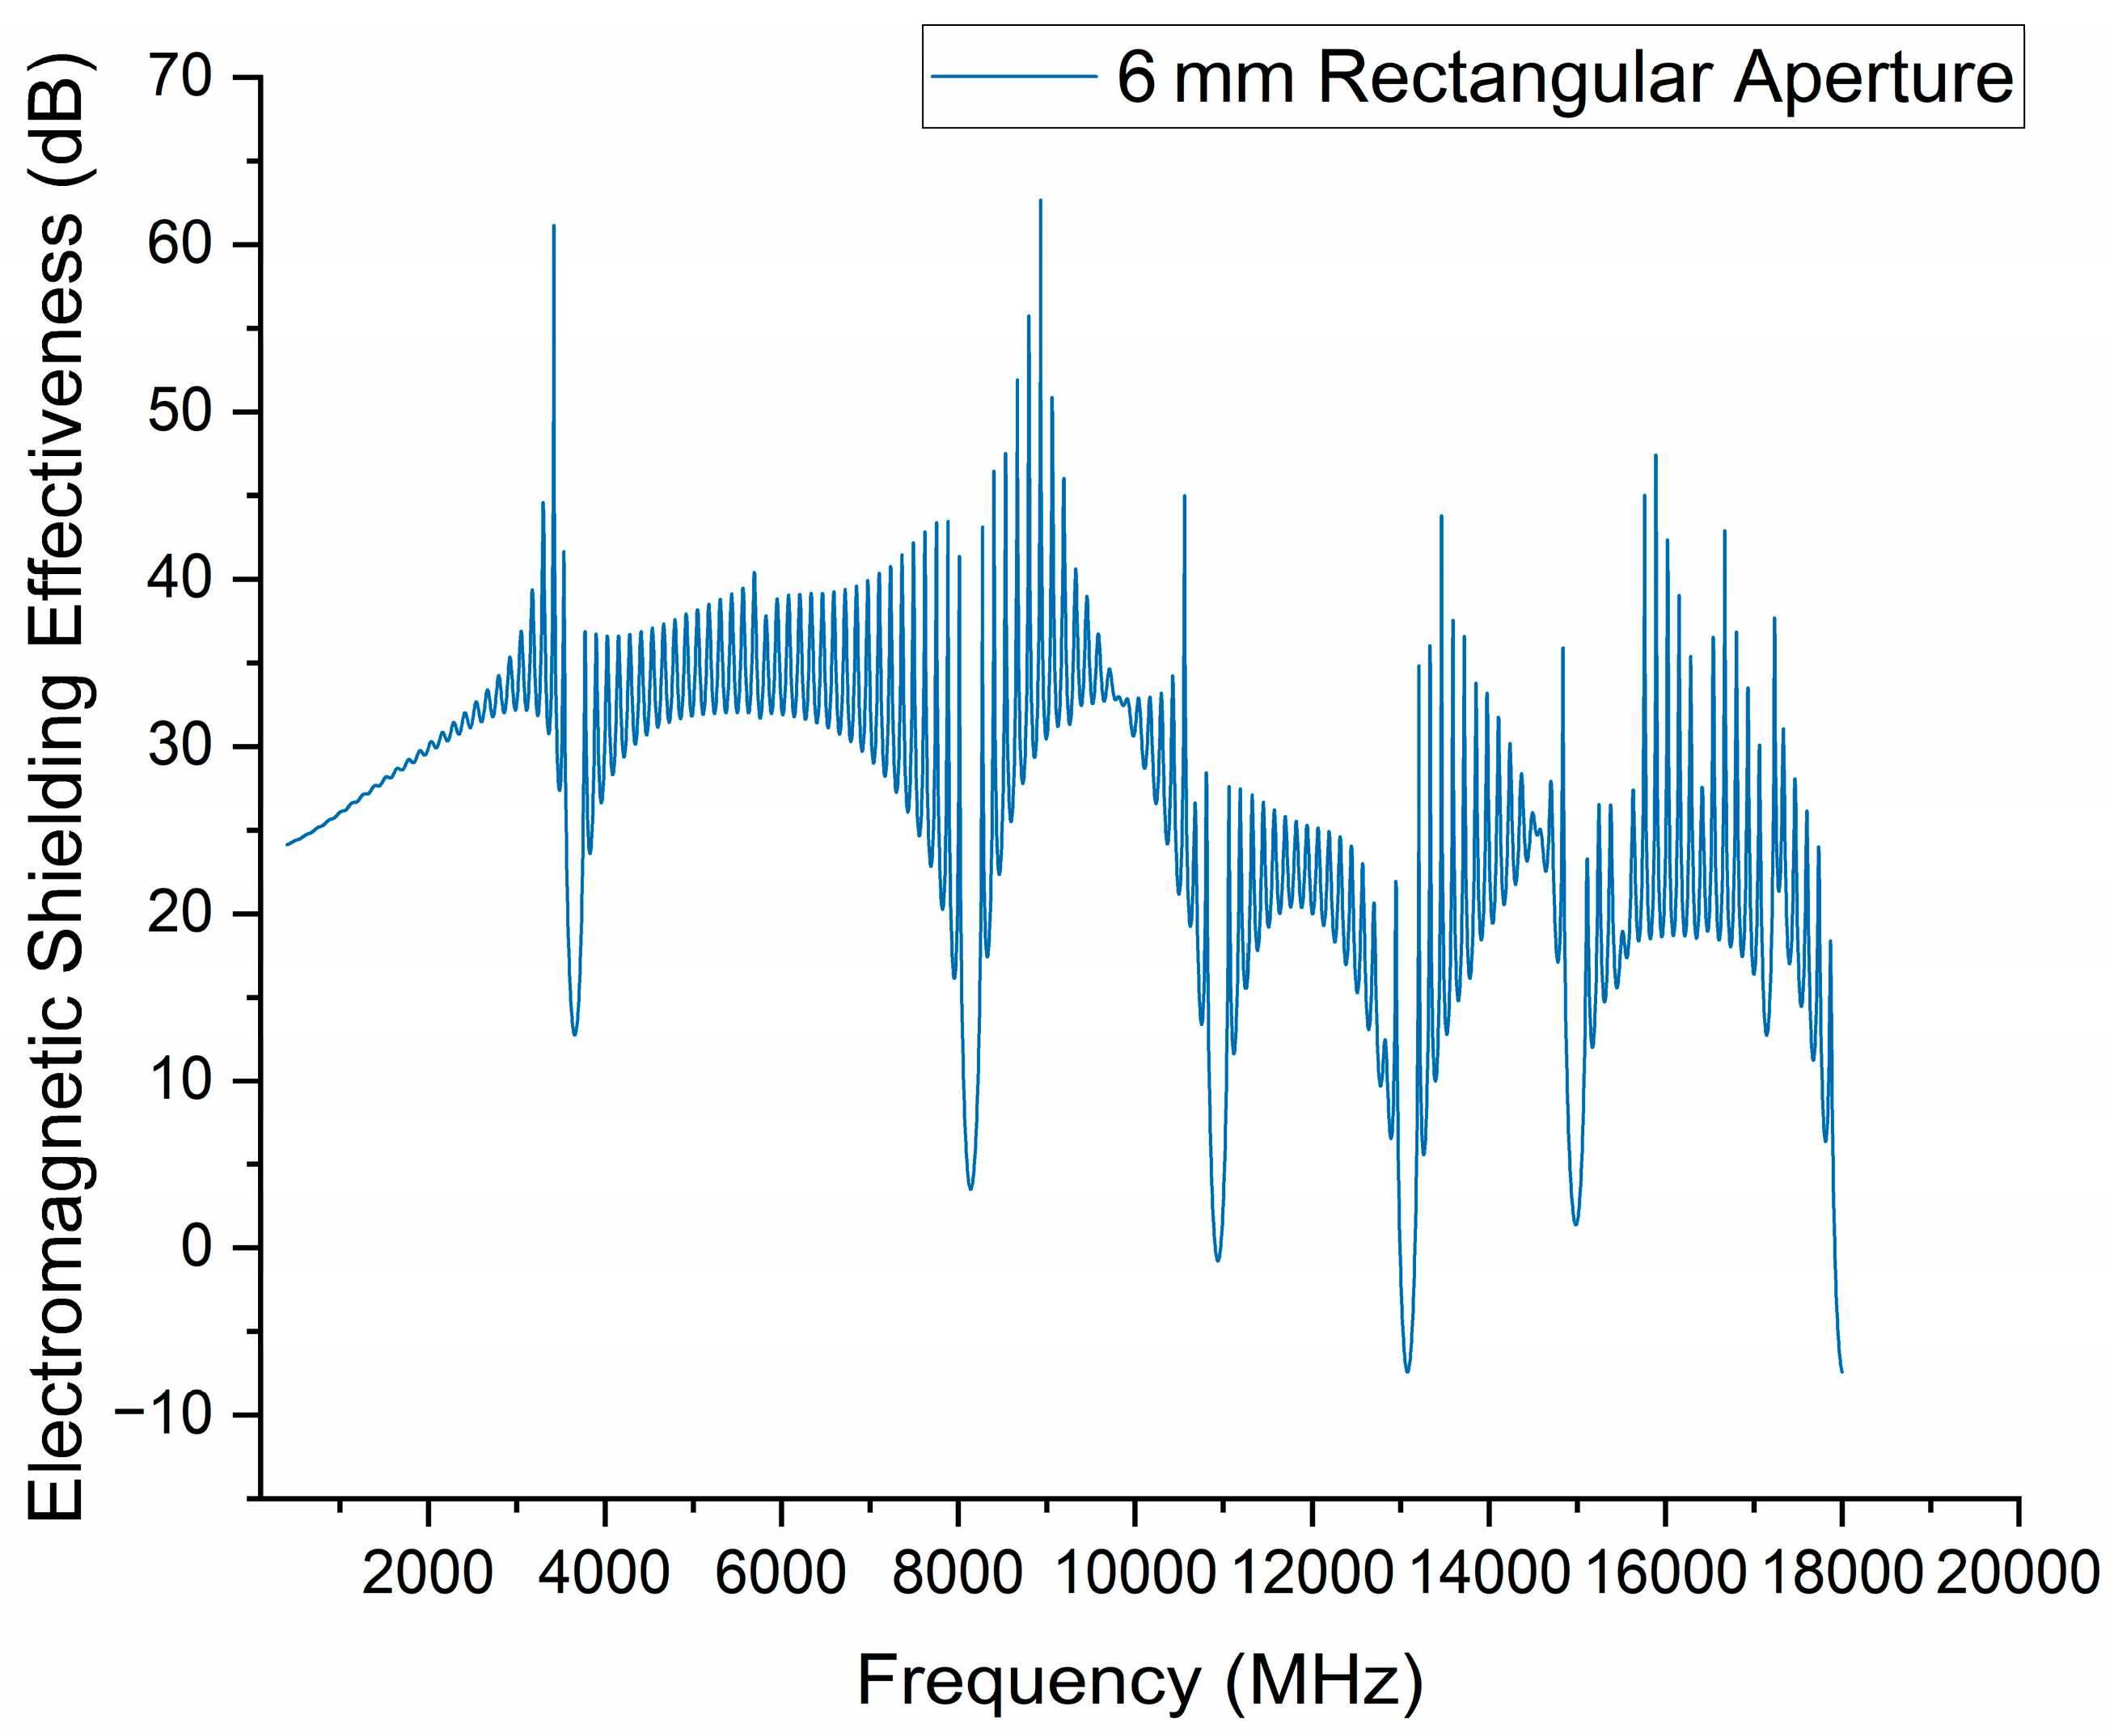
By comparing the cavity eigenfrequencies given by Equations (9) and (10) with the simulation data point by point, the quantitative link between resonance frequencies and the enclosure/aperture geometry can be verified and fixed; a single simulation or an anechoic-chamber measurement suffices to calibrate the correction factor. This criterion is applied to the single-aperture model in Section 4.7 (square opening with 6 mm side; wall thickness 1 mm), whose shielding-effectiveness curve is shown in Figure 44.
Under this condition, several single-point resonances occur, in ascending order at 3.6595, 8.183, 11.047, 13.251, and 14.916 GHz. Calibration and validation based on these frequencies are presented below.
  • Calibration of the correction factor
Set the inner-cavity dimensions to a = 58 mm, b = 14 mm, and l = 58 mm. Under horizontal polarization, the 3.6595 GHz notch corresponds to the low-order mode f 101 . Substituting into Equations (5) and (6) gives
f 101 = c 2 1 a e f f 2 + 1 l e f f 2 , a = l ,
a e f f = l e f f = X = c 2 f 101 = 57.967 mm ,
from which the correction factor is obtained as
η = X a w = 57.967 58 6 5.74 10 3 .
Because the aperture is small and there is only one opening, the correction is negligible; increasing the number or size of apertures would increase η The calibrated effective dimensions are a e f f = l e f f = 57.967 mm ,   b e f f = 13.967 mm .
  • Predicting other resonances (validation)
Inserting the calibrated dimensions into the other low-order modes yields
f 103 = c 2 1 a e f f 2 + 3 2 l e f f 2 = 8.183 GHz ,
f 011 = c 2 1 b e f f 2 + 1 l e f f 2 = 11.047 GHz ,
f 013 = c 2 1 b e f f 2 + 3 2 l e f f 2 = 13.251 GHz ,
f 014 = c 2 1 b e f f 2 + 4 2 l e f f 2 = 14.916 GHz .
The comparison between predicted and simulated resonance frequencies is summarized in Table 6.
These results show that a single-point calibration of η enables accurate prediction of the remaining resonance frequencies, with errors of 0.5–1.4%. The method thus provides an actionable, formula-based criterion for rapid estimation and geometry optimization at the design stage.

6.1.2. Mechanism of High-Permeability Materials on Shielding Effectiveness

The overall shielding effectiveness (SE) can be approximated as the sum of an absorption term A , a reflection term R , and a multiple-reflection term B :
S E = A + R + B .
The absorption term can be evaluated by:
A = 20 log 10 e t δ = 8.686 t δ , δ = 2 ω μ σ ,
where t is the material thickness, δ the skin depth, ω = 2 π f , μ the permeability, and σ the conductivity. This directly indicates that high permeability μ reduces δ and therefore increases the absorption term A .
The reflection term can be estimated by:
R 168 10 log 10 σ r μ r 20 log 10 f ,
where μ r is the relative permeability, σ r the relative conductivity, and f the frequency in MHz.
From these relations, increasing μ r slightly reduces R but enhances A more significantly; thus, the core value of high-permeability materials is to boost absorption and thereby improve the overall SE.

6.1.3. Mechanism: Effect of Aperture Size and Shape on Shielding Effectiveness

In shielding enclosures, apertures/vents are typical weak links for electromagnetic leakage. Simulations in Section 4 show that larger apertures yield poorer SE, and circular openings outperform rectangular ones. To quantify this, an aperture can be modeled as a short waveguide section. Waveguide theory indicates that when the incident frequency is below the cutoff frequency, the guide is below cutoff and fields decay exponentially inside the aperture, impeding transmission; when the frequency exceeds cutoff, the mode propagates and leakage rises rapidly [35]. Hence, the cutoff frequency is a primary indicator of an aperture’s shielding capability.
For common aperture shapes, the cutoff frequency can be expressed as:
Rectangular aperture (taking [ w t ] as the main width):
f c r e c = c 2 w t .
Circular aperture (radius [ r ]):
f c c i r c = 1.841 c 2 π r ,
where c is the speed of light.
Comparing these relations shows that, for the same characteristic size, a circular hole has a higher cutoff frequency, is more likely to operate below cutoff in the band of interest and thus provides better SE than a rectangular hole. Moreover, smaller apertures yield higher cutoff and lower leakage risk. For equal area or equal size, circular openings still tend to outperform square/rectangular ones—consistent with our simulations. Design implication: tightly limit aperture size, and prefer circular or rounded-corner geometries to raise cutoff and mitigate edge-field enhancement, thereby improving SE.

6.1.4. Thickness Enhancement and Honeycomb Channels

Electromagnetic waves propagating through a shield attenuate with the effective channel thickness; the attenuation scales with the shield thickness and the attenuation constant. According to waveguide theory (waveguide-below-cutoff), the relationship between the channel attenuation constant, thickness, and the resulting shielding effectiveness can be written as:
S E t = 20 log 10 e γ t = 8.686 γ t ,
where γ is the attenuation constant of the aperture/channel (governed by the aperture geometry, dimensions, material properties, and the incident frequency), t is the shield thickness (m), and S E t is the incremental shielding effectiveness (dB).
From (16), increasing the effective thickness is a direct and efficient way to improve SE. Honeycomb structures exploit a “small aperture + long channel” geometry, increasing both γ and t . As a result, they deliver strong SE while reducing weight and are widely adopted in aerospace to achieve high shielding effectiveness together with structural strength.

6.2. Optimization Recommendations

Building on the preceding mechanism analysis and the simulation/measurement results, this section proposes optimization measures to improve the shielding effectiveness (SE) of airborne equipment under HIRF. The recommendations cover frequency response and resonance control, aperture design, material matching, and multi-polarization protection, and are intended to provide practical design guidance.

6.2.1. Resonance Suppression

In the 3–10 GHz range, when the excitation approaches structural eigenfrequencies, single-point resonances are readily triggered, causing sharp SE degradation. According to Section 6.1.1, this is pronounced when the characteristic dimensions of apertures/slots approach the incident wavelength. The following measures are recommended to avoid resonance-induced SE loss:
  • Geometric detuning: Adjust enclosure dimensions and aperture geometry to shift resonances away from critical bands; simulations and mechanism analysis show that resizing the aperture and refining its shape can effectively avoid these resonance frequencies.
  • Introduce absorbers: Apply ferrite, conductive rubber, or similar absorbing materials at openings or current hot spots to dissipate energy in the resonant band, thereby suppressing resonance and enhancing SE.
  • Seam optimization: Use EMI gaskets or conductive fabrics to improve electrical continuity across seams and reduce leakage through slots.
Table 7 summarizes the mitigation strategies and their corresponding frequency ranges.

6.2.2. Optimization of Aperture Design

According to Section 6.1.3 (mechanism of aperture size and shape on SE), the size, shape, and distribution of apertures directly affect shielding effectiveness. Simulations and mechanism analysis show that larger apertures lead to poorer SE, and the impact is more pronounced in the mid-to-high frequency bands. The following is recommended:
  • Aperture size control: Enlarging apertures significantly degrades SE, especially at mid/high frequencies. Strictly limit the maximum size of functional apertures (e.g., vents, interfaces). Use honeycomb waveguide windows and filtered interfaces to balance functionality and shielding.
  • Aperture shape optimization: Prefer small-size, circular, or rounded-corner geometries to raise cutoff frequency and avoid edge field enhancement and current crowding at sharp corners, thereby reducing the likelihood of resonance.
  • Number and distribution optimization: When apertures are unavoidable, adopt a multi-point, small-size, non-periodic layout to avoid strong coupling and resonance failure caused by concentrated openings. Replacing a single large opening with multiple small, dispersed holes effectively mitigates local resonance and improves overall SE.

6.2.3. Material Selection and Electromagnetic Property Matching

According to Section 6.1.2 and the simulation results, shielding effectiveness (SE) depends not only on material conductivity but also closely on permeability. High-conductivity materials (e.g., copper, aluminum) generally provide good SE; however, their SE fluctuates strongly near resonant frequencies, and degradation becomes pronounced once the structure enters a resonance band.
In contrast, high-permeability materials (e.g., iron, ferrite) can effectively suppress resonance-induced SE fluctuations, with particularly notable benefits at lower frequencies, thereby improving SE stability. Due to their comparatively lower conductivity, these materials are typically used in combination with other media to maintain effective shielding at higher frequencies.
For enclosure design, it is recommended to apply high-permeability materials or magnetic composites locally or globally at critical locations—especially regions susceptible to high-frequency interference. Such materials suppress resonance responses and deliver a more stable SE. Material choices should be aligned with the operating bands and anticipated resonance points to ensure balanced and stable shielding performance across the entire frequency range.

6.2.4. Multi-Polarization and Multi-Directional Electromagnetic Protection

Simulation results show that shielding effectiveness (SE) varies markedly with polarization, angle of incidence, and incident face. Since polarization and propagation angles are random in HIRF, optimizing for a single direction or polarization is insufficient; the enclosure must provide balanced, all-around protection.
  • Structural layout optimization: Re-arrange key apertures, seams, and interconnects to avoid strong coupling with any single polarization, thereby reducing polarization-sensitive local weak points.
  • Multi-angle robustness: Angle changes significantly affect mid-band SE. Oblique incidence reduces the E-field component parallel to slots and weakens coupling. Design for SE balance across multiple incidence angles, avoiding a design that performs well only at one angle but fails at others.
  • Aperture-face reinforcement: For faces dense with openings, adopt composite measures: increase effective thickness (waveguide-below-cutoff) by thickening/lengthening channels so the aperture remains below cutoff in the target band; add honeycomb waveguide windows, EMI gaskets, spring grounding contacts, and absorbing coatings; where appropriate, place absorbers inside the opening to limit leakage paths. Distribute apertures more uniformly so different faces have comparable SE, avoiding a “weakest-side” effect.

6.2.5. High-Frequency Shielding Optimization

Simulations indicate that shielding effectiveness (SE) generally declines in the 10–18 GHz band, where airborne equipment is prone to malfunction. In this regime, surface current crowding becomes pronounced and coupling paths are complex yet seams and small apertures remain the dominant leakage channels. Recommended measures are:
  • Material selection: Use composites with both high conductivity and high permeability, or apply ferromagnetic metals at critical locations, to jointly suppress high-frequency E/H-field coupling and reduce resonance sensitivity.
  • Introduce high-frequency notching structures: Deploy metal meshes or capacitive patch elements at the enclosure interior or apertures to realize frequency-selective attenuation (FSS) targeted at the high-frequency band.
  • Control effective seam length: At high frequencies even tiny seams can concentrate current and trigger strong leakage. Improve electrical continuity across seams, smooth aperture edges, and taper structural discontinuities to mitigate high-frequency coupling.
All proposed improvements were evaluated under DO-160G Class G field-strength conditions, showing predictable SE gains of 20–35 dB at resonance frequencies—exceeding the 10–15 dB typically achieved by conventional shielding reinforcement methods while maintaining comparable structural mass.

7. Conclusions

This work conducts a device-level study of the shielding effectiveness (SE) of an airborne GNSS receiver under HIRF, combining a geometry-faithful CST model with an anechoic-chamber campaign aligned with DO-160G (Section 20, Class G). Beyond parametric results, we propose an equation-based mechanism (cavity modes, aperture/slot coupling, waveguide-below-cutoff, thickness attenuation) with an effective-dimension correction, enabling single-point calibration: one measured/simulated resonance maps to geometry and predicts the remaining resonances with 0.5–1.4% error. Chamber evidence reproduces high-frequency failures and clarifies the C/N0↓ → DOP↑ → loss-of-lock chain, directly validating the SE-driven coupling mechanism. The main conclusions are:
  • Frequency selectivity of SE. In 3–10 GHz, SE is strongly affected by structural resonances and shows sharp fluctuations; above 10 GHz, overall shielding performance degrades and structural stability is reduced.
  • Apertures/seams as dominant coupling paths. SE is highly sensitive to aperture size/shape/distribution and seam continuity. Limiting aperture size, using circular/rounded edges, improving electrical continuity, and increasing effective thickness (e.g., honeycomb) strengthen below-cutoff attenuation and suppress leakage.
  • Predictive mechanism. With effective-dimension correction, single-point calibration enables rapid, formula-based prediction of other resonances (0.5–1.4%), supporting early-stage geometry optimization.
  • Experimental confirmation and failure mechanism. DO-160G–integrated chamber tests confirm simulation validity and coupling risk and reveal the GNSS failure mechanism via the dynamic C/N0–DOP linkage.
  • Mechanism-aligned optimization. Actionable rules—aperture control (size/shape/spacing; honeycomb where needed), geometric detuning with local absorbers, high-permeability inserts near resonances, and multi-polarization/multi-directional protection—yield predictable, verifiable, and quantifiable SE improvements.
In sum, the study forms a mechanism → criterion → design loop, achieving predictable, verifiable, and quantifiable SE gains, and provides directly applicable engineering guidance for equipment-level EMC design of airborne systems in HIRF environments.

Supplementary Materials

The following supporting information can be downloaded at: https://www.mdpi.com/article/10.3390/pr13123782/s1.

Author Contributions

Conceptualization, H.C. and X.L.; methodology, H.C.; software, H.C.; validation, H.C., C.Z. and J.W.; formal analysis, H.C.; investigation, C.Z., Y.T. and Y.S.; resources, Y.W.; data curation, H.C.; writing—original draft preparation, H.C.; writing—review and editing, X.L. and J.H.; visualization, X.L.; supervision, H.C.; project administration, X.L.; funding acquisition, X.L. All authors have read and agreed to the published version of the manuscript.

Funding

This research was funded by Multi-Objective Intelligent Optimization of Task Execution Strategies for UAV-Based Interference Source Detection (24CAFUC03021), Mechanism Analysis of Electromagnetic Interference Effects from High-Speed Rail Pantograph-Catenary Arcs on Navigation and Positioning Systems of Low-Altitude UAVs (25CAFUC04008), Construction of a University-Industry Collaborative Talent Training Base for Cultivating New-Type Aviation Talents with Civil Aviation Characteristics (MHJY2025009), Study on HIRF Coupling Effects on Airborne Equipment of eVTOL (GY2024-63E), The Innovation and Entrepreneurship Training Program for Students of Civil Aviation University of China (S202410624146), The Innovation and Entrepreneurship Training Program for Students of Civil Aviation University of China (S202410624141), Research on the Influence of High-Speed Railway Pantograph-Arc on the Flight Safety of eVTOL at Emerging Urban Integrated Transportation Hubs (F2024KF17D), Research on the impact of high speed rail bow network arcing on the flight safety of low altitude unmanned aerial vehicles (2025UASKLSP02).

Data Availability Statement

The original contributions presented in this study are included in the article/Supplementary Materials. Further inquiries can be directed to the corresponding authors.

Conflicts of Interest

The authors declare no conflicts of interest.

References

  1. Fang, J.; Zhang, Y.; Wu, Y. Ground multipath reflection interference mitigation methods in HIRF testing. Guid. Fuze J. 2015, 36, 54–59. [Google Scholar] [CrossRef]
  2. Jia, B.; Liu, D. Analysis of HIRF protection for aircraft. Aeronaut. Manuf. Technol. 2011, 2011, 86–89. [Google Scholar] [CrossRef]
  3. N8110.71; Guidance for the Certification of Aircraft Operating in High Intensity Radiated Field (HIRF). Federal Aviation Administration: Washington, DC, USA, 1998.
  4. 14 CFR 25.1317; High-Intensity Radiated Fields (HIRF) Protection. Federal Aviation Administration: Washington, DC, USA, 2007.
  5. AC 20-158B; The Certification of Aircraft Electrical and Electronic Systems for Operation in the High-intensity Radiated Fields (HIRF) Environment. Federal Aviation Administration: Washington, DC, USA, 2024.
  6. PS-ACE-23-10; HIRF/Lightning Test Levels and Compliance Methods for 14 CFR Part 23 Class I, II, and III Airplanes. Federal Aviation Administration: Washington, DC, USA, 2017.
  7. RTCA/DO-160G; Environmental Conditions and Test Procedures for Airborne Equipment. RTCA: Washington, DC, USA, 2010.
  8. AC-21-1317; Requirements for High-Intensity Radiated Fields (HIRF) Protection of Aircraft. Civil Aviation Administration of China: Beijing, China, 2006.
  9. CCAR-25-R4; Airworthiness Regulations for Transport Category Airplanes. Civil Aviation Administration of China: Beijing, China, 2011.
  10. AC-25-AA-2023-03; Type Certification of Transport Airplanes. Civil Aviation Administration of China: Beijing, China, 2023.
  11. Kong, S.; Huang, D.; Xiang, Y. Review of aircraft HIRF protection design and verification technologies. Electron. Prod. Reliab. Environ. Test. 2018, 36, 70–77. [Google Scholar] [CrossRef]
  12. Huang, S. Study on airworthiness compliance verification methods for HIRF protection of transport rotorcraft. China Equip. Eng. 2020, 2020, 143–145. [Google Scholar] [CrossRef]
  13. Ning, M.; Wang, L.; Chen, J. Risk analysis method of high-intensity radiated fields due to lightning on civil aircraft. Sci. Technol. Innov. Her. 2017, 2017, 12–13. [Google Scholar] [CrossRef]
  14. Liang, X.; Wang, L.; Xiong, W. Overview of test methods for HIRF in civil aircraft. In Proceedings of the 5th International Forum on Civil Aircraft Avionics Systems, Shanghai, China, 19–21 April 2016; pp. 431–435. [Google Scholar]
  15. Zhang, G. Research on HIRF airworthiness verification methods for civil aircraft. Sci. Tech Vis. 2016, 2016, 97–98. [Google Scholar] [CrossRef]
  16. Hu, P. Application of low-level coupling techniques in aircraft-level tests. J. Microw. 2010, 26, 58–61. [Google Scholar] [CrossRef]
  17. Schroder, A.; Rasek, G.A.; Bruns, H.D.; Řezníček, Z.; Kučera, J.; Loos, S.E. Analysis of high-intensity radiated field into aircraft using the method of moments. IEEE Trans. Electromagn. Compat. 2014, 56, 113–122. [Google Scholar] [CrossRef] [Scilit]
  18. Wang, F. Study on Antenna Coupling Characteristics of UAV System under Strong Electromagnetic Pulse. Master’s Thesis, Xidian University, Xi’an, China, 2023. [Google Scholar] [CrossRef]
  19. Han, Z.; Ma, Z.; Shi, C.; Cheng, Z. Shielding performance of airborne electronic equipment under HIRF conditions. Electron. Opt. Control 2022, 29, 106–111. [Google Scholar] [CrossRef]
  20. Hu, J.; Zhu, H.; Liu, Y.; Si, X. Simulation study on shielding effectiveness of aircraft fuselage based on HIRF. J. Hefei Univ. Technol. Nat. Sci. 2021, 44, 322–326, 369. [Google Scholar] [CrossRef]
  21. Li, H. Study on Radiation Emission and Immunity Testing of UAVs. Master’s Thesis, Heilongjiang University, Harbin, China, 2017. [Google Scholar]
  22. Yuan, H.; Duan, Z.; Qiu, S.; Wang, J. Sensitivity study of airborne radios under HIRF in electromagnetic reverberation chamber. Aviat. Eng. Prog. 2020, 11, 859–865+906. [Google Scholar] [CrossRef]
  23. Chen, J.; Jia, R.; Tang, B.; Shi, H. Investigation of radar electromagnetic irradiation effects under reverberation chamber conditions. J. Microw. 2014, 30, 55–58+79. [Google Scholar] [CrossRef]
  24. Lemaire, D.; Garrido, F. A unified approach for lightning and low-frequency HIRF transfer functions measurements on A380. In Proceedings of the IEEE EMC Europe 2009 Workshop, Athens, Greece, 11–12 June 2009; pp. 1–4. [Google Scholar]
  25. Li, K. Research on Field Uniformity Method in Reverberation Chamber Test of Electromagnetic Environment. Master’s Thesis, Zhejiang University, Hangzhou, China, 2021. [Google Scholar] [CrossRef]
  26. Liu, Y. Research on Low-Level Swept-Frequency Test Method for Aircraft HIRF. Master’s Thesis, Civil Aviation University of China, Tianjin, China, 2020. [Google Scholar] [CrossRef]
  27. Wang, Y.H.; Gong, H.L.; Hu, Y.M.; Sun, B.; Si, X. Research on low-level swept current test method for high-intensity radiated field. J. Microw. 2023, 39, 95–99. [Google Scholar] [CrossRef]
  28. Ganguly, S.; Kanovsky, N.; Das, P.; Gedanken, A.; Margel, S. Photopolymerized thin coating of polypyrrole/graphene nanofiber/iron oxide onto nonpolar plastic for flexible electromagnetic radiation shielding, strain sensing, and non-contact heating applications. Adv. Mater. Interfaces 2021, 8, 2101255. [Google Scholar] [CrossRef] [Scilit]
  29. Alzahrani, F.M.A.; Basha, B.; Hammoud, A.; Tamam, N.; Alsufyani, S.J.; Kebaili, I.; Al-Buriahi, M.S. Gamma attenuation and nuclear shieling ability of TeO2/Bi2O3/WO3 glass system. Radiat. Phys. Chem. 2024, 223, 111985. [Google Scholar] [CrossRef] [Scilit]
  30. Yuan, H. Research on HIRF Testing Methods and Protection of Airborne Equipment. Ph.D. Thesis, Hefei University of Technology, Hefei, China, 2020. [Google Scholar] [CrossRef]
  31. Wang, C. Electromagnetic Interference and Airworthiness of EWIS Wiring on Aircraft. Master’s Thesis, Civil Aviation University of China, Tianjin, China, 2012. [Google Scholar]
  32. Dassault Systèmes. CST Studio Suite. Available online: https://www.3ds.com/products-services/simulia/products/cst-studio-suite/ (accessed on 18 August 2025).
  33. Budnarowska, M.; Mizeraczyk, J. Determination of shielding effectiveness of a subnanosecond high-power EM interference by an enclosure with aperture using time domain approach. Energies 2023, 16, 1931. [Google Scholar] [CrossRef] [Scilit]
  34. RTCA, Inc. DO-229D—Minimum Operational Performance Standards for Global Positioning System/Wide Area Augmentation System Airborne Equipment; RTCA, Inc.: Washington, DC, USA, 2006. [Google Scholar]
  35. Keller, R.B. Shielding. In Design for Electromagnetic Compatibility—In a Nutshell; Springer: Cham, Switzerland, 2023. [Google Scholar] [CrossRef] [Scilit]
Figure 1. Schematic Diagram of HIRF Interference Mechanism.
Processes 13 03782 g001
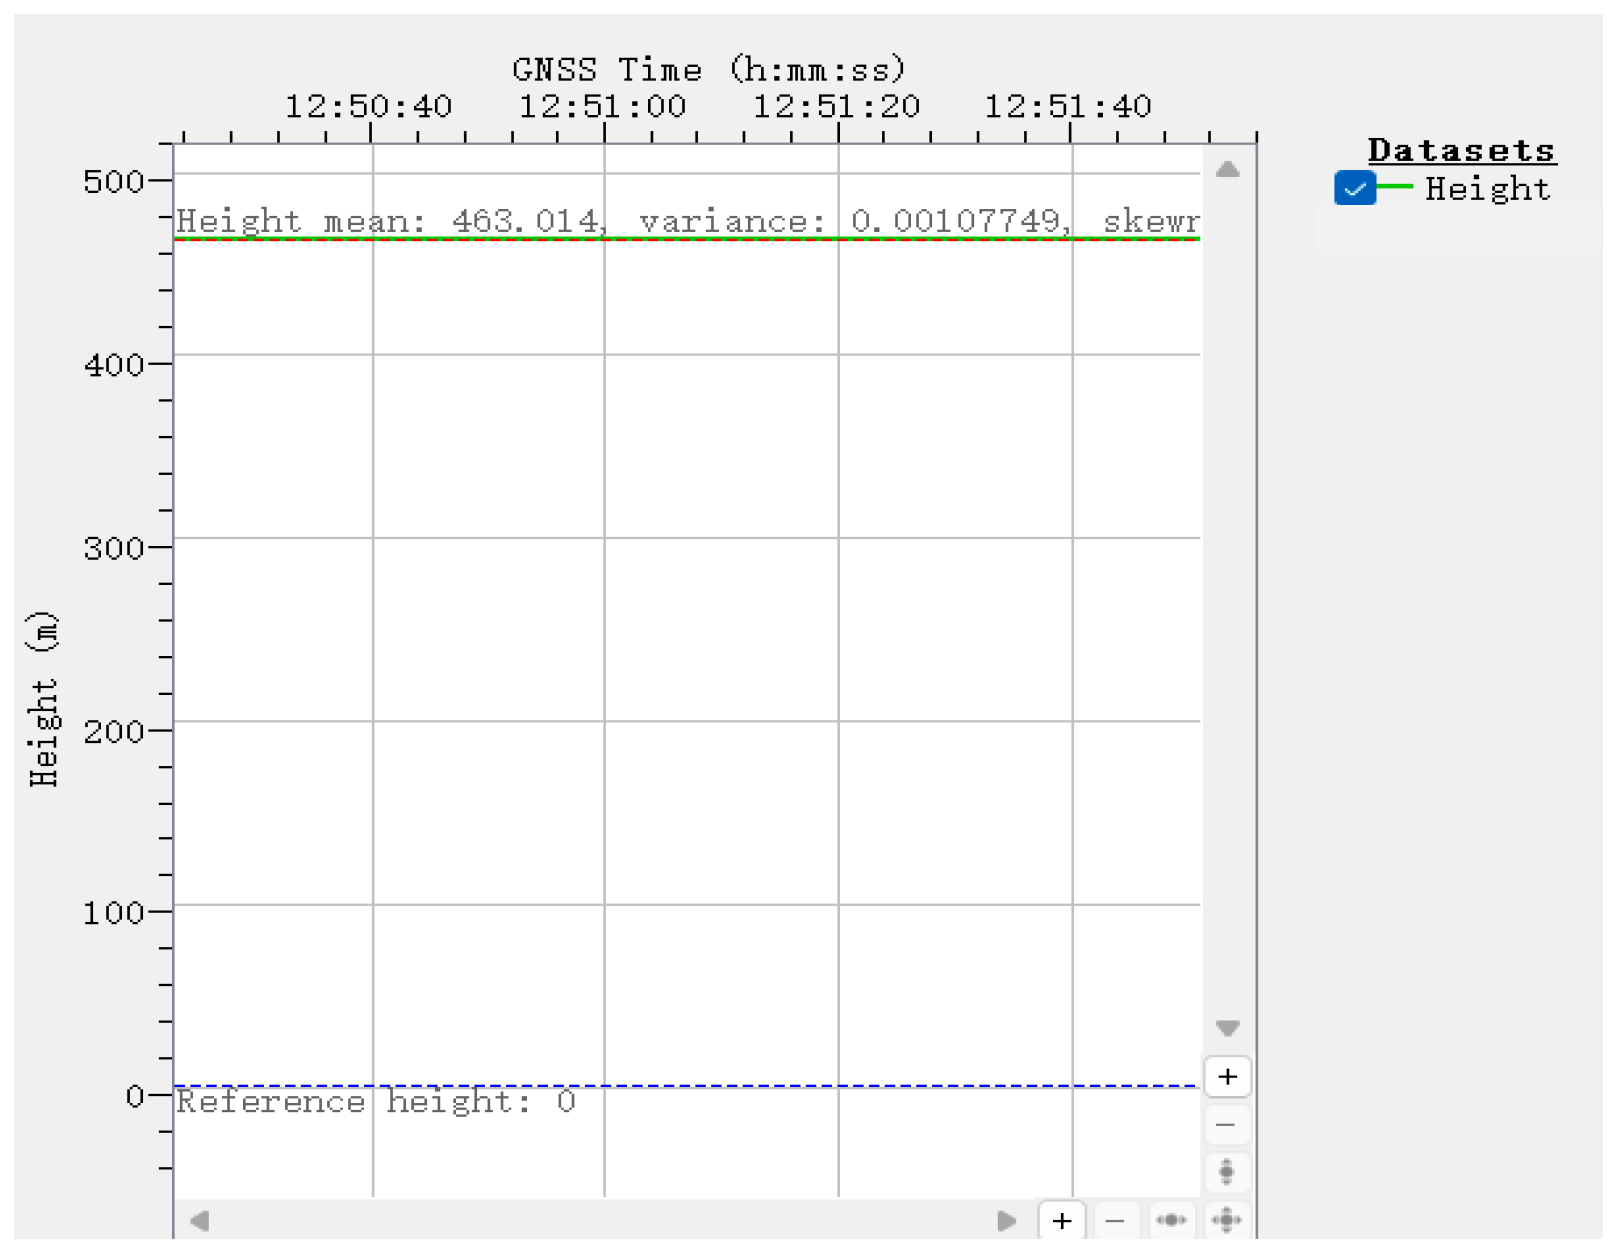
Figure 2. Real GNSS Receiver. (a) Surface A view; (b) Surface B view (c) Surface C view.
Processes 13 03782 g002
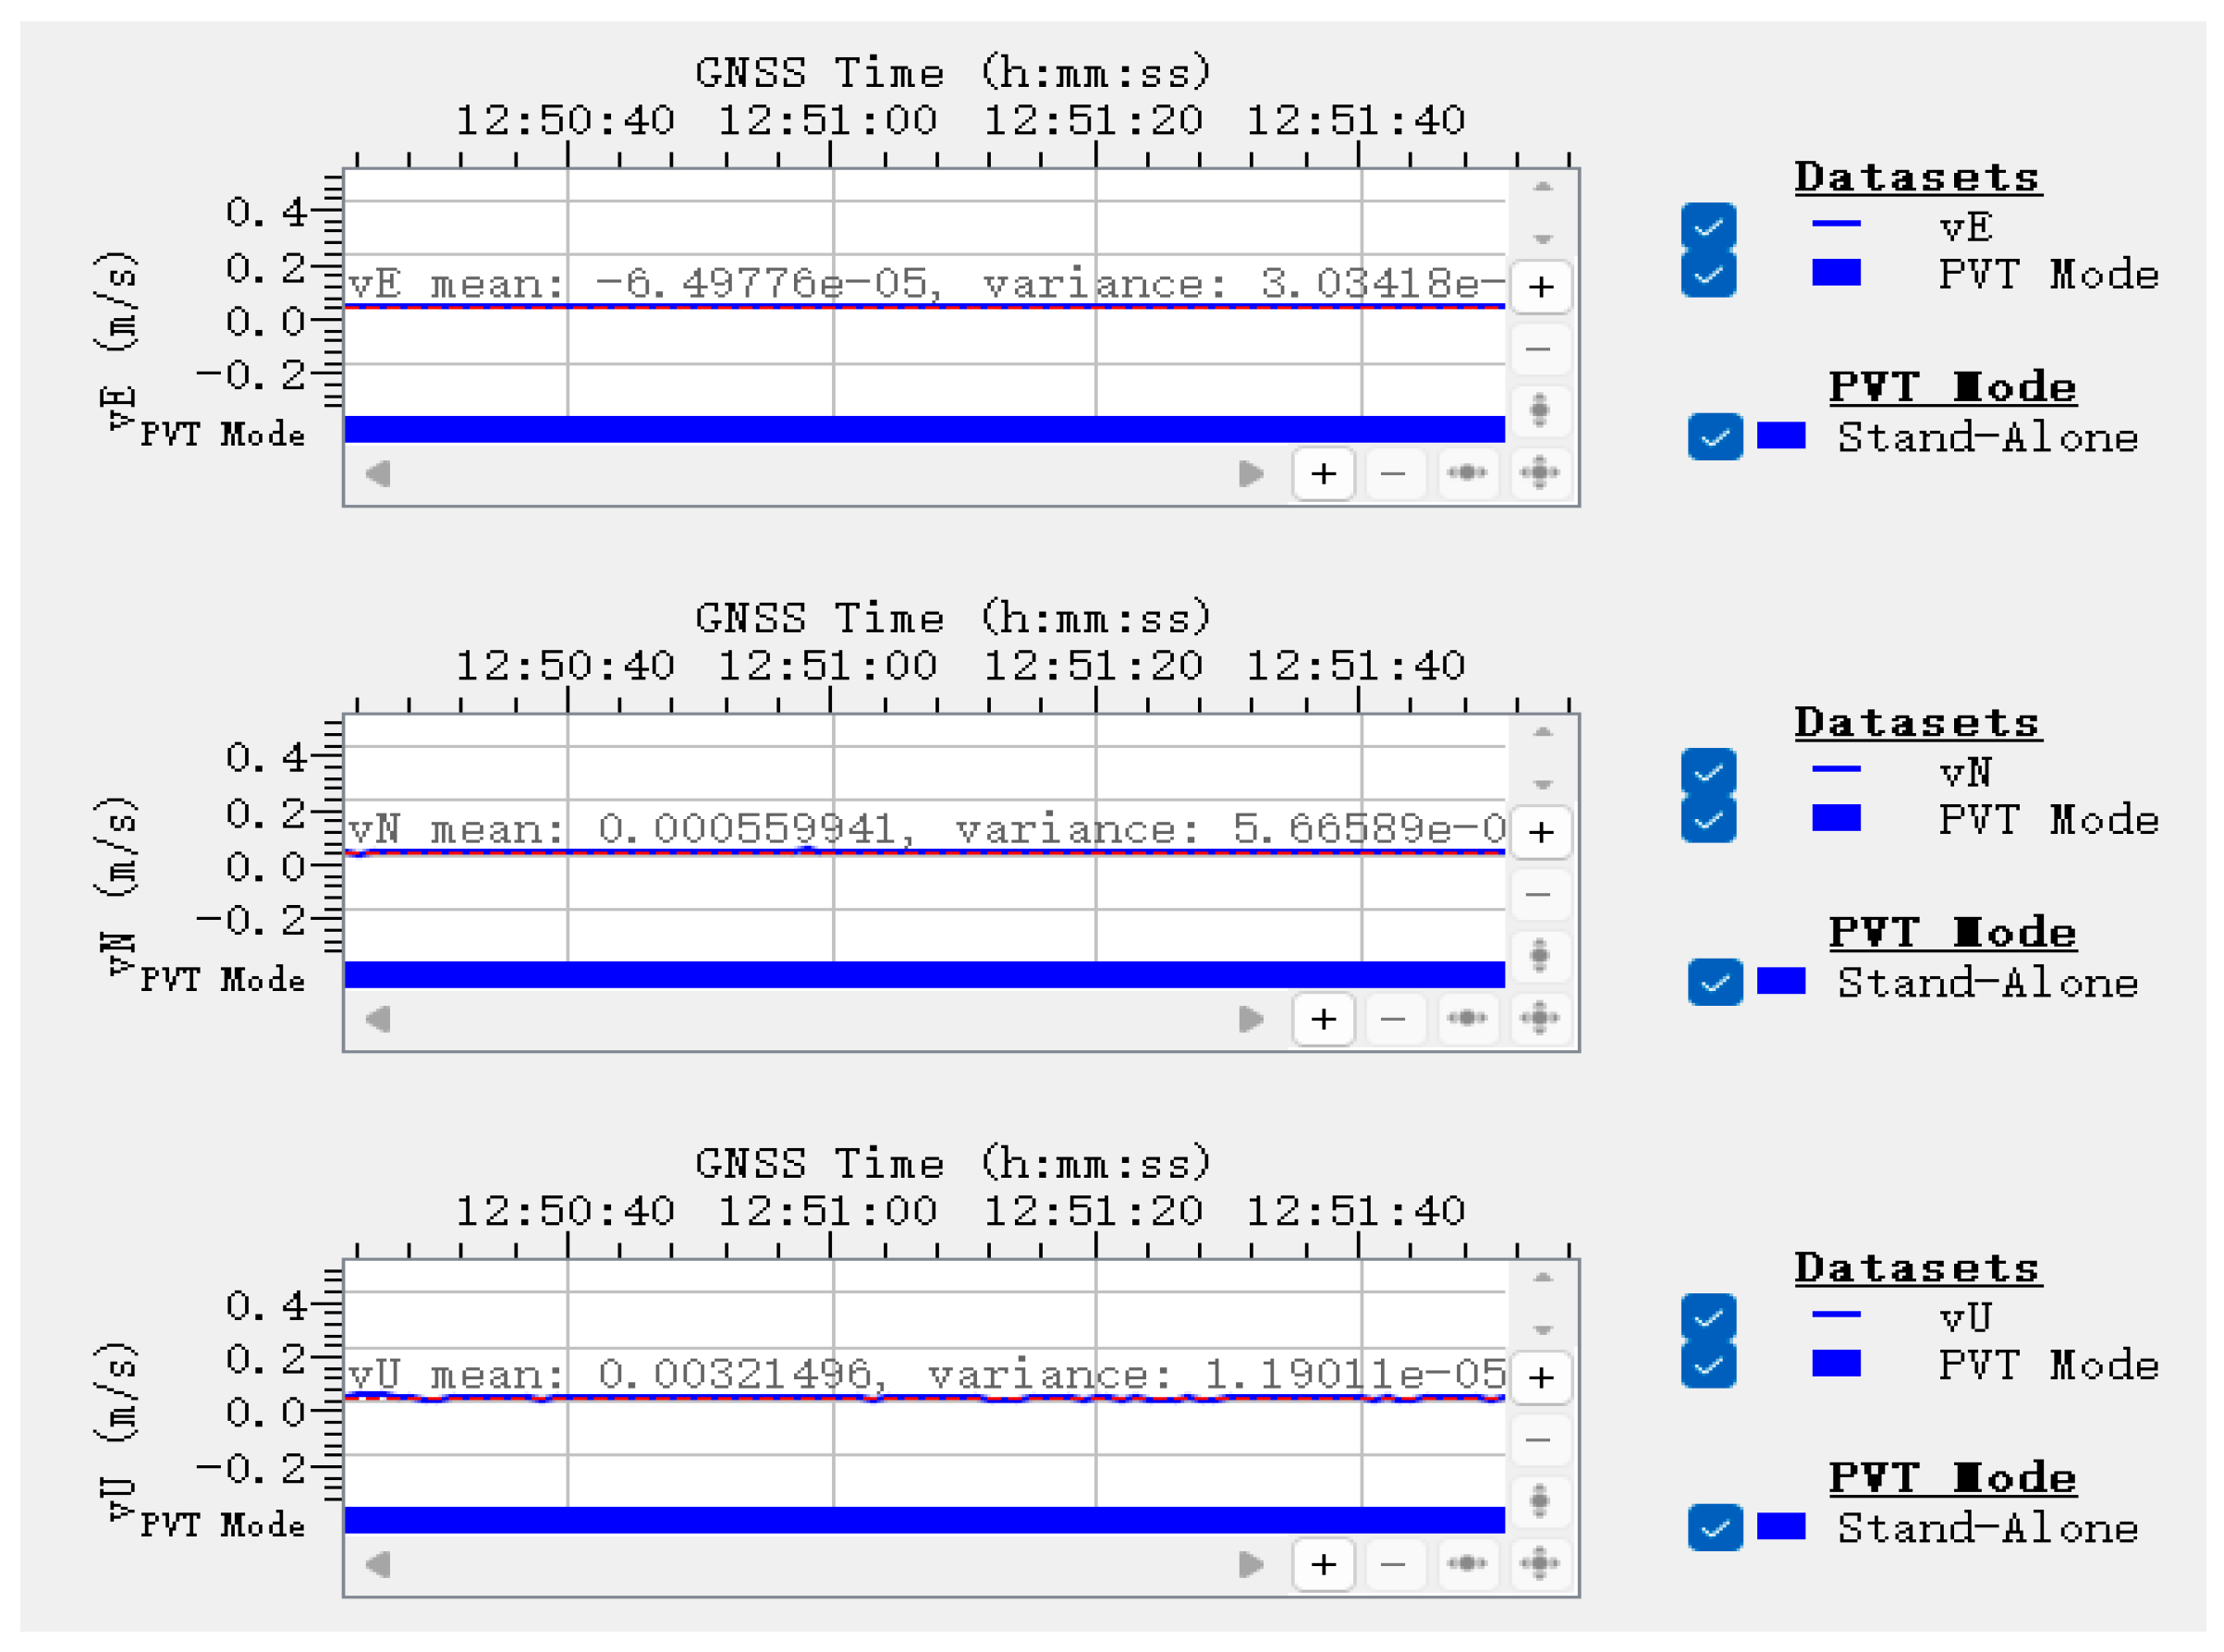
Figure 3. Simulated Model in CST. (a) Overall 3D structure with dimensions; (b) Detailed panel dimensions and connector cutouts.
Processes 13 03782 g003
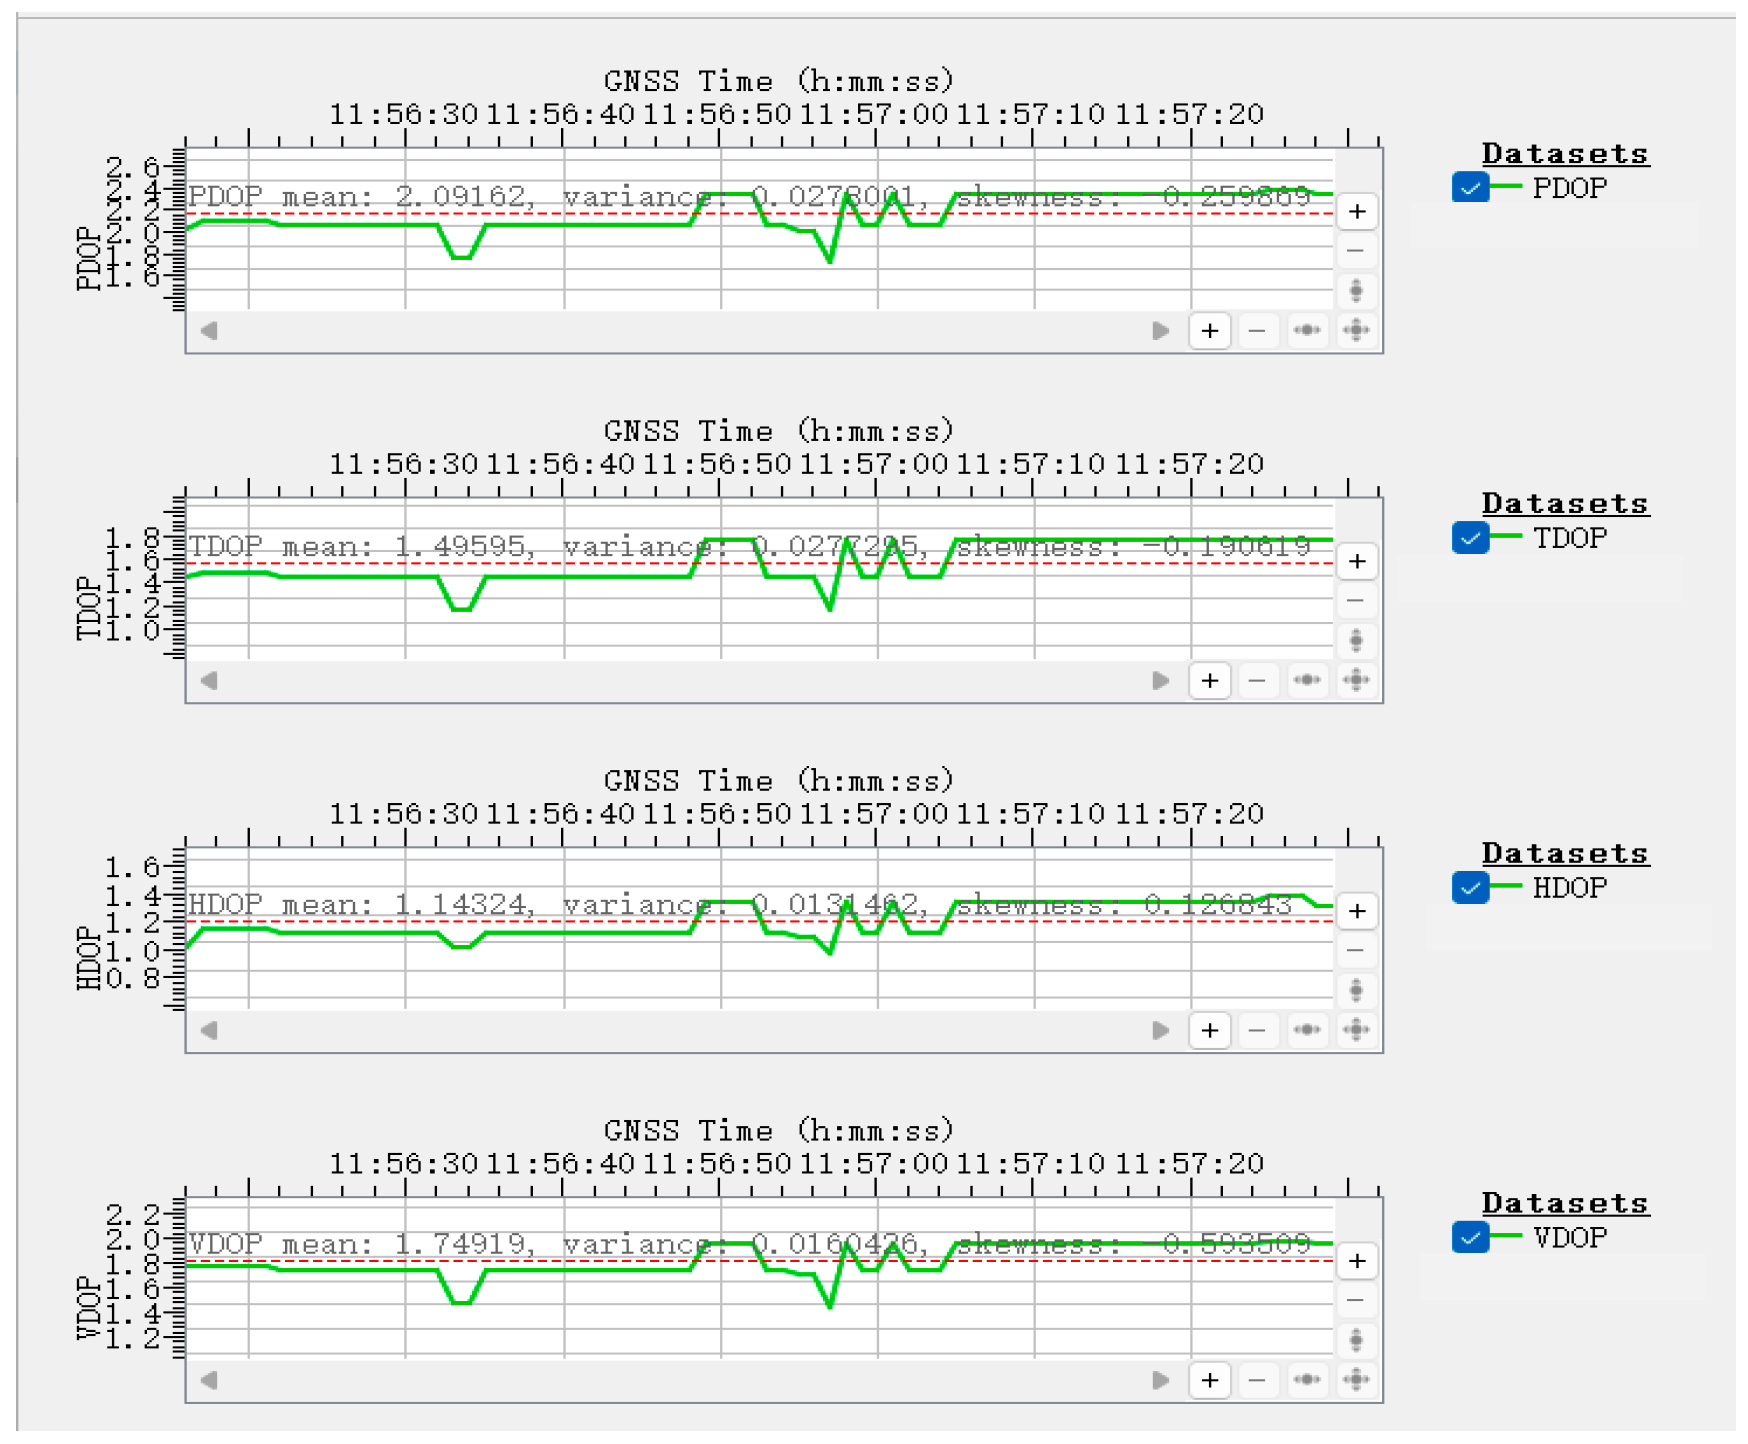
Figure 4. Illustration of Plane Wave Excitation. (a) Position diagram; (b) Waveform plot.
Processes 13 03782 g004
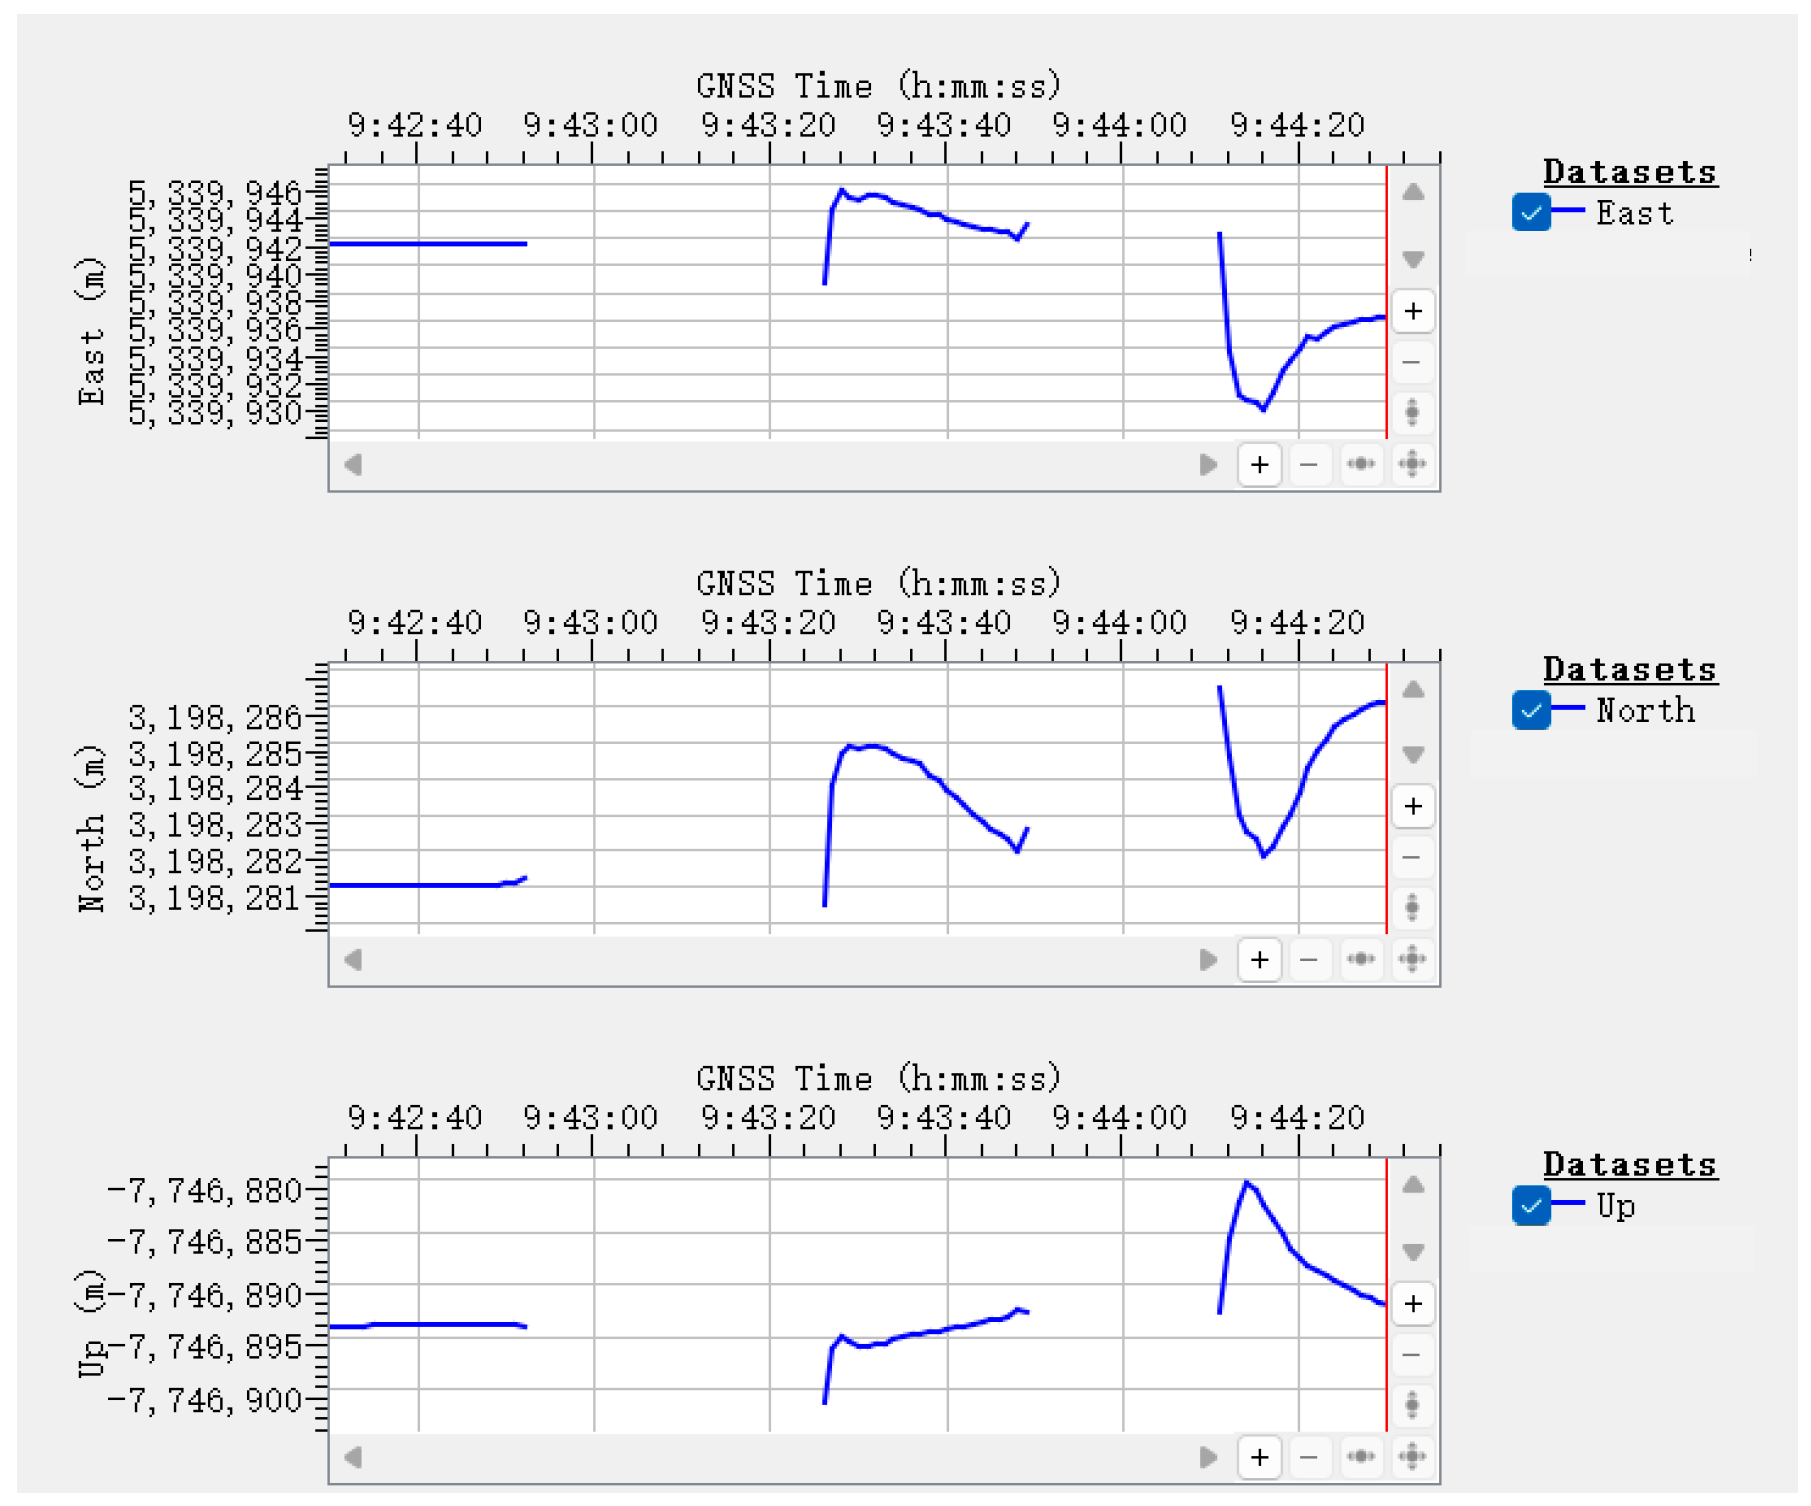
Figure 5. Illustration of Probe Position.
Processes 13 03782 g005
Figure 6. Simulation results at different probe positions (full frequency range).
Processes 13 03782 g006
Figure 7. Simulation results at different probe positions (low-frequency range).
Processes 13 03782 g007
Figure 8. Simulation results at different probe positions (high-frequency range).
Processes 13 03782 g008
Figure 9. Surface current distribution at different frequencies: (a) 400 MHz; (b) 2000 MHz; (c) 5000 MHz; (d) 10,000 MHz; (e) 13,000 MHz; (f) 18,000 MHz.
Processes 13 03782 g009
Figure 10. Simulation results under different polarization modes.
Processes 13 03782 g010
Figure 11. Illustration of different incidence angles: (a) 0°; (b) 30°; (c) 45°; (d) 60°.
Processes 13 03782 g011
Figure 12. Simulation results for different incidence angles (full frequency range).
Processes 13 03782 g012
Figure 13. Simulation results for different incidence angles (low-frequency range).
Processes 13 03782 g013
Figure 14. Simulation results for different incidence angles (high-frequency range).
Processes 13 03782 g014
Figure 15. Illustration of different incident surfaces: (a) Surface A; (b) Surface B; (c) Surface C; (d) Surface D.
Processes 13 03782 g015
Figure 16. Simulation results for different incident surfaces (full-frequency range).
Processes 13 03782 g016
Figure 17. Simulation results for different incident surfaces (low-frequency range).
Processes 13 03782 g017
Figure 18. Simulation results for different incident surfaces (high-frequency range).
Processes 13 03782 g018
Figure 19. Field-mapping results at 3.6 GHz under horizontally polarized excitation.
Processes 13 03782 g019
Figure 20. Simulation results of different materials (full frequency range).
Processes 13 03782 g020
Figure 21. Simulation results of different materials (low-frequency range).
Processes 13 03782 g021
Figure 22. Simulation results of different materials (high-frequency range).
Processes 13 03782 g022
Figure 23. Illustration of different aperture shapes: (a) Circular opening; (b) Rectangular opening.
Processes 13 03782 g023
Figure 24. Simulation results for different aperture shapes.
Processes 13 03782 g024
Figure 25. Illustration of different aperture sizes: (a) Rectangular opening, side length = 2 mm; (b) Rectangular opening, side length = 4.43 mm; (c) Rectangular opening, side length = 6 mm.
Processes 13 03782 g025
Figure 26. Simulation results for different aperture sizes.
Processes 13 03782 g026
Figure 27. Illustration of different aperture quantity configurations: (a) One rectangular aperture with side length = 6 mm; (b) Four rectangular apertures with side length = 3 mm each.
Processes 13 03782 g027
Figure 28. Simulation results for different aperture quantities.
Processes 13 03782 g028
Figure 29. Illustration of different aperture spacing: (a) Closely spaced apertures; (b) Widely spaced apertures.
Processes 13 03782 g029
Figure 30. Simulation results for different aperture spacing.
Processes 13 03782 g030
Figure 31. Test environment for radiated immunity in the anechoic chamber.
Processes 13 03782 g031
Figure 32. Antenna illumination setup.
Processes 13 03782 g032
Figure 33. Camera monitoring interface.
Processes 13 03782 g033
Figure 34. ENU position monitoring under normal conditions.
Processes 13 03782 g034
Figure 35. Ellipsoidal height under normal conditions.
Processes 13 03782 g035
Figure 36. Velocity monitoring under normal conditions.
Processes 13 03782 g036
Figure 37. DOP monitoring under normal conditions.
Processes 13 03782 g037
Figure 38. Relative coordinate monitoring interface at 13.183 GHz (horizontal polarization).
Processes 13 03782 g038
Figure 39. Relative coordinate monitoring interface at 14.125 GHz (vertical polarization).
Processes 13 03782 g039
Figure 40. C/N0 monitoring, 4–6 GHz (horizontal polarization).
Processes 13 03782 g040
Figure 41. DOP monitoring, 4–6 GHz (horizontal polarization).
Processes 13 03782 g041
Figure 42. C/N0 monitoring, 13.183 GHz (horizontal polarization).
Processes 13 03782 g042
Figure 43. DOP monitoring, 13.183 GHz (horizontal polarization).
Processes 13 03782 g043
Figure 44. Shielding effectiveness vs. frequency for an enclosure with a single 6 mm rectangular aperture.
Processes 13 03782 g044
Table 1. Electromagnetic properties of different materials.
Material ε r μ r σ (s/m)
Perfect Electric Conductor (PEC)11
Iron150001 × 106
Aluminum113.5 × 107
Copper115.8 × 107
Carbon Fiber311 × 104
Stainless Steel16001 × 106
Table 2. Selected radiated susceptibility test levels and classes.
EnvironmentClass B (V/m)Class D (V/m)Class F (V/m)Class G (V/m)
Frequency (GHz)SW/CWPMSW/CWPMSW/CWPMSW/CWPM
0.1–0.220 25 50 100
0.2–0.420 25 50 100
0.4–0.720150201752535050700
0.7–1201502517550350100700
1–2252505050010010002002000
2–4253755075010015002003000
4–6253755075010015002003000
6–825150502501005002001000
8–12383757575015015003003000
12–18252505050010010002002000
Note: SW = square wave; CW = continuous wave; PM = pulse modulation.
Table 3. Radiated susceptibility—Class G test field strengths.
Test Frequency Range (GHz)CW Field Strength (V/m)
0.1–0.2100
0.2–0.4100
0.4–0.750
0.7–1100
1–2200
2–4200
4–6200
6–8200
8–12300
12–18200
Table 4. GNSS receiver failure types.
No.Failure Type
1Power-off or restart
2Signal loss
3Severe accuracy degradation (DOP > 20)
Table 5. Recorded failure frequencies and types.
Failure Frequency (GHz)Failure Type
13.183 (Horizontal)Signal loss
13.490 (Vertical)Signal loss
14.125 (Vertical)Signal loss
14.791 (Horizontal)Signal loss
Table 6. Resonance Frequency Calibration and Validation (Single 6 mm Aperture, Horizontal Polarization).
ModePredicted (GHz)Measured (GHz)Rel.Error
f 101 (calib.)3.65953.65950
f 103 8.1838.14050.52%
f 011 11.04710.901.35%
f 013 13.25113.101.16%
f 014 14.91615.000.56%
Table 7. Primary optimization approaches.
Mitigation TechniqueTarget Frequency RangePrimary Objective
Modify enclosure proportionsMid-frequency (3–10 GHz)Avoid structural resonance
Apply absorbing materialsMid/high frequencyAttenuate resonant coupling energy
Electrical continuity treatmentFull frequency rangeBlock current paths at discontinuities
Disclaimer/Publisher’s Note: The statements, opinions and data contained in all publications are solely those of the individual author(s) and contributor(s) and not of MDPI and/or the editor(s). MDPI and/or the editor(s) disclaim responsibility for any injury to people or property resulting from any ideas, methods, instructions or products referred to in the content.