Article

Investigation of Microscopic Oil Flow Characteristics During Fracturing Fluid Invasion and Flowback in Shale Oil Reservoirs

1
Exploration and Development Research Institute, Changqing Oilfield Company, PetroChina, Xi’an 710018, China
2
Petroleum Engineering College, China University of Petroleum-Beijing, Beijing 102249, China
3
Baikouquan Oil Production Plant, Xinjiang Oilfield Company, PetroChina, Karamay 834000, China
*
Author to whom correspondence should be addressed.
Processes 2025, 13(12), 3780; https://doi.org/10.3390/pr13123780 (registering DOI)
Submission received: 30 October 2025 / Revised: 20 November 2025 / Accepted: 21 November 2025 / Published: 23 November 2025

Abstract

After hydraulic fracturing of C shale formation, it is difficult to get stable production, and the flowback efficiency of fracturing fluid is low. In order to reveal the law of fracturing fluid invasion and flowback behavior and to investigate the microscopic characteristics of its effect in improving the oil recovery factor, the experiments were innovatively carried out by using online Nuclear Magnetic Resonance (NMR) technology combined with huff-n-puff experiments using formulated fracturing fluid on two shale rocks, with the core inlet end representing the fractured surface in the reservoir. The dominant pores, Minimum Pore-Producing Radius (MPPR), and invasion depth for upper sweet-spot core (with smaller K and Φ) and lower sweet-spot core (with larger K and Φ) during fracturing fluid invasion and flowback were compared. The results show that small pores in upper sweet-spot core are the dominant pores, while mesopores are dominant in the lower sweet-spot core. The MPPR is 0.0087 μm and 0.024 μm, respectively, for the upper and lower sweet spot. As invasion pressure difference increases from 10 MPa to 20 MPa, the invasion depth of fracturing fluid into the upper sweet-spot core increases from 0.15 cm to 0.29 cm, and for the lower sweet-spot core it increases from 0.23 cm to 0.36 cm, about 1.2 times that of the upper core. Based on the similarity criterion, the formula for calculating on-site effective invasion depth of fracturing fluid Lf is derived, and it is approximately 0.46 m and 0.70 m in the upper and lower sweet spot after a 30-day well soaking. Based on experiments, the flowback efficiency of fracturing fluid is obtained, which is 23.6% in the upper sweet spot and 17.66% in the lower sweet spot. Imbibition tests were also performed for two shale core samples, and it is found that the imbibition recovery degree of the upper sweet-spot core is higher than that of the lower sweet-spot core. Dimensionless time calculated by using Ma’s model yields good fitting results for imbibition, and the soaking time is upscaled to reservoir conditions. The research results provide important reference for hydraulic fracturing practice and thus to improve the oil recovery factor in shale oil reservoirs.

1. Introduction

China possesses abundant terrestrial shale oil resources, with significant breakthroughs achieved in exploration and development. C shale reservoirs feature substantial interlayer lithological variations. After large-scale hydraulic fracturing operations, substantial volumes of fracturing fluid remain trapped within the reservoir, resulting in poor productivity during the flowback stage. Domestic and international experts have conducted research on factors affecting shale oil recovery, the microscopic mechanisms of fracturing fluid retention, and the interaction between fracturing fluids and shale reservoirs. The substantial fracturing fluid retention and the low recovery factor can be explained by the increased specific surface area through natural fractures post-fracturing, trapping fluids within fractures [1,2,3,4,5,6,7], strong heterogeneity, and poor throat connectivity in shale reservoirs [8,9]. The development of micropores and nanopores, coupled with increased fractures post-fracturing, amplifies capillary effects and enhances the imbibition effect during well soaking [10,11,12]. Under the combined effects of salt dissolution, hydration, and mineral corrosion, the number of mesopores, macropores, and microfractures increases. This leads to more serious field proppant breakage rates and rock embedding, reducing flow capacity and causing fracturing fluid to be trapped within the reservoir [13,14].
Fracturing fluids primarily reside within the fracture network and may imbibe oil from the matrix to enhance residual oil recovery. It is necessary to further clarify the microscopic oil mobilization characteristics by fracturing fluids. However, experimental studies on fracturing fluid invasion and flowback at the core scale are limited. This paper integrates core-flooding experiments, imbibition experiments, and online NMR technology to physically simulate fracturing fluid invasion and flowback at fracture surfaces in shale oil reservoirs. Using cores obtained from C reservoirs, the invasion depth, oil recovery factor at different ranges of pore size, and Minimum Pore-Producing Radius (MPPR) are quantitively determined. These findings hold significant implications for guiding shale oil reservoir development.

2. Experimental Equipment and Methods

2.1. Experimental Materials and Equipment

Experimental cores: Natural cores were selected from the upper and lower sweet spots of the C reservoir, respectively. The parameters of the cores are shown in Table 1.
Oil: The simulated oil was prepared using field crude oil and kerosene, with a density of 0.831 g·cm−3 and a viscosity of 2.06 mPa·s.
Fracturing fluid: 0.1% (mass concentration) viscous slickwater, 0.3% anti-emulsifier, 0.2% anti-swelling agent, 0.02% gel breaker, 0.3% flowback aid, and mixed with D2O to get rid of hydrogen signal for NMR testing.
Experimental Equipment: MesoMR23-060H-I Nuclear Magnetic Resonance Imaging Analyzer (Suzhou Niumag Analytical Instrument Co., Ltd., Suzhou, China).

2.2. Experimental Procedure

2.2.1. Fracturing Fluid Invasion and Flowback

The experimental flowchart is shown in Figure 1. We set the measurement parameters for the NMR T2 spectrum with a repetition sampling interval time as TW = 3000 ms, number of echoes as NECH = 10,000, echo time as TE = 0.1 ms, and number of scan repetitions as NS = 16.
The experimental procedure consists of the following steps:
Cleaning and drying the cores. The thermotank is set to 50 °C;
Placing the core sample into the core holder, vacuuming it for 48 h, and then saturating oil into the core;
Closing the backpressure valve and continuing to inject oil until the pressure reaches 10 MPa and letting it stabilize. Taking NMR T2 spectrum and images;
Invasion: injecting fracturing fluid at 30 MPa and recording T2 spectrum when the pressure reaches 20 MPa and 30 MPa, respectively. Then the injection is stopped and the soaking is maintained for 5 h. The pressure difference of 10 MPa and 20 MPa is selected because it is reported that the pressure difference across the fracture face is reported to be 10~20 MPa;
Flowback: recording T2 spectrum when the production pressure drops to 20 MPa and 10 MPa, respectively.

2.2.2. Imbibition Test of Fracturing Fluid

The experimental procedure is as follows:
Cleaning and drying the cores;
Vacuuming the core for 48 h and then saturating it with oil up to 25 MPa;
Weighing the core and taking the T2 spectrum;
Putting the core into a container at 80 °C and 10 MPa;
At different time intervals, depressurizing the system, taking the core out, weighing it, and taking the T2 spectrum.

3. Experimental Results

3.1. Oil Flow Characteristics During Fracturing Fluid Invasion and Flowback

The NMR device records the magnitude of hydrogen signals to reflect fluid distribution within porous media. The size of rock pores correlates with relaxation time; longer transverse relaxation times indicate larger pore radius. Higher hydrogen signal amplitude corresponds to higher oil content in pores. Therefore, pore radii can be converted from the T2 relaxation times by the following formula, which enables the quantification of oil content in different pore sizes.
T 2 = 1 ρ 2 F S r
r = C × T 2
where T2 is the relaxation time, ms; r is the pore radius, µm; Fs is the shape factor; and ρ2 is the relaxation rate. Typically, when the pore shape is cylindrical, Fs = 2 and ρ2 is taken as 10 µm/s, yielding a conversion coefficient of C = 0.02.

3.1.1. Study on Invasion and Flowback of Fracturing Fluids in Upper Sweet-Spot Core

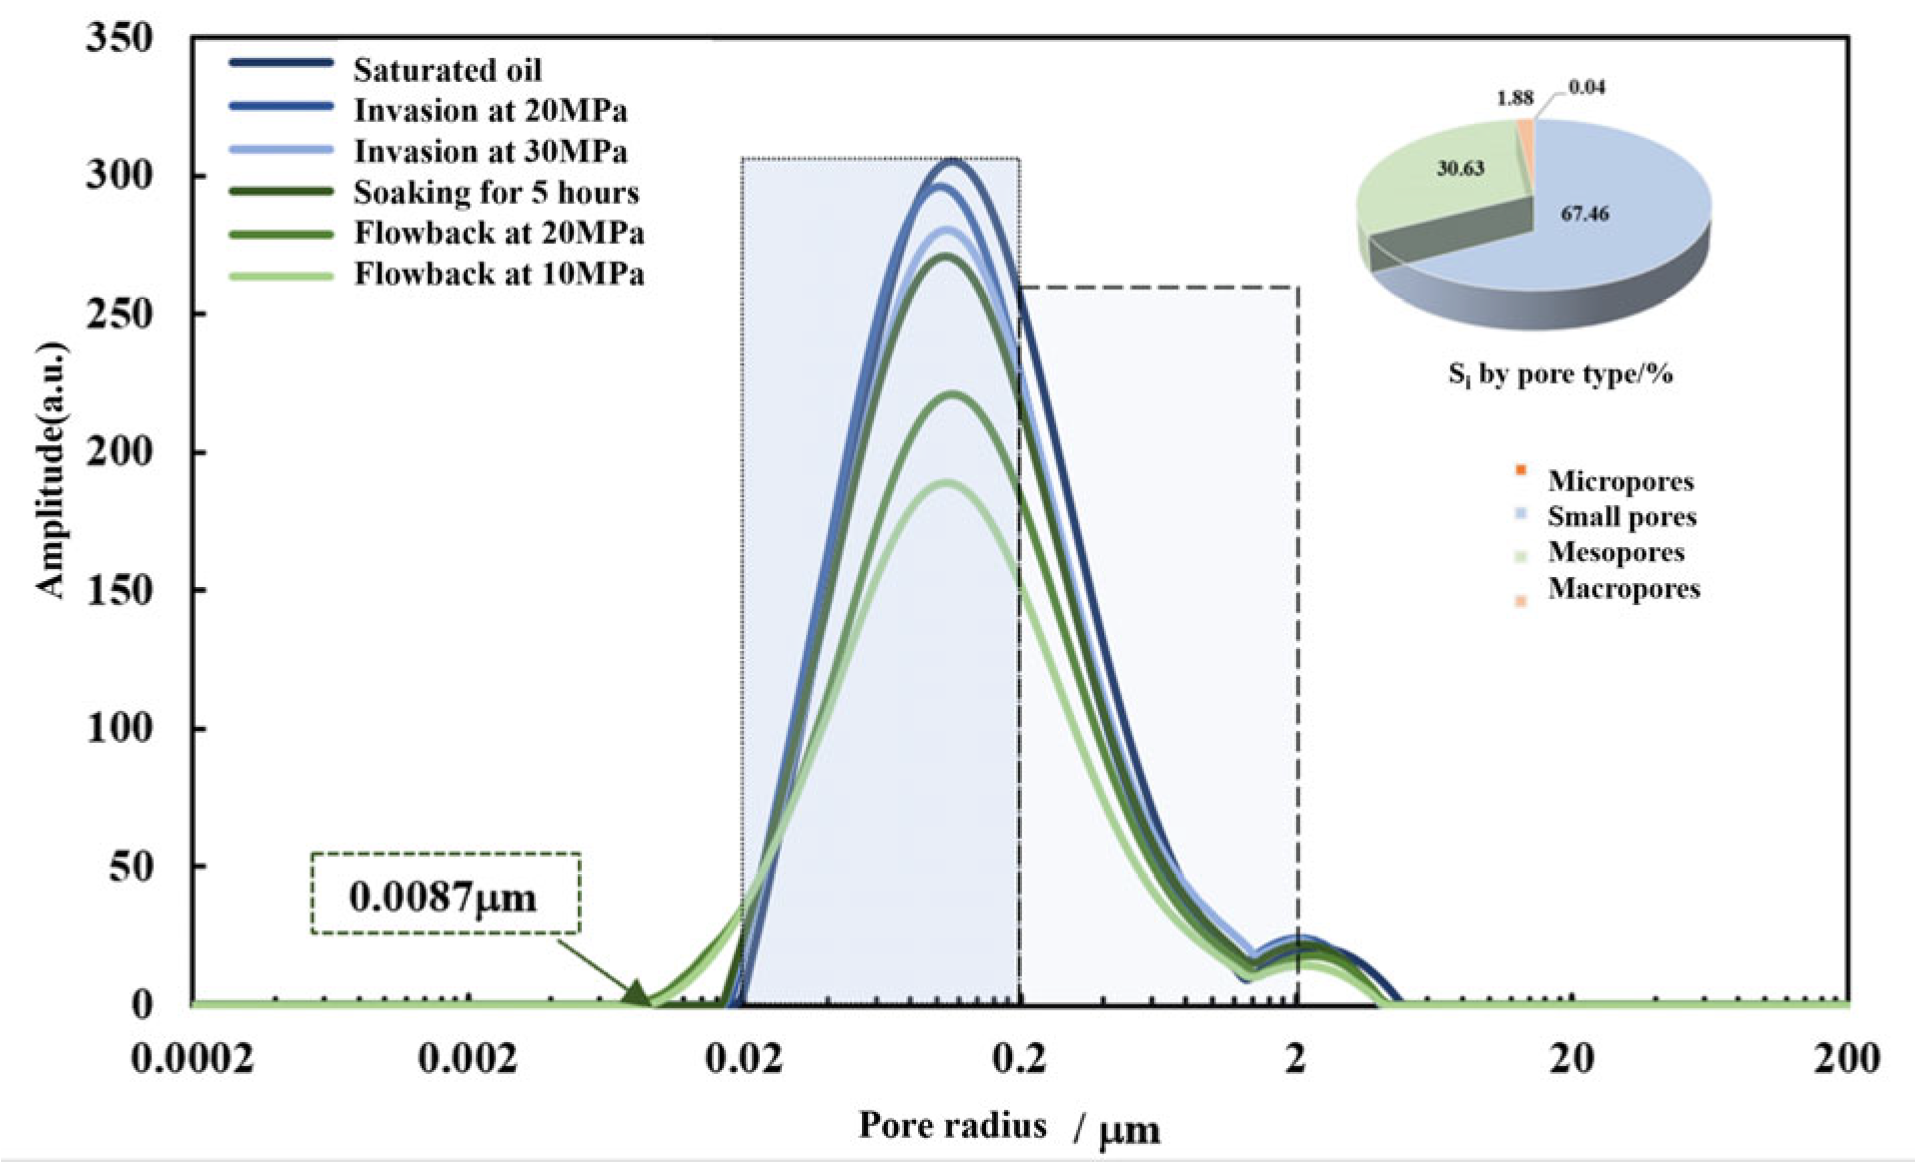
NMR T2 spectrum of fracturing fluid invasion and flow in the upper sweet-spot core 1# under 20 MPa pressure differential is shown in Figure 2. The pores ranging from 0 to 0.02 µm are classified as micropores, 0.02–0.2 µm as small pores, 0.2–2 µm as mesopores, and 2–200 µm as macropores.
The NMR T2 spectrum exhibits a single peak showing relatively concentrated pore sizes within the porous medium. The small pores in the upper sweet-spot core are the dominant pores, accounting for 67.46% of oil content, followed by mesopores (30.63%). With a backpressure of 10 MPa and while the injection pressure increased from 20 MPa to 30 MPa (i.e., the pressure differential increased from 10 MPa to 20 MPa), the signal amplitude decreased significantly, shifting the curve to the left. During well soaking, crude oil redistributed within the pores. At the fracturing fluid flowback stage, oil content in small pores decreased substantially at bottom-hole flow pressure of 20 MPa and 10 MPa, respectively. The Minimum Pore-Producing Radius (MPPR) in the upper sweet spot is 0.0087 µm.
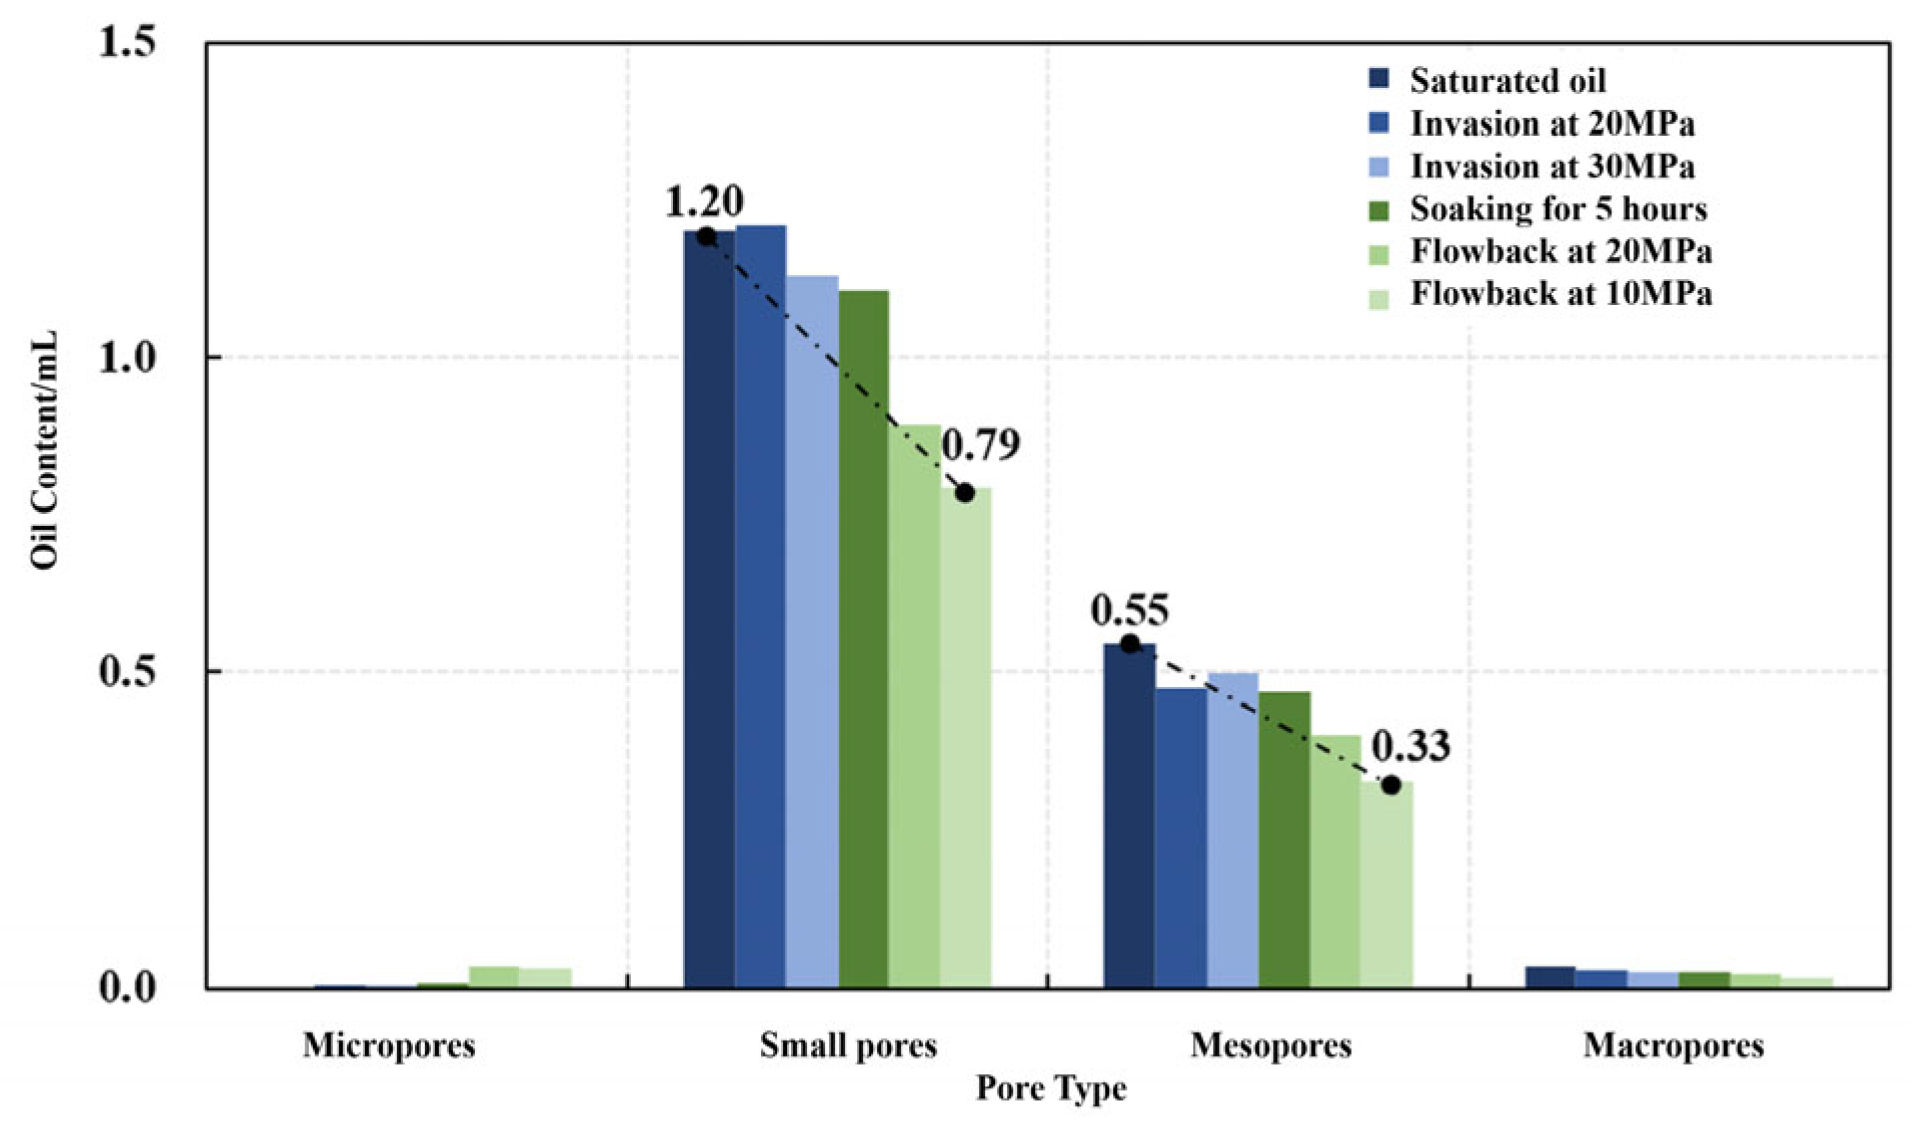
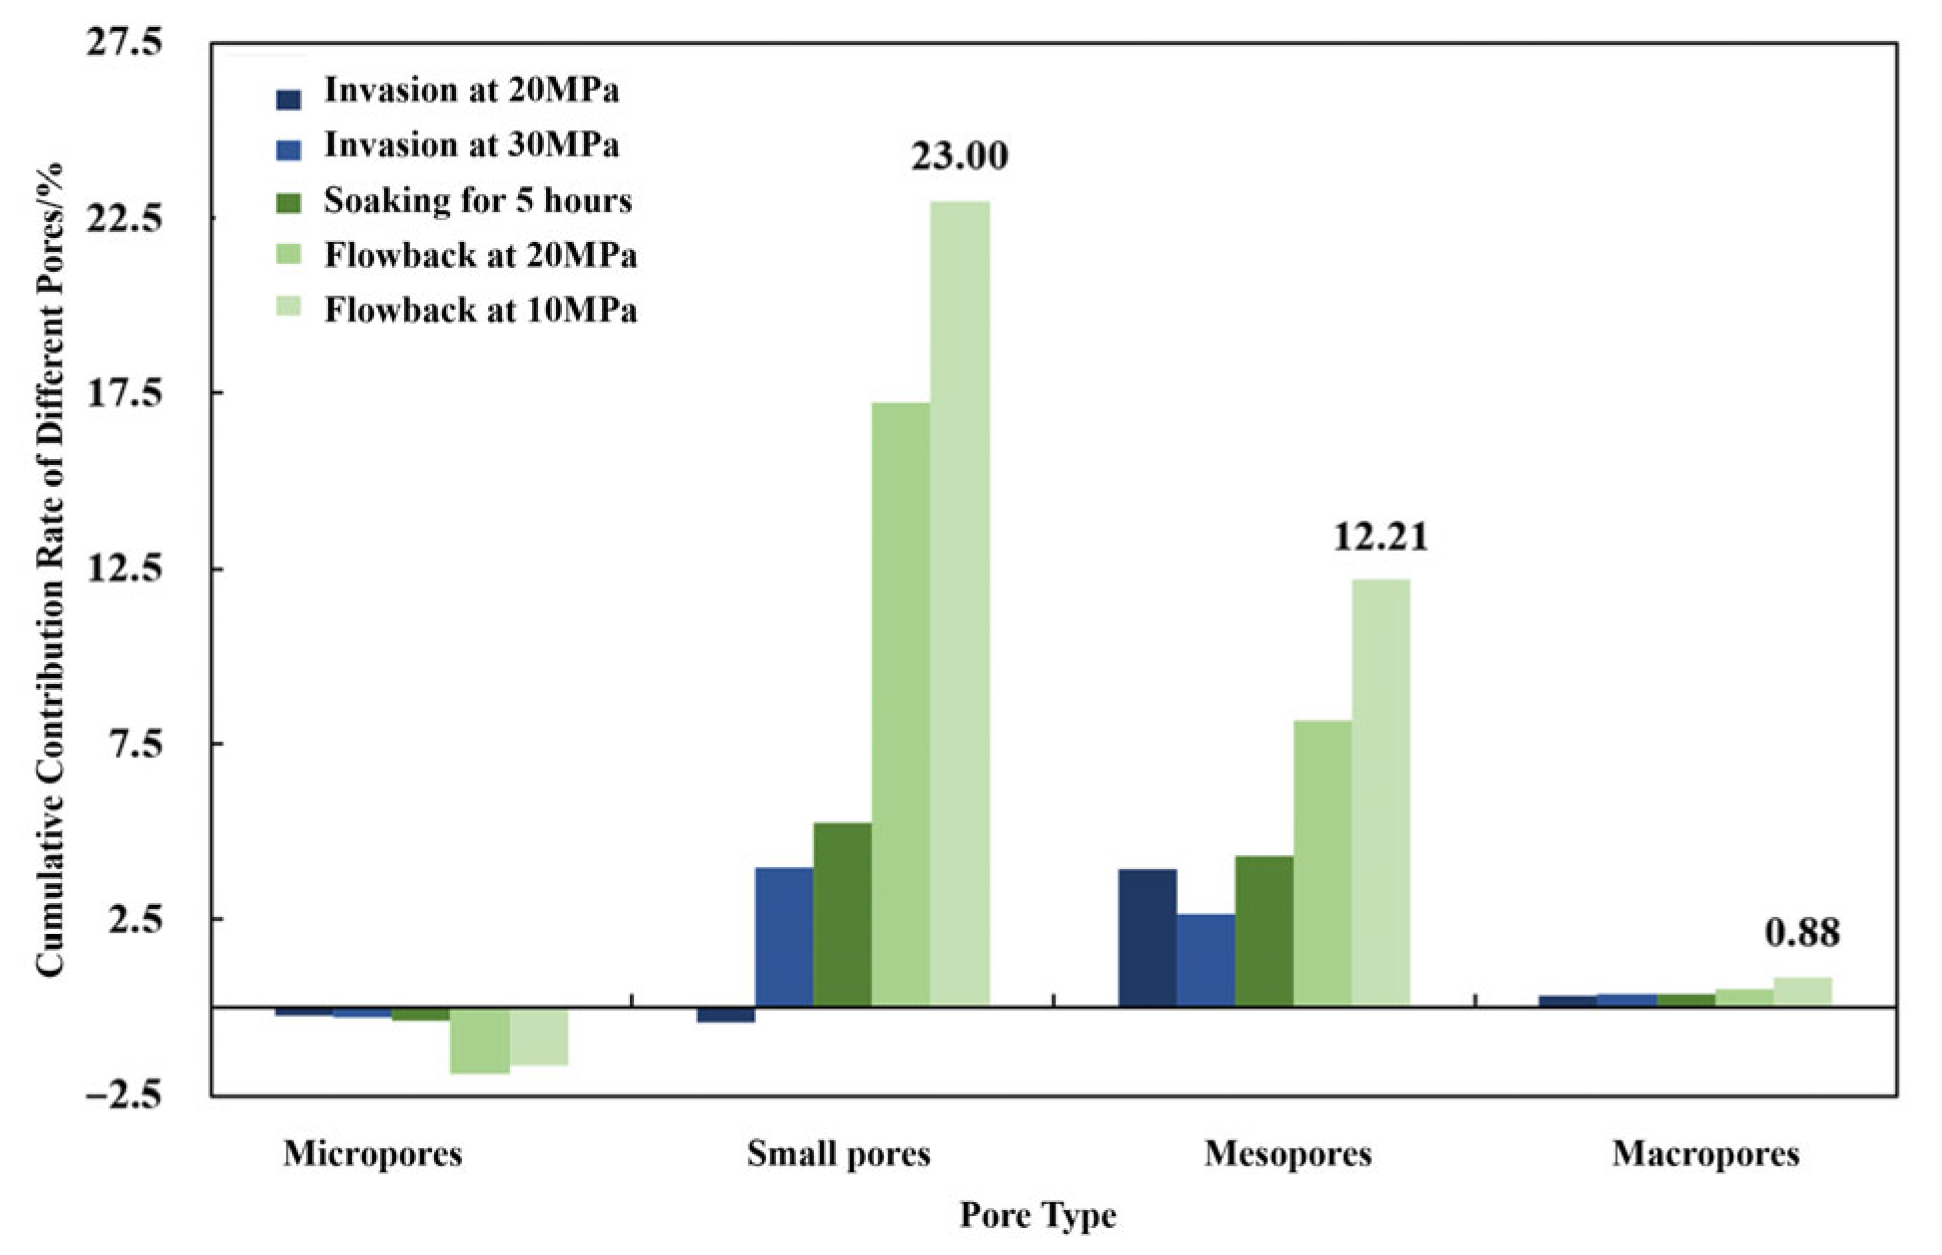
Figure 3 shows oil content in different pore sizes during the fracturing fluid invasion and flowback process. Figure 4 illustrates the contribution of different pore sizes to the total recovery rate. At the invasion stage, the fracturing fluid first enters macropores and mesopores, driving crude oil into smaller pores. During well soaking, the fracturing fluid redistributes with little variation. In the flowback stage, as the bottom-hole flow pressure decreases, the oil signal in small pores decreases obviously. The initial oil content in small pores decreases from 1.20 mL to 0.79 mL, contributing the most (23.00%) to the total recovery rate, and the initial oil content in mesopores decreases from 0.55 mL to 0.33 mL, contributing 12.21% to the total recovery rate. The contributions of macropores and micropores to the total recovery rate were minor.

3.1.2. Study on the Invasion and Displacement of Fracturing Fluids in Lower Sweet-Spot Core

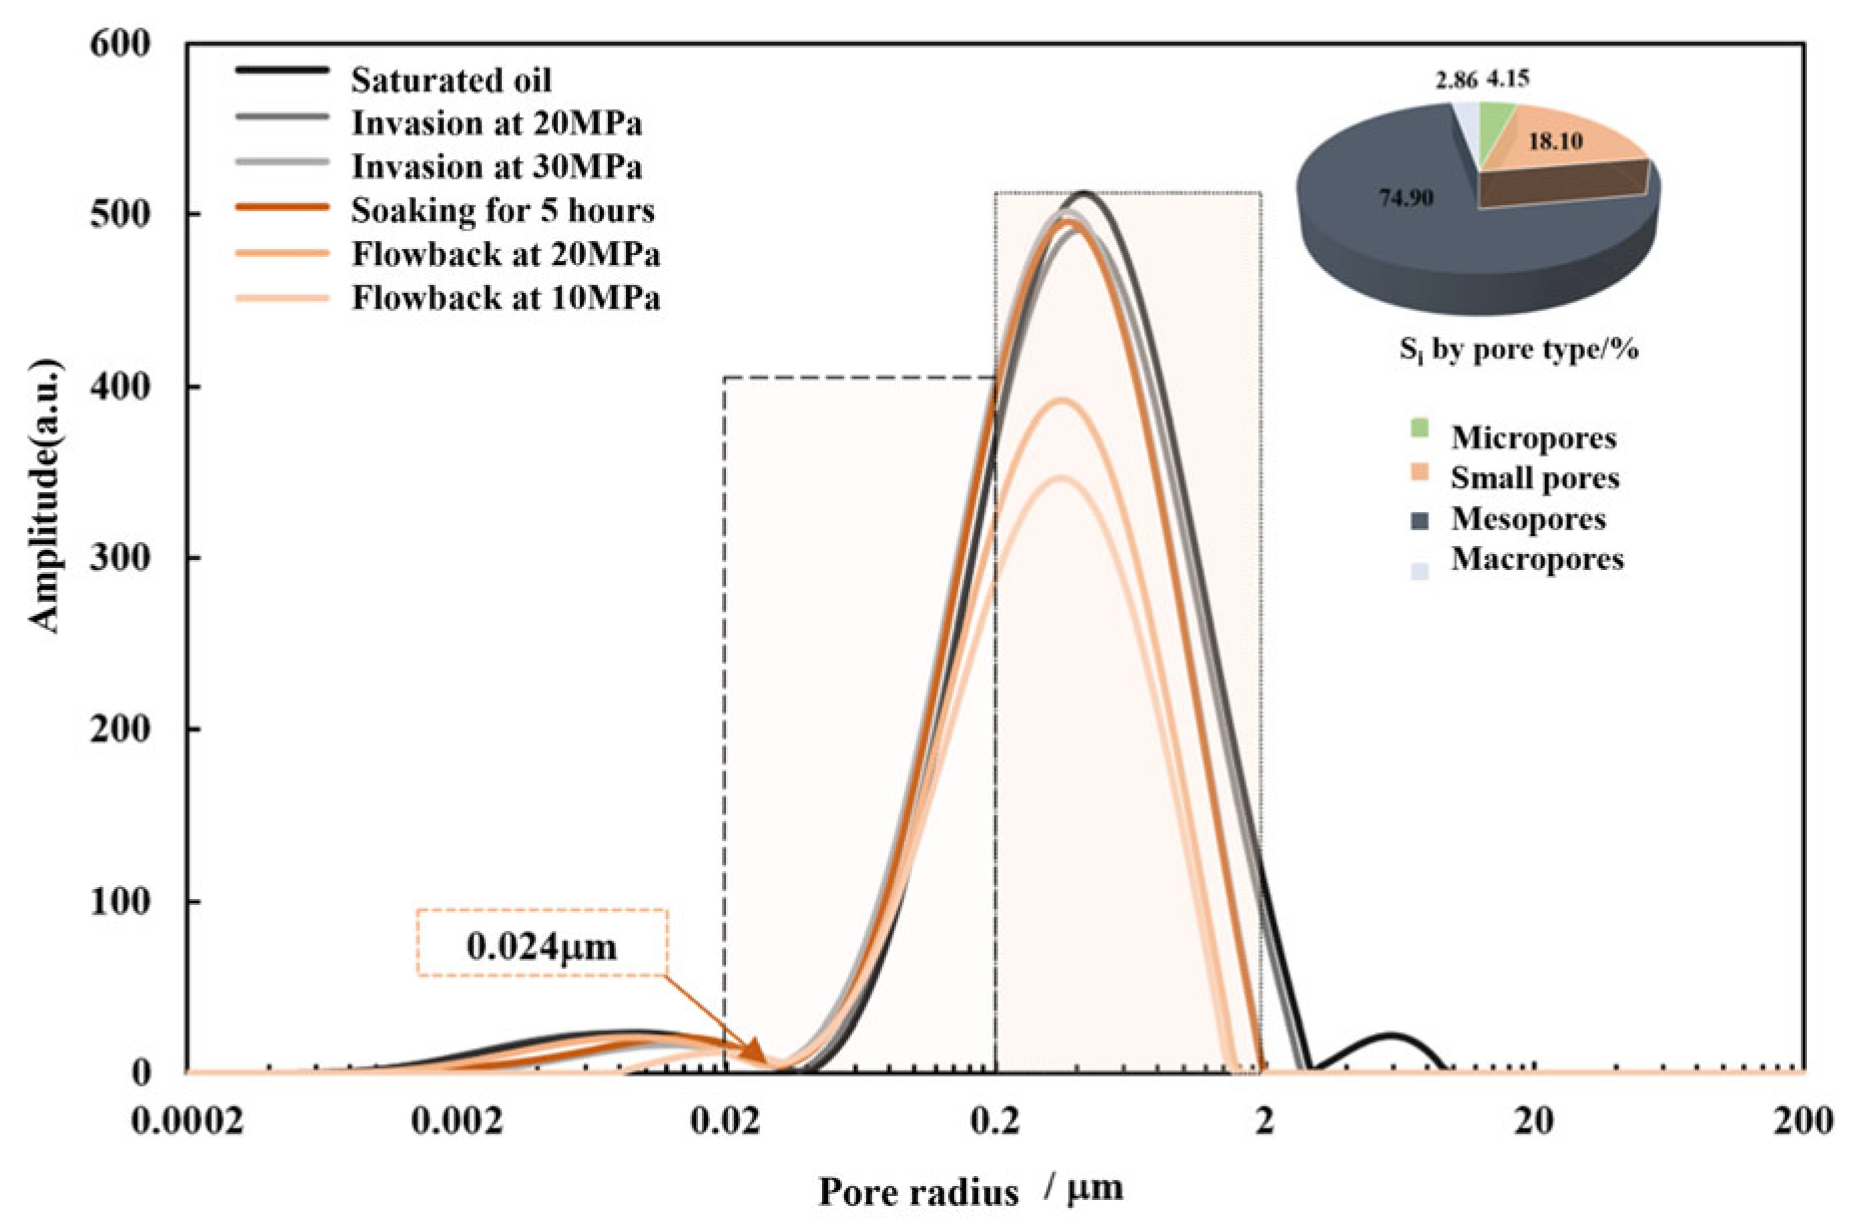
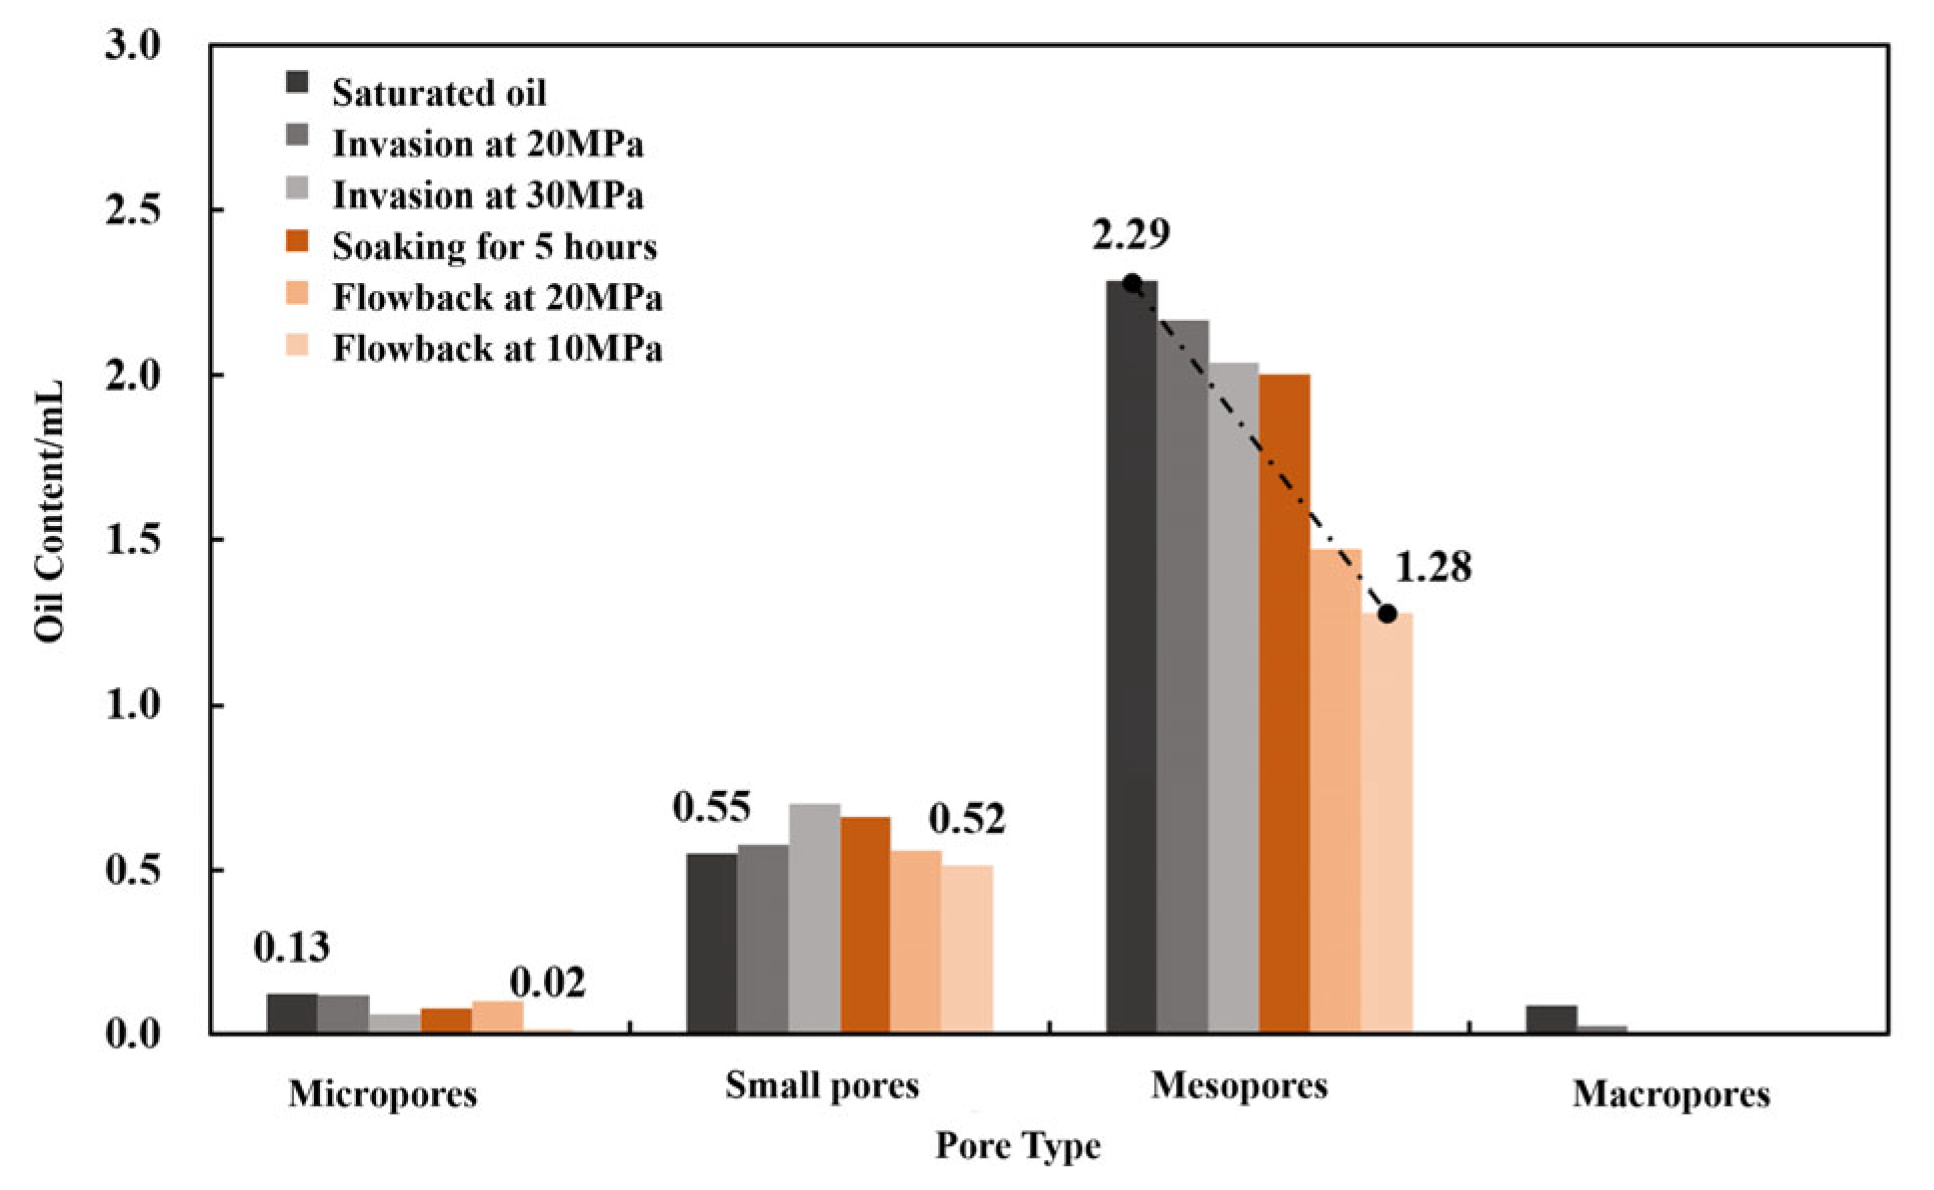
Figure 5 shows the T2 NMR spectrum of fracturing fluid invasion and backflow in the lower sweet-spot core 2# under a 20 MPa pressure differential. The mesopores constitute the primary pores in the lower sweet-spot core, accounting for 74.90% of oil content, followed by small pores at 18.10%. As the invasion pressure increases from 20 MPa to 30 MPa, the curve shifts to the left while no oil is produced during this stage. During well soaking, the curve shows a shift towards the left meaning that some oil has migrated to smaller pores. At a backflow pressure of 20 MPa, signal intensity in mesopores decreases the most while that in small pores decreases to a lesser extent. At 10 MPa backflow pressure, pore signal amplitude continues to decrease but more slowly. The MPPR in the lower sweet spot was 0.024 µm.
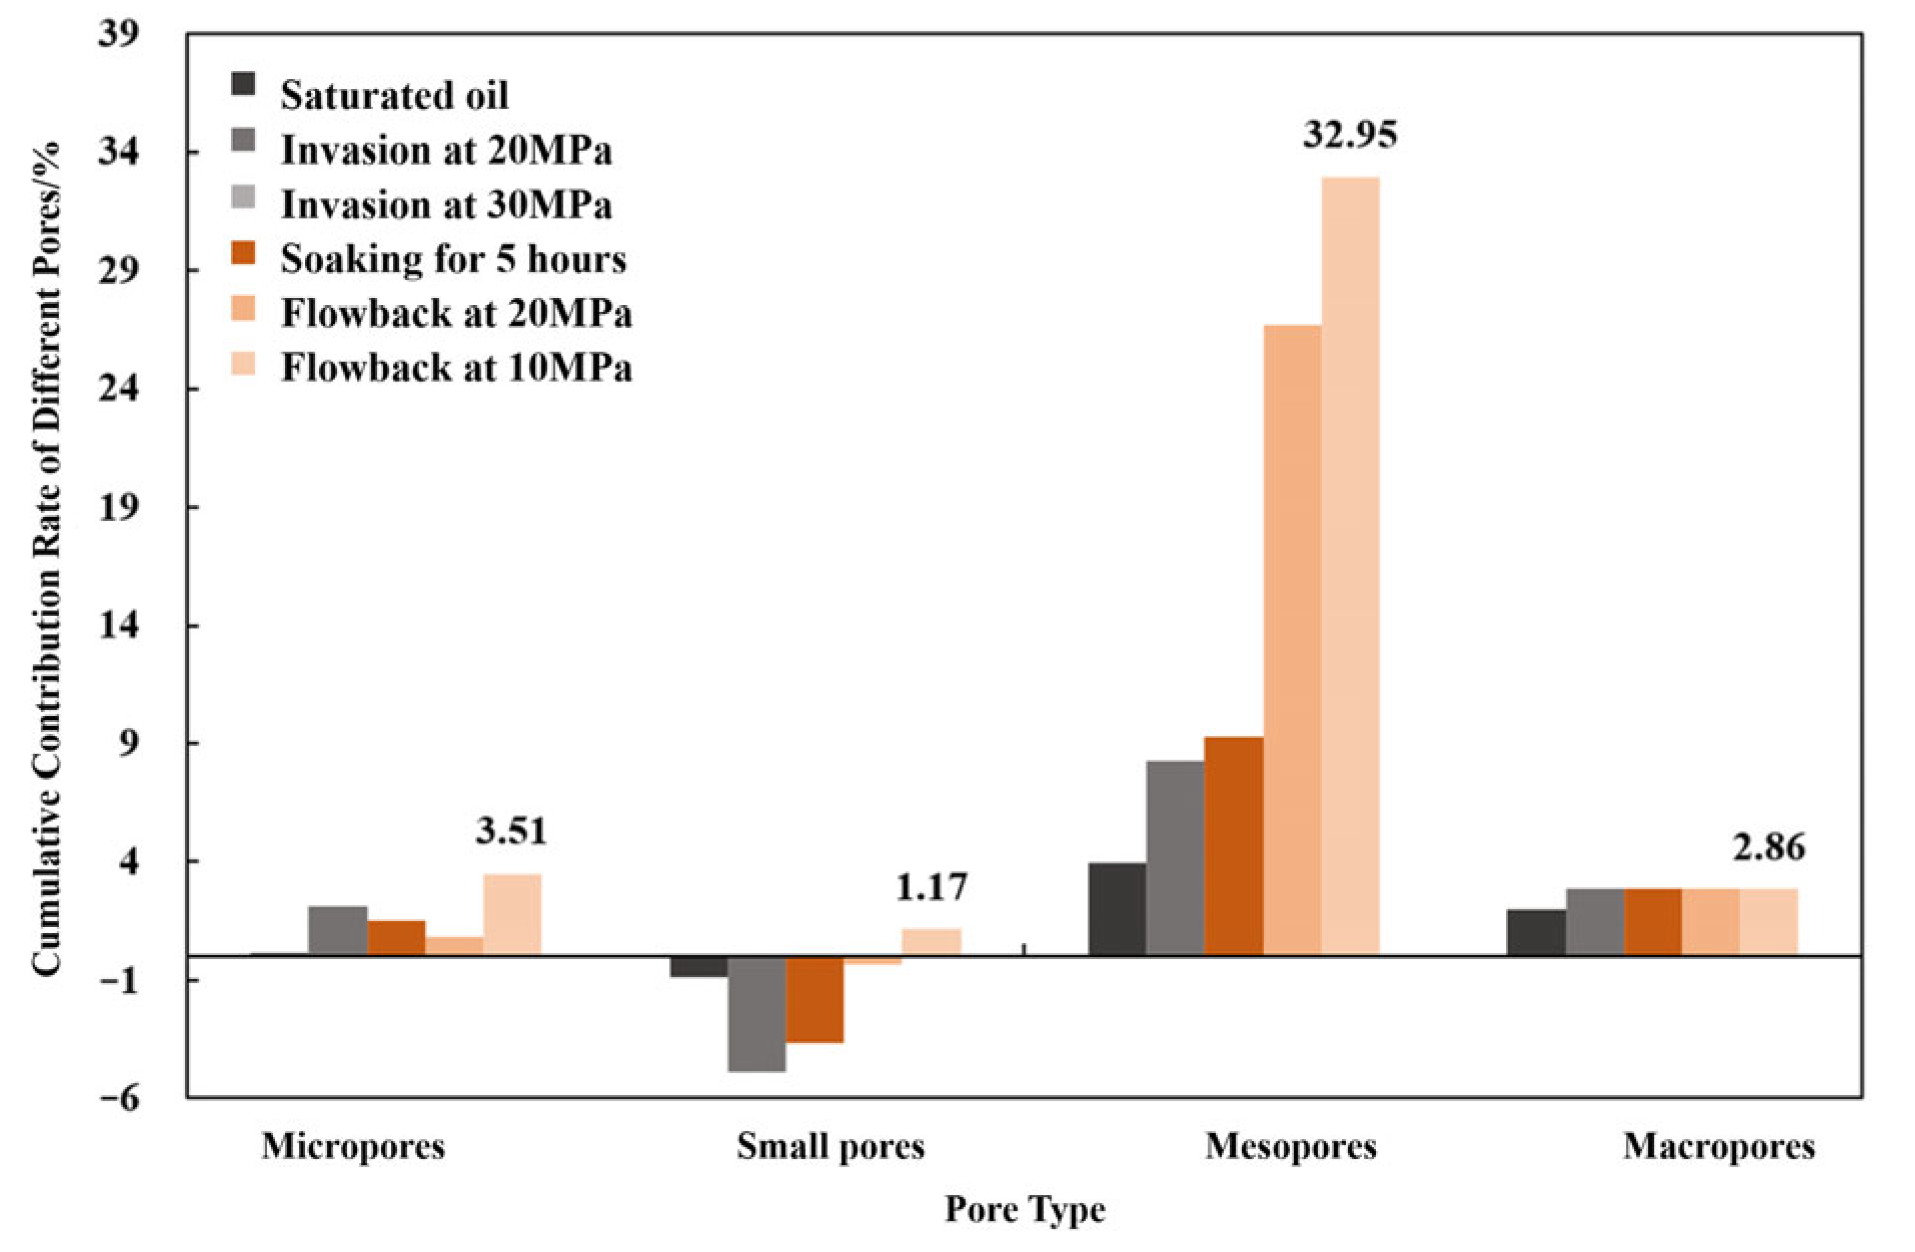
Figure 6 shows the variation in oil content within different pore sizes during the fracturing fluid invasion and backflow process of core 2#. Figure 7 shows the contribution of different pore sizes to the recovery rate. The results indicate that during the invasion phase, mesopores and macropores contribute the most to oil recovery rate. Crude oil flows from mesopores and macropores into small pores, increasing the oil signal intensity in the small pores. During well soaking, fracturing fluid mobilizes crude oil in small pores through capillary imbibition. As the backflow pressure decreased, the initial oil content in mesopores dropped from 2.29 mL to 1.28 mL, making the largest contribution to the total recovery rate at 32.95%.

3.2. Fracturing Fluid Invasion Depth and Recovery Efficiency

3.2.1. Fracturing Fluid Invasion and Flowback Nuclear Magnetic Resonance Imaging

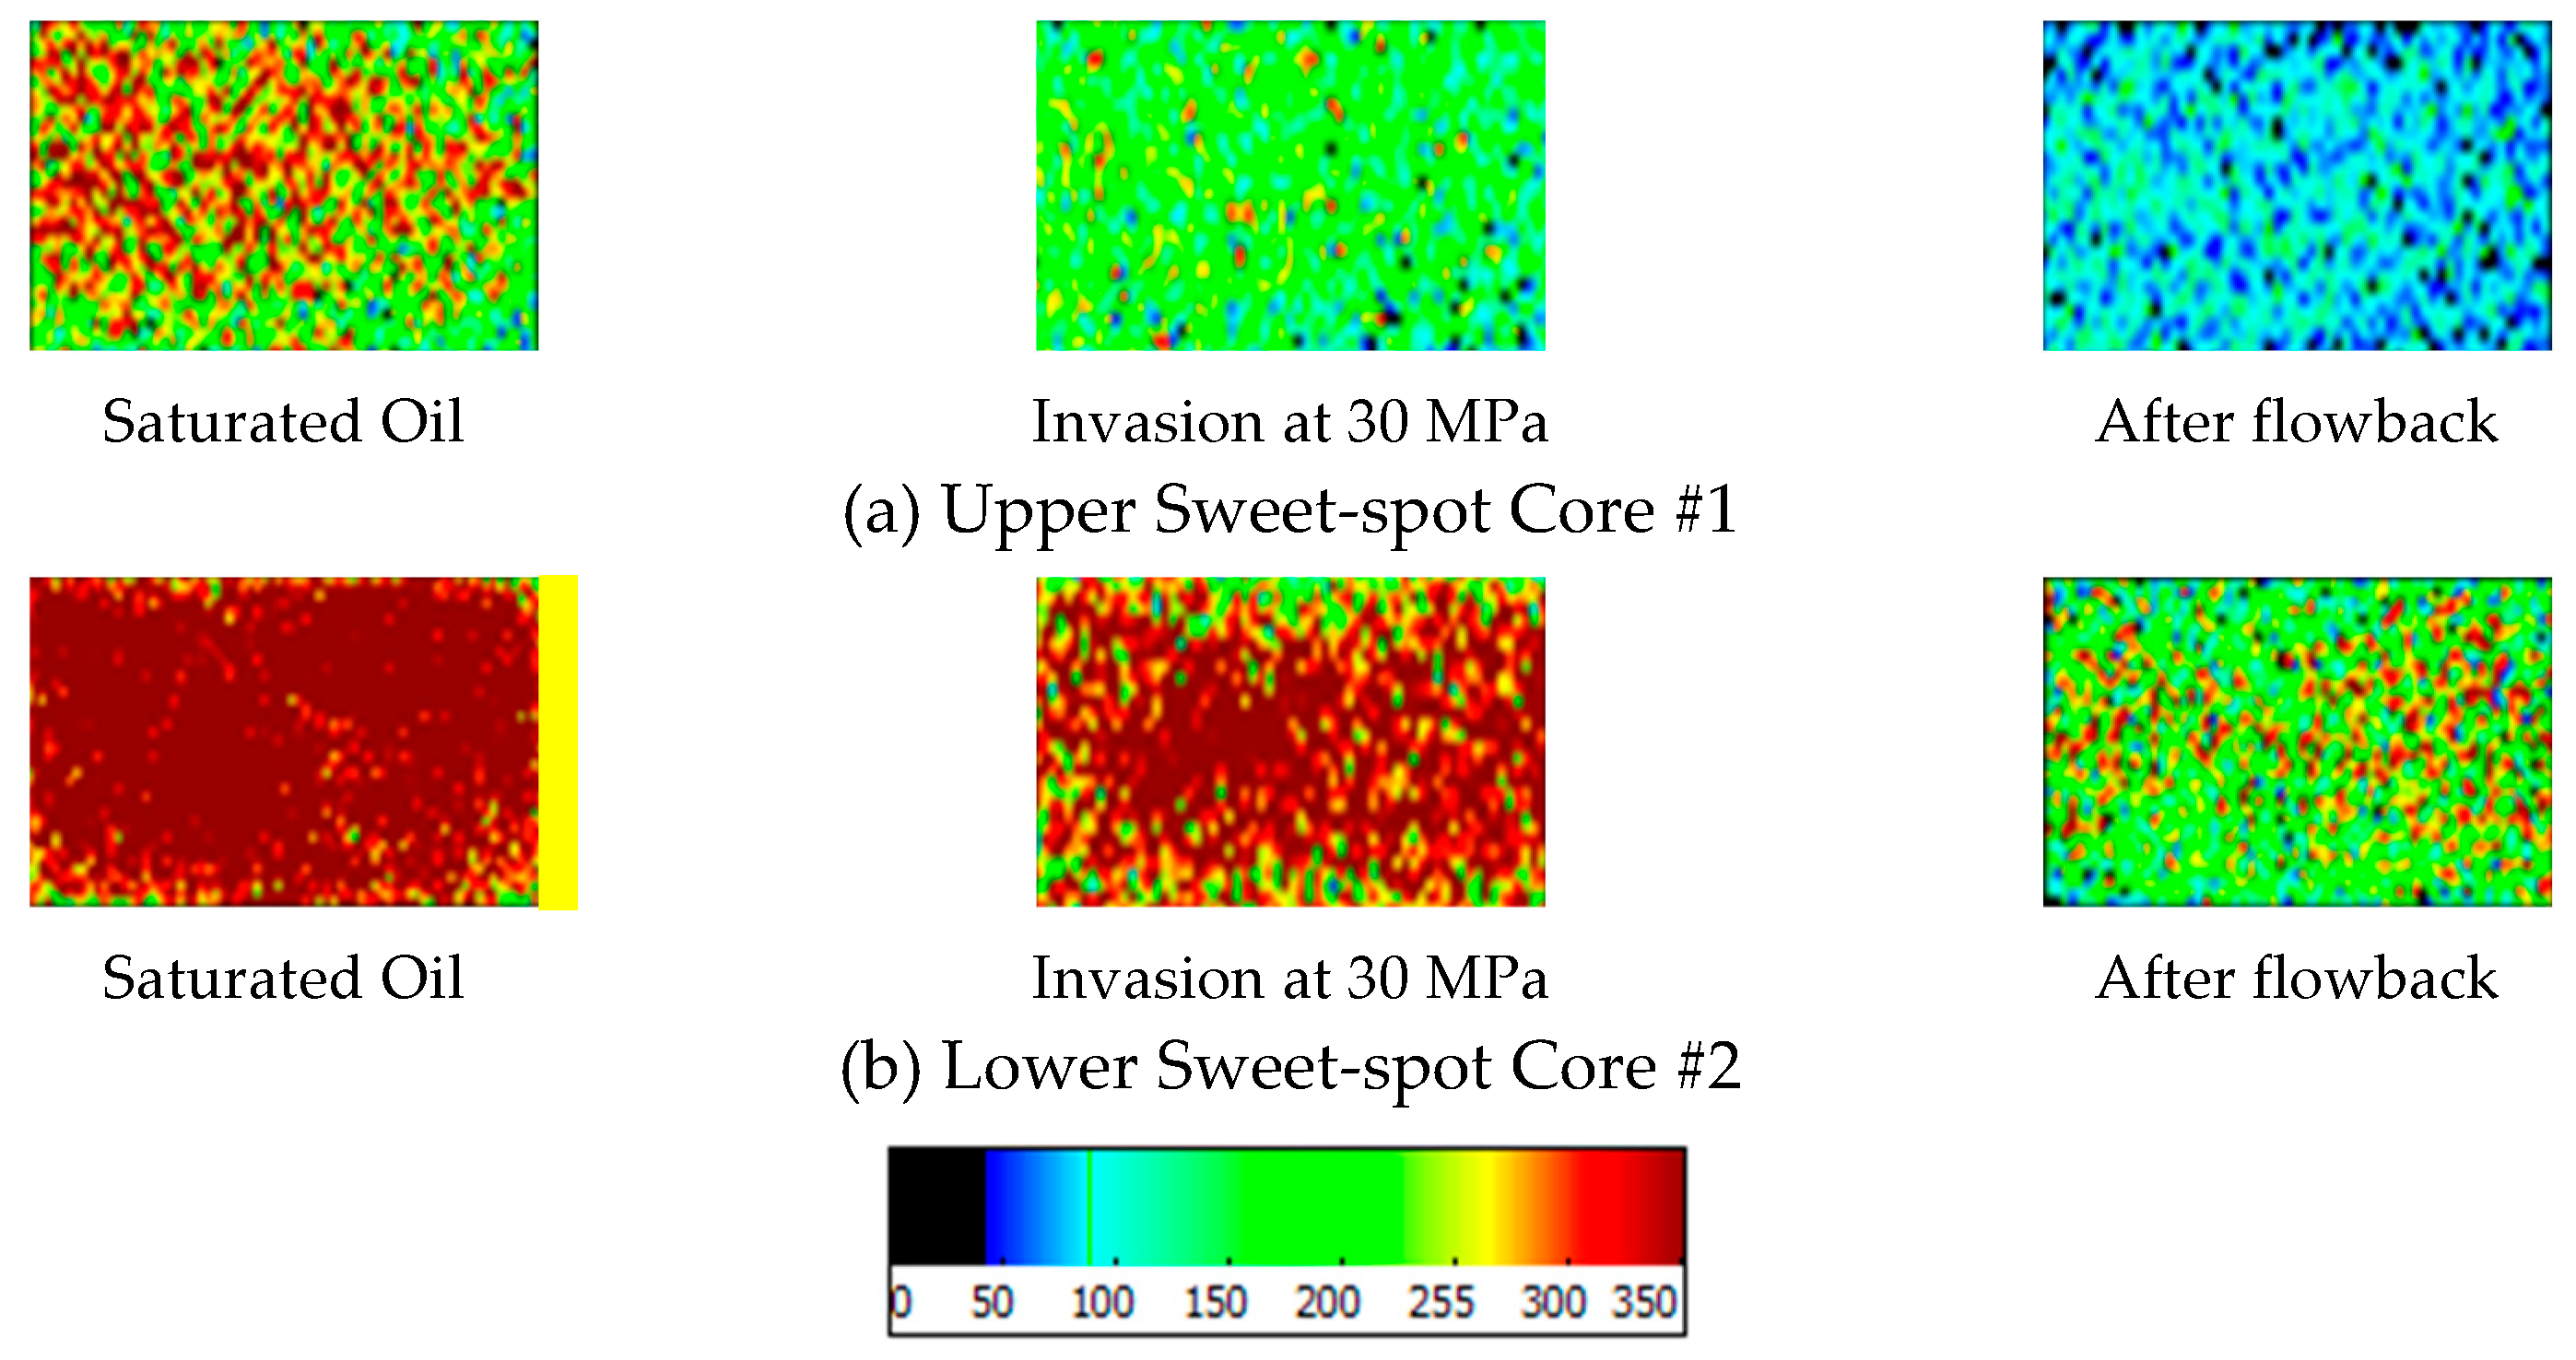
Nuclear Magnetic Resonance Imaging (NMRI) for fracturing fluid invasion and backflow in the upper and lower sweet-spot cores under 20 MPa are shown in Figure 8a,b, respectively. It can be observed that oil is produced more in the lower sweet-spot core due to its higher permeability than in the upper sweet spot.

3.2.2. Fracturing Fluid Invasion Depth

During the fluid invasion phase, the average depth to which fracturing fluid flows into the reservoir matrix and produces oil is termed as the invasion depth. Subsequently, during the soaking and flowback stage, the fracturing fluid continues to mobilize crude oil within the matrix through seepage flow. Although this value obtained in the lab cannot be fully applied to actual flow distance in the reservoir, the concept of invasion depth can be introduced, or a vivid understanding of the oil mobilization effect of fracturing fluid under varying conditions is obtained.
Thus, D is defined as the invasion depth and can be obtained by dividing the oil production from different stages by the cross-sectional area of the core. The calculation formula is shown in Equation (3):
D = Q ϕ A
where D is the penetration depth, cm; Q is the oil yield, cm3; ϕ is the porosity, %; and A is the core cross-sectional area, cm2.
Table 2 and Table 3 show the fracturing fluid invasion depth of the upper sweet-spot and lower sweet-spot cores, respectively. The invasion depth increases with injection pressure increases from 20 MPa to 30 MPa. The upper sweet-spot core achieved a maximum invasion depth of 0.29 cm at 30 MPa, with 1.46 cm at flowback at production pressure at 10 MPa. Its final recovery rate was 34.45%. For the lower sweet-spot core, the maximum invasion of 1.77 cm produced a final recovery rate of 40.49%.
The maximum invasion depth and recovery rate of the lower sweet-spot core are approximately 1.2 times the upper one because of its higher porosity and permeability. The average invasion depth obtained in our core experiments without consideration of complex fracture interference is barely a reflection of the recovery factor. For the actual reservoir, the loss volume of fracturing fluid is proportional to the square root of time as proposed by Carter’s fracturing fluid loss theory [15] (shown in Equation (4)). Assumptions for this theory include one-dimensional linear flow of fracturing fluid; incompressible fluid; constant loss coefficient over time; uniform and isotropic formation permeability and porosity; and neglect of filter cake effects. The invasion depth is obtained by dividing the filtrate volume by the product of the filtrate area and porosity, as shown in Equation (5). Finally, combining similarity criteria yields the field invasion depth Lf calculation as in Equation (6).
V = 2 C A t
L = V A ϕ = 2 C ϕ t
L f = L l ϕ l C f t f ϕ f C l t l
where V is the filtrate volume, m3; C is the filtration coefficient, m·min1/2; A is the filtration area, m2; t is the filtration time, min; ϕ is the porosity, %; Lf is the field invasion depth, m; Ll is the core invasion depth, m; ϕf is the reservoir porosity, %; ϕl is the core porosity, %; Cf is the reservoir loss coefficient considering natural fracture opening [15], equal to 2.45 × 10⁻⁴ m·min1/2; Cl is the reservoir loss coefficient with natural fractures closed [15], equal to 0.80 × 10⁻⁴ m·min1/2; tl is the core soaking time, min; and tf is the field soaking time, min.
Calculating the fluid invasion depth based on a 30-day well-tightening period, the upper sweet-spot fluid invasion depth is approximately 0.46 m, while the lower sweet-spot invasion depth is approximately 0.70 m.

3.2.3. Flowback Behavior of Fracturing Fluid

Under laboratory conditions, the injection and displacement of fracturing fluid comply with the law of conservation of mass. The displaced volume of fracturing fluid corresponds to the oil displaced from the core pores during injection. Therefore, the flowback efficiency of the fracturing fluid at the core scale is calculated considering the compressibility of rock and crude oil.
c f = 2.587 × 10 4 ϕ 0.4358
c f = 1 V b V P P
c o = 1 V o V o P
η = V w V w o V w
where c f is the effective compressibility coefficient of rock [16], MPa−1; c o is the compressibility coefficient of crude oil, MPa−1; ϕ is the porosity, %; V b is the apparent volume of the core, cm3; V P is the pore volume of the core, cm3; P is the injection pressure, MPa; V o is the oil-bearing volume of the core, cm3; η is the fracturing fluid flowback efficiency, %; V w is the total injected fracturing fluid volume, cm3; and V w o is the displaced oil volume after fracturing fluid injection, cm3.
Table 4 shows the fracturing fluid flowback and retention volumes for the upper sweet-spot core 1# and lower sweet-spot core 2# under a 20 MPa pressure differential.
The total invasion volume of the upper sweet-spot core is 0.80 mL, and oil displacement volume is 0.61 mL through imbibition, with a flowback efficiency of 23.60%. In comparison, the total invasion volume of the lower sweet-spot core is 1.50 mL, and oil displacement volume is 1.24 mL, with a flowback efficiency of 17.66%. The upper sweet-spot core, in which small pores are dominant, demonstrated a lower invasion volume but a higher flowback efficiency than the lower one. Because a smaller pore volume in upper sweet-spot cores limits the total volume of fracturing fluid invasion, this results in a lower oil recovery efficiency and thus relatively larger flowback rate.

3.3. HTHP Imbibition Characteristics of Fracturing Fluid

3.3.1. Imbibition of Fracturing Fluid in Upper Sweet-Spot Cores

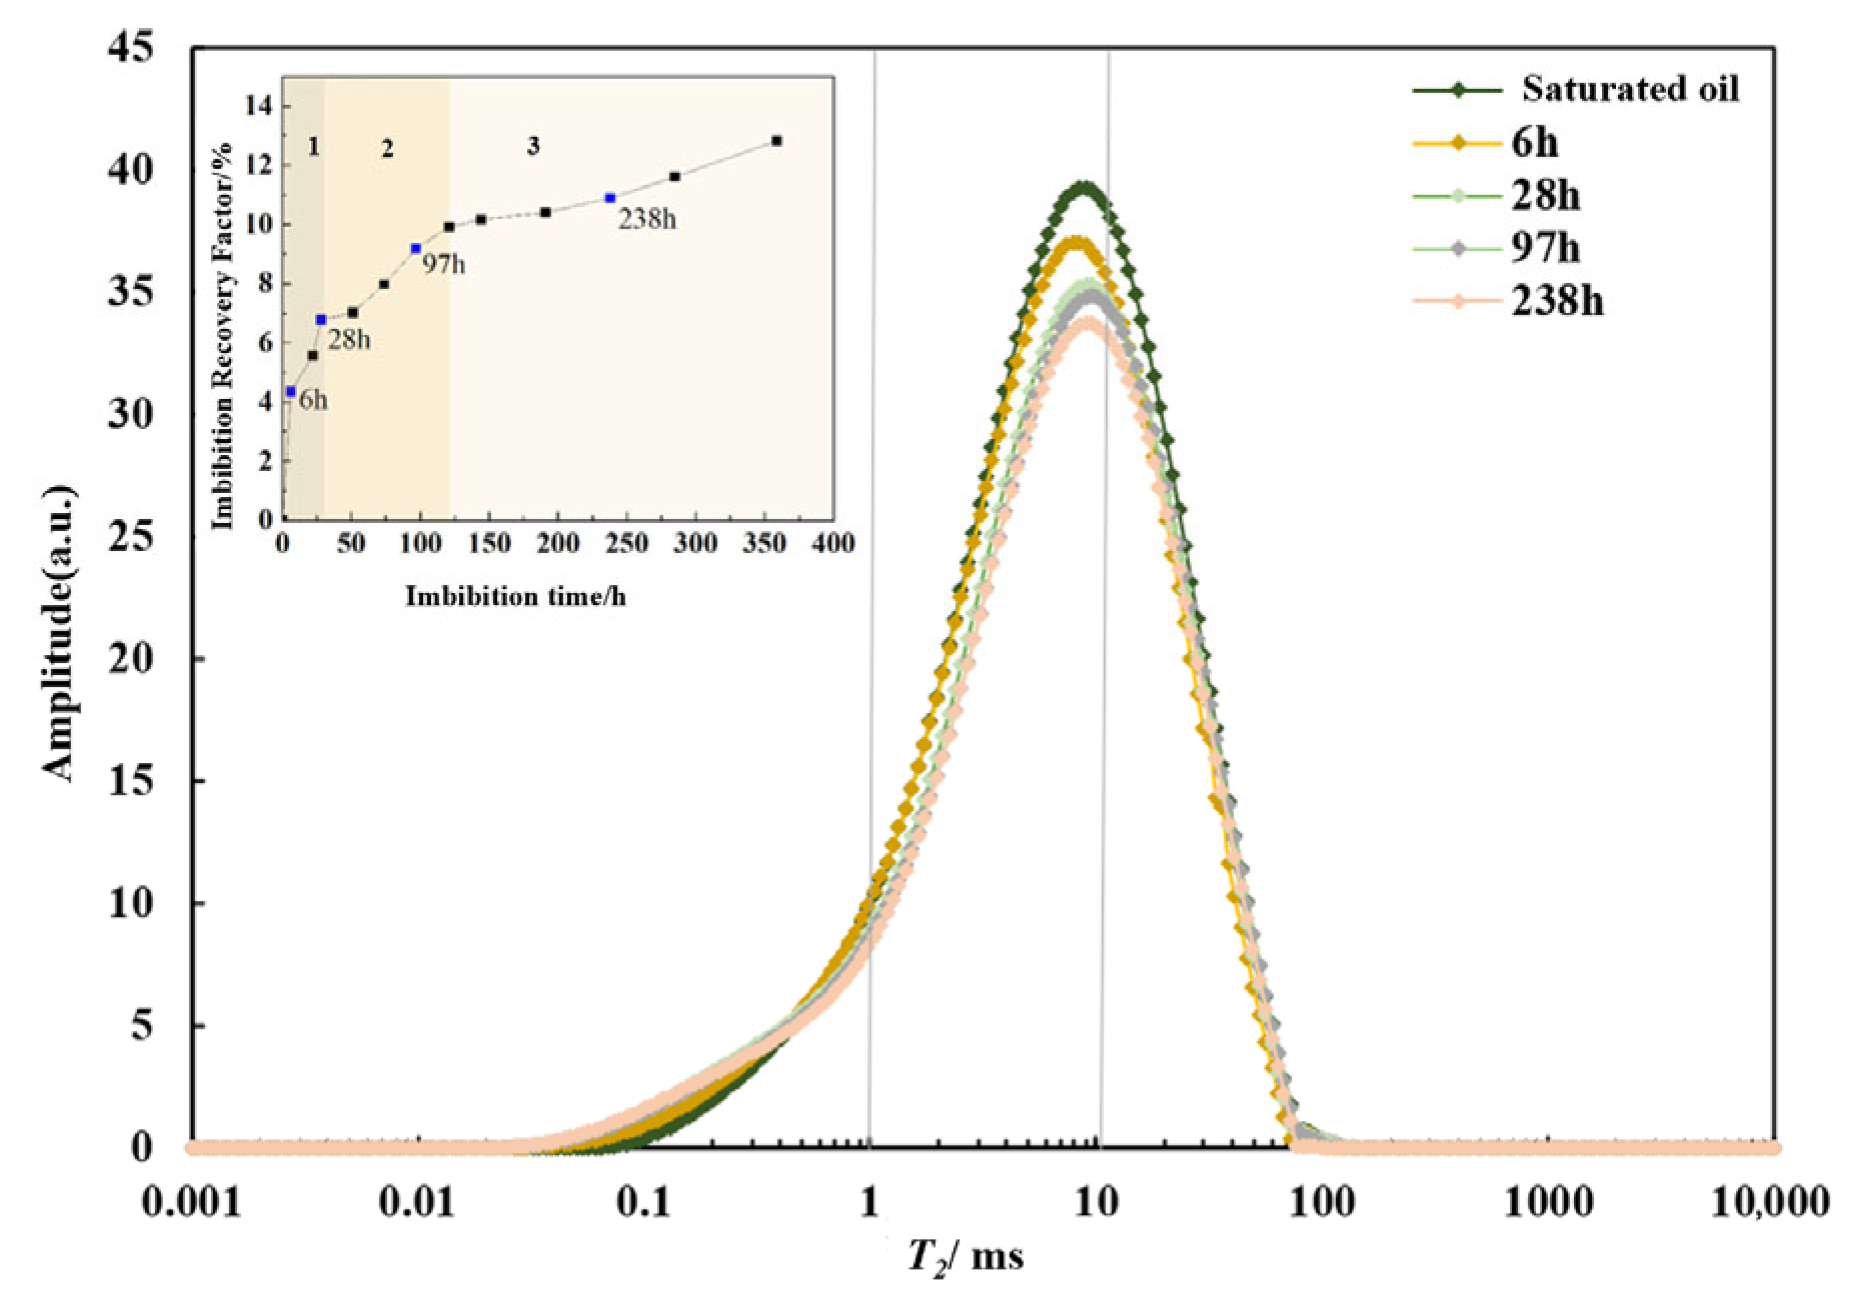
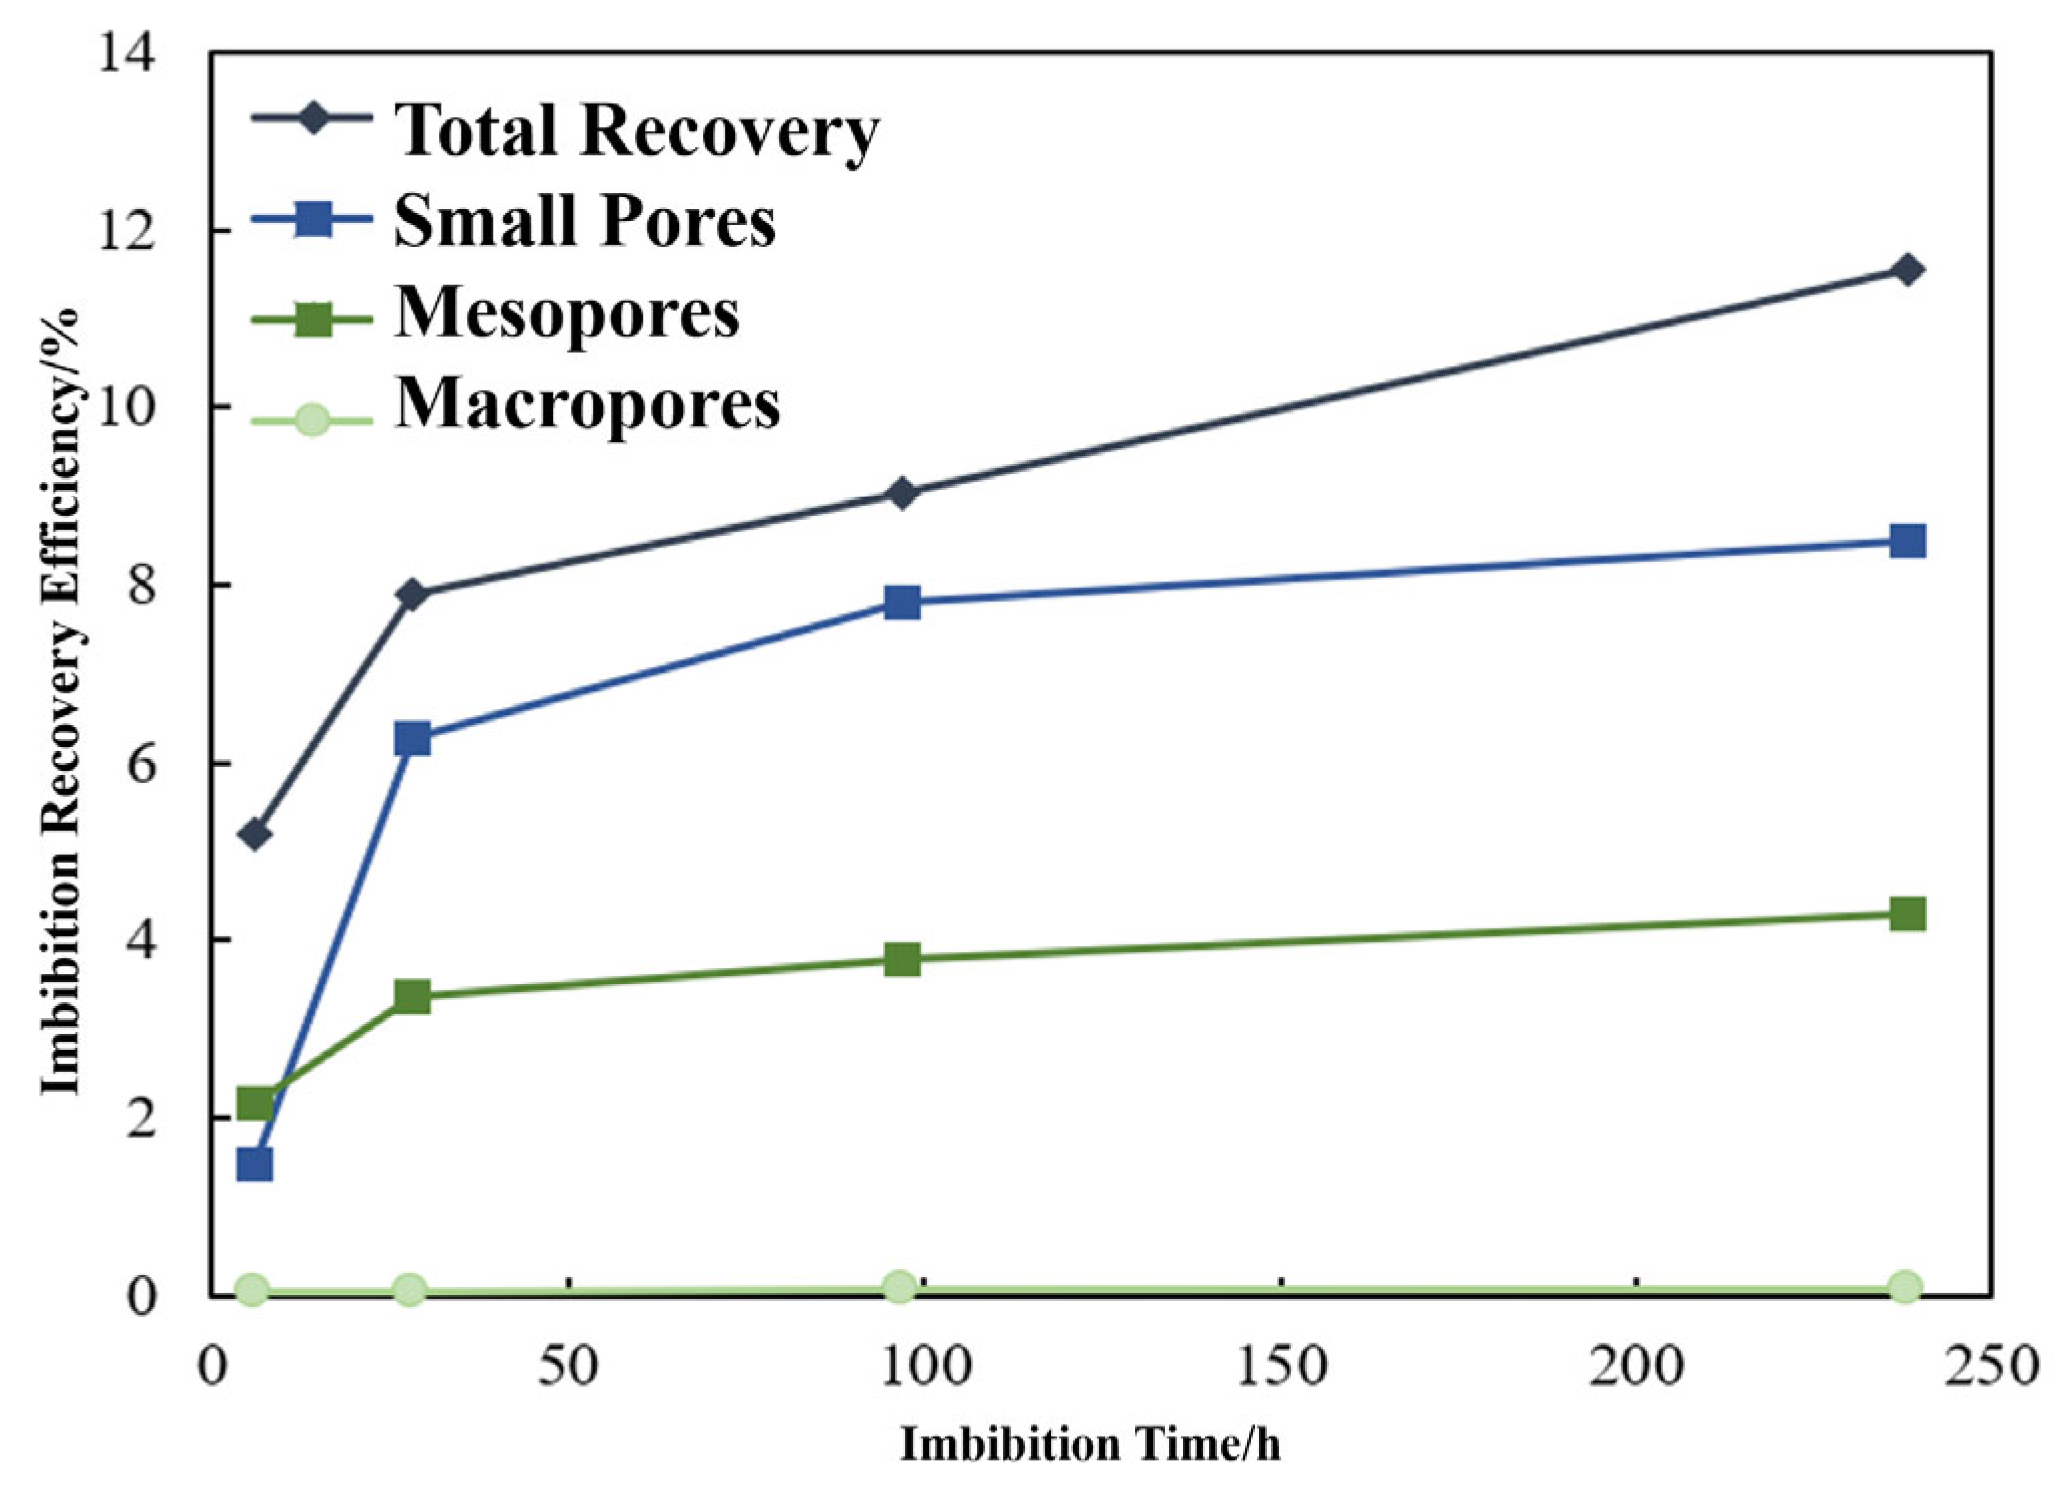
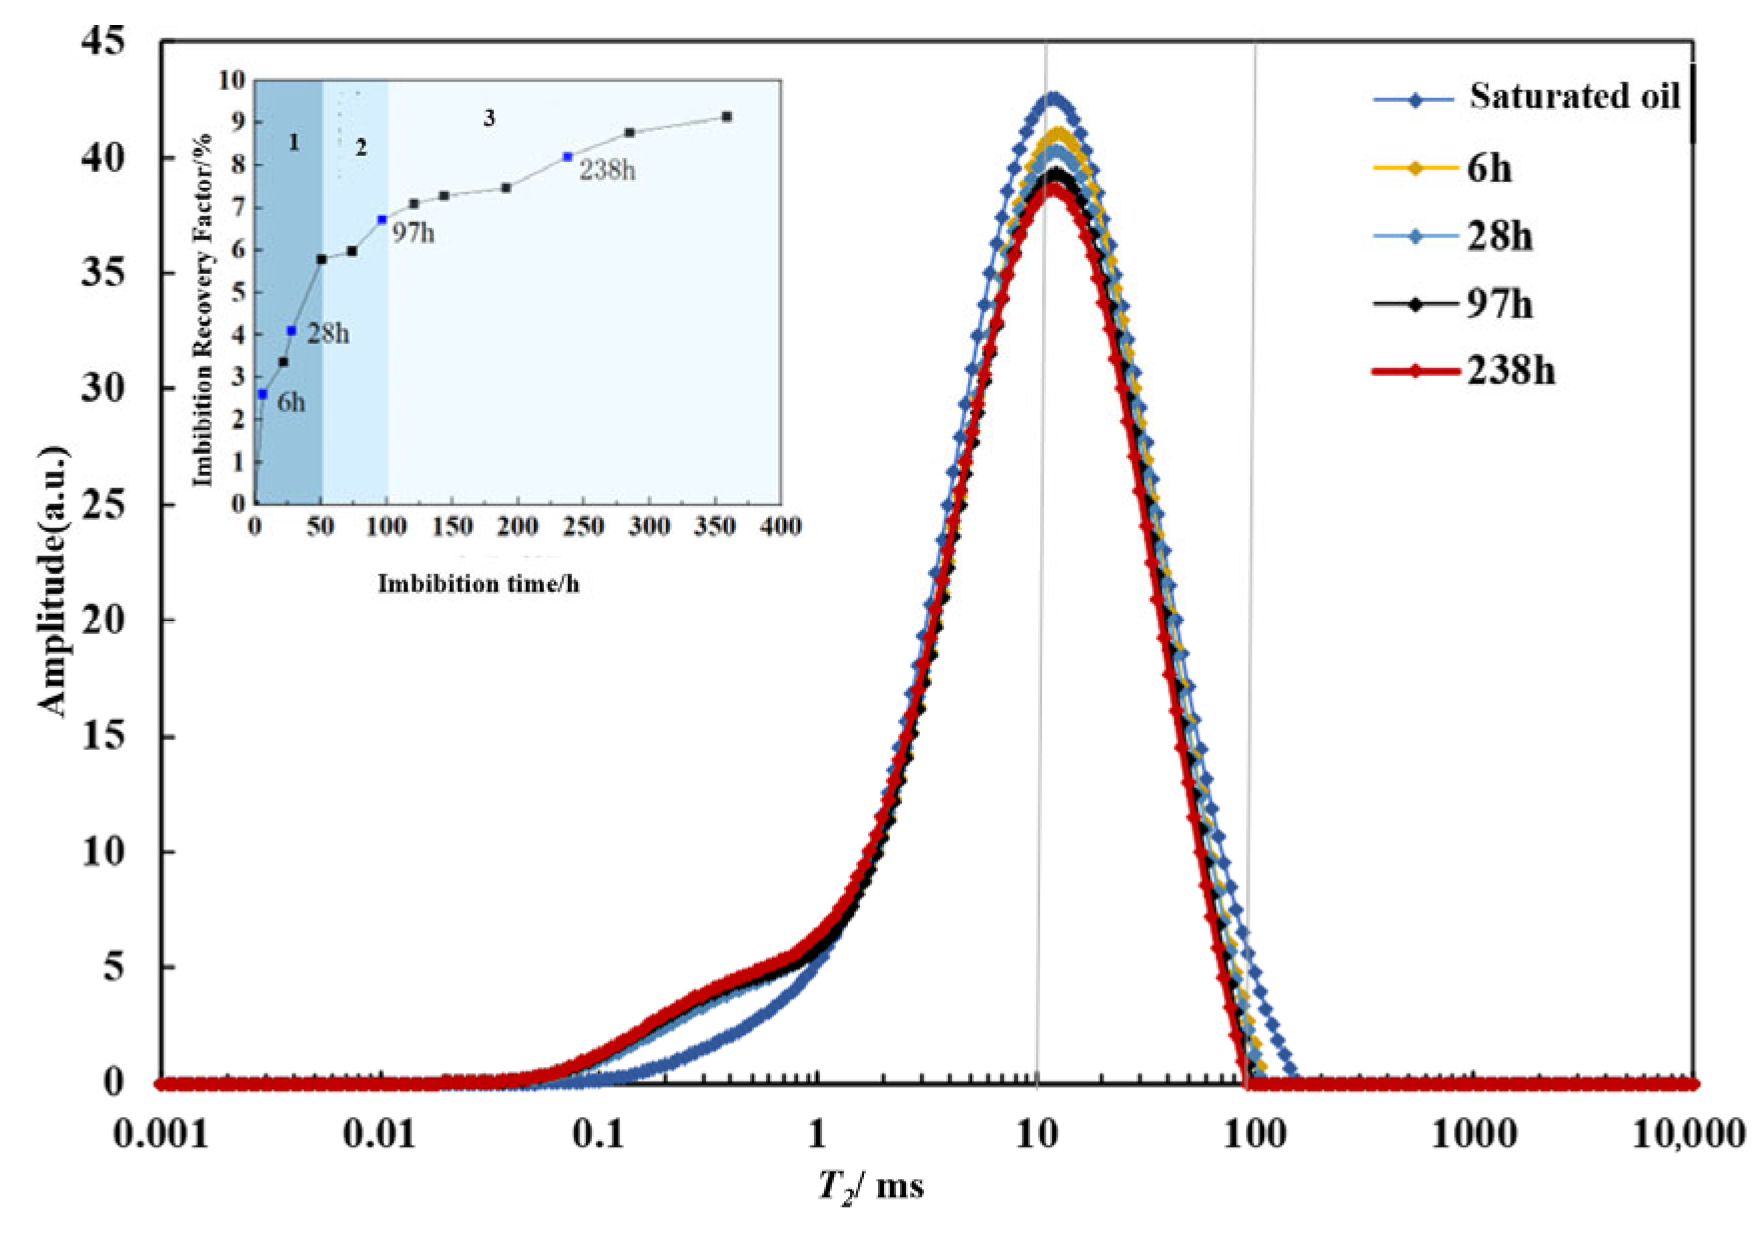
Figure 9 and Figure 10 show the NMR T2 spectrum of upper sweet-spot core #3 and the imbibition recovery curves for different pore types. As time increases, fracturing fluid progressively imbibes oil out from the core. The T2 spectrum of small pores decreases obviously, indicating a high recovery rate of crude oil in the small pores.
The inset in Figure 9 shows the oil recovery curve obtained from the imbibition test. Core 3# exhibits a rapid imbibition rate during the rising phase (0–28 h), followed by a transition phase (28–121 h), during which the imbibition rate decreases significantly. After 121 h, the imbibition rate slows down and gradually stabilizes, reaching an ultimate recovery efficiency of 12.822%.

3.3.2. Imbibition of Fracturing Fluid in Lower Sweet-Spot Cores

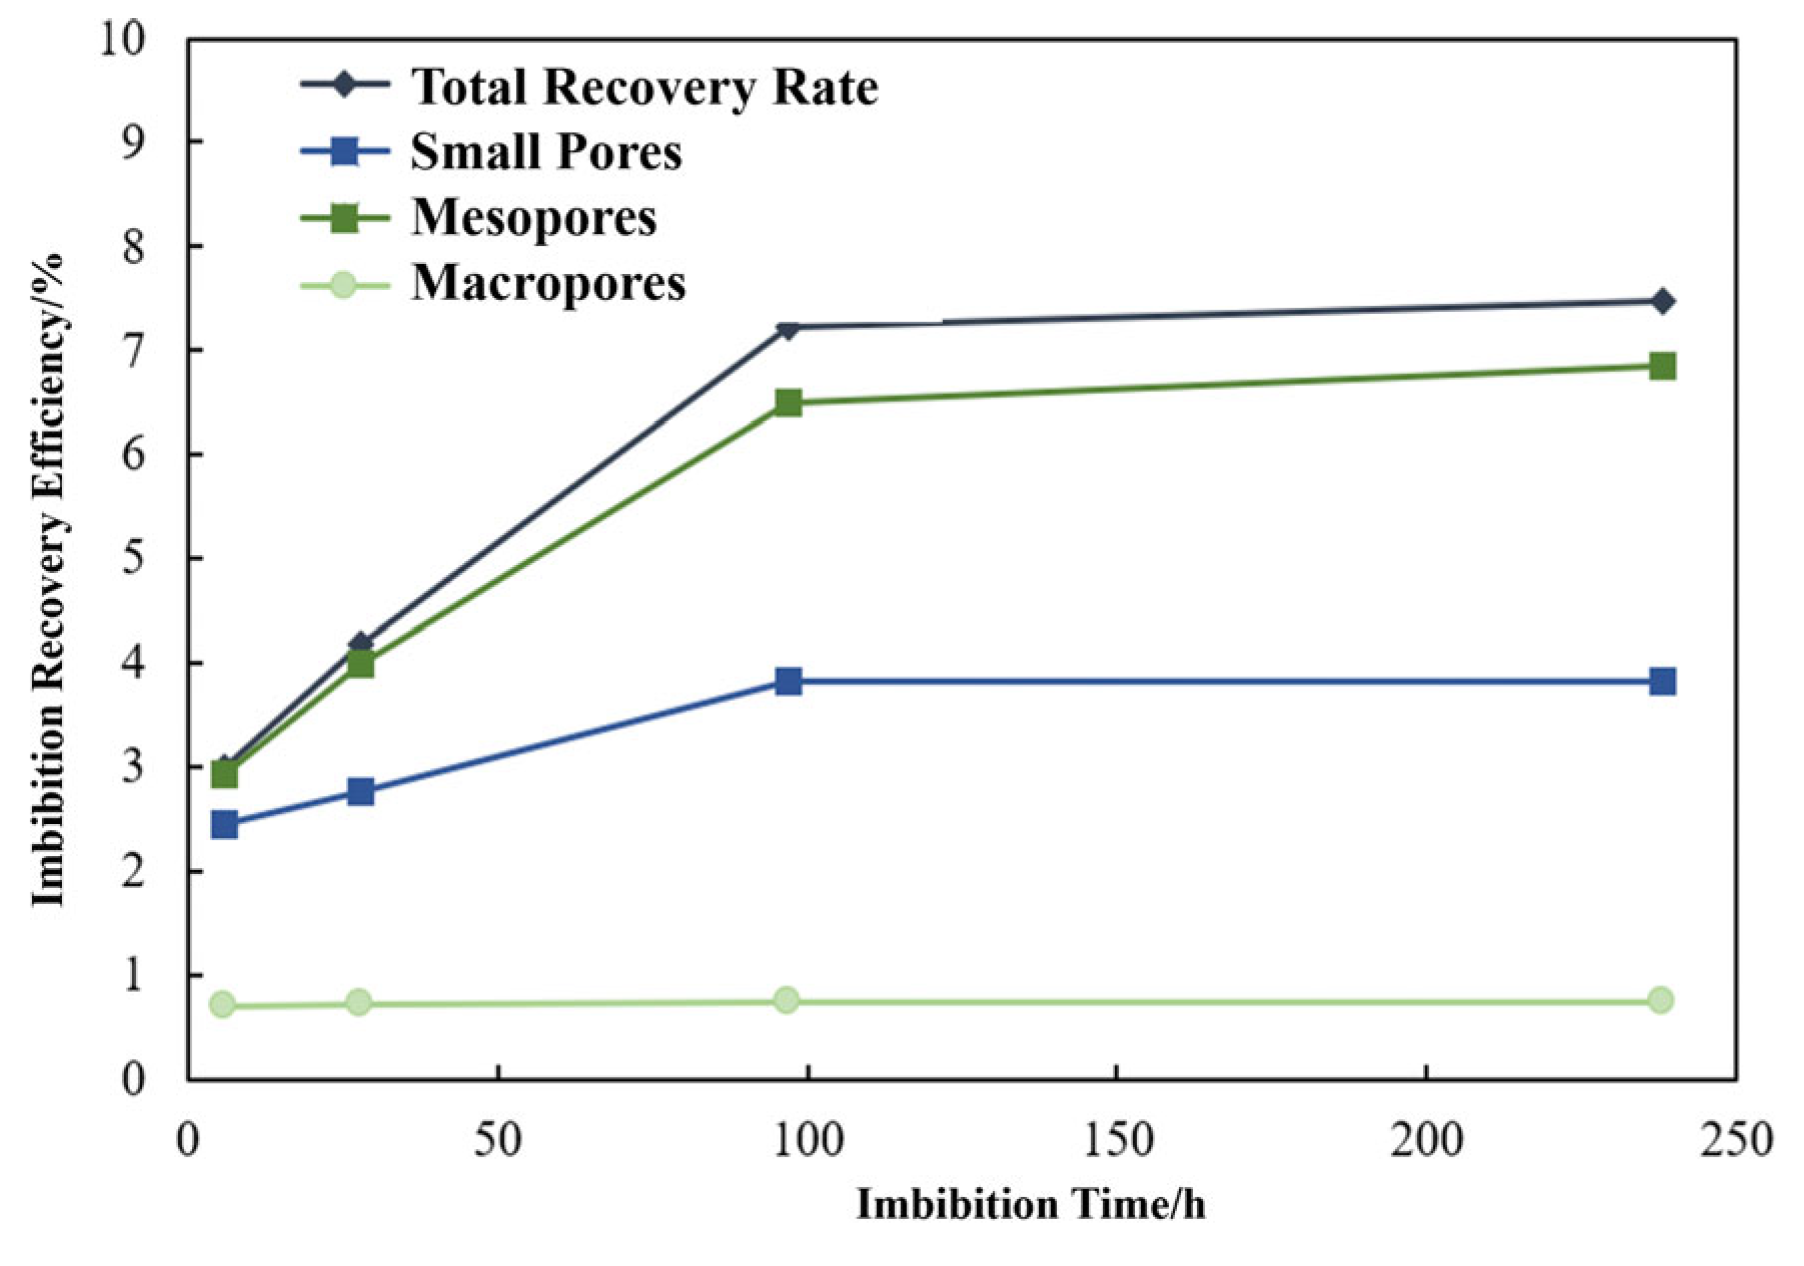
Figure 11 and Figure 12 present the NMR T2 spectrum and the imbibition recovery efficiency curves for different pore types in lower sweet-spot core 4#. The results indicate that the primary oil-bearing pores in this core are mesopores and small pores. As imbibition time increases, fracturing fluid progressively invades the core and displaces crude oil. The most decrease in the T2 spectrum amplitude is observed in mesopores, which also exhibit the highest oil recovery efficiency among all pore types.
The inset in Figure 11 displays the oil recovery from the imbibition experiment. Core 4# exhibits a rapid imbibition rate during the initial growth phase (0–51 h), followed by a transition phase (51–97 h), characterized by a decline in the imbibition rate. Beyond 97 h, the rate further decreases and gradually stabilizes, ultimately reaching a final recovery efficiency of 9.143%.
Under high-temperature and high-pressure (HTHP) imbibition conditions, the fracturing fluid imbibition recovery efficiency observed in core 3# is higher than that in core 4#. This result can be attributed to the lower permeability and smaller pore radii of core 3#, which generate stronger capillary forces, enhancing imbibition recovery factor.
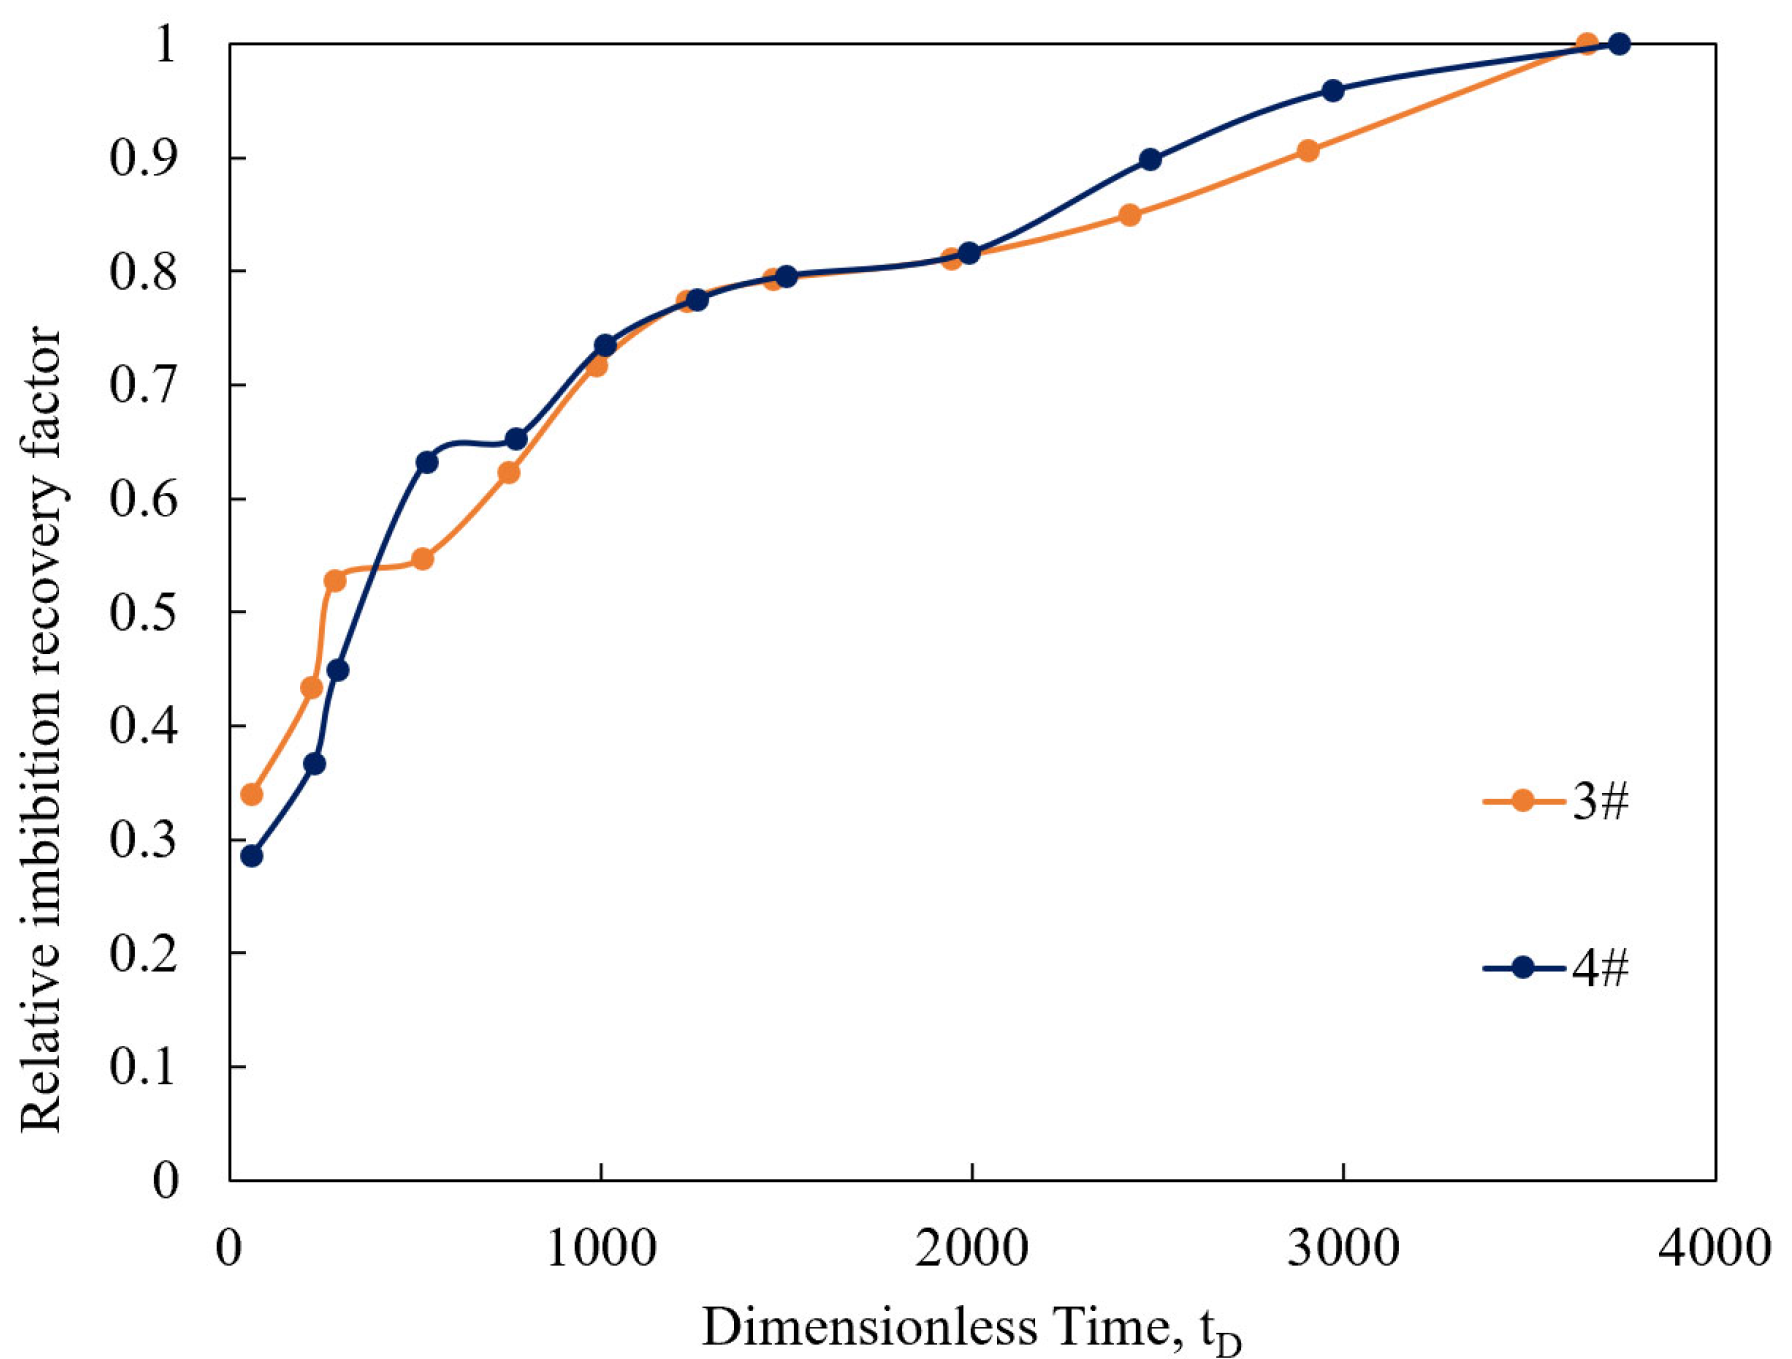
To apply lab-scale fracturing fluid imbibition results to the determination of optimal soaking time in reservoir after fracturing, dimensionless time modeling is required. Ma et al. [17] proposed a dimensionless time equation incorporating a characteristic length, which is applicable to imbibition oil recovery in tight reservoirs, as shown in Equation (11). Then the relative imbibition recovery efficiency is introduced whereby the imbibition recovery is normalized according to Equation (12) [18].
t D = σ K ϕ μ w μ o L c 2 t
R r = R t R
In the equation,   t D is dimensionless time; K is permeability (mD); ϕ is porosity (%); σ is interfacial tension (N/m); t is imbibition time (s); μ w is fracturing fluid viscosity (mPa·s); μ o is oil phase viscosity (mPa·s); and L c is characteristic length (m). R r is relative imbibition efficiency; R t is imbibition efficiency at time t (%); and R is the ultimate imbibition efficiency (%).
Ma’s model was applied to fit our experimental data of high-temperature and high-pressure (HTHP) imbibition. As shown in Figure 13, the fitting curve of the Ma model aligns well with the experimental data.
The dimensionless time calculated by Ma’s model is equal to the reservoir dimensionless time, so that the suggested soaking time for the well is calculated, as shown in Equations (13) and (14). The principle for determining the well-soaking time is connected to maximizing the imbibition of the oil recovery factor.
σ f K f ϕ f μ w f μ o f L c f 2 t f = σ e K e ϕ e μ w e μ o e L c e 2 t e
t f = L c f 2 σ e K e ϕ e μ w f μ o f L c e 2 σ f K f ϕ f μ w e μ o e t e
In the equations, t e is the equilibrium imbibition time required for the core; K e and K f show the permeability of the core and the reservoir, respectively (mD); ϕ e and ϕ f show the porosity of the core and the reservoir (%); σ e and σ f denote the oil–water interfacial tension under core and reservoir conditions (N/m); t f is the well-soaking time in the reservoir (s); μ w e and μ w f are the viscosity of the fracturing fluid used in the core and the reservoir (mPa·s); μ o e and μ o f are the oil-phase viscosity under core and reservoir conditions (mPa·s), respectively; L c e is the characteristic length of the core (m), and L c f is the characteristic length of fractures in the reservoir (m).
At core scale, the average permeability and porosity are 0.0482 mD and 8.59%, respectively. The fracturing fluid viscosity, crude oil viscosity, and the oil–water interfacial tension are 1.1 mPa·s, 2.06 mPa·s, and 0.026 N/m, respectively. The pore structures in Reservoir C are mainly classified into Type II and Type III. Type II reservoirs have average permeability of 0.289 mD and a porosity of 12.20%, while Type III reservoirs have an average permeability of 0.025 mD and an average porosity of 7.1% [19]. The oil–water interfacial tension, fracturing fluid viscosity, and crude oil viscosity under reservoir conditions are assumed to be consistent with those in the core experiments. During the high-temperature, high-pressure imbibition experiments, the boundary condition was set as open on the sides and closed at both ends, so the characteristic length is given by Formula (15). To account for the influence of fracture length and width, the boundary condition is assumed to be fully open, and the characteristic length for the reservoir is defined by Equation (16), with a fracture half-length L of 130.75 m [20]. The imbibition equilibrium time is approximately 15 days in the lab experiments.
L c e = D 2
L c f = D L 2 D 2 + 2 L 2
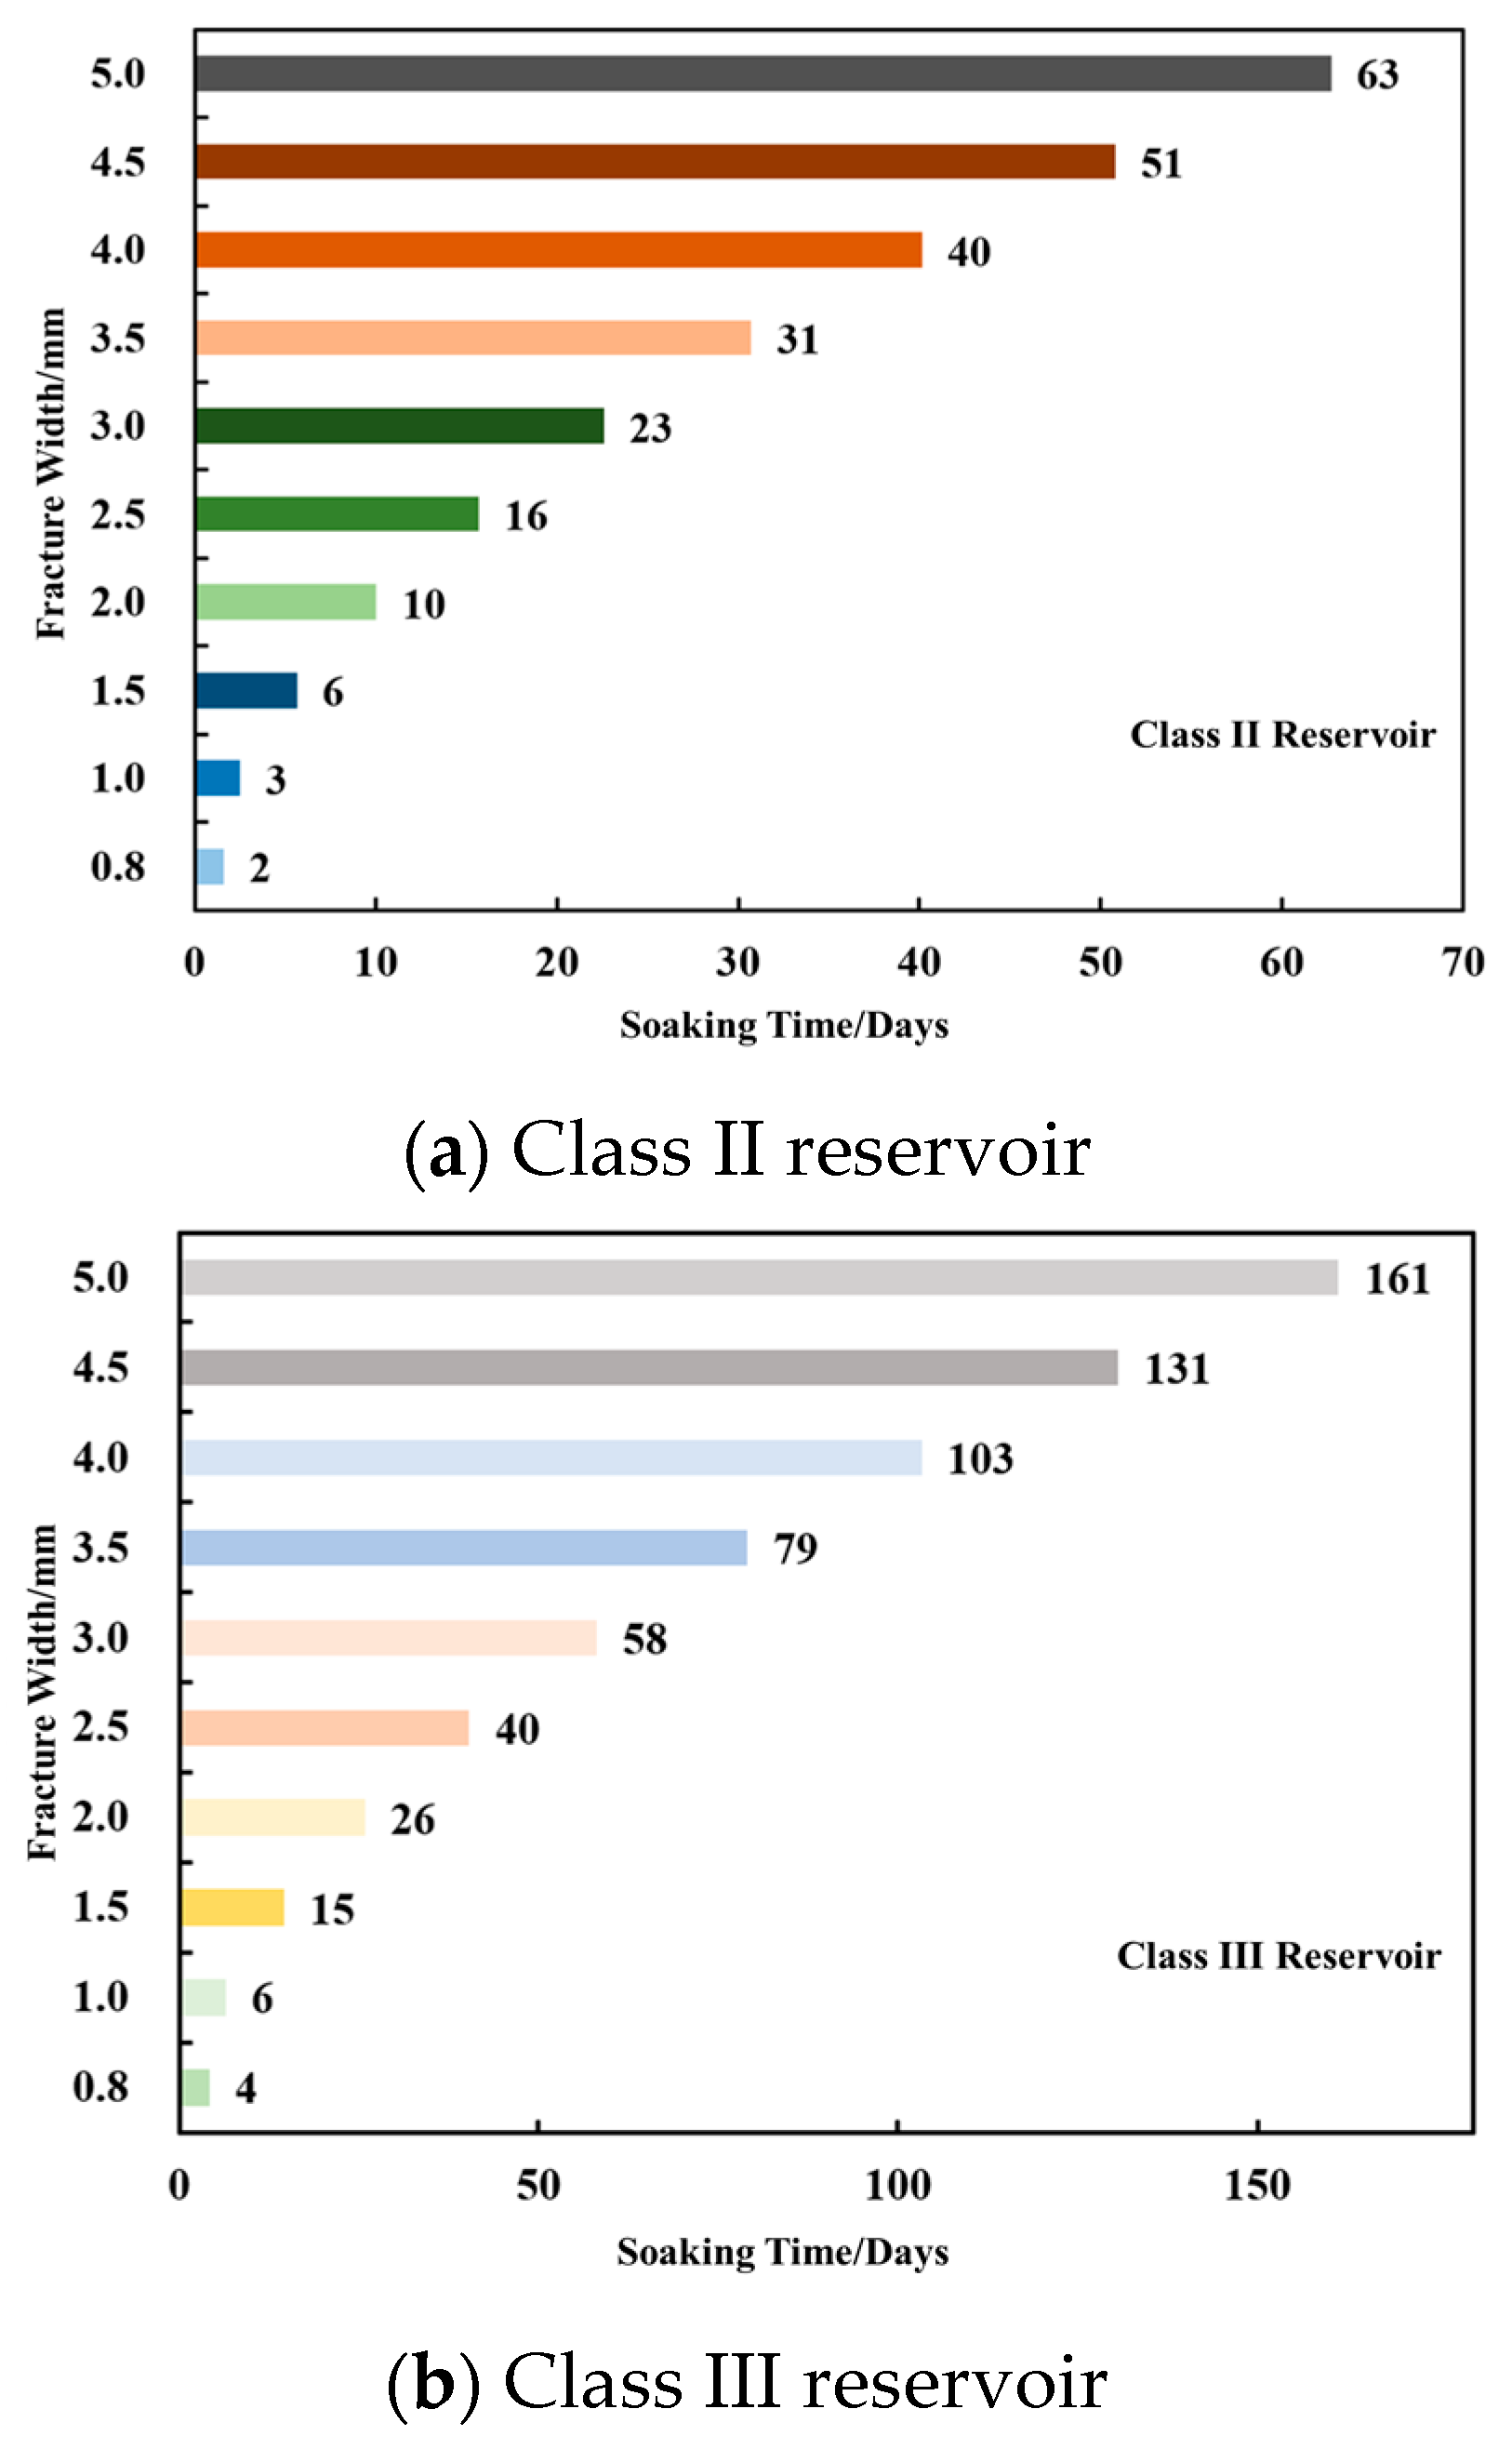
Substituting the above parameters into Equation (14) yields the optimal soaking time on field. As reservoir permeability and porosity decrease, the soaking time should increase; as fracture width increases, the soaking time should also increase. Soaking time for average fracture widths D ranging from 0.8 mm to 5 mm are calculated, as shown in Figure 14. However, the optimal well-soaking time requires further examination based on reservoir characteristics and site conditions.

4. Conclusions

(1)
In the upper sweet-spot core, small pores are the primary oil-bearing pores, while they are mesopores in the lower sweet-spot core. During fracturing fluid invasion and flowback, small pores in the upper sweet-spot core are the main oil-producing pores, followed by mesopores, with a Minimum Pore Production Radius (MPPR) of 0.0087 µm. While in the lower sweet-spot core, mesopores are the primary oil-producing pores, followed by micropores, with a MPPR of 0.024 µm.
(2)
As the invasion pressure increases, the maximum invasion depth increases. The upper sweet-spot core exhibits a maximum invasion depth of 1.46 cm and a final recovery rate of 34.45%, whereas the value is 1.77 cm and 40.49% for the lower sweet-spot core, respectively. With larger pore throats, the lower sweet-spot core achieves a maximum invasion depth and recovery rate approximately 1.2 times greater than those of the upper sweet-spot.
(3)
The total volume of fracturing fluid injected into the upper and lower sweet-spot core was 0.80 mL and 1.50 mL, with a flowback efficiency of 23.60% and 17.66%, respectively. Due to differences in the dominant oil-producing pore systems between the two cores, the upper sweet-spot exhibited lower total fracturing fluid invasion but a higher flowback efficiency than the lower sweet spot.
(4)
Due to lower permeability in the upper sweet-spot core, the imbibition recovery factor under high temperature and high pressure was higher than that in the upper sweet-spot. Ma’s model provided a good fit to the imbibition results. By equating Ma’s dimensionless time for core scale and reservoir scale, the optimized well-soaking time for different fracture widths was proposed.

Author Contributions

Writing—original draft, Y.Z. and Y.G.; methodology, Y.Z. and C.Y.; conceptualization, W.F. and C.Y.; formal analysis, Y.L.; writing—review and editing, X.W.; supervision, X.W.; data acquisition, M.L. All authors have read and agreed to the published version of the manuscript.

Funding

China National Petroleum Corporation Major Science and Technology Project “Research and Demonstration of Key Technologies for the Full Industrial Chain of Large-Scale Carbon Dioxide Capture, Enhanced Oil Recovery, and Storage” and Topic 3 “Research on Fine Characterization of CCUS Flooding Geological Bodies and Key Technologies for Reservoir Engineering” (2021ZZ01-03).

Data Availability Statement

The original contributions presented in this study are included in the article. Further inquiries can be directed to the corresponding author.

Conflicts of Interest

Author Yongqiang Zhang, Wei Fan, Chengwei Yang, Yao Lu and Mei Li were employed by Changqing Oilfield Company. The author Yuanyuan Gao was employed by Xinjiang Oilfield Company. The remaining authors declare that the research was conducted in the absence of any commercial or financial relationships that could be construed as a potential conflict of interest.

References

  1. Sun, X.; Hasheti, Y.; Yan, X.; Zheng, B.; Liu, B.; Zhang, J. Geological Characteristics and Distribution of Promising Areas for Tight Oil in the Luchaogou Formation of the Jimsar Depression. Sci. Technol. Eng. 2022, 22, 5134–5145. [Google Scholar] [CrossRef]
  2. Liu, Z.; Zeng, Z.; Tian, J.; Li, J.; Li, W.; Zhang, W.; Zhang, Z. Genesis and Distribution Prediction of the “Sweet-spot” in the Luchaogou Formation of the Permian System, Jimusar Depression. Lithol. Reserv. 2022, 34, 15–28. [Google Scholar] [CrossRef]
  3. Palisch, T.T.; Vincent, M.; Handren, P.J. Slickwater Fracturing: Food for Thought. In Proceedings of the Society of Petroleum Engineers Annual Technical Conference and Exhibition, Denver, CO, USA, 21 September 2008. [Google Scholar] [CrossRef]
  4. King, G.E. Thirty years of gas shale fracturing: What have we learned. In Proceedings of the SPE Annual Technical Conference and Exhibition, Florence, Italy, 19 September 2010. [Google Scholar] [CrossRef]
  5. Hou, X.; Zhang, X.; Zhou, J. Study on the effect of surfactant functions on invasion–flowback and interaction depth based on online computed tomography and numerical simulation. Phys. Fluids 2025, 37, 076617. [Google Scholar] [CrossRef]
  6. Agrawal, S.; Sharma, M.M. Liquid Loading Within Hydraulic Fractures And Its Impact on Unconventional Reservoir Productivity. In Proceedings of the SPE/AAPG/SEG Unconventional Resources Technology Conference, Denver, CO, USA, 12–14 August 2013. [Google Scholar] [CrossRef]
  7. Liu, N.; Liu, M.; Zhang, S. Post-Pressurization Backflow Patterns in Shale Gas Wells. Nat. Gas Ind. 2015, 35, 50–54. [Google Scholar] [CrossRef]
  8. Wang, M.; Zhang, S.; Guan, H.; Liu, Y.; Hui, G. Relationship between Characteristics of Tight Oil Reservoirs and Fracturing Fluid Damage: A Case Study of the Chang 7 Member of the Triassic Yanchang Formation in the Ordos Basin. Pet. Nat. Gas Geol. 2015, 36, 848–854. [Google Scholar] [CrossRef]
  9. Xia, H.; Han, K.; Song, W.; Yang, C.; Luo, F.; Yao, J. Study on the Micro-Scale Mechanism of Fracturing Fluid Retention in Multi-Scale Pores and Fractures of Shale Gas Reservoirs. Reserv. Eval. Dev. 2023, 13, 627–635+685. [Google Scholar] [CrossRef]
  10. Ren, K.; Ge, H.; Yang, L.; Wu, S.; Shen, Y. Shale Self-Suction Experiment and Its Application in Flow Reversal Analysis. Sci. Technol. Eng. 2015, 15, 106–109. [Google Scholar]
  11. Zhang, T.; Li, X.; Wang, Y.; Shi, J.; Yang, L.; Sun, Z.; Yang, J.; Zhang, Z. Influence of Shale Reservoir Properties on Fracturing Fluid Flowback Rate and Production Capacity. Nat. Gas Geosci. 2017, 28, 828–838. [Google Scholar]
  12. Ding, Y.; Lei, W.; Liu, X.; Qin, Z.; Liang, L.; Zhou, J.; Xiong, J. Experimental Study on the Correlation Among Self-Suction, Hydration Damage, and Ion Diffusion in Shale Gas Reservoirs. Pet. Drill. Technol. 2023, 51, 88–95. [Google Scholar]
  13. Yuan, X.; Xu, D.; Chen, S.; He, X.; Cheng, N.; Chen, J. Damage to Flow Conductivity in Shale Reservoirs Caused by Fracturing Fluid Invasion. Sci. Technol. Eng. 2020, 20, 3591–3597. [Google Scholar] [CrossRef]
  14. Shao, J.; You, L.; Jia, N.; Kang, Y.; Chen, M. Investigation of induced change in pore structure by the reaction of shale with fracturing fluid. Gas Sci. Eng. 2023, 110, 204860. [Google Scholar] [CrossRef]
  15. Jing, J.; Guo, B.; Wang, X.; Li, X. Improvement and Application of Pressure Drop Analysis Method for Small-Scale Fracturing in Tight Reservoirs. Xinjiang Pet. Geol. 2019, 40, 371–375. [Google Scholar]
  16. Qin, T. Practical Reservoir Engineering Methods; Petroleum Industry Press: Beijing, China, 1989. [Google Scholar]
  17. Ma, S.; Morrow, N.R.; Zhang, X. Generalized scaling of spontaneous imbibition data forstrongly water-wet systems. J. Pet. Sci. Eng. 1997, 18, 165–178. [Google Scholar]
  18. Pu, Y. Experimental Study on Static Suction Patterns in Dense Reservoirs. Master’s Thesis, China University of Petroleum, Beijing, China, 2017. Available online: https://kns.cnki.net/kcms2/article/abstract?v=ldCk9GscAdAQRUSKSCQyktGufRGbBV8CHmB9uWH8yDOALR4rPaT1IGOLTtlNBHFNDB1kFBfP9a1RPSBQFx-7fBVk7sxwMbpCjpjG8mn8QClCezBq9NtezLRY9fYtDkw06iTG8CPW2JN6H0XN_CRJaZvSJcdKRB1e3wLzFtV01lY=&uniplatform=NZKPT (accessed on 20 October 2025).
  19. An, X.; Wang, D.; Xiang, L.; Wang, Z.; Zhang, G. Cluster Analysis of Rock Pore Structure Characteristics in Tight Oil Reservoirs: A Case Study of the Luchaogou Formation Reservoir in the Jimsar Depression. Reserv. Eval. Dev. 2016, 6, 7–13. [Google Scholar] [CrossRef]
  20. Wang, F.; Ruan, Y.; Chen, Q.; Zhang, S. A Pressure Decline Model for Fracturing and Steaming Wells Considering Fluid Seepage and Oil Replacement Effects. Pet. Explor. Dev. 2021, 48, 1250–1257. [Google Scholar] [CrossRef]
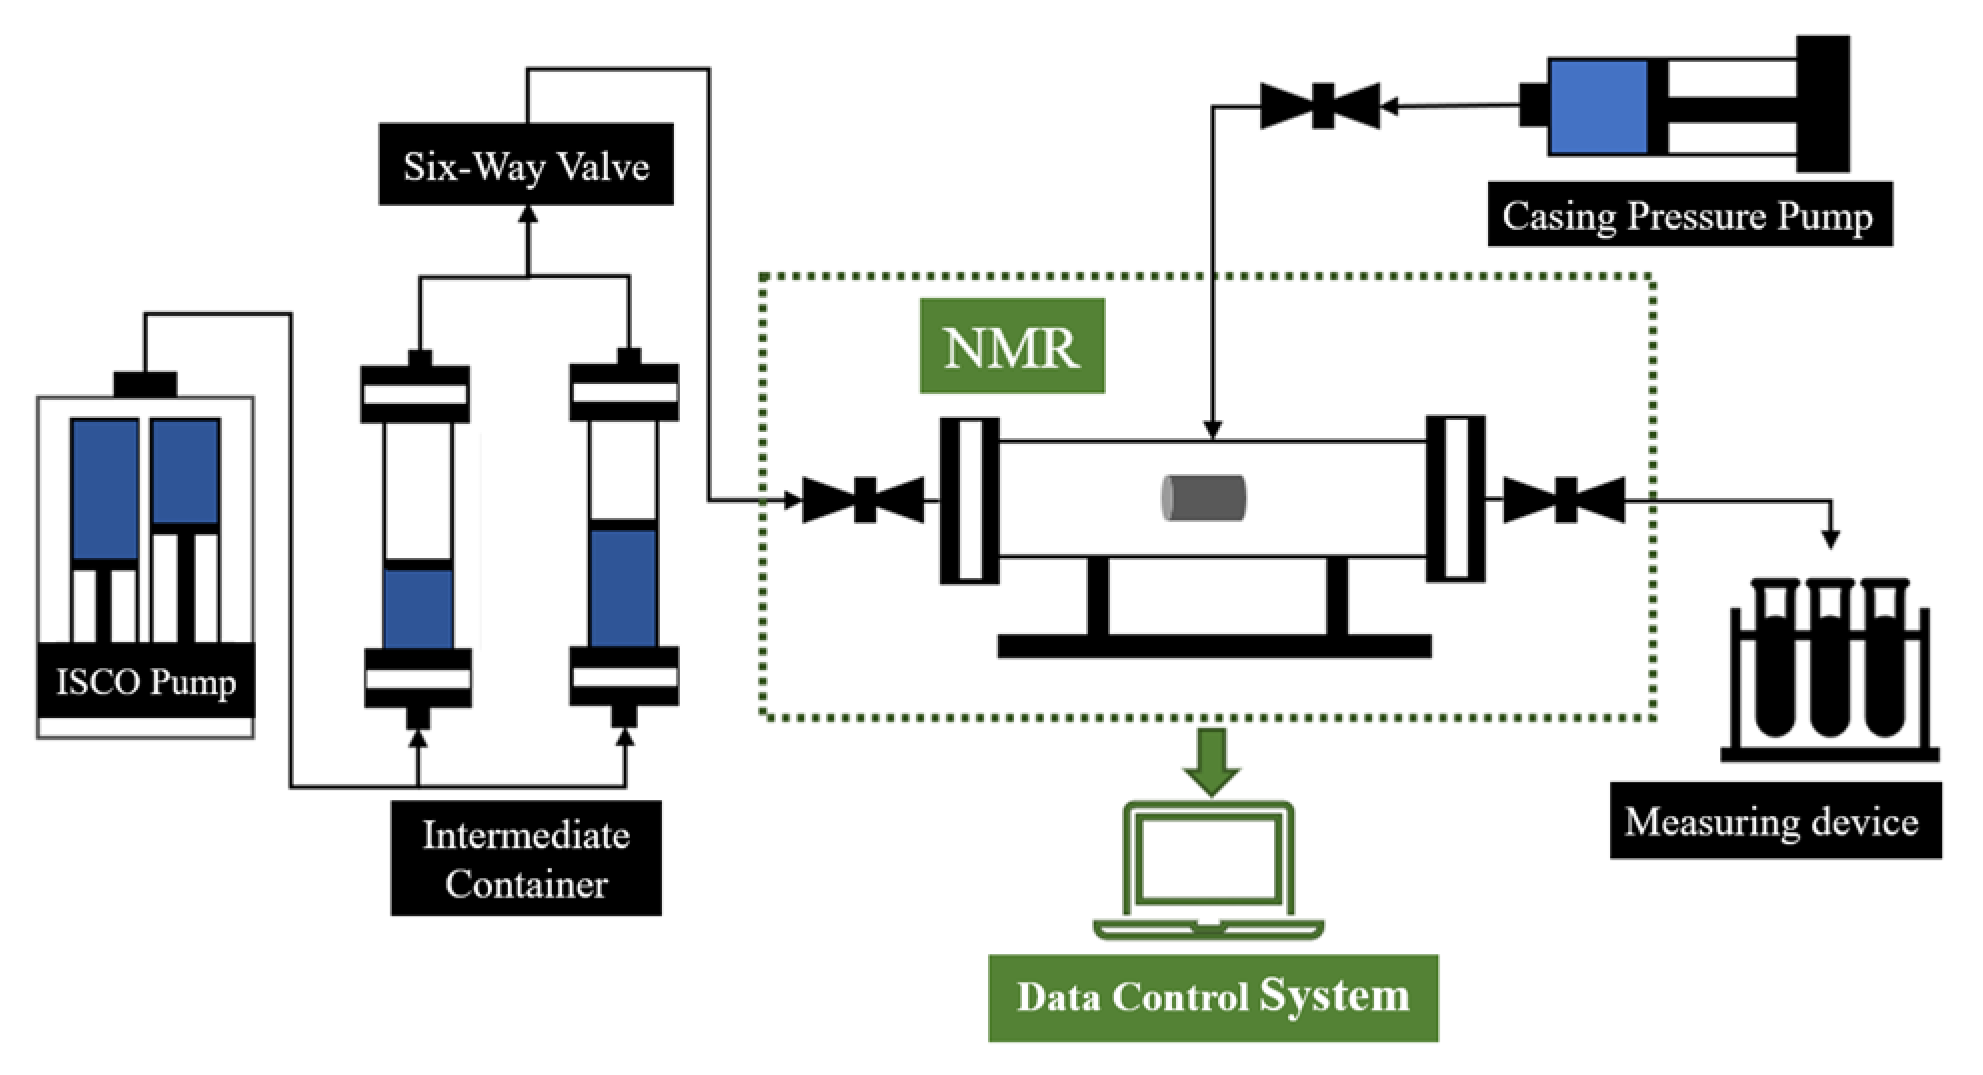
Figure 1. Experimental flowchart for online NMR monitoring of fracturing fluid invasion and flowback.
Processes 13 03780 g001
Figure 2. NMR T2 spectrum of Core 1# during fracturing fluid invasion and flowback.
Processes 13 03780 g002
Figure 3. Oil content variation in different pore types of Core 1#.
Processes 13 03780 g003
Figure 4. Recovery contribution of different pore types in Core 1#/%.
Processes 13 03780 g004
Figure 5. NMR T2 spectrum of Core 2# during fracturing fluid invasion and flowback.
Processes 13 03780 g005
Figure 6. Oil content variation in different pore types of Core 2#.
Processes 13 03780 g006
Figure 7. Recovery contribution of different pore types in Core 2#.
Processes 13 03780 g007
Figure 8. Images of fracturing fluid invasion and flowback in upper and lower sweet-spot core.
Processes 13 03780 g008
Figure 9. NMR T2 spectra of Core 3# at different imbibition times.
Processes 13 03780 g009
Figure 10. Imbibition recovery efficiency curves for different pore types in Core 3#.
Processes 13 03780 g010
Figure 11. NMR T2 spectra of Core 4# at different times.
Processes 13 03780 g011
Figure 12. Imbibition recovery efficiency curves for different pore types in Core 4#.
Processes 13 03780 g012
Figure 13. Ma’s model fits relative imbibition recovery factor curve.
Processes 13 03780 g013
Figure 14. Field soaking time with different fracture widths.
Processes 13 03780 g014
Table 1. Basic data for experimental cores.
CoreDiameter/cmLength/cmPorosity/%Permeability/(10−3 μm2)Experimental Protocol
1# (Upper sweet spot)2.4574.2659.350.018Fracturing Fluid Invasion and Flowback
2# (Lower sweet spot)2.5864.36714.260.032
3# (Upper sweet spot)2.4274.7497.470.01510 Mpa, 80 °C Imbibition
4# (Lower sweet spot)2.5074.91310.440.025
Table 2. Fracturing fluid invasion depth and recovery efficiency of Core 1# under a 20 MPa pressure differential.
Different StagesInvasion
20 MPa
Invasion
30 MPa
Soaking 5 hFlow
Back 20 MPa
Flow
Back 10 MPa
Recovery Rate/%3.646.769.6524.0834.45
Depth of Deployment/cm0.150.290.411.021.46
Table 3. Fracturing fluid invasion depth and recovery efficiency of Core 2# under a 20 MPa pressure differential.
Different StagesInvasion
20 MPa
Invasion
30 MPa
Soaking 5 hFlow
Back 20 MPa
Flow
Back 10 MPa
Recovery Rate/%5.288.2710.0330.0640.49
Depth of Deployment/cm0.230.360.441.311.77
Table 4. Fracturing fluid invasion/flowback volumes in upper and lower sweet-spot cores.
CoreInvasion Volume/mLOil Production Volume/mLFlowback Volume/mLFlowback Efficiency/%
1#0.800.610.1923.60
2#1.501.240.2717.66
Disclaimer/Publisher’s Note: The statements, opinions and data contained in all publications are solely those of the individual author(s) and contributor(s) and not of MDPI and/or the editor(s). MDPI and/or the editor(s) disclaim responsibility for any injury to people or property resulting from any ideas, methods, instructions or products referred to in the content.