Active–Reactive Coordination Optimal Dispatch of Active Distribution Network Considering Grid Balance Degree
Abstract
1. Introduction
2. Multidimensional GBD Indicator System
2.1. Power Flow Dimension GBD
2.1.1. Power Flow Entropy
2.1.2. Heavy Load Rate
2.1.3. Average Load Factor
2.1.4. Standard Deviation of Load Factor
2.2. Voltage Dimension GBD
2.2.1. Peak-to-Valley Voltage Ratio
2.2.2. Maximum Voltage Deviation Ratio
2.2.3. Voltage Fluctuation Ratio
2.3. Structure Dimension GBD
2.4. Analysis of Dispatch Methods Used to Improve GBD
- (a)
- Optimal Dispatch Objective Function: The objective function incorporates a load factor penalty term. By setting heavy load factor penalty, it reduces the number of heavily loaded lines, thereby achieving a more balanced distribution of power flow across the ADN.
- (b)
- Optimized Scheduling Constraints: This refers to adjusting (reducing) the upper and lower limits of voltage within the optimized scheduling constraints to ensure node voltages remain near their rated values and are more evenly distributed.
- (c)
- Grid Reconfiguration: From a structural perspective, altering the operational configuration of the power grid by changing switch states (closing or opening loops) to optimize power flow distribution and voltage levels.
3. Indicator System for Pre-Assessment of ADN Operational Status
4. Active and Reactive Power Optimal Dispatch Considering GBD
4.1. Objective Function
4.2. Constraints
4.2.1. DR Resource Constraints
- (1)
- Price-Based DR
- (i)
- CL Feature Modeling
- (ii)
- SL Feature Modeling
- (2)
- Incentive-Based DR Constraints
4.2.2. Controllable Distributed Generation
4.2.3. ESS
4.2.4. Distributed Generation (DG) Model
4.2.5. CB
4.2.6. SVC
4.2.7. Operational Safety Constraints for ADNs
- (1)
- Node voltage constraint
- (2)
- Transmission power constraintwhere and represent the upper and lower limits of the bus voltage for node , respectively, while and denote the transmission power and rated power of branch .
4.3. Approach to Solving the Scheduling Model Based on Second-Order Cone Relaxation
4.3.1. Branch Flow Model
4.3.2. Convex Relaxation Model
4.3.3. The Solution Process
- (1)
- Model construction and constraint refinement: For the day-ahead forecast data of wind, solar, and load, employ scenario generation to convert the random and uncertain generation and load forecast models into deterministic scenarios for a solution, thereby transforming them into deterministic power data; define the active and reactive power coordination optimal objective function (including GBD and economic efficiency indicators). Identify all constraints, including distribution network power flow constraints, equipment operation constraints (e.g., adjustment range of ESS charging/discharging), voltage upper/lower limit constraints, and load factor constraints, to form a complete non-convex optimal model.
- (2)
- Second-order cone relaxation conversion: For non-convex terms in distribution network power flow equations (e.g., nonlinear relationships between node power/voltage and line impedance), employ second-order cone relaxation to convexify these constraints. This converts non-convex constraints into second-order cone constraints solvable using Gurobi, eliminating computational difficulties caused by nonlinearity while ensuring relaxation error remains within acceptable limits.
- (3)
- Model Standardization and Parameter Configuration: Standardize the transformed second-order cone programming model by defining decision variables (including power generation output, reactive power compensation, DR adjustment, node voltage, etc. for each time period), specifying variable types (continuous/discrete) and their valid ranges; configure Gurobi solver parameters, including accuracy thresholds, solver methods (default interior-point method), and constraint tolerances, to match model scale and computational efficiency requirements.
- (4)
- Invoke Gurobi Solver: Import the standardized model into the Gurobi solver and utilize the solver’s built-in algorithms to perform numerical optimization of the second-order cone programming model. Output the optimal values for decision variables (e.g., reactive power compensation device outputs) and the optimal value of the objective function (e.g., operating costs).
5. Case Study Analysis
5.1. Case Configuration
5.2. Generation and Analysis of Source Load Operation Scenarios Considering Uncertainty
5.3. Comparison of Scheduling Results for Different Strategies
5.3.1. Analysis of Assessment Results for the Pre-Assessment Indicator System
- (1)
- Analysis of GBD Indicators in Power Flow and Voltage Dimensions
- (2)
- Economic Comparison
5.3.2. Analysis of Measures to Improve GBD
- (1)
- Load Factor Penalty Threshold Sensitivity Analysis
- (2)
- Setting Voltage Upper and Lower Limits in Constraints
- (3)
- Network Reconfiguration
5.3.3. Optimal Strategy Validation and Comparison
6. Conclusions
- (1)
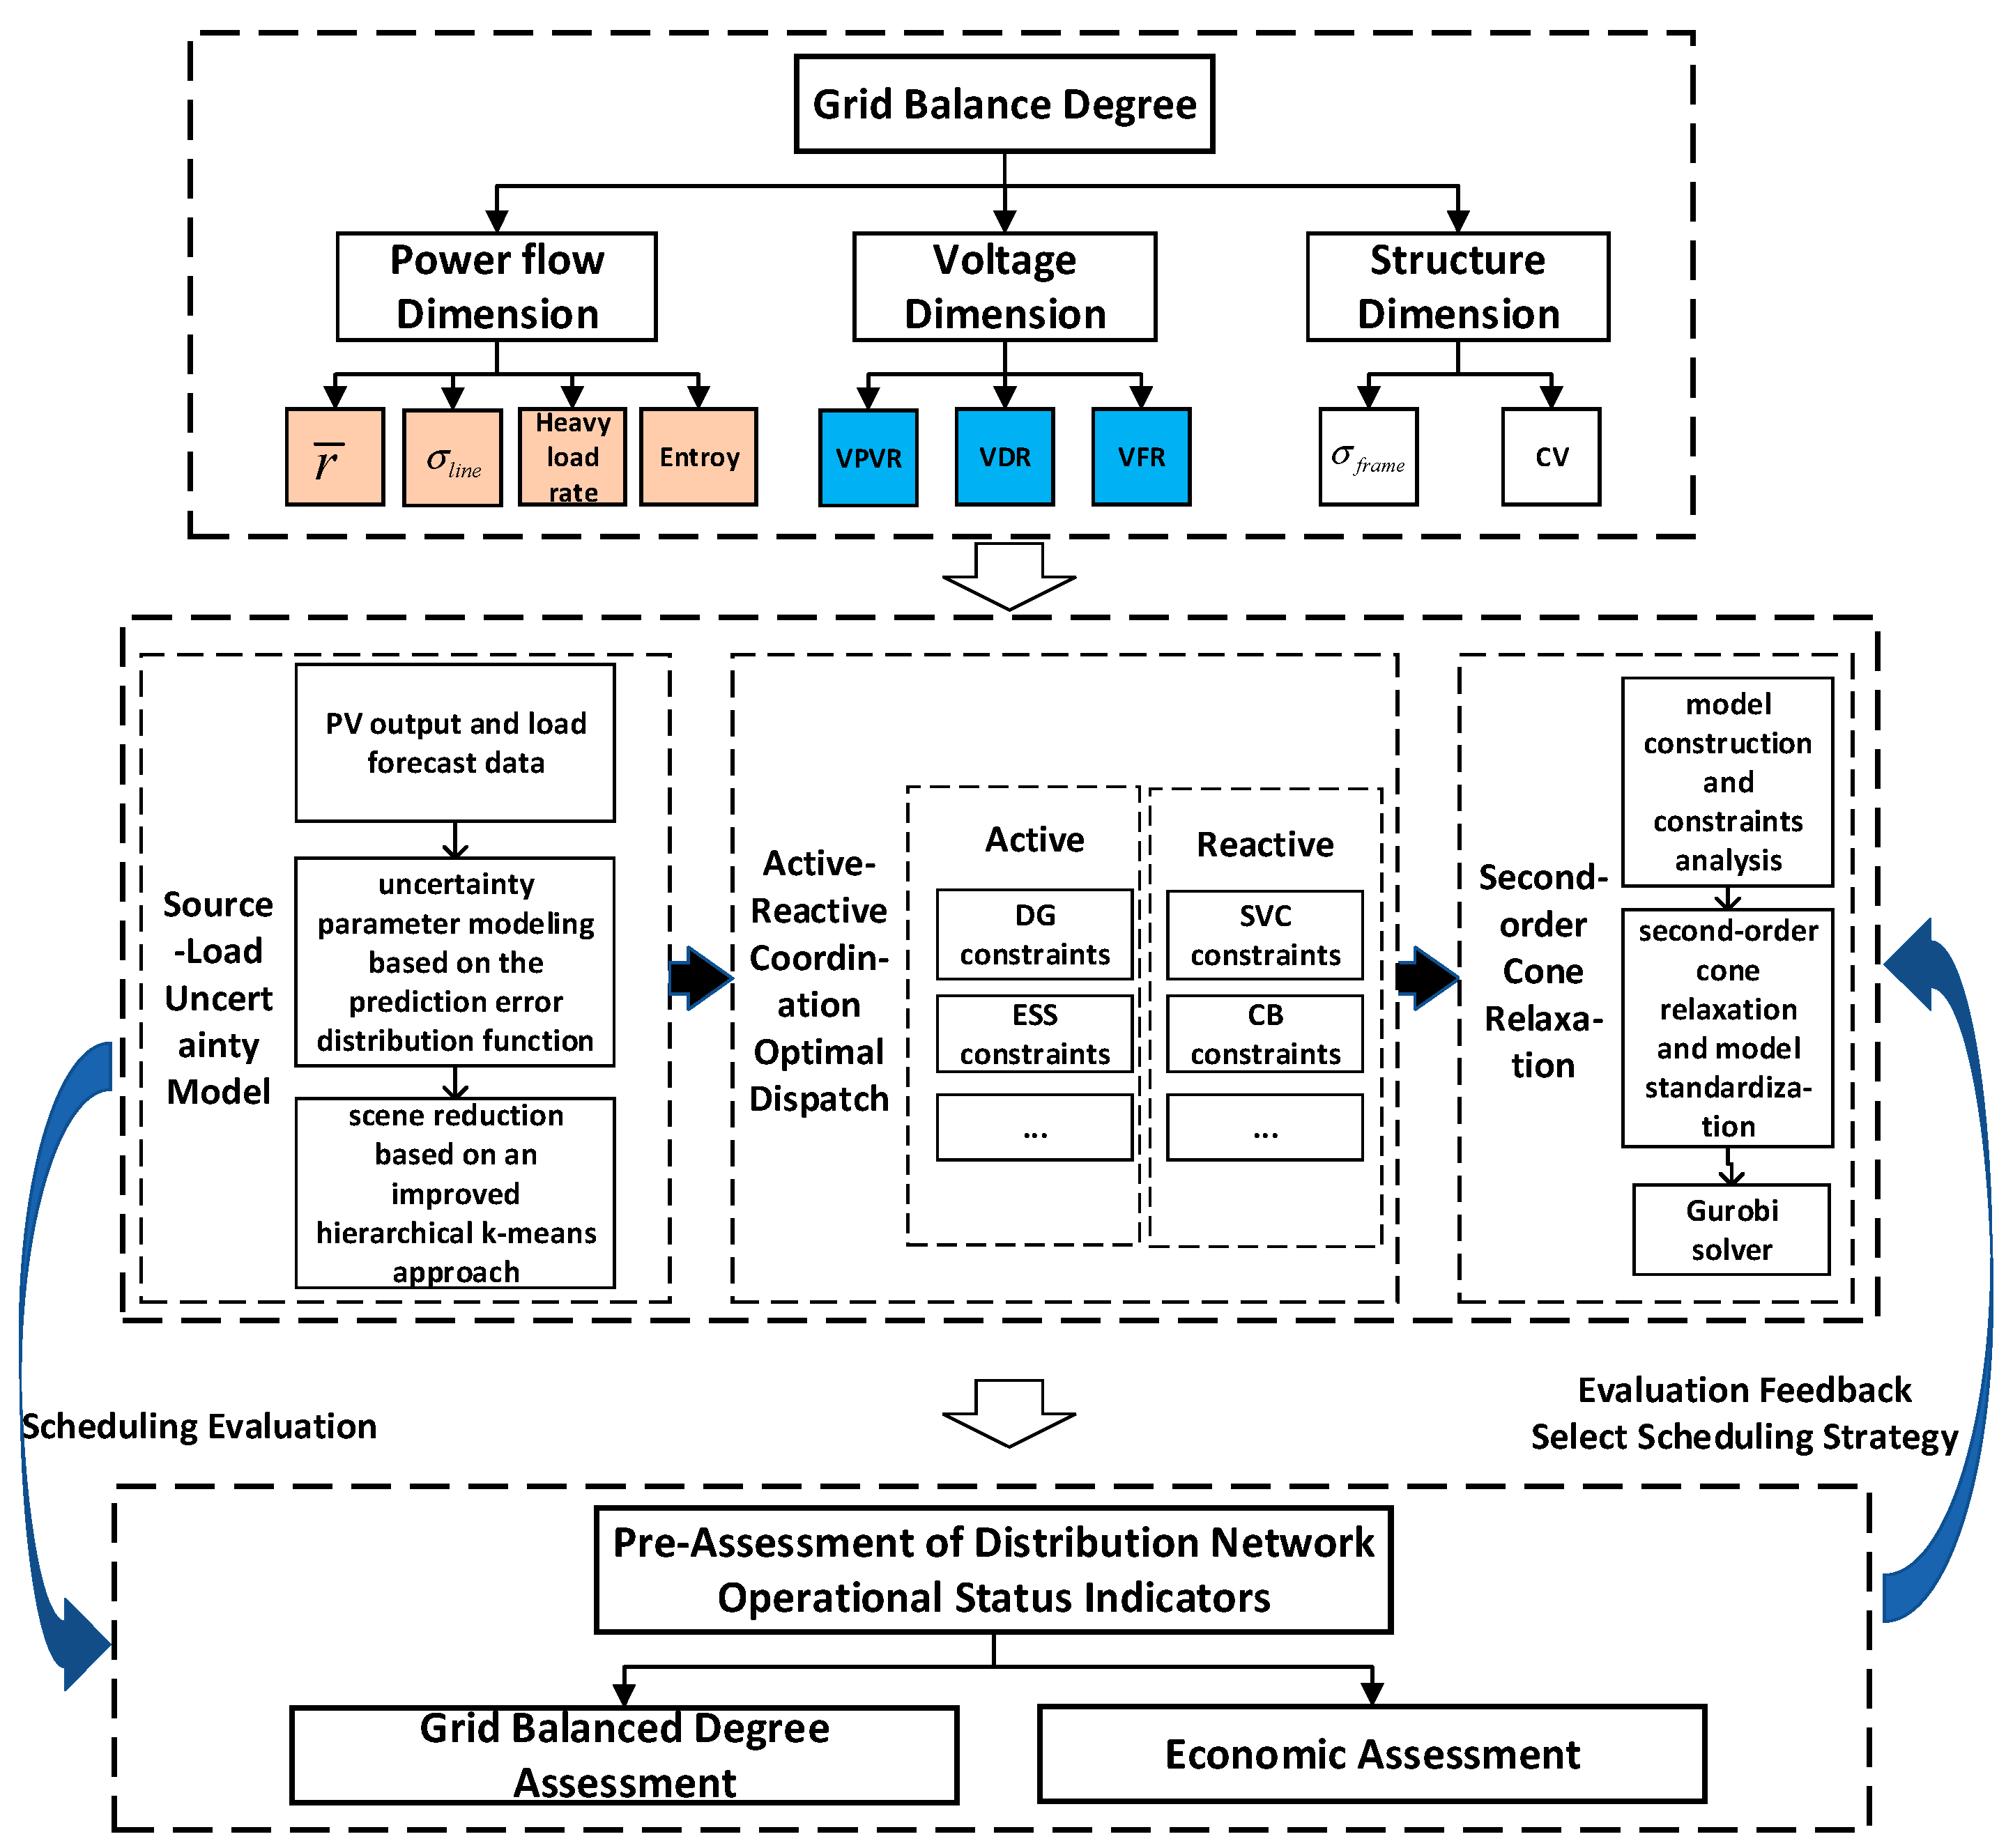
- GBD is defined through three key dimensions: power flow (power flow entropy, heavy load factor, average load factor, and line load factor standard deviation), voltage (peak-to-valley voltage difference, maximum voltage deviation rate, and voltage fluctuation rate), and network structure (degree standard deviation and coefficient of variation), comprehensively reflecting grid operational reliability. Combining GBD and economic indicators, we propose a pre-assessment indicator system for ADN operation. This system visually displays the operational status and control costs of ADNs with varying GBD levels based on dispatch plans, addressing the current lack of specialized pre-assessment indicators tailored for dispatch planning that effectively demonstrate dispatch effects.
- (2)
- A coordinated active/reactive power optimal dispatch strategy incorporating GBD is proposed. Including load factor penalties in dispatch objectives, it guides balanced power flow distribution across lines, prevents heavy line load or overloading, and enhances GBD in the power flow dimension. Adjusting the voltage upper/lower limits modifies GBD in the voltage dimension. Network restructuring can adjust GBD at the structure level. Integrating reactive power compensation devices, ESS, and DR resources enhances GBD and the operational reliability of ADN; delays equipment aging; and extends the equipment lifespan. Combining the dispatch method with operational state pre-assessment indicators quantifies the costs and benefits of high-quality grid operation, enabling dispatchers to select scheduling schemes with varying reliability levels.
- (3)
- Based on the scheduling results of IEEE 33-node and 69-node systems, this study effectively validates the effectiveness of the GBD optimal strategy and its adaptability to larger-scale, more complex systems. Case studies demonstrate that the proposed method enhances system security and stability with a modest increase in operational costs, achieving comprehensive benefits including power flow balance, voltage stability, and reduced network losses. This demonstrates the core value and application potential of GBD as an optimal objective.
7. Limitations and Future Work
- (1)
- The validation scenarios focus on the IEEE standard node system. The sensitivity analysis and selection of relevant parameter thresholds require further verification and adaptation based on the specific engineering implementation scenarios of the scheduling strategy.
- (2)
- The DR modeling does not account for response deviations, user participation willingness, and satisfaction constraints in real-world scenarios. It assumes perfect response capability and availability, which differs from engineering practice. Subsequent research will consider these factors.
Author Contributions
Funding
Data Availability Statement
Conflicts of Interest
References
- Sun, D.Y.; Geng, J.; Yang, S.C.; Zhang, L.Z.; Yang, J.C. Challenges of coordinated and optimized operation of coal power and new energy and other diversified resources in new power system. Power Syst. Technol. 2024, 48, 3105–3113. [Google Scholar] [CrossRef]
- Huang, Z.; Zhang, Y.; Xie, S. Data-Adaptive Robust Coordinated Optimization of Dynamic Active and Reactive Power Flow in Active Distribution Networks. Renew. Energy 2022, 188, 164–183. [Google Scholar] [CrossRef]
- Agajie, T.F.; Ali, A.; Fopah-Lele, A.; Amoussou, I.; Khan, B.; Velasco, C.L.R.; Tanyi, E. A Comprehensive Review on Techno-Economic Analysis and Optimal Sizing of Hybrid Renewable Energy Sources with Energy Storage Systems. Energies 2023, 16, 642. [Google Scholar] [CrossRef]
- Guo, Z.W.; Wang, Z.J.; Huang, C.; Jiang, Y.C. A distribution network clustering method considering source-load-storage power coordination and uncertainty. Power Syst. Technol. 2024, 1–13. [Google Scholar] [CrossRef]
- Wang, Y.; Qiu, D.; Strbac, G.; Gao, Z. Coordinated Electric Vehicle Active and Reactive Power Control for Active Distribution Networks. IEEE Trans. Ind. Inform. 2023, 19, 1611–1622. [Google Scholar] [CrossRef]
- Wu, D.; Wang, Y.C.; Yu, C.L.; Liu, C.Y.; Lin, Z.Z.; Yang, L. Demand response potential assessment method of industrial users based on Gaussian process regression. Electr. Power Autom. Equip. 2022, 42, 94–101. [Google Scholar] [CrossRef]
- Huang, L.P.; Wang, Y.F.; Guo, J.T.; Xu, G.L.; Di, F.T. Economic dispatch for disaster prevention considering load rate homogeneity of power grid and N-1 security constraints. Autom. Electr. Power Syst. 2020, 44, 56–63. Available online: https://link.cnki.net/urlid/32.1180.TP.20200511.1723.024 (accessed on 9 November 2025).
- Wu, Y.W.; Cai, Z.Q.; Lou, S.H.; Lu, S.Y. Transmission network expansion planning model considering network load balance. J. Huazhong Univ. Sci. Technol. Nat. Sci. Ed. 2013, 41, 96–100. [Google Scholar] [CrossRef]
- Gu, G.R.; Yang, P.; Tang, B.; Wang, D.; Lai, X. A method for improving the balance ability of distribution networks through source-load-storage collaborative optimization. Proc. CSEE 2024, 44, 5097–5109. [Google Scholar] [CrossRef]
- Yang, Q.; Wang, J.X.; Li, X.X.; Liu, H.C. Bi-level Transmission Expansion Planning Model Considering Planning-operation Coordination of Line Load Rate Indices. Power Syst. Technol. 2024, 48, 1846–1854. [Google Scholar] [CrossRef]
- Gao, J.; Chen, J.J.; Qi, B.X.; Zhao, Y.L.; Peng, K.; Zhang, X.H. A Cost-Effective Two-Stage Optimization Model for Microgrid Planning and Scheduling with Compressed Air Energy Storage and Preventive Maintenance. Int. J. Electr. Power Energy Syst. 2021, 125, 106547. [Google Scholar] [CrossRef]
- Sun, X.; Qiu, J.; Yi, Y.; Tao, Y. Cost-Effective Coordinated Voltage Control in Active Distribution Networks with Photovoltaics and Mobile Energy Storage Systems. IEEE Trans. Sustain. Energy 2022, 13, 501–513. [Google Scholar] [CrossRef]
- Ji, H.L.; Xu, L.; Yang, J.H.; Dou, C.X. Active Reactive Power Optimization of Active Distribution Network Considering Dynamic Wind and Solar Uncertainty and Demand Response. Electr. Power 2025, 1–16. Available online: https://link.cnki.net/urlid/11.3265.tm.20250715.0949.002 (accessed on 9 November 2025).
- Oladeji, I.; Makolo, P.; Abdillah, M.; Shi, J.; Zamora, R. Security Impacts Assessment of Active Distribution Network on the Modern Grid Operation—A Review. Electronics 2021, 10, 2040. [Google Scholar] [CrossRef]
- Feng, T.T.; Dai, H.; Ding, L.; Xiao, X.; He, J. Assessment model of distribution network operation state based on multi-level fuzzy comprehensive assessment method. Electr. Eng. 2022, 12, 160–163. [Google Scholar] [CrossRef]
- Weng, G.Q.; Shu, J.P.; Xie, F.R.; Gong, Y.G.; Zhang, Y.B. Situation assessment of operating state for active distribution network based on combination weight and attribute interval method. Chin. High Technol. Lett. 2020, 30, 1149–1160. Available online: https://kns.cnki.net/kcms2/article/abstract?v=0eC8MkjONMENUaGDXJDbct58rPDZQjUyOwAot734Na07oVQtTyEXvYRMirfAFLDjbrL3PgZ3gLhaKKZgaIQ5-IVphRIVuHSw6Td_fEydPgwFzgyReCHPZyVU_2eMWM71hf-4sBdp6JiaoxutDvyssqCmClOTBTcjWB4MGKTQd2ylymDEn8b69g==&uniplatform=NZKPT&language=CHS (accessed on 9 November 2025).
- Li, M.C.; Mei, W.M.; Liu, Y.Q.; Zhang, L.K.; Song, D.W.; Zhao, C. Accurate identification method of brittle branches in power grid based on improved load flow entropy indexes. Power Syst. Technol. 2019, 43, 1026–1033. [Google Scholar] [CrossRef]
- Xu, H.; Chang, Y.; Zhao, Y.; Wang, F. A New Multi-Timescale Optimal Scheduling Model Considering Wind Power Uncertainty and Demand Response. Int. J. Electr. Power Energy Syst. 2023, 147, 108832. [Google Scholar] [CrossRef]
- Lin, Z.; Hu, Z.C.; Song, Y.H. Convex relaxation for optimal power flow problem: A recent review. Proc. CSEE 2019, 39, 3717–3728. [Google Scholar] [CrossRef]
- Zhang, Z.; Wang, C.; Lv, H.; Liu, F.; Sheng, H.; Yang, M. Day-Ahead Optimal Dispatch for Integrated Energy System Considering Power-to-Gas and Dynamic Pipeline Networks. IEEE Trans. Ind. Appl. 2021, 57, 3317–3328. [Google Scholar] [CrossRef]

| Off-Peak Hours | Peak Hours | Regular Hours | |
|---|---|---|---|
| Off-peak hours | −0.1 | 0.012 | 0.01 |
| Peak hours | 0.012 | −0.1 | 0.016 |
| Regular hours | 0.01 | 0.016 | −0.1 |
| Peak-Valley Type | Electricity Rates (CNY/kW·h) | Time Period |
|---|---|---|
| Off-peak hours | 0.35 | 1–7 |
| Peak hours | 0.68 | 8–9, 13–19, 23–24 |
| Regular hours | 1.09 | 10–12, 20–22 |
| Parameters | Value | Parameters | Value |
|---|---|---|---|
| Electricity Purchase Cost Factor | 0.78 () | IDR Call Cost | 10 () |
| Cost of Controllable Distributed Generation | 3 () | SL Call Cost | 3 () |
| ESS Operating Costs | 0.53 () | CL Call Cost | 5 () |
| ESS Loss Cost | 0.05 () | Load Factor Penalty Coefficient | 1000 |
| DG Cost Factor | 0.5 () | CB Cost | 1 () |
| Network Loss Cost Factor | 0.6 () | SVC Cost | 1 () |
| Parameters | Value | Parameters | Value |
|---|---|---|---|
| () | 0 | () | −800 |
| () | 4000 | 0.9 | |
| () | 3600 | 0.95 | |
| () | 0 | 0.1 | |
| () | 3000 | 0.9 | |
| 0.9 | () | 4000 | |
| (kVar) | −3000 | (kVar) | 300 |
| (kVar) | 3000 | 6 | |
| (kW) | 800 | 3 |
| Typical Scenarios | p | Typical Scenarios | p |
|---|---|---|---|
| 1 | 0.001 | 4 | 0.386 |
| 2 | 0.012 | 5 | 0.512 |
| 3 | 0.034 | 6 | 0.055 |
| Scenario | Entropy | Heavy Load Rate | VDR | VPVR | VFR | Ploss /kW | /CNY | ||
|---|---|---|---|---|---|---|---|---|---|
| 1 | 1.24 | 0.51 | 0.82 | 0.489 | 0.18 | 0.115 | 0.068 | 30,644 | 342,865 |
| 2 | 1.13 | 0.39 | 0.68 | 0.311 | 0.10 | 0.056 | 0.038 | 19,843 | 399,760 |
| 3 | 0.87 | 0.23 | 0.55 | 0.201 | 0.05 | 0.046 | 0.017 | 12,990 | 607,257 |
| 4 | 0.82 | 0.19 | 0.53 | 0.182 | 0.05 | 0.044 | 0.016 | 12,639 | 610,688 |
| Scenario | ||||||
|---|---|---|---|---|---|---|
| 1 | 181,414 | 92,170 | 835 | 50,059 | 0 | 0 |
| 2 | 168,267 | 110,331 | 835 | 50,060 | 58,361 | 0 |
| 3 | 147,894 | 165,654 | 835 | 46,278 | 148,586 | 90,215 |
| 4 | 150,451 | 168,699 | 835 | 43,951 | 148,849 | 90,321 |
| Scenario | Entropy | Heavy Load Rate | CV | VDR | VPVR | VFR | Ploss /kW | /CNY | |||
|---|---|---|---|---|---|---|---|---|---|---|---|
| 4 | 0.82 | 0.19 | 0.53 | 0.182 | 0.496 | 0.256 | 0.05 | 0.044 | 0.016 | 12,639 | 610,688 |
| 5 | 0.85 | 0.21 | 0.53 | 0.186 | 0.496 | 0.256 | 0.05 | 0.048 | 0.016 | 12,774 | 609,493 |
| 6 | 0.86 | 0.22 | 0.54 | 0.190 | 0.496 | 0.256 | 0.05 | 0.047 | 0.016 | 12,856 | 609,268 |
| 7 | 0.86 | 0.23 | 0.54 | 0.192 | 0.496 | 0.256 | 0.05 | 0.047 | 0.016 | 12,925 | 608,529 |
| 8 | 0.86 | 0.23 | 0.55 | 0.195 | 0.496 | 0.256 | 0.05 | 0.048 | 0.017 | 12,958 | 607,981 |
| 9 | 0.87 | 0.23 | 0.55 | 0.198 | 0.496 | 0.256 | 0.05 | 0.048 | 0.017 | 13,002 | 607,973 |
| 10 | 0.77 | 0.17 | 0.53 | 0.176 | 0.496 | 0.256 | 0.07 | 0.070 | 0.025 | 13,409 | 536,321 |
| 11 | 0.98 | 0.22 | 0.51 | 0.217 | 0.496 | 0.256 | 0.03 | 0.042 | 0.012 | 12,872 | 764,723 |
| 12 | 0.82 | 0.19 | 0.53 | 0.182 | 0.496 | 0.256 | 0.05 | 0.042 | 0.016 | 12,641 | 609,149 |
| 13 | 0.76 | 0.15 | 0.53 | 0.182 | 0.496 | 0.256 | 0.05 | 0.045 | 0.016 | 12,620 | 611,019 |
| 14 | 0.79 | 0.16 | 0.52 | 0.194 | 0.415 | 0.196 | 0.05 | 0.024 | 0.014 | 11,878 | 551,136 |
| Scenario | Entropy | Heavy Load Rate | VDR | VPVR | VFR | Ploss /kW | /CNY | ||
|---|---|---|---|---|---|---|---|---|---|
| 1 | 0.84 | 0.46 | 0.66 | 0.189 | 0.10 | 0.111 | 0.039 | 21,659 | 515,709 |
| 2 | 0.76 | 0.27 | 0.60 | 0.168 | 0.10 | 0.104 | 0.034 | 15,921 | 577,857 |
| 3 | 0.95 | 0.40 | 0.64 | 0.213 | 0.10 | 0.104 | 0.032 | 18,452 | 537,405 |
Disclaimer/Publisher’s Note: The statements, opinions and data contained in all publications are solely those of the individual author(s) and contributor(s) and not of MDPI and/or the editor(s). MDPI and/or the editor(s) disclaim responsibility for any injury to people or property resulting from any ideas, methods, instructions or products referred to in the content. |
© 2025 by the authors. Licensee MDPI, Basel, Switzerland. This article is an open access article distributed under the terms and conditions of the Creative Commons Attribution (CC BY) license (https://creativecommons.org/licenses/by/4.0/).
Share and Cite
Yang, X.; Zhou, F.; Xu, R.; Wang, Y.; Zhang, J. Active–Reactive Coordination Optimal Dispatch of Active Distribution Network Considering Grid Balance Degree. Processes 2025, 13, 3724. https://doi.org/10.3390/pr13113724
Yang X, Zhou F, Xu R, Wang Y, Zhang J. Active–Reactive Coordination Optimal Dispatch of Active Distribution Network Considering Grid Balance Degree. Processes. 2025; 13(11):3724. https://doi.org/10.3390/pr13113724
Chicago/Turabian StyleYang, Xin, Fan Zhou, Ran Xu, Yongjie Wang, and Jingjing Zhang. 2025. "Active–Reactive Coordination Optimal Dispatch of Active Distribution Network Considering Grid Balance Degree" Processes 13, no. 11: 3724. https://doi.org/10.3390/pr13113724
APA StyleYang, X., Zhou, F., Xu, R., Wang, Y., & Zhang, J. (2025). Active–Reactive Coordination Optimal Dispatch of Active Distribution Network Considering Grid Balance Degree. Processes, 13(11), 3724. https://doi.org/10.3390/pr13113724


