Article

Two-Phase Stefan Problem for the Modeling of Particle Solidification in a Urea Prilling Tower

1
Vietnam National University Ho Chi Minh City, Vo Trường Toan Str., Linh Xuan Ward, Ho Chi Minh City 71308, Vietnam
2
Faculty of Chemical Engineering, Ho Chi Minh City University of Technology (HCMUT), 268 Ly Thuong Kiet Str., Dien Hong Ward, Ho Chi Minh City 72506, Vietnam
3
Faculty of Applied Science, Ho Chi Minh City University of Technology (HCMUT), 268 Ly Thuong Kiet Str., Dien Hong Ward, Ho Chi Minh City 72506, Vietnam
*
Author to whom correspondence should be addressed.
Processes 2025, 13(11), 3717; https://doi.org/10.3390/pr13113717
Submission received: 10 October 2025 / Revised: 13 November 2025 / Accepted: 14 November 2025 / Published: 18 November 2025

Abstract

Urea production plays a crucial part in the worldwide agricultural economy, providing a primary supply of nitrogen for fertilizers. For storage and transport, urea is synthesized in granular form, and the prilling technology is frequently employed. In this technique, the hot liquid feed passes through an atomizer to produce small droplets, which then fall along the high tower. During the falling process, the liquid droplets gradually become solid because the internal energy is removed by the cooling air, which flows upward from the bottom. Typically, three consecutive thermal phases are analyzed for the solidification process: the liquid droplet cooling, solidification when the surface reaches freezing point, and the solid particle cooling. In this paper, the temperature distribution across the radius of the urea particles was analyzed using a heat transfer equation, which is considered a two-phase Stefan problem. The system of partial differential equations is solved numerically using the finite difference method and the enthalpy method. The temperature of the cooling air at various heights of the tower and the degree of solidification of different particle sizes were estimated and compared with data obtained from the urea factory to assess their reliability. The validation demonstrated a strong correlation between the model estimates and the real plant observations.

1. Introduction

Urea manufacturing plays a critical role in the global agricultural sector, serving as a primary source of nitrogen for fertilizers [1]. As the world’s population continues to grow, the demand for food production intensifies, making urea essential for enhancing crop yields and ensuring food security [2]. Additionally, urea’s versatility extends beyond agriculture; it is used in various industrial applications, including the production of resins and plastics [3]. Urea is usually available in the market in solid particle form to minimize losses during transportation and storage rather than in powder form. Therefore, making solid urea particles, which occurs at the final stage of urea manufacturing, plays an important role in the process.
The formation of granular urea from melting is frequently accomplished by granulation or prilling technology. In the prilling process, the primary steps involve spraying molten liquid from the top of a tall tower, and the generated droplets fall due to their initial velocity and gravity. At the same time, cool air is collected from the bottom of the tower and blows counter to the particle flow. During the falling process, the particle gradually becomes solid due to the heat removal by the cooling air. The technique has the benefits of low operational cost and producing particles with a relatively homogeneous shape and size [4].
Although the prilling process has the advantage of a high degree of self-control, the prilling tower still has some operational issues. Among them, the particles do not solidify completely at the bottom of the tower is a common problem. The inefficient solidification will result in a low-quality structure of the particles, causing poor mechanical properties, losing productivity, and thus decreasing profits. Modeling plays a crucial role in chemical industry processes, helping engineers precisely predict the behavior of the operation; therefore, better design, control, safety operation, and optimization can be achieved. Thus, there have been many studies focusing on the modeling of a prilling tower throughout the literature. One of the first studies might be the work of Bakhtin et al. [5]. In this work, the thermodynamics of the urea droplets includes three consecutive stages, and the temperature of the droplet is assumed to be uniform within the particles. Similarly, for designing the new prilling tower, Wu et al. [6] also used a lumped assumption to describe the temperature inside urea particles, and a simple shrinking core model to present the decrease of the radius of the liquid phase. In the report of Ricardo et al. [7], a 3D multiphase flow is employed to deal with the hydrodynamics of the particle flow in a prilling tower. However, the solidification of the droplet is also considered by the size of the solidification core, which is identical to the models in [5,6]. An alternative approach, which might better represent the phase transfer in urea particles, is using distributed models. In this approach, the temperature will vary within the particle, and heat transfer equations are required to describe the distribution. Alamdari et al. [8] proposed a distributed model that simultaneously considers the hydrodynamics, heat, and mass transfer to present the solidificaI untion of urea droplets in a commercial prilling tower. Later, the same model is applied to a rectangular cross-sectional area prilling tower, which was reported in the work of Rahmanian et al. [9]. Similarly, in the study of Mehrez et al. [10], a simultaneous momentum, energy, and mass transfer model was also employed to simulate the cooling-solidification of the urea droplets. In these models [8,9,10], the temperature distribution within the particle can be predicted rather than just the radius of the liquid part. However, in their approach, the same drawback exists. The solidification of urea droplets is divided into three distinct thermal intervals. The first stage is the cooling of liquid drops until their surfaces reach the freezing temperature. The next stage, the droplets solidify in the liquid phase at the freezing temperature, and the temperature decreases in the solid phase. Finally, the particles completely become solid and cool down in the third stage. This method categorizes the solidification interval as a Stefan one-phase problem, wherein the temperature of the liquid phase is fixed at the freezing temperature. The approach is unnatural as the temperature distribution within the particle would have to change gradually over time. Therefore, the temperature distribution profiles that were reported in these studies have abnormal regions. For example, in [10], the temperature in the interval around the solid-liquid interface suddenly increases. In the study of Torkashvand et al. [11], besides heat, mass, and momentum transfer, the authors also include the particle shrinkage to study the solidification of the urea particle. However, in the results of this study, the boundary between the solid and the liquid is not present in the temperature distribution profiles. Moreover, the most important part of these reports [8,9,10,11], which is the numerical solution for the Stefan problem, was not clearly proposed and validated. The tendency of the temperature does not follow the semi-analytical solutions, which were well reported in the literature, such as in [12]. There should be a sharp change of temperature in the liquid–solid interface rather than a smooth curve. In our recent study [13], the solidification of urea particle was briefly considered in the case the particles is quickly reach the steady state velocity. Therefore, as an improvement, the solidification of urea particles is fully examined in this report as a two-phase Stefan problem. The particles start as the liquid droplets, gradually reduce the temperature, and become solid. The heat transfer equation is considered as a two-phase Stefan problem, in which heat fluxes present simultaneously in both liquid and solid phases. The whole process from liquid droplets cooling, partial solidification, and full solidification is treated as a single continuous process, rather than dividing into three separate steps. The results of our numerical scheme for the Stefan two-phase problem are also discussed and validated by comparison with the solutions from the literature.

2. Problem Formulation

2.1. Assumptions

In this study, the falling and solidification process of urea particles is considered to involve only heat and moisture transfer between the particles and the cooling air. There is no contribution of the tower wall to the process. For more details, some assumptions are proposed as follows:
  • The process is stationary.
  • The urea droplets fall only in the vertical direction. There is no radial velocity.
  • The effect of moisture on melting temperature is negligible due to the low moisture content of the droplets (less than 0.5%)
  • The moisture content of the cooling air remains unchanged; only the temperature of the cooling air varies.
  • Radiation heat transfer is not considered.
  • The particles are considered to be perfectly spherical.
  • The particles do not shrink during the solidification process due to the low water content and the low evaporation of urea liquid.
  • The process is adiabatic because of the large thickness of the tower wall and the high thermal resistance of the concrete.

2.2. Momentum Transfer

The movement of the droplets is assumed to occur only in the vertical direction, along the axis of the tower. The particles are subject to three forces: gravitational force (FG), which acts in the same direction as the velocity, and buoyancy force (FB) and drag force (FD) act in the opposite direction. The forces acting on the particle include gravity (FG), buoyancy (FB), and drag (FD). Newton’s second law gives the following:
m p d v p d t = F G + F B + F D
Changing the derivative to a cylindrical axis (z-direction) and using the formulas for the forces, the equation becomes
1 6 π d p 3 ρ p v p d v p d z = 1 6 π d p 3 ρ p g 1 6 π d p 3 ρ a g 1 2 ρ a C D π d p 2 4 v p + v a 2
where
mp is the mass of the particle.
dp is the particle diameter.
vp and va are the velocities of the particle and air, respectively.
ρp and ρa are the densities of particles and air, respectively.
The drag coefficient CD correlates with particle Reynolds number, which is calculated as
Re p = d p v p + v a ρ a μ a
where μa is the viscosity of air in kg∙m−1∙s−1.
In this paper, the simple correlation reported in Brown and Lawler [14], which is applicable for the range of Reynolds number up to 2 × 10⁵ is employed to estimate the drag coefficient:
C D = 24 Re p 1 + 0.150 Re p 0.681 + 0.407 1 + 8710 Re p

2.3. Material Balance and Mass Transfer

Moisture constantly diffuses throughout the urea particle and enters the air by convection mass transfer. The governing equation for moisture diffusion is written as
v p M z = D M r 2 r r 2 M r
where M(r,z) is the local moisture fraction at position r of the particle radius and position z along the tower height, and DM is the diffusivity in the droplet of moisture. The initial and boundary conditions are as follows:
Initial condition: at z = 0
M r , 0 = M i , 0 r r p
Boundary condition: at r = 0 and r = rp
M r r = 0 = 0 , z > 0
D M M r r = r p = h mass M * M a , z > 0
where Mi is the initial moisture of the urea particles, Ma is the moisture of the cooling gas stream (which is assumed unchanged), M* is the equilibrium moisture content at the surface of the particle, and hmass is the convective mass transfer coefficient.
The value of M* is calculated by the following equation [15]:
M * = 0.622 P sat P 0 P sat
The saturated vapor pressure is estimated by the August equation:
P sat = exp 13.856 5173 / T p
where Psat is the saturated vapor pressure in atm, and Tp is the temperature at the surface of the particle in Kelvin.
In this study, the Ranz–Marshall equation [16] is used to estimate hmass:
Sh = 2 + 0.6 Re p 0.5 Sc 0.33
where Sh = h mass d p D M is the Sherwood number; Sc = μ a ρ a D M is the Schmidt number.

2.4. Energy Balance and Heat Transfer

At z > 0, the particles are falling and contacting the surrounding air with the temperature Ta, which is below the melting temperature Tm of urea. Therefore, as the position z increases, heat convection occurs, and the particles gradually cool down and become solid. The heat transfer domain can be divided into two regions, namely solid and liquid. The governing equations are a system of two partial differential equations.
In the liquid region,
v p T z = α l r 2 r r 2 T r , 0 r < R z
In the solid region,
v p T t = α s r 2 r r 2 T r , R z r < r p
where T = T (r,z) is the temperature at the position r of the particle radius and position z along the tower height.
α j = k j ρ j c j , kj, ρj, and cj (j = s, l) are the thermal diffusivity, thermal conductivity, density, and specific heat capacity of the solid and liquid phase, respectively.
R(z) is the radius of the solid-liquid interface at the position z along tower height.
The initial and boundary conditions are given as follows.
Initial conditions: for the solid–liquid interface and temperature,
R z = 0 = r p
T r , 0 = T i , 0 r r p
where Ti is the initial temperature of the liquid urea droplet.
Boundary conditions:
At the solid–liquid interface R (z), the flux condition is
k s T r R ( z ) k l T r R ( z ) = L ρ s d R z d t
where L is the latent heat of freezing.
At the particle–air interface,
k d T d r r = r p = h T r = r p T a , z > 0
where h is the convective heat transfer coefficient, which can be obtained from a Ranz–Marshall correlation [16]:
Nu = 2 + 0.6 Re p 0.5 Pr 0.33
where Nu = h d p k g is the Nusselt number; Pr = c p , g μ g k g is the Prandtl number; and kg, cp,g, and μg are the thermal conductivity, specific heat capacity, and viscosity of air, respectively.
About the heat balance of the air, the governing equation for the variation of the air temperature is given as follows:
ρ a v p c a d T a d z = h 6 ε d p T T a
where ε is the volume fraction occupied by the urea droplet.
The negative sign in the equation is because the direction of the cylindrical axis is opposite to the movement of the air.

3. Solution Procedure and Model Parameters

3.1. Solution Procedure

The solidification of the urea droplets in the prilling tower is mathematically described by the system of partial and ordinary differential Equations (2), (5), (12), (13), and (19). The system of ordinary differential Equations (2), (5), and (19) is solved using the Runge–Kutta fourth-order method. The method is an explicit scheme, which is fast and has low memory consumption while maintaining a high accuracy. Because the initial condition for the air temperature is at the end of the cylindrical axis, the shooting method is employed. In the shooting method, an initial condition of the air temperature at the top of the tower is assumed. The system of equations is solved to obtain the air temperature at the bottom of the tower. Then, the obtained value is compared to the inlet air temperature. This procedure is repeated by changing the air temperature at the top until the difference between the obtained and initial air temperature is negligible.
The heat transfer Equations (12) and (13), which are a Stefan two-phase system, are solved using the enthalpy method. These equations are unified using a reduced enthalpy function:
h ˜ = H ρ c p
Therefore,
h ˜ = T if T < T m h ˜ = T + L c p , l if T T m
where Tm is the melting temperature of the material.
The heat transfer equations in the two-phase system now become a unified equation in terms of the reduced enthalpy function in the whole domain:
v p h ˜ z = α r 2 r r 2 T r
with initial condition
h ˜ = T i + L c p , l
The temperature T can be calculated from the reduced enthalpy as
T = h ˜ L c p , l if h ˜ T m + L c p , l T = T m if T m h ˜ < T m + L c p , l T = h ˜ if h ˜ < T m
In the equation, other variables can be calculated by introducing the local liquid fraction f, which determines whether the position is in the liquid phase or not, as follows:
f = 1 if h ˜ T m + L c p , l f = h ˜ T m c p , l L if T m h ˜ < T m + L c p , l f = 0 if h ˜ < T m
The unified parameter α, k in the equation is defined as
α = f α l + 1 f α s
k = f k l + 1 f k s
For unconditional stability, the partial differential Equation (20) should be solved using an implicit scheme. In this study, the implicit Euler method was employed because of its simplicity. More details about the numerical scheme can be found elsewhere in the literature, such as in [17].
It should be noted that the system of ordinary differential equations solved by the explicit Runge–Kutta fourth-order method, and the partial differential equation solved by the implicit Euler method, are executed simultaneously.

3.2. Model Parameters

The properties of urea are obtained from [18] and are summarized in Table 1.
The properties of air are obtained from Table A5 in [19] and are summarized in Table 2.
The operating parameters of the tower are given in Table 3.

4. Results and Discussions

4.1. Validation of Numerical Scheme for Stefan Two-Phase Problem

In order to ensure the performance of our numerical model, especially the part of the two-phase Stefan problem, the enthalpy scheme in this study is applied to solve the freezing problem of water, and the result is compared to the experimental data from the literature. The comparison between the enthalpy scheme and the experimental data of Hindmarsh et al. [20] was presented in Figure 1. Note that the experimental data includes the supercooling stage. In practice, the supercooling period is required because the center of the droplet needs to be cooled until the temperature is below the freezing temperature (0 °C for water) to start the nucleation of the solid. The Stefan equation of heat transfer does not by itself present this region. In order to depict the supercool interval, one more heat transfer equation including the nucleation temperature is needed. Therefore, for checking the numerical solution of the Stefan problem, the supercool region can be excluded [21].
From the comparison, it can be observed that the difference between our numerical scheme and the experimental data is within 5% in estimating the temperature profile. It confirms the validity of our numerical scheme, and thus, the scheme can be used with full confidence.

4.2. Air Temperature Profiles

When the prill diameter is 1.6 mm (typical size of the urea particles), the temperature of the cooling gas stream inside the tower from the numerical simulation is depicted in Figure 2. The real plant data are obtained from the literature [8]. From the comparison, it can be observed that the calculation results and the real plant data are in good agreement. The difference between the estimation and experimental data is less than 3%. Note that the experimental data included the subcooled region, in which the temperature is lower than 0 °C or 273 K. Therefore, the numerical scheme in this study can be used with full confidence for the calculation of the two-phase Stefan problem.

4.3. Moisture Content Profiles

For a particle with a diameter of 1.6 mm (typical size in urea prilling towers), the moisture distribution inside the particle at different distances from the top of the tower is shown in Figure 3.
From the results, it can be obtained that the moisture content of the particle is gradually reduced from the top to the bottom of the tower. At the top of the tower, due to the high temperature of the particle, a high vapor pressure is achieved in this region; thus, the moisture content at the surface of the particle is lower than the moisture content at the bottom of the tower. It is also suggested that the moisture removal mainly occurs at the upper region of the tower, where the temperature of the prills is high. The moisture content of the particles at the bottom of the tower is almost fully removed, especially at the surface of the prills. However, due to the low diffusivity of water in urea, the moisture content at the center of the particle remains unchanged along the height of the tower.

4.4. Temperature Profiles of the Prills

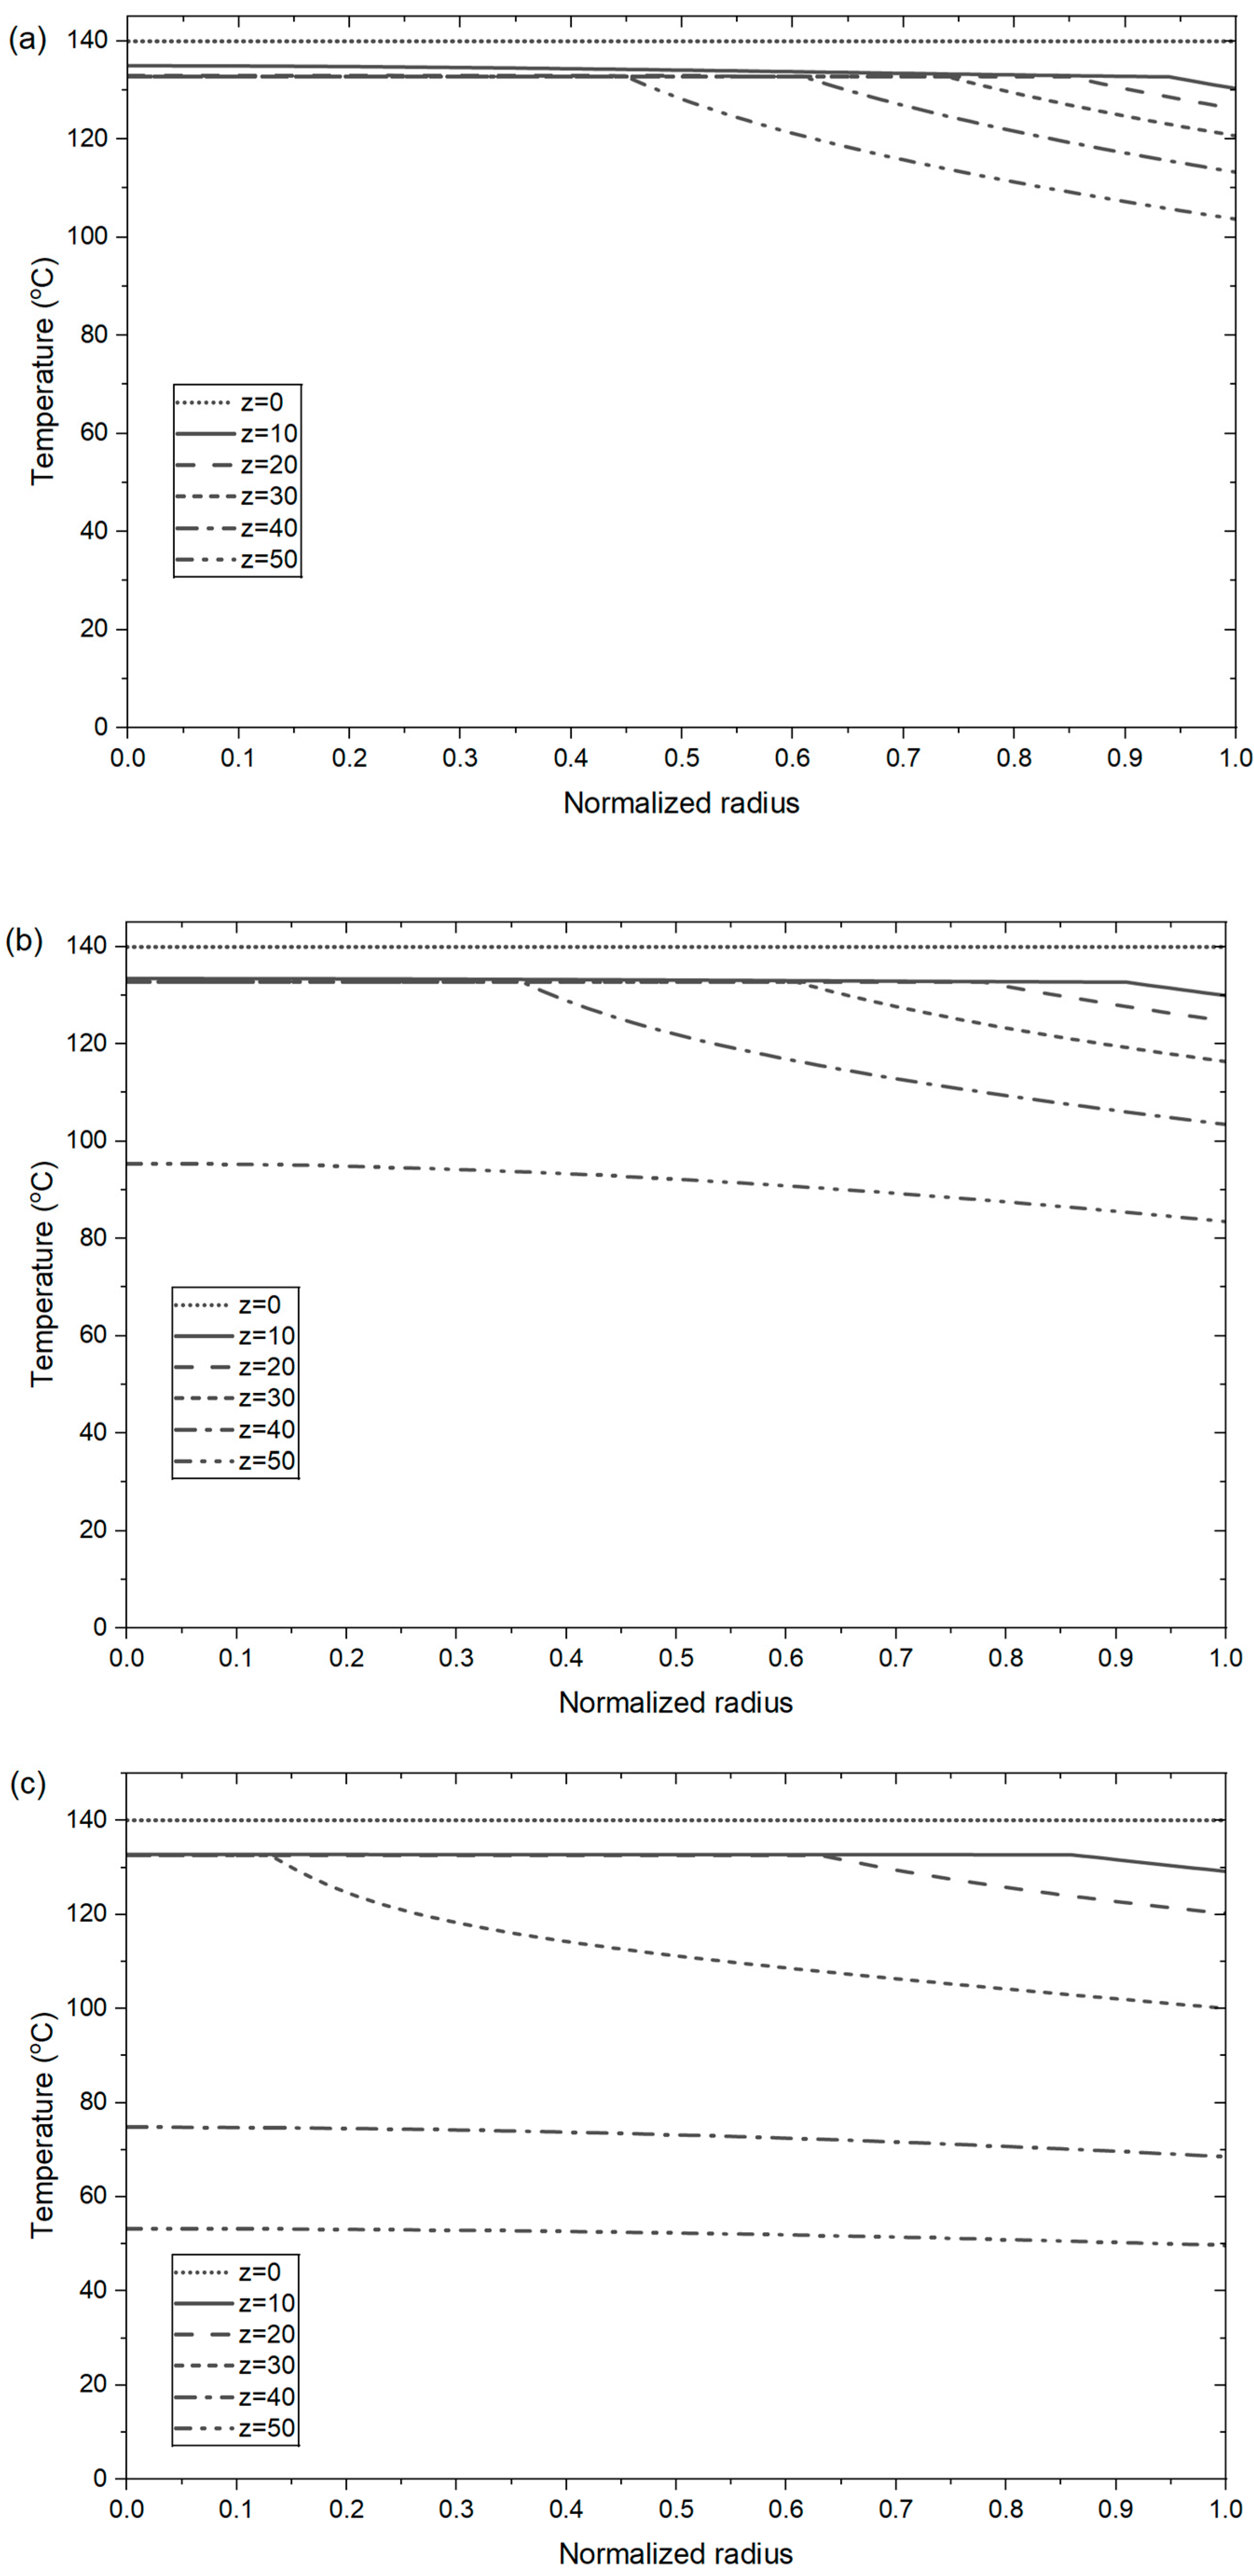
The temperature profiles for the very coarse droplets (diameter of 2.4 mm), coarse droplets (diameter of 2.0 mm), and typical droplets (diameter of 1.6 mm) are shown in Figure 4. The temperature profiles clearly indicate two regions inside the prills, one solid and one liquid, which are separated by the melting point (132 °C) when the solidification occurs. The transition between the two regions is smooth. There is no sudden increase in the temperature near the boundary as reported in [10]. The temperature in both regions is gradually reduced by the removal of heat by convection with the air and conduction inside the particle.
From the results, it can be seen that solidification is not yet complete for the very coarse urea droplets. In the case of 2.0 mm and 1.6 mm, the solidification has completely occurred. However, when the droplet size is 2.0 mm, the temperature of the prills leaving the tower is still hot, around 90 °C. The typical size of the droplets in the tower, which is 1.6 mm, leaves the tower with a temperature of 50 °C.
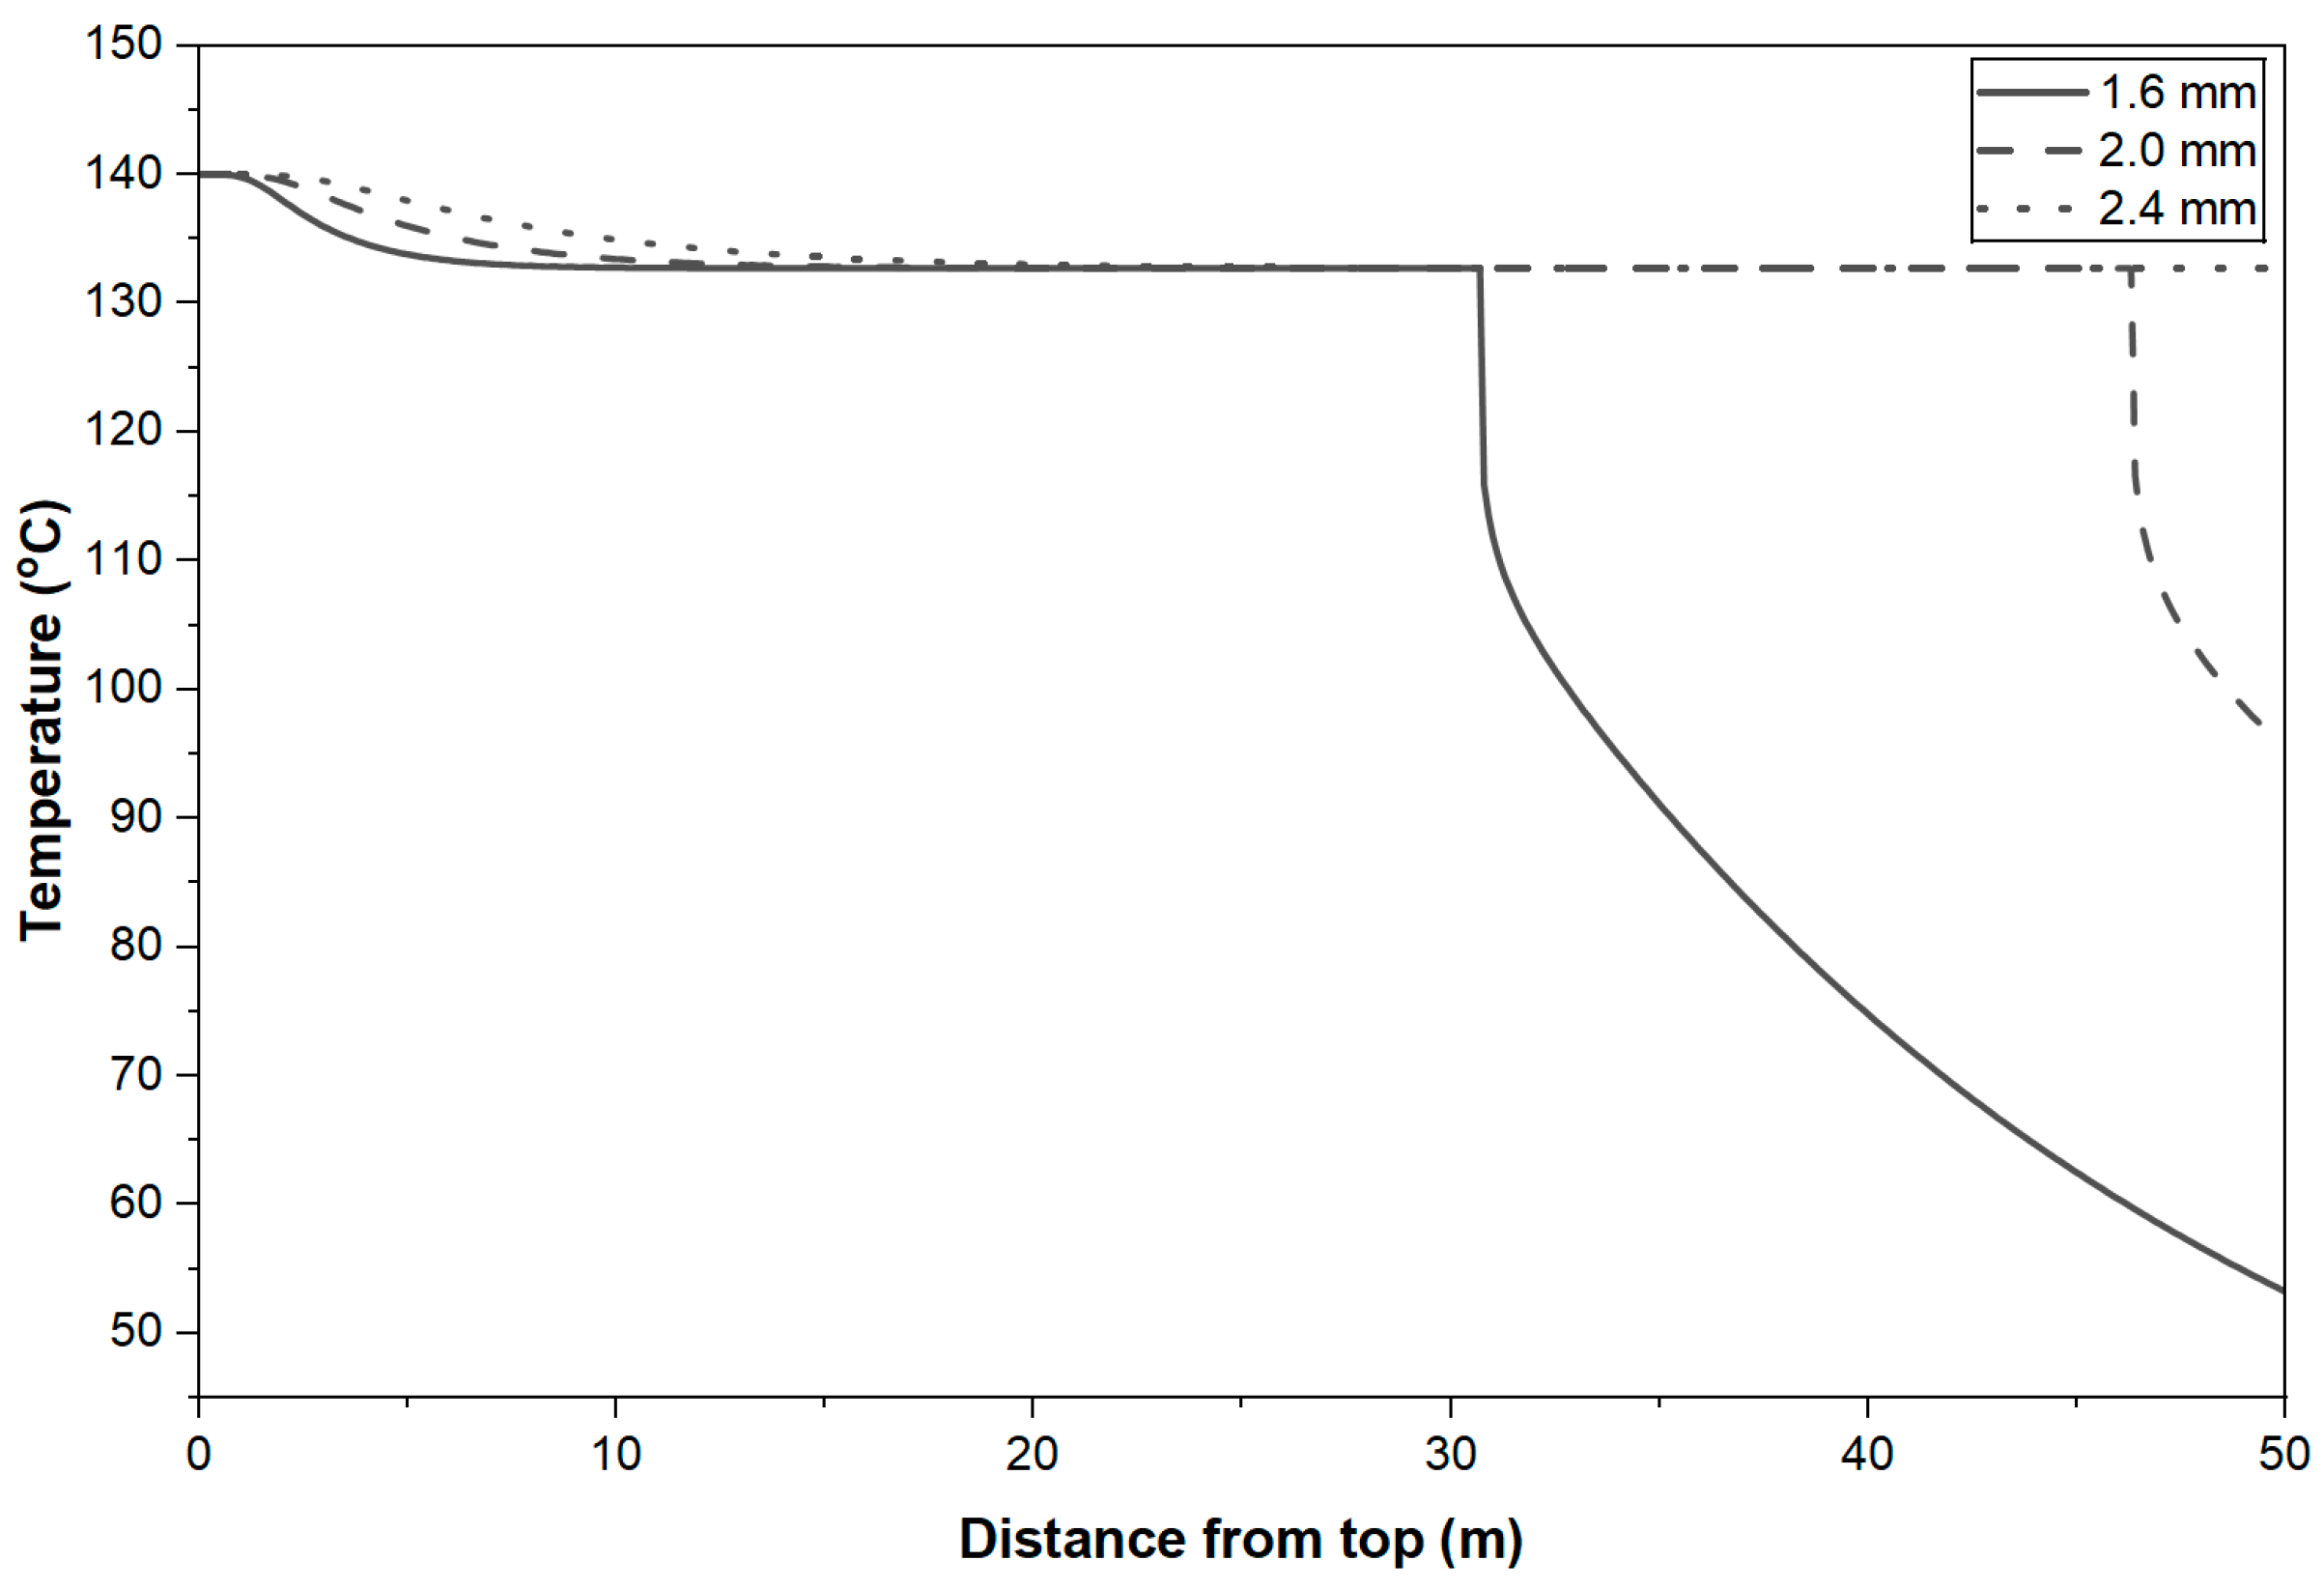
The temperature variation along the tower height at the center of the droplet of various diameters from 1.6 mm to 2.4 mm is also depicted in Figure 5. It can be obtained that for the 2.4 mm particle, the center has not yet reached the freezing temperature, and thus, is still in liquid form. For diameters of 1.6 mm and 2.0 mm, the whole particles are solidified. Due to the higher thermal conductivity in the solid phase compared to the liquid phase, the center of the droplet quickly attains the freezing point. However, the center is still in liquid form for a relatively long period of time because it needs to remove the latent heat to become solid. Due to the high value of latent heat, solidification occurs slowly. After the completion of the solidification process, the particle is cooled faster, as presented by the steeper slope in the temperature profiles.

4.5. Velocity Profiles

The velocity of the particles along the height of the tower is depicted in Figure 6. From the results, it can be obtained that the droplets quickly attain the terminal velocity for the typical and coarse sizes. The transition zone is just around ten meters from the top of the tower. For the coarser particle, it takes more time to reach the terminal velocity. The simulation also suggests that the larger the particle size, the higher the terminal velocity. For the typical size of the droplets, which is 1.6 mm in diameter, the terminal velocity nearly equals the velocity at which the particle leaves the atomizer.

4.6. Solidification Ratio

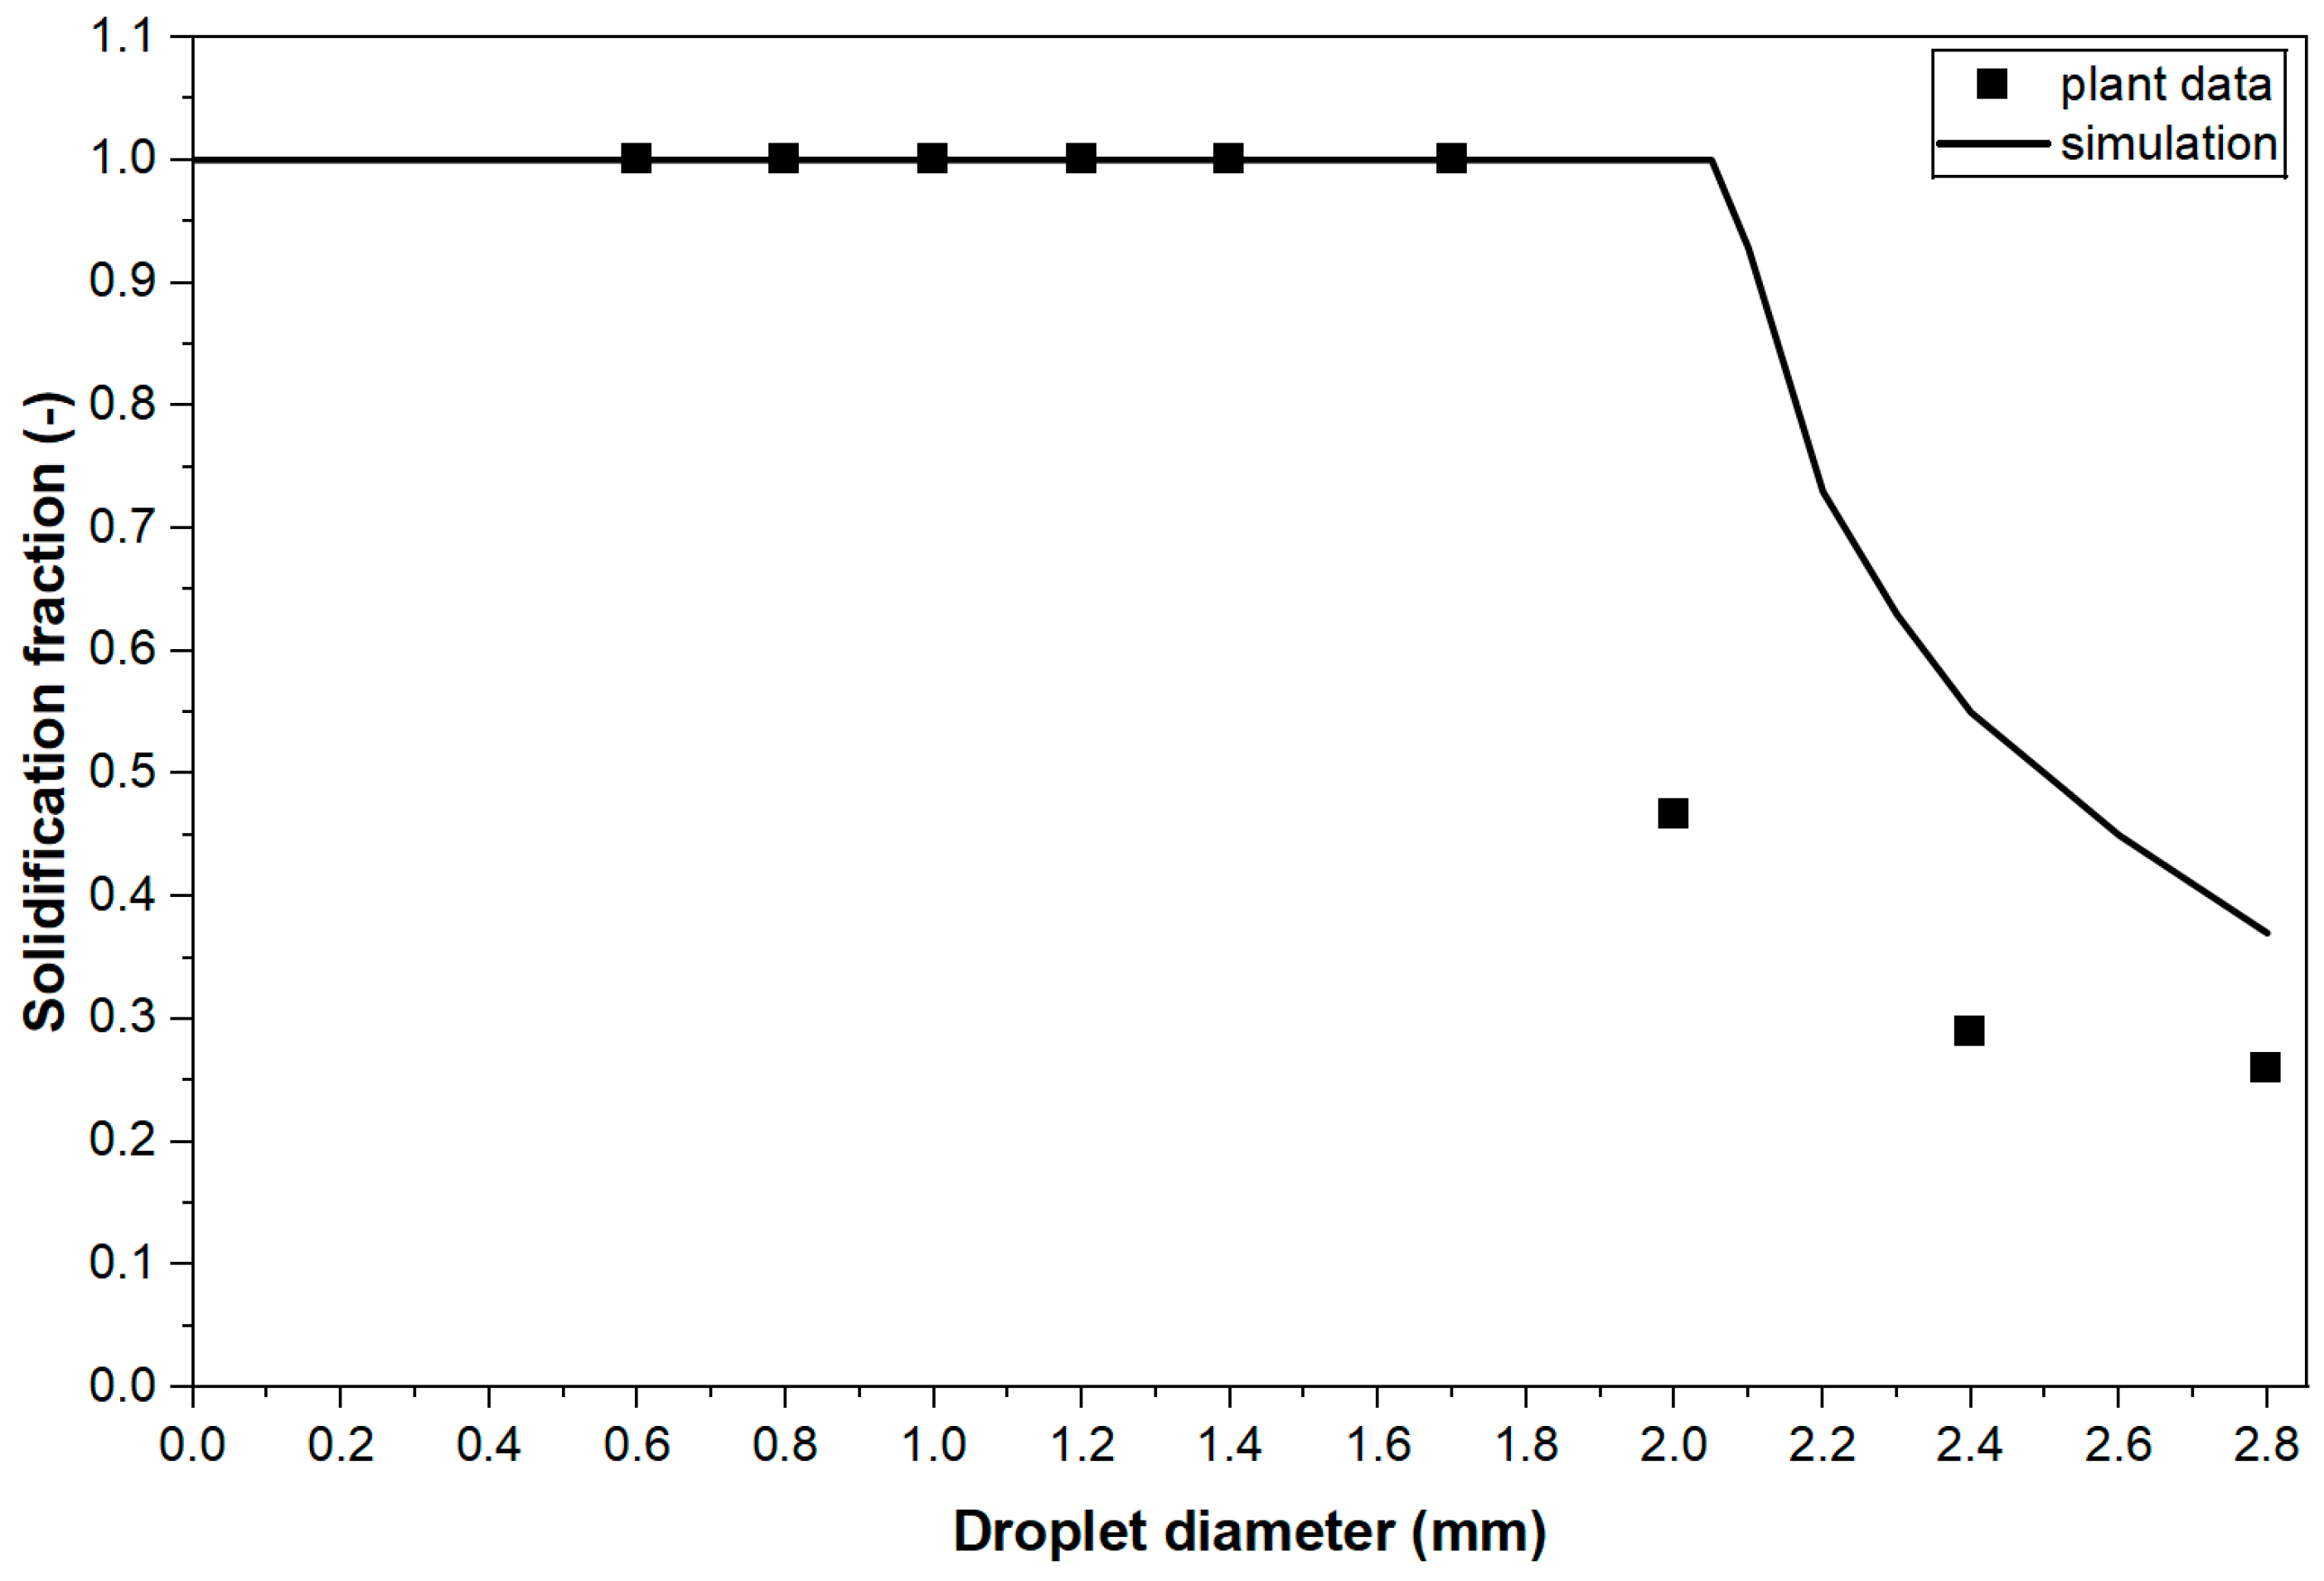
From the mathematical model, the solidification ratio can be estimated for any particle size. The data from real urea plant operation were also obtained from the literature [10] for reference. The comparison between the simulation results and plant data is presented in Figure 7.
From the comparison, it can be obtained that there is quite good agreement between the estimation and the real plant data. The simulation suggests that when the diameter of the droplets is less than 2 mm, the solidification process is complete. When the particle size is larger than 2 mm in diameter, there is only partial solidification. The analysis of the real plant prills confirms solidification up to 1.7 mm.
When the size of the particle is large, the droplets fall faster, as shown in Figure 6; thus, the residence time inside the tower becomes shorter. Larger droplets also contain more internal energy, which is stored as heat. The resistance is higher, which is determined by the thickness. Consequently, the solidification is just partially completed for the very coarse particle. The degree of solidification decreases with an increase in particle size, which is confirmed by simulation and experiments.
The experimental results come from the measurement of particle samples at the bottom of the tower using scanning electron microscope (SEM) images. The solidification fraction is calculated from the ratio between the inner shell, which is considered to be rougher than the outer portion due to the slow cool-down process. Therefore, the differentiation between the two regions is complicated, especially when the particle has an irregular shape. The relation between the texture of the solid and the solidification is not totally clear. Consequently, the error of solidification fraction determination in the cases of incomplete solidification is high. The model did not well represent the real plant data for the very coarse droplets. However, the model can give a good estimation of the solidification for particles with sizes up to around 1.8 mm, in which complete solidification occurred and the real data were reliable. The prediction of solidification degree has not been reported in the literature [8,9] or is still far from the real plant data [10], even for fine particles. The model also suggested the tendency of the solidification degree for the large droplets.

5. Conclusions

In this paper, the solidification of urea melt droplets in a prilling tower was modeled using a mechanistic approach. The contribution of the model was to analyze the temperature distribution across the radius of the urea particles as a two-phase Stefan problem. The entire process does not need to be divided into three distinct stages. The model includes momentum, heat, and mass transfer between the particles and the air. The system of equations is solved numerically using the finite difference method and the enthalpy method. The temperature of the cooling air at various heights of the tower and the degree of solidification of different particle sizes were estimated and compared with data obtained from the urea factory to assess their reliability. The validation demonstrated a strong correlation between the model estimates and the real plant observations.
The model may be utilized to examine the impact of process factors, including flow rates, temperature, and humidity of urea melt and cooling air, on the solidification degree. It is also beneficial for improved management of the existing operational tower and in the design of future prilling facilities.
The model indicated that, under specific operational conditions, it is not feasible to extract the requisite quantity of heat from the large urea droplet to achieve complete solidification before the particles leave the tower. This conclusion provides a clear justification for the issue of cake formation on the scraper of the prilling tower. In such cases, the simulation can suggest adjustments to operating conditions.

Author Contributions

Conceptualization, T.-A.N.; methodology, Q.-L.N.; validation, V.-H.D.; writing—original draft preparation, T.-A.N.; writing—review and editing, T.-A.N.; visualization, V.-H.D.; project administration, T.-A.N. All authors have read and agreed to the published version of the manuscript.

Funding

This research was funded by Vietnam National University, Ho Chi Minh City (VNU-HCM) under the grant number B2023-20-14.

Data Availability Statement

The data that support the findings of this study are available from the corresponding author, T.-A.N., upon reasonable request.

Acknowledgments

We acknowledge the support of time and facilities from Ho Chi Minh City University of Technology (HCMUT), VNU-HCM, for this study.

Conflicts of Interest

The authors declare no conflicts of interest.

Nomenclature

cp,aspecific heat of air at constant pressure (J/kg·K)
cp,lspecific heat of melt urea at constant pressure (J/kg·K)
cp,sspecific heat of solid urea at constant pressure (J/kg·K)
CDdrag coefficient (dimensionless)
dpparticle diameter (m)
DMdiffusion coefficient of moisture through urea within particles (m2/s)
Dttower diameter (m)
flocal liquid fraction (mol liquid/mol liquid and solid)
ggravitational acceleration (m/s2)
Henthalpy (kJ/mol)
hreduced enthalpy (K)
hmassconvective heat-transfer coefficient between air and particles (W/m2·K)
kathermal conductivity of air (W/m·K)
klthermal conductivity of melt urea (W/m·K)
ksthermal conductivity of solid urea (W/m·K)
Llatent heat of freezing (kJ/mol)
Mlocal moisture content of particle (kg H2O/kg dry urea)
Mamoisture content of the air (kg H2O/kg dry air)
M*equilibrium moisture content (kg H2O/kg urea)
mpmass of a particle (kg)
pmass flow rate of particles (kg/s)
amass flow rate of air (kg/s)
NuNusselt number (dimensionless)
Ppressure (atm)
Psatsaturated vapor pressure
PrPrandtl number (dimensionless)
RepReynolds number of the particle (dimensionless)
Rpparticle radius (m)
RHrelative humidity of the air (%)
rradial coordinate from particle center (m)
ScSchmidt number (dimensionless)
ShSherwood number (dimensionless)
Ttemperature of urea particle (K)
Tatemperature of air (K)
Titemperature of urea feed (K)
Tmmelting temperature of urea (K)
Tptemperature at the surface of the particle (K)
ttime taken when a particle falls to the position z from the top (s)
vavelocity of air (m/s)
vpvelocity of particle (m/s)
zaxial coordinate from top of the tower (m)
Ztower height (m)
Greek letters
μaviscosity of air (kg/m3)
ρadensity of air (kg/m3)
ρldensity of melt urea (kg/m3)
ρsdensity of solid urea (kg/m3)

References

  1. Yahya, N. Urea Fertilizer: The Global Challenges and Their Impact to Our Sustainability. In Green Urea: For Future Sustainability; Springer: Singapore, 2018; pp. 1–21. [Google Scholar] [CrossRef]
  2. Skorupka, M.; Nosalewicz, A. Ammonia Volatilization from Fertilizer Urea—A New Challenge for Agriculture and Industry in View of Growing Global Demand for Food and Energy Crops. Agriculture 2021, 11, 822. [Google Scholar] [CrossRef]
  3. Xia, M.; Mao, C.; Gu, A.; Tountas, A.A.; Qiu, C.; Wood, T.E.; Li, Y.F.; Ulmer, U.; Xu, Y.; Viasus, C.J.; et al. Solar Urea: Towards a Sustainable Fertilizer Industry. Angew. Chem. Int. Ed. 2022, 61, e202110158. [Google Scholar] [CrossRef] [PubMed]
  4. Rahmanian, N.; Naderi, S.; Supuk, E.; Abbas, R.; Hassanpour, A. Urea Finishing Process: Prilling Versus Granulation. Procedia Eng. 2015, 102, 174–181. [Google Scholar] [CrossRef]
  5. Bakhtin, L.A.; Vagin, A.A.; Esipovich, L.Y.; Labutin, A.N. Heat-exchange calculations in prilling towers. Chem. Pet. Eng. 1978, 14, 994–999. [Google Scholar] [CrossRef]
  6. Wu, Y.; Bao, C.; Zhou, Y. An Innovated Tower-fluidized Bed Prilling Process. Chin. J. Chem. Eng. 2007, 15, 424–428. [Google Scholar] [CrossRef]
  7. Ricardo, G.A.N.; Noriler, D.; Martignoni, W.P.; Meier, H.F. Application of Euler–Lagrange Approach to Predict the Droplet Solidification in a Prilling Tower. Ind. Eng. Chem. Res. 2015, 54, 9615–9626. [Google Scholar] [CrossRef]
  8. Alamdari, A.; Jahanmiri, A.; Rahmaniyan, N. Mathematical modelling of urea prilling process. Chem. Eng. Commun. 2000, 178, 185–198. [Google Scholar] [CrossRef]
  9. Rahmanian, N.; Homayoonfard, M.; Alamdari, A. Simulation of Urea Prilling Process: An Industrial Case Study. Chem. Eng. Commun. 2013, 200, 764–782. [Google Scholar] [CrossRef]
  10. Mehrez, A.; Ookawara, S.; Ali, A.H.H.; Suzuki, M. A Numerical Study on Cooling-Solidification Process of Urea Particles in Prilling Tower. J. Chem. Eng. Jpn. 2014, 47, 628–634. [Google Scholar] [CrossRef]
  11. Torkashvand, B.; Gilassi, S.; Moghadam, R. Analysis of Heat and Moisture Transfer During Drying of Urea Particles. Chem. Ind. Chem. Eng. Q. 2019, 25, 171–182. [Google Scholar] [CrossRef]
  12. McCue, S.W.; Wu, B.; Hill, J.M. Classical two-phase Stefan problem for spheres. Proc. R. Soc. A Math. Phys. Eng. Sci. 2008, 464, 2055–2076. [Google Scholar] [CrossRef]
  13. Ha, K.T.V.; Nguyen, T.-A.; Nguyen, Q.-L.; Dang, V.-V.; Dang, V.-H.; Van, H.-L.; Pham, L.-N.T. Two-Phase Stefan Problem for the Modeling of Urea Prilling Tower. Eng. Proc. 2023, 37, 122. [Google Scholar] [CrossRef]
  14. Brown, P.P.; Lawler, D.F. Sphere Drag and Settling Velocity Revisited. J. Environ. Eng. 2003, 129, 222–231. [Google Scholar] [CrossRef]
  15. Paláncz, B. A mathematical model for continuous fluidized bed drying. Chem. Eng. Sci. 1983, 38, 1045–1059. [Google Scholar] [CrossRef]
  16. McKenna, T.F.; Spitz, R.; Cokljat, D. Heat transfer from catalysts with computational fluid dynamics. AIChE J. 1999, 45, 2392–2410. [Google Scholar] [CrossRef]
  17. Caldwell, J.; Chan, C.-C. Numerical solutions of the stefan problem by the enthalpy method and the heat balance integral method. Numer. Heat Transf. Part B Fundam. 1998, 33, 99–117. [Google Scholar] [CrossRef]
  18. Meessen, J.H. Urea. In Ullmann’s Encyclopedia of Industrial Chemistry; VCH: Weinheim, Germany, 1985. [Google Scholar] [CrossRef]
  19. Serth, R.W.; Lestina, T.G. (Eds.) Appendix A—Thermophysical Properties of Materials. In Process Heat Transfer, 2nd ed.; Academic Press: Boston, MA, USA, 2014; pp. 555–580. [Google Scholar] [CrossRef]
  20. Hindmarsh, J.P.; Russell, A.B.; Chen, X.D. Experimental and numerical analysis of the temperature transition of a suspended freezing water droplet. Int. J. Heat Mass Transf. 2003, 46, 1199–1213. [Google Scholar] [CrossRef]
  21. Akhtar, S.; Xu, M.; Sasmito, A.P. Development and validation of an asymptotic solution for a two-phase Stefan problem in a droplet subjected to convective boundary condition. Int. J. Therm. Sci. 2021, 164, 106923. [Google Scholar] [CrossRef]
Figure 1. Comparison of the temperature profiles at the center of the water droplet of radius 780 μm.
Processes 13 03717 g001
Figure 2. Air temperature calculation along the height of the tower when the particle diameter is 1.6 mm and the real plant data.
Processes 13 03717 g002
Figure 3. Moisture content distribution versus time of a 1.6 mm particle (the legends indicate the distance from the top).
Processes 13 03717 g003
Figure 4. Temperature profiles of very coarse droplets (a), coarse droplets (b), and typical droplets (c). Legends indicate the distance from the top.
Processes 13 03717 g004
Figure 5. Temperature variation at the center of the droplet with a diameter of 1.6 mm.
Processes 13 03717 g005
Figure 6. Velocity profiles of different particle sizes along the height of the tower.
Processes 13 03717 g006
Figure 7. Solidification fraction of various droplet sizes from plant data and simulation results.
Processes 13 03717 g007
Table 1. Properties of urea.
PropertyNotationValue
Density of solid urea (kg/m3)ρs1335
Melting point of urea (°C)Tm132
Thermal conductivity of solid urea (W/(m·K))ks2.651 × 10−2
Specific heat capacity of solid urea (J/(kg·K))cp,s1334
Heat of fusion (kJ/kg)L224
Density of liquid urea (kg/m3)ρl1247
Thermal conductivity of liquid urea (W/(m·K))kl1.3 × 10−2
Specific heat capacity of liquid urea (J/(kg·K))cp,l2250
Particle (droplet) diameter range (mm)0.6–2.40.6–2.4
Table 2. Properties of air.
PropertiesNotationValues
Density of air (kg/m3)ρa1.166
Viscosity of air (Pa·s)μa1.87 × 10−5
Specific heat capacity (kJ/(kg·K))cp,a1.005
Thermal conductivity (W/(m·K))ka0.025
Table 3. Operating conditions of the tower (base case).
PropertiesNotationValues
Tower height (m)Z50
Tower diameter (m)Dt18
Temperature of urea feed (°C)Ti140
Moisture content of urea feed (%wt)Mi0.5
Mass flow rate of urea (kg/s)p19
Mass flow rate of air (kg/s)a128.6
Relative humidity of air (%)RH45
Velocity of air (m/s)va0.63
Inlet air temperature (°C)Ta,i30
Pressure (atm)P01
Particle (droplet) diameter range (mm)0.6–2.40.6–2.4
Disclaimer/Publisher’s Note: The statements, opinions and data contained in all publications are solely those of the individual author(s) and contributor(s) and not of MDPI and/or the editor(s). MDPI and/or the editor(s) disclaim responsibility for any injury to people or property resulting from any ideas, methods, instructions or products referred to in the content.