Article

Effects of High-Pressure Water Injection on Surface Functional Groups and Wettability in Different Rank Coals: Implications for Hydraulic Fracturing in CBM Wells

1
College of Geological and Surveying Engineering, Taiyuan University of Technology, Taiyuan 030024, China
2
Shanxi Huaxin Gas Energy Research Institute Co., Ltd., Taiyuan 030006, China
3
Provincial Center of Technology Innovation for Coal Measure Gas Co-Production, Taiyuan 030082, China
*
Author to whom correspondence should be addressed.
Processes 2025, 13(11), 3718; https://doi.org/10.3390/pr13113718
Submission received: 13 October 2025 / Revised: 8 November 2025 / Accepted: 14 November 2025 / Published: 18 November 2025

Abstract

Hydraulic fracturing is a widely used stimulation technology in coalbed methane (CBM) fields. However, the coal reservoir damage caused by high-pressure hydraulic fracturing seriously affects the production effects, and the mechanism is not clear. Therefore, based on high-pressure water injection (HPWI), Fourier transform infrared spectroscopy (FTIR), and contact angle tests, the effects of HPWI on surface chemical properties and wettability of different rank coals were studied. The FTIR results show that surface functional groups of different rank coals have changed to varying degrees after HPWI. After HPWI, the content of Ash in Shaqu and Yonghong coal decreases by 2.29% and 27.91%, while it increases by 297.87% in Shaping coal. The C–O bond content in Shaping and Yonghong coal decreases by 6.32% and 15.19%, while the C–O bond content in Shaqu coal increases by 50.96%. The content of C=O in Shaping and Yonghong coal increases by 2.44% and 27.84%, respectively. The R2CH2 contents increase by 19.75% and 12.5% in Shaping and Shaqu coal, while decreasing by 6.48% in Yonghong coal. The RCH3 content increases by 21.11% in Yonghong coal, while it decreases by 19.09% and 24.01% in Shaping and Shaqu coal. The content of cyclic associated hydroxy–hydrogen bond decreases by 41.25%, 63.92% and 65.86% in Shaping, Shaqu, and Yonghong coals, and the content of free hydroxyl group increases by 57.92%, 58.42%, and 93.71%. The farc of coal remains almost unchanged, the DOC increases by 20.21%, 126.77% and 0.24% in Shaping, Shaqu, and Yonghong coals, and the I decreases by 16.67% and 51.46% in Shaping and Yonghong coals, indicating that the ordering of coal becomes better, and the content of methylene carbon in the form of long straight chain increases after HPWI. The complexity and differences of changes in functional groups are mainly due to differences in coal structures caused by coalification. The contact angle tests show that the wetting contact angle of different rank coals decreased by 2.38% to 14.50%, revealing that the hydrophilicity of coals increases after HPWI. The decline rate of wetting angles in medium and high-rank coals was significantly higher than that of low-rank coal. This phenomenon discovered that the increase in hydrophilic functional groups caused by HPWI action leads to an increase in the hydrophilicity of coal samples, which is not conducive to the drainage efficiency in CBM development.

1. Introduction

With China already committing to peak carbon dioxide emissions before 2030 and achieve carbon neutrality before 2060, promoting the efficient development and utilization of CBM is of great significance to “carbon neutrality” Coalbed methane (CBM) resources buried shallower 2000 m are 30.05 × 10¹² m3 in China, accounting for 11.6% of the global total CBM resources, with huge development potential [1,2]. After about 30 years of exploration and development, China’s CBM has made great progress and is increasing every year [3]. Commercial development of CBM has been realized in Qinshui Basin and the eastern margin of Ordos Basin [4,5]. However, the CBM reservoirs in China generally have characteristics of low porosity, low permeability, low pressure, low gas saturation, and strong heterogeneity. The major problem of the low productivity in a single CBM well has restricted the efficient development of CBM in China [6]. As a result, the CBM industry mainly adopted the way of hydraulic fracturing to improve the permeability of coal reservoirs, thus improving the productivity of CBM wells [7,8]. At present, hydraulic fracturing is still the main stimulation measure for CBM in China, but the stimulation effect is generally poor, due to the geological inadaptability and reservoir damage [9,10].
Coal seam is the typical organic reservoir with obvious plasticity, weak mechanical properties, and strong adsorption capacity [11,12,13]. And these particular characteristics can lead to serious reservoir damage during the hydraulic fracturing process in CBM wells [10,11]. The types of reservoir damage caused by fracturing fluid to the coal permeability in the fracturing process of CBM wells include physical and chemical damage. Since the 1990s, many scholars have carried out research on the permeability damage caused by fracturing fluid of CBM wells to coal reservoirs [14,15,16,17]. These studies typically employ the reservoir sensitivity damage research methods commonly used in the conventional oil and gas field. Previous studies on coal reservoir damage mainly focus on the effects of fracturing fluids on pore structure characteristics and inorganic mineral components of coal reservoirs. At the same time, there were only a few reports on the influence of fracturing fluid on the microscopic chemical structure and surface chemical properties of organic components in coal reservoirs [18,19,20].
As a non-destructive analysis method, Fourier transform infrared spectroscopy (FTIR) has been widely used in the characterization of the chemical structure of coal in recent years [21,22,23]. In this study, FTIR was used to characterize the surface chemical structure of coal samples with different ranks before and after high-pressure water injection (HPWI) action, and the effects of high-pressure fluid on the chemical functional groups of the coal reservoir and its reasons are discussed. Finally, the influence of surface chemical structure changes on coal wettability was studied by coal wetting angle tests. The research results can provide a basis for revealing the microscopic damage mechanism of fracturing fluid to different rank coals.

2. Materials and Methods

2.1. Coal Samples Collection and Processing

2.1.1. Coal Samples Collection

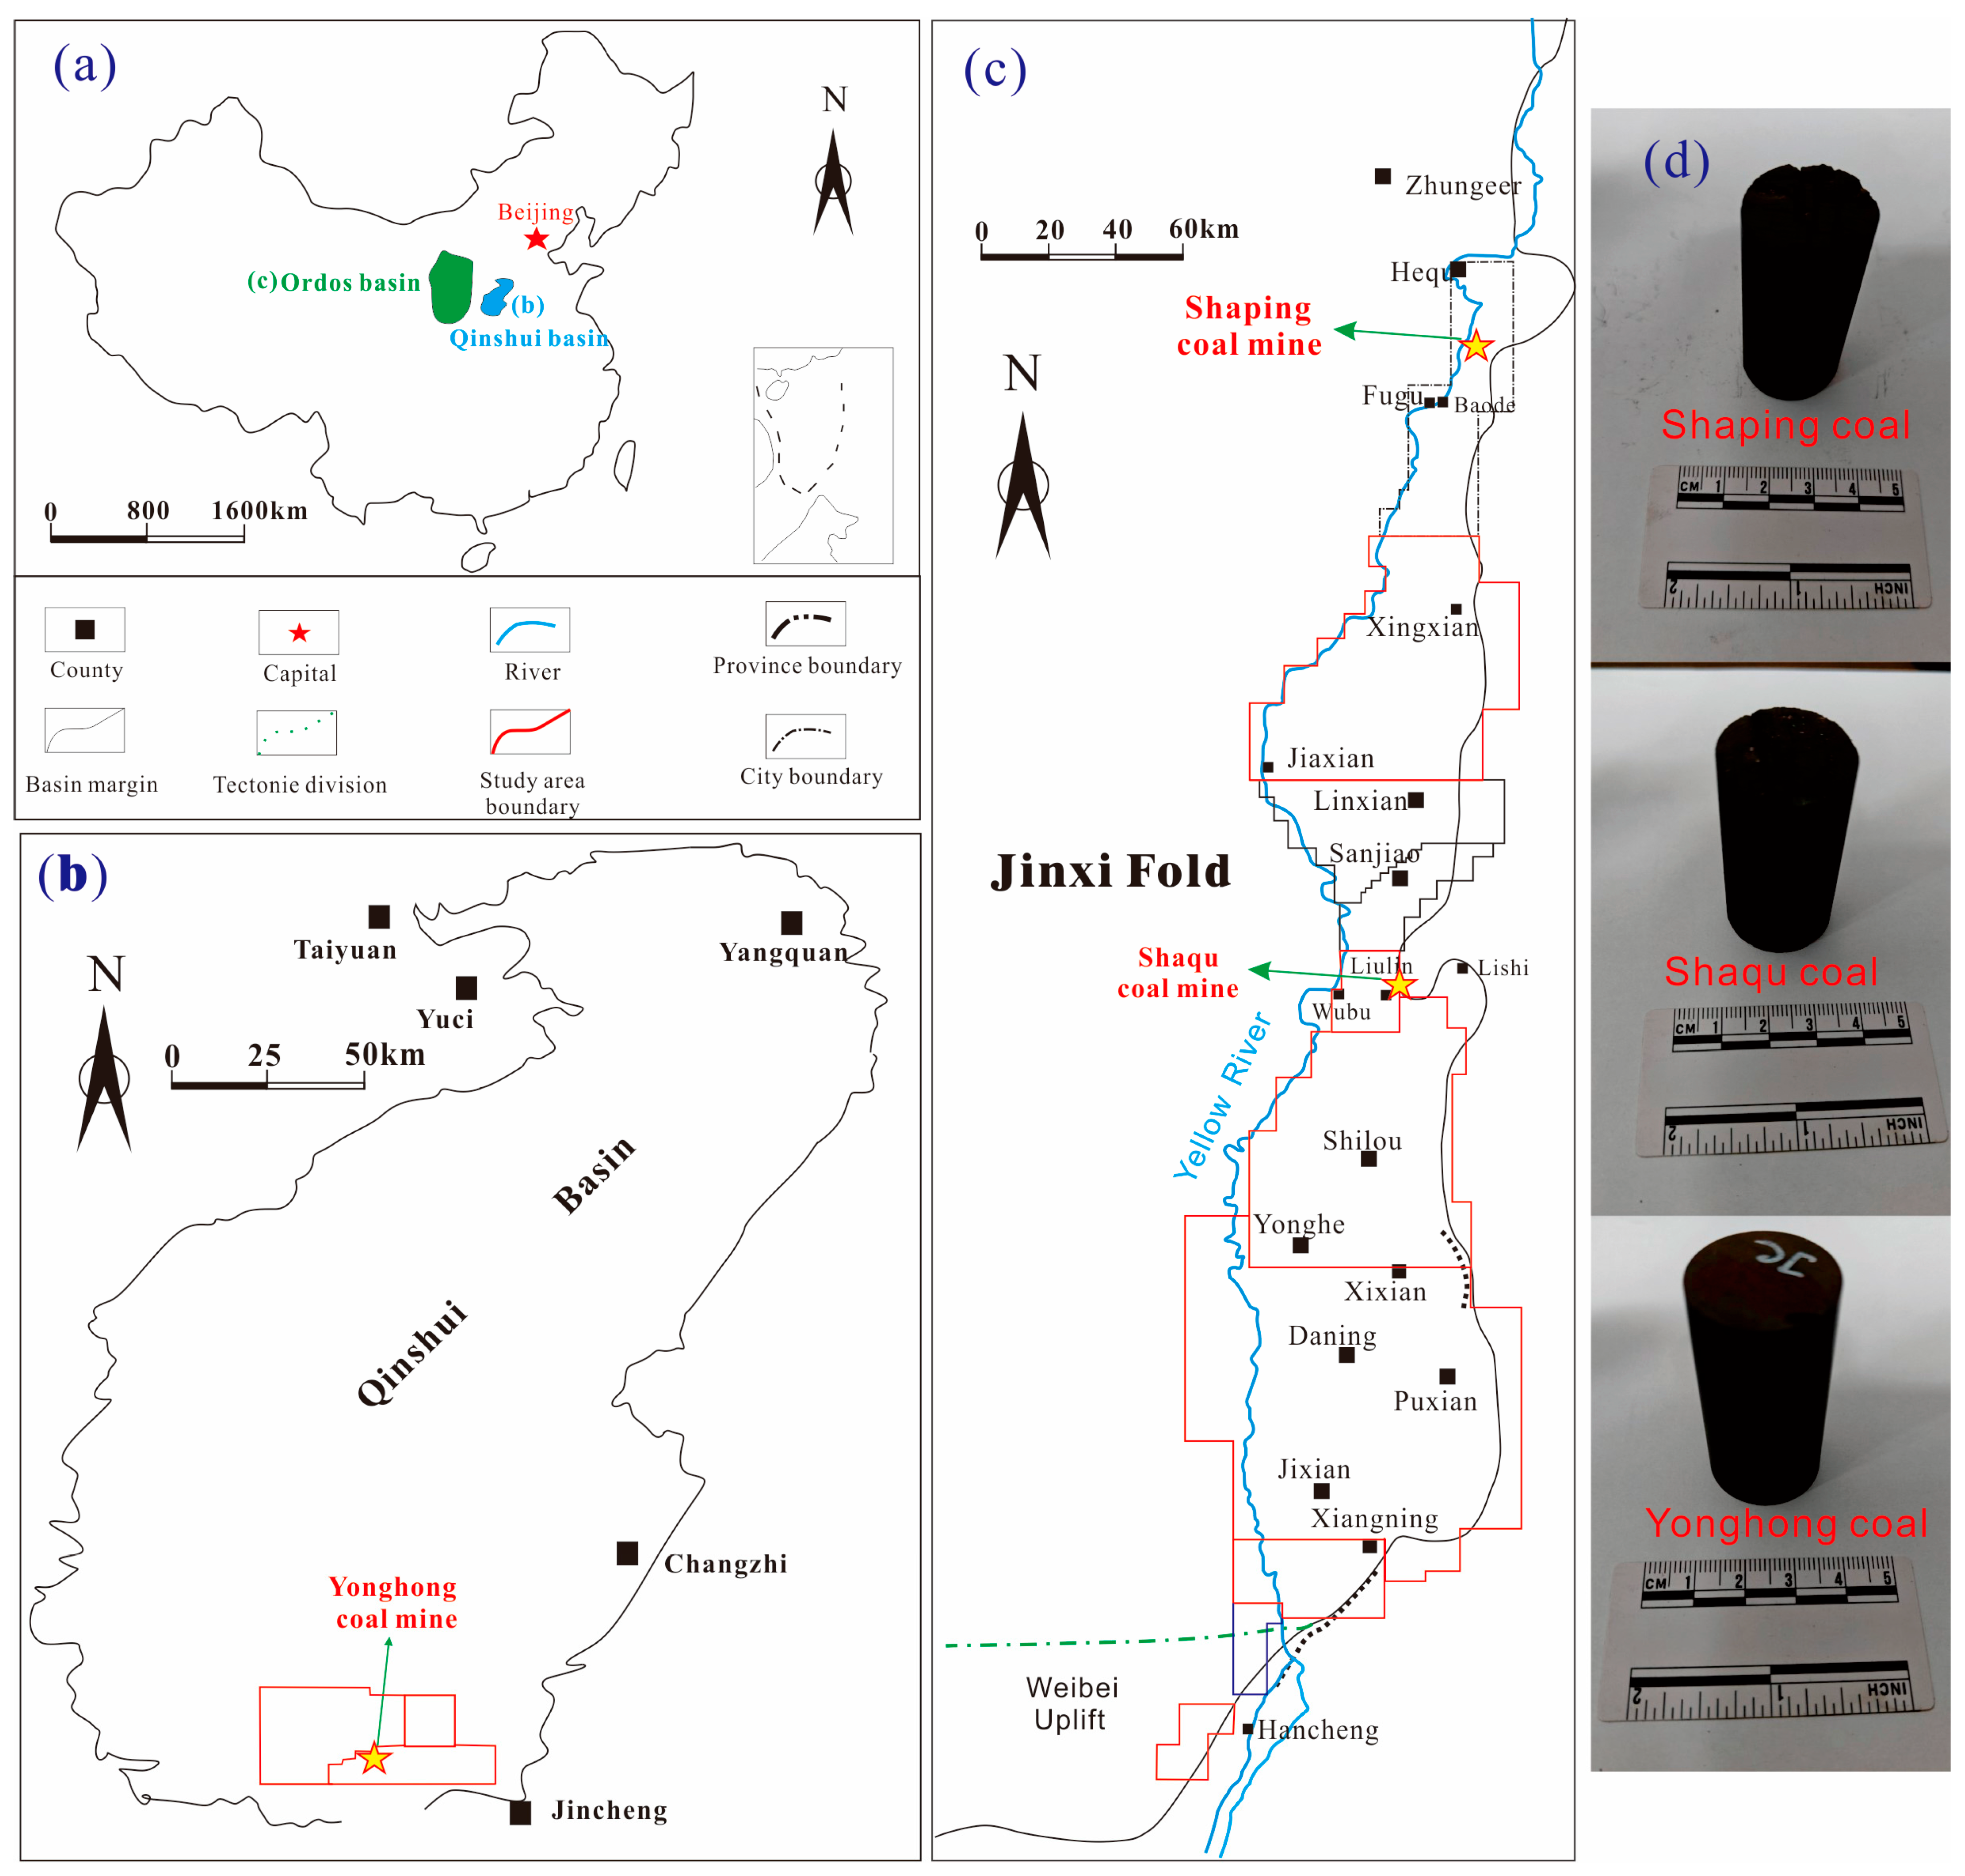
The southern Qinshui Basin and the eastern edge of the Ordos Basin are two hot spots for CBM development in China. The high rank CBM reservoirs are mainly distributed in the southern Qinshui Basin, while the medium and low rank CBM reservoirs are mainly distributed in the eastern margin of Ordos Basin [24,25]. The experimental coal samples were collected from the southern Qinshui Basin and the eastern edge of the Ordos Basin in Shanxi province (Figure 1a). Sampling was carried out in accordance with the Chinese national standard GB/T482-2008 [26]. Samples of low, medium, and high coal rank were collected from Hequ Shaping, Liulin Shaqu, and Jincheng Yonghong coal mines, respectively. The Jincheng Yonghong coal mine is located in the southern part of the Qinshui basin (Figure 1b). The Hequ Shaping and Liulin Shaqu coal mines are located in the eastern margin of the Ordos basin (Figure 1c). The coal sample from Hequ Shaping mine was collected from the No. 8 coal seam of the Carboniferous Taiyuan Formation, with a sampling depth of 112 m. The coal sample of Liulin Shaqu mine was collected from the No. 4 coal seam of the Permian Shanxi Formation with a sampling depth of 510 m. The coal sample of Jincheng Yonghong mine was collected from the No. 3 coal seam of the Permian Shanxi Formation with a sampling depth of 285 m.

2.1.2. Coal Samples Processing

The coal samples were divided into two parts and sealed in sample bags for preservation to prevent the samples from being polluted or oxidized. One part of the samples was cut into cores with a metal wire cutting machine. The diameter of the core was 25 mm, and the height was about 50 mm (Figure 1d). The cores were placed in a vacuum drying oven at 60 °C for 12 h in a DZF-6032 desktop vacuum drying oven (Produced by Shanghai Yiheng Scientific Instrument Co., Ltd. located in Shanghai, China, and the range of working temperatures is 10 to 200 °C), and then put into a reagent bag for high-pressure water injection experiments. Another part of the samples was crushed and used for coal FTIR and wetting angle tests before high-pressure water injection (HPWI).
The experiment of coal high-pressure water injection is to simulate the effect of high-pressure fracturing fluid on coal structure, so the coal samples after HPWI are called fractured coal samples. In this paper, the raw coal samples from Shaping, Shaqu, and Yonghong coal mines are named SP-Q, SQ-Q, and YH-Q in turn. Accordingly, the fractured coal samples from Shaping, Shaqu, and Yonghong coal mines are named SP-H, SQ-H, and YH-H in turn (the following sample names and codes have the same meaning in this paper).

2.2. Experimental Methods

2.2.1. High-Pressure Water Injection (HPWI) Experiment

The high-pressure water injection (HPWI) experiment was carried out in the laboratory of SGS-CSTC in Beijing. The water used in the HPWI process was deionized water. The experimental instrument is the YMP-3 model reservoir sensitivity evaluation device, which is mainly composed of an injection system, a model system, a metering system, an automatic control system, and a data acquisition and processing system. The experimental process is automatically controlled and collected, including time, pressure, temperature, and other parameters. The maximum effective confining pressure of this type of equipment is 50 MPa, and the maximum displacement pressure is 40 MPa, which meets the requirements of the design experiment. The experiment was carried out at room temperature (20 ± 2).
The testing steps are as follows: (a) Turn on the equipment, mark the liquid flow direction on the core, and place it in the core holder according to the direction. (b) The initial confining pressure is set to 3 MPa, the secondary confining pressure is set to 5 MPa, and thereafter, the confining pressure is increased step by step with 5 MPa as the step difference. (c) From the initial confining pressure condition, inject pure water at a rate of 0.5 mL/s, and observe whether there is water flowing out of the outlet. When the inlet pressure is lower than the confining pressure of 1 MPa and still no liquid flows out, increase the confining pressure according to the set order. When there is water flowing out, after the water is stable, record the parameters such as confining pressure, inlet pressure, flow rate, etc., and calculate the liquid permeability of the sample. (d) When the confining pressure increases to 30 MPa, close the outlet valve and keep the gripper at 30 MPa for 120 min. (e) Open the valve to reduce the inlet pressure and, at the same time, reduce the confining pressure. Remove the sample from the holder and place it in the sample bag for storage. (f) Pulverize the column samples with a mortar to powder, pass them through a 200-mesh sieve, put them in a reagent bag, label them, and store them in a sealed container.

2.2.2. FTIR Test

FTIR tests of coal samples were carried out in the Key Laboratory of Coal Science and Technology in Taiyuan University of Technology. The VERTEX70 infrared spectrometer produced by the Bruker Company located in Karlsruhe, Germany was used to measure coal samples before and after HPWI, respectively.
The testing steps are as follows: (a) Both 100 mg of potassium bromide powder and 100 g of coal sample were then mixed in an agate mortar by grinding. (b) The mixture was loaded in the mold by grinding and then placed in the tablet press into a 0.1~1.0 mm transparent thin disk under a pressure of 10 MPa for 1 min. (c) The transparent thin disk was fixed on the sample rack and put into the sample chamber of the infrared spectrometer for testing, and each spectrum was scanned 16 times with a resolution of 4.0 cm−1 to obtain an infrared spectrum, and the scanning region ranged from 400 cm−1 to 4000 cm−1.

2.2.3. Wetting Contact Angle Test

The coal wetting contact angle tests were completed in the Mineral Processing Laboratory at Taiyuan University of Technology. The contact angle experiments are measured under room temperature and normal pressure environments. The specific experimental operation steps are as follows: (a) The 0.2 g to 0.4 g sample was placed in the powder tablet press model FW-4A and pressed into round sheets. (b) Adjust the lens so that the needle transverse account for one-tenth of the page, and the vertical account for one-fifth of the page, the sample pressed into coal sheet is placed under the lens, about 3 μL of distilled water is dropped from the sampler, and then the needle is moved down to the surface of the contact sample, due to the existence of the surface tension system, the liquid will stay on the surface of the sample. The contact angle test data used in our article requires three repeated tests each time, and the average value is taken.

3. Results and Discussion

3.1. Coal Rank and Coal Quality Characteristics

The maximum vitrinite reflectance (Ro,max, %) measurements, industrial analysis, and ultimate analysis of coal samples were determined according to national standards GB/T6948-2008 [27], GB/T212-2008 [28], and GB/T31391-2015 [29], respectively. The test results are shown in Table 1. The results show that Shaping coal is low rank long flame coal, Shaqu coal is medium rank coking coal, and Yonghong coal is high rank anthracite. Among them, ash contents in Shaqu coal and Yonghong coal are higher.

3.2. Peak Separation Fitting of the Infrared Spectrum of Samples

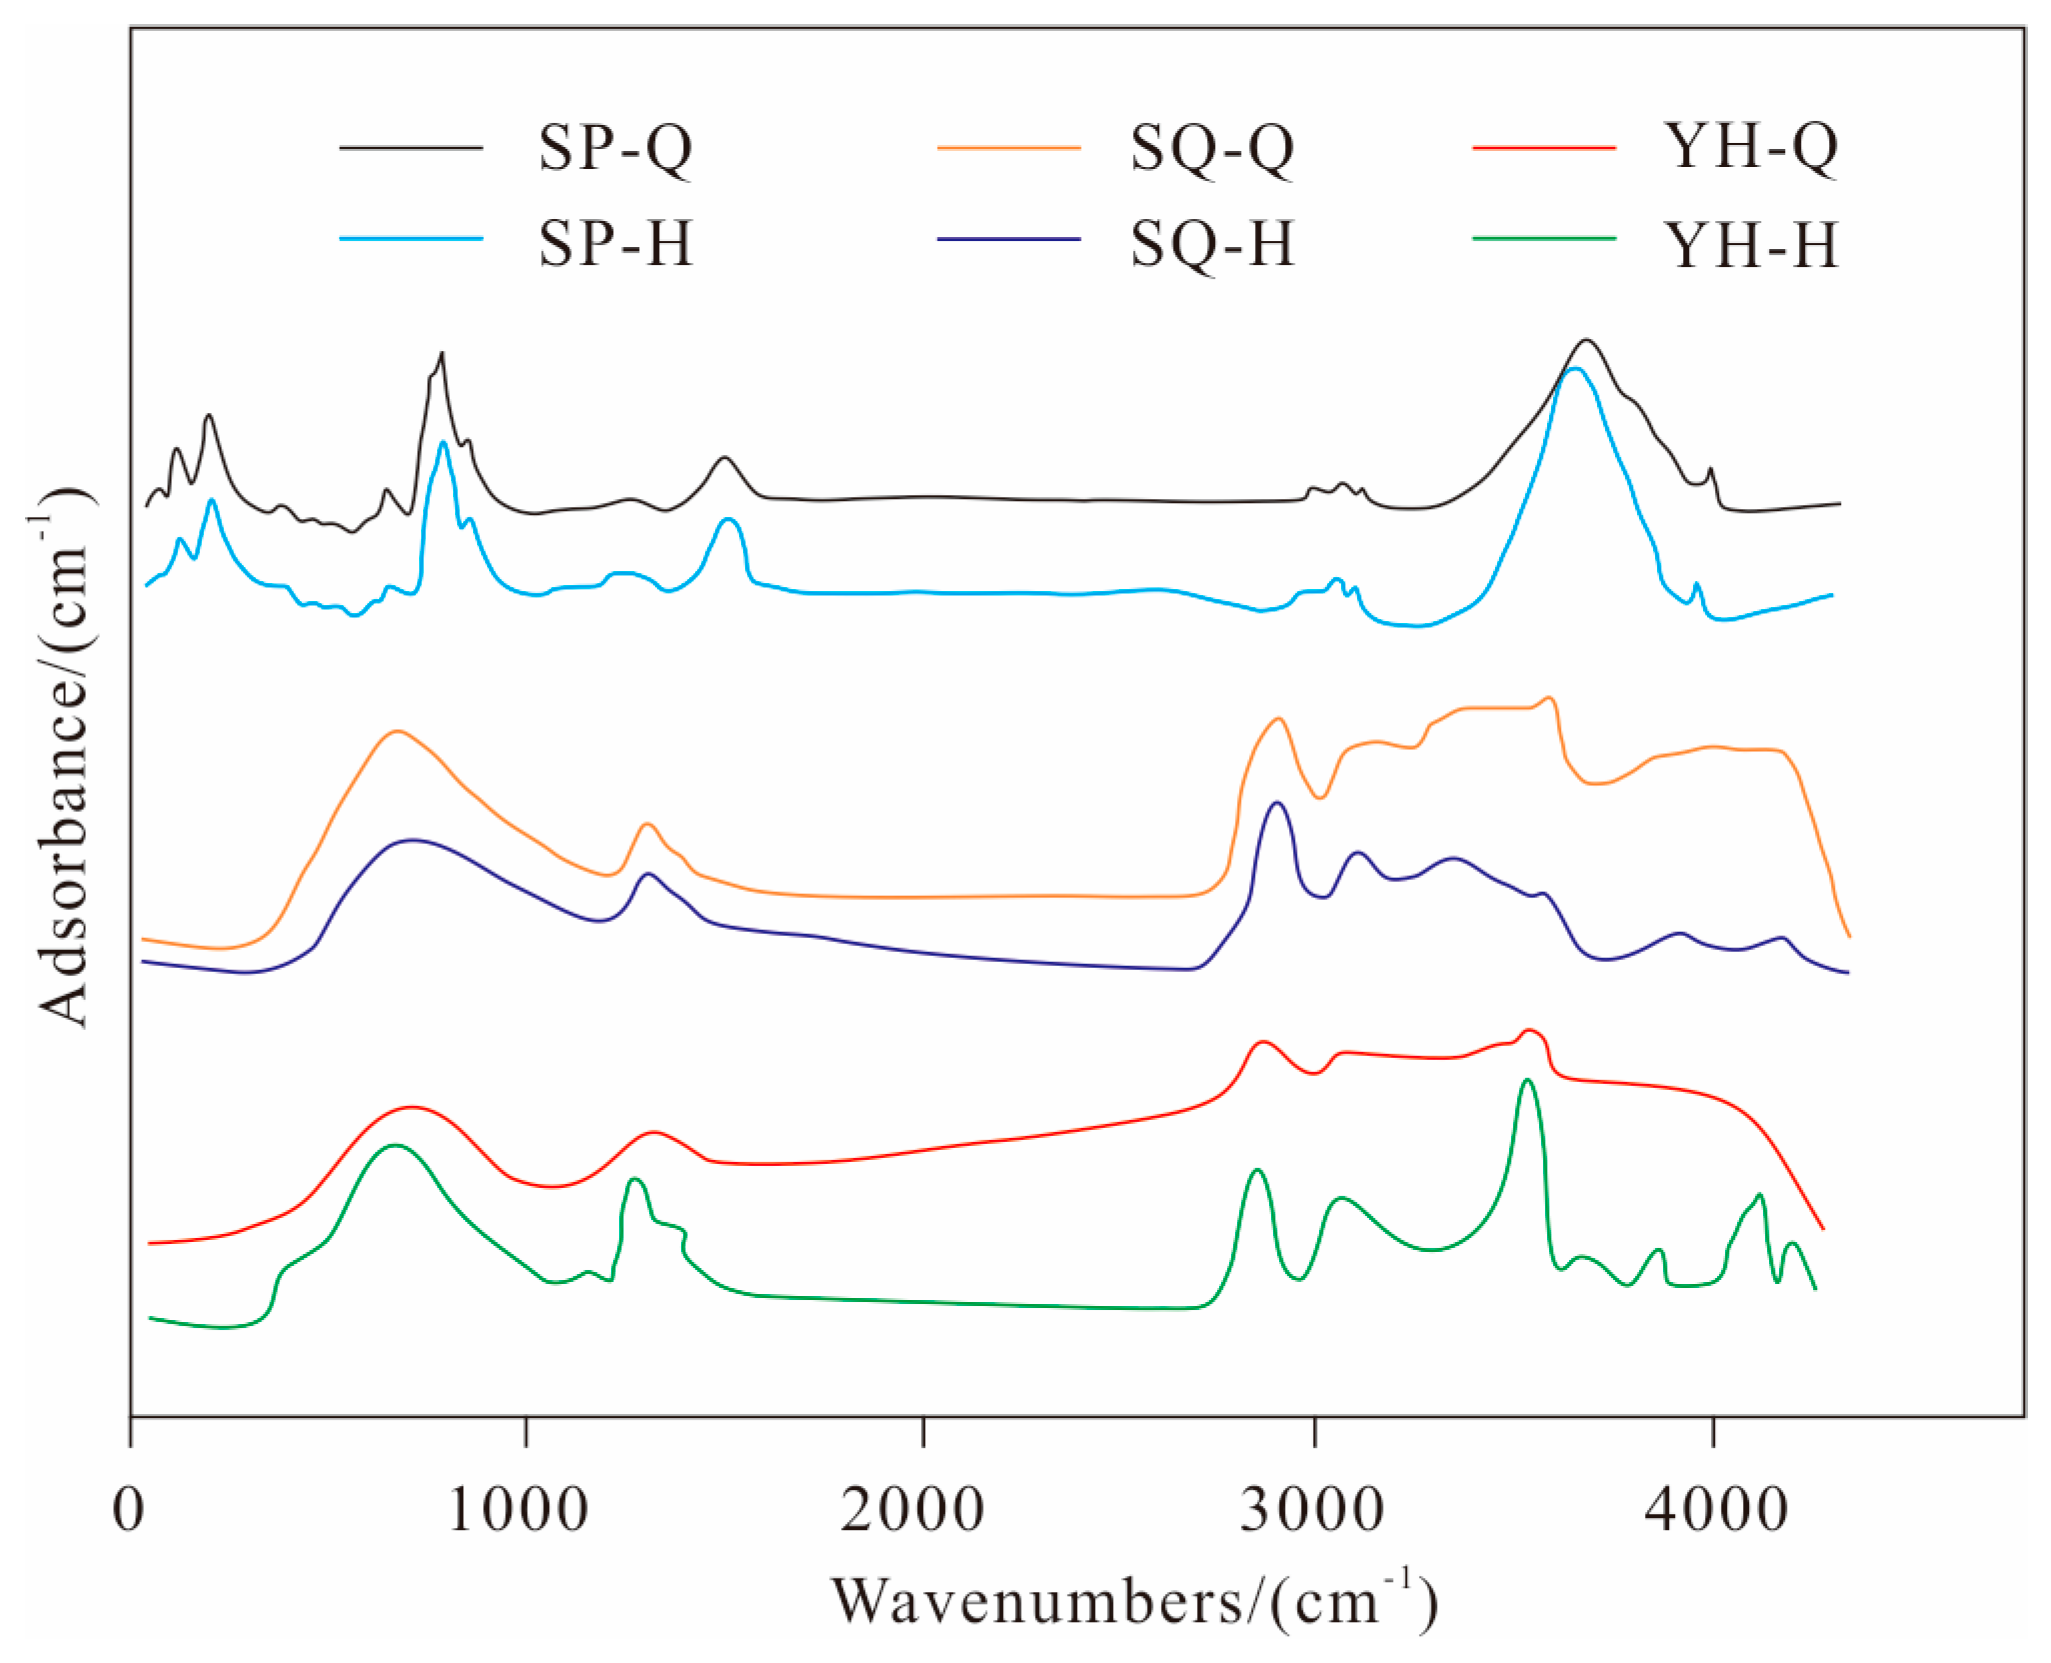
FTIR is an important means to study the chemical structure of coal, which can quantitatively characterize the degree of coalification to a certain extent [23]. Figure 2 shows the FTIR of raw coal and fractured coal samples from Shaping, Shaqu, and Yonghong coal mines. It can be seen that the peak profile type of coal samples changes to varying degrees before and after HPWI treatment.
Due to the phenomenon of overlapping infrared spectral peaks, it is necessary to use infrared overlapping spectral band peaking technology to improve the accuracy of quantification of infrared spectral peaks [21,22,23]. In this paper, Origin8.5 software was used to carry out infrared peaking fitting, ensuring that the fitting coefficient reached the standard of 99.9% or more, and the attribution of each functional group was determined by each fitting peak position after fitting. Among them, the changes of coal chemical structure and before and after HPWI treatment were analyzed mainly from three aspects: oxygen-containing functional group (infrared spectrum 1000–1800 cm−1), aliphatic hydrocarbon (infrared spectrum 2800–3000 cm−1), and hydrogen bond (infrared spectrum 3000–3700 cm−1).

3.2.1. Oxygen Functional Groups in Coal (1000–1800 cm−1)

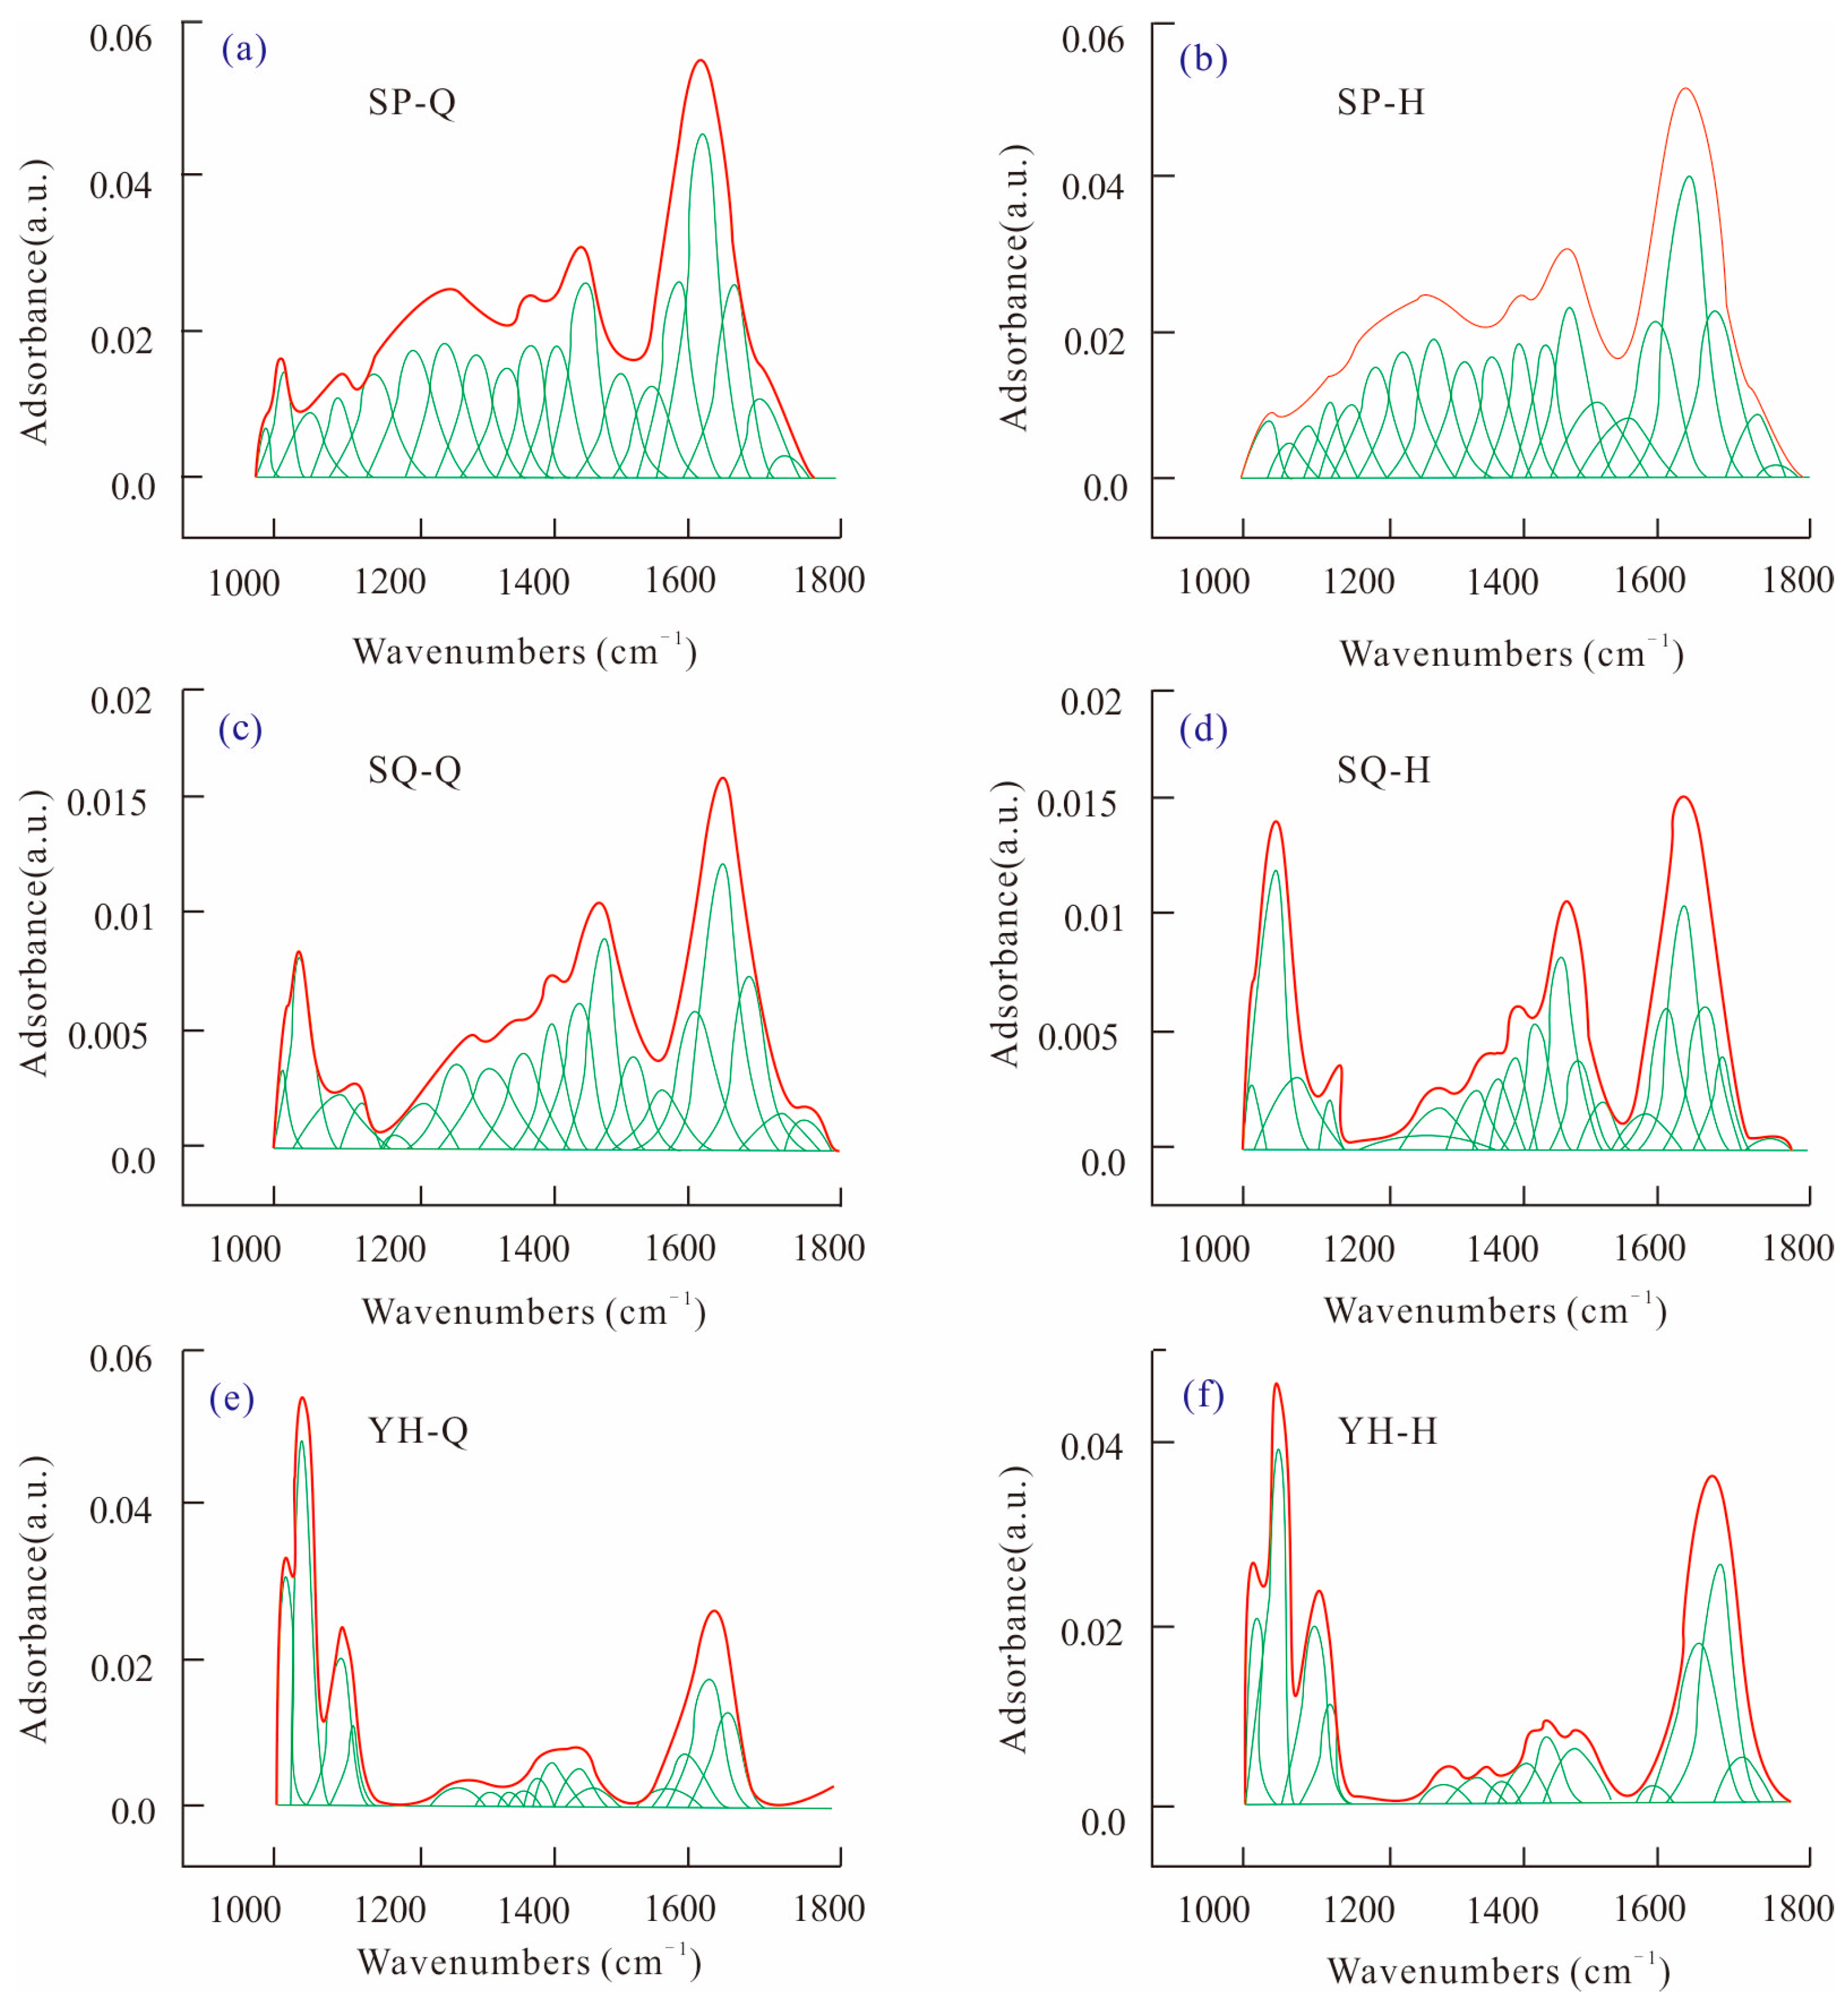
Oxygen in coal mainly exists in the form of water, inorganic oxygen-containing compounds, and oxygen-containing functional groups, among which the oxygen in the form of oxygen-containing functional groups has a greater impact on the properties of coal [30,31]. The oxygen-containing functional groups in coal mainly include carboxyl, carbonyl, hydroxyl, etheroxy, methoxy, and other types. Among them, hydroxyl and ether oxygen are the main functional groups. In the range of 1000–1800 cm−1, it mainly includes the infrared absorption fluctuations of the ether–oxygen bond, carboxyl group, and carbonyl group oxygen-containing functional groups, as well as the deformation vibration of CH3, C=C, and C=O stretching vibration.
The oxygen-containing functional groups of coal samples were fitted by peak separation before and after HPWI treatment, as shown in Figure 3. The regression coefficients were all above 99.9%, indicating a good degree of fitting. According to the peak area, the content of oxygen-containing functional groups in Shaping coal is obviously higher than that in Shaqu coal and Yonghong coal, and the content of oxygen-containing functional groups in Shaqu coal is the lowest.
The peak fitting results of the three groups of coal samples were statistically analyzed, and the relative contents of each oxygen-containing functional group in the coal samples were obtained, as shown in Table 2. The ‘relative content’ values represent the percentage of the total peak area. The ash content of Yonghong coal is the highest, while the ash content of Shaping coal is the least. Among the three kinds of coal samples, the phenols, alcohols, ethers, phenoxy groups, C–O stretching vibration in ester, and C=C vibration of aromatic hydrocarbons in Yonghong anthracite are obviously higher, indicating that oxygen is mainly in the form of non-active oxygen in coal with high metamorphism. This is consistent with previous experimental results [32].
The type and content of functional groups in coal will be changed by HPWI treatment. In the 1000–1800cm−1 coal sample, the absorption peaks are mainly C–O single bond, C=O double bond, and C=C double bond. The peak area content is more than 60% of the total area. After HPWI treatment, the ash content in coal changes to different degrees. The content of Ash in Shaqu coal and Yonghong coal decreases by 2.29% and 27.91%, while it increases by 297.87% in Shaping coal. The C–O bond content in Shaping coal and Yonghong coal decreases by 6.32% and 15.19%, while the C–O bond content in Shaqu coal increases by 50.96%, which reflects that the HPWI treatment changes the content of phenols, alcohols, ethers, phenoxy groups, and esters in coal to different degrees. The content of C=O in Shaping coal and Yonghong coal increases by 2.44% and 27.84%, respectively.
The change of ash, C–O, and C=O content in coal is caused by the change of aromatic hydrocarbon and oxygen-containing group in coal structure and mineral content in coal matrix after HPWI treatment. According to the C=O stretching vibration in coal and the weak peak at 2840 cm−1, it can be inferred that there are aldehyde and ketone groups in the molecular structure of coal. After HPWI treatment, the intensity of the C=O stretching vibration changes, and the content of aldehyde and ketone groups in coal changes.

3.2.2. Aliphatic Hydrocarbons in Coal (2800–3000 cm−1)

There are three kinds of fatty substances in coal, i.e., methyl, methylene, and methylene. In the infrared spectrum, the adipose stretching vibration range is 2990–2800 cm−1, and there are three large absorption peaks at 2953 cm−1, 2921 cm−1, and 2851 cm−1. The absorption peak at 2953 cm−1 reflects the antisymmetric CH3 stretching vibration in coal, and the absorption peak at 2921 cm−1 is the antisymmetric CH2 stretching vibration in coal. The absorption peak at 2851 cm−1 is a symmetric CH2 stretching vibration.
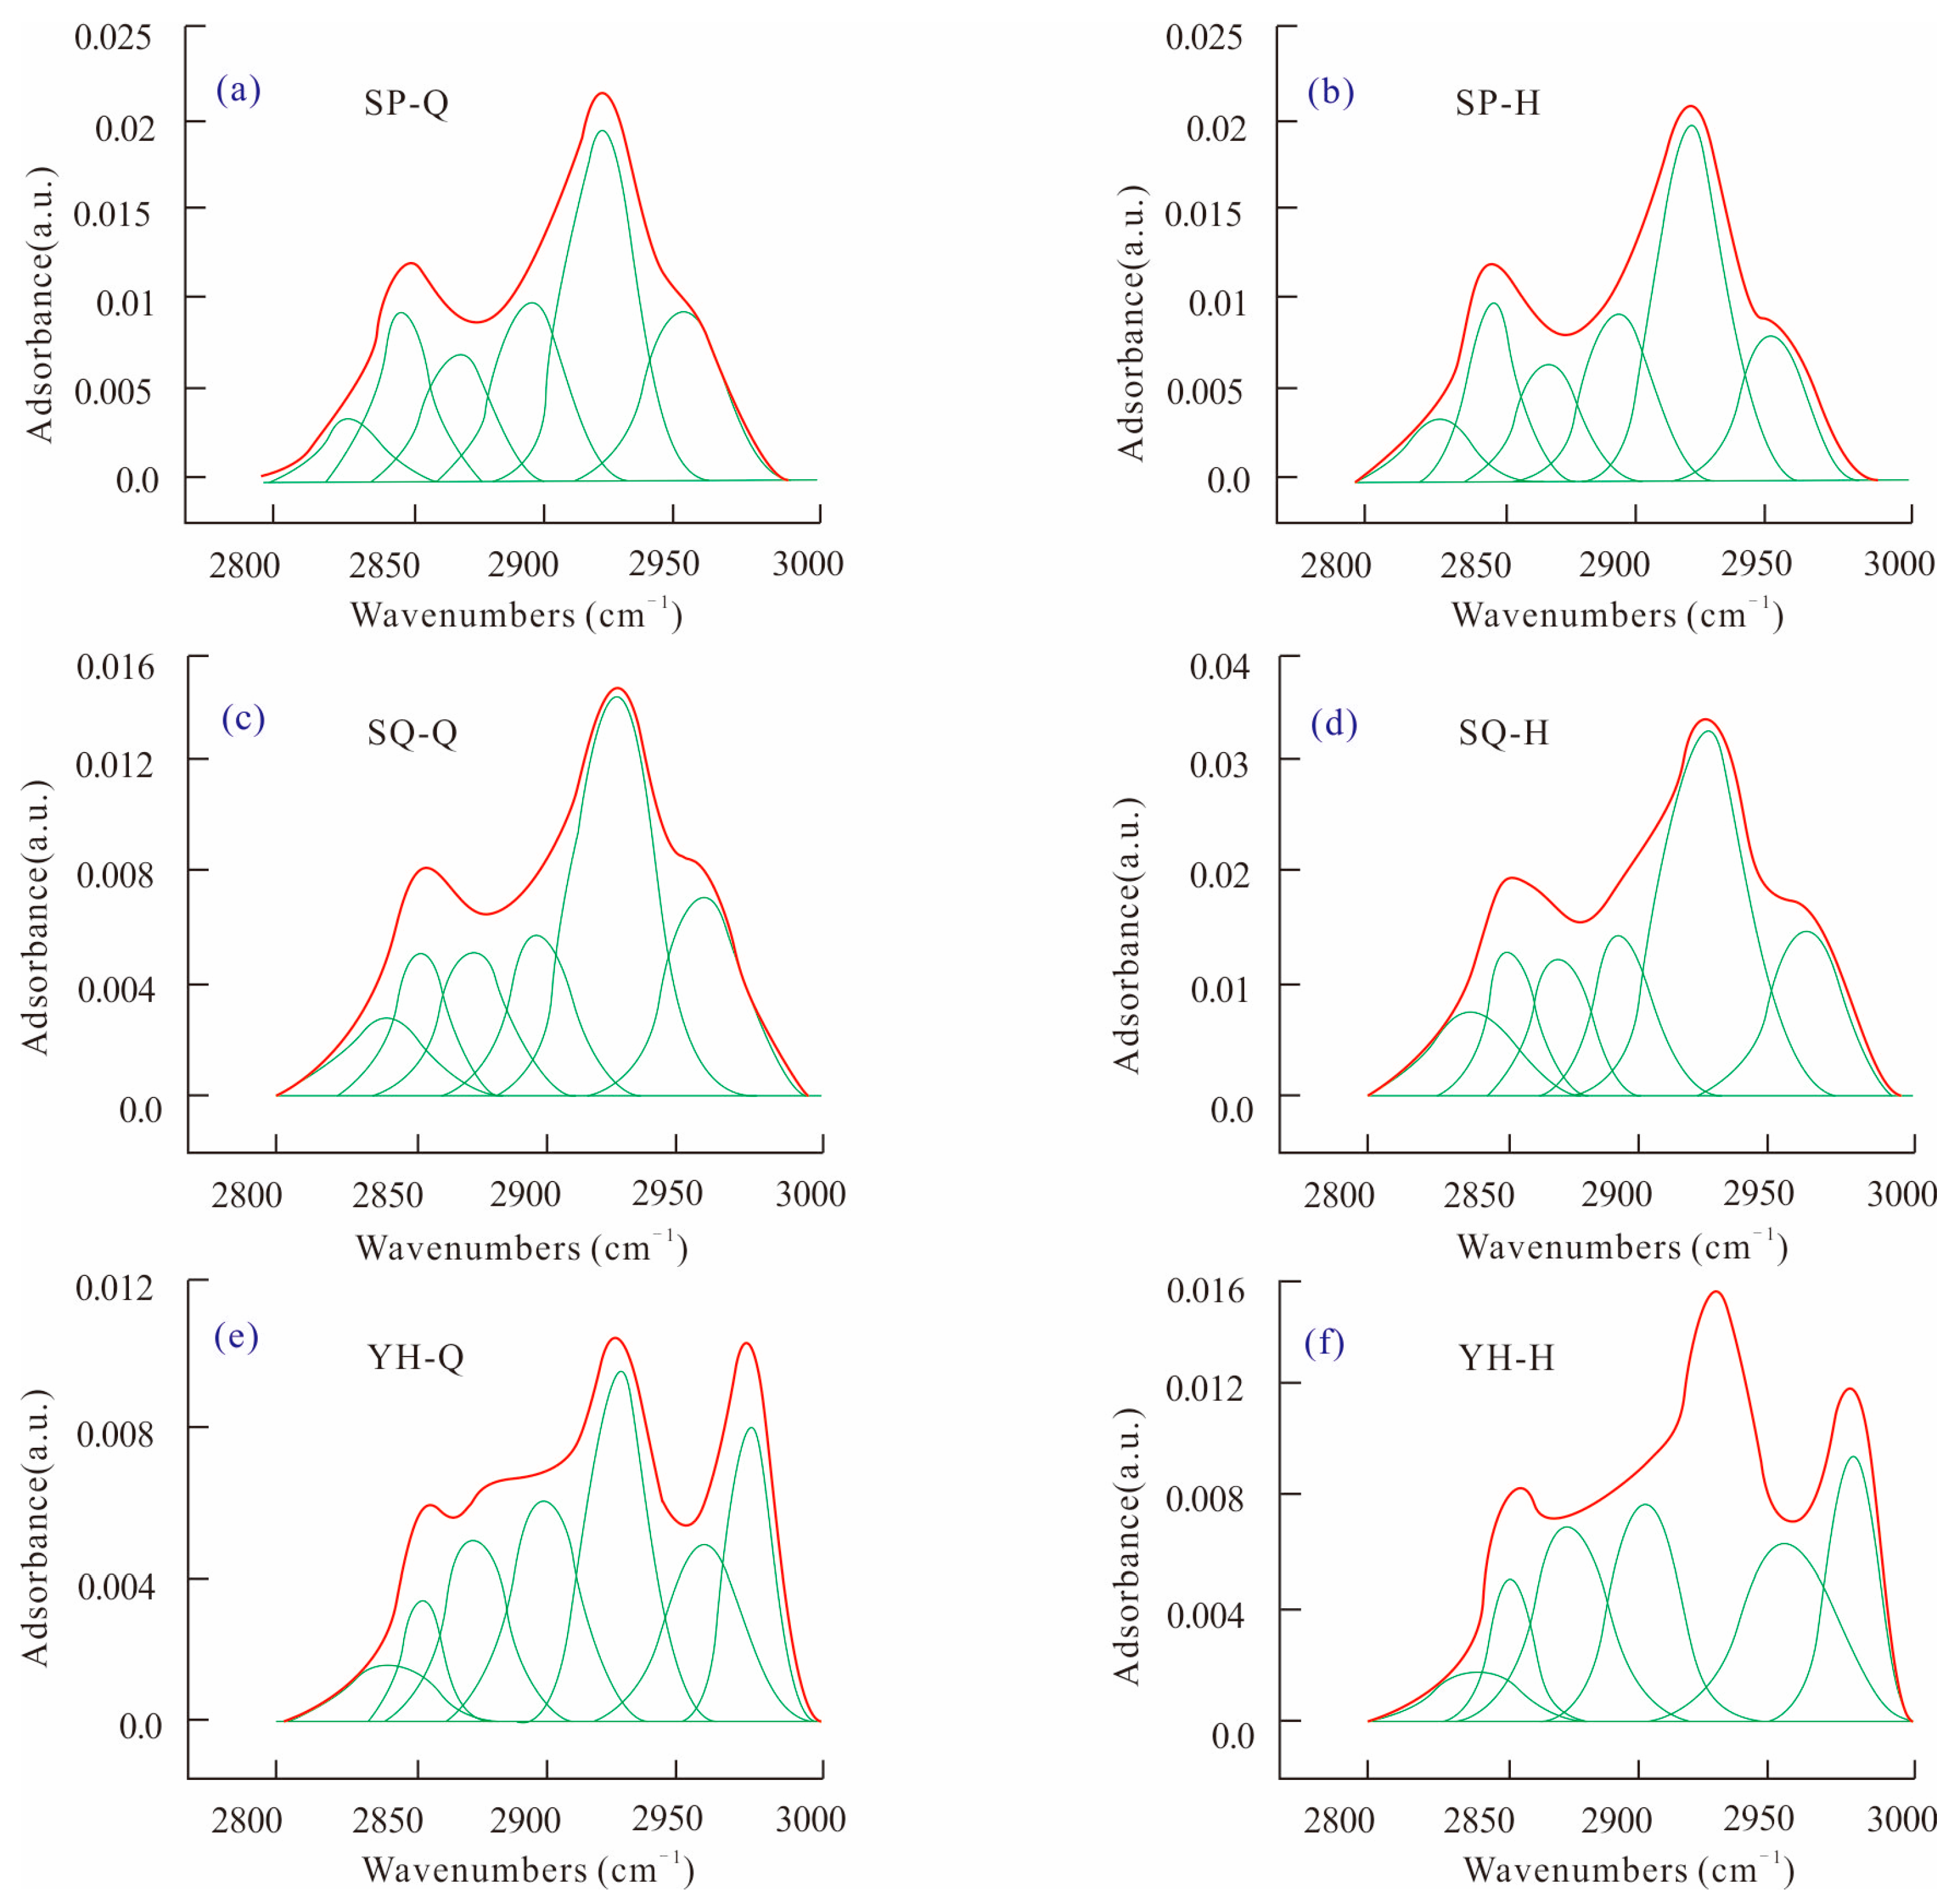
The absorption peak of 2800–3000 cm−1 is the absorption range of C-H in the FTIR spectrum of the fat chain and lipid ring. The aliphatic hydrocarbons in coal mainly include methyl group, methylene group, and methylene group. The fitting spectra of Shaping, Shaqu, and Yonghong coal samples between 2800 and 3000 cm−1 before and after HPWI treatment are shown in Figure 4.
The peak fitting results of the three groups of coal samples were statistically analyzed, and the relative contents of each aliphatic hydrocarbon in the coal samples were obtained, as shown in Table 3. It can be seen that asymmetric CH2 and CH3 stretching vibrations are the two main absorption peaks of coals. Yonghong coal is mainly dominated by antisymmetric RCH3, followed by antisymmetric R2CH2, and Shaping coal and Shaqu coal are mainly dominated by antisymmetric R2CH2. Among them, the objection R2CH2 of Yonghong coal is much smaller than that of Shaping coal and Shaqu coal, the objection RCH3 content increases with the increase in metamorphism degree, and the objection RCH3 of Yonghong coal is much larger than that of Shaping coal and Shaqu coal. The aliphatic hydrocarbon content of Yonghong coal is significantly different from that of Shaping coal and Shaqu coal, indicating that during the evolution of coal, the straight chain part of fat will decrease and the number of branched chains will increase.
After HPWI treatment, the infrared absorbance increases significantly, but the peak shape change is not very obvious. The R2CH2 contents increase by 19.75% and 12.5% in Shaping coal and Shaqu coal, while decreasing by 6.48% in Yonghong coal. The RCH3 content increases by 21.11% in Yonghong coal, while it decreases by 19.09% and 24.01% in Shaping coal and Shaqu coal. These changes imply that the branched degree of the alkane chain decreases and the order is better after HPWI treatment. The branched chain of aliphatic hydrocarbon increases, and the branched chain decreases in the coal molecules of Shaping fractured coal and Shaqu fractured coal. However, the branched chain of aliphatic hydrocarbon increases, and the branched chain decreases in the coal molecules of the Yonghong fractured coal.
The change of the content of asymmetric methylene and asymmetric methylene in the three groups of coal samples indicates the change of the degree of H shedding in coals. The change trend of aliphatic hydrocarbons in Yonghong coal is different from that of Shaping coal and Shaqu coal, because the evolution of Yonghong anthracite has matured, and the chemical properties of coal have changed greatly compared with those of middle and low-rank coal [21,23]. In addition, the peak area of Yonghong coal and Shaping coal decreased after HPWI treatment, indicating that the alkane in coal decreased, while the peak area of Shaqu coal increased after HPWI treatment, indicating that the alkane in coal increased.

3.2.3. Hydrogen Bonds in Coal (3000–3700 cm−1)

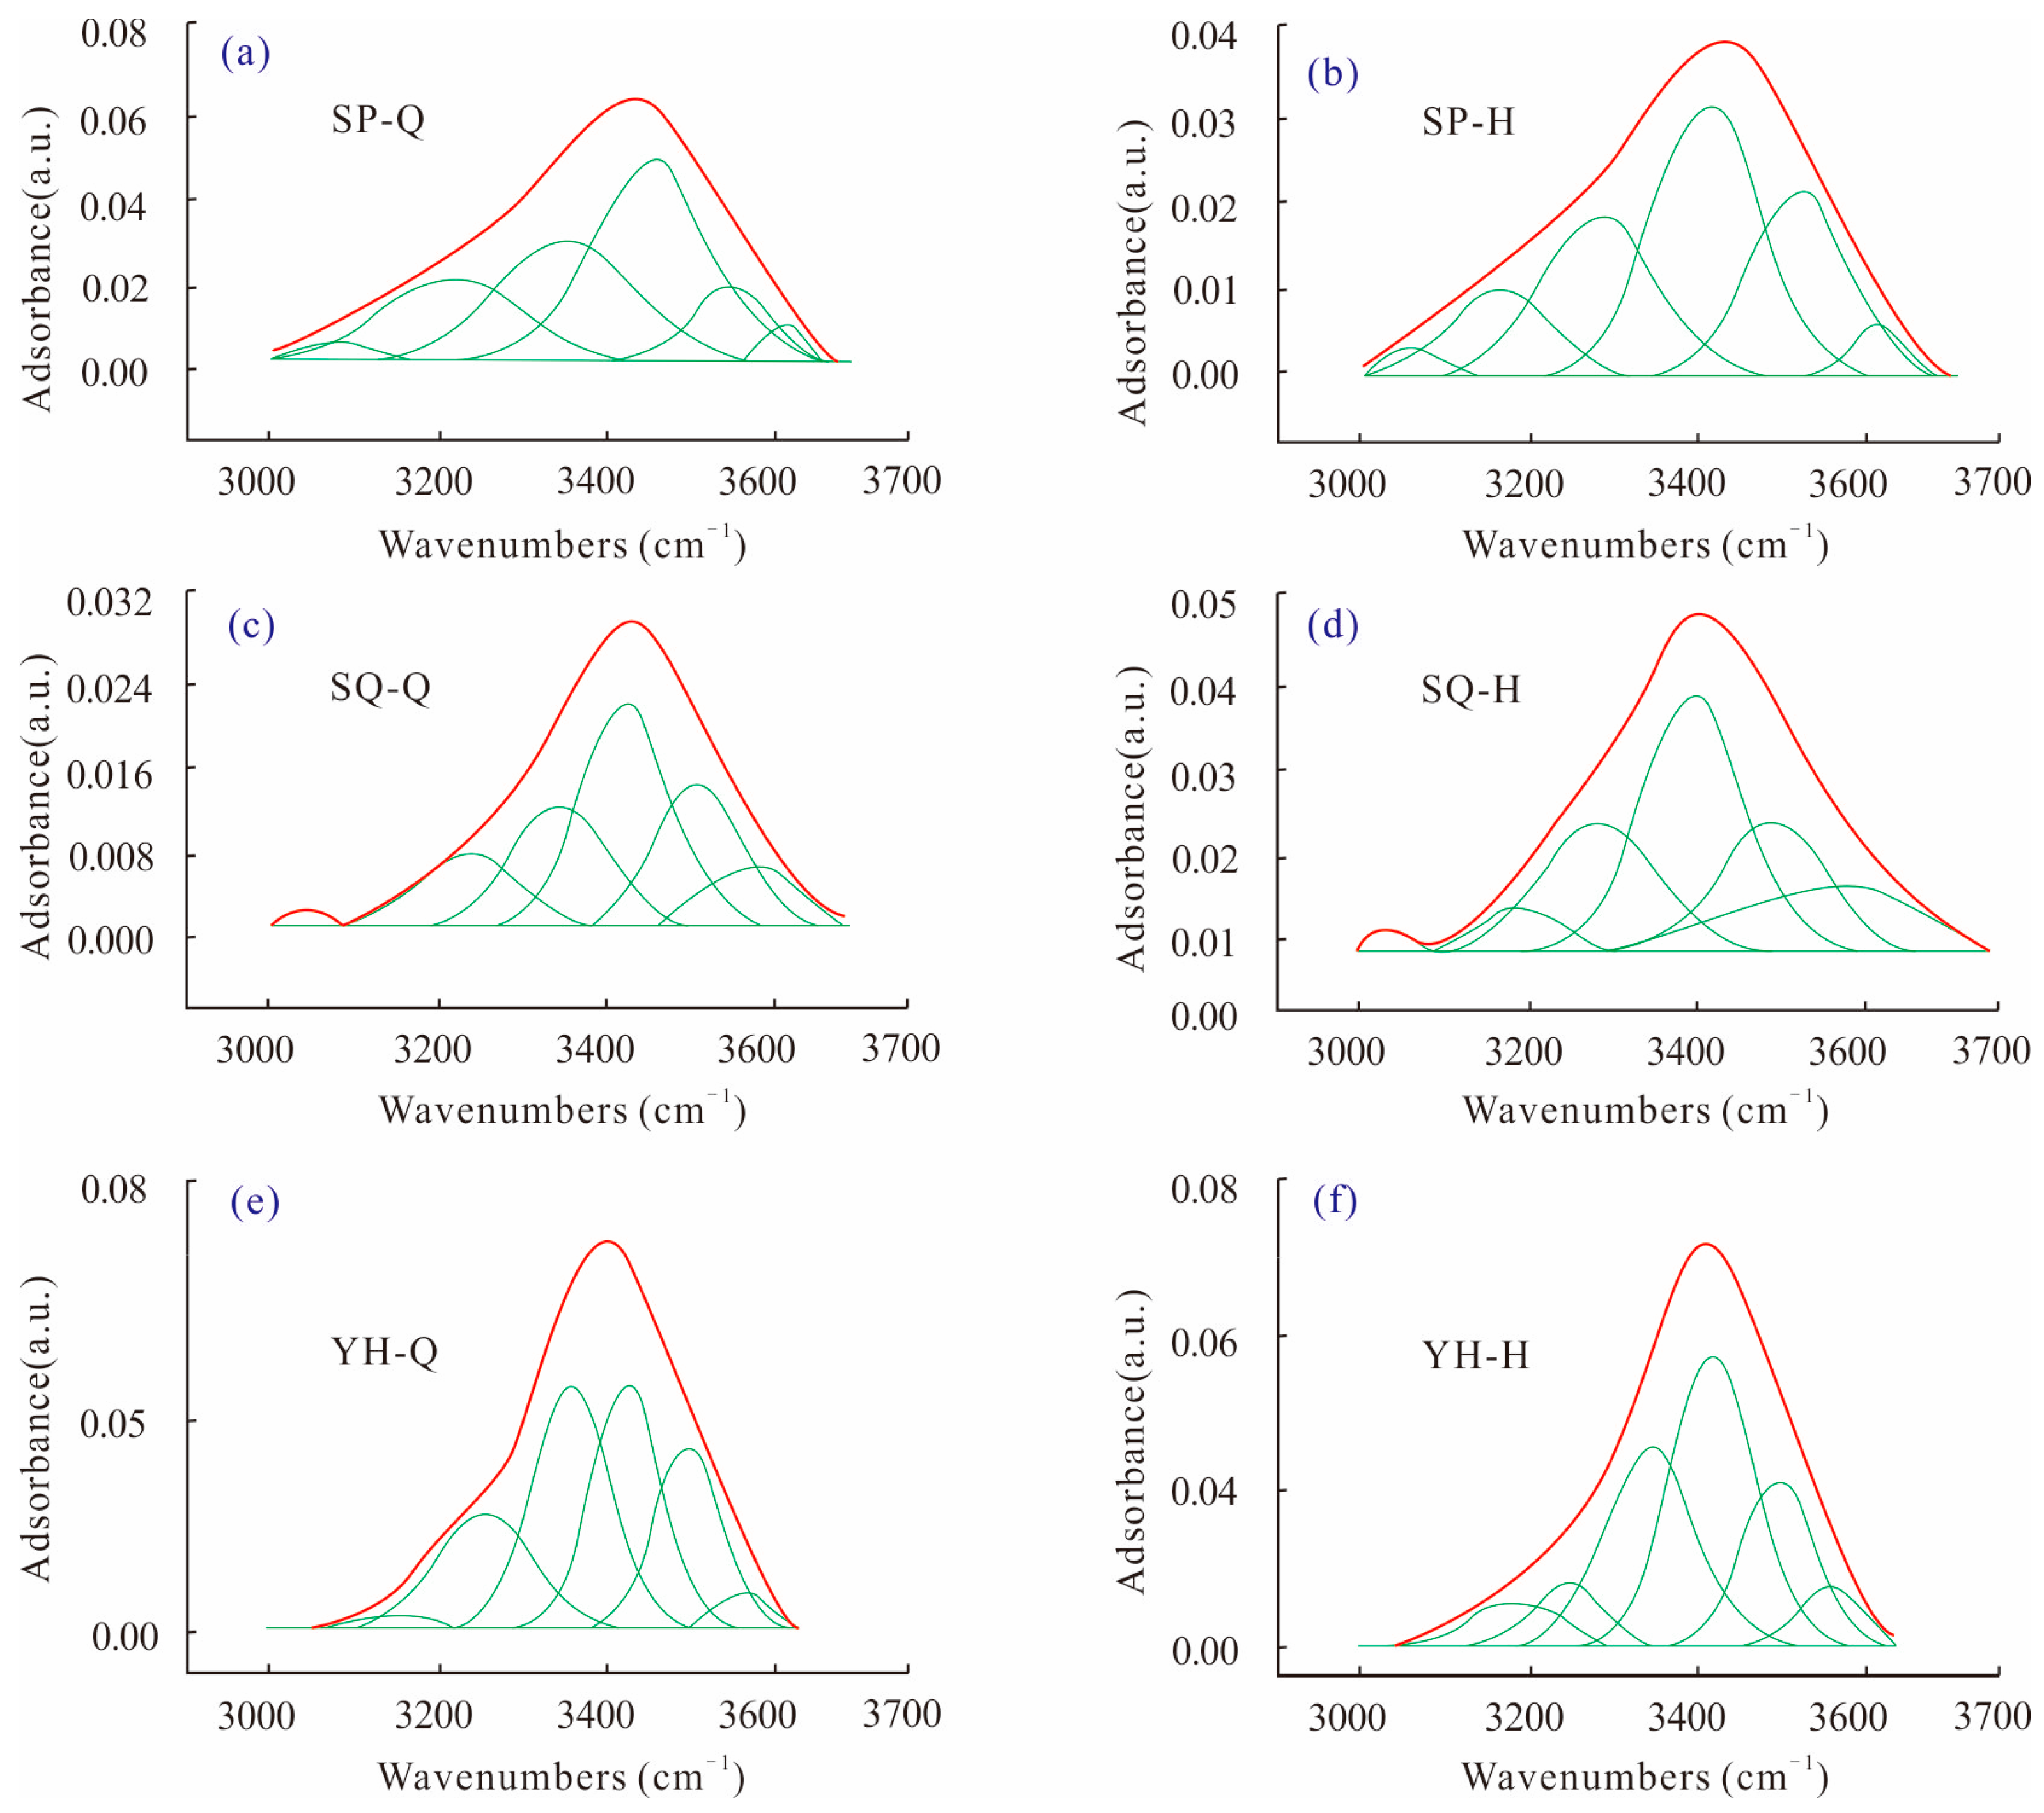
The most important functional group in hydrogen bonding is the hydroxyl group, which is the main non-covalent bond for the construction of coal macromolecular structure and is most closely related to the surface properties of coal. Among them, the polymer that accounts for a large proportion of the total hydroxyl group is the specific manifestation of the association structure in coal structure. According to relevant literature [33,34,35], there are six types of hydroxyl groups in coal. The fitting spectra of coal samples between 3000 and 2800 cm−1 before and after HPWI treatment in Shaping, Shaqu, and Yonghong coals are shown in Figure 5.
The peak fitting results of the three groups of coal samples were statistically analyzed, and the relative content of each hydrogen bond in the coal samples was obtained, as shown in Table 4. It can be seen that the hydroxy-ether–oxygen bond and hydroxy–hydroxy–hydrogen bond are the two main components of coal. Among them, Yonghong coal has the most hydroxy–ether–oxygen bond and no hydroxy–N bond, and Shaping coal and Shaqu coal have the most hydroxy–hydroxy–hydrogen bond. With the increase in coal rank, the content of hydroxy–N bond gradually decreases and disappears, and the content of hydroxy–hydroxy-hydrogen bond gradually decreases, indicating that the hydroxy–N bond and hydroxy–hydroxy–hydrogen bond have been destroyed in the coal evolution process. With the increase in coal rank, the number of ring-associated hydroxyl groups decreases, which is related to the continuous shedding of hydroxyl groups during coal evolution. The content of the hydroxy–ether–oxygen bond in Yonghong coal is the highest because there are more oxygen elements in the form of ether oxygen in Yonghong coal, which increases the probability of the hydroxy–ether–oxygen bond.
After HPWI treatment, the content of cyclic associated hydroxy–hydrogen bond decreases by 41.25%, 63.92% and 65.86% in Shaping, Shaqu, and Yonghong coals, and the content of free hydroxyl group increases by 57.92%, 58.42%, and 93.71%. And the content of the hydroxy–ether–oxygen bond decreases in Shaping coal and Yonghong coal, but increases in Shaqu coal, which is consistent with the change trend of the ether–oxygen bond after HPWI described above. The content of the hydroxy–N bond and hydroxy–hydroxyl–hydrogen bond decreases in Shaping coal, but increases in Shaqu coal and Yonghong coal. The content of the hydroxy–P hydrogen bond increases in Shaqu coal, but decreases in Shaqu coal and Yonghong coal. The differences in the variation trend of Shaping coal after HPWI are caused by the low evolution degree of low-rank coal.
After HPWI treatment, the changes of hydrogen bonds in different coal ranks are different, because the interaction mechanism between hydrogen bonds and water in different coal ranks is different, and the sensitivity to water is also different. As pointed out by Kang et.al. [36] in their study on the structure and spectral properties of typical hydrogen-bonded organic crystals under high pressure, high pressure causes the formation of new hydrogen bonds, while the original hydrogen bonds are broken, and the hydrogen bond network is rearranged, which leads to the change of crystal structure symmetry. It can be inferred that the size and type of intramolecular and intermolecular hydrogen bonds in coal samples change when the hydroxyl group transitions from a free state to a bound state under HPWI treatment. The high-pressure action of water makes the arrangement of coal molecules denser and more orderly, and changes the configuration of coal molecules. Hydrogen bonds with weak bond energy in coal molecules will break under high pressure, and the interaction between water and coal molecules will also lead to the formation of some new bonds.
3.3. Analysis of Infrared Spectral Structure Parameters of Samples

The structural parameters of the infrared spectrum can be used to analyze the macromolecular structure of coal, which is very important for studying the structural properties of coal. Many scholars have proposed an analysis method to calculate the infrared structural parameters of coal [21,32,37,38]. The microstructure of different chemical components of coal samples can be characterized by using the infrared structure parameters calculated from the peak area fitted by the infrared spectrum. The main infrared structural parameters of coal are calculated as shown in Equations (1)–(6).
(a)
Aromatization-carbon ratio (farc)
It is used to characterize the percentage of carbon atoms in an aromatic compound relative to the total carbon atoms (see Equation (1)). Where, Cal/C is the relative content of fatty carbon in total carbon, Hal/H is the relative content of fatty hydrogen in total hydrogen, as shown in Equation (2).
f ar c = C ar C = 1 C al C = 1 ( H al H × H C ) / H al C al
H al H = A ( 3000 ~ 2800 ) A ( 3000 ~ 2800 ) + A ( 900 ~ 700 )
  • (b) Degree of condensation of aromatic rings (DOC)
It represents the degree of substitution and condensation of coal and aromatic structures, as shown in Equation (3).
D O C = A ( 900 ~ 700 ) A ( 1600 )
  • (c) Hydrogen enrichment degree parameter (I, I1, I2)
The “I” represents the degree of hydrogen enrichment of coal and the CH3 removal degree, as shown in Equation (4). The “I1” represents the asymmetrical CH2 removal degree, as shown in Equation (5). The “I2” represents the symmetrical CH3 removal degree, as shown in Equation (6).
I = A ( 2964 ) A ( 1618 )
I 1 = A ( 2924 ) A ( 1618 )
I 2 = A ( 2850 ) A ( 1618 )
Based on the above equations, the calculation results of the main infrared structural parameters of the three groups of coal samples are shown in Table 5. Higher DOC or farc and lower I values physically reflect the degree of aromatic ring condensation of the coal structure under high pressure, i.e., the coal structure becomes more compact. It can be seen that with the increase in the degree of coal evolution, the DOC rises, indicating that the relative content of stable aromatic hydrogen increases, and the coal is evolving in an ordered direction. The farc decreases with the increase in coal rank, while the DOC increases with the increase in coal rank. The aromatic carbon content of shaping coal and Shaqu coal is higher than that of Yonghong coal, which may be due to the relatively high proportion of inert groups in the coal. The hydrogen enrichment degree parameter of Yonghong raw coal is significantly higher than that of Shaping raw coal and Shaqu raw coal.
After HPWI treatment, the farc of coal remains almost unchanged, the DOC increases by 20.21%, 126.77% and 0.24% in Shaping, Shaqu, and Yonghong coals, and the I decreases by 16.67% and 51.46% in Shaping and Yonghong coals, indicating that after HPWI treatment, the ordering of coal becomes better, and the content of methylene carbon in the form of long straight chain increases. The hydrogen enrichment parameters of coal samples change to different degrees after HPWI treatment, and the hydrogen enrichment parameters of Yonghong fractured coal decreased significantly. The difference in the changes of Shaping coal, Shaqu coal, and Yonghong coal after HPWI treatment may be related to the two coalification jumps in the evolution process of coal, which leads to the difference in molecular structure of high rank coal and low and medium rank coal.

3.4. Analysis of Wettability Parameters of Samples

Wetting phenomenon is the macroscopic manifestation of the microstructure and properties of solid surface, the surface and interface properties of liquid, and the interaction between solid–liquid two-phase molecules. The surface wettability of coal refers to the strength of the interface phenomenon of the interaction between the coal surface and water [39]. A common wettability phenomenon is the process in which gas on the coal surface is replaced by liquid. Coal wettability directly influences the irreducible water content, which can significantly alter the relative permeability of the gas and water during CBM production [40,41,42].
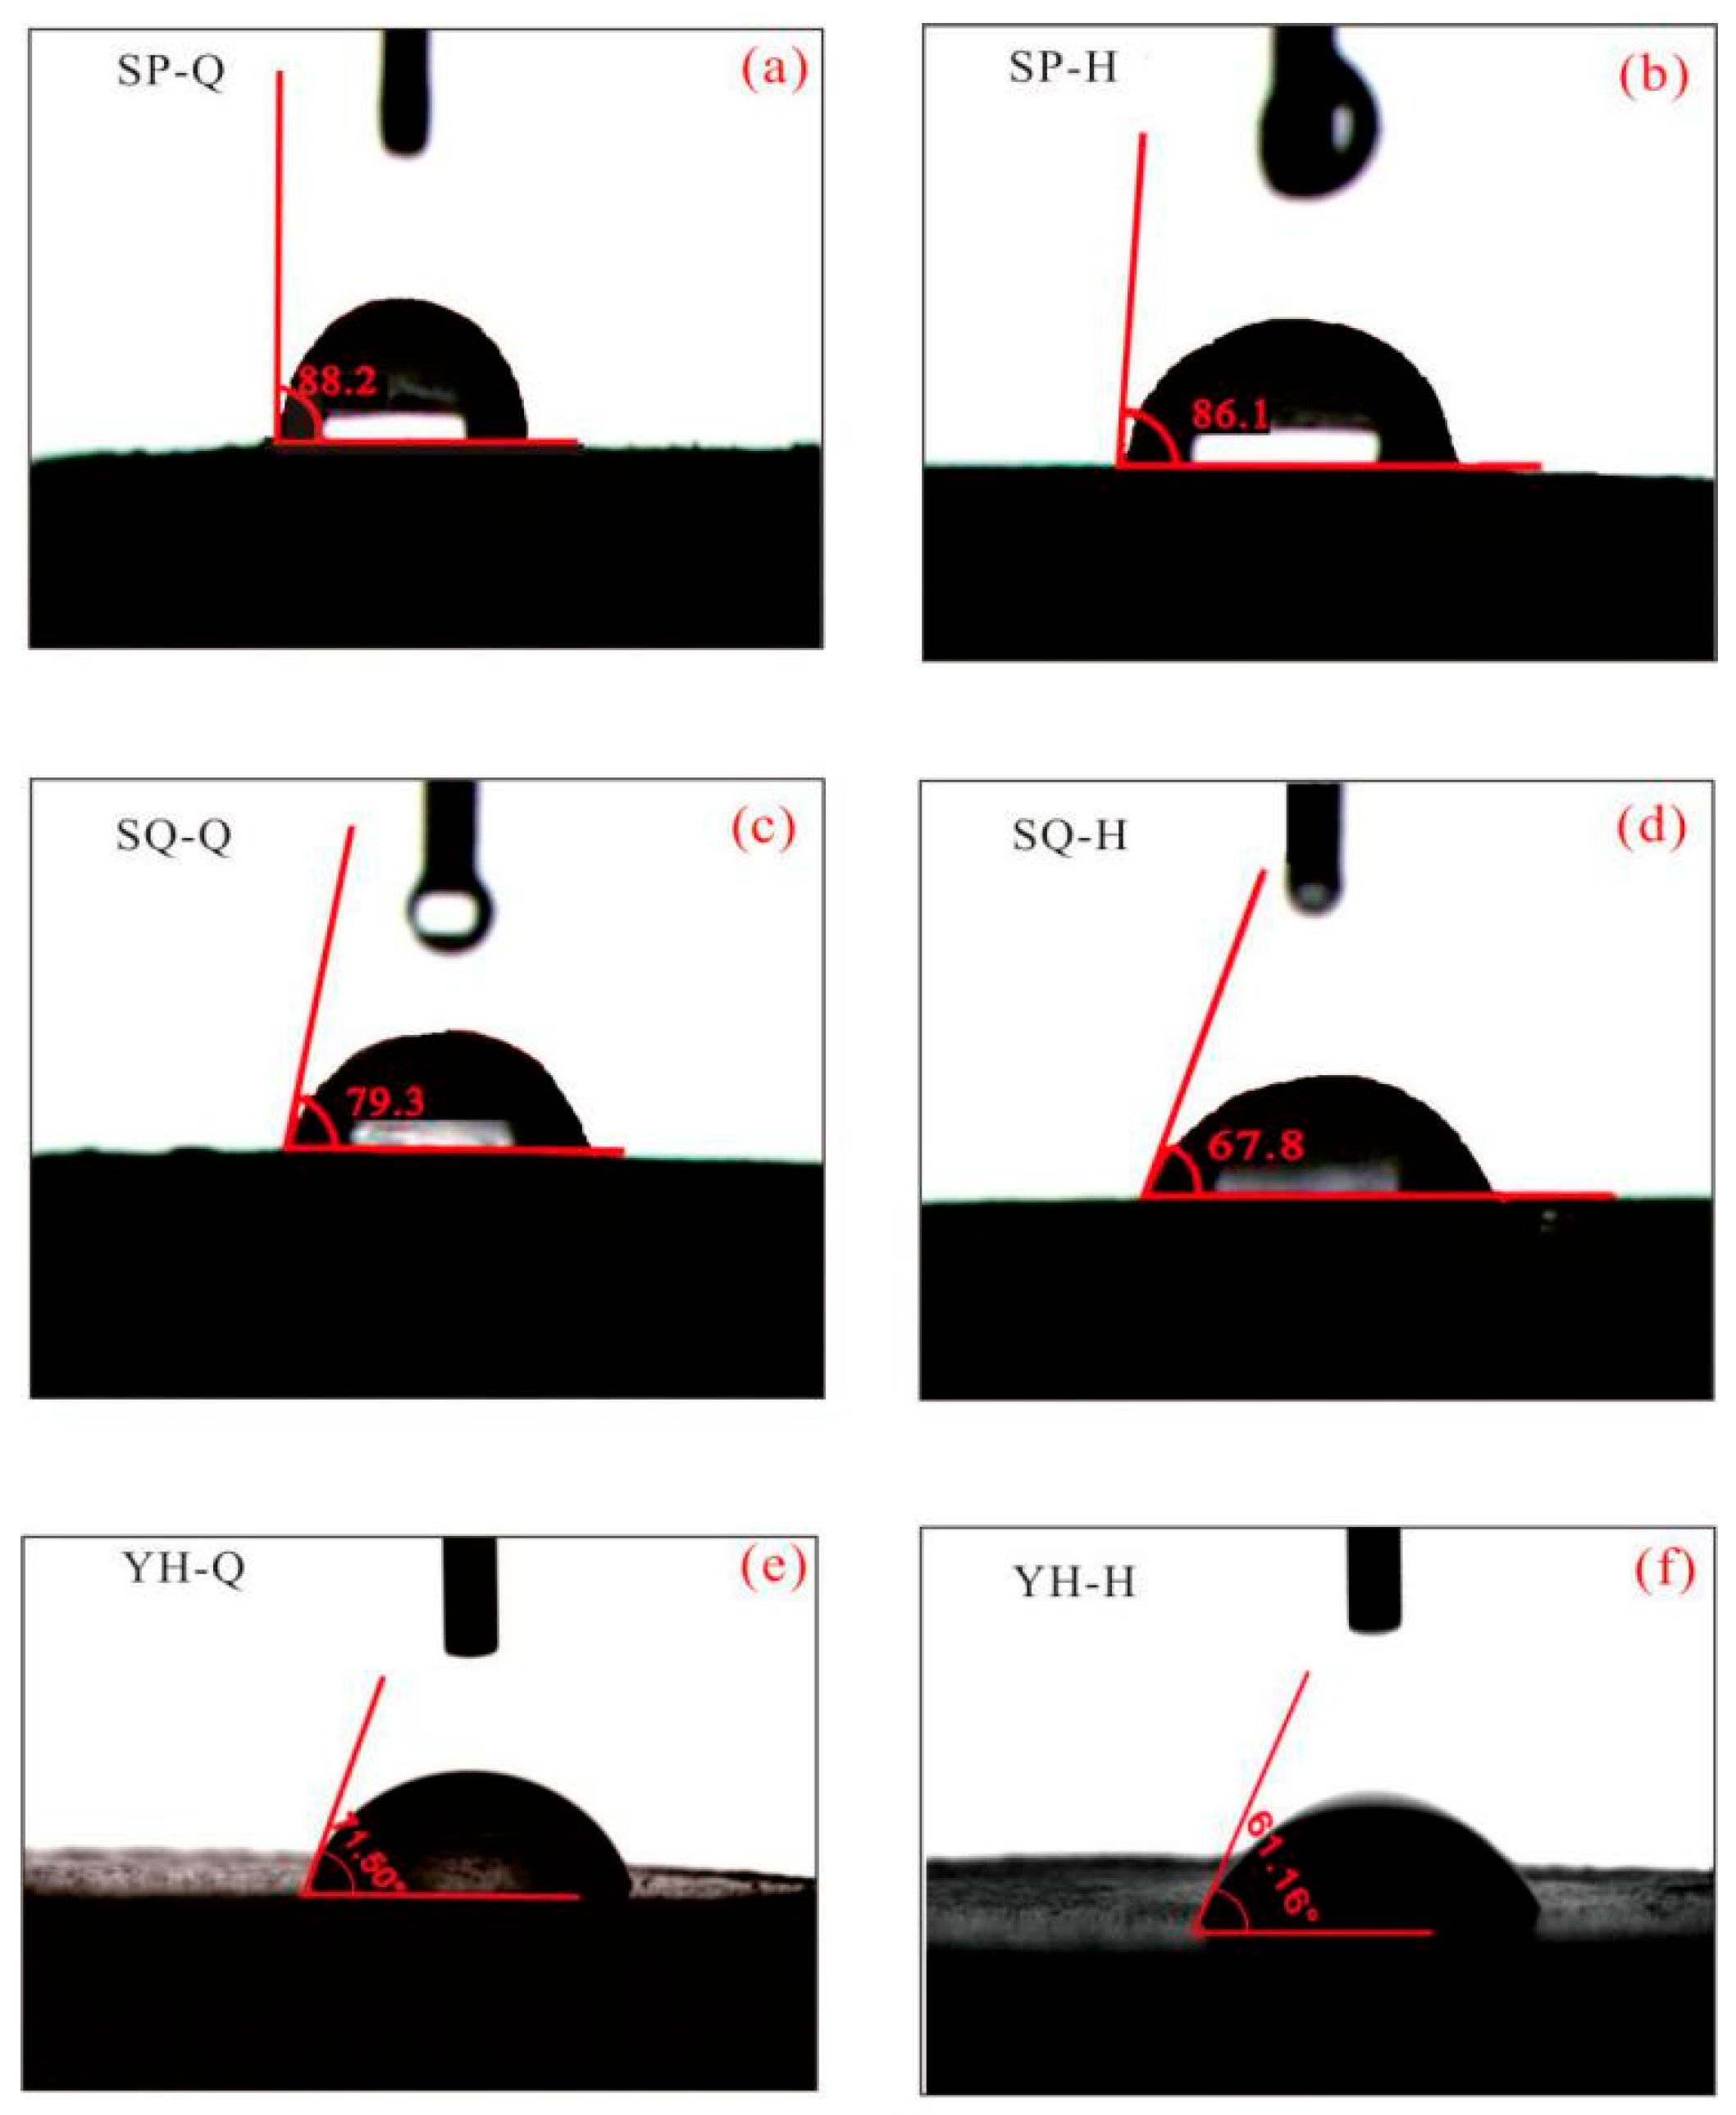
In order to study the damage caused by high-pressure fracturing fluid to the wettability of coal reservoir, this paper conducts wetting contact angle tests on Shaping, Shaqu, and Yonghong raw coal and fractured coals. We carried out sample preparation and contact angle testing under the operation of professional laboratories and personnel, which can eliminate the influence of environmental pollution on the test results. The test results are shown in Figure 6. The results show that the wetting contact angle decreases with the increase in coal rank. The results also show that the contact angle tests show that the wetting contact angle of different rank coals decreased by 2.38% to 14.50% (Table 6), revealing that the hydrophilicity of coals increases after HPWI.
The wettability theory shows that the smaller the wetting contact angle, the stronger the hydrophilicity of coal. It indicates that high-pressure fracturing fluid action would lead to increased hydrophilicity of coal reservoirs and change the surface wettability of coal reservoirs, thus affecting the distribution and seepage of multiphase fluids inside the reservoirs. According to the data on wetting contact angle reduction and wetting contact angle reduction rate, the Shaqu coal and Yonghong coal are much higher than that of Shaping coal. This shows that the damage effect of high pressure on medium and high-rank coal reservoirs is higher than that of low-rank coal reservoirs. Therefore, in the process of CBM development, the water lock effect caused by the fracturing fluid of medium and high-rank coal should be given enough attention.

4. Conclusions

After HPWI, in the wavenumber of 1000–1800 cm−1, the content of Ash in Shaqu and Yonghong coal decreases by 2.29% and 27.91%, while increases by 297.87% in Shaping coal. The C–O bond content in Shaping and Yonghong coal decreases by 6.32% and 15.19%, while the C–O bond content in Shaqu coal increases by 50.96%. The content of C=O in Shaping and Yonghong coal increases by 2.44% and 27.84%, respectively. In the wavenumber of 2800–3000 cm−1, the R2CH2 contents increase by 19.75% and 12.5% in Shaping and Shaqu coal, while decreasing by 6.48% in Yonghong coal. The RCH3 content increases by 21.11% in Yonghong coal, while it decreases by 19.09% and 24.01% in Shaping and Shaqu coal. In the wavenumber range of 3000–3600 cm−1, the content of cyclic associated hydroxy–hydrogen bond decreases by 41.25%, 63.92% and 65.86% in Shaping, Shaqu, and Yonghong coals, and the content of free hydroxyl group increases by 57.92%, 58.42%, and 93.71%.
The farc of coal remains almost unchanged, the DOC increases by 20.21%, 126.77% and 0.24% in Shaping, Shaqu, and Yonghong coals, and the I decreases by 16.67% and 51.46% in Shaping and Yonghong coals, indicating that the ordering of coal becomes better, and the content of methylene carbon in the form of long straight chain increases after HPWI.
The contact angle tests show that the wetting contact angle of different rank coals decreased by 2.38% to 14.50%, revealing that the hydrophilicity of coals increases after HPWI. The decline rate of wetting angles in medium and high-rank coals was significantly higher than that of low-rank coal. This phenomenon discovered that the increase in hydrophilic functional groups caused by HPWI action leads to an increase in the hydrophilicity of coal samples, which is not conducive to the CBM drainage. Therefore, in the process of CBM development, the water lock effect caused by the fracturing fluid of medium and high-rank coal cannot be ignored.

Author Contributions

Y.M.: Conceptualization, Methodology, Writing—review and editing, Supervision, Resources, Project administration. J.L.: Investigation, software, Writing—original draft preparation. K.L.: Visualization, Resources, Writing—review and editing. W.L.: Resources, Writing—review and editing. X.Y.: Writing—review and editing. H.H.: Validation, Writing—original draft preparation. All authors have read and agreed to the published version of the manuscript.

Funding

This research was funded by the National Natural Science Foundation of China (42372194, 42302201, 41702175), the China Postdoctoral Science Foundation (Grant No. 2024T170634).

Data Availability Statement

Data are contained within the article.

Acknowledgments

We also gratefully thank the Post-doctoral Research Workstation in Shanxi Comprehensive Reform Demonstration Zone, Shanxi Huaxin Gas Energy Research Institute Co., Ltd., and Mining Engineering Postdoctoral Mobile station in Taiyuan University of Technology for their strong scientific research support.

Conflicts of Interest

Authors Yanjun Meng, Kunjie Li and Wei Li were employed by the company Shanxi Huaxin Gas Energy Research Institute Co., Ltd. The remaining authors declare that the research was conducted in the absence of any commercial or financial relationships that could be construed as a potential conflict of interest.

Abbreviations

The following abbreviations are used in this manuscript:
CBMCoalbed Methane
HPWIHigh-Pressure Water Injection
FTIRFourier Transform Infrared Spectroscopy
DOCDegree of Condensation of Aromatic rings
farcAromatization-carbon ratio

References

  1. Li, S.; Qin, Y.; Tang, D.; Shen, J.; Wang, J.; Chen, S. A comprehensive review of deep coalbed methane and recent developments in China. Int. J. Coal Geol. 2023, 279, 104369. [Google Scholar] [CrossRef]
  2. Xu, F.; Hou, W.; Xiong, X.; Xu, B.; Wu, P.; Wang, H.; Mao, D. The status and development strategy of coalbed methane industry in China. Petrol. Explor. Dev. 2023, 50, 765–783. [Google Scholar] [CrossRef]
  3. Tao, S.; Chen, S.; Pan, Z. Current status, challenges, and policy suggestions for coalbed methane industry development in China: A review. Energy Sci. Eng. 2019, 7, 1059–1074. [Google Scholar] [CrossRef]
  4. Liu, D.; Jia, Q.; Cai, Y.; Gao, C.; Qiu, F.; Zhao, Z.; Chen, S. A new insight into coalbed methane occurrence and accumulation in the Qinshui Basin, China. Gondwana Res. 2022, 111, 280–297. [Google Scholar] [CrossRef]
  5. Zhang, X.; Lai, F.; Meng, Y.; Xu, X.; Li, H.; Liu, K. Dynamic production characteristics of deep coalbed methane: A case study of Daning-Jixian Block. Energy Fuels 2024, 38, 8700–8711. [Google Scholar] [CrossRef]
  6. Qin, Y.; Moore, T.; Shen, J.; Yang, Z.; Shen, Y.; Wang, G. Resources and geology of coalbed methane in China: A review. Int. Geol. Rev. 2018, 60, 777–812. [Google Scholar] [CrossRef]
  7. Liang, W.; Yan, J.; Zhang, B.; Hou, D. Review on coal bed methane recovery theory and technology: Recent progress and perspectives. Energy Fuels 2021, 35, 4633–4643. [Google Scholar] [CrossRef]
  8. Lu, Y.; Zhang, H.; Zhou, Z.; Ge, Z.; Chen, C.; Hou, Y.; Ye, M. Current status and effective suggestions for efficient exploitation of coalbed methane in China: A review. Energy Fuels 2021, 35, 9102–9123. [Google Scholar] [CrossRef]
  9. Zhu, Q. Theoretical basis of dredging and efficient development of high−rank coalbed methane in China: A case study of the Qinshui Basin. Coal Geol. Explor. 2022, 50, 82–91. [Google Scholar] [CrossRef]
  10. Huang, S.; Liu, D.; Gomez-Rivas, E.; Griera, A.; Gan, Q.; Wang, M.; Xing, Y.; Zhao, Y. Experimental insights into the nucleation and propagation of hydraulic fractures in anthracite coalbed methane reservoirs. Earth Energy Sci. 2025, 1, 123–143. [Google Scholar] [CrossRef]
  11. Zhang, Y.; Meng, Y.; Hao, P.; Shang, Y.; Fu, X. Brittleness Index of High-Rank Coal Reservoir and Its Influencing Factors in Mabidong Block, Qinshui Basin, China. Geofluids 2021, 2021, 5577740. [Google Scholar] [CrossRef]
  12. Liu, X.; Zheng, Y.; Hao, Q.; Zhao, R.; Xue, Y.; Zhang, Z. Dynamic failure features and brittleness evaluation of coal under different confining pressure. Geomech. Eng. 2022, 30, 401–411. [Google Scholar] [CrossRef]
  13. Shen, R.; Wang, X.; Li, H.; Gu, Z.; Liu, W. Brittleness characteristics and damage evolution of coal under true triaxial loading based on the energy principle. Nat. Resour. Res. 2022, 33, 421–434. [Google Scholar] [CrossRef]
  14. Puri, R.; King, G.E.; Palmer, I.D. Damage to coal permeability during hydraulic fracturing. In SPE Rocky Mountain Petroleum Technology Conference/Low-Permeability Reservoirs Symposium; Onepetro: Denver, CO, USA, 1991; p. SPE21813. [Google Scholar] [CrossRef]
  15. Chen, Z.; Khaja, N.; Valencia, K.; Rahman, S. Formation damage induced by fracture fluids in coalbed methane reservoirs. In SPE Asia Pacific Oil & Gas Conference and Exhibition; Onepetro: Adelaide, Australia, 2006; p. SPE101127. [Google Scholar] [CrossRef]
  16. Okere, C.; Su, G.; Zheng, L.; Cai, Y.; Li, Z.; Liu, H. Experimental, algorithmic, and theoretical analyses for selecting an optimal laboratory method to evaluate working fluid damage in coal bed methane reservoirs. Fuel 2020, 282, 118513. [Google Scholar] [CrossRef]
  17. Xue, S.; Huang, Q.; Wang, G.; Bing, W.; Li, J. Experimental study of the influence of water-based fracturing fluids on the pore structure of coal. J. Nat. Gas Sci. Eng. 2021, 88, 103863. [Google Scholar] [CrossRef]
  18. Kang, Y.; Huang, F.; You, L.; Li, X.; Gao, B. Impact of fracturing fluid on multi-scale mass transport in coalbed methane reservoirs. Int. J. Coal Geol. 2016, 154, 123–135. [Google Scholar] [CrossRef]
  19. Huang, Q.; Li, J.; Liu, S.; Wang, G. Experimental study on the adverse effect of gel fracturing fluid on gas sorption behavior for Illinois coal. Int. J. Coal Sci. Technol. 2021, 8, 1250–1261. [Google Scholar] [CrossRef]
  20. Ge, Z.; Wang, Z.; Hu, J.; Wang, Y.; Zhou, Z.; Li, R. Effect of different types of fracturing fluid on the microstructure of anthracite: An experimental study. Energy Source Part A 2021, 47, 11569–11583. [Google Scholar] [CrossRef]
  21. Isah, U.A.; Rashid, M.I.; Lee, S.; Kiman, S.; Iyodo, H.M. Correlations of coal rank with the derived Fourier Transform Infra-Red (FTIR) spectroscopy structural parameters: A review. Infrared Phys. Technol. 2024, 141, 105456. [Google Scholar] [CrossRef]
  22. Gao, F.; Jia, Z.; Cui, Z.; Li, Y.D.; Jiang, H. Evolution of macromolecular structure during coal oxidation via FTIR, XRD and Raman. Fuel Process. Technol. 2024, 262, 108114. [Google Scholar] [CrossRef]
  23. Hao, P.; Meng, Y.; Zeng, F.; Yan, T.; Xu, G. Quantitative study of chemical structures of different rank coals based on infrared spectroscopy. Spectrosc. Spect. Anal. 2020, 40, 787–792. [Google Scholar] [CrossRef]
  24. Meng, Y.; Tang, D.; Xu, H.; Qu, Y.; Li, Y.; Zhang, W. Division of coalbed methane desorption stages and its significance. Petrol. Explor. Dev. 2014, 41, 671–677. [Google Scholar] [CrossRef]
  25. Meng, Y.; Tang, D.; Xu, H.; Li, C.; Li, L.; Meng, S. Geological controls and coalbed methane production potential evaluation: A case study in Liulin area, eastern Ordos Basin, China. J. Nat. Gas Sci. Eng. 2014, 21, 95–111. [Google Scholar] [CrossRef]
  26. GB/T 482-2008; Sampling of Coal Seams. China Standards Press: Beijing, China, 2008.
  27. GB/T 6948-2008; Microscopical Determination of the Reflectance of Vitrinite in Coal. China Standards Press: Beijing, China, 2008.
  28. GB/T 212-2008; Proximate Analysis of Coal. China Standards Press: Beijing, China, 2008.
  29. GB/T 31391-2015; Ultimate Analysis of Coal. China Standards Press: Beijing, China, 2015.
  30. Feng, J.; Li, W.; Xie, K. Research on coal structure using FT-IR. J. China Univ. Min. Technol. 2002, 31, 362–366. [Google Scholar] [CrossRef]
  31. Cui, X.; Li, X.; Li, Y.; Li, S. Evolution mechanism of oxygen functional groups during pyrolysis of Datong coal. J. Therm. Anal Calorim 2017, 129, 1169–1180. [Google Scholar] [CrossRef]
  32. He, X.; Liu, X.; Nie, B.; Song, D. FTIR and Raman spectroscopy characterization of functional groups in various rank coals. Fuel 2017, 206, 555–563. [Google Scholar] [CrossRef]
  33. Painter, P.; Sobkowiak, M.; Youtcheff, J. FT-IR study of hydrogen bonding in coal. Fuel 1987, 66, 973–978. [Google Scholar] [CrossRef]
  34. Chen, C.; Gao, J.; Yan, Y. Observation of the type of hydrogen bonds in coal by FTIR. Energy Fuels 1988, 12, 446–449. [Google Scholar] [CrossRef]
  35. Ju, Y.; Jiang, B.; Hou, Q.; Wang, G. FTIR spectroscopic study on the stress effect of compositions of macromolecular structure in tectonically deformed coals. Spectrosc. Spect. Anal. 2005, 25, 1216–1220. [Google Scholar] [CrossRef]
  36. Kang, L.; Wang, K.; Li, S.; Liu, J.; Yang, K.; Liu, B.; Zou, B. Pressure-induced phase transition in hydrogen-bonded supramolecular structure: Ammonium formate. J. Phys. Chem. C 2014, 118, 8521–8530. [Google Scholar] [CrossRef]
  37. Wang, Y.; Ma, Y.; Mo, W.; Gong, W.; Ma, F.; Wei, X.; Fan, X.; Zhang, S. Functional groups of sequential extracts and corresponding residues from Hefeng sub-bituminous coal based on FT-IR analysis. J. Fuel Chem. Technol. 2021, 49, 890–901. [Google Scholar] [CrossRef]
  38. Fu, Y.; Liu, X.; Ge, B.; Liu, Z. Role of chemical structures in coalbed methane adsorption for anthracites and bituminous coals. Adsorption 2017, 23, 711–721. [Google Scholar] [CrossRef]
  39. Cassie, A.; Baxter, S. Wettability of porous surfaces. Trans. Faraday Soc. 1944, 40, 546–551. [Google Scholar] [CrossRef]
  40. Wang, Z.; Liu, S.; Qin, Y. Coal wettability in coalbed methane production: A critical review. Fuel 2021, 303, 121277. [Google Scholar] [CrossRef]
  41. Zhu, Y.; Shi, Z.; Zuo, S.; Qu, Q.; Yan, X.; Kuznetsov, D.; Chen, Z. Dewatering optimization of coal seam gas production wells: A review and future perspectives. Energy Fuels 2022, 36, 9785–9820. [Google Scholar] [CrossRef]
  42. Zhang, J.; Feng, Q.; Zhang, X.; Wen, S.; Zhai, Y. Relative permeability of coal: A review. Transp. Porous Med. 2015, 106, 563–594. [Google Scholar] [CrossRef]
Figure 1. Location distribution map of coal samples collection and cores images. (a) The coal sampling basins in China. (b) The sampling coal mine in Qinshui Basin. (c) The sampling coal mine in the eastern margin of Ordos Basin. (d) The images of coal cores.
Processes 13 03718 g001
Figure 2. FTIR spectra of coal samples before and after HPWI.
Processes 13 03718 g002
Figure 3. Curve-fitting FTIR spectrum of 1000–1800 cm−1 for raw coal and fractured coal. Note: The red line is fitting curve of experimental data, and the green line is peak fitting curve. (a) FTIR spectrum of Shaping raw coal. (b) FTIR spectrum of Shaping fractured coal. (c) FTIR spectrum of Shaqu raw coal. (d) FTIR spectrum of Shaqu fractured coal. (e) FTIR spectrum of Yonghong raw coal. (f) FTIR spectrum of Yonghong fractured coal.
Processes 13 03718 g003
Figure 4. Curve-fitting FTIR spectrum of 2800~3000 cm−1 for raw coal and fractured coal. Note: The red line is fitting curve of experimental data, and the green line is peak fitting curve. (a) FTIR spectrum of Shaping raw coal. (b) FTIR spectrum of Shaping fractured coal. (c) FTIR spectrum of Shaqu raw coal. (d) FTIR spectrum of Shaqu fractured coal. (e) FTIR spectrum of Yonghong raw coal. (f) FTIR spectrum of Yonghong fractured coal.
Processes 13 03718 g004
Figure 5. Curve-fitting FTIR spectrum of 3000~3700 cm−1 for raw coal and fractured coal. Note: The red line is fitting curve of experimental data, and the green line is peak fitting curve. (a) FTIR spectrum of Shaping raw coal. (b) FTIR spectrum of Shaping fractured coal. (c) FTIR spectrum of Shaqu raw coal. (d) FTIR spectrum of Shaqu fractured coal. (e) FTIR spectrum of Yonghong raw coal. (f) FTIR spectrum of Yonghong fractured coal.
Processes 13 03718 g005
Figure 6. The wetting contact angles of raw coals and fractured coals. (a) The wetting contact angle of Shaping raw coal. (b) The wetting contact angle of Shaping fractured coal. (c) The wetting contact angle of Shaqu raw coal. (d) The wetting contact angle of Shaqu fractured coal. (e) The wetting contact angle of Yonghong raw coal. (f) The wetting contact angle of Yonghong fractured coal.
Processes 13 03718 g006
Table 1. The proximate and ultimate analysis of coal samples.
SamplesRo,max (%)Proximate AnalysisUltimate Analysis
Mad (%)Aad (%)Vdaf (%)Cdaf (%)Hdaf (%)Odaf (%)Ndaf (%)Sdaf (%)
SP-Q0.603.36.7436.2884.254.717.111.552.38
SQ-Q1.450.5819.3121.9487.184.676.121.320.71
YH-Q2.491.6612.929.7691.512.74.21.240.34
Table 2. Relative content of oxygen-bearing functional groups in coals before and after HPWI.
Oxygen-Bearing Functional GroupsSP-QSP-HVariationSQ-QSQ-HVariationYH-QYH-HVariation
(%)
Ash0.471.87297.871.311.28−2.294.9563.573−27.91
C–O20.2518.97−6.3220.2530.5750.9644.49637.737−15.19
C–O of aryl ethers6.506.46−0.626.013.23−46.263.1932.884−9.68
CH2-C=O10.2610.512.445.523.11−43.662.2812.91627.84
Symmetrical CH34.744.995.275.306.3519.812.632.236−14.98
Variable angle ofα-CH2, carboxylate5.224.95−5.176.9610.3748.993.5784.45624.54
Asymmetric CH3, CH212.4912.05−3.5214.316.4−55.286.0635.969−1.55
C=C of aromatic hydrocarbons27.728.693.5729.1525.29−13.2422.75417.284−24.04
Table 3. Relative content of aliphatic hydrocarbons in coals before and after HPWI.
SP-QSP-HVariationSQ-QSQ-HVariationYH-QYH-HVariation
(%)
Symmetric R2CH218.0820.7614.8218.1419.366.7311.7711.54−1.95
Symmetric RCH311.6711.46−1.8011.8110.54−10.7513.8716.0215.50
CH stretching vibration17.3916.46−5.3512.5212.852.6418.2415.67−14.09
Antisymmetric R2CH234.1235.804.9238.5940.825.7824.7423.62−4.53
Antisymmetric RCH318.7415.50−17.2918.9416.43−13.2531.3933.155.61
Table 4. Relative content of hydrogen bonds in coals before and after HPWI.
SP-QSP-HVariationSQ-QSQ-HVariationYH-QYH-HVariation
(%)
Hydroxy–N bond2.291.97−13.970.921.1221.741.695.90249.80
Cyclic associated hydroxyl–hydrogen bond19.0311.18−41.2513.724.95−63.9218.386.27−65.86
Hydroxy–ether–oxygen bond27.1923.81−12.4320.4521.495.0930.1627.47-8.93
Hydroxy–hydroxy–hydrogen bond39.6336.83−7.0734.7738.6911.2727.2436.8735.38
Hydroxy–p hydrogen bond9.8422.98133.5421.2519.70−7.2919.6417.86−9.05
Free hydroxyl group2.023.1957.928.8514.0258.422.905.6293.71
Table 5. The FTIR structural parameters of raw coals and fractured coals.
SamplesfarcDOCII1I2
SP-Q0.9760.1930.120.220.087
SP-H0.9760.2320.100.220.085
Variation (%)0.0020.21−16.670.00−2.30
SQ-Q0.9750.2690.240.490.125
SQ-H0.9760.6100.340.840.190
Variation (%)0.10126.7741.6771.4352.00
YH-Q0.8480.4151.030.810.190
YH-H0.8450.4160.500.350.100
Variation (%)−0.350.24−51.46−56.79−47.37
Table 6. The wetting contact angles change in raw coals and fractured coals.
SamplesWetting Contact Angles (°)Wetting Contact Angle Reduction (°)Wetting Contact Angle Reduction Rate (%)
SP-Q88.132.032.30
SP-H86.10
SQ-Q79.3011.5014.50
SQ-H67.80
YH-Q71.5010.3414.46
YH-H61.16
Disclaimer/Publisher’s Note: The statements, opinions and data contained in all publications are solely those of the individual author(s) and contributor(s) and not of MDPI and/or the editor(s). MDPI and/or the editor(s) disclaim responsibility for any injury to people or property resulting from any ideas, methods, instructions or products referred to in the content.