Abstract
This study focuses on the tight reservoirs of the Jingzigou Formation in the Satan 1 block of the Jinan Sag, Junggar Basin. By integrating analyses of sedimentary microfacies, reservoir characteristics, and fracture distribution, it innovatively applies machine learning algorithms for the quantitative identification and prediction of “sweet spots”. The results indicate that subaqueous distributary channels within the braided river delta front are the dominant sedimentary microfacies. The reservoir exhibits typical tight oil characteristics, with porosity primarily below 10% and permeability generally less than 0.01 mD. Sedimentary microfacies significantly control reservoir quality, with the subaqueous distributary channels exhibiting the best physical properties. Mid- to high-angle structural fractures effectively enhance reservoir permeability and show a strong positive correlation with oil saturation. This research employs machine learning techniques—including Decision Trees, Random Forest, and Support Vector Machines—to establish a comprehensive sweet spot classification model by integrating pore-throat structure, petrophysical parameters, reservoir thickness, and fracture development intensity. Among these, the Random Forest algorithm demonstrated optimal performance across all evaluation metrics. Prediction results reveal that Class I and Class II sweet spots are predominantly distributed in the northern slope area, while Class III sweet spots are located in the central trough and southern nose-like structural zone. These classification results show a high consistency with actual production data, confirming the effectiveness and applicability of machine learning for sweet spot prediction in this study area. The research outcomes provide reliable geological guidance for well placement optimization and reserve development in the Satan 1 block, offering significant reference value for the prediction and development of sweet spots in similar heterogeneous tight oil reservoirs.
1. Introduction
The continuous growth of global oil and gas demand and the gradual depletion of conventional resources have highlighted the crucial importance of unconventional resources. Tight oil reservoirs represent a pivotal resource category, playing a crucial role in safeguarding the energy supply of the future. In recent years, China has made significant breakthroughs in tight oil exploration, with the Xinjiang Junggar Basin being an important enrichment area, possessing abundant tight oil resources. Multiple sags within the basin have promising prospects for forming an integrated oil and gas system [1,2]. The Mahu Oilfield was discovered under the theory of reservoir formation in the sag area [3]. Additionally, high-yield oil reservoirs were discovered in the Permian System of the Jinnan sag in the Junggar Basin, with the Satan 1 and Sa 4 blocks mainly being structural–lithologic oil reservoirs [4]. The Jinan sag has been shown to possess enormous exploration potential, as evidenced by a significant breakthrough made by the Satan 1 well. The Junggar Basin’s tight oil reservoirs are still being explored and developed; further in-depth studies on their characteristics are required to effectively guide operations and enhance recovery efficiency [5]. Especially in the Jinan sag, the tight reservoirs of the Jingjingzigou Formation have strong heterogeneity, and the distribution and enrichment patterns of high-quality reservoirs need to be clarified [6,7].
To achieve more accurate characterization of tight reservoirs, researchers at home and abroad are increasingly relying on machine learning (ML) techniques to improve prediction accuracy. Eriavbe et al. used ML technology to predict permeability, employing a deep normalization method and combining artificial neural networks (ANNs) to train core and logging data, obtaining more realistic prediction results and enhancing reservoir characterization levels [8]. Tang et al. proposed an integrated machine learning framework, combining gradient-boosting decision trees (XGBoost, CatBoost, LightGBM) and generative adversarial networks (GANs), and automatically identifying shale reservoir sweet spots based on logging data, showing higher accuracy [9]. Yuan et al. used support vector regression (SVR) to establish nonlinear relationships between reservoir parameters and various attributes, demonstrating high accuracy and resolution in predicting shale brittleness parameters [10]. Ore et al. utilized supervised ML algorithms to predict the brittleness of unconventional reservoirs based on logging and seismic attributes [11]. Zhu et al. compared the performance of unsupervised ML methods in predicting gas saturation, porosity, and depositional facies using multiple seismic attributes [12]. Anifowose et al. attempted to predict rock porosity from advanced mud gas (AMG) data using ML and found that the random forest (RF) model performed better than the artificial neural network (ANN) and decision tree (DT) models [13]. Moussa et al. used big data methods, using support vector machines (SVMs) to predict permeability, fuzzy clustering to evaluate fracturability, hierarchical clustering for lithology classification, and 3D Kriging interpolation to construct a high-resolution rock physics model, introducing the reservoir quality index (RQI) for sweet spot identification [14]. In China, Cao et al. and Zhang et al. have used machine learning methods to identify diagenetic facies and lithology, which have become effective means to improve reservoir evaluation accuracy [15,16].
Furthermore, by integrating studies on tight reservoirs, natural fractures, and artificial fractures, scholars have utilized ML to optimize fracturing design plans and evaluate development effects. Kuang et al. analyzed the reservoir characteristics (such as porosity, permeability, and sweet spot distribution) of the Jimushar tight oil reservoir in the Junggar Basin to optimize hydraulic fracturing techniques (such as fracturing fluid, proppant, and staged design) [17]. Rahman et al. combined geomechanical modeling, fracturing design, and reservoir simulation to optimize the fracturing parameters of horizontal and deviated wells, proving that the geomechanical model can effectively guide fracturing design and that directional perforation helps reduce fracture complexity [18]. Li et al. proposed the Dynamic Production Scaling (DPR) method to improve production decline analysis based on ML, with its stability not affected by specific ML algorithms, and it can effectively capture the similarity of production trends among different wells, improving short-term and long-term prediction accuracy [19]. Malkov et al. proposed a hybrid ML reservoir analysis workflow, combining ML, simplified physical models, and reservoir simulation, and using the Fast Multipole Method (FMM) to enhance predictive capabilities. This method significantly reduces the number of required simulations [20]. Aliyuda et al. used the random forest algorithm to evaluate the impact of geological variables on development effects, confirming that ML is an effective tool for improving the prediction accuracy of tight reservoirs [21]. Recent advancements in machine learning (ML) and artificial intelligence (AI) have further underscored the potential of data-driven approaches in reservoir engineering. Among these, artificial neural networks (ANNs) have gained prominence due to their ability to model highly nonlinear and multi-variable processes without requiring explicit physical formulations. For instance, in the context of formation damage prediction due to salt precipitation, ANN has demonstrated superior accuracy and efficiency compared to conventional empirical or numerical models [22].
In reservoir characterization, machine learning (ML) and traditional statistical methods each have distinct roles. Traditional methods (e.g., multiple regression, kriging) rely on explicit assumptions, offering transparent models that are easily interpretable. They are suitable for data-limited scenarios or near-linear relationships. In contrast, ML excels at capturing high-dimensional nonlinear patterns, demonstrating superior accuracy in tasks such as integrating multi-source data for permeability prediction and sweet spot identification [8,9]. However, its “black-box” nature reduces interpretability, and performance depends heavily on large volumes of high-quality data.
Rather than being mutually exclusive, the two approaches are complementary: traditional methods provide interpretability and robustness with limited data, while ML offers enhanced predictive capability for complex patterns and large datasets. The future direction lies in developing physics-informed ML models to simultaneously achieve prediction accuracy and geological plausibility.
Current systematic studies on the tight reservoirs of the Jinan sag’s Satan 1 block (Junggar Basin) lack the integration of machine learning (ML) techniques for reservoir classification and prospect identification, especially the lack of a sweet spot identification and distribution prediction model that integrates multiple geological factors and intelligent algorithms. This study takes the Satan 1 block as the object, innovatively integrates sedimentary microfacies analysis, reservoir parameter characterization, and fracture distribution prediction, and introduces multiple machine learning algorithms (including decision trees, random forests, and support vector machines), establishing a sweet spot identification and classification model based on multi-source geological-logging-seismic information. The main innovation points of this study are as follows: Firstly, for the first time, a comprehensive evaluation of reservoir under the control of sedimentary, diagenetic, and fracture coupling is systematically carried out in the Satan 1 block, delineating the dominant influencing factors and occurrence patterns of productive reservoirs. Secondly, a comprehensive classification standard for sweet spots integrating pore–throat structure, physical property parameters, reservoir thickness, and fracture development degree is constructed, overcoming the limitations of traditional single-parameter evaluation. Finally, by comparing the prediction effects of multiple machine learning algorithms, quantitative and high-precision prediction of sweet spot distribution is achieved, significantly improving the reliability and interpretability of favorable zone identification. This research not only provides a direct and reliable basis for the next well location deployment and effective utilization of reserves in the Satan l block but also provides methodological support that can be generalized for the prediction of sweet spots in similar strongly heterogeneous tight oil reservoirs.
2. Description of the Study Area
The Satan 1 block of Jinan Oilfield is located in the eastern part of the Junggar Basin. The Permian Jingjingzigou Formation in this block forms a single anticlinal structure. Its overall configuration is higher in the east and lower in the west. Fractures are well-developed. In the northern slope area, it is a slope with the northeast being high and the southwest being low; in the central trough area, it appears as a negative trough bounded by two NW-SE trending reverse faults. in the southern nose and bulge area, it is a positive nose-shaped uplift formed by the compression of north–south stress (Figure 1).
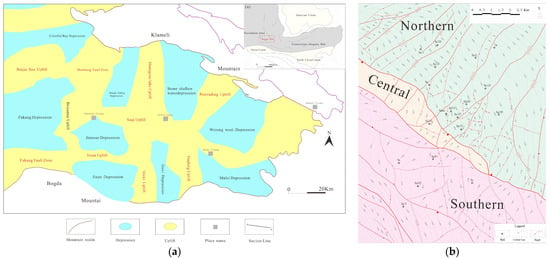
Figure 1.
Structural location of Satan 1 block and structural well location map of Jingjingzigou Formation in Satan 1 block ((a) structural location map of the Satan 1 block area; (b) top structure map of the Jingjingzigou Formation in the Satan 1 block).
The Jingjingzigou Formation was initially a lacustrine environment in its early stage and later evolved into the braided river delta front. The previous studies on the outcrops along the southern margin of the basin have revealed the sedimentary pattern and sand body configuration of this formation [23]. The lithology is mainly composed of gray and brown mudstones interbedded with thin layers of sandstone. The underwater distributary channel sand bodies at the upper part of the braided river delta front and the mudstones form a good reservoir–cap combination. Multiple wells in the Satan 1 block have achieved industrial oil production, and the Satan 1 well has obtained stable and high-yielding oil production.
Within the Jingjingzigou Formation, the sand bodies have a large thickness, with an average thickness of 150–250 m per well. Based on the sedimentary cycle characteristics of single-well cores, well log responses, and seismic reflection features, the upper sand bodies are interpreted, together with those of the overlying Lucaogou Formation, as constituting a lowstand systems tract. The middle sand bodies are relatively thick, while the lower ones are thinner. These sand bodies can be classified into three sand groups: P2jj1, P2jj2, and P2jj3. The top of the P2jj1 sand layer group is composed of fine sandstone with low natural gamma and high resistivity, which is in an integrated contact with the high natural gamma mudstone at the bottom of the Lucaogou Formation above. This set of mudstone is stable in distribution; the bottom of this group also develops a set of low natural gamma and high-resistivity sandstone. The top of the P2jj2 sand layer group is developed with high natural gamma and low-resistivity mudstone, and there are multiple sets of low natural gamma and high-resistivity fine sandstone within the group. The top of the P2jj3 sand layer group is developed with high natural gamma and low-resistivity mudstone, and the bottom is composed of low natural gamma and high-resistivity fine sandstone. Overall, the lithology of the P2jj3 sand layer group is finer and has lower electrical properties compared to the P2jj1 and P2jj2 groups. The total thickness of the three sand groups is generally stable but exhibits local variations, showing a trend of thinning southward and thickening northward.
3. Study of Sedimentary Microfacies
During the sedimentation phase of the Jingjingzigou Formation, the ancient terrain of the Jinan sag developed three ancient gullies and two slope folds, which governed the arrangement of advantageous facies zones. Sediment was mainly supplied by the ancient western uplift in the southeast, and the secondary sources were from the Jinan uplift. The southeastern source system was mainly composed of traction flow deposits transported over long distances along gentle slopes, and it was the main sedimentary mode in the area.
The principal objective for the Satan 1 block is the Jingjingzigou Formation of the Permian System. It has two major sedimentary source systems, namely the southeast and northeast systems. The sedimentary background is a braided river delta and a fan delta. The main sedimentary microfacies is the underwater distributary channel at the front of the braided river delta.
3.1. Depositional System
The Satan 1 block mainly has two sediment source systems in the Jingjingzi Formation: the southeastern and the northeasterly systems. The southeastern source is the main source, resulting in a traction flow sedimentation with a gentle slope and long-distance transportation, which is the main sedimentary pattern in the area; the northeasterly source is a gravity flow sedimentation on a steep slope, and it only controls a minimal zone within the depression’s northern region. The Sa 10 and Sa 103 wells in the south mainly have traction flow sedimentation, while the Sa 11 well in the north shows the coexistence of traction flow and gravity flow.
The sedimentary environment of the braided river delta consists of three units: the braided river delta plain, the braided river delta front, and the pre-braided river delta. The fan delta depositional system comprises three units: the fan delta plain, the fan delta front, and the pre-fan delta. The distribution of sedimentary facies is controlled by the paleo-depositional landforms and the transport distance. There are differences in the grain size, sorting, and rounding degree of the sediments in each unit.
3.2. Depositional Microfacies Characteristics
Through the observation of core samples of typical microfacies, combined with grain size, electron microscopy and logging data analysis, the main sedimentary microfacies characteristics of the Jingjingzigou Formation in the Satan 1 block are as follows:
Braided delta front subaqueous channel: (1) Grain size characteristics: dominated by jumping and rolling components, with the overall content of jumping being nearly 90%, concentrated in the PQ section on the C-M diagram, as seen in Figure 2a; (2) microscopic characteristics: the particle rounding degree is moderate, sorting is medium to poor, point-line contact; (3) lithologic and sedimentary structure: mainly composed of medium-coarse sandstone, with the development of large plate-like interbedded strata, and the lithology within the channel is homogeneous and stable; (4) logging facies characteristics: The Gamma Ray (GR) curve typically displays box-shaped or bell-shaped patterns. The upper and lower boundaries are defined by high-GR mudstones, formed during the abandonment phase of the channel.
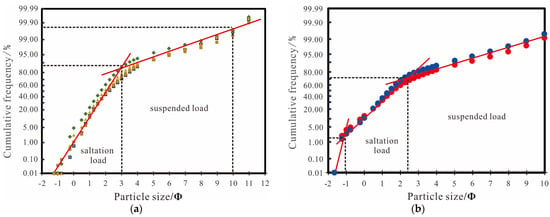
Figure 2.
The grain size probability cumulative curves of the Jingzigou Formation in the Satan 1 block ((a) Well Sa101; (b) Well Sa103).
Estuarine dam: (1) Grain size characteristics: dominated by the jumping component (about 75%), the suspended component slightly increases, mainly located in the PQ section and diverging towards the RQ section on the C-M diagram, as seen in Figure 2b; (2) microscopic characteristics: the particle roundness is moderate, the sorting is medium to good, and the contact is line contact; (3) rock type and sedimentary structure: mainly composed of fine sandstone, common blocky structure, visible parallel or interlaced bedding layers formed by water dynamic changes, pure sand quality; (4) logging facies characteristics: the GR curve is funnel-shaped, often in contact with the box-shaped curves of the upper and lower underwater distributary channels, forming the estuarine dam–underwater distributary channel sedimentary sequence.
3.3. Distribution of Microfacies in the Small Layer
According to the features observed in sedimentary cycles, the P2jj1 and P2jj2 sand layer groups were each subdivided into two smaller layers (P2jj1−1, P2jj1−2, P2jj2−1, P2jj2−2), and the distribution patterns of sedimentary microfacies in each of these small layers were studied.
In the direction of the source, the plain river channel of the P2jj3 sand layer group is relatively small; as it progresses to the P2jj2 sand layer group, extensive underwater distributary river channels are widely distributed, interlaced with thin layer estuary dam deposits; in the late sedimentary stage of the P2jj1 sand layer group, the size of the subaqueous distributary channels increases. The lateral changes in the river channels are small, with good correspondence, and they transition to sheet-like sands. Multiple channel phases are present in the source. They are vertically interlaced and superimposed.
The P2jj1 and P2jj2 sand layers are mainly composed of deposits from the braided river delta front and the fan delta (Figure 3). The geological structure and paleo-structural factors control the source system. Currently, the drilling is mainly concentrated in the southeastern source system, which controls the development of the southern braided river delta; the northeast source system influences the north area and mainly develops the fan delta.
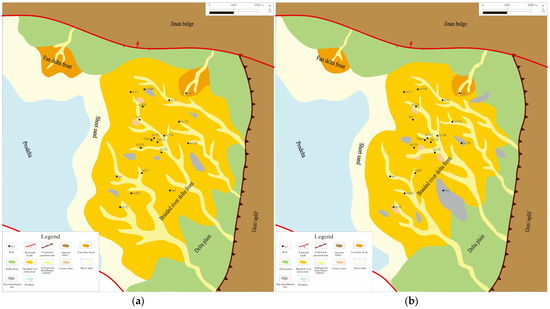
Figure 3.
Sedimentary microfacies diagram of the Jingjingzigou Formation of Satan 1 block ((a) P2jj1 sand layer; (b) P2jj2 sand layer).
P2jj1−1 layer: From west to east, there are developed pre-deepwater deltas, sheet-like sands, and subaqueous distributary channels located in the meandering river delta front zone. The SE-NW direction is the predominant orientation for the main body of subaqueous distributary channels in the meandering river delta front, while the underwater distributary channel of the fan delta is distributed in the NE-SW direction.
P2jj1−2 layer: In the north, there is a fan delta front, which spreads in the NE-SW direction. In the west, there are sheet-like sands, and the main part develops underwater distributary channels of braided river delta front that spread in the SE-NW direction.
The P2jj2−1 and P2jj2−2 layers: In the west, sheet-like sands are developed; in the north, fan delta front underwater distributary channels running NE-SW are formed. In the main part, meandering river delta front underwater distributary channels running SE-NW are developed.
In summary, the P2jj1 sand layer group mainly features underwater distributary channels fed by southeasterly sources. The channels in the areas of Sa3, Satan1, and Sa105 are the most developed, with sporadic inter-channel sedimentation. The P2jj2 sand layer group mainly features underwater distributary channels originating from the southeast. From top to bottom, the underwater distributary channels of the two sand layer groups exhibit continuity.
4. Reservoir Distribution Characteristics
Reservoirs are the core of tight oil exploration and development; finely characterizing their storage capacity is therefore the key to understanding how tight oil accumulates. Based on the study of sedimentary petrological characteristics, this research systematically characterizes the pore space, throat structure, and oil-bearing properties of different rock types, summarizes the differences in storage performance, and identifies the main developmental types of tight oil reservoirs. Compared with other tight intervals in the basin—e.g., the Upper Wuerhe Formation in the Fukang Sag and the Fengcheng Formation on the Manan Slope—the reservoirs described here share common features yet also display distinct characteristics [24,25].
The main sand layers (P2jj1, P2jj2) have a dominant composition of fine sandstone, and the rock type is mainly feldspar-charged sandstone. The average porosity is 11.9%, and the average permeability is 1.12 mD. Reservoir properties in this low-porosity, low-permeability system are dictated by sedimentary microfacies, with oiliness exhibiting a close relationship to these properties.
To systematically characterize the storage capacity of the tight reservoirs in the Jingjingzigou Formation and identify the controlling factors, this study followed a structured analytical workflow based on experimental data from cores, thin sections, well logs, and high-pressure mercury injection (HPMI). Firstly, the analysis started with the petrological characteristics (composition, texture, interstitial material) to define the material basis and inherent reservoir-forming conditions. Subsequently, the types and composition of the pore system were characterized qualitatively and quantitatively through cast thin sections and image observations. Then, high-pressure mercury injection data were utilized to delineate pore–throat structure parameters (e.g., pore–throat radius, displacement pressure), revealing fluid storage and flow capacity. Finally, these microscopic parameters were integrated and correlated with macroscopic petrophysical properties (porosity, permeability) and oil-bearing property data. This comprehensive analysis aimed to decipher the intrinsic causal relationships between “sedimentation–diagenesis, pore structure, storage performance,” thereby clarifying the key geological factors controlling the development of high-quality reservoirs.
4.1. Lithological Characteristics
The characteristics of sedimentary rocks serve as the foundation for studying reservoir performance and the mechanism of reservoir formation. Identifying the rock composition, structure, and sedimentary structural features is the prerequisite for exploring diagenesis and the differences in reservoir performance.
The Jingjingzigou Formation reservoir exhibits low quartz content, medium to long feldspar, and high rock fragments. It mainly consists of feldspar rock fragment sandstone and rock fragment sandstone, with moderate maturity. The average volume fraction of quartz is 8.6%, feldspar is 22.1%, and rock fragments is 69.3%. The content of volcanic materials is high, with magma rock fragments accounting for the highest proportion (84.4%) in the rock fragment components, followed by volcanic debris rock fragments (14.9%), and the contents of metamorphic and sedimentary rocks are relatively low.
The rock fragments are mainly composed of intermediate–basic extrusive rocks (andesite–basalt), with a small amount of tuff. The rock type is mainly medium-coarse sandstone and fine sandstone from fan delta front channel and estuary dam, with moderate sorting and moderate rounding, mainly sub-angular to sub-rounded. The pore-type cementation is dominant (91.5%), followed by inlaid-cemented type (5.8%). The particles mostly have point-line and line-point contacts, forming a particle-supported structure. The overall maturity of composition and structure is relatively low.
The fillers include matrix materials and binders, with a volume fraction ranging from 1% to 49% (average 11.6%). The matrix materials are mainly clay (average 2.9%). The binders are mainly carbonate minerals (average 7.4%), followed by halloysite, pyrite, sodium feldspar, etc., and occasionally, kaolinite and authigenic quartz are also present.
4.2. Reservoir Space Type
Diagenesis includes compaction, dissolution and cementation processes. Compaction and cementation result in significant loss in pores, while intergranular and intragranular dissolution pores formed by dissolution processes are important storage spaces. There are multiple controlling factors behind the heterogeneity observed in pore structures [26].
The observation of the cast thin sections indicates that the reservoir space in the study area is mainly composed of matrix pores. Secondary dissolution pores and micropores are developed, with limited residual primary intergranular porosity, and scattered fractures also occur (Figure 4).
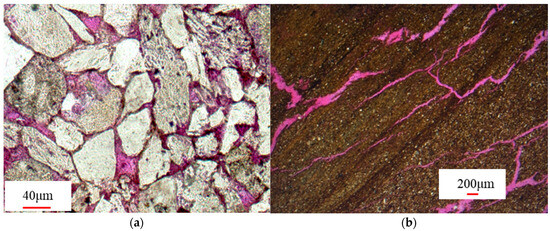
Figure 4.
Reservoir cast thin sections of the Jingjingzigou Formation ((a) secondary dissolution cavities, Sa101, 3254.62 m; (b) fractures, Sa3, 3229.98 m).
The secondary dissolution pores are the most developed, accounting for 62.9% of the total; the micropores and intragranular dissolution pores follow, accounting for approximately 18.9% and 16.2%, respectively. Intergranular dissolution pores are occasionally observed. In the P2jj1 sand layer group, secondary dissolution pores and intergranular primary pores are developed, with the latter being predominant; in the P2jj2 sand layer group, secondary dissolution pores and intergranular primary pores are the main features, with both intergranular and intragranular dissolution pores also present.
In addition, structural fractures, structural–solutionary fractures, and intergranular fractures were also observed. The main fractures are diagenetic shrinkage fractures, which are mostly isolated and discontinuous, developing along the particle edges. Some of the fractures contain oil, improving the reservoir permeability and providing channels for fluid migration. The characteristics and genesis of the microscopic fractures have been well-studied in the adjacent areas, providing a reference for the study of fractures in this area [27].
4.3. Pore Structure Characteristics
In this region, the reservoir bed of the Jingjingzigou Formation is generally classified as a low-porosity–extremely-low-porosity and ultra-low-permeability reservoir (Figure 5). Based on the analysis of the samples from the oil-producing sections combined with the results of oil testing and production, it is found that the reservoir layer’s effective porosity is primarily distributed within the range of 8.0% to 18.6%. The permeability is generally at a low level, mainly ranging from 0.01 mD to 43.6 mD. Porosity and permeability show a good positive correlation, and there are some samples with low porosity but high permeability, indicating the influence of fractures.
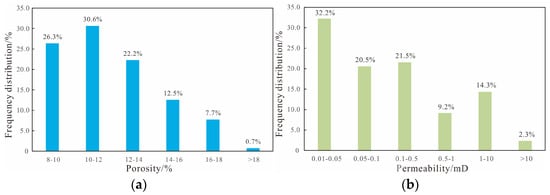
Figure 5.
Histogram of reservoir property distribution of the Jingjingzigou Formation in Satan 1 block ((a) porosity distribution histogram; (b) permeability distribution histogram).
Porosity and permeability measurements from the Jingjingzigou Formation’s sandstone reservoirs reveal significantly heterogeneous physical properties. The overall continuity of the physical properties of the P2jj1 and P2jj2 sand layer groups is relatively good. Among them, the physical attributes of the small layers of P2jj1−2 and P2jj2−1 are the best.
The study area contains multiple zones with high petrophysical properties (Figure 6). The high-porosity zones coincide well with high-permeability zones and correspond closely to the subaqueous distributary channel facies. Overall, the reservoir quality in the sand-prone northern area is better than that in the south, and the extent of high-porosity and high-permeability zones is also larger in the north.
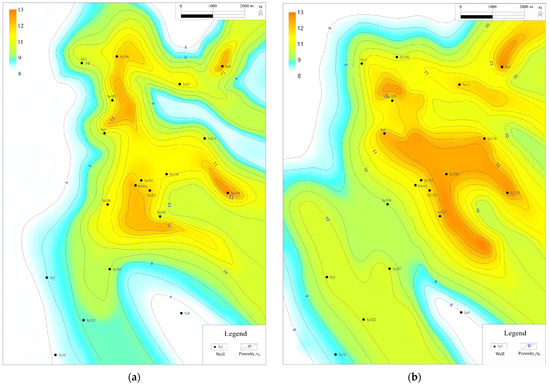
Figure 6.
Equivalent contour map of porosity of the small layers in the Jingjingzigou Formation of Satan 1 block ((a) layer P2jj1−1; (b) layer P2jj2−1).
4.4. Oil Layer Distribution
The oiliness of the Jingjingzigou Formation is controlled by physical properties, and the two are positively correlated. If the rock’s physical properties are better, then water saturation will be lower, and the better the oiliness. The high-oil-saturation areas are mainly concentrated in the well areas such as Sa105, Sa11, and Sa102 in the northern slope area.
The P2jj1−1 and P2jj1−2 small layers are widely developed in the northern slope oil layers and have good continuity; the thickness of the Sa3 area in the southern nose bulge region has decreased. The P2jj2−1 small layer has the widest distribution of oil layers, while the P2jj2−2 small layer has a smaller range and thinner thickness in the Sa11, Sa105, and Sa6 well areas.
Reservoir properties are well-correlated with oil layer thickness. The areas with high oil layer thickness correspond to better properties, and they commonly occur in the subaqueous distributary channel microfacies. In general, the thickness of the oil layer in the northern part is greater than that in the southern part.
4.5. Factors Influencing Reservoir Heterogeneity
4.5.1. Reservoir Heterogeneity and Sedimentary Microfacies
The sedimentary facies determine the formation and spatial arrangement of reservoirs. Sedimentary microfacies not only control the type, shape, thickness, scale, and spatial distribution of sand bodies, but also affect the planar and longitudinal distribution of sand bodies as well as the interlayer and intralayer heterogeneity. Moreover, at the microscopic level, it determines the characteristics of rock detrital particles size, filling material content, rock structure (sorting, rounding, contact mode), etc., thereby controlling the original porosity and permeability of the rock. Therefore, the control of sedimentary microfacies on reservoir physical properties is innate.
Reservoir heterogeneity refers to the differences in physical and chemical properties within the reservoir, which primarily arise from various geological processes such as depositional environment, diagenesis, and tectonic movement. Based on the sources and manifestations of reservoir heterogeneity, it can be divided into two major categories: macroscopic heterogeneity and microscopic heterogeneity. Macroscopic heterogeneity is primarily manifested in the spatial distribution and geometric morphology of the reservoir, such as variations in parameters like reservoir thickness, permeability, and porosity across space. This control effect can be characterized by quantitative physical property features. The Jingjingzigou Formation of the Satan 1 block is a braided river delta and fan delta sedimentary system. It mainly develops three sedimentary microfacies: the underwater distributary channel, the estuarine dam, and the underwater distributary channel interstitial zone. The porosity and permeability data show that the porosity and permeability of different microfacies vary significantly: the microfacies of the underwater distributary channel has excellent physical attributes, displaying improved porosity and permeability parameters, and the positive correlation is obvious; the physical properties of the estuarine dam are second, with porosity mainly distributed in 5–15%, and a general correlation between porosity and permeability; The microfacies of the underwater distributary channel interstitial zone has the worst physical properties, with porosity mainly distributed in 0–10%, and the permeability mostly less than 0.01 mD (Figure 7).
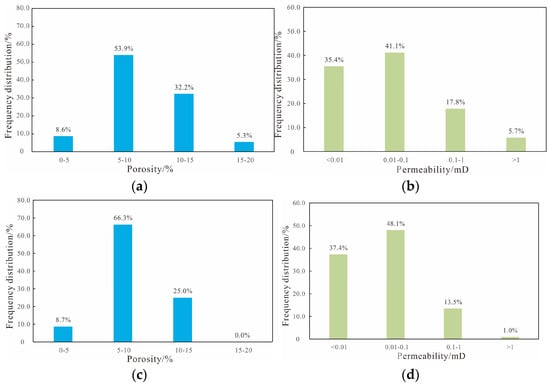
Figure 7.
Histogram of physical property distribution of different sedimentary microfacies of the Jingjingzigou Formation in Satan 1 block ((a) histogram of porosity distribution in the subaqueous distributary channel facies; (b) histogram of permeability distribution in the underwater distributary channel microfacies; (c) histogram of porosity distribution in the estuarine dam microfacies; (d) histogram of permeability distribution in the estuarine dam microfacies).
In the middle part of the microfacies of the underwater distributary channel and the upper part of the microfacies of the estuarine dam, the water dynamic force is strong, low mud content, good sorting, and preserved original fabric are characteristic, and the resistance to compaction is strong. This is conducive to the preservation of original pores and the entry of later acidic fluids. The thin sand layer in the inter-channel microfacies of the underwater distributary channel has fine sedimentation grain size, high mud content, poor sorting, and weak resistance to compaction, making it difficult for pores to be preserved.
Under different sedimentary environments, there are differences in the clastic composition, structure, sorting, rounding, single-layer thickness, etc., of the sand bodies, and these differences are mainly reflected in the reservoir performance. Core and thin section observations indicate that the main lithofacies types in this area include siltstone, fine sandstone, medium-fine sandstone, gravelly sandstone, and muddy siltstone.
The sedimentary microfacies is closely related to the reservoir thickness. Statistics show that thin sand layers with a thickness less than 2 m and the peripheral parts of thick layers have poor physical properties, with porosity mainly distributed in 3–9%; sand layers with a thickness of 2–6 m have porosity mainly distributed in 6–12%; and sand bodies with a thickness greater than 6 m have porosity mostly greater than 9%. It can be seen that the sedimentary microfacies significantly affects the reservoir properties and is an important factor controlling heterogeneity.
4.5.2. Diagenetic Controls on Reservoir Heterogeneity
In the Satan 1 block, reservoir porosity is preserved mainly by clay coatings that resist mechanical compaction, whereas porosity is enhanced through dissolution of volcanic rock fragments and zeolite cements; the resulting secondary pores can markedly improve deep-reservoir quality. By integrating log and facies data, we compared sand-body properties and diagenetic intensity at different positions. Even within the same microfacies, pore–permeability development differs because the diagenetic environment varies. Along the margins of continuous sand bodies—the sites of facies transition—the pore fluid is chemically unstable, favoring precipitation, strong cementation, and weak dissolution. The central parts of continuous sand bodies were deposited under stable conditions; here, diagenesis is dominated by compaction and dissolution with only weak cementation. At the edges of thin sand layers, strong compaction and pervasive argillaceous cementation severely restrict fluid flow, so dissolution is essentially absent.
Based on the differences in diagenetic strength, the diagenetic transformation process can be classified into three types: dissolution-dominated type, compaction-dominated type, and cementation-dominated type (Figure 8).

Figure 8.
Microscopic characteristics of reservoir diagenesis thin sections ((a) erosion-dominated type, Sa101, 3255.02 m, with well-developed erosion pores; (b) compaction-dominated type, Sa103, 3352.8 m, high clay content; (c) cementation-dominated type, Sa104, 3431.68 m, strong carbonate cementation).
Weathering-dominated type: It mainly develops in the fine-grained sandstone facies of the subaqueous distributary channel facies of the P2jj1 and P2jj2. Its characteristic is that the early zeolite cementation resisted the compaction and pore reduction, while in the later stage, intense weathering formed a large number of secondary pores. The compaction of this type of reservoir occurs later than the main hydrocarbon accumulation period.
Compaction-dominated type: It mainly develops in fine-grained sandstone facies, the edges of underwater distributary channels, and thin sand bodies. Its characteristics are fine sand grain size, high content of muddy matrix, weak overall compressive resistance, and poor original porosity and permeability. The reservoir is densified close to the main hydrocarbon accumulation period.
Cementation-dominated type: It mainly develops at the edges of underwater distributary channels and thin interbedded sand bodies. The cementation type is mainly carbonate cementation. Due to the proximity of the sand body edges to mudstone, under deep burial conditions, ions such as K+, Na+, Ca2+, Mg2+, Fe3+, and Si4+ released from the mudstone are prone to precipitation, resulting in intense cementation at the sand–mudstone interface. The compaction of this type of reservoir occurs earlier than the main hydrocarbon accumulation period.
By comparing the reservoir characteristics of different layers in the Jingjingzigou Formation, it can be seen that the sedimentary structure, thickness, and diagenetic modification process jointly determine the reservoir quality. Generally speaking, the P2jj1 and P2jj2 have better physical properties. The sedimentary microfacies are mainly composed of underwater distributary channels and estuarine dam, with coarse grain size and mainly fine sandstone and sand–gravel rock as the lithology. The diagenetic facies are mainly dissolution facies and clay cementation facies. The good original structure of the reservoir and strong resistance to compaction creates favorable conditions for preserving primary pores and allowing later fluid migration. Unstable minerals undergo intense dissolution, secondary dissolution pores develop, and a small amount of residual primary pores are preserved. The physical properties are good. Overall, the dissolution diagenetic facies in the subaqueous distributary channel facies controls the distribution of favorable reservoirs.
5. Distribution Characteristics of Fractures
A fracture is a geological structure where the two sides of a rock break due to force without significant displacement along the fracture plane. According to its formation, it can be classified as a structural fracture or a non-structural fracture. Structural fractures are further divided into shear fractures and tensile fractures. The rocks in low-permeability reservoirs are dense and brittle and are prone to generate macroscopic or microscopic fractures under tectonic stress conditions. Field exploration shows that fractures and faults, especially deep high-angle fractures, can serve as effective channels for oil and gas migration. In other areas of the Junggar Basin, such as the Mahu sag, the identification and study of fault and fracture have formed an effective model, which is of reference significance for the research in this area [28].
5.1. Fracture Development Characteristics
Outcrop, core, and FMI image-log data show that fracturing is intense in the Satan 1 block. The fractures are dominated by medium- to high-angle shear and extension fractures of tectonic origin, with local development of bedding-parallel and low-angle structural fractures (Figure 9). Most fractures in the Jingjingzigou Formation are open and effective, strongly influencing reservoir flow. They provide preferred pathways for hydrocarbon migration but also increase reservoir heterogeneity, creating challenges for stimulation and production forecasting.
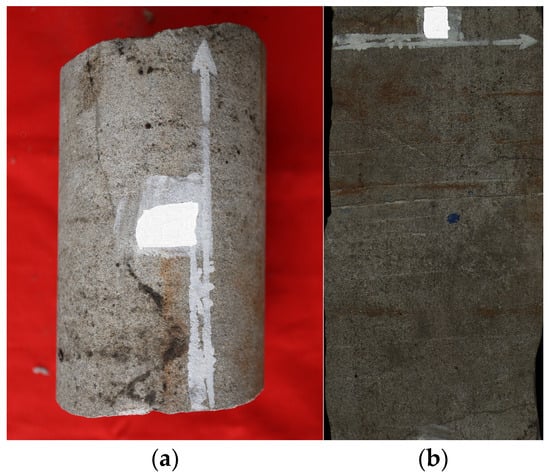
Figure 9.
Core sample photo of P2jj from well Sa104 ((a) core sample photo; (b) core profile photo).
5.2. The Relationship Between Crack Development and Oil Content
Core observation indicates that, apart from the filling fractures, fractures are generally oil-bearing. The oil content grades of core samples from the P2jj1 sand layer group are as follows: oil impregnated 20.6%, oil spots 8.3%, oil streaks 15.5%, and fluorescence 55.6%. For the P2jj2 sand layer group: oil impregnated 33%, oil spots 11.2%, oil streaks 16%, and fluorescence 39.9%. Overall, the oil content of core samples from the P2jj2 sand layer group is better than that of the P2jj1 sand layer group. The oil saturation of the core samples in Satan 1 block varies significantly. The oil saturation of medium-coarse sandstone and sand–gravel rock is relatively high, and the oil grades are mainly fluorescence. From the perspective of crack development, the coupling area of high- and low-angle open fractures has the best oil content.
5.3. Fracture Prediction and Classification
In outcrops in the field, faults often appear in the form of fracture zones. Their internal structure is complex and can be divided into the fault-sliding surface and the peripheral rupture zone, or the fractured zone and the induced fracture zone.
On the seismic profile, the fractures cause discontinuity in the coherent axis of seismic reflections, manifesting as weak coherence, high chaotic properties, high maximum likelihood properties, as well as abnormal attributes such as dip angle and curvature. To improve the prediction accuracy, in this study, the maximum likelihood body is used to predict the sliding surface of the fault, and the coherence body is used to predict the peripheral rupture zone.
According to the earthquake prediction results, the P2jj1 and P2jj2 sand layers of the Jingjingzigou Formation in the Satan 1 block of the Permian System have relatively well-developed fractures. The fractures in the northern-slope-sliding and fault-sliding zone are relatively developed, while those in the southern nose protrusion area are relatively less developed. This study divides the fractures into three categories: one is the sliding fracture zone, the second is the induced fracture zone, and the third is the matrix reservoir zone. The first category is mainly distributed near the NE-SW trending faults in the north, the third category is the matrix development area, and the second category is located between the two. After excluding isolated or small areas, a comprehensive evaluation map of favorable areas was formed (Figure 10).
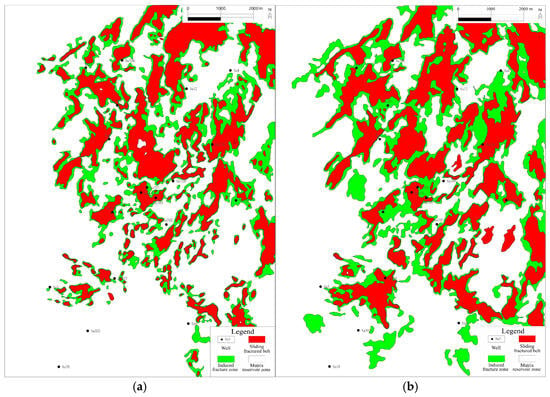
Figure 10.
Distribution map of favorable fracture areas of Jingjingzigou Formation in Satan 1 block ((a) P2jj1; (b) P2jj2).
6. Study of Sweet Spot Distribution Patterns
Reservoir quality in the Satan 1 block is governed primarily by depositional microfacies and diagenesis, with locally intense fracturing enhancing flow pathways. A sweet spot classification scheme was built from porosity/permeability, pay thickness, and fracture intensity, then calibrated with machine learning algorithms to predict the areal distribution of sweet spots and guide well placement.
6.1. Classification of Reservoir Sweet Spots
6.1.1. Core Pore and Throat Characteristics
Based on the mercury injection capillary pressure curve and the characteristics of mercury saturation, the reservoirs are classified into categories I, II, and III.
Class I reservoirs: average pore throat radius 1.12 μm, maximum pore throat radius 3.76 μm, displacement pressure 0.15 MPa, maximum mercury saturation 91.97%.
Class II reservoirs: average pore throat radius 0.51 μm, maximum pore throat radius 1.67 μm, displacement pressure 0.47 MPa, maximum mercury saturation 85.86%.
Class III reservoirs: average pore throat radius 0.13 μm, maximum pore throat radius 0.50 μm, displacement pressure 2.57 MPa, maximum mercury saturation 84.65%.
6.1.2. Classification Standards for Reservoir Sweet Spots
By comprehensively utilizing logging data, well testing data, and core analysis data, and based on the classification of pore throat radii, according to parameters such as reservoir thickness, physical properties, and oiliness, combined with the development intensity of fractures and reservoir quality, a sweet spot classification standard (Table 1) was established. The effective thickness, porosity, oil saturation, and fracture types of each well in each small layer were statistically analyzed, and based on this, the type of sweet spot for each well was determined, and a sample library for machine learning was established.

Table 1.
Classification criteria for sweet spots in Jingjingzigou Formation of Satan 1 block.
The classification standards in this study are not a simple superposition of single parameters but represent a multi-disciplinary, multi-scale, and quantitative comprehensive analysis workflow. Its core innovation lies in coupling genetic mechanisms with reservoir performance, specifically manifested at three levels:
Integration of multi-source information: The evaluation system synthesizes four major categories encompassing over ten key parameters, including geological data (sedimentary microfacies, diagenetic facies), petrophysical properties (porosity, permeability, thickness), pore–throat structure (HPMI parameters, movable fluid saturation), and fractures (development intensity, orientation). This overcomes the limitations of traditional methods that often rely on single petrophysical parameters.
Classification criteria based on genetic controls: The established sweet spot classification criteria (Table 2) directly link geological genesis to reservoir quality. For instance, the highest-quality “Class I Sweet Spots” are explicitly defined as reservoirs developed in the dissolution facies of subaqueous distributary channels, characterized by large pores and coarse throats, and intersected by high-angle effective fractures. This ensures the classification results carry clear geological significance beyond mere mathematical clustering.

Table 2.
Performance metrics of the three algorithms on the independent test set (n = 14).
6.2. Reservoir Sweet Spot Classification and Planar Distribution
6.2.1. Classification Method of Reservoir Sweet Spots
Common machine learning classification methods include decision tree (DT), random forest (RF), support vector machine (SVM), K-nearest neighbor (KNN), and neural network, etc. In this study, decision tree, random forest and support vector machine were selected as the three methods. These methods have become increasingly mature in the field of petroleum geology, such as being used for lithofacies identification and lithology prediction, providing method references for this study [15,16].
Decision tree classification principle: A decision tree is a model that makes decisions based on a tree structure. It conducts a series of tests on the features of the dataset, divides the dataset into different subsets, and, finally, provides a classification result at the leaf nodes. When a new sample needs to be classified, start from the root node, based on the feature values of the sample at each node, move down along the branches of the tree until reaching a leaf node, and the category of the leaf node is the classification result of that sample [29].
Random forest classification principle: Random forest is an ensemble learning algorithm consisting of multiple decision trees. By constructing multiple decision trees and integrating the classification results of these trees, the accuracy and stability of classification can be improved. When classifying a new sample, the sample is input into each decision tree, and the classification results of each tree are obtained. Usually, the voting method (for classification problems) is adopted to determine the final classification result; the category with the highest occurrence frequency is selected as the final classification [30].
The principle of support vector machine classification: The basic idea of support vector machine (SVM) is to find an optimal hyperplane in the feature space, separating samples of different classes as far apart as possible, and maximizing the margin (distance) between the two classes. For a new sample, calculate its distance to the hyperplane or determine its position relationship in the high-dimensional space through the kernel function, and then judge the class of the sample based on the sign [31].
6.2.2. Spatial Distribution Patterns of Reservoir Sweet Spots
This study selected 42 wells within the work area as the research subjects, with data sourced from the Jingjingzigou Formation. The original dataset comprises 70 valid samples, each encompassing the following five key reservoir parameters, porosity, permeability, oil saturation, effective thickness, fracture category.
Each sample corresponds to a respective reservoir classification label, constituting a complete supervised learning dataset. In terms of sample size, this study represents a typical few-shot learning problem. The ratio of total samples (N = 70) to feature dimensions (D = 5) is 14:1, which aligns with the statistical characteristics of few-shot data.
This study employed a hold-out method to partition the 70 well samples into training and test sets. Specifically, an 80%/20% random split was used, where 56 samples (80%) formed the training set for model development, and the remaining 14 samples (20%) constituted the test set for final model evaluation (Table 2).
Random forest performed best across all metrics, achieving an accuracy and F1-score of 0.7143 and 0.7177, respectively, demonstrating good generalization capability. Support vector machine and decision tree had the same accuracy (0.6429), but decision tree showed higher precision (0.7286), indicating better reliability in positive class predictions.
The precision of all models was higher than their recall, reflecting a conservative tendency in predictions, which may be related to the characteristics of the small sample dataset.
Using the well-point sweet spot sample data, three algorithms were employed to conduct sweet spot classification predictions for the P2jj sand layer group (Table 3).

Table 3.
Algorithm performance comparison.
The performance hierarchy clearly shows random forest (RF) > SVM > decision tree (DT) across all evaluation metrics. Random forest demonstrates the best performance, leading in all evaluation metrics. Support vector machine ranks second, showing significantly better performance than decision tree.
The feature importance distribution, calculated using the random forest algorithm, is detailed as follows: Fracture category recorded the highest importance score of 0.490, accounting for 49.0% of the total importance, indicating it is the most critical feature for distinguishing reservoir types. Oil saturation and permeability ranked second and third, with importance scores of 0.155 and 0.150, respectively, demonstrating comparable contributions. In contrast, reservoir thickness and porosity showed relatively lower importance, with scores of 0.107 and 0.097.
The classification results of the three algorithms show significant differences: The northern slope area was predominantly characterized by class I (red) and class II (green) sweet spots, whereas the central trough and southern nose areas mainly contained class III (white) sweet spots. (Figure 11).
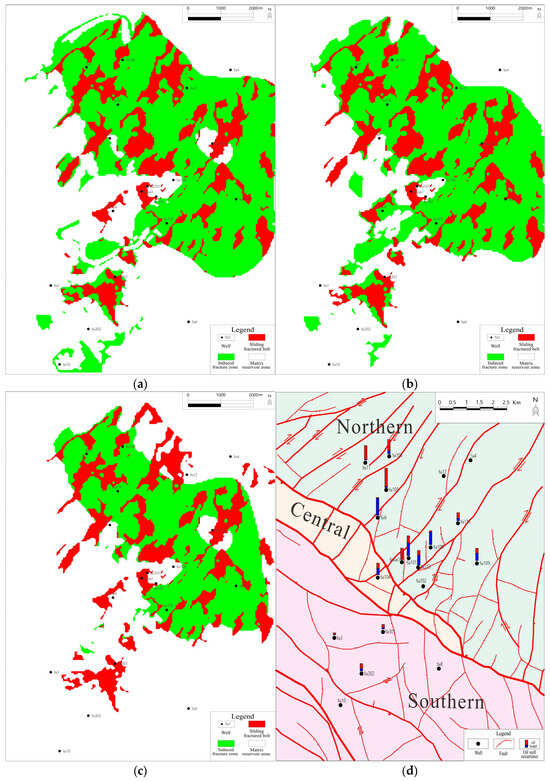
Figure 11.
Classification results of sweet spots for the P2jj2 sand layer group of Satan 1 block and production status diagram of the operating wells ((a) classification results of the random forest method; (b) classification results of the support vector machine method; (c) classification results of the decision tree method; (d) production well initial production profile diagram).
In the reservoir evaluation of the study area, fracture development is the primary geological factor controlling reservoir classification, with its influence significantly surpassing other parameters. Oil saturation and permeability, which represent key parameters for fluid storage and flow capacity, provide a moderate contribution to reservoir quality discrimination. Conversely, reservoir thickness and porosity exhibit relatively limited discriminative importance in this study. These findings align with established geological understanding and emphasize the central role of the fracture system in reservoir evaluation within this work area.
Class I area (e.g., the P2jj test oil layer of Well Sa11): It had high production. The pore structure is mainly composed of residual inter-pore pores, and the nuclear magnetic logging shows dominant large-pore signal characteristics. The proportion of mobile fluids is high (PMF/PME > 60%), and the test production shows the characteristics of initial high production and long-term high production and stable production.
Class II area (e.g., the P2jj test oil layer of Well Sa101): It achieved industrial oil flow. The pore system is characterized mainly by intragranular dissolution pores, and the nuclear magnetic logging shows dominant large- and medium-pore signal characteristics. The proportion of mobile fluids is medium (PMF/PME > 50%), and the test production shows the characteristics of initial high production and rapid decline.
Class III area (e.g., the P2jj test oil layer of Well Sa3): It had low production. The pore development is poor, and the nuclear magnetic logging shows no obvious large-pore signal. The pore system is dominated by small pores, resulting in limited mobility of fluids (PMF/PME < 40%), and production testing reveals low yield rates accompanied by elevated water content.
7. Conclusions and Understanding
Targeting the Jingjingzigou formation tight reservoirs of the Satan 1 block in the Jinan Sag, Junggar Basin, this study integrates depositional microfacies analysis, reservoir characterization, fracture prediction and machine learning techniques to identify sweet spots. The main conclusions are as follows:
- Two source systems (southeastern and northeastern) fed the block; the dominant depositional microfacies are underwater distributary channels on the braided river delta front. These microfacies control reservoir architecture and vary in lithology, petrophysical properties, sedimentary structures, and log responses. Their distribution is governed by structural framework and sediment provenance, making them the primary control on reservoir heterogeneity.
- Reservoir quality is the key control on oiliness, the two being positively correlated. High oil saturation occurs in high-quality reservoirs on the northern slope. Defining porosity/permeability distributions and vertical variations is essential for predicting pay and designing development plans.
- Fractures are dominated by medium- to high-angle shear and extension fractures of tectonic origin. Characterizing their development clarifies where permeability is enhanced. Fracture classification and sweet spots mapping provide critical guidance for well placement and stimulation strategies.
- Sweet spot identification and mapping give a clear direction for targeted development. Random forest demonstrates the best performance, leading in all evaluation metrics. The areal sweet spot distribution effectively guides capacity building and maximizes reserve recovery. For the P2jj, the predicted Class-I/II sweet spots on the northern slope match the performance of wells already on production.
In summary, the multi-disciplinary, machine learning-assisted workflow enables precise sweet spot identification and distribution forecasting in tight reservoirs, providing a robust technical basis for future well deployment and efficient reserve development in the area. Although the selected algorithms (DT, RF, SVM) have demonstrated robust performance and high interpretability on our small sample dataset, future work will benefit from incorporating state-of-the-art methods like XGBoost and LightGBM, especially as the dataset expands. This would provide a more comprehensive benchmark and potentially uncover further performance gains.
Author Contributions
Conceptualization, W.Z., C.H., D.X. and J.C.; methodology, W.Z., C.H., D.X. and J.C.; writing—original draft preparation, W.Z., C.H. and J.C.; writing—review and editing, W.Z. and C.H.; visualization, W.Z.; supervision, C.H.; project administration, J.C. All authors have read and agreed to the published version of the manuscript.
Funding
This paper is supported by the Science and Technology Special Project of China National Petroleum Corporation (Project No.: 2023ZZ24YJ04) and Tuha Oilfield Branch of China National Petroleum Corporation (Contract No. YJYHZC2023079).
Data Availability Statement
The original contributions presented in this study are included in the article. Further inquiries can be directed to the corresponding author.
Acknowledgments
The authors have reviewed and edited the output and take full responsibility for the content of this publication.
Conflicts of Interest
Authors Wei Zhang and Dianhe Xie were employed by Research Institute of Exploration and Development, Tuha Oilfield Company, PetroChina. The remaining authors declare that the research was conducted in the absence of any commercial or financial relationships that could be construed as a potential conflict of interest.
References
- Zhi, D.M.; Li, J.Z.; Yang, F.; Kang, J.; Zhang, W.; Ma, Q.; Tao, L. Geological Characteristics and Exploration and Development Practice of the Permian Full Oil and Gas System in Jimsar Sag, Junggar Basin. China Pet. Explor. 2023, 28, 14–23. [Google Scholar] [CrossRef]
- Zhi, D.M.; Xie, A.; Yang, F.; Ma, Q.; He, C.; Gou, H. Exploration Prospects of the Whole Oil and Gas System in the Permian Hydrocarbon Depressions in the Eastern Junggar Basin. J. Geomech. 2024, 30, 781–794. [Google Scholar] [CrossRef]
- Li, G.; Qin, J.; Xian, C.; Fan, X.; Zhang, J.; Ding, Y. Theoretical understandings, key technologies and practices of tight conglomerate oilfield efficient development: A case study of the Mahu oilfield, Junggar Basin, NW China. Pet. Explor. Dev. 2020, 47, 1275–1290. [Google Scholar] [CrossRef]
- Kang, J.L.; Yang, R.Z.; Ma, Q.; Lin, T.; Yang, F.; Wei, Y.Z.; Gou, H.G.; Lin, X.N.; Lin, L. Formation Conditions, Reservoir Characteristics and Exploration Directions of Permian Reservoirs in Jinnan Sag, Eastern Junggar Basin. Sci. Technol. Eng. 2023, 23, 13788–13802. [Google Scholar]
- Liang, S.; Luo, Q.; Kang, J.; Li, F.; Ma, Q.; Wang, X.; Peng, Y.; Zhang, W. Breakthrough and Significance of Risk Exploration in Well Satan 1 in Jinan Sag, Junggar Basin. China Pet. Explor. 2021, 26, 72–83. [Google Scholar] [CrossRef]
- Xu, C.; Bo, Q.; Xiang, S.; Jie, B.; Wenxia, L.; Yuqing, C.; Bobin, H. Characteristics and Influencing Factors of Tight Sandstone Reservoirs in the Second Member of the Permian Jingjingzigou Formation, Jinan Sag. Chin. J. Geol. 2024, 59, 1245–1255. [Google Scholar]
- Zhou, H.; Xuebing, J.; An, X.; Dongxue, W.; Zhizhong, W.; Qiang, T.; Xiaodong, Z. Tight Sandstone Reservoir Characteristics and Main Controlling Factors of Tight Oil Enrichment in the Second Member of Permian Jingjingzigou Formation in Jimsar Sag. Chin. J. Geol. 2025, 60, 33–43. [Google Scholar] [CrossRef]
- Eriavbe, F.E.; Okene, U.O. Machine Learning Application to Permeability Prediction Using Log & Core Measurements: A Realistic Workflow Application for Reservoir Characterization. In Proceedings of the SPE Nigeria Annual International Conference and Exhibition, Lagos, Nigeria, 5–7 August 2019; pp. 1–19. [Google Scholar] [CrossRef]
- Tang, J.; Fan, B.; Xiao, L.; Tian, S.; Zhang, F.; Zhang, L.; Weitz, D. A New Ensemble Machine-Learning Framework for Searching Sweet Spots in Shale Reservoirs. SPE J. 2020, 26, 482–497. [Google Scholar] [CrossRef]
- Yuan, Z.; Huang, H.; Jiang, Y.; Tang, J. Multi-attribute reservoir parameter estimation based on a machine learning technique. In Proceedings of the SEG International Exposition and 88th Annual Meeting, Anaheim, CA, USA, 11–16 October 2018; pp. 2266–2270. [Google Scholar] [CrossRef]
- Ore, T.; Gao, D. Supervised machine learning to predict brittleness using well logs and seismic signal attributes: Methods and application in an unconventional reservoir. In Proceedings of the First International Meeting for Applied Geoscience & Energy, Denver, CO, USA, 26 September–1 October 2021; pp. 1566–1570. [Google Scholar] [CrossRef]
- Zhu, X.; Zhao, L.; Zhao, X.; You, Y.; Xu, M.; Wang, T. Deep carbonate reservoir characterization with unsupervised machine learning approaches. In Proceedings of the Third International Meeting for Applied Geoscience & Energy, Houston, TX, USA, 24–28 August 2023; pp. 1244–1248. [Google Scholar] [CrossRef]
- Anifowose, F.; Mezghani, M.; Badawood, S.; Ismail, J. From Well to Field: Reservoir Rock Porosity Prediction from Advanced Mud Gas Data Using Machine Learning Methodology. In Proceedings of the SPE Middle East Oil, Gas and Geosciences Show, Manama, Bahrain, 19–21 February 2023; pp. 1–10. [Google Scholar] [CrossRef]
- Moussa, T.; Dehghanpour, H. Completion Design Optimization as a Function of Reservoir Quality in Tight Reservoirs: A Big Data Approach. SPE J. 2025, 30, 507–523. [Google Scholar] [CrossRef]
- Jamet, E. An eye-tracking study of cueing effects in multimedia learning. Comput. Human Behav. 2014, 32, 47–53. [Google Scholar] [CrossRef]
- Zhang, F.B.; Ma, X.L.; Dong, Z.Z.; Zou, L.; Wang, Q.; Li, W.; Wu, L. Application of Machine Learning Model Based on CNN and LSTM in Well Logging Lithology Identification. J. Xi’an Shiyou Univ. 2024, 39, 96–103. [Google Scholar] [CrossRef]
- Kuang, L.; Xu, J.; Mao, X.; Chen, C.; Li, X.; Judd, T.; Liu, Y.; Hai, L.; Li, J. Evaluating Vertical and Horizontal Well Potential of Tight Oil Exploratory Wells in the Jimusaer Field. In Proceedings of the SPE Middle East Unconventional Resources Conference and Exhibition, Muscat, Oman, 26–28 January 2015; pp. 1–15. [Google Scholar] [CrossRef]
- Rahman, K.; Gui, F.; He, W. Geomechanical and Reservoir Integrated Hydraulic Fracturing Optimisation for a Tight Oil Reservoir: A Case Study from Offshore Vietnam. In Proceedings of the SPE Asia Pacific Oil & Gas Conference and Exhibition, Adelaide, Australia, 14–16 October 2014; pp. 1–18. [Google Scholar] [CrossRef]
- Li, B.; Billiter, T.C.; Tokar, T. Rescaling Method for Improved Machine-Learning Decline Curve Analysis for Unconventional Reservoirs. SPE J. 2021, 26, 1759–1772. [Google Scholar] [CrossRef]
- Malkov, A.; Aikman, M.; Badmaev, D.; Chaube, A.; Venkatraman, A.; Dindoruk, B.; Davudov, D.; Osei, K. Accelerating Infill Well Location Optimization Through Hybrid Machine Learning Reservoir Analysis. In Proceedings of the SPE Advances in Integrated Reservoir Modelling and Field Development Conference and Exhibition, Abu Dhabi, United Arab Emirates, 2–4 June 2025; pp. 1–9. [Google Scholar] [CrossRef]
- Aliyuda, K.; Howell, J.; Humphrey, E. Impact of Geological Variables in Controlling Oil-Reservoir Performance: An Insight from a Machine-Learning Technique. SPE Reserv. Eval. Eng. 2020, 23, 1314–1327. [Google Scholar] [CrossRef]
- Khormali, A.; Ahmadi, S.; Aleksandrov, A.N. Analysis of reservoir rock permeability changes due to solid precipitation during waterflooding using artificial neural network. J. Pet. Explor. Prod. Technol. 2025, 15, 1–18. [Google Scholar] [CrossRef]
- Zhang, C.; Yu, X.H.; Li, S.L.; Chen, H.L.; Yang, Z.H.; Li, Y.L. Sedimentary Characteristics and Model of Outcrop in Jingjingzigou Formation of Southern Margin, Junggar Basin. Xinjiang Pet. Geol. 2017, 38, 1. [Google Scholar] [CrossRef]
- Shan, X.; Dou, Y.; Liu, C.W.; Pan, J.; Guo, G.H.; Peng, P.; Li, K. Characteristics and Controlling Factors of Deep Buried Tight Conglomerate: A Case Study from the Permian Upper Urho Formation of Fukang Sag, Junggar Basin. Acta Sedimentol. Sin. 2025, 43, 1116–1129. [Google Scholar] [CrossRef]
- Shan, X.; Dou, Y.; Yan, Q.; Chen, X.G.; Peng, B.; Yi, J.F. Characteristics and Controlling Factors of Tight Oil Reservoirs of Fengcheng Formation in Southern Slope of Mahu Sag. Xinjiang Pet. Geol. 2022, 43, 704–713. [Google Scholar]
- Sun, L.H.; Xiao, H.M.; Tan, L.; Li, B.W.; Sun, D.W.; Wang, P.W. Pore Structure Comparison and Difference Mechanism Between Tight Sandstone and Tight Conglomerate Reservoirs. Acta Geol. Sin. 2022, 96, 18. [Google Scholar] [CrossRef]
- Chen, X.X.; Li, W.; Xu, Q.R.; Geng, M.; Wang, Z.; Han, B.; Zhao, X. Microscopic Characteristics and Causes of Micro-Fractures in the Jingjingzigou Formation in Jimsar Sag, Junggar Basin. Geol. Rev. 2025, 71, 181–191. [Google Scholar] [CrossRef]
- Hu, Z.M.; Hu, M.Y.; Yu, Y.; Jiao, S.J.; Wei, T.; Meng, L.F.; Ye, Y.P.; Yin, S.L. Fault-Fracture Body Identification and Reservoir Development Model: Taking Baikouquan Formation in Madong Area of Mahu Sag, Junggar Basin as an Example. Fault-Block Oil Gas Field 2024, 31, 283–288. [Google Scholar]
- Li, H. Statistical Learning Methods; Tsinghua University Press: Beijing, China, 2012. [Google Scholar]
- Zhou, Z.H. Machine Learning; Tsinghua University Press: Beijing, China, 2016. [Google Scholar]
- Vapnik, V.N. The Nature of Statistical Learning Theory; Springer: Berlin/Heidelberg, Germany, 1995. [Google Scholar]
Disclaimer/Publisher’s Note: The statements, opinions and data contained in all publications are solely those of the individual author(s) and contributor(s) and not of MDPI and/or the editor(s). MDPI and/or the editor(s) disclaim responsibility for any injury to people or property resulting from any ideas, methods, instructions or products referred to in the content. |
© 2025 by the authors. Licensee MDPI, Basel, Switzerland. This article is an open access article distributed under the terms and conditions of the Creative Commons Attribution (CC BY) license (https://creativecommons.org/licenses/by/4.0/).