Abstract
The pursuit of efficient drying methods that preserve fruit quality remains a major challenge in food processing. Non-thermal pre-treatments such as ultrasonication (U), edible film coating (F), and osmotic dehydration (O) can improve drying performance but show limited effectiveness when applied individually. This study investigates a combined pre-treatment strategy for pear drying, evaluating a taro starch-based edible coating used alone and in combination with U and O. Pear slices received individual and combined pre-treatments (F, OF, UF, and UOF) prior to drying at temperatures of 60, 70, and 80 °C. The drying kinetics were modeled, and quality parameters such as effective moisture diffusivity (Deff), rehydration capacity, microstructure, color, total phenolic content (TPC), antioxidant activity, and vitamin C, were assessed. The Page model fitted the drying data the best (R2 > 0.9935). UF achieved the shortest drying time and a porous microstructure, thereby enhancing rehydration. OF showed the highest Deff and best color retention, but the lowest rehydration. Conversely, UOF caused the greatest losses in bioactive compounds (TPC: 54.29 mg GAE/100 g; antioxidant activity: 15.39%; 0.48 mg vitamin C/100 g). Unlike single-technology studies, this sequential pre-treatment strategy for pears uniquely tailors the final quality, targeting efficiency, color, bioactivity, or structural properties.
1. Introduction
The pear (Pyrus communis L.) is among the most widely cultivated fruits worldwide, appreciated for its pleasant taste, nutritional composition, and health-promoting properties [1,2,3]. The Deveci pear (Pyrus communis L. cv. Deveci) is one of the most prominent cultivars, recognized for its large fruit size, crisp texture, and distinctive taste [4,5]. It is also a valuable source of dietary fiber, vitamin C, and phenolic compounds with antioxidant activity [2,3,6]. The high susceptibility of fresh pears to post-harvest losses and mechanical damage represents a significant economic challenge [1,7]. While drying serves as an effective preservation method by reducing water content and extending shelf life [2,4,6,8], conventional hot-air drying often induces thermal degradation, leading to nutrient loss, color alteration, and undesirable texture changes [2,6,8,9,10]. These limitations highlight the necessity for pre-treatment strategies that can mitigate quality degradation while improving drying efficiency and reducing energy consumption [11]. Among these approaches, the application of a single edible coating is recognized as a non-thermal, green technology that can form a selective barrier on the food surface, thereby minimizing oxidative degradation and preserving color and bioactive compounds during thermal processing [9,12,13].
Starch-based edible coatings are frequently chosen for their superior oxygen barrier properties, which aid in preserving bioactive compounds like carotenoids and total phenolics by mitigating thermal degradation [9]. Among various starch sources, taro starch (Colocasia esculenta) has recently attracted attention as a promising material for edible coatings due to its biodegradability, affordability, hydrophilicity, and superior film-forming capacity, which is attributed to its small granule size and unique amylose-to-amylopectin ratio [14,15]. The effectiveness of taro starch-based edible coatings in prolonging the shelf life of fresh produce, including red peppers [15], mangoes [16], and peeled salak fruit [17], is well-established. However, research has primarily concentrated on characterizing the film properties and their application during the storage of these fresh commodities [15,16,17,18]. A significant research gap exists, however, concerning the application of these coatings on pears as a combined pre-treatment before the fruit drying process. This area remains unexplored in the current literature. In addition to coating techniques, osmotic dehydration is commonly utilized in food processing to decrease initial moisture content, preserve natural pigments, and enhance the quality attributes of dried products, such as pears [5,19]. This process involves the diffusion of water from fruit tissue into a hypertonic solution, influenced by osmotic pressure gradients. Concurrently, solutes from the solution may enter the tissue, resulting in partial dehydration and solute impregnation [20]. Furthermore, ultrasonication is increasingly applied as a pre-treatment to accelerate mass transfer during osmotic dehydration and subsequent drying processes. As has been reported in various food matrices, the acoustic cavitation produced by ultrasonic waves disrupts the cellular structure, improving membrane permeability and facilitating moisture removal [21,22].
Previous studies on fruit drying pre-treatments have mainly focused on the individual effects of ultrasonication [21,22,23], osmotic dehydration [5,16], or edible coating applications (e.g., xanthan gum, sodium alginate, pectin, and gelatin [13]), all aiming to enhance drying efficiency and preserve final product quality. However, previous studies have mainly focused on individual pre-treatments, and systematic evaluation of combined pre-treatment strategies for pear slices, particularly involving taro starch-based coatings, has not been fully addressed. Notable examples of such combined pre-treatment strategies include the application of ultrasonication with coating, as reported in sweet cherry [24], or ultrasonication in combination with osmotic dehydration, as demonstrated in kiwifruit [25], cranberries [26], and Satkara fruit [21]. This study addresses a major research gap by introducing a novel pre-treatment strategy using a taro starch-based edible coating for Deveci pear fruit (Pyrus communis L. cv. Deveci) prior to the drying process. The rationale for using these combined pre-treatments is that each method targets a different barrier to moisture transfer and quality loss: ultrasonication increases cell membrane permeability, osmotic dehydration removes free water, and coatings control the surface moisture, thereby potentially achieving a synergistic effect. We hypothesized that the taro starch-based edible coating, applied alone or with pre-treatments, would improve the quality of dried taro, specifically enhancing color, structural integrity, and rehydration capacity, while actively altering the drying kinetics compared to untreated samples. To test this hypothesis, this study aims to comprehensively investigate the influence of this coating (F), applied individually or in combination with ultrasonication (U) and osmotic dehydration (O), on the drying kinetics and quality attributes of pears. The combined pre-treatments were applied in a specific sequence, as denoted by their acronyms: UF (ultrasonication then coating), OF (osmotic dehydration then coating), and UOF (ultrasonication, osmotic dehydration, then coating). These strategies were employed to achieve a dual objective: enhancing the drying efficiency and preserving the product quality, with a specific focus on bioactive compounds, color, and microstructure. The study provides new insights into the combined effects of these treatments, demonstrating their potential to enhance drying efficiency while preserving specific physicochemical qualities.
2. Materials and Methods
2.1. Materials
Pears (Pyrus communis L. cv. Deveci) were procured from the Fruit Research Institute, MAREM, Eğirdir-Isparta, Türkiye. Fresh taro (Colocasia esculenta L. Schott) corms were obtained from a regional grower in Mersin, Türkiye. Both pears and taro corms were stored in a cold chamber at 2 ± 1 °C and 85–90% relative humidity until use.
Commercial sucrose was purchased locally, and glycerol was supplied by Sigma-Aldrich (St. Louis, MO, USA). All other chemicals were of analytical grade, including gallic acid (CAS No. 6192-52-5, Sigma-Aldrich, St. Louis, MO, USA), L-ascorbic acid (CAS No. 50-81-7, Sigma-Aldrich, St. Louis, MO, USA), m-phosphoric acid (CAS No. 37267-86-0, Merck, Darmstadt, Germany), 2,2-diphenyl-1-picrylhydrazyl (DPPH; CAS No. 1898-66-4, Sigma-Aldrich, St. Louis, MO, USA), methanol (CAS No. 67-56-1, Sigma-Aldrich, St. Louis, MO, USA), sodium carbonate (Na2CO3; CAS No. 497-19-8, Merck, Darmstadt, Germany), and Folin–Ciocalteu’s reagent (Merck, Darmstadt, Germany).
2.2. Sample Preparation and Pre-Treatments
Deveci pears were washed, and the stem and calyx ends were removed to minimize tissue variability among samples. The pears were then mechanically sliced using a stainless-steel manual cutter (LX-02, Dalle, Jinjiang, Fujian, China) to a uniform thickness of 3.5 ± 0.1 mm. Five sample groups were prepared: control (C), film coating only (F), and three combined pre-treatments (UF, OF, and UOF). These groups were designed to investigate the effects of a taro starch-based edible coating, applied alone or in combination with other pre-treatments, on the drying kinetics and quality characteristics of pear slices. The combined pre-treatments were applied sequentially in the specific order indicated by their acronyms: UF (ultrasonication followed by coating), OF (osmotic dehydration followed by coating), and UOF (ultrasonication followed by osmotic dehydration and coating). The specific order of the combined pre-treatments was strategically designed to maximize synergistic effects and protect the final coating. Ultrasonication (U) was applied first to enhance tissue permeability, thereby improving the efficiency of the subsequent osmotic dehydration (O). The edible coating (F) was always applied as the final step because subjecting it to the mechanical stress of ultrasonication or the hypertonic solution of osmotic dehydration would damage its structural integrity and barrier function.
The osmotic pre-treatment (O) was carried out according to an established protocol [5]. Pear slices were immersed in a 55 °Bx sucrose solution prepared with distilled water at 24 ± 1 °C for 1 h. All treatments were performed using the same batch of solution, maintaining a solid-to-solution mass ratio of 1:4 (w/w). A nylon mesh basket was employed to guarantee complete submersion and to avert sample flotation. After treatment, the slices were removed and gently blotted with absorbent paper to remove any excess solution.
The ultrasound pre-treatment (U) was performed in an ultrasonic water bath (Witeg, WUC-D, 40 kHz, 100 W, Wertheim, Germany) at 25 °C for 20 min and 50% amplitude, maintaining a solid-to-liquid ratio of 1:3 (w/w).
For the edible coating pre-treatment (F), taro starch was used as the coating material. Starch was extracted from taro tubers following the method described in [27], and the coating solution was prepared according to [28]. A 5% (w/v) taro starch suspension was prepared in distilled water, to which 3% (v/v) glycerol was added as a plasticizer. The mixture was homogenized at 500 rpm for 5 min and heated to 85 ± 1 °C on a magnetic hot plate stirrer (MSH-20D, Daihan, Wonju, Republic of Korea) until complete gelatinization. The gelatinized coating solution was then sonicated for 20 min to remove air bubbles and cooled to 30 ± 1 °C before use. Pear slices were immersed in the coating solution for 1 min at a solid-to-liquid ratio of 1:3 (w/w). The coated slices were placed on stainless steel sieves and air-dried for 10 min at room temperature (22 ± 2 °C) to ensure coating adherence. The application of the taro starch-based coating was standardized by quantifying the coating uptake. The coating uptake was calculated as the percentage of weight gain relative to the uncoated sample weight, ensuring a consistent and reproducible coating load across all replicates.
2.3. Convective Hot Air Drying
Control and pretreated samples were dried in a convective dryer (DefneLab, Afyonkarahisar, Türkiye) at a fixed air velocity of 1.6 m/s and three temperatures: 60, 70, and 80 °C. The drying chamber (60 × 80 × 80 cm) operates within a temperature range of 20–90 °C, relative humidity of 10–95%, and adjustable air velocity of 0–1.8 m/s. The system includes an integrated weighing unit and digital displays for real-time monitoring of temperature, relative humidity, and sample mass. Perforated stainless-steel mesh trays were used for sample placement. A photograph of the convective dryer used in this study is provided in the Supplementary Materials (Figure S1). Thin-layer drying was performed with approximately 750 g of pear slices arranged in a single layer on the tray to ensure uniform heat and mass transfer. The drying experiments were performed in duplicate (N = 2). The drying data were collected automatically and non-destructively at 5-min intervals, generating continuous drying curves containing a large number of data points for each independent run. Drying persisted until equilibrium was attained, characterized by a mass change of less than 5 g over five successive measurements; the total experimental time required to reach this point was recorded as the drying time. Subsequent analytical measurements were conducted in at least triplicate (n = 3) for each independent run, with the exception of color analysis, which was performed with n = 5 measurements.
2.4. Drying Kinetics and Mathematical Modeling
The drying behavior of pear slices was analyzed by fitting experimental data into well-established mathematical models. The initial moisture content (M0) was determined experimentally using the standard oven drying method at 105 °C until constant weight, according to AOAC guidelines [29]. Moisture loss during drying was recorded, and the moisture ratio (MR) at each time point was determined using Equation (1):
where M0 represents the initial moisture content on a dry basis (d.b.) of the material in g/g; Mt is the moisture content (d.b.) at drying time t in g/g; and Me indicates the equilibrium moisture content. For the long drying times applied, the equilibrium moisture content Me was considered negligible and assumed to be zero, simplifying Equation (1) to MR = Mt/M0 for model fitting, which is a common practice in thin-layer drying analysis [30].
The thin-layer drying of ‘Deveci’ pears during the falling rate period was modeled using Fick’s second law of diffusion [31]. For an infinite slab geometry and long drying times, the analytical solution simplifies into Equation (2):
where MR is the moisture ratio, Deff is the effective moisture diffusivity (m2/s), t is the drying time (s), and L is the half-thickness of the pear slices (m) [32]. The equation was linearized by taking the natural logarithm (Equation (3)):
The effective moisture diffusivity (Deff) was calculated from the slope (K) of the linear regression of ln(MR) versus time, using Equation (4):
The activation energy (EA) for moisture diffusion during the drying of Deveci pears was determined by modeling the temperature dependence of the effective moisture diffusivity (Deff). This relationship was described using the Arrhenius equation, resulting in the following form (Equation (5)):
In this equation, D0 is the pre-exponential factor (m2/s), EA is the activation energy (J/mol), R is the universal gas constant (8.314 J/mol·K), and T is the absolute drying temperature (K) [33]. For the purpose of calculating EA, Equation (5) was linearized by taking the natural logarithm of both sides (Equation (6)). The activation energy (EA) was obtained from the slope of the plot of the natural logarithm of the effective moisture diffusivity (ln(Deff)) versus the reciprocal of the absolute temperature (1/T).
The drying data were fitted to five thin-layer drying models: Lewis, Page, Henderson and Pabis, Logarithmic, and Wang and Singh. Model parameters were estimated at each drying temperature (60, 70, and 80 °C) using non-linear regression analysis. Parameter estimation and model fitting were performed with the non-linear least squares algorithm (curve fit function) in Python (version 3.13.2) using the SciPy library (version 1.7.0). The mathematical forms of the models are presented in Table 1.

Table 1.
The thin-layer drying models assessed in this study.
The goodness-of-fit for each model was evaluated using the coefficient of determination (R2), root mean square error (RMSE), and chi-square (χ2), which were calculated using the Equations (7)–(9). The model that best fits the experimental data is characterized by a coefficient of determination (R2) approaching unity, along with root mean square error (RMSE) and reduced chi-square (χ2) values approaching zero [21].
where MRe,i and MRp,i are the experimental and predicted moisture ratios, respectively; N is number of observations; and z is the number of models [39].
2.5. Color Measurement
The color values of dried pear slices (pre-treated and control) were evaluated in terms of lightness (L*), redness (a*), and yellowness (b*) according to the CIELab system using a colorimeter (Chroma Meter CR-400, Minolta, Osaka, Japan). The system was equipped with a D65 illuminant and an 8 mm aperture. The total color difference (ΔE) and browning index (BI) were calculated as previously described [40]. Color difference (ΔE) was calculated using the average color values of the fresh pear slices corresponding to each drying experiment as the reference. Each measurement was repeated five times, and results are expressed as the mean ± standard deviation.
2.6. Total Phenolic Content, and Antioxidant Activity
Bioactive compounds were extracted from dried samples (2 g) using 80% (v/v) methanol (30 mL and 35 mL, respectively) with a high-speed homogenizer (Heidolph Silent Crusher M), followed by filtration through Whatman No. 2 paper. Extracts were stored at −80 °C until analysis. The total phenolic content (TPC) and antioxidant activity (AA) of dried pear samples were determined according to [41] with slight modifications. For TPC, the reaction mixture, containing 100 µL of extract, 100 µL of Folin–Ciocalteu reagent, 200 µL of 7.5% Na2CO3, and 1.6 mL of distilled water, was incubated for 1 h in the dark. Absorbance was measured at 765 nm using a UV-Vis spectrophotometer (Varian Cary 50 Bio, Agilent Technologies, Santa Clara, CA, USA). TPC was expressed as mg gallic acid equivalent per 100-g dry weight (mg GAE/100 g dw). For AA, the DPPH radical scavenging assay was employed. A 0.1 mL extract was mixed with 2.9 mL of 0.1 mM DPPH solution, incubated for 30 min in the dark, and the absorbance was measured at 517 nm using the same spectrophotometer. The results were expressed as percentage inhibition (%). All analyses were performed in triplicate. The results are expressed as the mean ± standard deviation.
2.7. Determination of Vitamin C by HPLC
The vitamin C (L-ascorbic acid) content was quantified by HPLC according to [42] with slight modifications. Briefly, 5 g of ground sample was homogenized with 5 mL of 2.5% (w/v) meta-phosphoric acid and centrifuged (6500× g, 10 min, 4 °C). The supernatant was filtered (0.45 μm) after dilution. Chromatographic separation was achieved on a C18 column (Phenomenex Luna, 250 × 4.6 mm, 5 μm) at 25 °C using 1 mL/min H2SO4 (pH 2.2) as the mobile phase. A standard calibration curve (50–2000 ppm, R2 = 0.9953) was used. The Limit of Detection (LOD) and Limit of Quantification (LOQ) were defined as S/N = 3 and S/N = 10, respectively. Detection was at 254 nm. Analyses were performed in triplicate, and results are reported as the mean ± standard deviation.
2.8. Morphological Analysis by SEM
The morphological characteristics of the dried pear samples were examined using scanning electron microscopy (SEM) (LEO 440 VP, Zeiss, Cambridge, UK). Prior to imaging, the dried samples were mounted on aluminum stubs using double-sided adhesive carbon tape. The samples were coated with a thin layer of carbon under vacuum to ensure surface conductivity. Micrographs were acquired at 250× magnification, and a 20 µm scale bar was included for reference.
2.9. Rehydration Capacity Analysis
To determine the rehydration capacity (RR), dried pear samples were immersed in distilled water (25 °C) at a mass ratio of 1:50 (w/v) [43] and incubated in a water bath (Memmert, Schwabach, Germany) until a constant weight was achieved. Samples were removed from the water using a stainless-steel slotted spoon, gently blotted with filter paper to remove any excess surface water, and then weighed using an analytical balance (HR 250, A&D Company, Ltd., Tokyo, Japan). RR was calculated as the ratio of the final rehydrated weight to the initial dry weight. All measurements were performed in triplicate, and the data are expressed as the mean ± standard deviation.
2.10. Statistical Analysis
Data were analyzed using SPSS software (v23.0, IBM SPSS Statistics, Armonk, NY, USA). Differences among mean values were determined by one-way analysis of variance (ANOVA), followed by Tukey’s Honestly Significant Difference (HSD) test. A significance level of p < 0.05 (at a 95% confidence level) was applied to all comparisons.
3. Results and Discussion
3.1. Drying Kinetics and Modeling
The experimental moisture ratio (MR) data were analyzed using five common thin-layer models: Lewis (Newton), Page, Henderson & Pabis, Two-Term, and Wang and Sing [21,23,44]. According to established criteria for evaluating drying models, a good fit is characterized by a high R2 (approaching 1.00), and low values for RMSE and χ2 (approaching 0.00) [4,21,45]. Among the thin-layer drying models tested, the Page model provided the best fit for all experimental data, as indicated by the highest coefficient of determination (R2 > 0.9935) (Table 2). The low error indices, including the root mean square error (RMSE) and chi-square (χ2), provided additional confirmation of this observation. The success of the Page model lies in its flexibility to account for deviations from a simple diffusion-controlled mechanism (Fick’s law), which is assumed by models like Lewis where the exponent n is fixed at 1. Similar findings have been reported in the drying of different pear varieties where the Page model frequently outperforms other thin-layer models in terms of predictive accuracy [46,47,48].
Table 2.
Comprehensive statistical parameters of various thin-layer drying models for pear samples under different pre-treatments and temperatures.
The calculated constants of thin-layer models are presented in Table 3. The model parameters, the drying rate constant (k) and the dimensionless exponent (n), provided profound mechanistic insights into the impact of the pre-treatment sequence on the drying process. The exponent n values greater than unity (1.2175–1.5660) across all treatments and temperatures indicate that the drying process deviated from a simple diffusion-controlled mechanism, being affected by additional internal and external mass transfer phenomena such as structural shrinkage, surface resistance, and the specific effects of the pre-treatments [13,49]. The drying rate constant (k) increased systematically with temperature, aligning with the corresponding rise in the effective moisture diffusivity (Deff), as observed in Table 4 and consistent with reported values for similar fruit matrices [24,50]. The effective moisture diffusivity (Deff) values for all samples ranged from 4.55 × 10⁻¹¹ to 1.56 × 10⁻¹⁰ m2/s (Table 4), which is consistent with the reported range for various fruit materials [45]. As anticipated, elevating the drying temperature from 60 to 80 °C led to increased Deff values and reduced drying durations across all treatments, indicating improved water mobility at higher temperatures [23].
Table 3.
Model Parameters of thin-layer drying models for pear samples under different pre-treatments and temperatures.
Table 4.
Drying times and effective moisture diffusivity values of untreated and pre-treated pear samples.
The results in Table 4 revealed that the effective moisture diffusivity (Deff) and the Page model rate constant (k) were not strictly proportional across all pre-treatments. Although they generally followed similar trends, deviations were observed depending on the dominant drying mechanism. This partial inconsistency indicates that the pre-treatment sequence fundamentally changed the mechanism controlling the drying rate. Statistical analysis confirmed that pre-treatment and temperature had a highly significant combined effect on Deff (F(14, 15) = 170.510, p < 0.001).
The use of the taro starch-based coating (F) alone led to a steady decrease in Deff at all temperatures when compared with the Control with its Deff values at 60 °C being statistically lower (4.55 vs. 6.09, group ‘b’ vs. ‘a’). This is corroborated by the Page model, which showed lower k values for F, particularly at higher temperatures. The EA for F (34.32 kJ/mol) was slightly higher than that of the Control. This observed hindrance to moisture transfer is a characteristic effect of edible coatings, which function by creating a semi-permeable barrier on the product surface, thereby increasing resistance to mass transfer and slightly impeding the drying process [13,30,44].
The pre-treatment combining ultrasonication followed by coating (UF) presented a more complex effect. It led to significantly faster drying (305 min at 60 °C, group ‘f’) compared to the Control and F samples and higher Deff values compared to the Control, accompanied by the highest EA (44.37 kJ/mol). Notably, at 80 °C, UF achieved the shortest drying time (175 min, group ‘a’) and the highest Deff value of all treatments. A possible explanation for this combination is that the mechanical effects of acoustic cavitation during ultrasonication create micro-channels within the tissue [23], which would enhance internal moisture movement (leading to higher Deff). However, the subsequent coating may partially infiltrate these channels, increasing resistance during the later drying stage and thus requiring more energy (higher EA). This dual effect explains why the overall drying rate did not increase as much as the high Deff might suggest, and why the drying rate declines more sharply at the final stage (as reflected in the Page model parameters).
The osmotic dehydration followed by coating (OF) pre-treatment yielded shorter drying times compared to the control and among the highest Deff values among all samples. This outcome is a direct consequence of the osmotic step, where the high concentration of sucrose creates a hypertonic solution. The osmotic pressure gradient across the semi-permeable membranes of the pear tissue induces the fast outflow of free water from the tissue into the solution, concurrently promoting the transport of solutes into the fruit [22,25]. For instance, studies on convectively dried pear slices indicate that osmotic dehydration before drying reduces drying times by up to 42% compared to untreated samples [20], a finding consistent with the values observed in the OF group. Statistical analysis indicates that the EA of the OF pretreatment (36.34 kJ/mol, group ‘b’) was significantly higher than that of the Control (33.27 kJ/mol, group ‘a’). This suggests that after the easy removal of free water via osmosis, a significant portion of the remaining moisture is in a bound state within the cellular matrix, requiring more thermal energy for its removal compared to the control. Furthermore, the final coating step (F) applied to this solute-rich tissue alters the film’s properties. After the osmotic process, residual sucrose, which contains multiple hydroxyl (-OH) groups, is capable of forming strong hydrogen bonds with water molecules [51]. This interaction can contribute to a reduced rate of water evaporation at the coating–tissue interface. Therefore, residual sucrose on the pear surface acts as a strong humectant and plasticizing agent for the taro starch film, preventing excessive surface hardening or vitrification at high temperatures. The resulting coating remains flexible, supporting moisture diffusion and maintaining a relatively high Deff. However, the removal of the remaining bound water requires higher thermal energy than control. In the OF pretreatment, the combination of bound water removal and the coating’s physical resistance accounts for its EA value being higher than the control’s.
The triple-combination pre-treatment (UOF) demonstrated the most favorable kinetic performance among all groups. The UOF method demonstrated the shortest drying time overall, taking 295 min at 60 °C. It also exhibited high effective diffusivity values and the lowest activation energy of 33.11 kJ/mol among all pre-treated samples, suggesting a highly efficient process with minimal energy costs.
The process sequence; ultrasonication, followed by osmotic dehydration and then coating, is crucial to this outcome: the initial ultrasonication (U) likely improves cell membrane permeability and creates micro-channels, thereby enhancing the efficiency of the subsequent osmotic dehydration (O) by facilitating mass transfer (water efflux and solute uptake). This effective pre-treatment sequence leads to a product in which the final coating (F) is applied to a matrix that has already achieved a lower free-water content, thereby reducing the relative resistance created by the coating.
The structure achieved by this effective sequence successfully avoids the two main limitations observed in other treatments: it prevents the high energy barrier from residual bound water (as seen in OF) and the surface sealing effect that restricts diffusion (as seen in UF). The Page n values for UOF, which are close to those of the control and OF, further suggest a return to a more diffusion-dominated mechanism, confirming the successful improvement of the mass transfer process.
Beyond the kinetic mechanisms, the activation energy (EA) values offer practical insights for industrial scaling. A higher EA, as observed for the OF pretreatment, generally suggests greater thermal energy demand to remove moisture, which could translate to higher operational costs. Conversely, the lower EA value of the UOF pretreatment indicates a comparatively lower energy demand for drying. These findings highlight a trade-off between drying rate and energy consumption, providing a useful perspective for evaluating the economic feasibility of these methods in industrial applications.
3.2. Bioactive Properties
The application of the coating alone (F samples) demonstrated a slight protective effect on total phenolic compounds (TPC) at 60 and 70 °C (Table 5). This suggests that the coating provided a partial barrier against thermal degradation, consistent with reports that biopolymer coatings minimize the loss of bioactive compounds during drying processes [13,30]. However, this protective effect was lost at 80 °C, where the coated sample showed a lower TPC than the control. This highlights the coating’s constraints when subjected to extreme thermal stress, consistent with findings of rapid phenolic degradation at elevated temperatures, where these film barriers are noted to be inadequate [30]. The UF treatment yielded a significantly lower TPC than the Control and F groups (F(14, 15) = 21.08, p < 0.001). This indicates that the microstructural disruption from ultrasonication, facilitated phenolic degradation or loss, an effect that the subsequent coating could not mitigate [22]. The OF and UOF treatments exhibited the lowest TPC values across the pre-treatments (F(14, 15) = 21.08, p < 0.001), indicating substantial phenolic leaching into the osmotic solution during the OD process, a loss that the subsequent taro-based edible coating was unable to prevent [5]. This loss is primarily attributed to the mechanism of osmotic treatment itself: the high osmotic concentration and prolonged duration lead to the migration of hydrophilic bioactive components (e.g., vitamins, organic acids, and phenolic compounds) into the osmotic solution, thereby resulting in the loss of hydrophilic components such as phenolic compounds [5,22]. As a result, the taro starch coating showed measurable protective effects only at lower temperatures. The combination of osmotic dehydration or ultrasonication with the coating did not mitigate the notable phenolic losses typically associated with these treatments.
Table 5.
Effect of different pre-treatments and drying temperatures on the bioactive compounds of pear samples.
The DPPH radical-scavenging activity of the dried pears was significantly affected by pre-treatment and temperature (F(14, 15) = 41.90, p < 0.001). A marked decrease in activity with increasing temperature confirmed the thermal degradation of antioxidants [21,23]. Treatments involving osmotic dehydration (OF, UOF) yielded the lowest antioxidant activity. This indicates that the benefit of their reduced drying time (Table 4) was outweighed by the substantial leaching of antioxidants into the osmotic solution, a process inherent to osmotic dehydration [19,21]. The edible coating (F) offered a minor protective effect at lower temperatures. This aligns with the established role of edible, starch-based coatings, which serve mainly as barriers to oxygen, thus aiding in reducing oxidative degradation of antioxidants [13,24]. Conversely, the UF treatment resulted in lower activity compared to the control and F samples. This reduction is likely due to the destructive effects of acoustic cavitation on thermolabile bioactive compounds, potentially exacerbated by the generation of reactive oxygen species (ROS) during the ultrasound pre-treatment [22,25]. A weak, non-significant correlation was found between TPC and antioxidant activity (AA) (r = 0.231, p = 0.390), indicating a non-linear relationship [2,52]. This suggests that soluble phenolics are not the sole contributor to the antioxidant capacity. This divergence can be attributed to several factors. Ascorbic acid, present in fresh pears [3], and its derivatives likely contribute to the AA. Furthermore, the overall activity is a composite measure, potentially influenced by the formation of Maillard reaction products during drying [53], and the physical barrier effect of the edible coating [13,30]. Therefore, the final antioxidant capacity is determined by a complex interplay between residual native antioxidants, process-induced compounds, and physical matrix effects.
A consistent decrease in final vitamin C content was observed with increasing drying temperature across all pre-treatment groups, confirming its high thermal lability (F(14, 15) = 620.24, p < 0.001) [21,44]. This thermal sensitivity was statistically confirmed within each pre-treatment group, as evidenced by the distinct Tukey’s HSD letters assigned to the 60, 70, and 80 °C levels for the Control, F, and UF samples. The application of a taro starch-based edible coating alone (F) showed a neutral to slightly negative impact on vitamin C preservation compared to the control. As established in the literature, polysaccharide coatings generally provide an effective oxygen barrier to preserve vitamin C [13,44]; however, this protective role is often overwhelmed by severe thermal conditions, where the rate of thermal degradation becomes dominant [21]. The lowest vitamin C content was found in osmotic dehydration treatments (OF, UOF). Despite their reduced drying times (Section 3.1, Table 4), the significant loss indicates that the dominant mechanism was the leaching of water-soluble vitamins during the osmotic step, which outweighed the benefit of shorter thermal exposure. Thus, these pre-treatments offer a valuable trade-off. The same mechanisms that enhance drying performance and physical quality, such as ultrasonication for creating micro-channels and osmotic dehydration for water removal, unavoidably lead to a partial reduction in certain bioactives through leaching and degradation.
3.3. Color
The analysis of lightness (L*) revealed a statistically significant difference among the treatment combinations (F(14, 15) = 159.51, p < 0.001) (Table 6). L* values consistently decreased with increasing drying temperature across all groups, confirming the expected acceleration of browning reactions at higher thermal energy levels [24]. The best color preservation was attained by osmotic pre-treatment (OF), with the peak L* value (77.86) recorded at 60 °C. The OF treatment maintained superior L* values at lower temperatures (60 °C and 70 °C), indicating better color retention compared to other treatments. This effect stems from a dual mechanism: sugar infusion during osmosis reduces water activity and drying time, while the subsequent taro starch coating provides an additional barrier against oxidative browning [12,13,19]. This combination effectively suppresses non-enzymatic browning reactions, primarily the Maillard reaction and caramelization, that cause darkening [19,54]. Similar positive effects were observed in the a* (F(14, 15) = 71.68, p < 0.001) and b* values (F(14, 15) = 19.83, p < 0.001). Thus, the OF pre-treatment emerges as an effective approach for color preservation in dried pears at lower drying temperatures.
Table 6.
Effect of different pre-treatments and drying temperatures on the color parameters (L, a, b), total color difference (ΔE), and browning index (BI) of pear samples.
Data for the Browning Index (BI) and total color difference (ΔE) provide conclusive support for the color preservation trend (BI: F(14, 15) = 43.12, p < 0.001; ΔE: F(14, 15) = 63.24, p < 0.001). A post hoc analysis (Tukey HSD) statistically confirmed the strong influence of drying temperature on color quality within each pre-treatment group, as evidenced by the distinct letter groups assigned to different temperatures. The OF and UOF samples showed the lowest BI and ΔE values at all temperatures, confirming minimal browning and color change [55]. In contrast, control samples exhibited the highest values, indicating substantial color degradation. The more significant color shift in the UF samples compared to the F samples indicates that ultrasonication may have partially diminished the coating’s protective efficacy. The UF samples exhibited intermediate ΔE and BI values, lying between the OF/UOF and control groups. This indicated that although the micro-channels induced by ultrasonication improved drying rates, this process was less effective at preserving color than the solute infusion and dual coating provided by the OF and UOF treatments.
3.4. Microstructure
The microstructures of the pre-treated pear slices were investigated via scanning electron microscopy (SEM) to establish a physical basis for the observed drying kinetics, as illustrated in Figure 1. In micrographs of the control samples, the tissue structure appeared dense and intact, with clearly defined cell walls and minimal disruption. This inherent, unmodified structure offers significant resistance to mass transfer, which is consistent with the longest drying time observed for this group. The microstructure visually confirms the diffusional limitations that characterize the control’s drying profile.
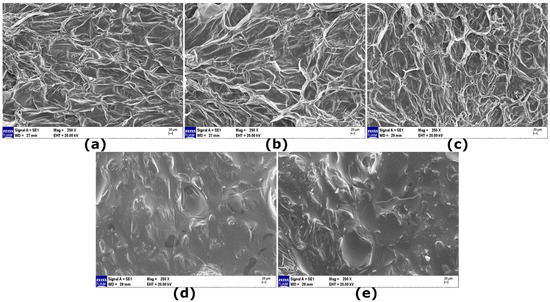
Figure 1.
Representative SEM images of pear tissues showing the microstructural effects of different pre-treatments after drying at 60 °C: (a) Control (untreated), (b) Film coating (F), (c) Ultrasonication and film coating (UF), (d) Osmotic dehydration and film coating (OF), and (e) Ultrasonication, osmotic dehydration and film coating (UOF).
The film (F) (film-coated) samples showed that the taro starch film formed a relatively thin, continuous layer over the natural tissue topography. This observation provides direct microstructural evidence for the barrier mechanism. The coating layer, which creates a continuous film over the natural pores, accounts for the reduced effective diffusivity (Deff) and the slightly increased drying time and activation energy (EA) relative to the control (Table 4), as it introduces an additional barrier to water vapor escape. This phenomenon is consistent with findings in other pear varieties, where biopolymer coatings have been observed to reduce surface porosity and create a compact, channel-free structure on the par surface penetrating by the cellular matrix, thereby increasing resistance to mass transfer [13]. Strikingly, the UF samples revealed a distinct and more open microstructure, with the formation of micro-channels and a more porous network compared to both the Control and F samples. Our observation of a more porous network and micro-channels in UF samples aligns with the well-documented effect of ultrasonic cavitation on plant tissues. Similar structural modifications, characterized by the formation of microchannels, have been consistently reported in various other fruits subjected to ultrasound application, including pear [47]; kiwifruit [56], and apple [57]. This confirms that ultrasonication fundamentally alters the microstructure by creating pathways for mass transfer—a finding that is crucial as it visually confirms the physical impact of ultrasonic cavitation discussed in Section 3.1. While these micro-channels would theoretically facilitate internal moisture movement (supporting the higher Deff of UF compared to F), the kinetic data indicated a complex drying mechanism with high EA and a high Page n value. This suggests that while ultrasonication successfully modified the internal structure, the subsequent coating may have lined these newly formed channels, not fully sealing them but altering their vapor transfer properties, leading to the observed high energy barrier. The penetration of coating material into the porous structure of fruit tissue, thereby reducing effective porosity, is a documented effect that supports this proposed mechanism [24]. Conversely, the OF samples showed a notably smoothed and densified surface structure, with a loss of distinct cellular definition. This structural collapse and densification are typical consequences of osmotic dehydration [22] and provides a microstructural basis for its kinetic behavior. This microstructure explains the dual kinetic findings for OF: the initial water removal drastically shortens drying time, but the resulting dense, shrunken matrix makes the removal of bound water more difficult, resulting in the highest EA. Finally, the UOF samples displayed an intermediate structure. The surface was smoother than that of UF but retained more residual porosity and structural features than that of OF. This hybrid microstructure is a clear visual manifestation of the proposed synergistic sequence. The initial ultrasonication likely created pathways that facilitated more efficient and potentially less destructive water removal during the osmotic step, preventing the densification seen in OF. This produced a pre-dried tissue matrix that remained receptive to moisture flow, aligning perfectly with the rapid drying kinetics attained without elevated energy costs (low EA) as detailed in Section 3.1. Consequently, the SEM analysis provided strong microstructural evidence supporting the drying kinetic results, demonstrating a clear consistency between specific structural modifications and the macroscopic drying behavior of pear slices.
3.5. Rehydration Capacity
The rehydration capacity (RR) served as a key quality indicator, reflecting the structural damage imparted by drying and pre-treatments [24]. Typically, increasing drying temperatures led to reduced RR values in the majority of samples, consistent with observations in other dried fruits, which is often linked to heightened structural damage at increased temperature [58]. However, the data (Figure 2) clearly show that each specific pre-treatment applied had a substantially greater impact on the final rehydration capacity than the drying temperature.
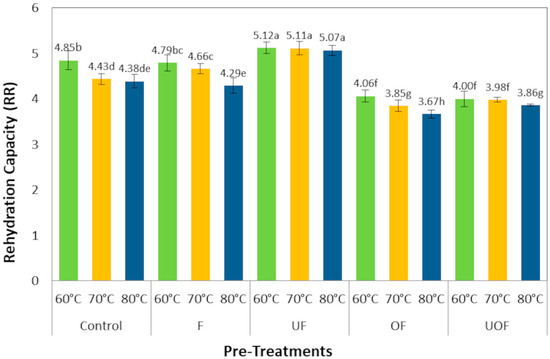
Figure 2.
Effect of different pre-treatments and drying temperatures on the rehydration capacity of pear samples. Values with different letters are significantly different (p < 0.05) according to Tukey’s HSD test.
The ultrasonic-film (UF) samples achieved the highest and most stable RR values (~5.1), statistically consistent across temperatures (p > 0.05). This superior performance is attributed to the microporous structure created by ultrasound, which facilitates water ingress [22], and the coating’s role in mitigating structural collapse [12]. The film-coated (F) samples showed a clear, though moderate improvement over the control, confirming that the taro starch coating alone provides a protective effect against structural shrinkage [24], thereby enhancing water re-absorption compared to the untreated tissue. In contrast, OF samples showed the lowest RR among all samples at the higher drying temperatures of 70 and 80 °C. This inadequate rehydration is a direct consequence of internal tissue breakdown and collapse [59]. Osmotic solute infusion causes severe structural damage, including cell wall disconnection and loss of turgor pressure, which fundamentally compromises water-absorption capacity [5,22]. The combined UOF treatment yielded intermediate RR values, significantly higher than those of OF but lower than those of UF. This indicates that the initial ultrasonic step partially preserved the tissue structure by creating microchannels, thereby mitigating the severe structural collapse typically induced by the subsequent osmotic dehydration [22]. Consequently, while the drying rate remained high due to the dominant osmotic-film mechanism, the product’s ability to reabsorb water was notably improved compared to the OF treatment alone.
These RR findings offer consistent evidence supporting kinetic and microstructural analyses. The high RR of UF samples is a functional result of their preserved, porous structure (Figure 1), which also enabled high moisture diffusivity (Section 3.1). The intermediate performance of the F group aligns with its role in moderately reducing shrinkage. Conversely, the OF samples, despite achieving the highest drying rate constant (k, Page model), exhibited the lowest RR. This demonstrates that their fast drying was achieved through a surface-enhanced mechanism that compromised the internal matrix necessary for rehydration, aligning with their dense SEM morphology.
4. Conclusions
The assessment of several pre-treatment methods underscored the relationship among drying efficiency, color preservation, and nutrient retention in Deveci pears. The Page model effectively described the drying kinetics (R2 > 0.9935). The values of the dimensionless exponent (n > 1) across all treatments confirmed that drying was not governed solely by internal diffusion but was significantly influenced by the microstructural modifications induced by the pre-treatments.
Applying the taro starch coating (F) alone consistently reduced effective moisture diffusivity relative to the control, as supported by its reduced Page model k values and higher activation energy, by creating a semi-permeable barrier on the product surface. In contrast, the osmotic pre-treatment (OF) increased effective moisture diffusivity to the highest observed value (1.56 × 10⁻¹⁰ m2/s), which accelerated moisture removal but also caused partial structural collapse, leading to lower rehydration capacity, as observed in the SEM images. Ultrasonication (UF) produced the shortest drying time (175 min at 80 °C) while preserving a porous microstructure that enhanced rehydration capacity. Quality analysis revealed that no single pre-treatment was superior in all aspects. Although pretreatments led to moderate losses in TPC and vitamin C due to leaching and structural disruption, they substantially improved drying efficiency, color stability, and rehydration performance, offering a balanced approach for practical applications. The samples pre-treated with ultrasonication followed by taro starch-based edible coating (UF) provided a balance between drying efficiency (high Deff), rehydration capacity (RR), and porous microstructure. Processors emphasizing rapid drying and color retention may consider osmotic dehydration combined with a taro starch-based edible coating (OF), which demonstrated accelerated drying kinetics and reduced BI and ΔE values at all temperatures, albeit with an adverse impact on rehydration capacity and retention of bioactive compounds. If the main objective is to preserve the bioactive compounds, drying at a low temperature (60 °C) led to higher antioxidant activity (AA), vitamin C levels, and total phenolic content (TPC) compared with treatments at higher temperatures.
Overall, this study aimed to evaluate how film coating and its combinations influence drying behavior and quality parameters in pear slices, providing novel insight into the trade-offs among drying efficiency, product structure, and quality attributes. The findings highlight practical implications for selecting suitable pre-treatments according to processing goals in pear drying. Consequently, the choice of pre-treatment is not a search for a single optimum, but a strategic decision based on the desired balance of these quality trade-offs. Nevertheless, the study was limited to a single fruit cultivar and laboratory-scale conditions; future research should explore different fruit matrices and drying configurations to validate these findings and may build upon the present results for the optimization of drying processes in future applications.
Supplementary Materials
The following supporting information can be downloaded at: https://www.mdpi.com/article/10.3390/pr13113695/s1, Figure S1: Photograph of the convective dryer used in this study.
Author Contributions
Conceptualization, D.D.K., B.A.Y. and H.D.; methodology, B.A.Y., D.D.K. and H.D.; software, D.D.K.; validation, D.D.K.; formal analysis, B.A.Y.; data curation, D.D.K.; writing—original draft preparation, B.A.Y., D.D.K. and H.D.; writing—review and editing, D.D.K.; visualization, D.D.K.; supervision, D.D.K. and H.D.; project administration, D.D.K. All authors have read and agreed to the published version of the manuscript.
Funding
This study received financial support for the analytical work from the Afyon Kocatepe University Scientific Research Projects Coordination Unit (Project Number: 23.FEN.BİL.21).
Data Availability Statement
Data is contained within the article. Further inquiries can be directed to the corresponding author.
Conflicts of Interest
The authors declare no conflicts of interest.
References
- Cevher, E.Y.; Öztekin, Y.B. Mechanical behavior of Deveci pear cultivar affected by maturation. Turk. J. Food Agric. Sci. 2019, 1, 39–43. [Google Scholar]
- Özcan, M.M.; Uslu, N. The effect of thermal treatment on antioxidant activity and changes in bioactive and phenolic compounds of three pear (Pyrus spp.) varieties slices. Food Humanit. 2023, 1, 281–288. [Google Scholar] [CrossRef]
- Erbil, N.; Murathan, Z.T.; Arslan, M.; Ilcim, A.; Sayin, B. Antimicrobial, Antioxidant, and Antimutagenic Activities of Five Turkish Pear Cultivars. Erwerbs-Obstbau 2018, 60, 203–209. [Google Scholar] [CrossRef]
- Güler, H.Ö.; Tuncer, A.D.; Şirin, C.; Usta, H. Effect of forced convection drying on the thin layer characteristics of ‘Deveci’ pear (Pyrus communis L.). In Proceedings of the 3rd International Conference on Agriculture, Food, Veterinary and Pharmacy Sciences, Trabzon, Türkiye, 16–18 April 2019; pp. 94–101. [Google Scholar]
- Yılmaz, M. Determination of Optimum Conditions for Convectional and Microwave Drying of Osmo-Dehydrated Pear Slices. Ph.D. Thesis, Bolu Abant İzzet Baysal University, Bolu, Türkiye, 2022. [Google Scholar]
- Al Juhaimi, F.; Uslu, N.; Özcan, M.M.; EL Babiker, E.F.; Ghafoor, K. Effect of drying on antioxidant activity, total phenol and mineral contents of pear fruits. J. Food Saf. Food Qual. 2016, 67, 164–167. [Google Scholar] [CrossRef]
- Deng, L.Z.; Mujumdar, A.S.; Zhang, Q.; Yang, X.H.; Wang, J.; Zheng, Z.A.; Gao, Z.J.; Xiao, H.W. Chemical and physical pretreatments of fruits and vegetables: Effects on drying characteristics and quality attributes—A comprehensive review. Crit. Rev. Food Sci. Nutr. 2019, 59, 1408–1432. [Google Scholar] [CrossRef] [PubMed]
- Petikirige, J.; Karim, A.; Millar, G. Effect of drying techniques on quality and sensory properties of tropical fruits. Int. J. Food Sci. Technol. 2022, 57, 6963–6979. [Google Scholar] [CrossRef]
- Guiné, R.P.F.; Barroca, M.J.; Gonçalves, F.J.; Alves, M.; Oliveira, S.; Correia, P.M.R. Effect of Drying on Total Phenolic Compounds, Antioxidant Activity, and Kinetics Decay in Pears. Int. J. Fruit Sci. 2015, 15, 173–186. [Google Scholar] [CrossRef]
- Masamba, K.G.; Mkandawire, M.; Chiputula, J.; Nyirenda, K.S. Evaluation of sensory quality attributes and extent of vitamin C degradation in dried pineapple, mango and banana fruit pieces pre-treated with sodium metabisulphite and lemon juice. Int. Res. J. Agric. Sci. 2013, 3, 226–234. [Google Scholar]
- Demir, H.; Demir, H.; Lončar, B.; Pezo, L.; Brandić, I.; Voća, N.; Yilmaz, F. Optimization of Caper Drying Using Response Surface Methodology and Artificial Neural Networks for Energy Efficiency Characteristics. Energies 2023, 16, 1687. [Google Scholar] [CrossRef]
- Santagata, G.; Mallardo, S.; Fasulo, G.; Lavermicocca, P.; Valerio, F.; Di Biase, M.; Di Stasio, M.; Malinconico, M.; Volpe, M.G. Pectin-honey coating as novel dehydrating bioactive agent for cut fruit: Enhancement of the functional properties of coated dried fruits. Food Chem. 2018, 258, 104–110. [Google Scholar] [CrossRef]
- Kian-Pour, N. Effect of Biopolymer Dip-Coating Pretreatments as a Non-Thermal Green Technology on Physicochemical Characteristics, Drying, and Rehydration Kinetics of Santa Maria Pears. Foods 2023, 12, 2466. [Google Scholar] [CrossRef] [PubMed]
- Zhang, Z.; Wei, Q.; Liu, C.; Li, D.; Liu, C.; Jiang, N. Comparison of four pretreatments on the drying behavior and quality of taro (Colocasia esculenta L. Schott) slices during intermittent microwave vacuum-assisted drying. Dry. Technol. 2017, 35, 1347–1357. [Google Scholar] [CrossRef]
- Jayanti, E.T.; Purwati, N.; Ariska, W. The effect of taro starch (Colocasia esculenta L. Schoott) edible coating on the quality of red chili (Capsicum annuum L.). J. Penelit. Pendidik. IPA 2024, 10, 437–441. [Google Scholar] [CrossRef]
- Meindrawan, B.; Kusuma, A.W.; Yuniarti, R.; Nabila, F.G.; Rahmayanti, D.; Pamela, V.Y. Application of Edible Coating from Beneng Taro Starch, Chitosan and Ginger Essential Oil to Maintain the Quality of Mango. J. Trop. Food Agroind. Technol. 2024, 5, 66–73. [Google Scholar] [CrossRef]
- Patandianan, D.L.; Hartiati, A.; Harsojuwono, B.A. Variation of Taro Starch-Carrageenan Edible Coating Composite Material and Glycerol Concentration on Peeled Salak Fruit Characteristics. J. Rekay. Manaj. Agroind. 2025, 13, 428–439. [Google Scholar]
- More, P.R.; Pegu, K.; Arya, S.S. Development and Characterization of Taro Starch-Casein Composite Bioactive Films Functionalized by Micellar Pomegranate Peel Extract (MPPE). Int. J. Biol. Macromol. 2022, 220, 1060–1071. [Google Scholar] [CrossRef] [PubMed]
- Castelló, M.; Igual, M.; Fito, P.; Chiralt, A. Influence of osmotic dehydration on texture, respiration and microbial stability of apple slices (Var. Granny Smith). J. Food Eng. 2009, 91, 1–9. [Google Scholar] [CrossRef]
- Ribeiro, A.S.d.C.; Aguiar-Oliveira, E.; Maldonado, R.R. Optimization of osmotic dehydration of pear followed by conventional drying and their sensory quality. LWT-Food Sci. Technol. 2016, 72, 407–415. [Google Scholar] [CrossRef]
- Hossain, M.A.; Shaha, L.C.; Romen, T.I.; Sarkar, A.; Biswas, R.; Ahmed, S.; Islam, M.A.; Muntasir, F.; Patwary, M.A.; Morais, R.M.S.C.; et al. Synergistic Effect of Ultrasound and Osmotic Pretreatment on the Drying Kinetics and Antioxidant Properties of Satkara (Citrus macroptera): A Novel Preservation Strategy. Processes 2025, 13, 384. [Google Scholar] [CrossRef]
- Nowacka, M.; Tappi, S.; Tylewicz, U.; Luo, W.; Rocculi, P.; Wesoły, M.; Ciosek-Skibińska, P.; Dalla Rosa, M.; Witrowa-Rajchert, D. Metabolic and sensory evaluation of ultrasound-assisted osmo-dehydrated kiwifruit. Innov. Food Sci. Emerg. Technol. 2018, 50, 26–33. [Google Scholar] [CrossRef]
- Yilmaz, D.; Tekin-Cakmak, Z.H.; Karasu, S. Impact of Ultrasound Pretreatment and Temperature on Drying Kinetics and Quality Characteristics of Blood Orange Slices: Comparison with Different Drying Methods. Processes 2025, 13, 1596. [Google Scholar] [CrossRef]
- Salehi, F.; Ghazvineh, S.; Inanloodoghouz, M. Effects of edible coatings and ultrasonic pretreatment on the phenolic content, antioxidant potential, drying rate, and rehydration ratio of sweet cherry. Ultrason. Sonochem. 2023, 99, 106565. [Google Scholar] [CrossRef]
- Nowacka, M.; Tylewicz, U.; Romani, S.; Dalla Rosa, M.; Witrowa-Rajchert, D. Influence of ultrasound-assisted osmotic dehydration on the main quality parameters of kiwifruit. Innov. Food Sci. Emerg. Technol. 2017, 41, 71–78. [Google Scholar] [CrossRef]
- Nowacka, M.; Fijalkowska, A.; Dadan, M.; Rybak, K.; Wiktor, A.; Witrowa-Rajchert, D. Effect of ultrasound treatment during osmotic dehydration on bioactive compounds of cranberries. Ultrasonics 2018, 83, 18–25. [Google Scholar] [CrossRef] [PubMed]
- Wongsagonsup, R.; Nateelerdpaisan, T.; Gross, C.; Suphantharika, M.; Belur, P.D.; Agoo, E.M.G.; Janairo, J.I.B. Physicochemical properties and in vitro digestibility of flours and starches from taro cultivated in different regions of Thailand. Int. J. Food Sci. Technol. 2021, 56, 2395–2406. [Google Scholar] [CrossRef]
- Briones, M.F.; Jazmin, P.F.; Pajarillaga, B.E.; Juvinal, J.G.; Leon, A.A.D.; Rustia, J.M.; Tuates, A.M., Jr. Biodegradable film from wild taro Colocasia esculenta (L.) Schott starch. Agric. Eng. Int. CIGR J. 2020, 22, 152–155. [Google Scholar]
- Official Methods of Analysis, 15th ed.; Method 934.06; Association of Official Analytical Chemists: Arlington, VA, USA, 1990.
- Rajabi, F.; Karimi, S.; Abbasi, H.; Layeghinia, N. Influence of edible coatings pretreatment on the performance of microwave and combined microwave-hot air drying of kiwifruit. Food Bioprod. Process. 2025, 153, 286–297. [Google Scholar] [CrossRef]
- Sacilik, K. Effect of drying methods on thin-layer drying characteristics of hull-less seed pumpkin (Cucurbita pepo L.). J. Food Eng. 2007, 79, 23–30. [Google Scholar] [CrossRef]
- Salehi, F.; Satorabi, M. Influence of Infrared Drying on Drying Kinetics of Apple Slices Coated with Basil Seed and Xanthan Gums. Int. J. Fruit Sci. 2021, 21, 519–527. [Google Scholar] [CrossRef]
- Fikry, M.; Benjakul, S.; Al-Ghamdi, S.; Tagrida, M.; Prodpran, T. Evaluating Kinetics of Convection Drying and Microstructure Characteristics of Asian Seabass Fish Skin without and with Ultrasound Pretreatment. Foods 2023, 12, 3024. [Google Scholar] [CrossRef]
- Lewis, W.K. The rate of drying of solid materials. Ind. Eng. Chem. 1921, 13, 427–432. [Google Scholar] [CrossRef]
- Page, G.E. Factors Influencing the Maximum Rates of Air-Drying Shelled Corn in Thin Layers. Master’s Thesis, Purdue University, West Lafayette, IN, USA, 1949. [Google Scholar]
- Henderson, S.; Pabis, S. Grain drying theory: IV. The effect of air flow rate on the drying index. J. Agric. Eng. Res. 1962, 7, 85–89. [Google Scholar]
- Yagcioglu, A. Drying characteristic of laurel leaves under different conditions. In Proceedings of the 7th International Congress on Agricultural Mechanization and Energy, Adana, Türkiye, 26–27 May 1999. [Google Scholar]
- Wang, C.; Singh, R. A Single Layer Drying Equation for Rough Rice; ASAE Paper; ASAE: St. Joseph, MI, USA, 1978. [Google Scholar]
- Doymaz, İ.; İsmail, O. Experimental characterization and modelling of drying of pear slices. Food Sci. Biotechnol. 2012, 21, 1377–1381. [Google Scholar] [CrossRef]
- Subhashree, S.N.; Sunoj, S.; Xue, J.; Bora, G.C. Quantification of browning in apples using colour and textural features by image analysis. Food Qual. Saf. 2017, 1, 221–226. [Google Scholar] [CrossRef]
- Zhang, H.; Zheng, W.; Yan, L.; Liu, W.; Yao, F.; Liu, C.; Zheng, L. Effects of vacuum microwave combined with freeze-drying on the physicochemical properties, phenolic compounds, and antioxidant capacity of pear fruit slices. J. Food Sci. 2023, 88, 2807–2820. [Google Scholar] [CrossRef]
- Kırca, L.; Kırca, S.; Aygün, A. Organic acid, phenolic compound and antioxidant contents of fresh and dried fruits of pear (Pyrus Communis L.) cultivars. Erwerbs-Obstbau 2023, 65, 677–691. [Google Scholar] [CrossRef]
- Vega-Gálvez, A.; Miranda, M.; Clavería, R.; Quispe, I.; Vergara, J.; Uribe, E.; Paez, H.; Di Scala, K. Effect of air temperature on drying kinetics and quality characteristics of osmo-treated jumbo squid (Dosidicus gigas). LWT-Food Sci. Technol. 2011, 44, 16–23. [Google Scholar] [CrossRef]
- Silva, K.S.; Garcia, C.C.; Amado, L.R.; Mauro, M.A. Effects of Edible Coatings on Convective Drying and Characteristics of the Dried Pineapple. Food Bioprocess Technol. 2015, 8, 1465–1475. [Google Scholar] [CrossRef]
- Fufa, D.D.; Bekele, T.; Tamene, A.; Bultosa, G. Drying kinetic models, thermodynamics, physicochemical qualities, and bioactive compounds of avocado (Persea americana Mill. Hass variety) seeds dried using various drying methods. Heliyon 2025, 11, e41058. [Google Scholar] [CrossRef]
- Shukla, R.M. Drying kinetics of pear slices in greenhouse solar dryer. J. Adv. Food Sci. Technol. 2024, 1, 17–27. [Google Scholar] [CrossRef]
- Önal, B.; Adiletta, G.; Di Matteo, M.; Russo, P.; Ramos, I.N.; Silva, C.L.M. Microwave and ultrasound pre-treatments for drying of the “Rocha” pear: Impact on phytochemical parameters, color changes and drying kinetics. Foods 2021, 10, 853. [Google Scholar] [CrossRef]
- Lima, L.S.L.; da Silva, W.P.; Pereira, J.C.A.; Diniz, P.S.E.S.; Silva, C.M. Study of continuous and intermittent drying of pear through mathematical and diffusion models. J. Agric. Stud. 2022, 10, 29–47. [Google Scholar] [CrossRef]
- Lopez-Quiroga, E.; Prosapio, V.; Fryer, P.J.; Norton, I.T.; Bakalis, S. Model discrimination for drying and rehydration kinetics of freeze-dried tomatoes. J. Food Process Eng. 2020, 43, e13192. [Google Scholar] [CrossRef]
- Alibaş, İ.; Yılmaz, A.; Günaydın, S.; Arkain, B. Influence of Drying Methods on Drying Kinetics and Color Parameters. Turk. J. Agric. Food Sci. Technol. 2021, 9, 897–908. [Google Scholar]
- Penkov, N.V. Relationships between Molecular Structure of Carbohydrates and Their Dynamic Hydration Shells Revealed by Terahertz Time-Domain Spectroscopy. Int. J. Mol. Sci. 2021, 22, 11969. [Google Scholar] [CrossRef]
- Wang, Z.; Barrow, C.J.; Dunshea, F.R.; Suleria, H.A.R. A Comparative Investigation on Phenolic Composition, Characterization and Antioxidant Potentials of Five Different Australian Grown Pear Varieties. Antioxidants 2021, 10, 151. [Google Scholar] [CrossRef] [PubMed]
- Todisco, K.M.; Janzantti, N.S.; Santos, A.B.; Galli, F.S.; Mauro, M.A. Effects of temperature and pectin edible coatings with guava byproducts on the drying kinetics and quality of dried red guava. J. Food Sci. Technol. 2018, 55, 4735–4746. [Google Scholar] [CrossRef]
- Rudy, S.; Dziki, D.; Biernacka, B.; Polak, R.; Krzykowski, A.; Domin, M.; Rudzki, G.; Kachel-Górecka, M. Drying Kinetics and Physicochemical Characteristics of Dehydrated Jerusalem Artichoke (Helianthus tuberosus L.). Processes 2025, 13, 2553. [Google Scholar] [CrossRef]
- Araujo, B.Z.R.; Martins, V.F.R.; Pintado, M.E.; Morais, R.M.S.C.; Morais, A.M.M.B. A Comparative Study of Drying Technologies for Apple and Ginger Pomace: Kinetic Modeling and Antioxidant Properties. Processes 2024, 12, 2096. [Google Scholar] [CrossRef]
- Nowacka, M.; Tylewicz, U.; Laghi, L.; Dalla Rosa, M.; Witrowa-Rajchert, D. Effect of ultrasound treatment on the water state in kiwifruit during osmotic dehydration. Food Chem. 2014, 14, 18–25. [Google Scholar] [CrossRef] [PubMed]
- Pieczywek, P.M.; Kozioł, A.; Konopacka, D.; Cybulska, J.; Zdunek, A. Changes in cell wall stiffness and microstructure in ultrasonically treated apple. J. Food Eng. 2017, 197, 1–8. [Google Scholar] [CrossRef]
- Turkmen, F.; Karasu, S.; Karadag, A. Effects of Different Drying Methods and Temperature on the Drying Behavior and Quality Attributes of Cherry Laurel Fruit. Processes 2020, 8, 761. [Google Scholar] [CrossRef]
- Al-Khuseibi, M.K.; Sablani, S.S.; Perera, C.O. Comparison of water blanching and high hydrostatic pressure effects on drying kinetics and quality of potato. Dry. Technol. 2005, 23, 2449–2461. [Google Scholar] [CrossRef]
Disclaimer/Publisher’s Note: The statements, opinions and data contained in all publications are solely those of the individual author(s) and contributor(s) and not of MDPI and/or the editor(s). MDPI and/or the editor(s) disclaim responsibility for any injury to people or property resulting from any ideas, methods, instructions or products referred to in the content. |
© 2025 by the authors. Licensee MDPI, Basel, Switzerland. This article is an open access article distributed under the terms and conditions of the Creative Commons Attribution (CC BY) license (https://creativecommons.org/licenses/by/4.0/).