Abstract
In light of frequently occurring wellbore instability such as wellbore collapse and sand production that often occur in drilling and the completion of shale oil and gas development, we propose one-run shape memory thermosensitive screen technology that can expand spontaneously at a specific temperature to help strengthen the formation. Based on the theory of thermal expansion and large deformation of shape memory materials, the expansion process of the thermosensitive screen is calculated by the finite element method. After expanding to the wellbore wall, the effects of the screen squeezing force on the formation production parameters are evaluated theoretically. The analysis shows that the radial compressive stress of the thermosensitive screen decreases with the increase in the radial distance, but as the original outer diameter of the thermosensitive screen is greater than the wellbore diameter, it can provide extrusion force for the wellbore wall. According to the in situ stress model, the extrusion force after the screen contacts the wellbore can effectively improve the stress distribution near the wellbore and reduce the impact of sand production caused by formation instability. Moreover, in shale oil and gas completion, it can effectively increase the bottom hole flowing pressure and drawdown pressure.
1. Introduction
The wellbore stability of deep and ultra-deep wells is a complex problem often encountered in drilling and completion engineering [1,2,3,4]. During the drilling stage, borehole collapse will cause accidents such as sticking and obstruction, affecting the drilling rate and cementing quality. In the completion stage, wellbore collapse often occurs due to the decrease in wellbore pressure or excessive drawdown pressure. Wellbore collapse will plug the borehole and affect subsequent production or operations. In oil fields, perforated tubing or slotted screens are often run to the collapsed layer to support the wellbore. However, due to the limitation of fixed size, the running ability of common screens in the wellbore is limited, especially in horizontal wells or extended reach wells. It is difficult to run them in a well section with serious dogleg. As the screen string of designed size cannot be run to the target layer, the operators usually have to replace it with a screen string of a smaller size to run it into the well, which will weaken the support effect and lead to the re-accumulation of cuttings in the wellbore, thereby affecting oil production.
Therefore, we introduce a kind of expansion string, namely the thermosensitive screen (hereafter abbreviated as TSS) [5,6,7]. Its advantage is that the screen can maintain a smaller size (i.e., compressed state) than the conventional oil screen in the lowering process. After the screen is run to the target layer, the formation temperature stimulates the expansion of the screen. As the original size of the thermosensitive screen is greater than the wellbore size, it can provide extrusion force for the wellbore wall when expanded and pressed against the wellbore wall. Compared with traditional mechanical expansion screen technology [8,9], this technology can greatly shorten the construction period and features a simple expansion process. It can be used for the completion of oil and gas wells with limited wellbore conditions such as long horizontal section wells, complex structure wells, and offshore wells [10,11].
2. Principle of Thermosensitive Expansion
The thermosensitive screen proposed in this paper is composed of a kind of shape memory polymer. Shape memory polymer refers to a kind of environment-responsive material that can change their initial shape through external environmental stimulation and can be restored to their initial shape through reverse stimulation [12,13]. Under the stimulation of external temperature, the TSS has two different states, namely a glassy state at low temperatures and a rubbery state at high temperatures. The transition temperature from the glassy state to the rubbery state is called the glass-transition temperature Tg. As shown in Figure 1, the TSS in the initial state is first heated to the glass-transition temperature Tg and then compressed to the designed shape in the mold by external force. After reducing the temperature below the transition temperature Tg and removing the external force, the TSS will fix its compressed shape at a lower temperature. Once the TSS in the low-temperature glassy state is heated to the transition temperature (i.e., when the ambient temperature rises to the transition temperature), the TSS will regain its initial state [14,15,16,17].
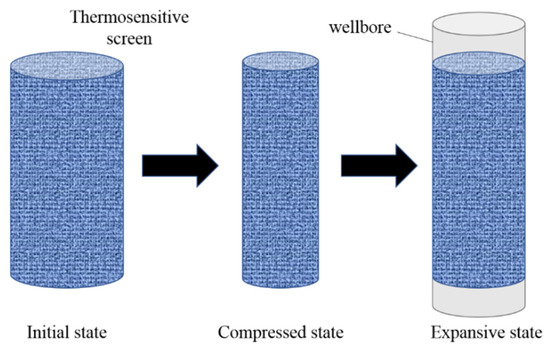
Figure 1.
Transformation progress of thermosensitive screen.
In the field of aerospace, the Japanese NEC company has used shape memory materials combined with 4D printing technology to manufacture self-deformation pipes and self-repair pipes. The former can expand or shrink according to service conditions, and the latter has the ability of environmental perception and can repair itself after injury. In biomedical science, a vascular stent made of shape memory alloy can support the blood vessels and restore the normal function of the stenotic blood vessels [18,19].
After the thermosensitive screen composed of the above shape memory material is sent to the predetermined underground stratum, the formation temperature is used to stimulate the expansion of the screen, which begins to recover its initial shape. As its initial shape is larger than the wellbore size, after the screen expands and is pressed against the wellbore wall, a positive extrusion force will be generated on the wellbore wall to stabilize the formation and facilitate later production.
3. Expansion Process of Thermosensitive Screen
According to the above shape memory characteristics, we establish the large deformation model of shape memory polymers by simplifying the research problems. This method can simulate and predict the stress and strain variation in the thermosensitive screen after expansion in place. In order to simplify the problem, the assumptions adopted in this model are as follows:
- When the temperature rises to the critical value, the memory shape of the material can be completely restored.
- The time effect is ignored, and the recovery time of expansion is long enough that the deformation of the material is stable.
- The constitutive model of the thermosensitive screen is described by the Odgen model [20,21].
The expansion process of the thermosensitive screen can be simplified to an elastic problem including geometric nonlinearity and constitutive nonlinearity based on Assumptions (1)–(3). Because the relevant mechanical parameters of the thermosensitive screen are unknown in advance, it needs to be solved by inversion according to the experimental data.
Therefore, firstly, according to the uniaxial compression experiment, the axial pressure under different axial compressions is measured, and the values of the unknown parameters in the Odgen model can be inverted by using the experimental results. The inverse constitutive model is applied to simulate the deformation and stress distribution of the thermosensitive screen in the process of real well completion.
3.1. Mechanical Parameter Inversion
The deformation potential energy of the thermosensitive screen can be expressed as
where , , and are the principal eigenvalues of deformation, is the value in the axial direction, is the value in the radial direction, is the value in the circumferential direction, and are dimensionless real numbers, and is a positive integer. These three values need to be inversed and calculated by using the experimental data.
In the uniaxial compression test, the sample has an outer diameter of 25 mm and height of 30 mm. The universal mechanical testing machine for materials is set to displacement control mode, the compression speed is set to 2 mm/min, and the compression distance is set to 15 mm. The compression properties were measured in 70 °C water bath and 25 °C air environment, respectively. The sample is soaked in a 70 °C water bath for one hour to be fully heated. The measurement results of stress () and strain () during unidirectional compression are shown in Figure 2. According to the experimental results, the axial length of the cylindrical sample becomes shorter after compression, while the radial deformation is negligible (see Figure 2), so it can be approximately assumed that , .
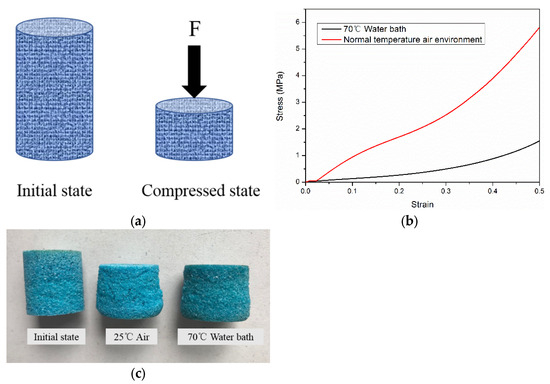
Figure 2.
Compression experiment under constant temperature. (a) Compression progress; (b) compression stress and strain curve. (c) Experimental samples.
The formula of axial stress can be obtained according to the potential energy as follows:
where is the Biot stress in the axial direction, N/m2.
The results of axial deformation and measured stress in the experiment are substituted into the above calculation formula, and the results of , , and are determined by the nonlinear fitting method. The values of the results are
The fitting calculation results and experimental results are shown in the figure below (Figure 3), which shows that the above fitting results are very accurate and can be used for case analysis in the next step.
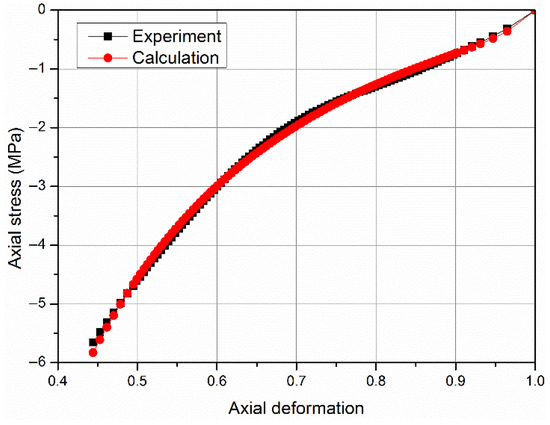
Figure 3.
Comparison of parameter inversion results.
3.2. Load Distribution After Expansion
When the shape of the thermosensitive screen is restored and becomes stable, it experiences significant deformation. The outer diameter of the thermosensitive screen is the same as the inner diameter of the wellbore wall, and the inner diameter is the same as the outer diameter of the base tube (the base tube is sleeved in the thermosensitive screen; see Figure 4). As the radial compression deformation has little effect on the axial deformation, the calculation problem can be simplified to a plane stress problem.
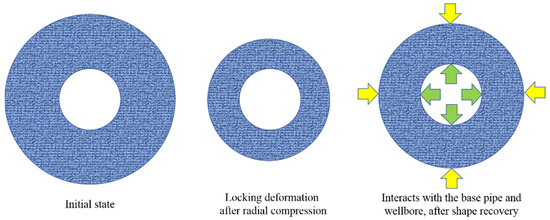
Figure 4.
Schematic diagram of TSS expansion process. The green arrow represents the contact force between the base pipe and the material, while the yellow arrow represents the contact force between the wellbore and the material.
3.2.1. Basic Model
According to the characteristics of the axisymmetric problem, the deformation of the thermosensitive screen is
where is the radial coordinate of the TSS under the initial configuration, is the radial displacement, and is the new radial coordinate after radial deformation.
The deformation gradient and strain are expressed as follows, respectively:
The principal eigenvalues of the radial and circumferential deformation are
According to the function of deformation potential energy (1), each component of Biot stress is as follows:
Since the expansion problem is axisymmetric, Biot stress is equivalent to nominal stress. According to the principle of virtual work, the following equilibrium conditions are obtained:
where represents the area element and represents the boundary element, both of which are integrated on the initial configuration. is the displacement field and needs to satisfy the displacement boundary conditions. is an imaginary variable, which refers to the difference between any two variables that meet the constraints of the displacement boundary conditions. is a strain tensor, is a volume force vector, and is a nominal stress vector.
The solution of the expansion problem can be obtained by using the above equation. However, as the problem involves significant deformation and the material constitutive relation is nonlinear, the analytical solution cannot be obtained directly, so it needs to be solved by the finite element method.
3.2.2. Numerical Solution Method
The circular screen is decomposed into several small rings, and each small ring is an axisymmetric problem. Due to the small difference between the internal and external diameters of the micro ring, the internal displacement field can adopt the following interpolation mode:
where and are the displacement values of the internal and external nodes, and and are the shape function.
The interpolation of the radial coordinates of the initial configuration of the ring also meets the following requirements:
where and are the radial coordinates of the internal and external nodes.
The calculation formula of shape function is as follows:
where represents isoparametric deformation, and its value range is [−1, 1].
Figure 5 shows the established finite element discrete model.
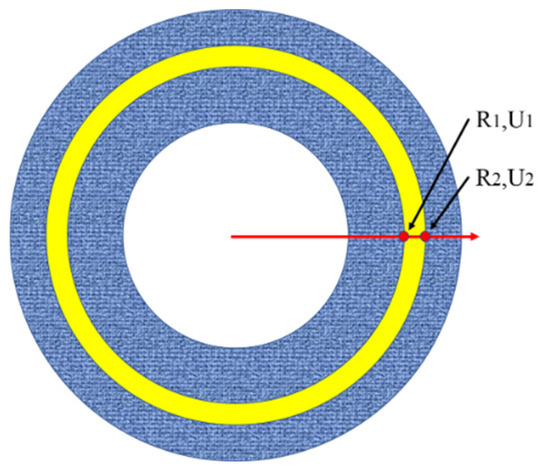
Figure 5.
Finite element discrete model. The yellow line represents the material element.
The transformation matrix of strain and displacement is defined, and its calculation formula is
The left side of the equilibrium equation for this element is converted to
where is the node displacement vector, and the definition formula is . is the nominal stress vector, and its definition formula is ; is the equivalent internal force at the node, which can be solved by the Gaussian numerical integration method.
Here, according to the Odgen model, the calculation formula of the nominal stress vector is
In this problem, the effect of volume force is ignored, so the first term on the right is zero. For the second item on the right, it can be directly simplified as
where and are the radial stress at the inner and outer nodes, respectively. is the equivalent external force at the node.
According to the equilibrium equation,
The above equation gives the nonlinear equation of an element displacement; is independent of displacement and is a nonlinear function of displacement. The above equation needs to be solved by an iterative method, such as the Newton–Raphson method.
In the Newton–Raphson method, the linear increment needs to be solved in advance, i.e.,
where D is the transformation matrix of strain and displacement, and its calculation formula is
is the tangent stiffness matrix, which can be solved by the Gaussian numerical integration method.
At this time, the iterative equation in the Newton–Raphson method is expressed as
In order to solve the global displacement field, the elements need to be assembled to form the solution of the global problem. Considering the arbitrariness of virtual displacements, the non-displacement constraint points can be removed directly and the constraint of the displacement field can be added. The final Newton–Raphson iterative equation is as follows:
where and are the vectors composed of the radial displacement of each node in the K and K + 1 iterative steps, and they can be expressed as
is the stiffness matrix related to , and is the residual vector related to . Both quantities can be solved according to the k-th iteration step.
3.2.3. Sensitivity Analysis
The parameters in the case analysis are as follows: the outer diameter of the base tube is 89 mm, the inner diameter of the thermosensitive screen is 90 mm, the outer diameter is 132 mm (before expansion, namely the compressed state), the original outer diameter is 190 mm, and the length is 2 m. The inner diameter of the wellbore is 152 mm.
After the shape of the thermosensitive screen is restored, its inner diameter is equal to the outer diameter of the base tube, and its outer diameter is equal to the inner diameter of the wellbore. It is a typical large deformation problem with known displacement boundary conditions. The stress and strain distribution of the TSS during the expansion process can be obtained with the proposed method based on the experimental results.
Figure 6 shows the radial displacement of a point along different radial positions. The radial compression displacement at the outermost part is the largest.
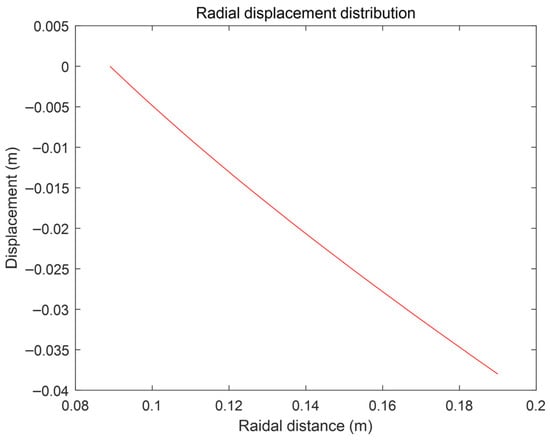
Figure 6.
Radial displacement distribution.
Figure 7 shows the radial strain and circumferential strain along different radial positions. The radial compressive strain at the outermost part is the largest and the circumferential compressive strain is the smallest.
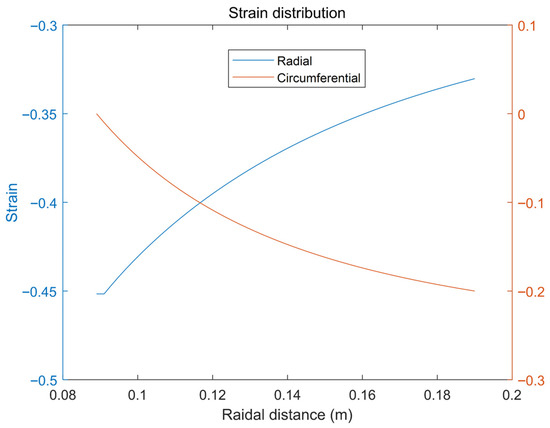
Figure 7.
Radial and circumferential strain distribution.
Figure 8 shows the change in nominal and Cauchy radial stress and circumferential stress with radial distance, in which the radial compressive stress decreases with the increase in radial distance, and the circumferential compressive stress increases with the increase in radial distance. Figure 9 shows the distribution of radial and circumferential stress clearly. The radial stress near the base tube is the largest, while that near the outermost layer is the smallest. Therefore, after the shape of the memory material is restored, the extrusion force on the base pipe is greater than that on the wellbore.
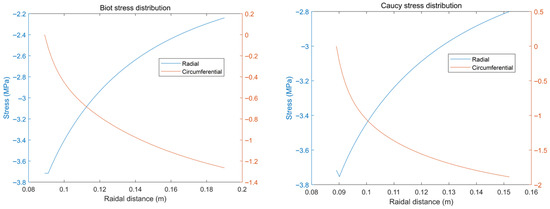
Figure 8.
Biot stress distribution and Cauchy stress distribution.
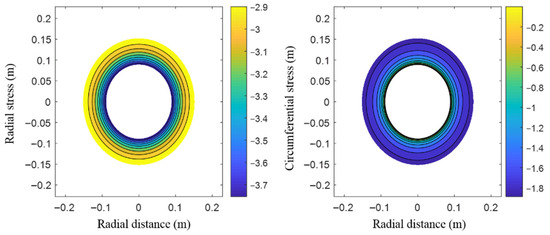
Figure 9.
Radial and circumferential stress distribution.
Figure 10 shows the calculation results of radial stress and circumferential stress of three hypothetical materials after shape memory restoration. The parameters of material 2 are the same as the experimental results, while the parameters of material 1 are half of that of material 2, representing low elastic modulus. The parameter of material 3 is twice that of material 2, which represents high elastic modulus. It can be seen from the above results that with the increase in the elastic modulus of the material, the contact force of the material on the base pipe and the wellbore wall increases after shape recovery. When the contact force between the material and the wellbore is so small that the support effect of the material on the wellbore wall is not effective, the wellbore may experience yield failure. When the contact force between the material and the wellbore wall is so large that the extrusion force of the material on the base pipe is above the yield strength of steel, the base pipe may experience collapse failure. Therefore, the optimization of material properties should be between the two failure cases.
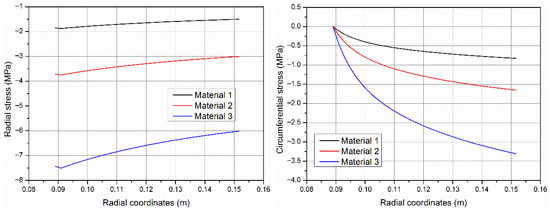
Figure 10.
Comparison of radial stress and circumferential stress of three materials.
Figure 11 shows the calculation results of radial stress and circumferential stress after shape recovery under three kinds of initial outer diameters. The parameters of outer diameter 2 are the same as the experimental results. Outer diameter 1 is 0.9 times that of outer diameter 2, representing a small initial outer diameter. Outer diameter 3 is 1.1 times that of outer diameter 2, representing a large initial outer diameter. It can be seen from the above results that with the increase in the initial outer diameter, the contact force of the material on the base pipe and the wellbore wall increases after the shape is restored. The effects of the initial outer diameter on the failure of the base tubes and wellbores are consistent with the above elastic modulus analysis. Similarly, the optimization of the initial outer diameter of the material should be between the two failure cases.
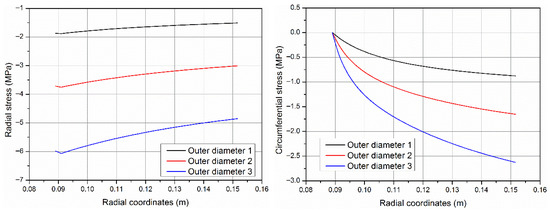
Figure 11.
Comparison of radial stress and circumferential stress of different outer diameters.
4. Wellbore Strengthening of Thermosensitive Screen
Whether the wellbore is stable or not ultimately depends on the stress state of the surrounding rock, which will produce plastic deformation once the stress level exceeds the elastic range under the combined action of in situ stress, pore pressure, and wellbore fluid pressure.
4.1. Effects of Thermosensitive Screen on Elastic Solution
The formation of stress distribution around the wellbore refers to the calculation of the vertical stress, tangential stress, and radial stress at any point around the wellbore under specific conditions according to the original principal stress of the formation, that is, the vertical principal stress and the horizontal maximum and minimum principal stress. Considering the influence of the thermosensitive screen on the formation, the assumptions are as follows [22]:
- The formation rock is a homogeneous, isotropic, and linear elastic porous medium.
- The thermosensitive screen has good permeability (the screen and the base pipe can be perforated or slotted to form a flow channel).
- The influence of the tectonic stress field and temperature field on the formation is ignored.
- The surrounding rock of the wellbore wall is in the plane strain state.
According to the force balance of the element, the distribution of effective stress at any position of the surrounding rock under the influence of the thermosensitive screen in the vertical well is
where is the radial distance from the borehole center, m. is the included angle with the maximum horizontal principal stress, rad. is the Poisson’s ratio of rock, dimensionless. is the boundary radius in the elastic region, m. is the inner boundary pore pressure in the elastic region, MPa. and are the original maximum and minimum horizontal principal stresses after considering pore pressure, MPa. is the original vertical in situ stress, MPa. , , and are the effective radial, tangential, and vertical stress in the elastic zone, MPa. is the shear stress of the borehole surrounding rock, MPa. refers to the interaction stress between the thermosensitive screen and the wellbore after being extruded against the wellbore.
Considering the fluid pressure in the formation pores, the Mohr Coulomb criterion expressed by principal stress can be expressed as
where and are the maximum and minimum stresses, MPa. is the Biot constant. is the failure angle, (°).
Let us assume that the rock stress state just conforms to the Mohr Coulomb failure criterion at the characteristic position ; then, the pore pressure is expressed as a function of bottom flowing pressure :
where is the pore pressure; is the outer boundary pore pressure in the elastic region, MPa; and is the boundary radius in the elastic region, m. is the wellbore radius, m.
The maximum stress and minimum stress at the characteristic position are also a function of bottom flowing pressure . By substituting the two stresses into the Mohr Coulomb failure criterion, we obtain the balance equation of bottom flowing pressure :
The bottom hole flowing pressure obtained by solving Equation (26) is the critical bottom flowing pressure for sand production, and the critical drawdown pressure can be obtained by
where is the critical bottom flowing pressure for sand production, MPa. is the critical drawdown pressure of sand production, MPa. is the formation static pressure, MPa.
4.2. Case Analysis
Suppose a well has a borehole diameter of 152 mm, outer boundary radius of 200 m, boundary pressure of 12 MPa, and formation static pressure of 9.5 MPa. The original horizontal principal stress is 19.73 MPa and 14.35 MPa, and the original vertical principal stress is 17.68 MPa. The Poisson’s ratio of formation rock is 0.25 and the elastic modulus is 2017 MPa. According to the elastic solution, the stress distribution near the wellbore and the critical drawdown pressure can be analyzed. The shear failure of the formation mainly depends on the difference between the maximum and minimum principal stresses. The greater the stress difference, the greater the shear effect on the formation, and the easier the wellbore yields and loses stability.
The elastic stress distribution near the open hole after considering the influence of the thermosensitive screen is shown in Figure 12 (In the figure, “ext” refers to the extrusion stress of TSS. “Radial” refers to the stress in the radial direction. The abbreviation also applies to Figure 13 and Figure 14). Under these formation parameters, the radial stress is the smallest and the circumferential stress is the largest. The formation stress gradually tends to be stable from near the wellbore zone to far from wellbore zone. After considering the influence of the thermosensitive screen, the stress distribution of the formation near the wellbore is significantly improved. The radial stress increases with the increase in the contact stress of the thermosensitive screen, and the circumferential stress decreases with the increase in the contact stress of the thermosensitive screen. Therefore, the stress difference borne by the formation near the wellbore is reduced due to the expansion of the thermosensitive screen.
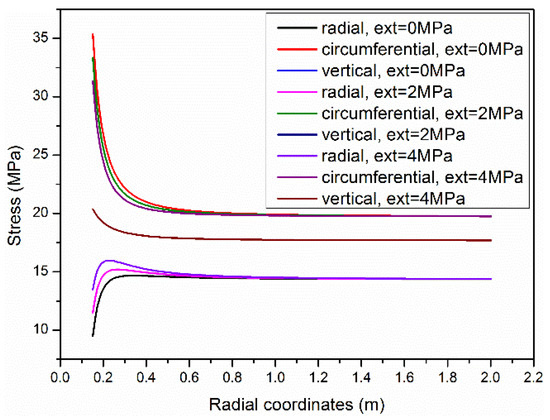
Figure 12.
Elastic stress along single direction (α = 90°).
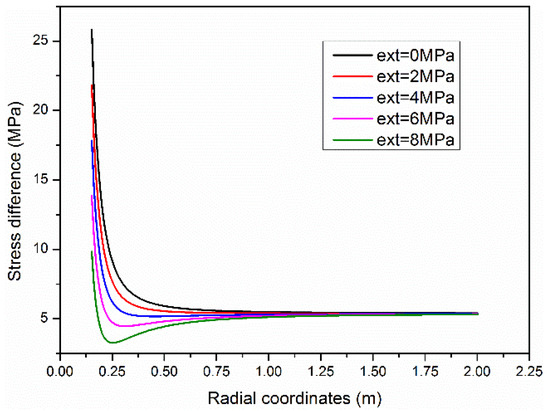
Figure 13.
Maximum and minimum principal stress difference.
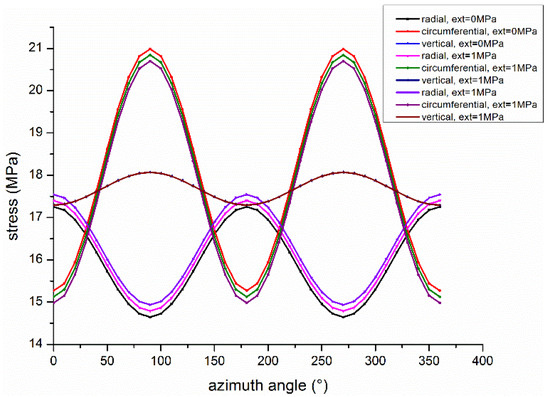
Figure 14.
Elastic stress distribution around borehole.
Figure 13 shows the variation trend in the formation stress difference in the diameter direction in detail. The stress difference around the wellbore reaches the maximum on the open hole wall and gradually stabilizes with the radial extension of the formation. However, the stress difference will continue to decrease with the increase in extrusion stress. When the extrusion stress in the figure is 8 MPa, the minimum stress difference is about 2 MPa, which is smaller than that in the far well zone. Therefore, as long as the effective stress on the formation does not exceed the fracture pressure, the expansion extrusion force of the thermosensitive screen can be improved as much as possible. Figure 14 shows the formation stress distribution along 0.4 m of the well diameter within 360° of the well circumference. At 90° and 270° azimuth angles, the largest stress difference can be found. Under the influence of the TSS, it shows the same influence trend as that in a single direction.
Figure 15 shows the critical bottom flowing pressure under the influence of the thermosensitive screen. Obviously, in the near-wellbore zone (0.4 m around the well), the critical bottom flowing pressure increases with the increase in the extrusion stress of the thermosensitive screen. The critical bottom flowing pressure when there is no extrusion stress is 41.4 MPa, while the critical pressure increases to 71.7 MPa when the extrusion stress of the thermal screen is 10 MPa. According to the definition of critical drawdown pressure, the critical drawdown pressure can be increased by 95% under the current formation conditions. Therefore, the study of a high-expansion-rate and high-stiffness thermosensitive screen will play a significant role in strengthening the stability of wellbores.
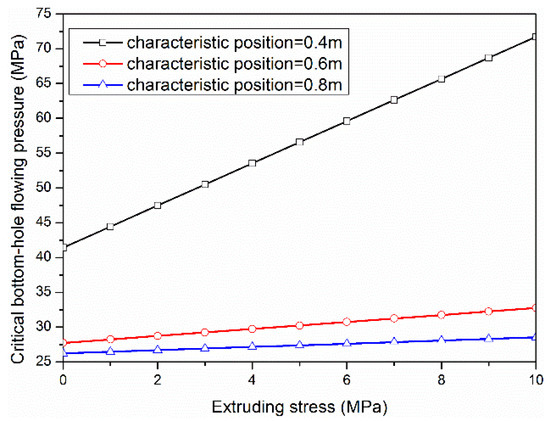
Figure 15.
Critical bottom flowing pressure.
4.3. Effects of Thermosensitive Screen on Plastic Solution
According to the Coulomb failure criterion, once the stress exceeds the critical stress, the formation will change from the elastic state to plastic state. The elastic solution shows that there will be a plastic region around the wellbore in loose formations. According to the plastic flow law of formation and the rock failure criterion, the plastic region of formation can be determined and the influence of the TSS on the plastic radius can be further determined by introducing the influence of TSS boundary conditions.
The so-called sand production radius refers to the radius of the plastic zone near the wellbore. It is the maximum theoretical radius around a wellbore within which the in situ stresses exceed the formation’s strength, leading to rock failure and the potential for sand production. It represents the boundary between the failed, yielded zone (where sand is dislodged) and the intact, stable formation. Before sand production, elastic deformation occurs in the whole formation. After sand production, plastic failure occurs in the region around the wellbore. The whole formation is divided into the plastic area and elastic area shown in Figure 16.
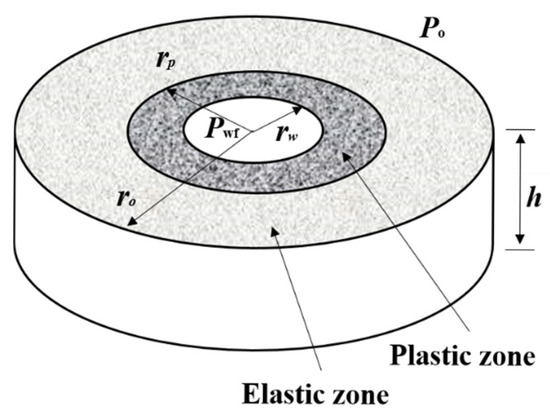
Figure 16.
Elastic and plastic formation stress distribution model.
In this paper, we mainly discussed the effects of TSS extrusion force on the plastic region, so a detailed discussion of elastic and plastic solutions of formation is beyond the scope of this article. The effects of TSS extrusion force are simplified to an external force applied to the wellbore wall. Given the internal and external boundary conditions, namely the wellbore radius , bottom effective internal pressure , external boundary radius , and external boundary pressure , the elastic–plastic stress distribution of the formation near the well can be calculated.
According to the Mohr Coulomb failure criterion, when the critical stress expressed by the Mohr Coulomb equation is reached, the rock material will change from elastic deformation to plastic deformation. When solving stress distribution in the plastic zone, it is necessary to confirm the maximum and minimum principal stresses first. According to the elastic stress analysis, the radial stress around the wellbore is the smallest, so we assume that to discuss the extrusion effects [22,23].
If the vertical stress and tangential stress in the outer plastic zone are equal on the boundary of the outer plastic zone, we obtain
where
where is the radius of the inner plastic zone. t is an intermediate variable, . q is the fluid flow rate, m3/s. is the fluid viscosity, Pa·s. h is the reservoir thickness, m. v is Poisson’s ratio, dimensionless. is the permeability, m2. is the cohesive strength.
The continuity of radial stress must be satisfied at the elastic–plastic stress boundary. By substituting the radial stress in the plastic region and the tangential stress in the elastic region into the Coulomb criterion, the equation for the plastic radius can be obtained as [23]
where is the plastic radius, m. Other intermediate variables are as follows:
4.4. Case Study
We refer to the data of reference [1] for the stress solution with no fluid flow. This corresponds to the situation after the well has been drilled and the fluid pressure in the well is in balance with the pore pressure in the formation. The relevant parameters of a well with formation instability are considered as follows: the Poisson ratio of the rock is 0.45, cohesion strength is 101.4 kPa, the internal friction angle is 60 °, the elastic modulus is 5765 MPa, the Biot number is 1.0, and the formation pressure at the initial stage of production is 32.065 MPa. The outer boundary radius of the single well control area is 10 m, the outer boundary pressure is 32.065 MPa, and the borehole diameter is 100 mm. The original vertical principal stress is 65.5 MPa, and the original horizontal principal stress is 60.255 MPa. By substituting the relevant parameters of the example well into the plastic radius equation derived above, the elastic–plastic stress distribution of the formation near the wellbore can be calculated by a numerical method.
Figure 17 and Figure 18 compare and analyze the plastic stress distribution under the influence of the TSS. The formation stress increases along the radial direction from the wellbore wall, the vertical stress and circumferential stress coincide in the internal plastic area, separate after exceeding the first plastic area, and the formation stress begins to change slowly at the boundary of elastic–plastic stress. If there are no TSS effects, as shown in Figure 17, the plastic radius is about 0.9 m. When the TSS extruding stress is 5 MPa, the elastic–plastic contact radius is obviously reduced from 0.9 m to 0.81 m. If the expansion performance and the stiffness of TSS materials are further improved, the strengthening effect of the wellbore wall will be greatly increased. Figure 19 shows the variation range of the plastic radius calculated after further improving the extruding stress of the TSS. Obviously, the external plastic radius decreases with the increase in expansion extruding stress.
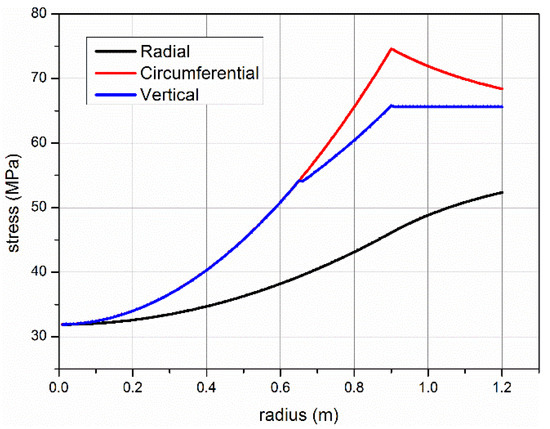
Figure 17.
Plastic stress distribution (no extruding stress).
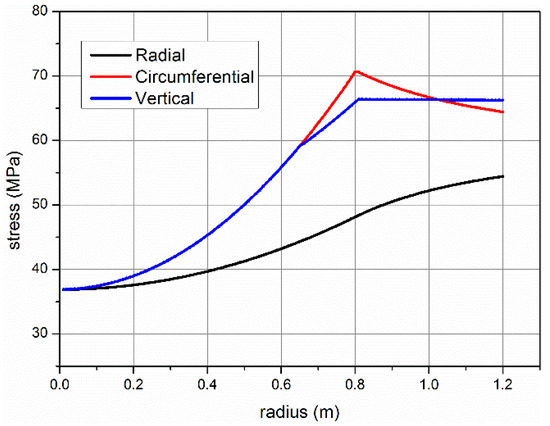
Figure 18.
Plastic stress distribution (extruding stress 5 MPa).
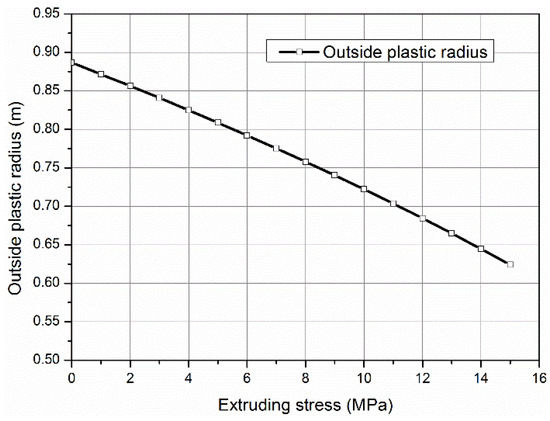
Figure 19.
Variation in plastic radius with extruding stress.
According to the above formation stress distribution near the wellbore, if the expansion contact performance of the existing TSS is known, the effects of the TSS on formation stability can be predicted. Conversely, if the relevant parameters of the formation are known in advance, the mechanical properties that are required to be achieved after TSS expansion can be calculated according to the proposed method. The calculated mechanical parameters can help provide guidance for TSS material design to meet formation requirements. Therefore, this paper provides an optimized design approach combined with engineering practice for the performance design of TSSs in the future.
Upon expansion, the temperature-sensitive screen significantly increases the flow area while applying radial stress to the wellbore, thereby enhancing the stability of the near-wellbore zone. It is suitable for unconsolidated sandstones, weakly cemented formations, and other sand-prone reservoirs. Its expansion enables better adaptation to irregular wellbores, reducing the “crescent-shaped” gap between the screen and the wellbore, eliminating fluid channeling pathways, and ensuring more uniform production contribution. This offers significant advantages in wells with complex trajectories, such as horizontal and highly deviated wells. In harsh high-temperature and high-pressure environments like deepwater oil and gas or geothermal wells, the temperature-sensitive screen provides an innovative solution for addressing well integrity and long-term sand control challenges.
5. Conclusions
In this paper, we introduce thermosensitive screen technology to help stabilize a wellbore. The expansion extrusion force obtained by a simulation of the TSS expansion process can provide input parameters for borehole strengthening analysis. Combined with formation parameters, its influence on the elastic–plastic stress distribution near the wellbore can be evaluated, and the critical drawdown pressure and critical plastic radius under the influence of the TSS can be predicted. Some new conclusions can be drawn from the above analysis as follows:
- An analysis method of significant expansion deformation is proposed, which can invert the model parameters according to the experimental data. The changes in stress and outer diameter during the expansion of the thermosensitive screen are analyzed and calculated with the method. The radial compressive stress after restoring the shape decreases with the increase in radial distance. After restoring the shape, the thermosensitive screen can provide extrusion force for the wellbore wall.
- According to the elastic stress solution of formation and Mohr Coulomb failure criterion, the stress distribution around the wellbore considering the expansion of the thermosensitive screen is obviously improved. The stress difference in the formation near the wellbore is reduced due to the expansion extrusion force of the thermosensitive screen. The critical bottom flowing pressure increases with the increase in expansion extrusion force. If the extrusion force is 10 MPa, the critical drawdown pressure can be increased by 95% under the current formation conditions.
- The plastic stress solution shows that if the expansion contact force of the TSS is large enough, the plastic yield radius of the formation will be effectively reduced, and the sand production radius can be reduced in the production well.
Author Contributions
Conceptualization, Y.Z. and X.Q.; methodology, Y.Z., Y.W. and X.Q.; software, Y.Z. and Y.W.; validation, Y.Z., Y.W. and X.Q.; formal analysis, X.Q. and Y.R.; investigation, Y.Z. and Y.R.; resources, Y.Z. and X.Q.; data curation, Y.Z. and Y.W.; writing—original draft preparation, Y.Z. and X.Q.; writing—review and editing, Y.R.; visualization, Y.Z., Y.W. and X.Q.; supervision, Y.Z.; project administration, X.Q.; funding acquisition, Y.Z. and X.Q. All authors have read and agreed to the published version of the manuscript.
Funding
The authors gratefully acknowledge the financial support from the National Science and Technology Major Project [grant number 2025ZD1401503], the National Natural Science Foundation of China [grant number 52004301], and the “Western young scholars” of Chinese Academy of Sciences [grant number 2021-XBQNXZ-033].
Data Availability Statement
The data that support the findings of this study are available from the corresponding author upon reasonable request.
Conflicts of Interest
Author Xing Qin was employed by the company Sinopec Research Institute of Petroleum Engineering. The remaining authors declare that the research was conducted in the absence of any commercial or financial relationships that could be construed as a potential conflict of interest.
Abbreviations
The following abbreviations are used in this manuscript:
| TSS | Thermosensitive screen |
References
- Fuh, G.F.; Loose, P.K. Horizontal wellbore stability for open hole completions. In Proceedings of the SPE Annual Technical Conference and Exhibition, San Antonio, TX, USA, 8–11 October 1989. [Google Scholar] [CrossRef]
- Tohidi, A.; Fahimifar, A.; Rasouli, V. Analytical solution to study depletion/injection rate on induced wellbore stresses in an anisotropic stress field. Geotech. Geol. Eng. 2018, 36, 1735–1744. [Google Scholar] [CrossRef]
- Gholami, R.; Elochukwu, H.; Fakhari, N.; Sarmadivaleh, M. A review on borehole instability in active shale formations: Interactions, mechanisms and inhibitors. Earth Sci. Rev. 2018, 177, 2–13. [Google Scholar] [CrossRef]
- Li, X.; Zhang, C.; Feng, Y.; Wei, Y.; Chen, X.; Weng, H.; Deng, J. An integrated geomechanics approach to evaluate and manage wellbore stability in a deep graben formation in Tarim Basin. J. Pet. Sci. Eng. 2022, 208, 109391. [Google Scholar] [CrossRef]
- Qin, X.; Duan, Y.; Yue, H.; Ai, S.; Hou, Q.; Jing, B. Mechanical behavior of thermosensitive screen applied for wellbore collapse. In Proceedings of the SPE Annual Technical Conference and Exhibition, OnePetro, Virtual, 26–29 October 2020. [Google Scholar] [CrossRef]
- Osunjaye, G.; Abdelfattah, T. Open hole sand control optimization using shape memory polymer conformable screen with inflow control application. In Proceedings of the SPE Middle East Oil & Gas Show and Conference, OnePetro, Manama, Bahrain, 6–9 March 2017; p. SPE-183947-MS. [Google Scholar] [CrossRef]
- Wang, X.; Osunjaye, G. Advancement in openhole sand control applications using shape memory polymer. In Proceedings of the SPE Annual Technical Conference and Exhibition, OnePetro, Dubai, United Arab Emirates, 26–28 September 2016. [Google Scholar] [CrossRef]
- Mcmillin, K. Using expandable sand screens in unconsolidated formations. Offshore 2000, 60, 52–53. [Google Scholar]
- Metcalfe, P. Expandable sand screen technology increases production. World Oil 2000, 221, 94–95. [Google Scholar]
- Carrejo, N.; Horner, D.N.; Johnson, M.H. Shape memory polymer as a sand management alternative to gravel packing. In Proceedings of the Canadian Unconventional Resources Conference, Calgary, AB, Canada, 15–17 November 2011. [Google Scholar] [CrossRef]
- Carrejo, N.; Horner, D.N.; Johnson, M.H. The effects of dynamic loading on the sand management and permeability of shape memory polymer and gravel packs for sand management applications. In Proceedings of the SPE Brasil Offshore Conference, Macaé, Brazil, 7–10 June 2011. [Google Scholar] [CrossRef]
- Xie, T. Tunable polymer multi-shape memory effect. Nature 2010, 464, 267–270. [Google Scholar] [CrossRef] [PubMed]
- Mather, P.T.; Luo, X.; Rousseau, I.A. Shape memory polymer research. Annu. Rev. Mater. Res. 2009, 39, 445–471. [Google Scholar] [CrossRef]
- Tobushi, H.; Hashimoto, T.; Hayashi, S.; Yamada, E. Thermomechanical Constitutive Modeling in Shape Memory Polymer of Polyurethane Series. J. Intell. Mater. Syst. Struct. 1997, 8, 711–718. [Google Scholar] [CrossRef]
- Tobushi, H.; Okumura, K.; Hayashi, S. Thermomechanical constitutive model of shape memory polymer. Mech. Mater. 2001, 33, 545–554. [Google Scholar] [CrossRef]
- Qi, H.J.; Nguyen, T.D.; Castro, F.; Yakacki, C.M.; Shandas, R. Finite deformation thermo-mechanical behavior of thermally induced shape memory polymers. J. Mech. Phys. Solids 2008, 56, 1730–1751. [Google Scholar] [CrossRef]
- Ge, Q.; Luo, X.; Iversen, C.B.; Nejad, H.B.; Mather, P.T.; Dunn, M.L.; Qi, H.J. A finite deformation thermomechanical constitutive model for triple shape polymeric composites based on dual thermal transitions. Int. J. Solids Struct. 2014, 51, 2777–2790. [Google Scholar] [CrossRef]
- Jia, H.; Gu, S.Y.; Chang, K. 3D printed self-expandable vascular stents from biodegradable shape memory polymer. Adv. Polym. Technol. 2018, 37, 3222–3228. [Google Scholar] [CrossRef]
- Yakacki, C.M.; Shandas, R.; Lanning, C.; Rech, B.; Eckstein, A.; Gall, K. Unconstrained recovery characterization of shape-memory polymer networks for cardiovascular applications. Biomaterials 2007, 28, 2255–2263. [Google Scholar] [CrossRef] [PubMed]
- Kim, N.H. Introduction to Nonlinear Finite Element Analysis; Springer Science & Business Media: Berlin/Heidelberg, Germany, 2014. [Google Scholar] [CrossRef]
- Kim, B.; Lee, S.B.; Lee, J.; Cho, S.; Park, H.; Yeom, S.; Park, S.H. A comparison among Neo-Hookean model, Mooney-Rivlin model, and Ogden model for chloroprene rubber. Int. J. Precis. Eng. Manuf. 2012, 13, 759–764. [Google Scholar] [CrossRef]
- Jaeger, J.C.; Cook, N.G.; Zimmerman, R. Fundamentals of Rock Mechanics; John Wiley & Sons: Hoboken, NJ, USA, 2009. [Google Scholar] [CrossRef]
- Risnes, R.; Bratli, R.K.; Horsrud, P. Sand stresses around a wellbore. Soc. Pet. Eng. J. 1982, 22, 883–898. [Google Scholar] [CrossRef]
Disclaimer/Publisher’s Note: The statements, opinions and data contained in all publications are solely those of the individual author(s) and contributor(s) and not of MDPI and/or the editor(s). MDPI and/or the editor(s) disclaim responsibility for any injury to people or property resulting from any ideas, methods, instructions or products referred to in the content. |
© 2025 by the authors. Licensee MDPI, Basel, Switzerland. This article is an open access article distributed under the terms and conditions of the Creative Commons Attribution (CC BY) license (https://creativecommons.org/licenses/by/4.0/).