Figure 1.
Layout of multi-heat sources with large marine diesel engine.
Figure 1.
Layout of multi-heat sources with large marine diesel engine.
Figure 2.
Energy balance of the marine diesel engine.
Figure 2.
Energy balance of the marine diesel engine.
Figure 3.
Distribution of waste heat source temperature ranges in marine diesel engine.
Figure 3.
Distribution of waste heat source temperature ranges in marine diesel engine.
Figure 4.
Configuration of the MHSORC system for large marine diesel engines.
Figure 4.
Configuration of the MHSORC system for large marine diesel engines.
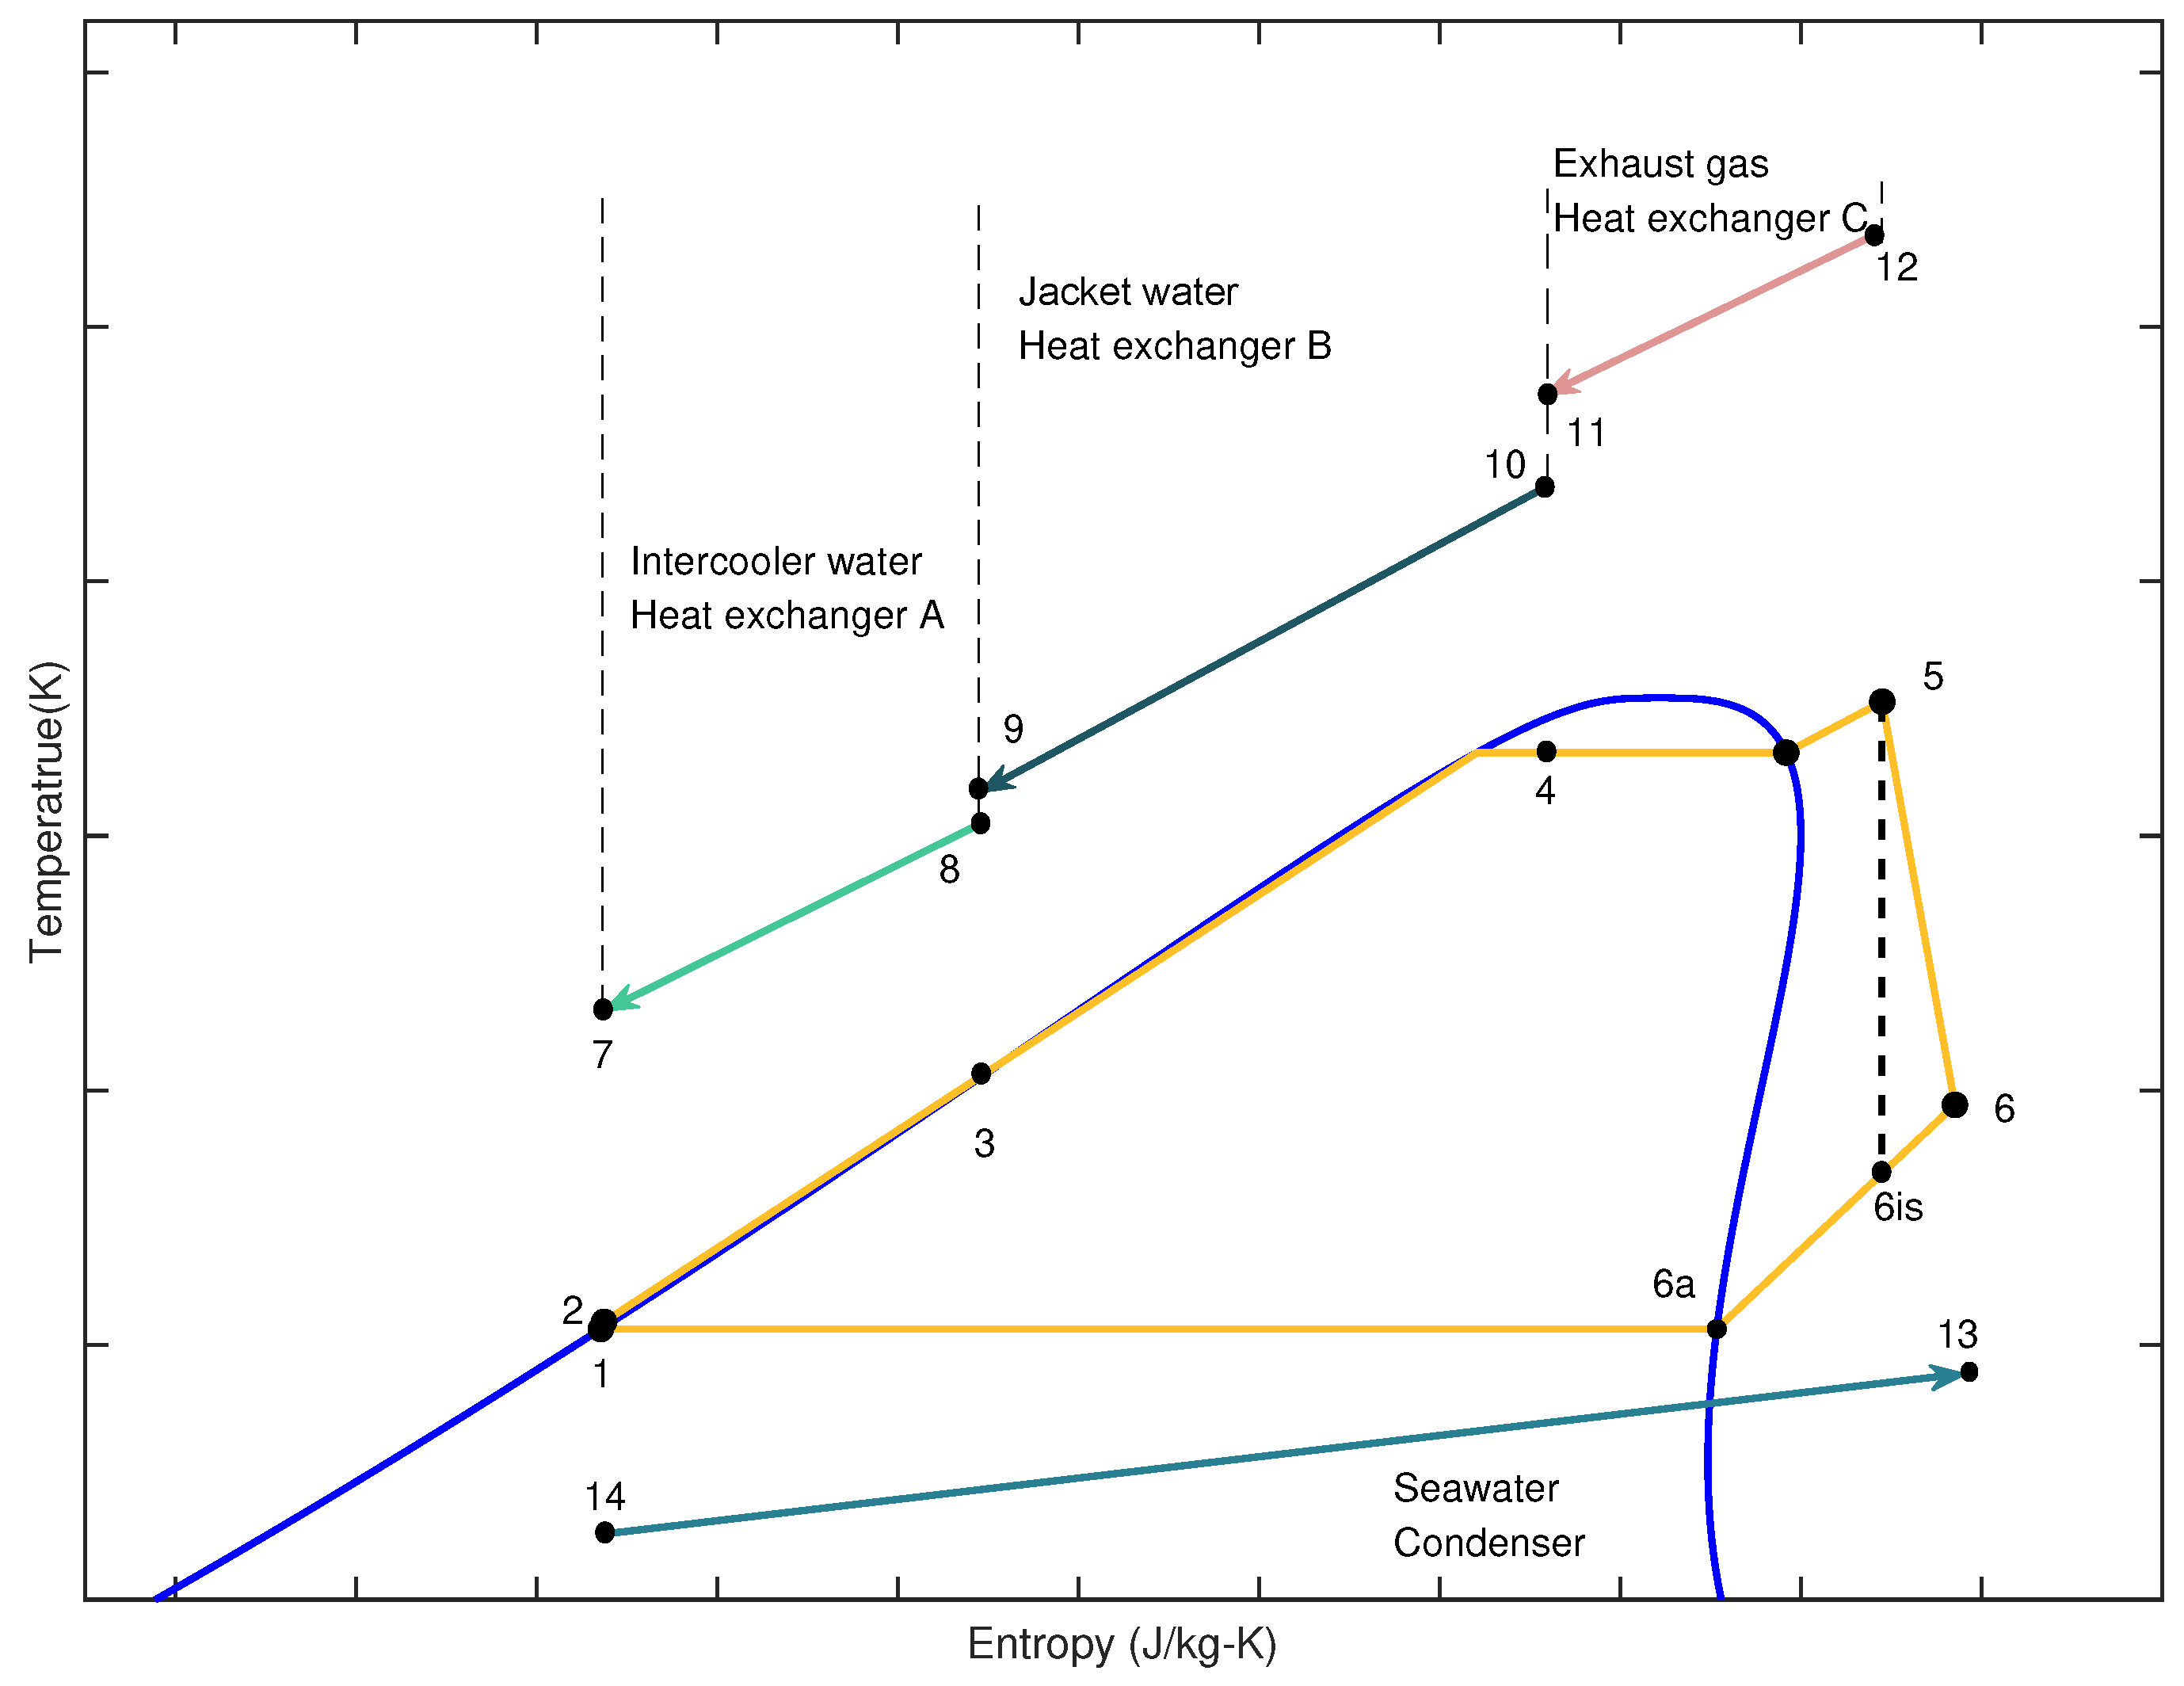
Figure 5.
T-s diagram of the MHSORC [
14].
Figure 5.
T-s diagram of the MHSORC [
14].
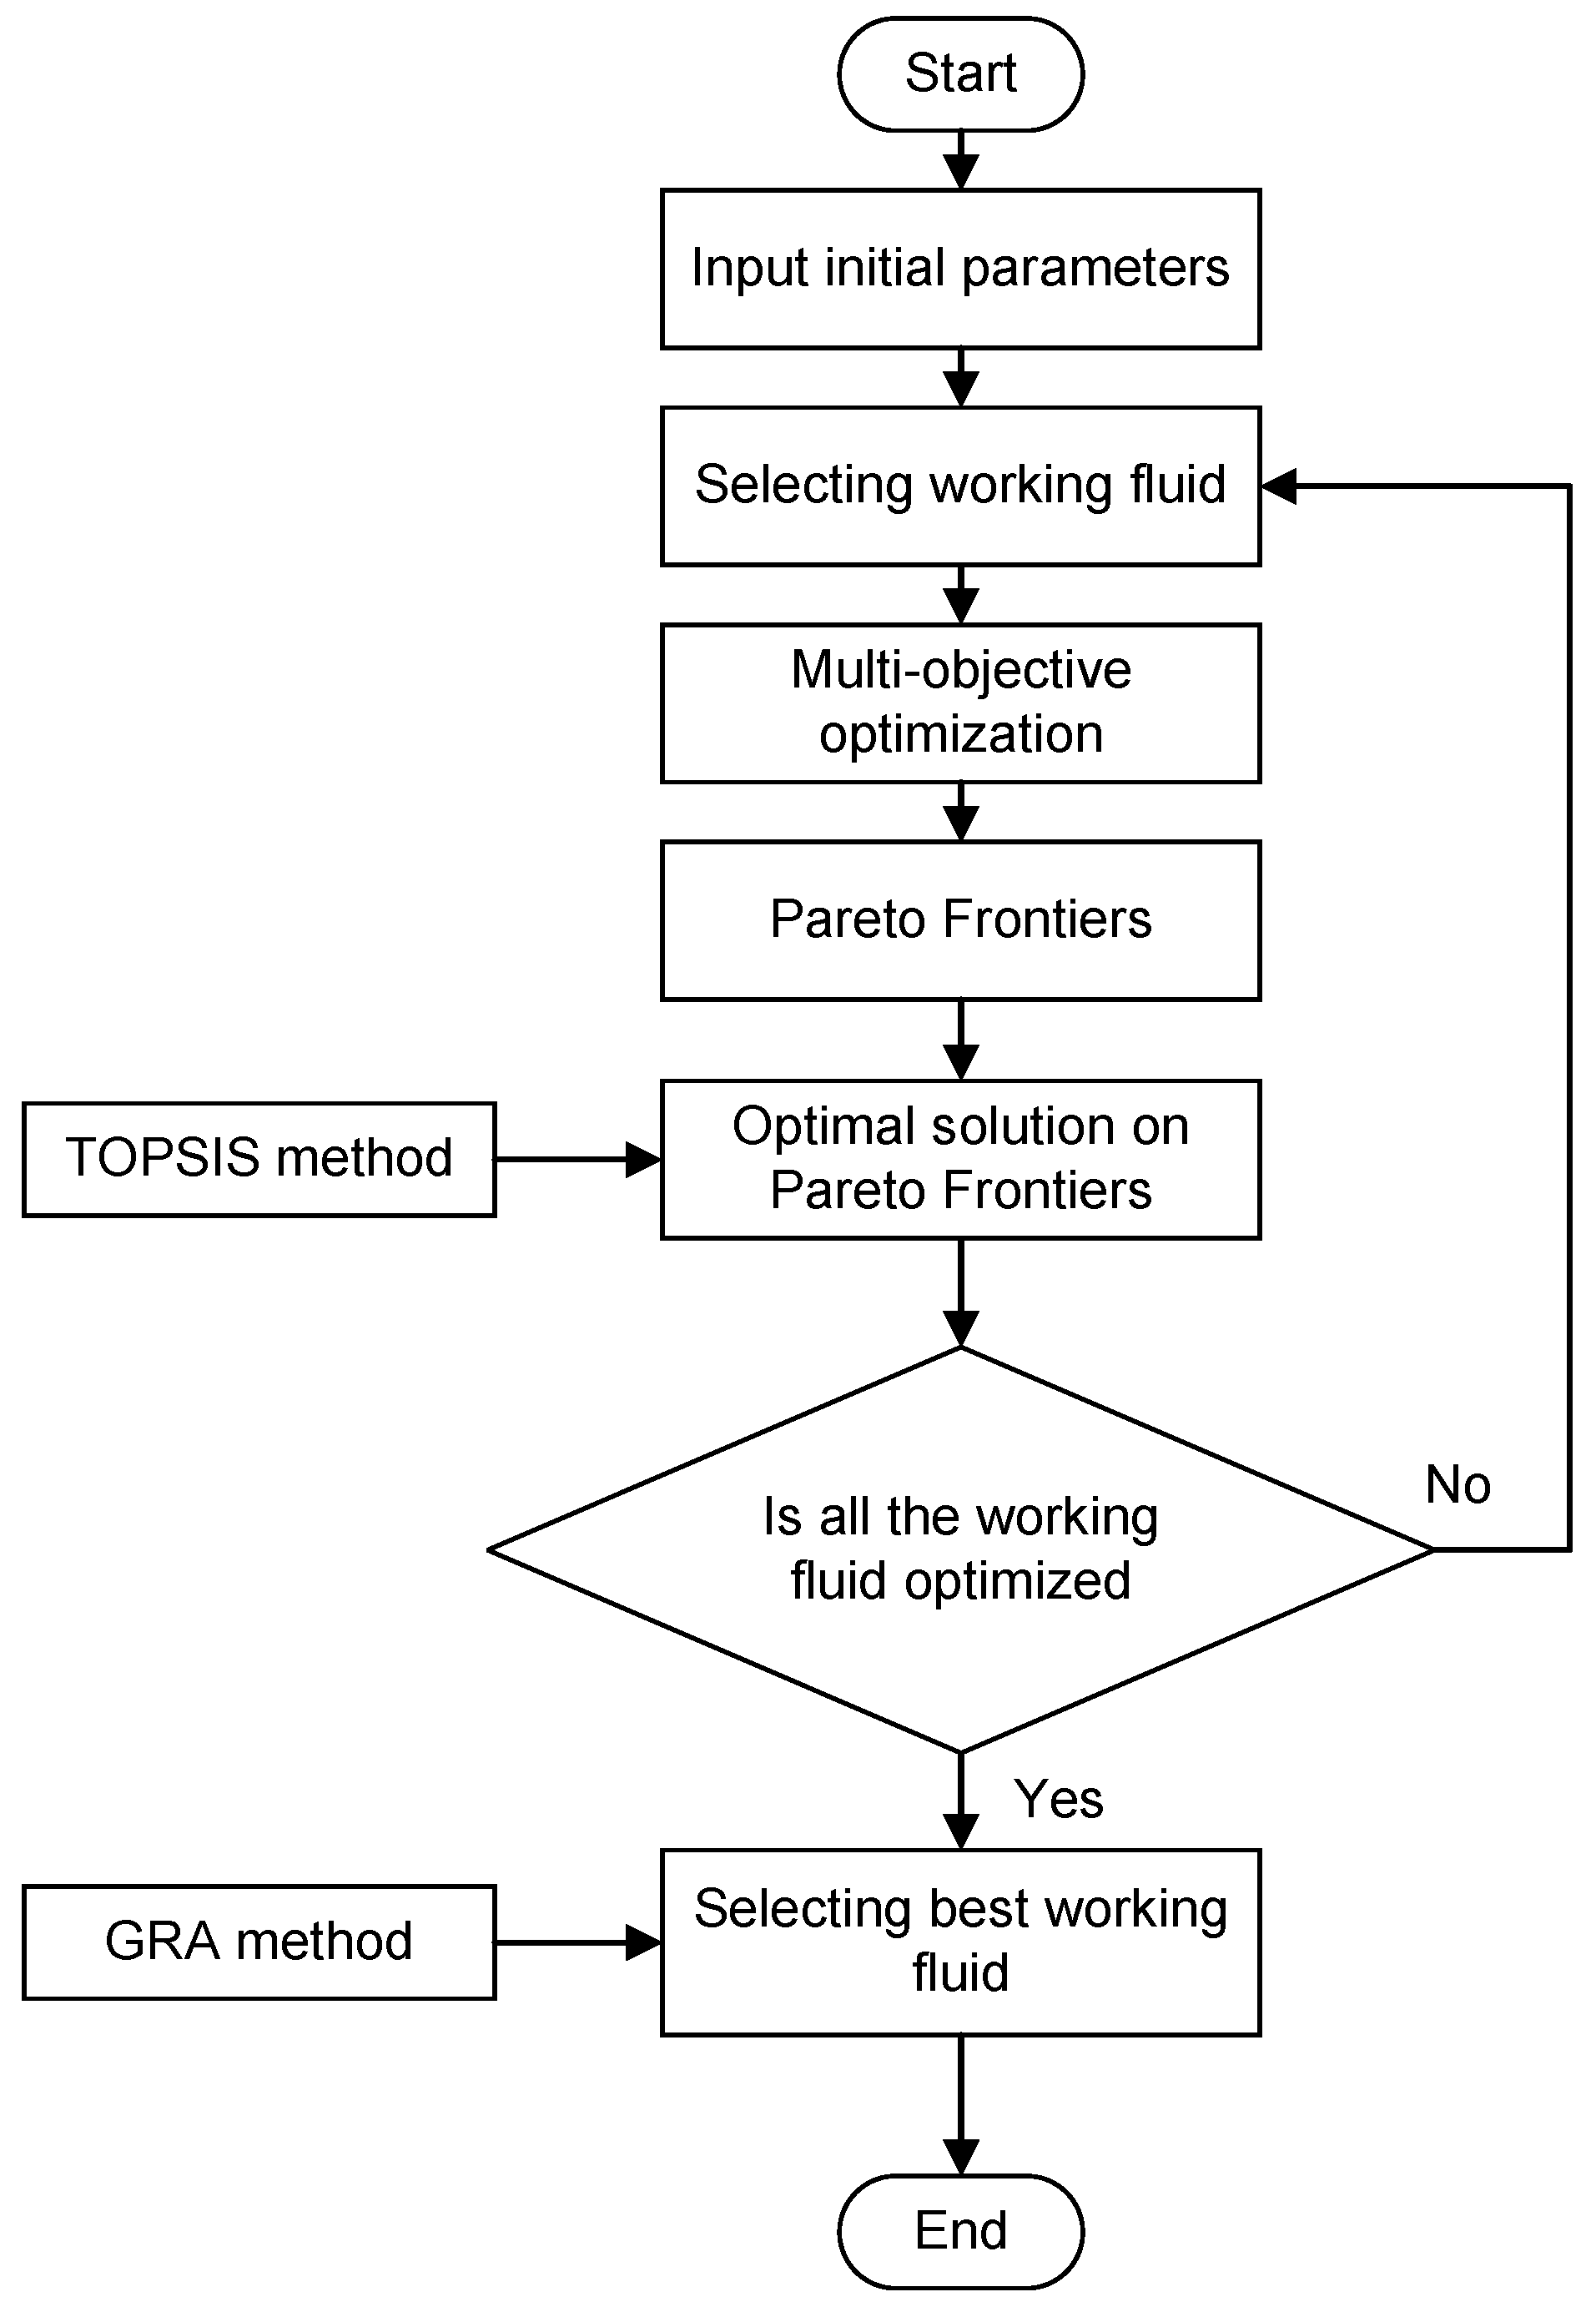
Figure 6.
The flowchart of the multi-objective optimization process [
36].
Figure 6.
The flowchart of the multi-objective optimization process [
36].
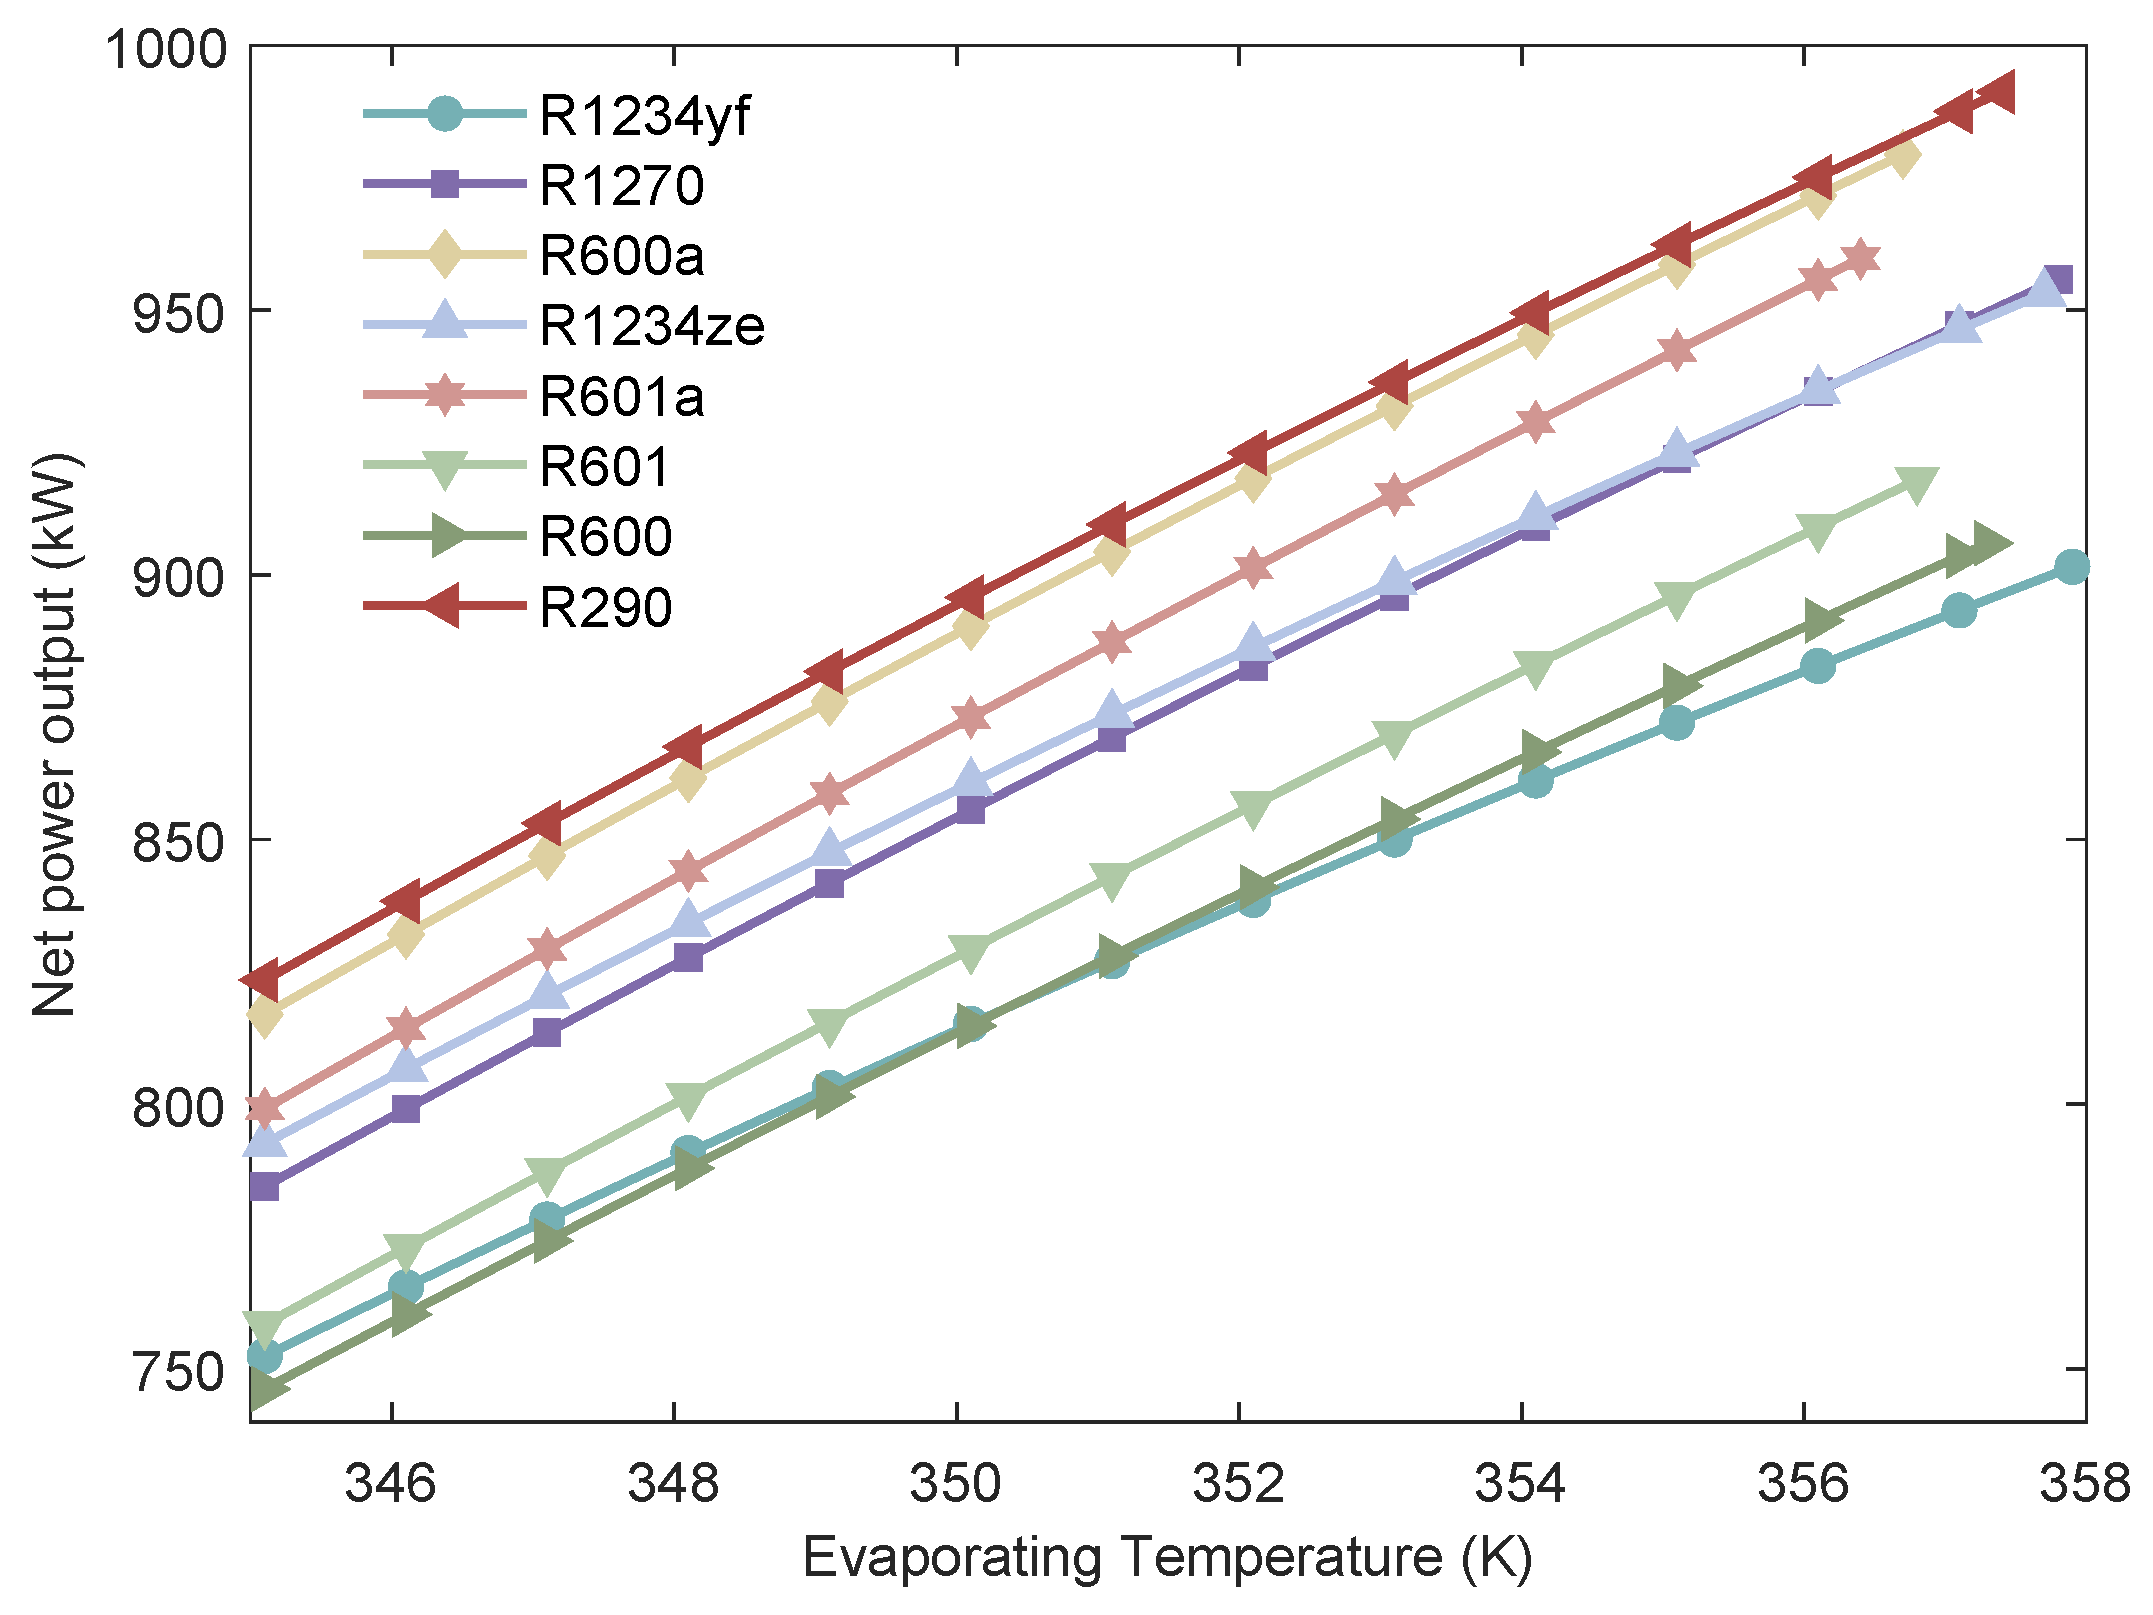
Figure 7.
Relationship between the of the MHSORC system and the evaporation temperature.
Figure 7.
Relationship between the of the MHSORC system and the evaporation temperature.
Figure 8.
Relationship between the of the MHSORC system and the evaporation temperature.
Figure 8.
Relationship between the of the MHSORC system and the evaporation temperature.
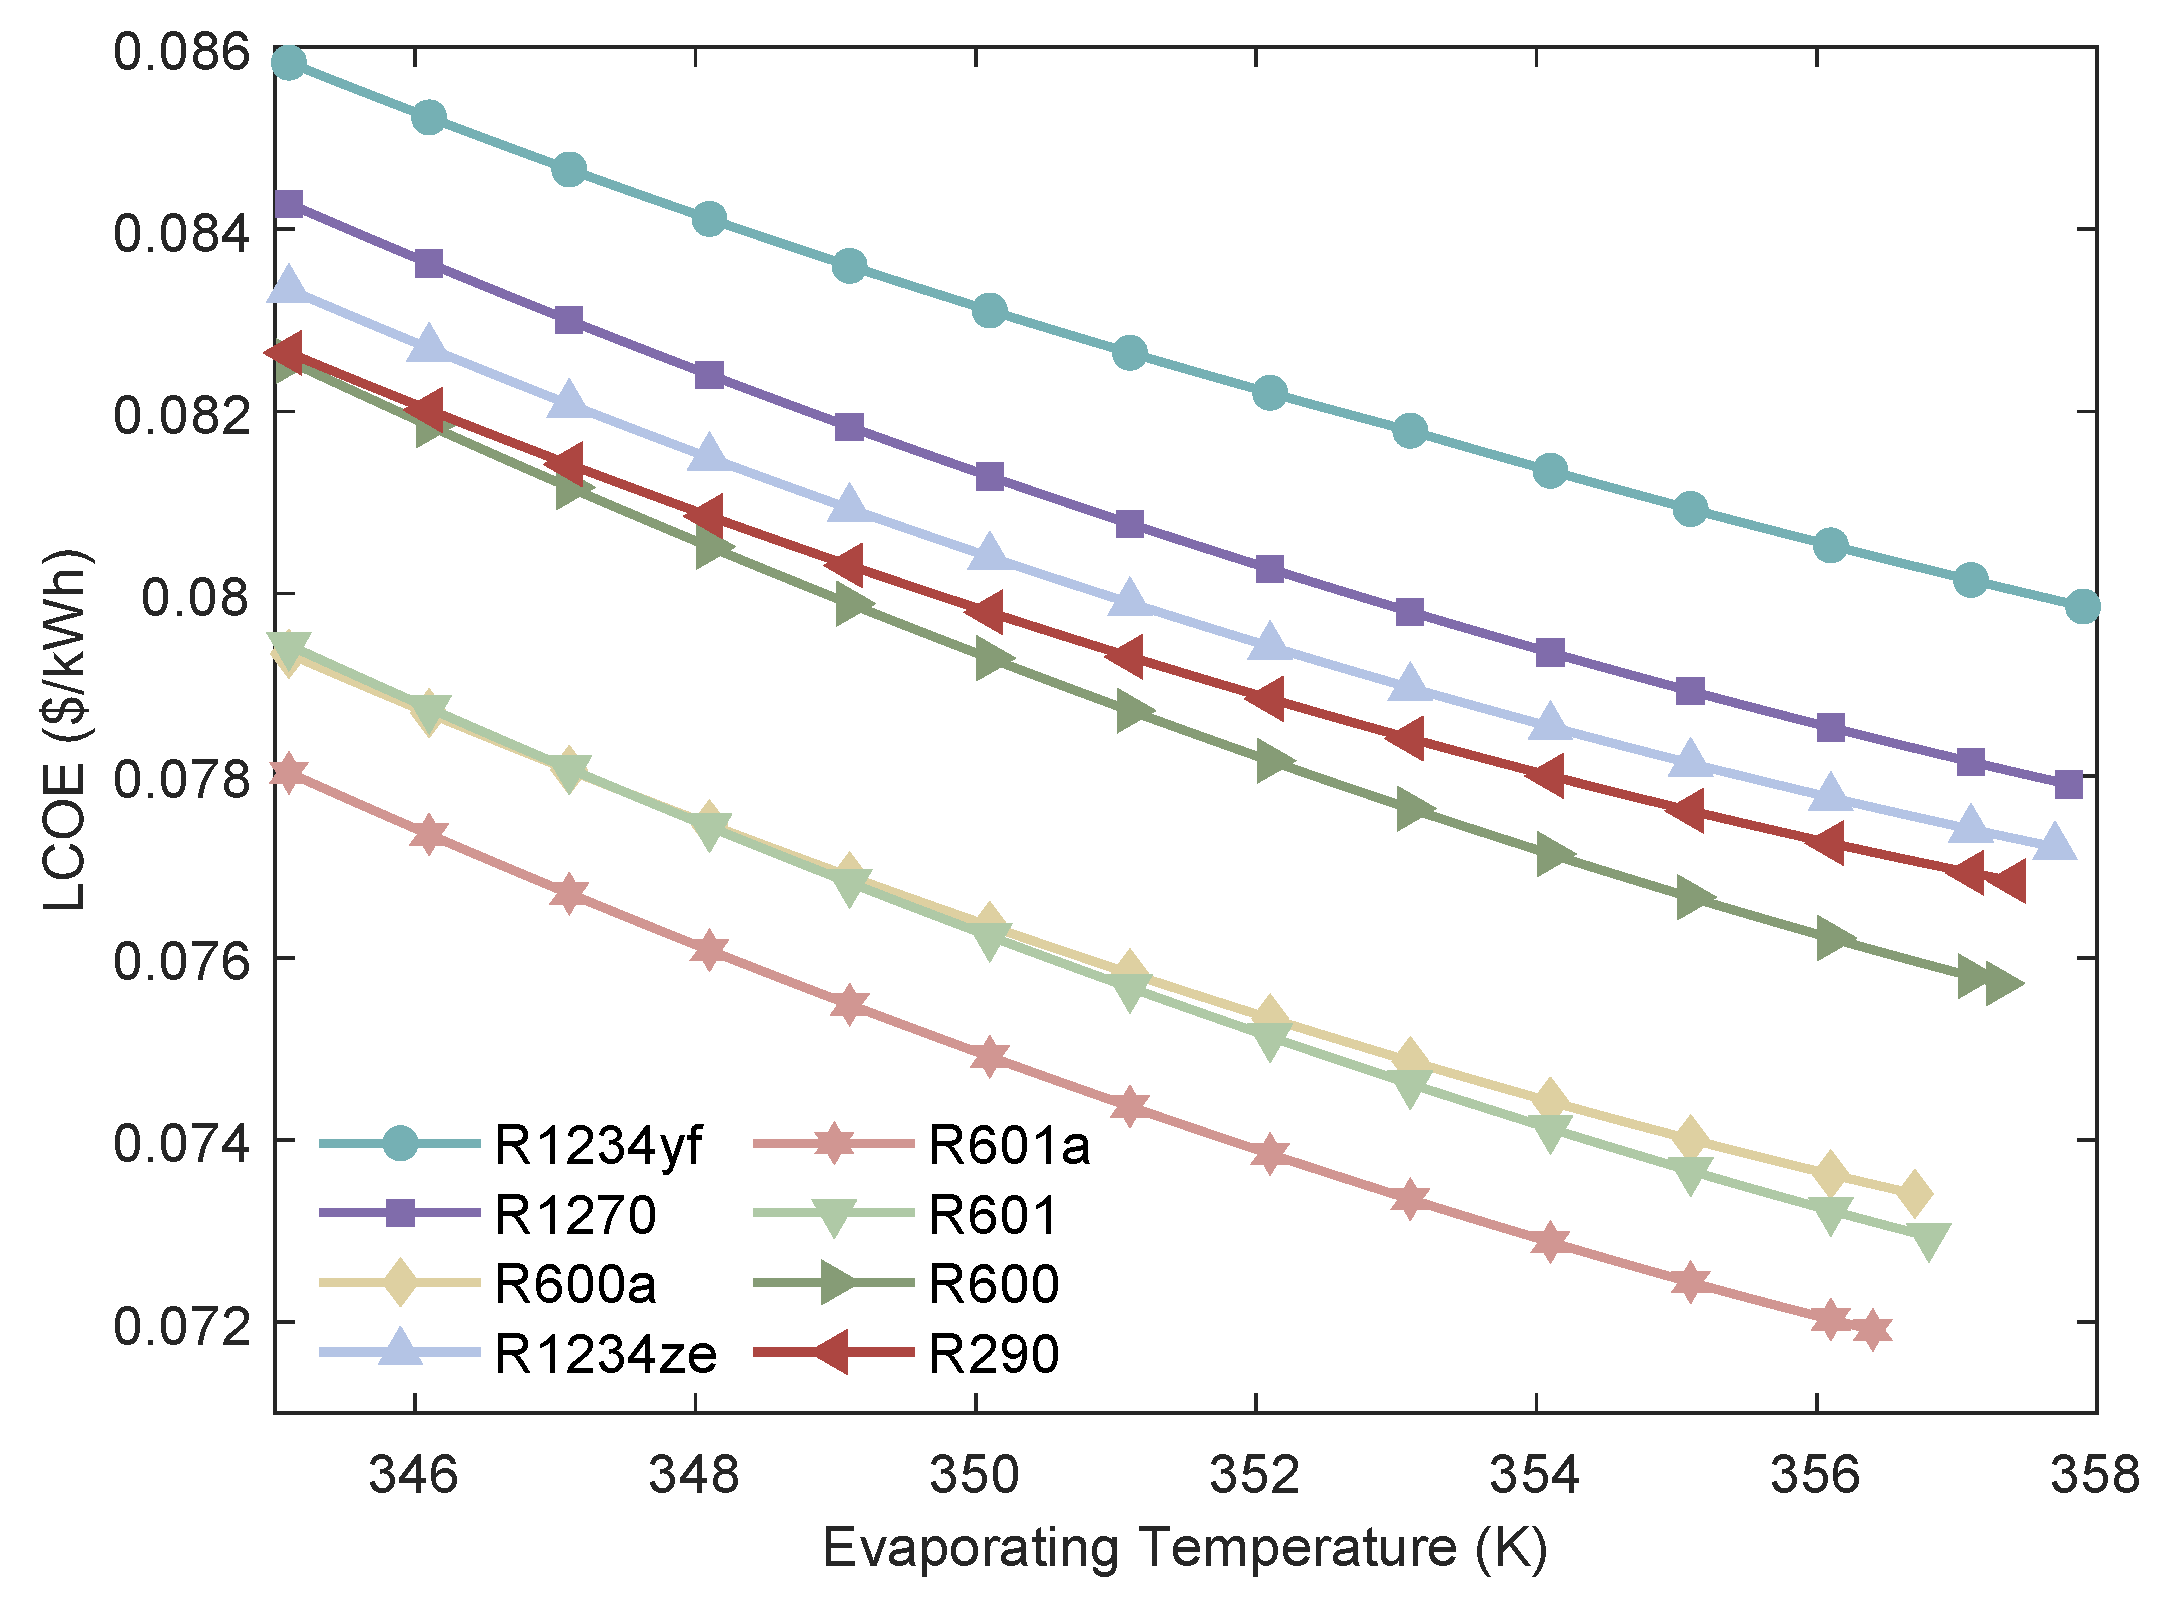
Figure 9.
Relationship between the LCOE of the MHSORC system and the evaporation temperature.
Figure 9.
Relationship between the LCOE of the MHSORC system and the evaporation temperature.
Figure 10.
Relationship between the of the MHSORC system and the evaporation temperature.
Figure 10.
Relationship between the of the MHSORC system and the evaporation temperature.
Figure 11.
The variation of of MHSORC system with respect to the condensing temperature.
Figure 11.
The variation of of MHSORC system with respect to the condensing temperature.
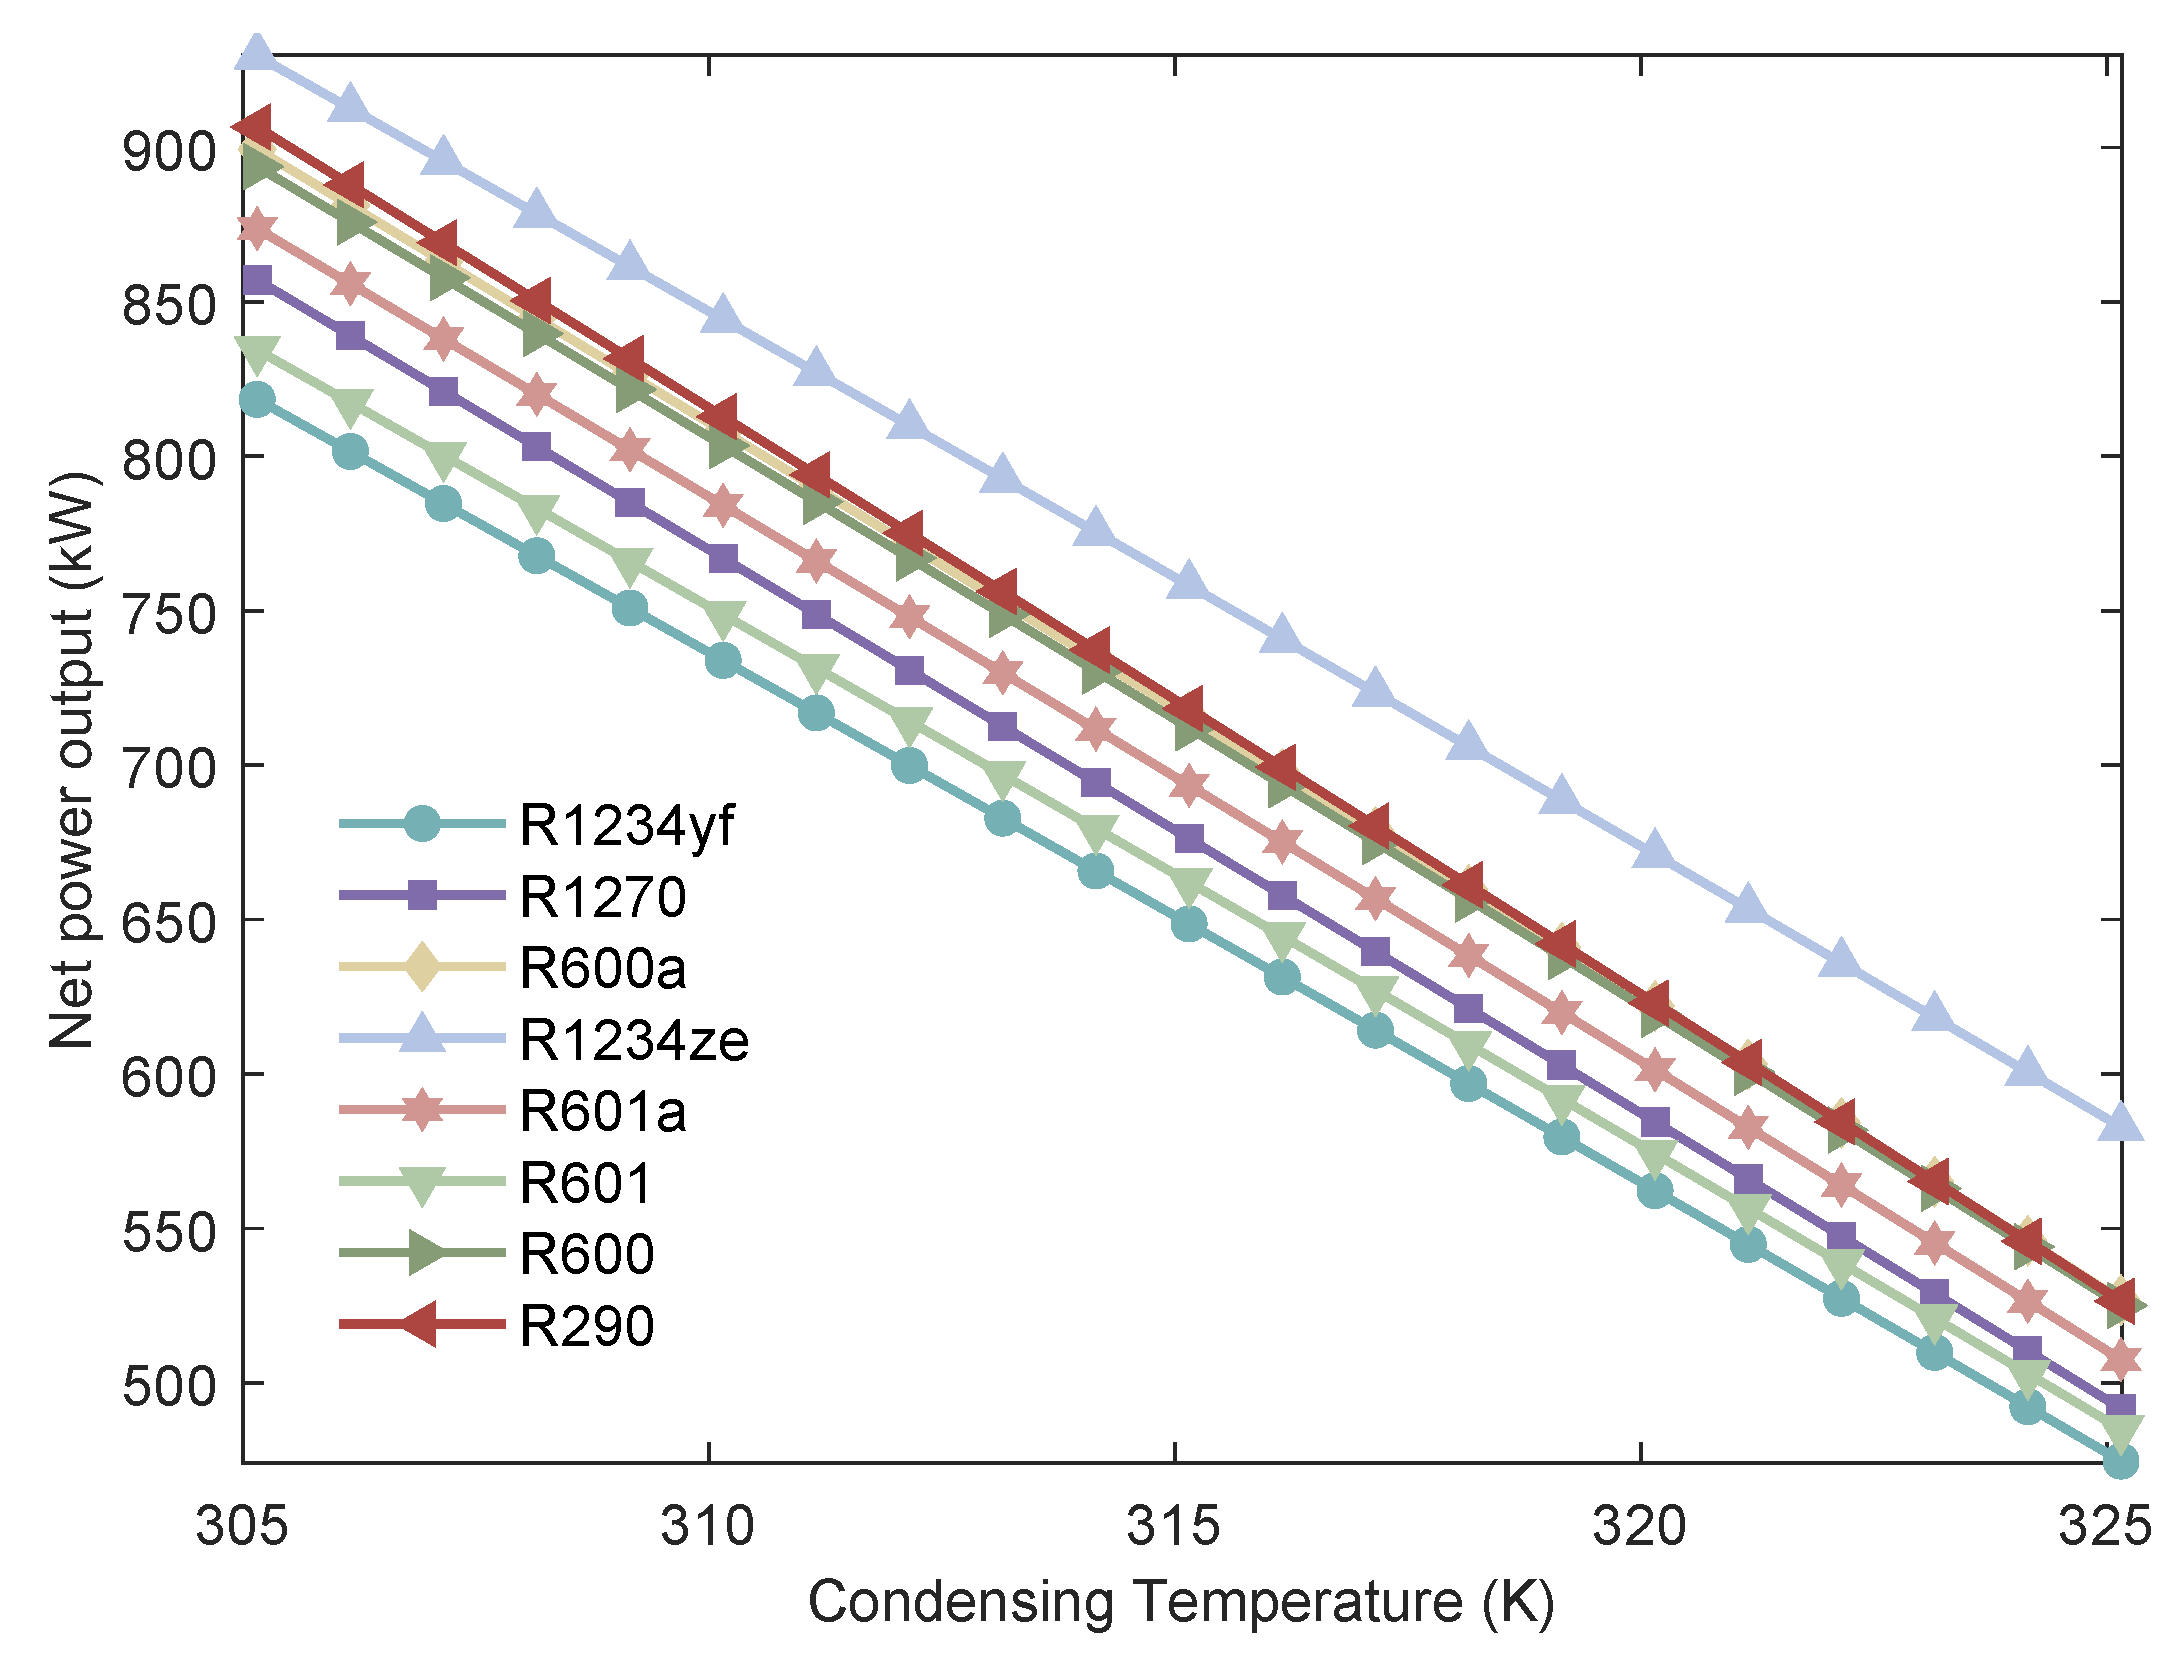
Figure 12.
The variation of of MHSORC system with respect to the condensing temperature.
Figure 12.
The variation of of MHSORC system with respect to the condensing temperature.
Figure 13.
The variation of LCOE of the MHSORC system with respect to the condensing temperature.
Figure 13.
The variation of LCOE of the MHSORC system with respect to the condensing temperature.
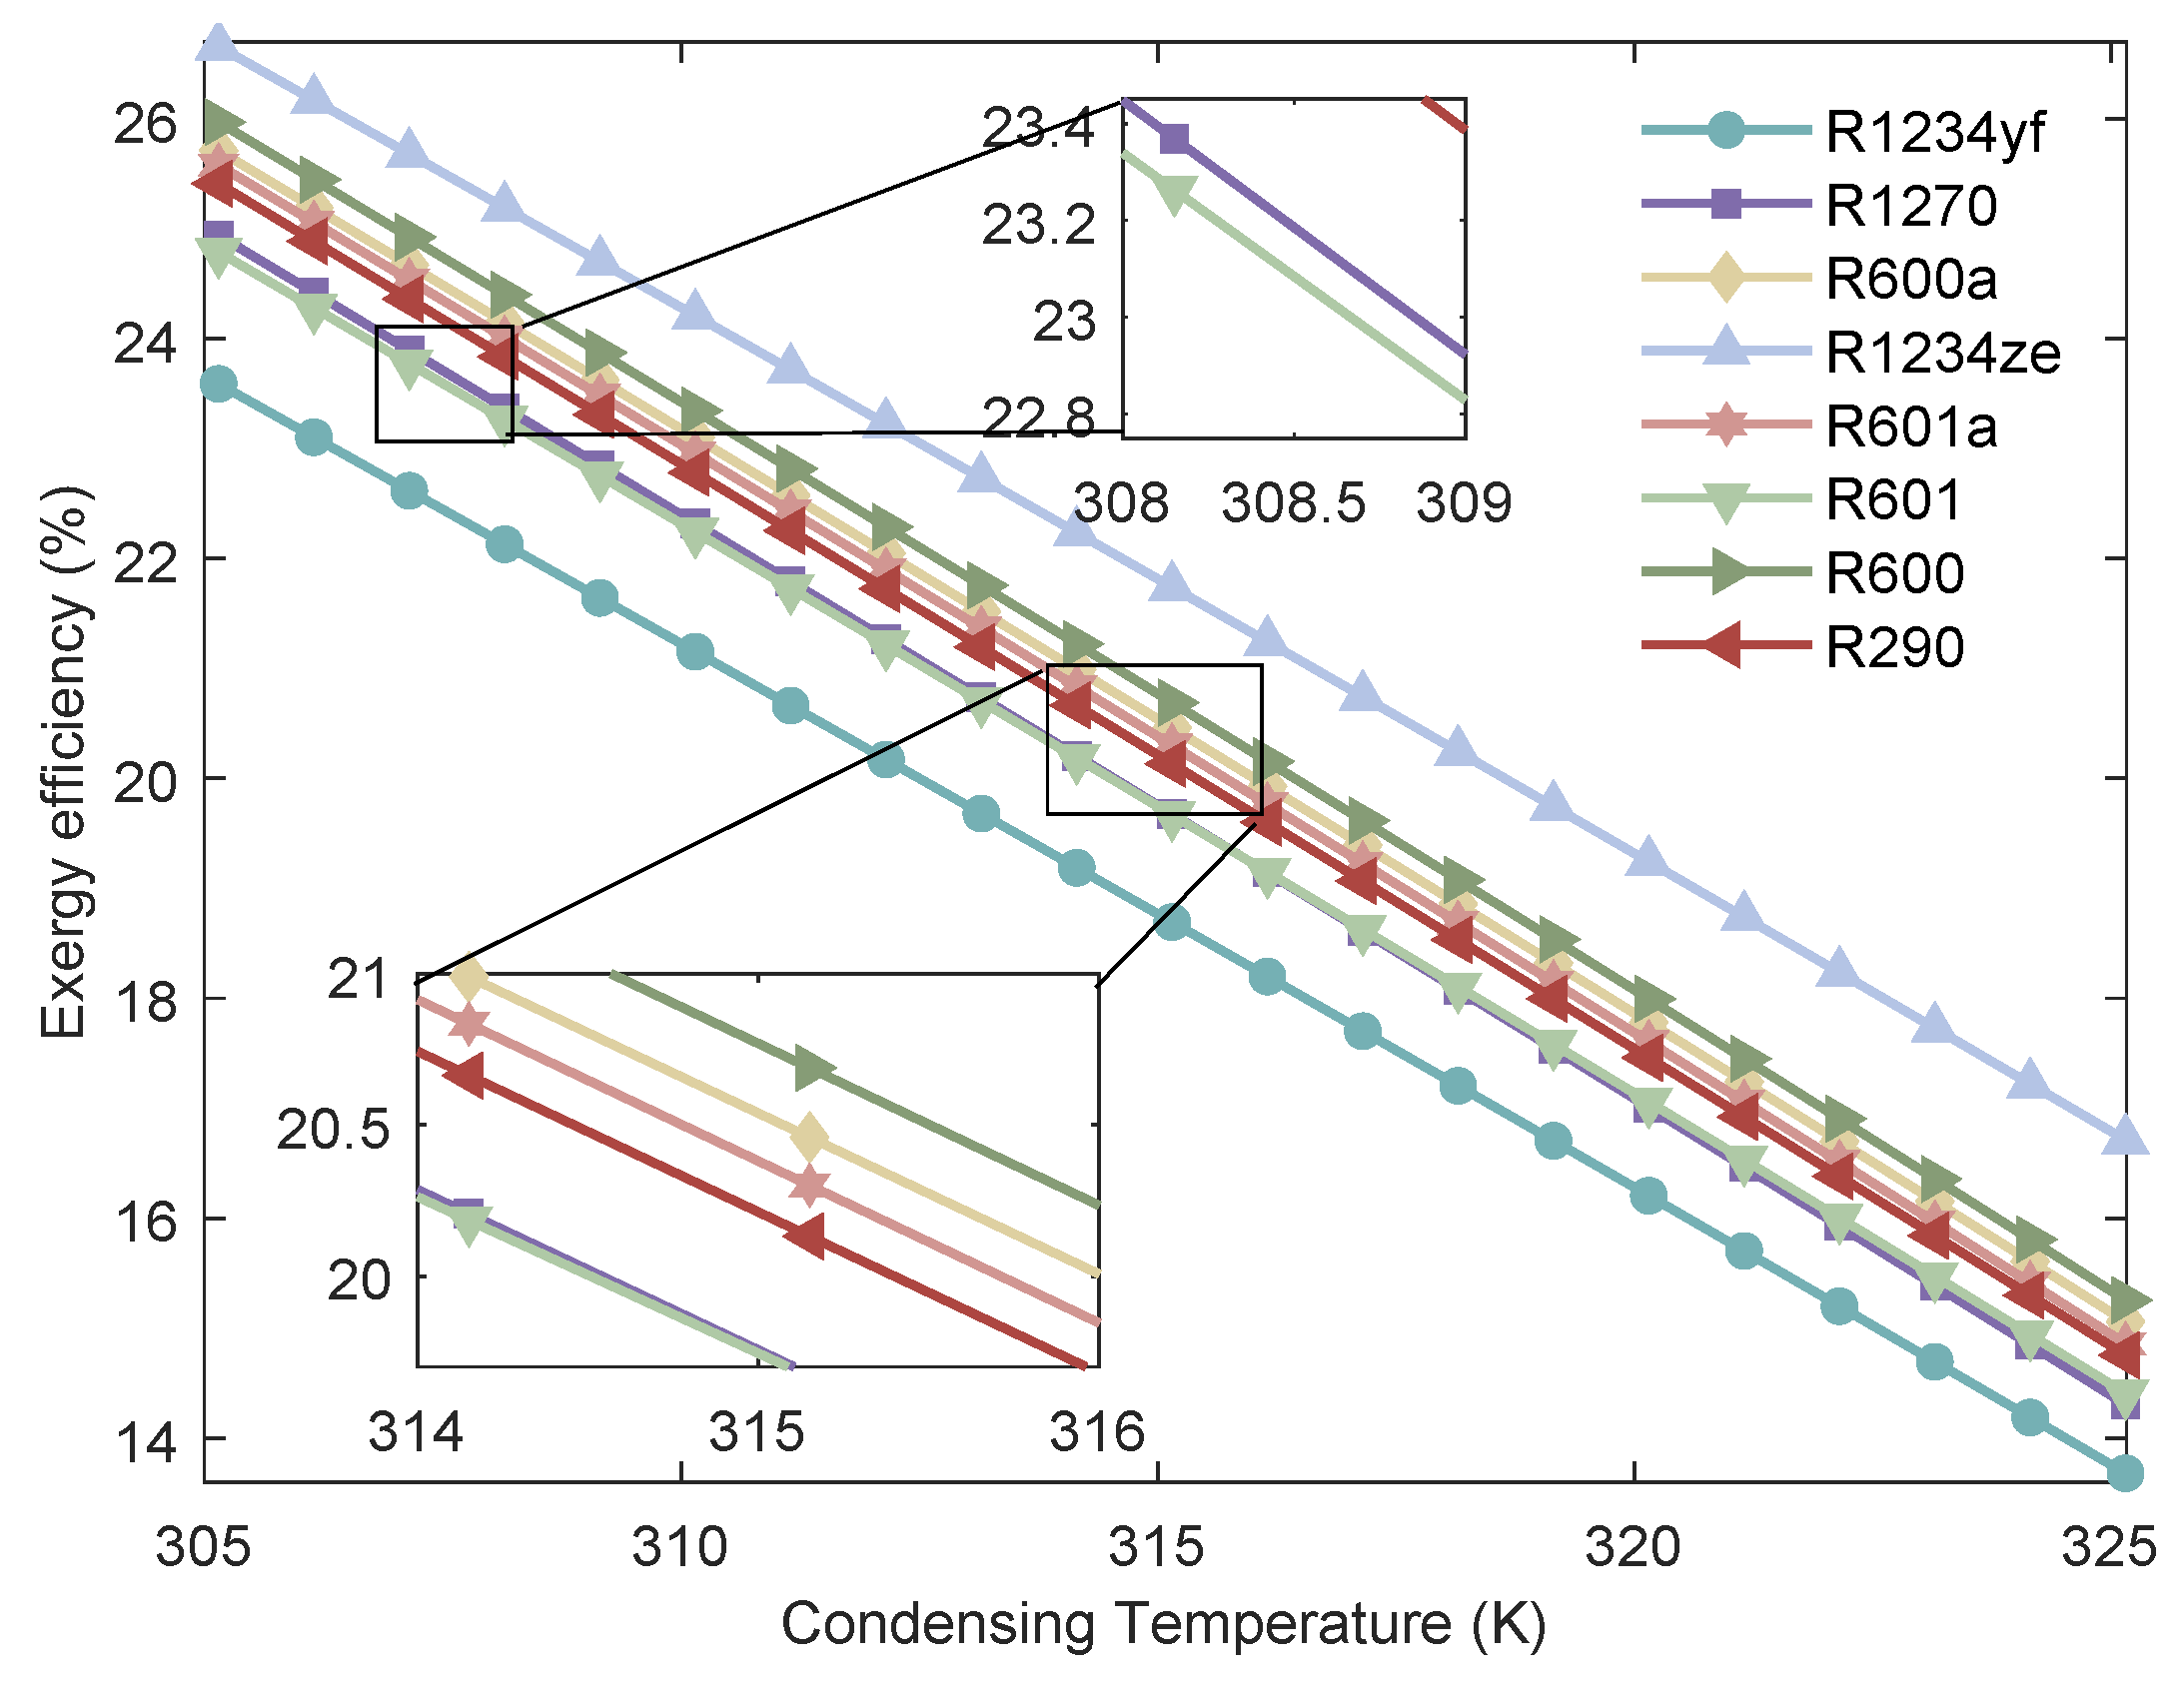
Figure 14.
Variation of the of MHSORC system with respect to the condensing temperature.
Figure 14.
Variation of the of MHSORC system with respect to the condensing temperature.
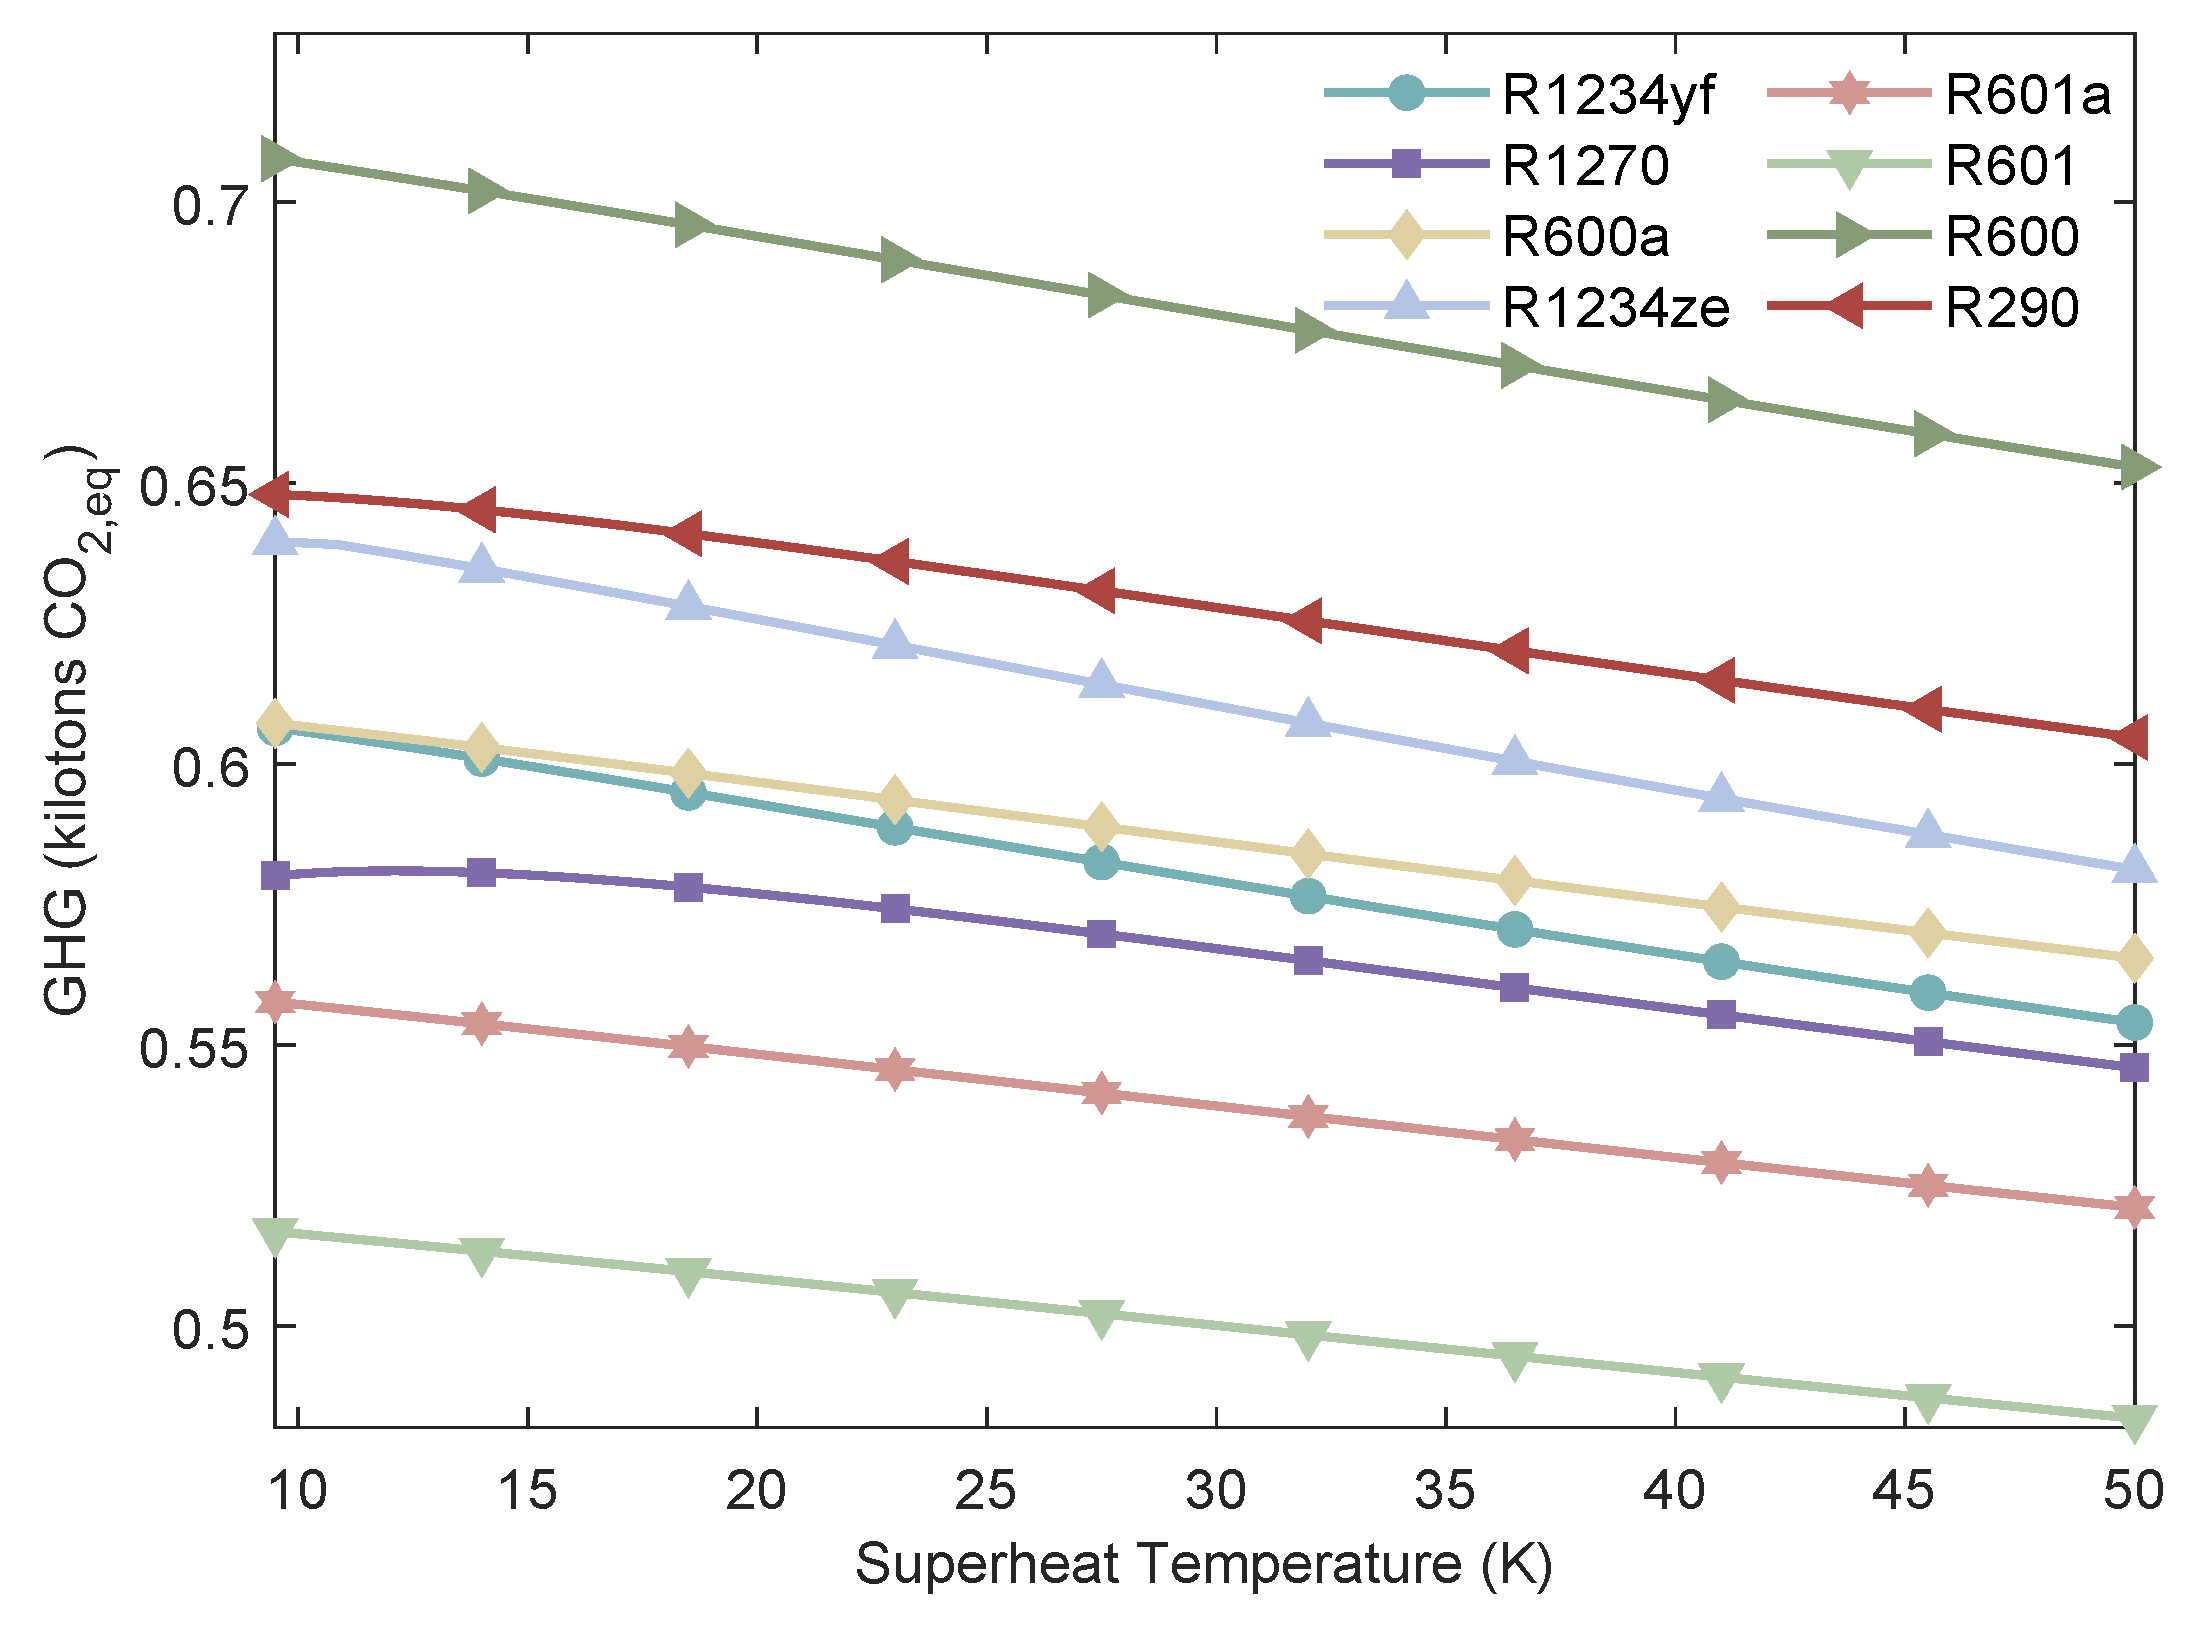
Figure 15.
Variation of the of MHSORC system with respect to the superheat temperature.
Figure 15.
Variation of the of MHSORC system with respect to the superheat temperature.
Figure 16.
Variation of the of MHSORC system with respect to the superheat temperature.
Figure 16.
Variation of the of MHSORC system with respect to the superheat temperature.
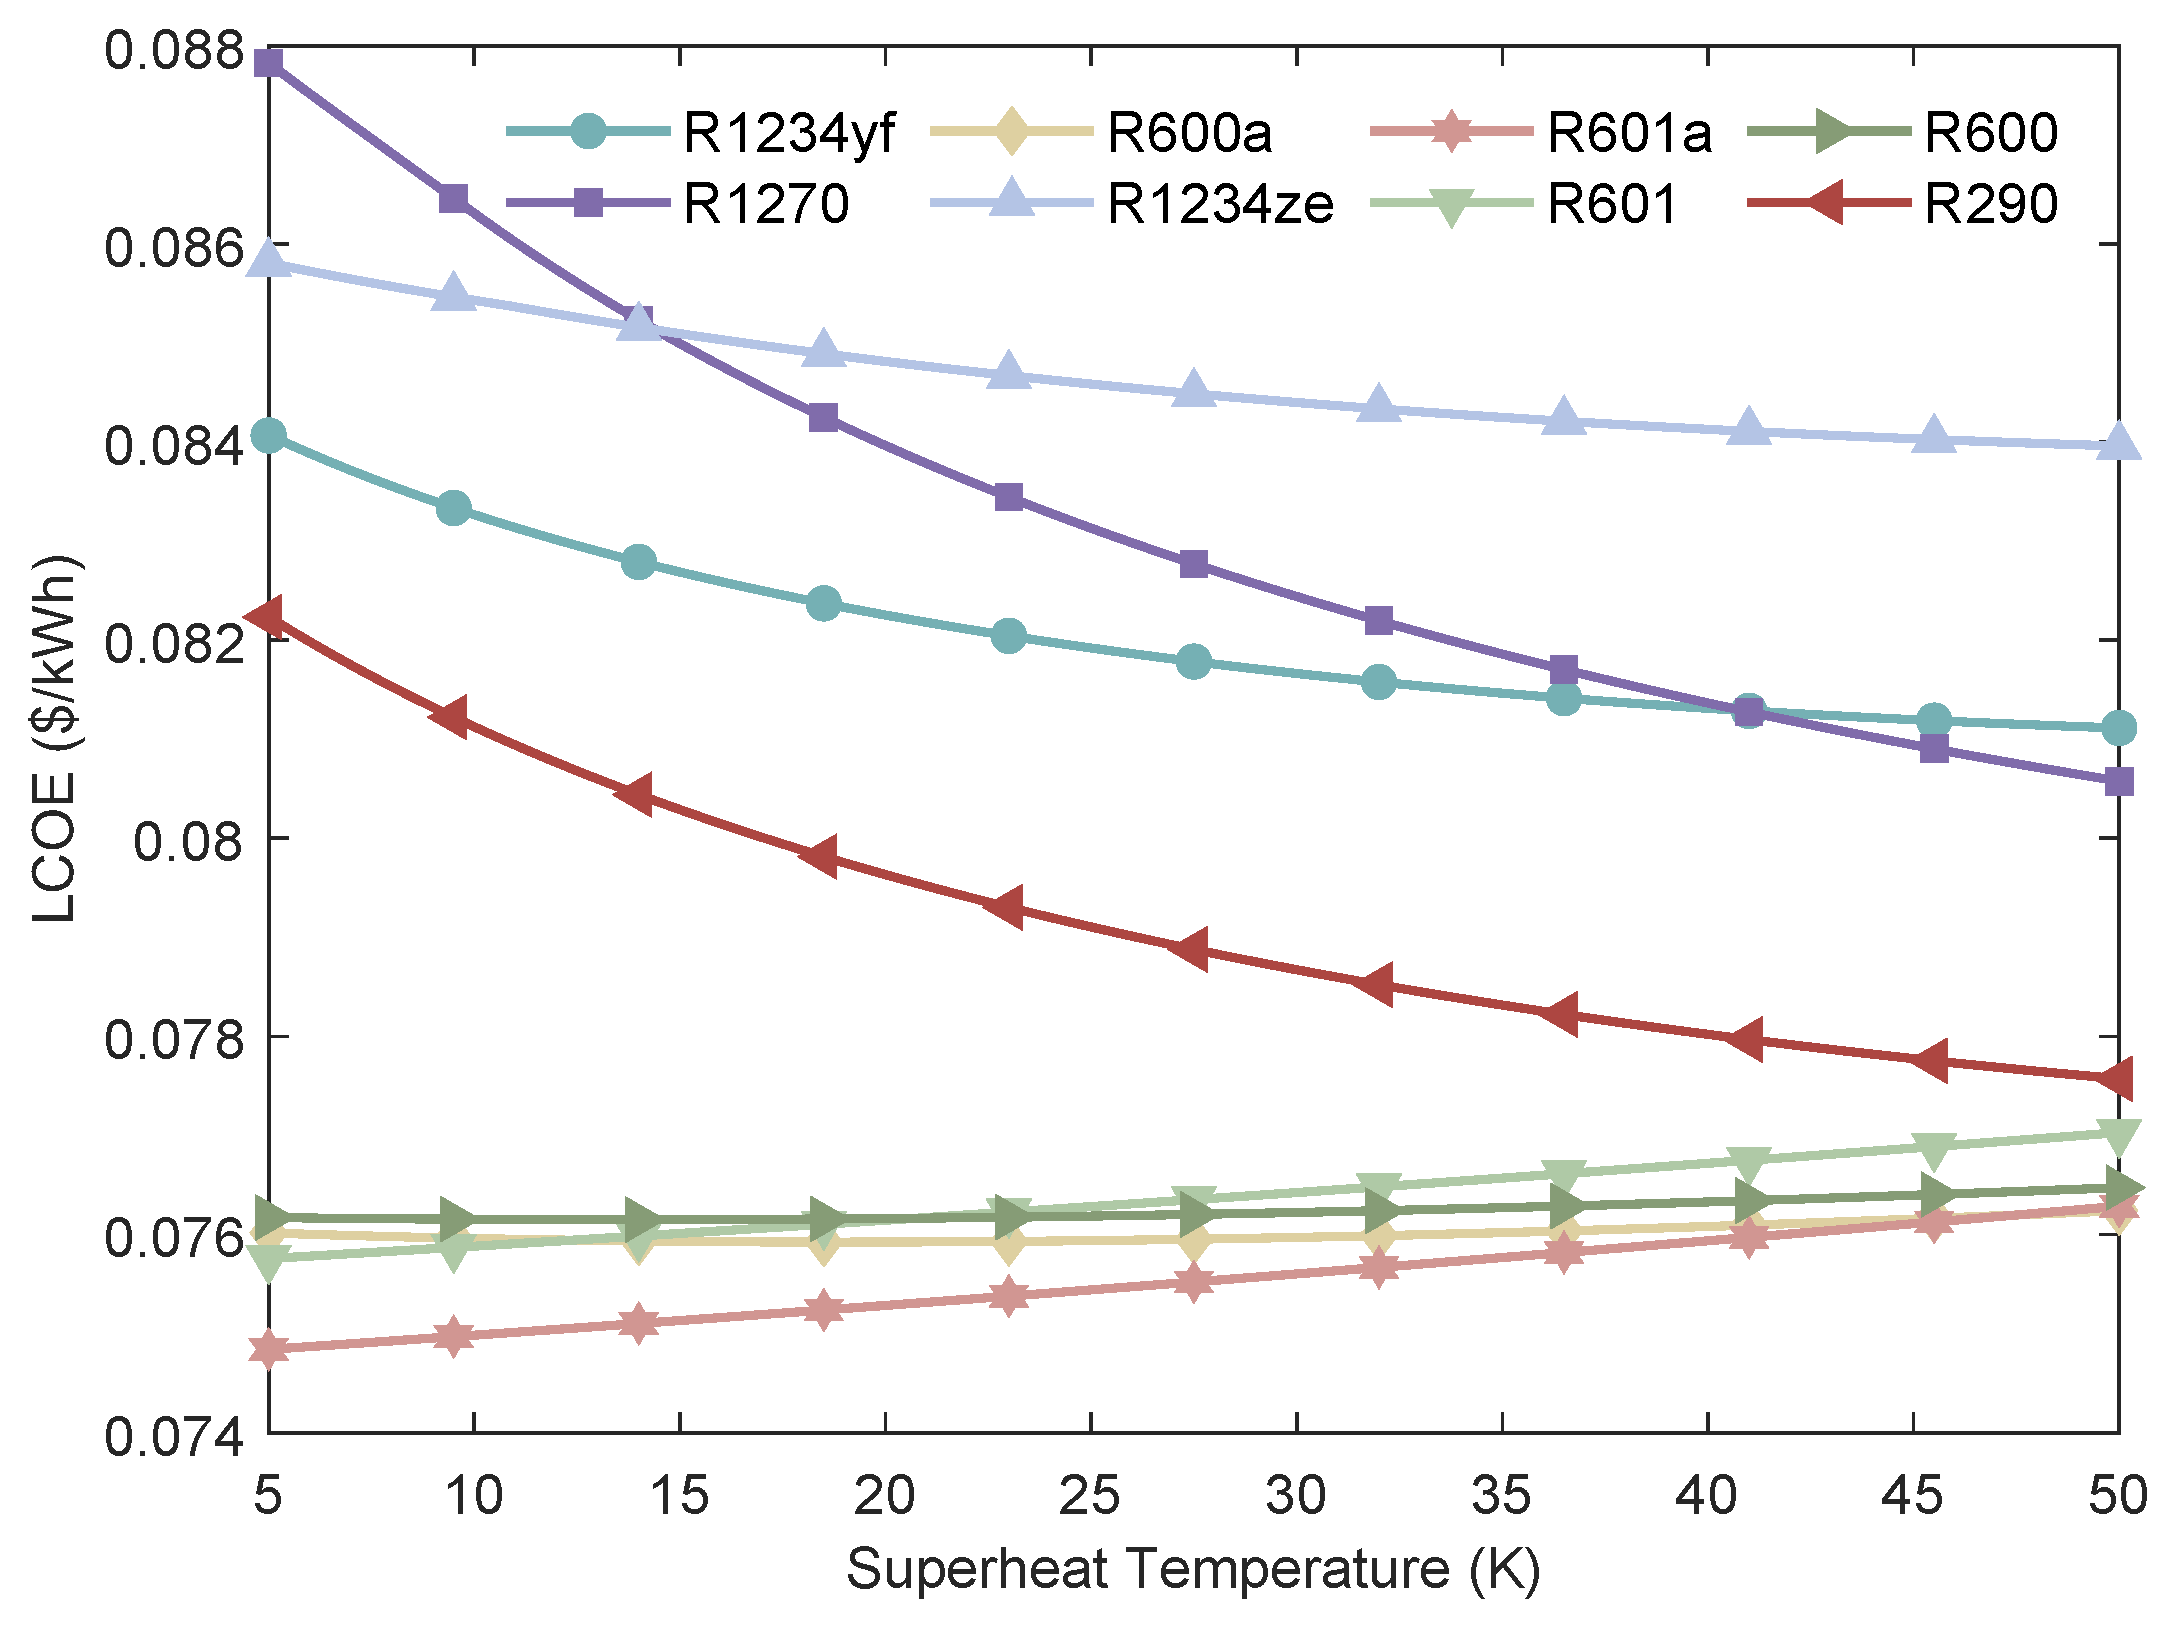
Figure 17.
Variation of the LCOE of MHSORC system with respect to the superheat temperature.
Figure 17.
Variation of the LCOE of MHSORC system with respect to the superheat temperature.
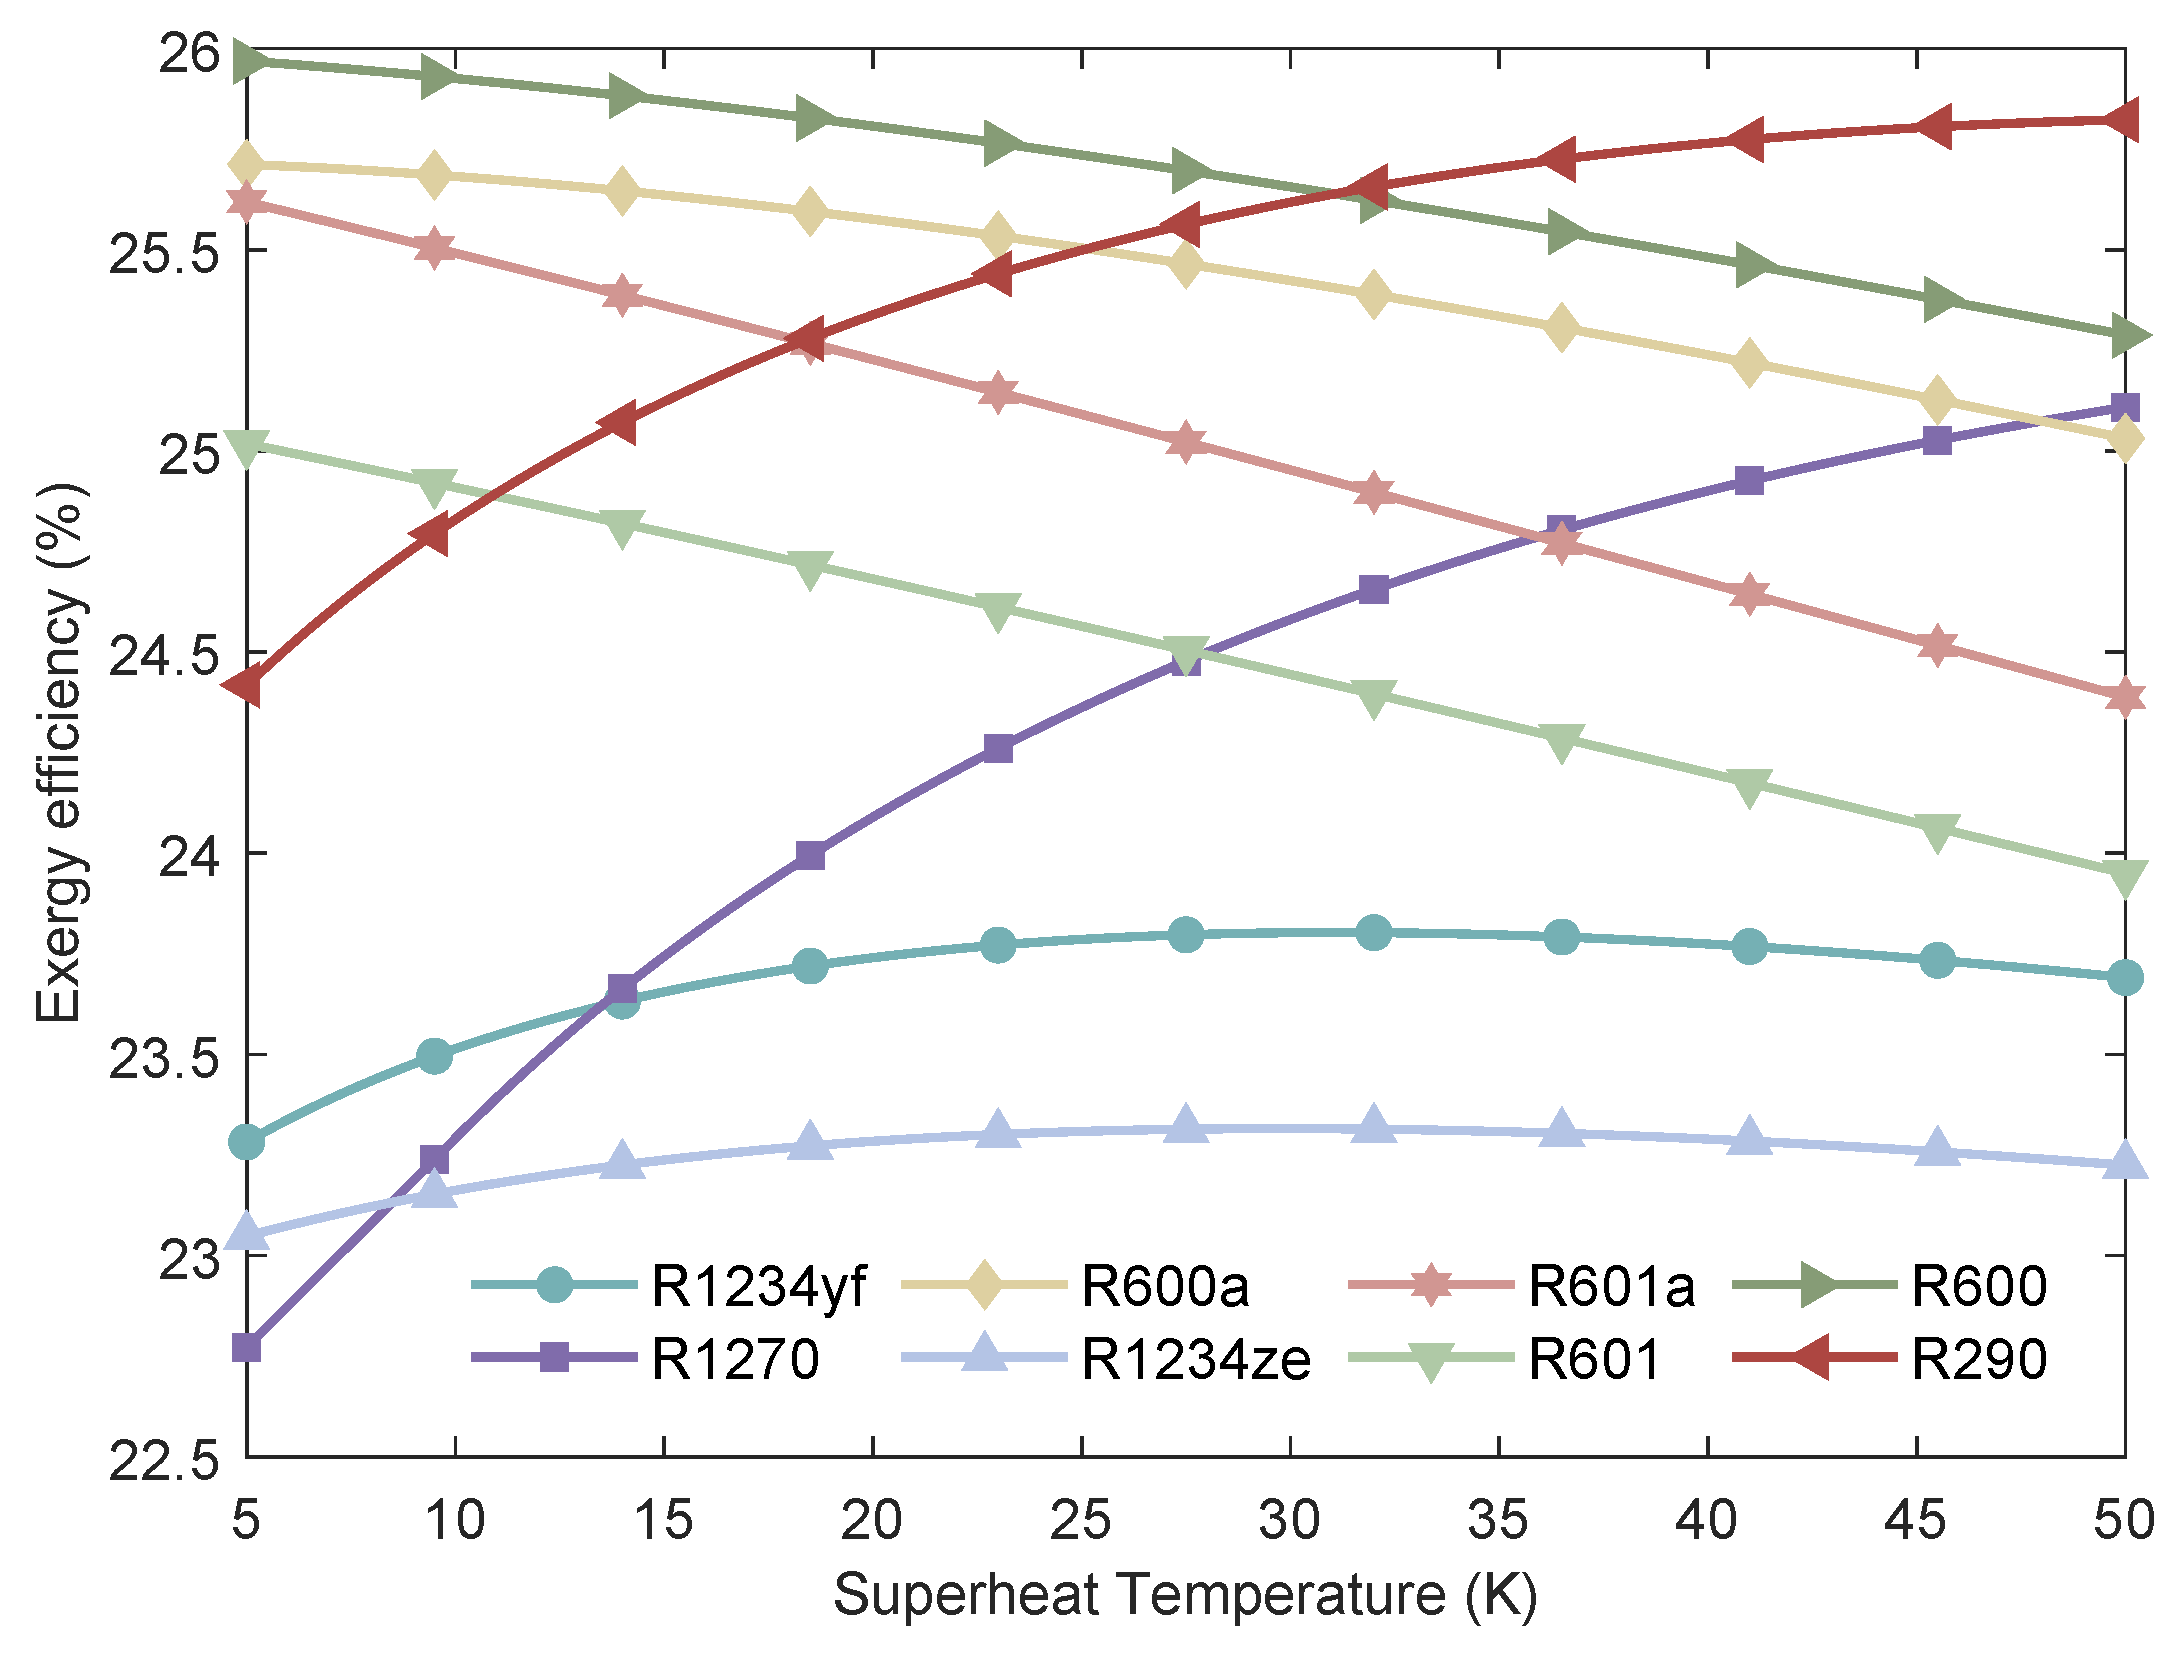
Figure 18.
Variation of the of MHSORC system with respect to the superheat temperature.
Figure 18.
Variation of the of MHSORC system with respect to the superheat temperature.
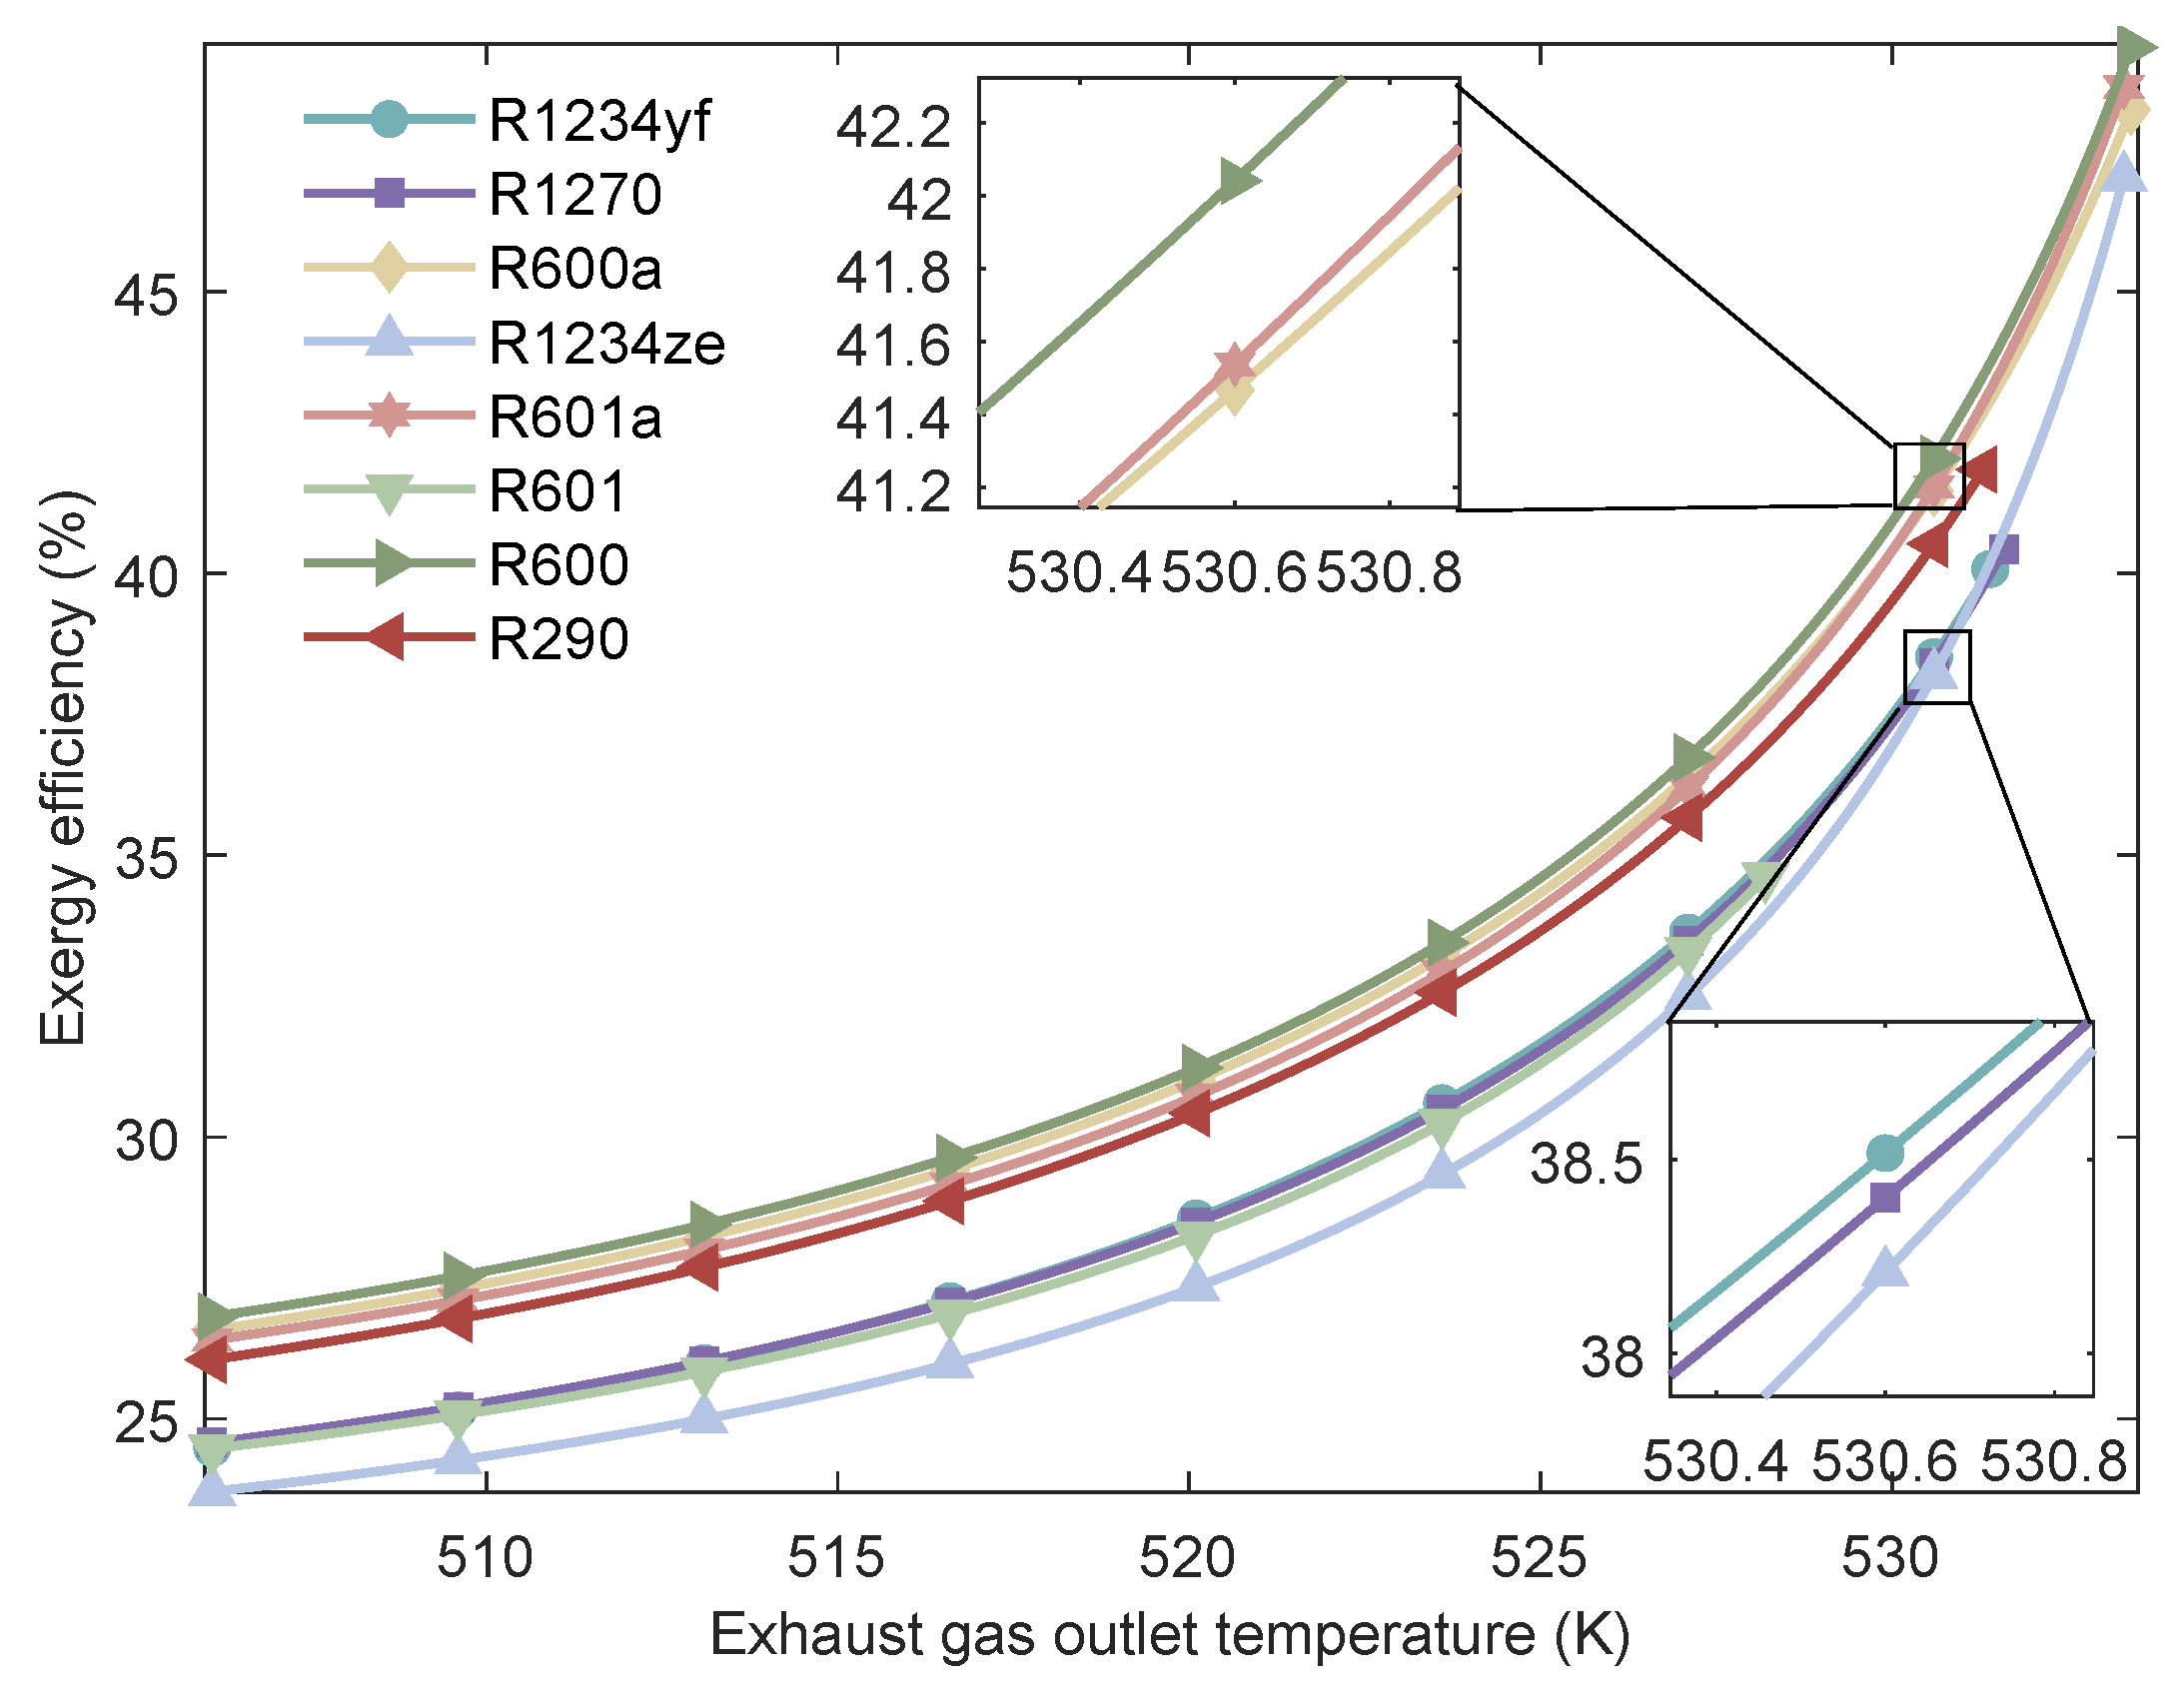
Figure 19.
Variation of of the MHSORC system with respect to the exhaust gas outlet temperature.
Figure 19.
Variation of of the MHSORC system with respect to the exhaust gas outlet temperature.
Figure 20.
Variation of the of MHSORC system with respect to the exhaust gas outlet temperature.
Figure 20.
Variation of the of MHSORC system with respect to the exhaust gas outlet temperature.
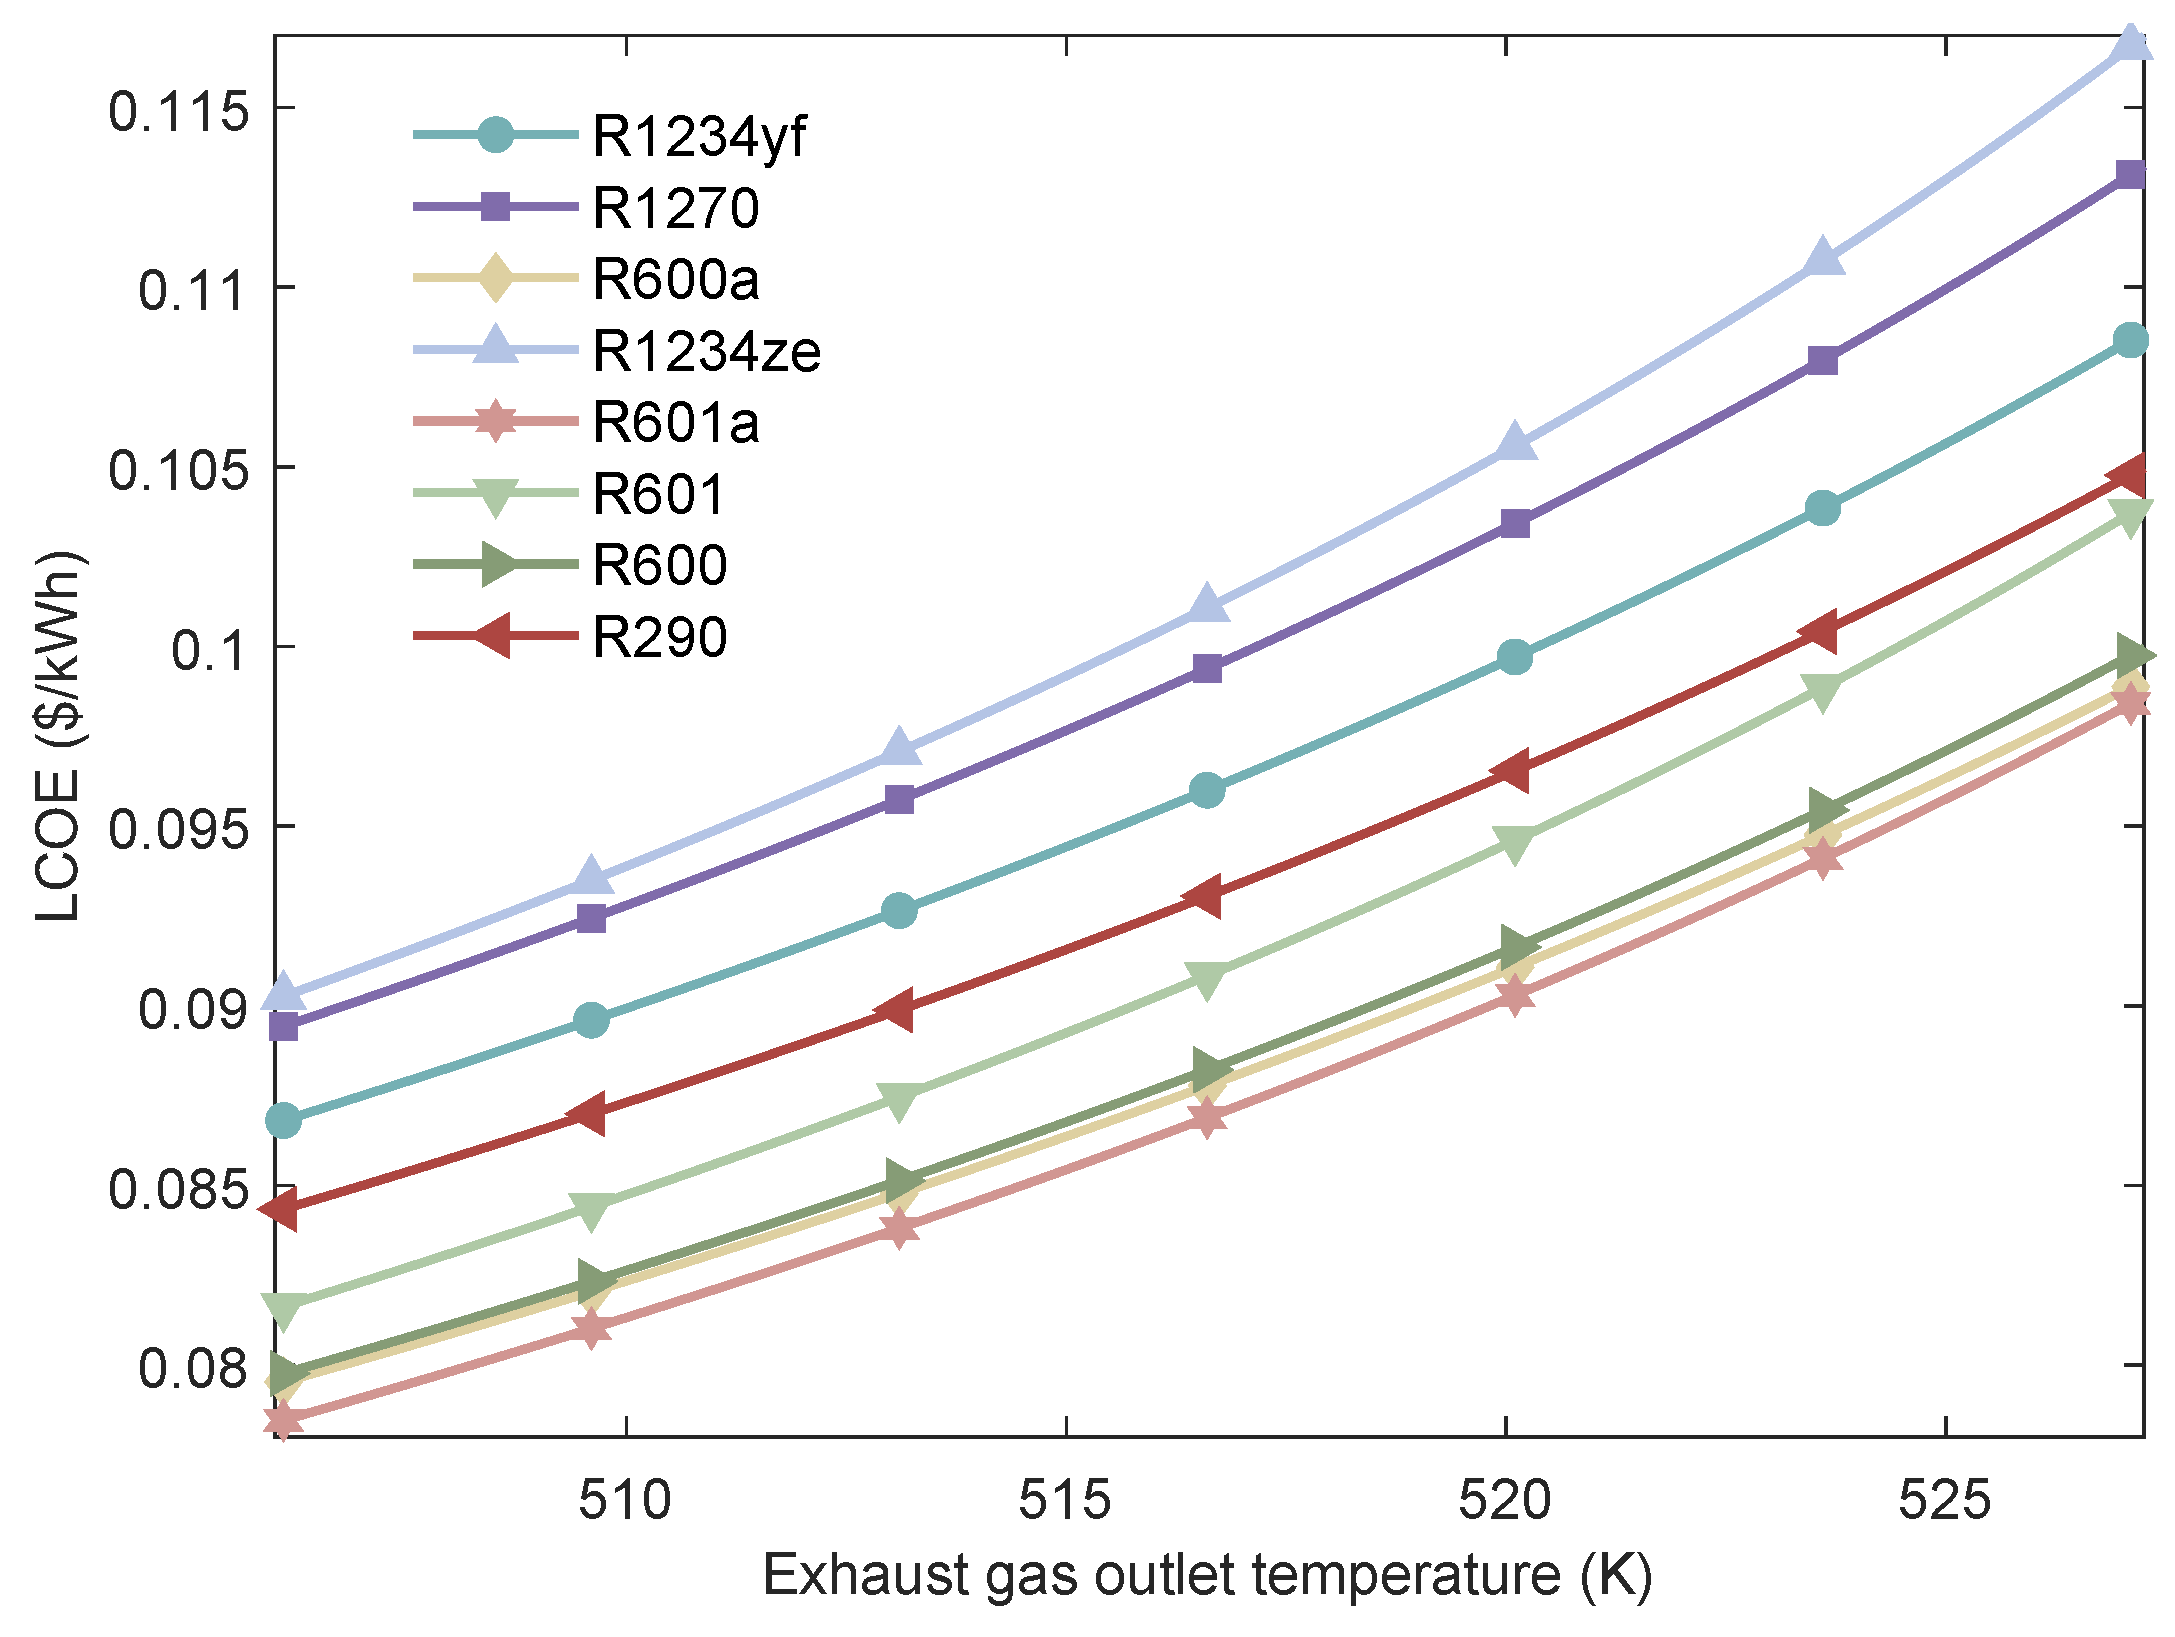
Figure 21.
Variation of the LCOE of MHSORC system with respect to the exhaust gas outlet temperature.
Figure 21.
Variation of the LCOE of MHSORC system with respect to the exhaust gas outlet temperature.
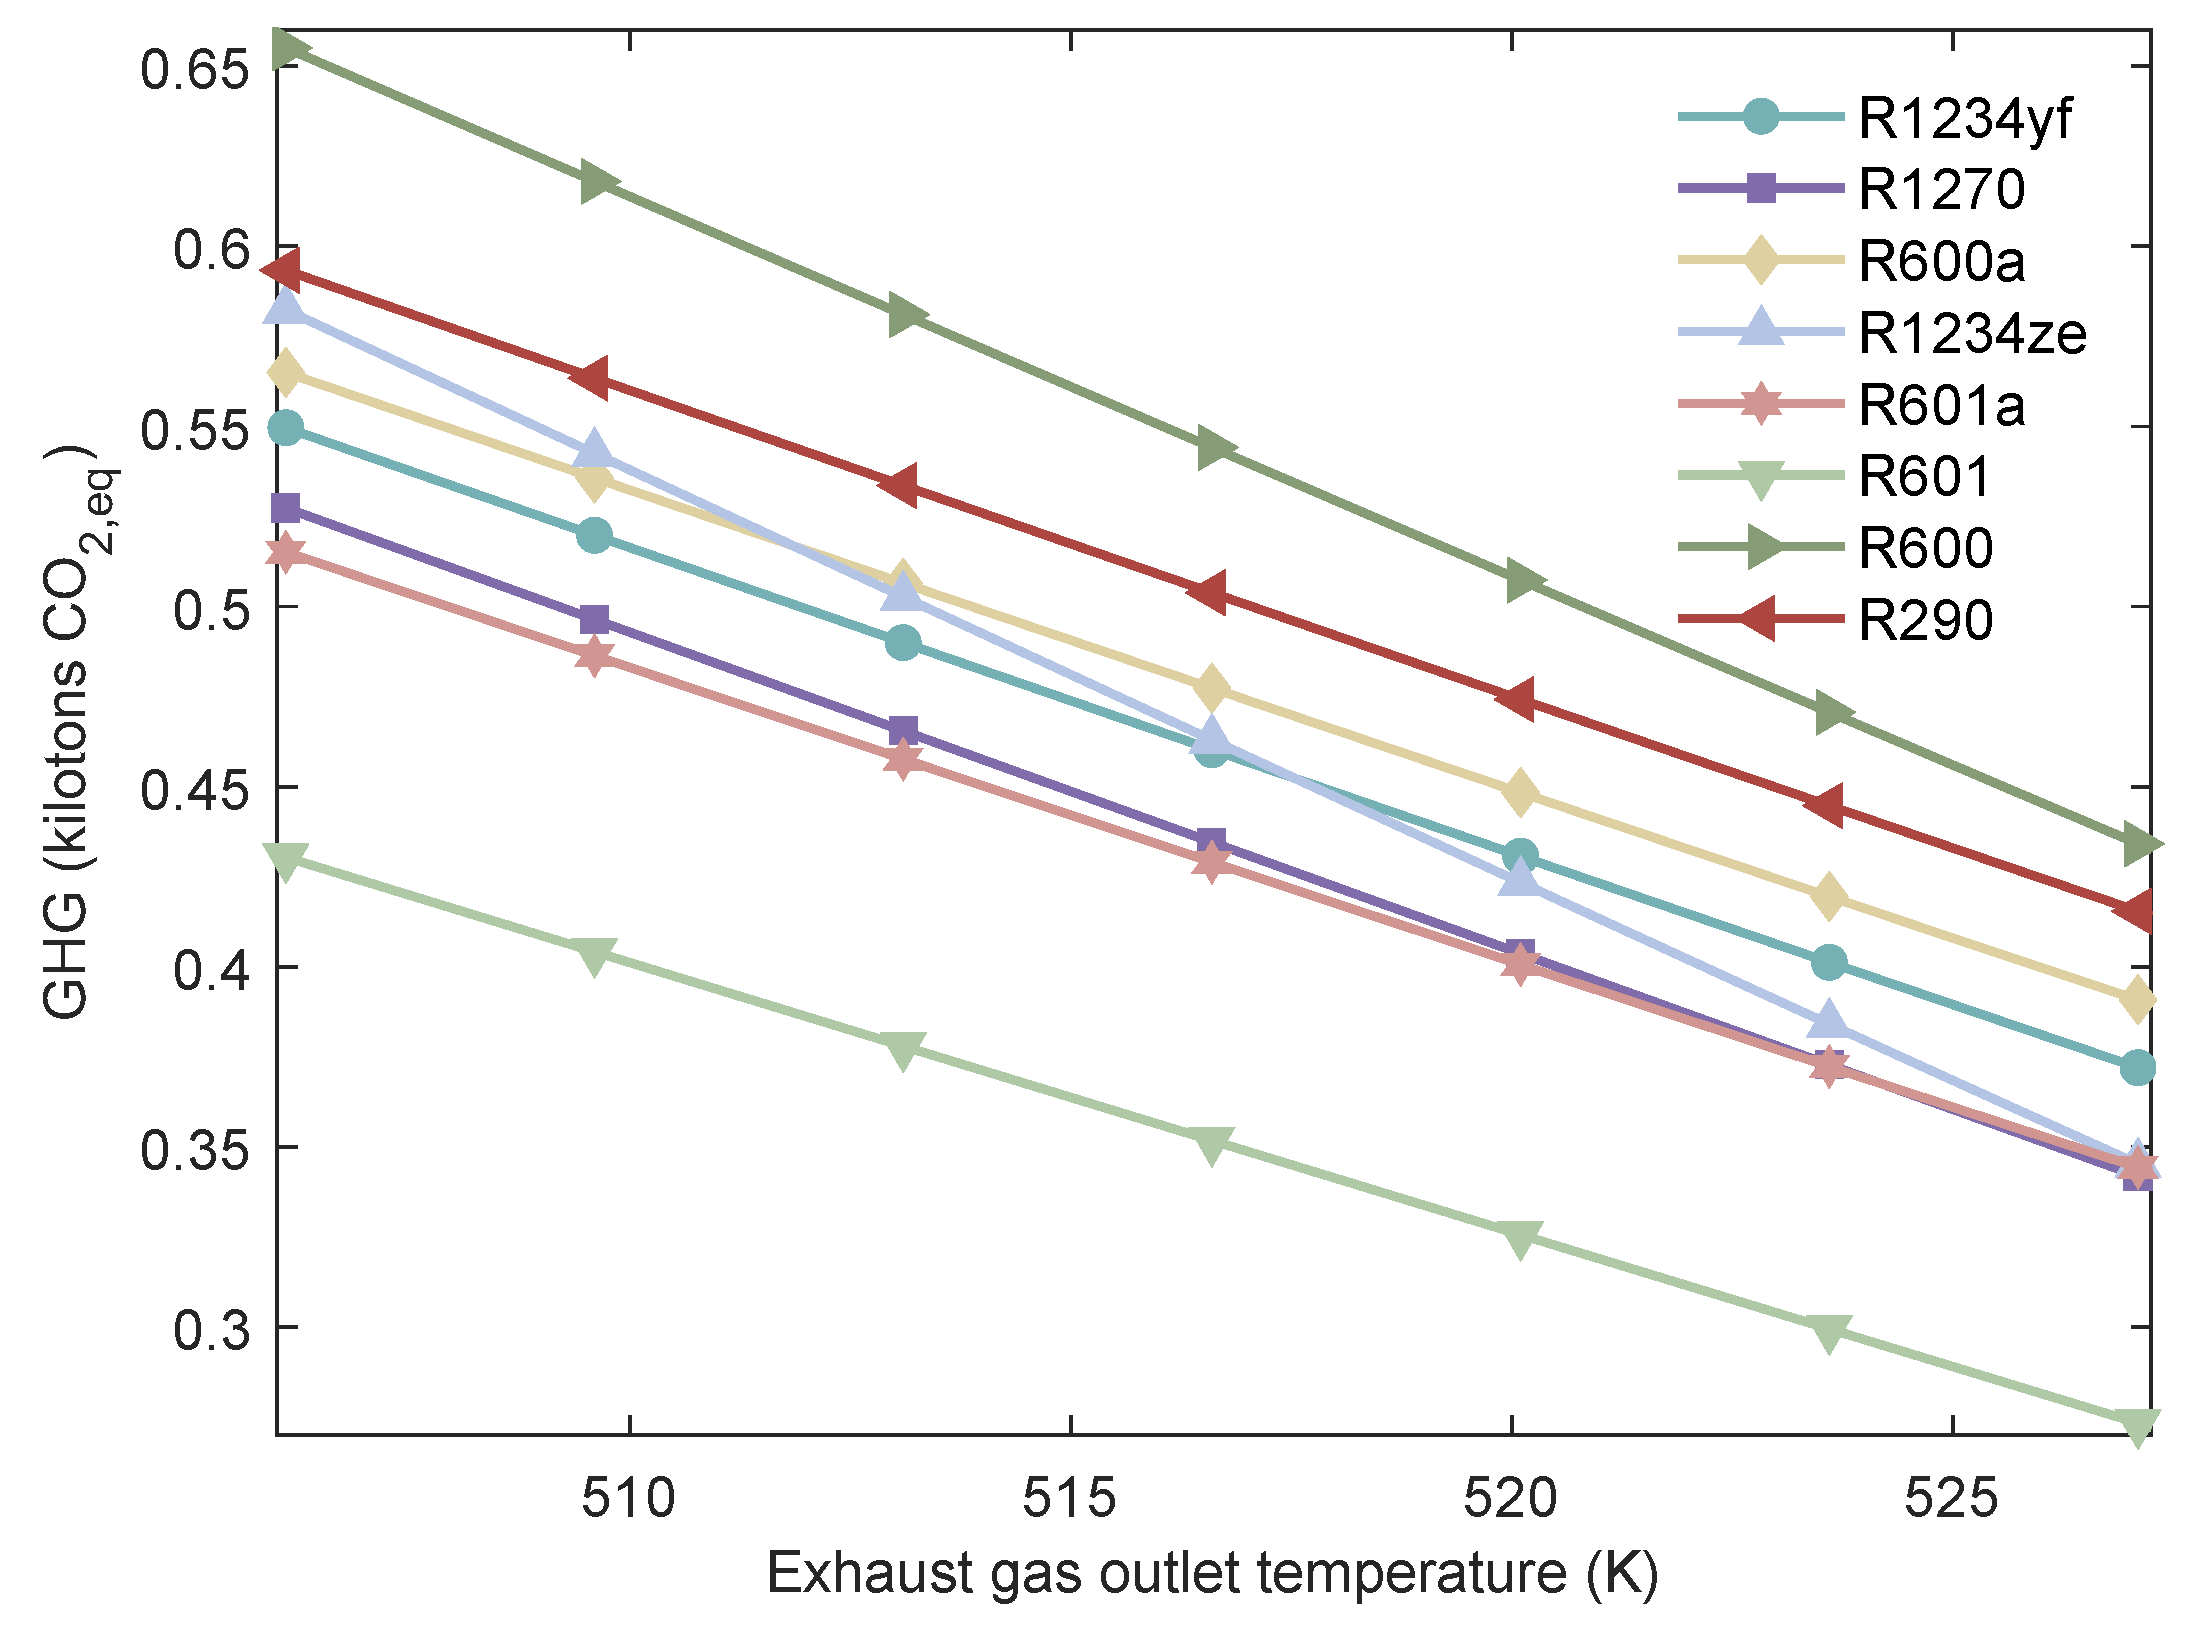
Figure 22.
Variation of the of MHSORC system with respect to the exhaust gas outlet temperature.
Figure 22.
Variation of the of MHSORC system with respect to the exhaust gas outlet temperature.
Figure 23.
Pareto frontiers of the MHSORC with various working fluids. (a) Pareto frontiers of MHSORC with R290. (b) Pareto frontiers of MHSORC with R1270. (c) Pareto frontiers of MHSORC with R1234ze. (d) Pareto frontiers of MHSORC with R21234yf. (e) Pareto frontiers of MHSORC with R600. (f) Pareto frontiers of MHSORC with R600a. (g) Pareto frontiers of MHSORC with R601. (h) Pareto frontiers of MHSORC with 601a.
Table 1.
The heat source parameters of the RT-flex96C large marine diesel engine under 85% load.
Table 1.
The heat source parameters of the RT-flex96C large marine diesel engine under 85% load.
| Heat Source | Exhaust Gas | Jacket Water | Intercooler Water | Unit |
|---|
| Mass flow rate | 173.0 | 182.5 | 190.6 | kg/s |
| Inlet temperature | 533.15 | 363.15 | 349.15 | K |
| Limiting outlet temperature | 406.15 | 346.15 | 319.15 | K |
Table 2.
The thermodynamic properties of the eight candidate working fluids.
Table 2.
The thermodynamic properties of the eight candidate working fluids.
| Working Fluid | Molar Mass (kg/kmol) | Critical Temperature (K) | Boiling Temperature (K) | ODP | GWP |
|---|
| R1234yf | 114.04 | 367.85 | 243.7 | 0 | 4 |
| R1270 | 42.08 | 364.21 | 320.95 | 0 | 2 |
| R600a | 58.122 | 407.81 | 261.4 | 0 | 20 |
| R1234ze (E) | 130.5 | 438.75 | 291.47 | 0 | 7 |
| R601 | 72.15 | 469.7 | 309.21 | 0 | 20 |
| R601a | 72.149 | 460.35 | 300.98 | 0 | 20 |
| R600 | 58.122 | 425.13 | 272.66 | 0 | 20 |
| R290 | 44.1 | 369.89 | 231.15 | 0 | 3 |
Table 3.
The heat transfer coefficients of the heat exchangers.
Table 3.
The heat transfer coefficients of the heat exchangers.
| Type | Side | Region | Coefficient Correlation |
|---|
| Plate heat exchanger | working fluid | single phase | |
| | | boiling | |
| | | film condensation | |
| | heat source | ~ | |
| Shell and tube exchanger | working fluid | single phase | |
| | | boiling | |
| | heat source | ~ | |
Table 4.
Empirical coefficients for module cost estimation equations.
Table 4.
Empirical coefficients for module cost estimation equations.
| Equipment Type | | | | | | | | | |
|---|
| Plate heat exchanger | 4.6561 | −0.2947 | 0.2207 | 0 | 0 | 0 | 0.96 | 1.21 | 1 |
| Shell and tube heat exchanger | 4.3247 | −0.3030 | 0.1634 | 0.0381 | −0.11272 | 0.08183 | 1.63 | 1.66 | 1.2 |
| Condenser | 4.6561 | −0.2947 | 0.2207 | 0 | 0 | 0 | 0.96 | 1.21 | 1 |
| Expander | 2.2476 | 1.4965 | −0.1618 | 0 | 0 | 0 | / | / | 3.8 |
| Working pump | 3.3892 | 0.0536 | 0.1538 | −0.3935 | 0.3957 | −0.00226 | 1.89 | 1.35 | 1.6 |
Table 5.
Emissions of materials during manufacturing and disposal processes.
Table 5.
Emissions of materials during manufacturing and disposal processes.
| Material | Emissions of Materials During Manufacturing | Emissions of Materials During Recycling |
|---|
| Aluminum | 0.54 | 0.07 |
| Copper | 0.63 | 0.07 |
| Steel | 2.46 | 0.07 |
| Plastics | 0.12 | 0.01 |
Table 6.
Information of the software used in this study.
Table 6.
Information of the software used in this study.
| Software | Version | Manufacturer | License Type | Primary Application in This Study |
|---|
| MATLAB | 9.10 | MathWorks Inc. Natick, MA, USA | Academic License | Development of thermodynamic and economic models; implementation of NSGA-II optimization; numerical simulation |
| CoolProp | 7.1.0 | Open-source | MIT Open License | Calculation of thermophysical properties of working fluids |
Table 7.
Comparison of the MHSORC model with previous research Ref. [
23].
Table 7.
Comparison of the MHSORC model with previous research Ref. [
23].
| Working Fluid | W (kW) | (%) | LOCE ($/kWh) | GHG (ton ) |
|---|
| R290 [23] | 87.83 | 53.02 | 0.0938 | 15.43 |
| R290 (Present) | 87.28 | 52.88 | 0.0931 | 15.43 |
| R1234yf [23] | 79.34 | 50.94 | 0.0951 | 27.76 |
| R1234yf (Present) | 79.01 | 50.68 | 0.0949 | 27.66 |
Table 8.
GRA -based ranking of the MHSORC with various working fluids.
Table 8.
GRA -based ranking of the MHSORC with various working fluids.
| Working Fluid | GRA |
|---|
| R601 | 0.4394 |
| R601a | 0.4164 |
| R600a | 0.3965 |
| R600 | 0.3686 |
| R290 | 0.2966 |
| R1270 | 0.2937 |
| R1234yf | 0.2893 |
| R1234ze | 0.2414 |
Table 9.
GRA-based ranking of the MHSORC with various working fluids.
Table 9.
GRA-based ranking of the MHSORC with various working fluids.
| Parameter | Value | Unit |
|---|
| 466.7 | K |
| 305.15 | K |
| 28.41 | K |
| 10.93 | K |
| 476.37 | K |
| 362.52 | K |
| 348.94 | K |
| 41.69 | % |
| 0.0495 | $/kWh |
| 0.8019 | kilotons |


