Article

A Visualized Simulation Study on the Mechanism of Foam-Assisted Gas Flooding in Fractured-Solution-Cavern Type Reservoirs

1
Science and Technology Department of China Petrochemical Corporation, Beijing 100728, China
2
School of Petroleum Engineering, Yangtze University, Wuhan 430100, China
3
State Key Laboratory of Low Carbon Catalysis and Carbon Dioxide Utilization, Yangtze University, Wuhan 430100, China
*
Author to whom correspondence should be addressed.
Processes 2025, 13(11), 3642; https://doi.org/10.3390/pr13113642
Submission received: 16 September 2025 / Revised: 17 October 2025 / Accepted: 10 November 2025 / Published: 10 November 2025
(This article belongs to the Section Energy Systems)

Abstract

Fractured-vuggy carbonate reservoirs primarily have pores and caves as their main storage spaces with poor fracture development, resulting in low reservoir connectivity and strong heterogeneity. During nitrogen injection developments, the fluidity of the medium is poor, and gas tends to form dominant flow channels, leading to a short response time. Consequently, the displacement of crude oil in such reservoirs is limited, leaving a large proportion of residual oil trapped within the pore and vug systems. Based on the Tarim fractured-vuggy carbonate reservoir, a two-dimensional visualized physical model of the fractured-vuggy body was designed and constructed to conduct a foam-assisted gas displacement physical experiment. The research shows that foam has good oil recovery efficiency and dominant channel-blocking ability, which can effectively mobilize the residual oil in the fractures and vugs after gas displacement. In the vertical direction, the foam-assisted gas flooding mechanism primarily involves gravity segregation and interfacial tension reduction between oil and water; horizontally, it operates by selectively blocking large fractures and main channels, redirecting gas into smaller and more tortuous pathways, thus enhancing overall sweep efficiency. Once dominant flow channels develop, injecting salt-sensitive foam at a 2:1 gas–liquid ratio and 0.3 pore volume can raise the recovery factor from around 3% to nearly 19%, representing an improvement of about 16%, thereby boosting both gas flooding performance and overall field development efficiency.

1. Introduction

Carbonate formations constitute a major component of global unconventional hydrocarbon resources, representing approximately 60% of worldwide oil and gas reserves [1,2]. In China, such reservoirs are predominantly distributed across the Tarim, Sichuan, and Ordos Basins, as well as the North China area, among which the Tarim fractured-vuggy carbonate system is globally recognized as the area’s largest accumulation of carbonate oil and gas [3,4].The development of such reservoirs is crucial for the replacement of China’s oil and gas resources. The storage framework of fractured-vuggy carbonate reservoirs mainly consists of interconnected pores, vugs, and fractures that exhibit pronounced heterogeneity [1]. Considerable variations exist in both the scale of the fractured-vuggy systems and the regularity of their interconnections. The pronounced spatial heterogeneity of fractured-vuggy carbonate reservoirs leads to substantial challenges in their development, often resulting in inefficient recovery from fracture–cave systems [5].
In the early stages of the Tarim oilfield’s development, water flooding was the primary method used; however, as the water injection period increased, the water cut rose, and oil production declined. Subsequently, nitrogen injection was implemented to recover the remaining oil, but owing to pronounced reservoir heterogeneity and large fluid mobility contrast, injected gas easily established preferential flow pathways, causing gas coning and resulting in only a marginal enhancement of recovery. The gas injection production curve is shown in Figure 1.
Foam has excellent channel-blocking capabilities and can block dominant flow channels during the displacement process, thereby expanding the sweep volume and effectively increasing the recovery factor. Yang et al. [6] revealed that within a regular slit-hole network, gel foam adheres to and seals the openings, thereby guiding the upward migration of gas and enhancing the co-driving recovery of residual oil. In systems containing both fractures and irregular cavities, the foam—owing to its density and mobility—propagates downward and laterally along the fracture paths, facilitating the displacement of crude oil and formation water toward production wells. Youssif et al. [7] noted that foam-assisted gas injection technology can significantly enhance oil sweep efficiency in fractured carbonate reservoirs by improving gas mobility and controlling fluid flow direction. Fu et al. [8] demonstrated that a novel ultra-low interfacial tension DES-CTAB composite foam system performs excellently in heavy oil recovery, and its nitrogen foam-assisted steam flooding can substantially increase the overall recovery rate by 44.9% by altering the occurrence state of residual oil. Tuoliang et al. [9] reported that fluctuations at the oil–water and gas–oil interfaces positively influence recovery in fractured–porous reservoirs. The addition of foam during the nitrogen injection process stabilizes gas flow, intensifies interfacial fluctuation behavior, and consequently raises the recovery efficiency. Wen et al. [10] found that gel foam demonstrates superior flow control and high microscopic displacement efficiency, enabling multidirectional sweeping at nearly uniform velocities. The principal enhanced oil recovery mechanisms of gel foam in crevice–porosity reservoirs include lowering interfacial tension, improving fluid mobility, selectively blocking high-permeability channels, and inducing discontinuous flow behavior. Wen et al. [11] reviewed the performance of micro-dispersed gel foam in fractured carbonate systems, concluding that its application intensifies gas drive efficiency and expands the area of effective oil displacement. Feng Yao et al. [12] conducted a numerical simulation study on CO2 foam-assisted gas flooding in tight reservoirs. The results demonstrate that CO2 foam flooding significantly enhances oil recovery and gas control under various reservoir conditions. Compared to Water-Alternating Gas (WAG) and continuous gas injections, Surfactant-Alternating Gas (SAG) more effectively delays gas breakthrough, reduces the gas–oil ratio (GOR), and improves the mobilization of residual oil. It performs well in tight, vertically and laterally heterogeneous, and fractured reservoirs, particularly those dominated by vertical fractures.
Therefore, based on the selective plugging performance of foam, this study focuses on addressing the gas channeling issue in the Tarim Basin by conducting research on foam-assisted gas flooding. The aim of the study is to extend the effective duration of gas injection, enhance the overall recovery efficiency of the oilfield, and increase the economic benefits of gas injection.

2. Materials and Methods

2.1. Two-Dimensional Visualization Model

The reservoir is buried at depths between 5300 and 7000 m, with formation temperatures ranging from 120 to 150 °C. The formation water exhibits a total salinity of about 220,000 mg/L, containing roughly 10,000 mg/L of calcium and magnesium ions, characteristic of a high-salinity CaCl2-type brine. The reservoir pore system is mainly composed of dissolution vugs and interconnected fractures. The distribution of oil and water phases is highly irregular, and a distinct oil–water interface cannot be clearly identified. The average porosity of the reservoir is approximately 0.76%, and the mean permeability is about 2.59 × 10⁻³ μm2.
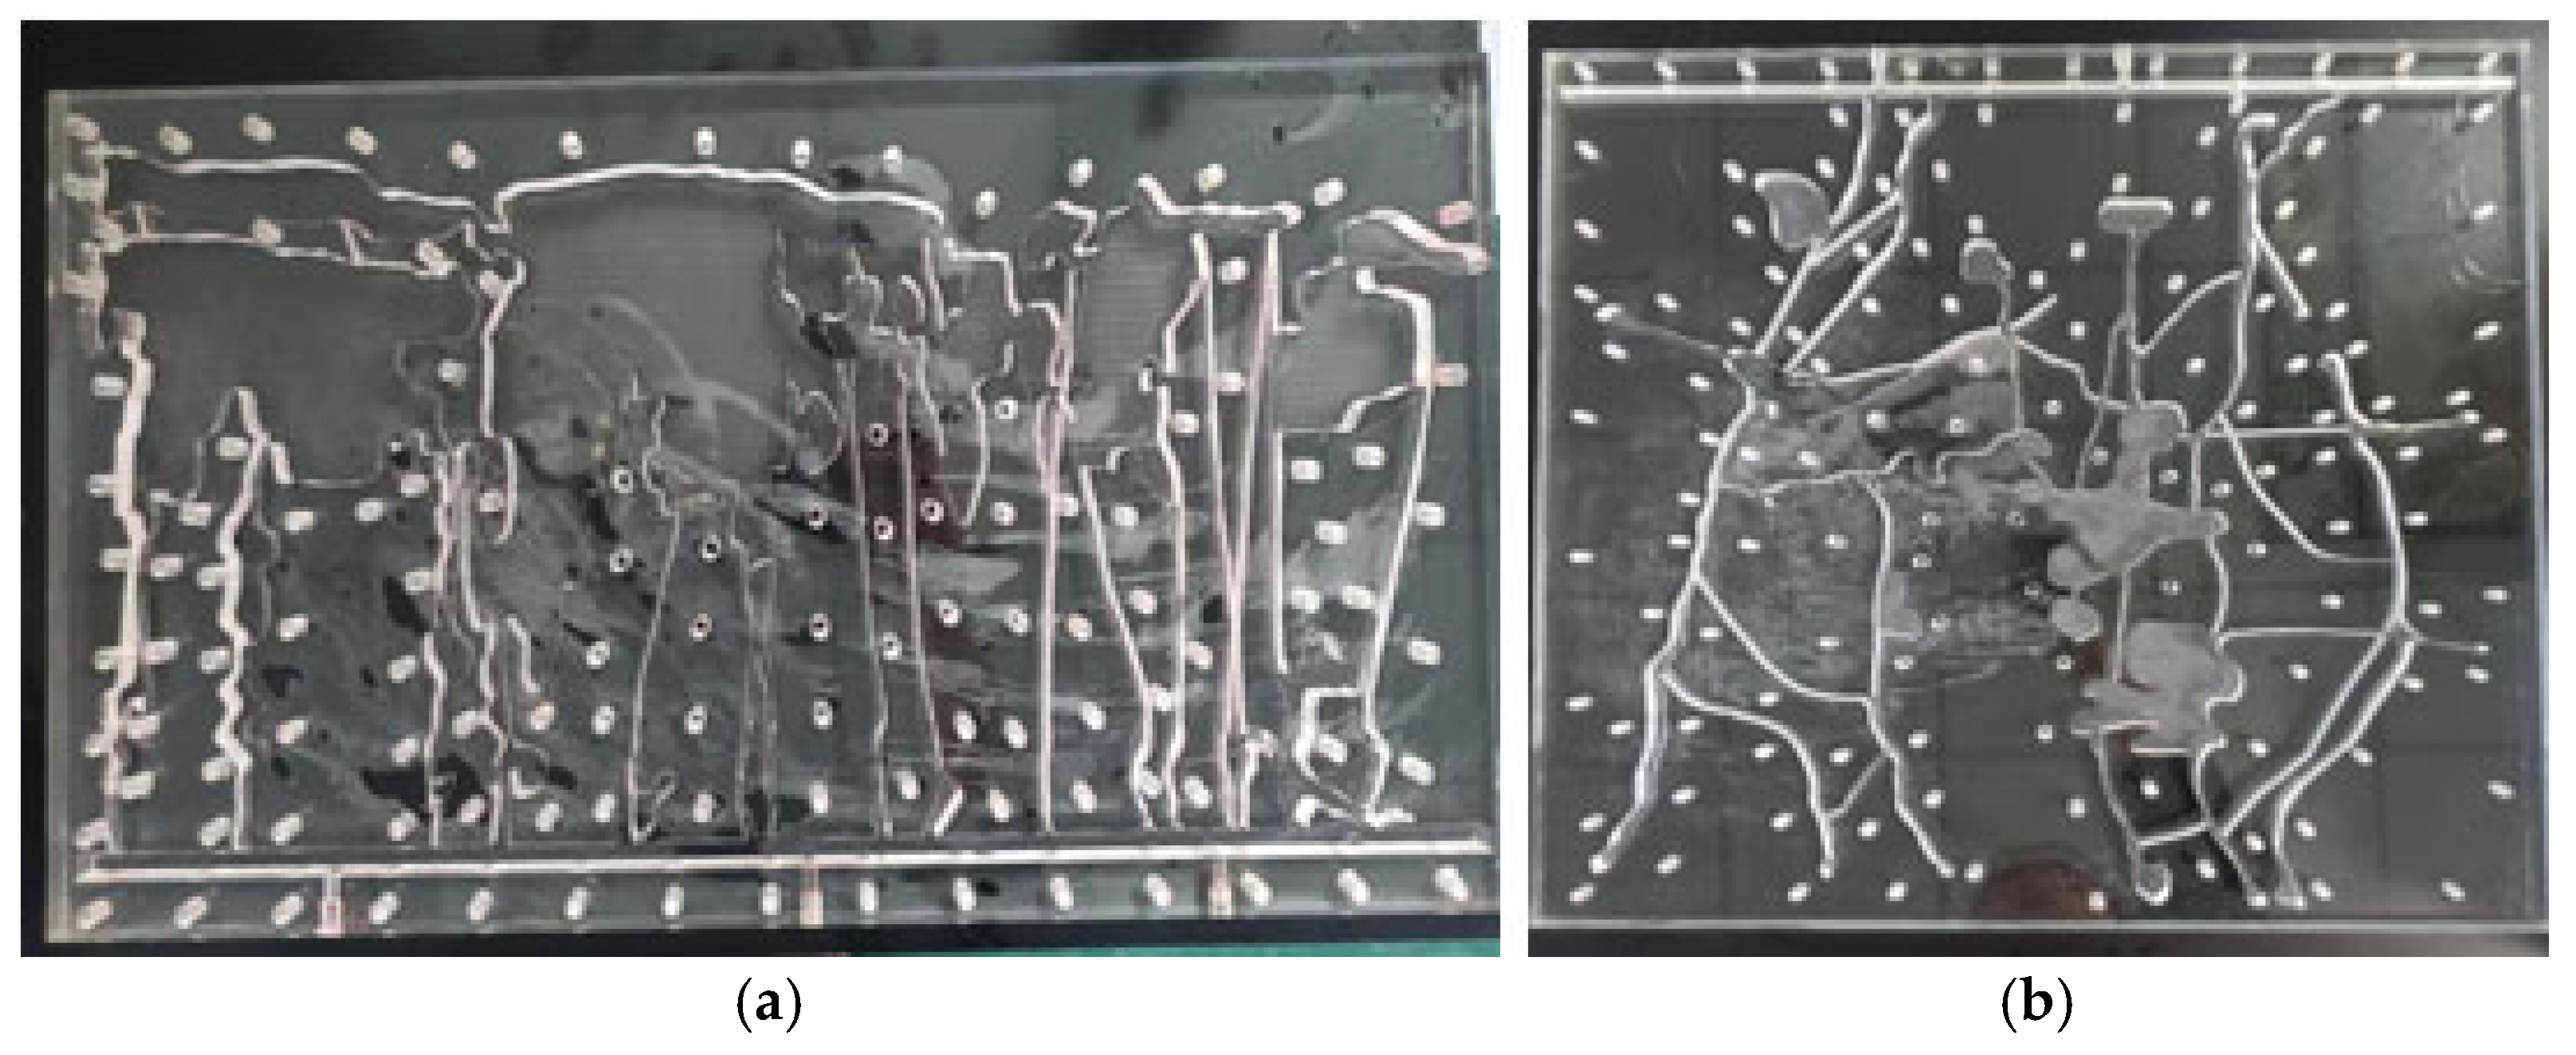
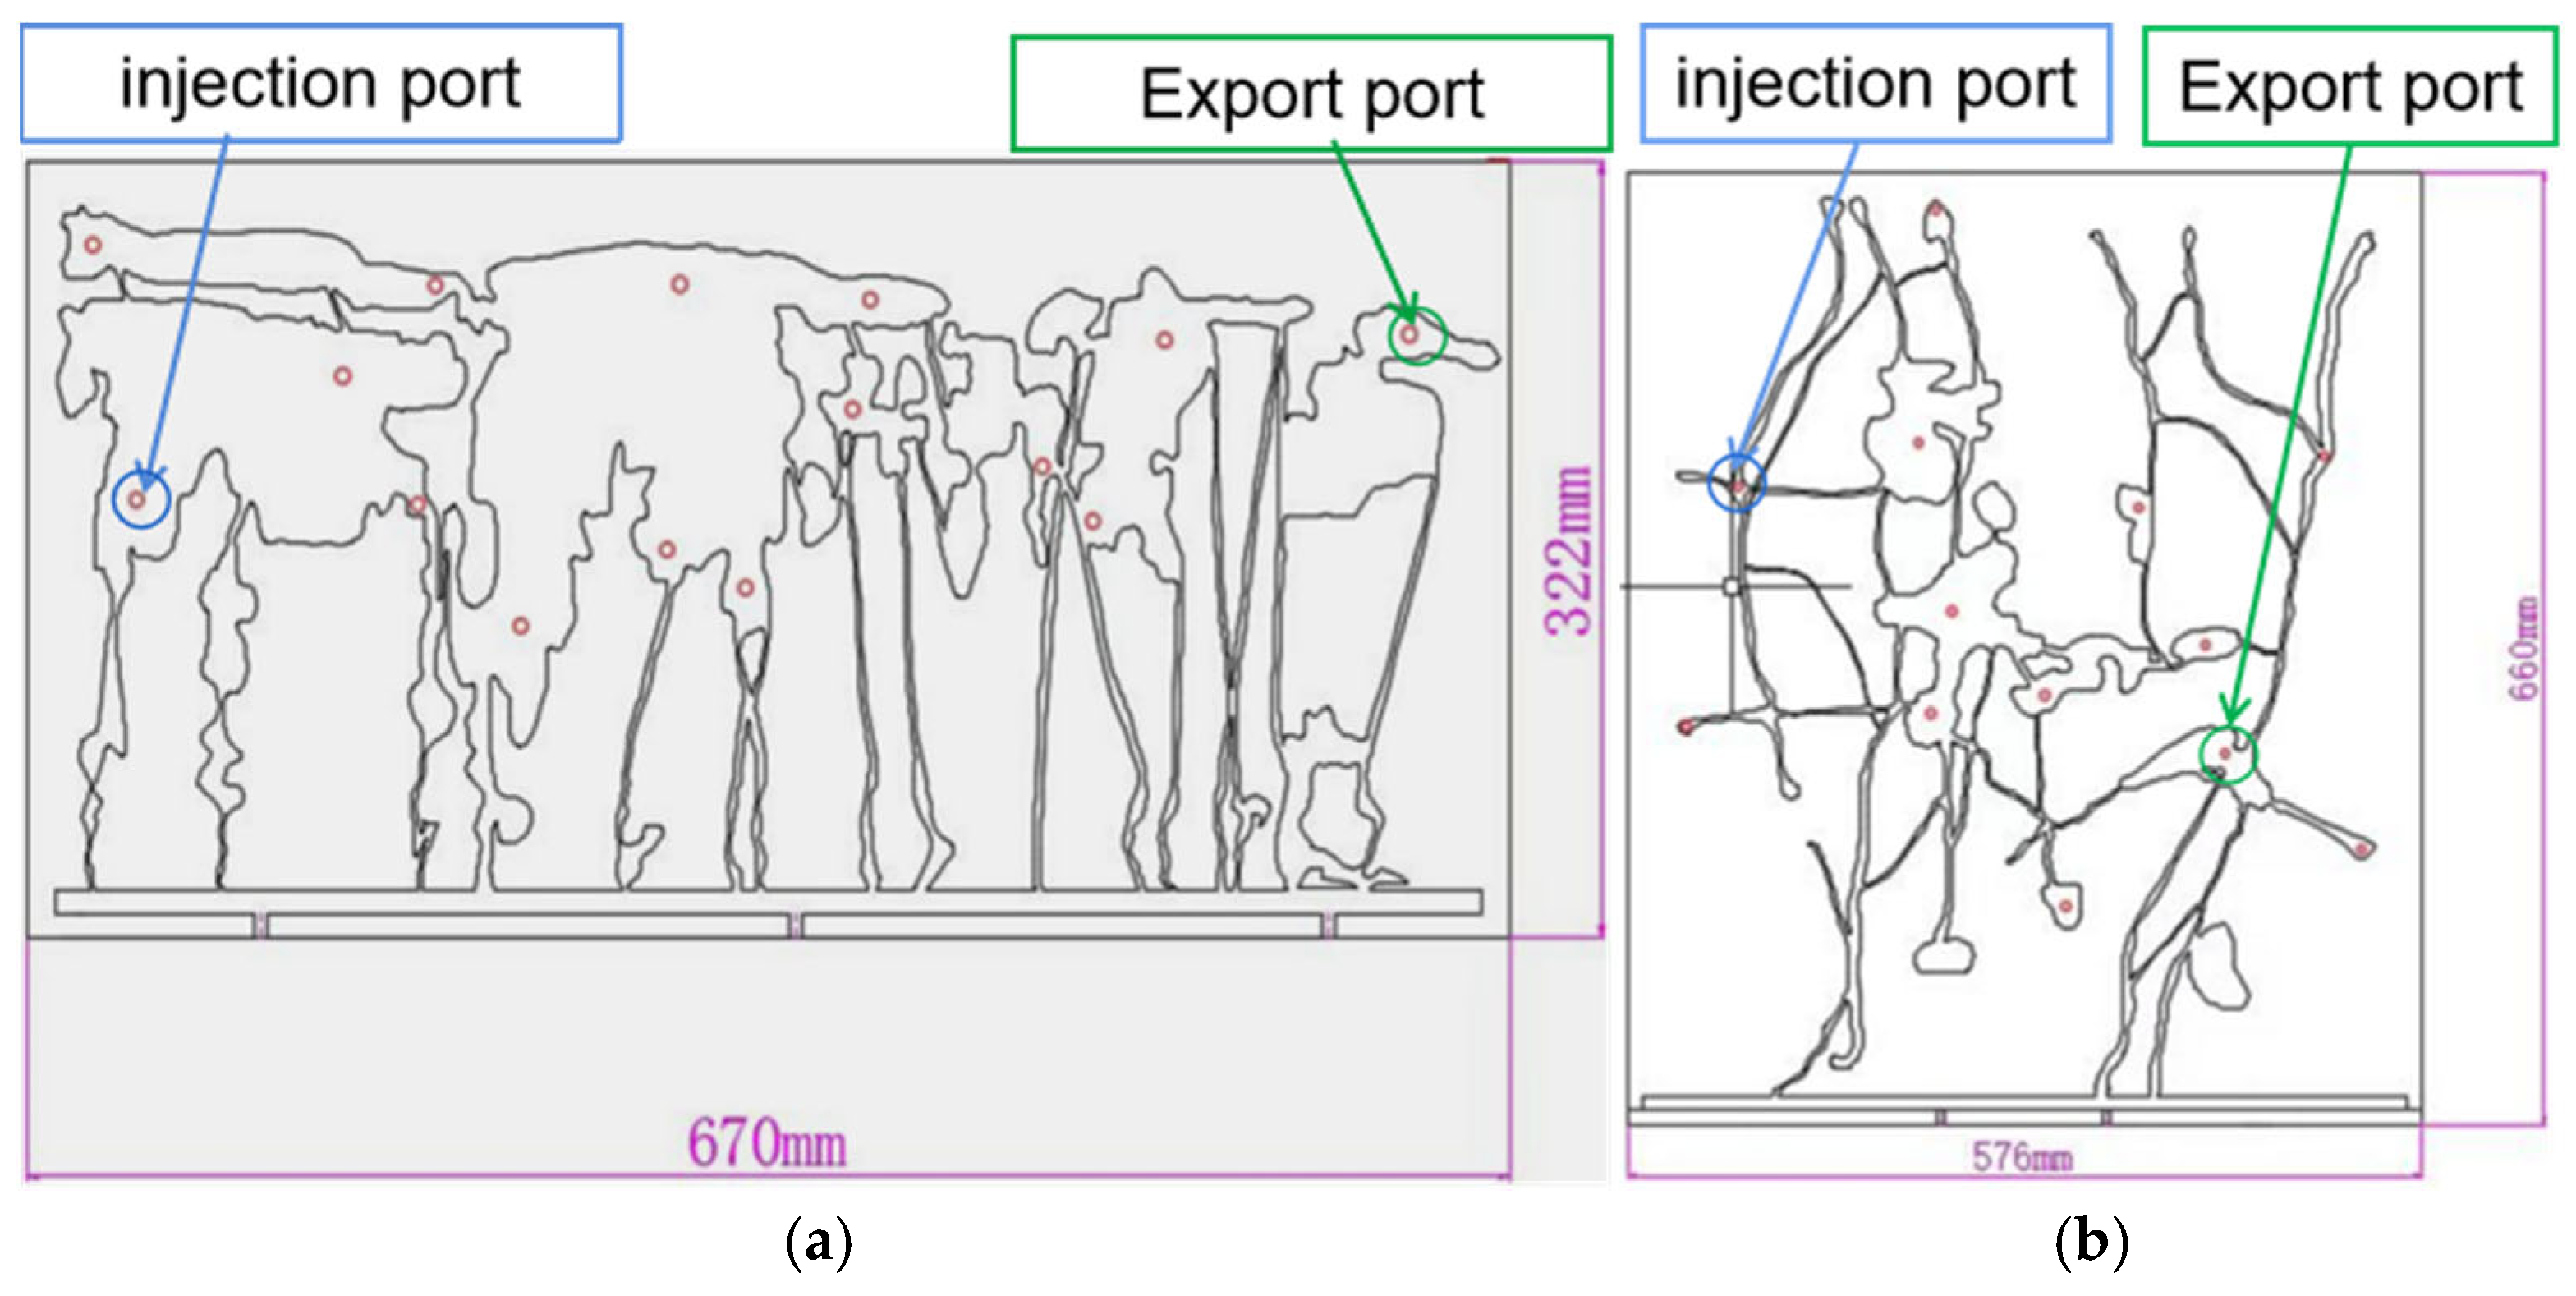
Considering the representative fracture structures and vug–fracture assemblages of the Tarim oilfield, a two-dimensional visualization model of a fractured-vuggy system was designed and constructed following a set of similarity criteria, as illustrated in Figure 2 and Figure 3. Guided by the principle of flow similarity, the fluid mobility under experimental conditions was ensured to be essentially similar to that under reservoir conditions. After calculations, the fracture aperture in the model was designed to range from 0.5 to 2 mm. The vertical model, representing the reservoir’s longitudinal section, measures 670 × 322 mm with a total volume of 880 mL, while the horizontal (transverse) model has dimensions of 576 × 660 mm and a total volume of 780 mL. The physical model was fabricated from acrylic sheets, comprising an etched flow plate and a sealing cover plate. Due to the relatively low compressive strength of acrylic plates, the experiment was conducted under normal pressure. Similar criteria were used to convert the experimental parameters in order to simulate the actual reservoir.

2.2. Experimental Materials and Equipment

The experimental parameters were established according to similarity principles to ensure that the test results closely reflected the behavior observed under actual reservoir conditions. The water employed in the fractured-vuggy visualization experiments was a self-prepared synthetic formation brine, possessing a total salinity of about 2.2 × 10⁵ mg/L and containing approximately 1 × 10⁴ mg/L of calcium and magnesium ions. This brine represents a high-salinity CaCl2-type solution, which was colored with methyl blue dye for visual observation. The experimental oil is stained using Sudan III reagent. The injection method is a single injection followed by a single production. All experiments were performed at a controlled ambient temperature of 25 °C. The primary experimental measurement focused on quantifying the displaced oil volume. Foam was prepared by combining nitrogen gas, foaming and stabilizing agents, and the synthetic formation water through a foam generation unit. As illustrated in Figure 4, the overall experimental apparatus comprised three subsystems: the fractured-vuggy visualization model assembly, the experimental control module, and the video monitoring and data acquisition unit. The visualization system for the fractured-vuggy model included a supporting frame and the transparent model itself. The experimental control system includes a displacement pump (liquid flow rate 0.01 to 9.99 mL/min), nitrogen gas cylinder, six-way valve, intermediate container (maximum pressure tolerance 50 MPa), gas flow meter, and foam generator. The video monitoring and data acquisition system includes a computer with image processing software (2018 version), a produced fluid metering device, and a high-definition camera (maximum resolution 1080p).

2.3. Experimental Procedure

① Construct the model according to specifications and verify its sealing integrity. After confirming the seal, saturate the model with dyed water and oil, carefully measuring and recording the volumes of both saturated oil and water. ② Position the saturated model on the holder and firmly fix it in place. Subsequently, connect the pipelines following the designed experimental procedure. ③ Activate the gas cylinder and monitor the gas flow rate. When the target injection flow rate is achieved, perform the initial gas displacement test, documenting the oil volume produced until only gas is observed at the outlet, signaling the end of this phase. ④ Pour the prepared foaming solution into the intermediate tank and deliver it to the foam generator via the displacement pump to produce foam. Inject the calculated volume of foam into the model as specified by the experiment, and record the resulting oil production. ⑤ Reopen the gas cylinder, regulate the gas flow rate, and start the secondary gas injection when the preset rate is attained. Track the oil output at the outlet until gas breakthrough without oil production occurs, marking the experiment’s completion. ⑥ After collecting the experimental data, organize and calculate the recovery factor, defined as the ratio of recovered oil volume to the initial oil volume in the model. (Cumulative recovery is shown in the figure, while incremental recovery per stage is listed in the table.)

3. Results and Discussion

3.1. Foam-Assisted Gas Drive Mechanism

(1) Density difference, gravity impact, and displacement of loft oil (oil located at the upper section of the formation) [10]: In vertically stratified reservoirs, the notable density contrast causes gas to accumulate at the top due to gravity segregation, creating an “oil cap” that helps recover high-pressure crude oil, often called “balcony oil.” However, a large disparity in flow velocities exists between gas and oil phases. The high mobility of gas results in viscous fingering and preferential gas migration paths (Figure 5a), which reduce displacement efficiency and cause considerable residual oil to remain centrally. Subsequently, foam-assisted gas displacement technology was introduced. Due to its lower density, the foam system accumulates in the central area of the reservoir under the influence of gravity, increasing the gas sweep volume. At the same time, the presence of foam enhances the apparent viscosity of the displacement phase, slows down gas surging, and enables the effective exploitation of the remaining oil in the central area, as shown in Figure 5b.
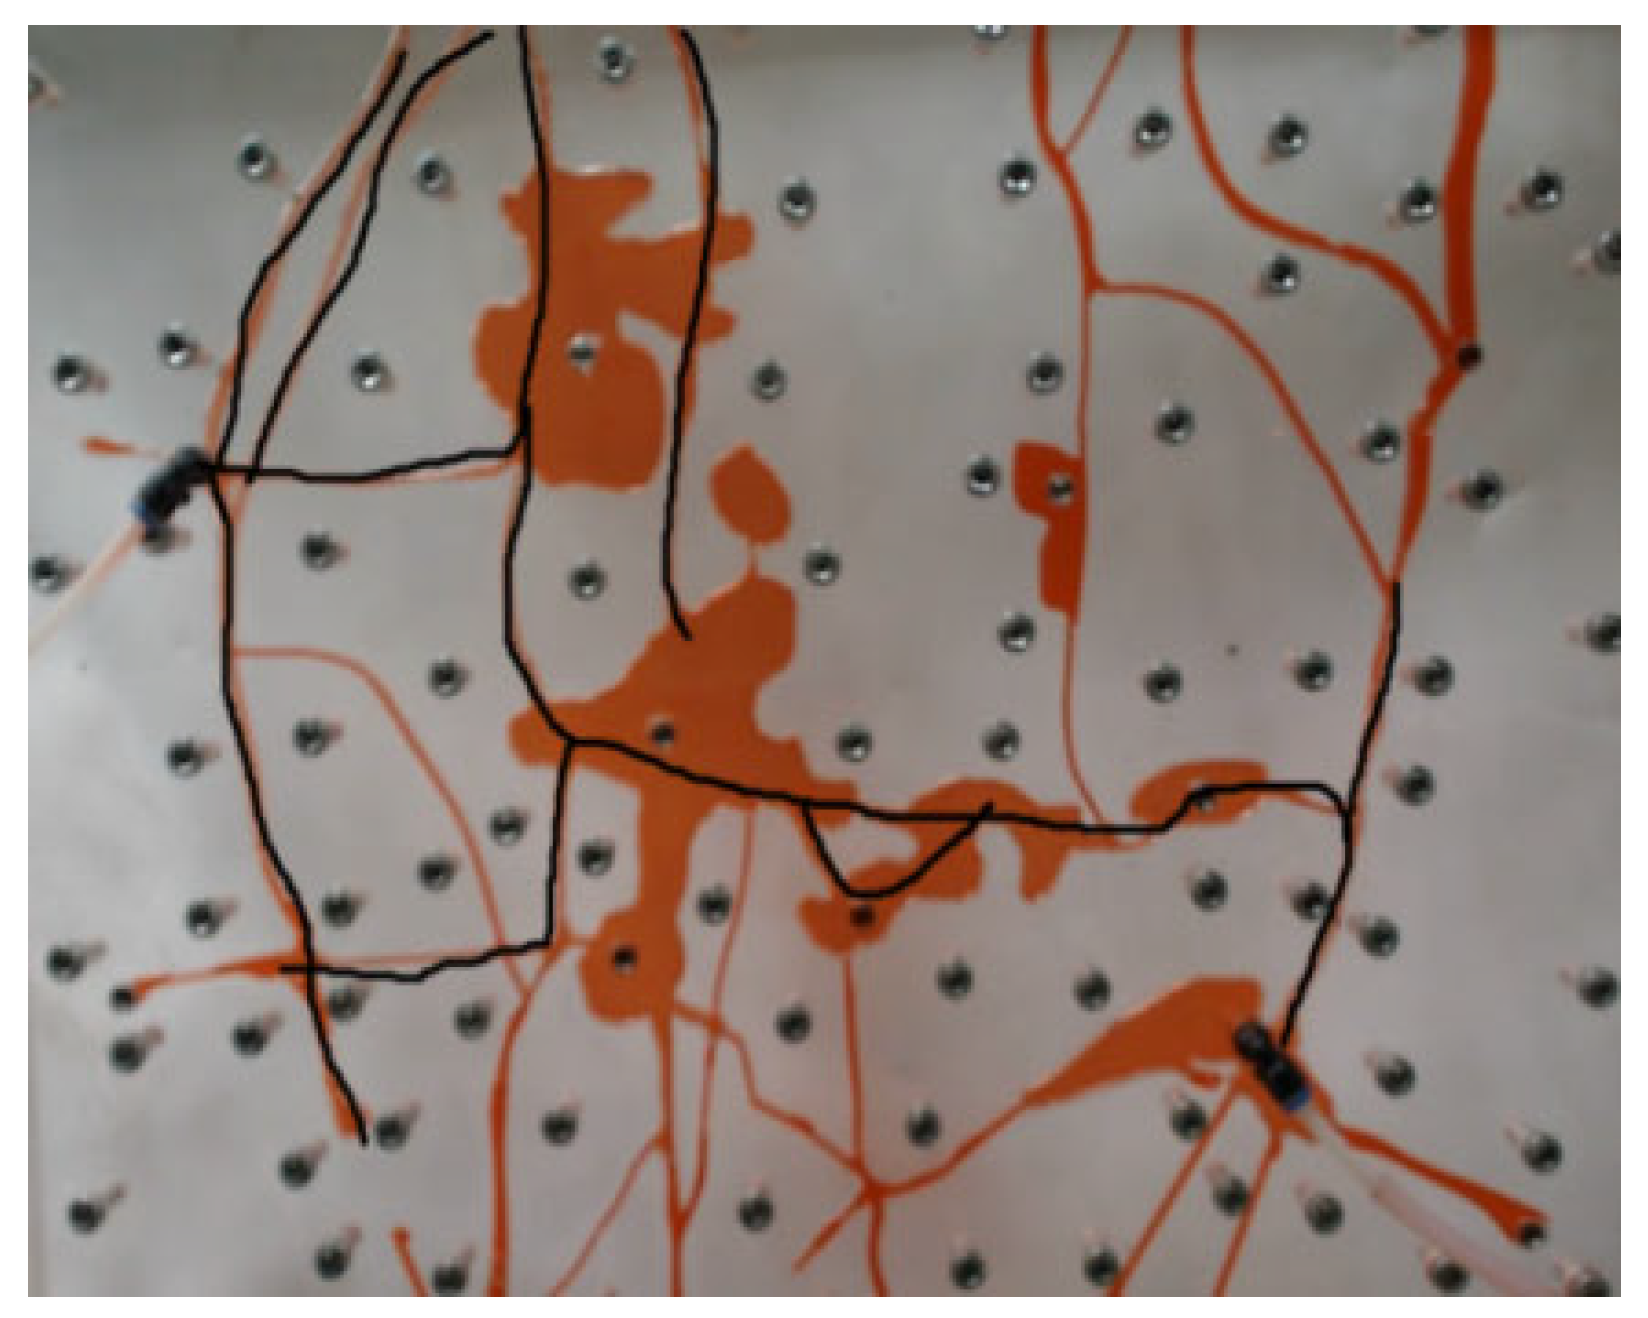
(2) Gas diffusion and flow path selection [10]: In the horizontal fracture model, gas displacement demonstrates a pronounced path preference. Driven by pressure gradients, the gas tends to move along the route offering the least resistance, rapidly passing through the model and creating a primary flow channel. During the early displacement phase, the gas initially pushes out residual oil located near the model’s surface. This process is mainly controlled by interfacial tension and displacement pressure. As the displacement progresses, the gas gradually invades the internal fracture network of the model. Its migration behavior is strictly controlled by the fracture structure: the gas first enters the main trunk fractures with larger openings and better connectivity; subsequently, under the action of the pressure gradient, it successively enters the secondary fractures with lower curvatures and smaller tortuosity, thereby exploiting the remaining oil in the internal multi-scale fracture network. The migration path and the dynamic evolution process of the displacement front are represented by the black line in Figure 6. With the ongoing rise in gas injection volume, the gas progressively forms a continuous flow channel within the fracture network, directing flow toward the production outlet. Eventually, the gas prematurely breaks through to the bottom of the production well, resulting in gas coning. This phenomenon greatly decreases gas sweep efficiency and oil recovery effectiveness, while causing a substantial rise in the produced gas–oil ratio, which severely impacts the economic feasibility of the project. This phenomenon reveals that when implementing gas flooding in fractured reservoirs, controlling flow rate and adjusting the suction profile are crucial for improving recovery rate.
(3) The Jamin effect and gas steering [10]: During the process of foam-assisted gas displacement, the foam significantly improves the displacement effect through its unique “Jamin effect”. This effect stems from the microscopic interactions of the gas–liquid interface in porous media: when the foam liquid film enters narrow pores, it will form a curved liquid surface at both ends with a high capillary force, generating additional resistance, thereby effectively blocking the high-permeability advantageous channels formed by the gas in the early stage.
This blocking effect forces the subsequent injected gas to change its migration path, no longer escaping along the original large channels, but instead entering the medium- and low-permeability areas and tiny pores that were not previously affected within the model. As shown in Figure 7 by the yellow lines, the wavefront of the gas expands, the displacement efficiency significantly increases, and more residual oil is effectively displaced.
As the displacement process continues, under the combined effects of foam plugging and gas driving force, the gas further invades and expands the micro-crack system. As shown in Figure 7 by the blue lines, the temporary plugging effect of the foam causes the fluid pressure to be redistributed, driving the gas into the micro-cracks with larger curvatures and smaller openings, thereby mobilizing and displacing the residual oil present within them, significantly improving the microscopic and macroscopic oil displacement effects.

3.2. Optimization of Foam Injection Parameters

3.2.1. Vertical Model

(1)
Foam Type Optimization
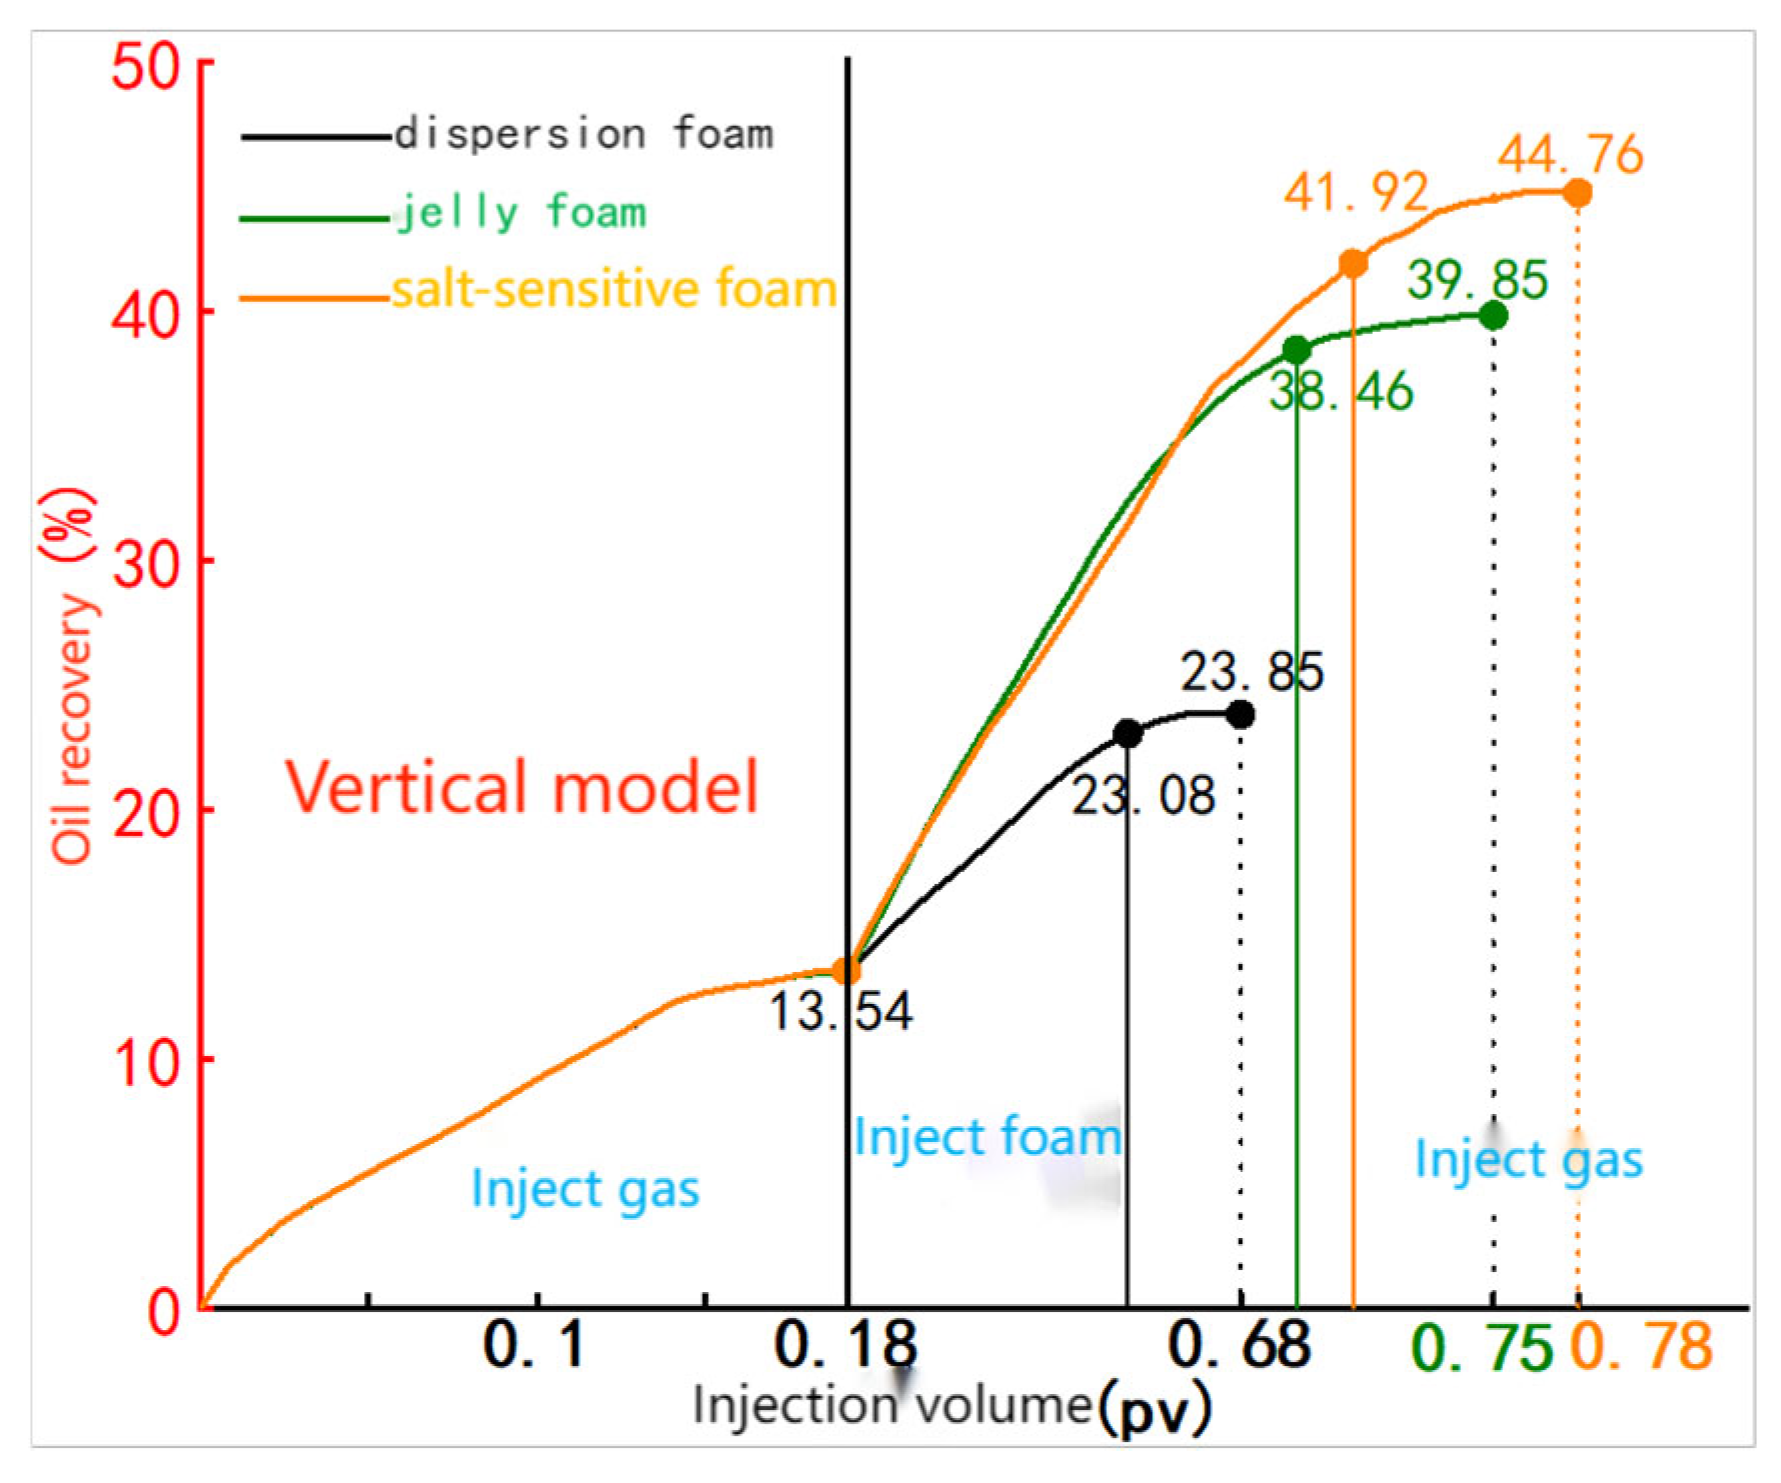
This research examines how various foam types influence foam-assisted gas displacement following gas coning, by applying an injection volume of 0.4 PV with a gas-to-liquid ratio of 3:1. The results are detailed in Table 1 and Figure 8.
Foam stability tests show that the half-life of dispersed foam is 8 min; gel foam has a half-life of 500 min; and salt-sensitive foam demonstrates a half-life of 10 days.
Experimental results indicate that among dispersed foam, gel foam, and salt-sensitive foam, salt-sensitive foam achieves the highest recovery factor in foam-assisted gas displacement. This is mainly due to its longer half-life and better resistance to defoaming compared to gel and dispersed foams. Once introduced into the model, this foam maintains greater stability and mobilizes more residual oil.
Therefore, when gas injection alone is insufficient to enhance recovery, using salt-sensitive foam for assisted displacement yields the most favorable economic benefits.
(2)
Optimization of Foam Injection Volume
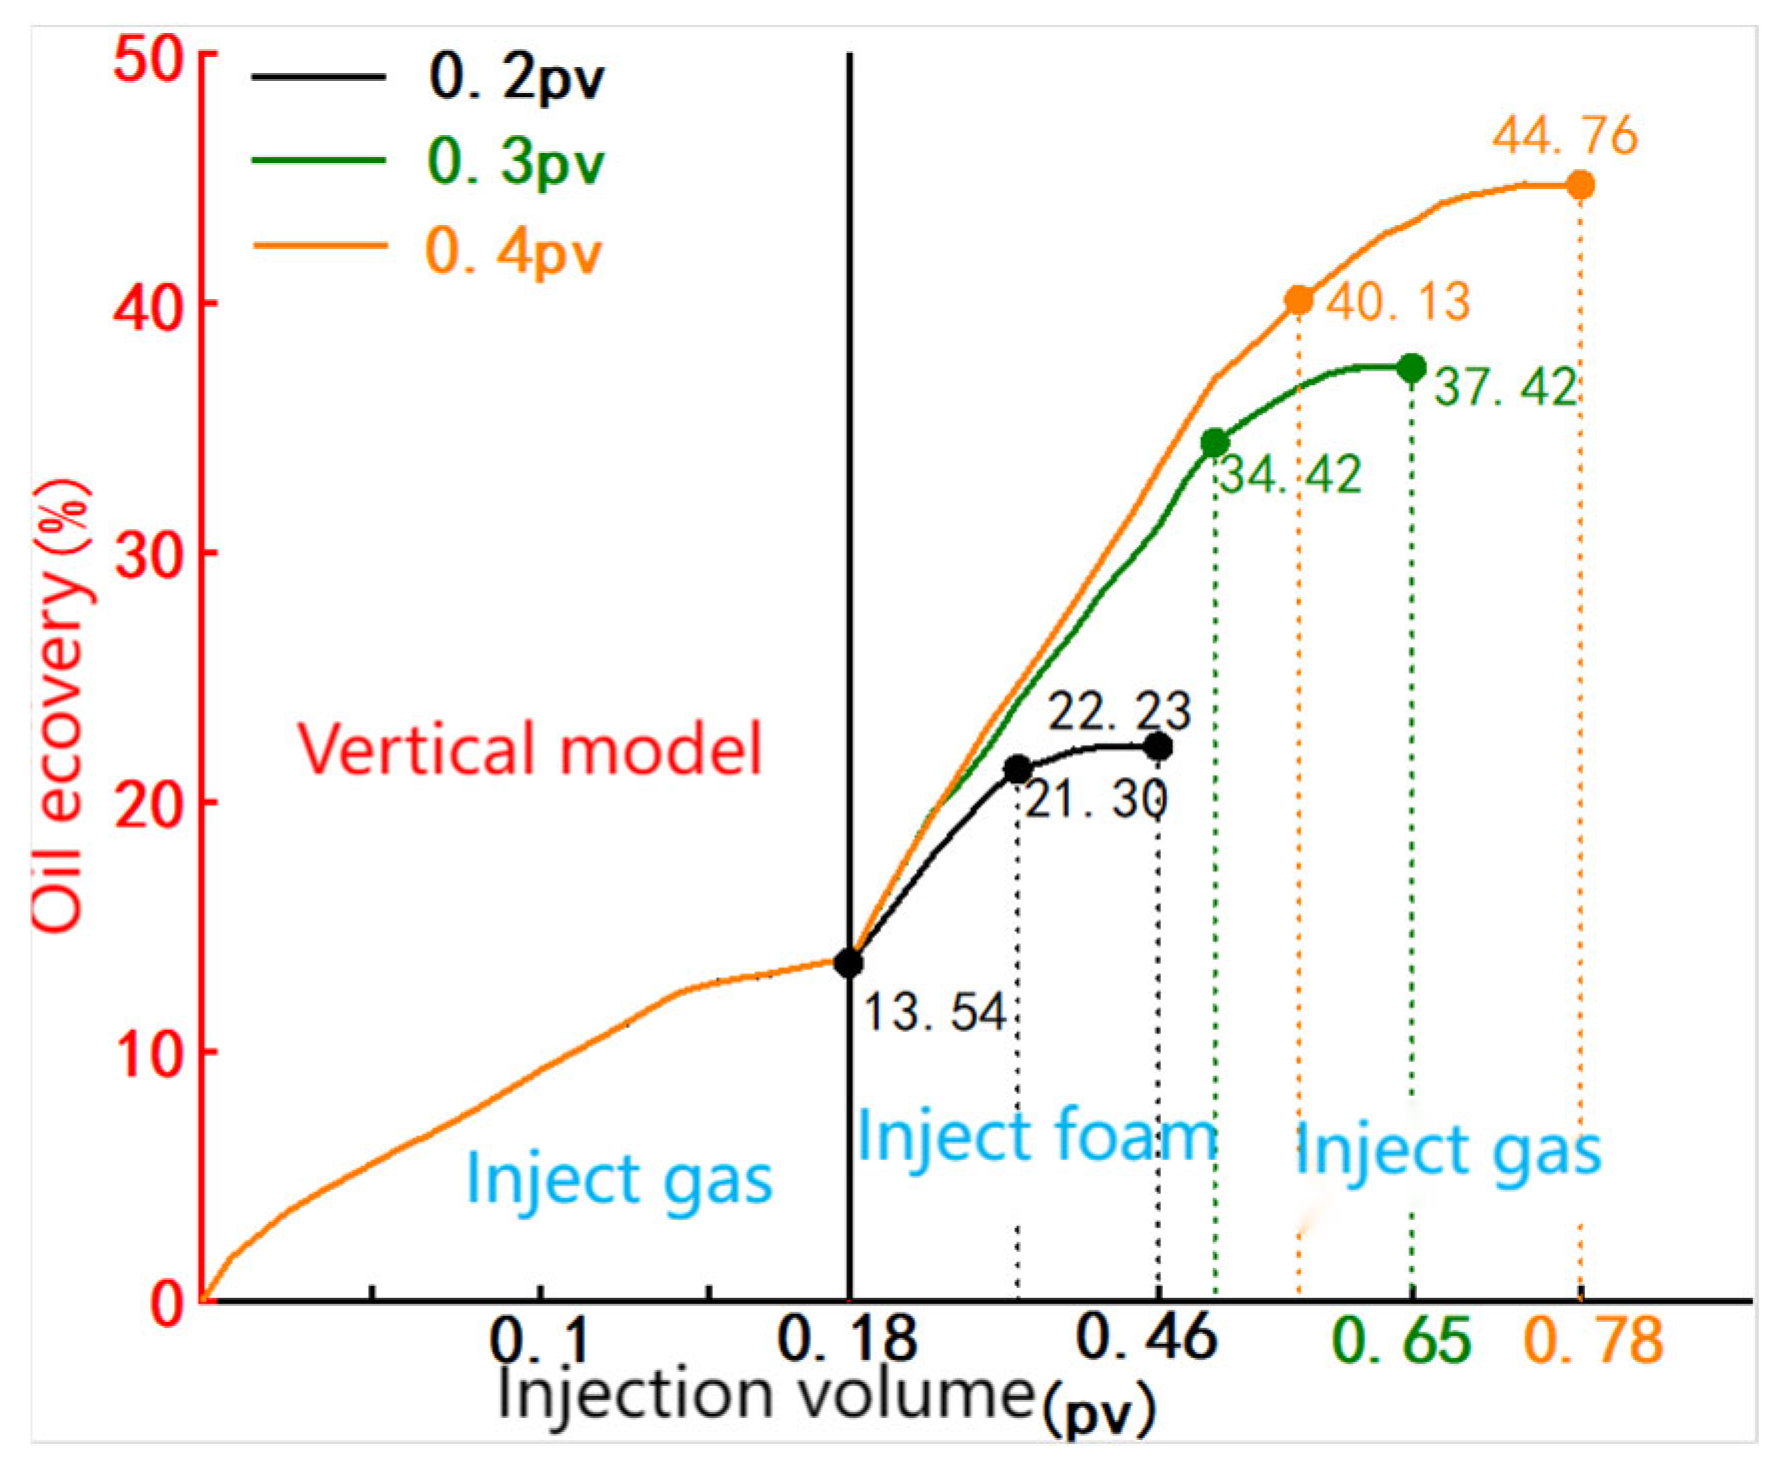
The study assessed the oil displacement performance of various foam injection volumes for salt-sensitive foam at a gas-to-liquid ratio of 3:1 during the gas coning period. The results are provided in Table 2 and Figure 9.
The recovery per PV is calculated by dividing the difference between the final recovery and the recovery after gas channeling by the injected PV volume.
Injecting 0.2 PV of foam leads to a 4.35% recovery increase for every 0.1 PV added. At 0.3 PV injection, the recovery rises by 7.96% per 0.1 PV, while at 0.4 PV, the increase slightly drops to 7.8% per 0.1 PV. Increasing the foam volume from 0.2 PV to 0.3 PV boosts the recovery factor by 14.12%. However, increasing it from 0.3 PV to 0.4 PV only improves recovery by 5.71%, showing a slowing growth rate.
Based on the average and range analysis, the optimal foam injection volume for maximizing economic benefits is between 0.3 PV and 0.4 PV, with 0.3 PV identified as the preferred injection amount.
(3)
Optimization of Foam Gas–Liquid Ratio
For salt-sensitive foam, the study compared the effects of foam-assisted gas displacement under different gas–liquid ratios with an injection volume of 0.4 PV during the gas coning phase. The findings are presented in Table 3 and Figure 10.
At a gas–liquid ratio of 1:1, foam injection increases recovery by 5.5% per 0.1 PV. Raising the ratio to 2:1 boosts recovery by 7.37% per 0.1 PV, while at 3:1, the increase is 7.09% per 0.1 PV. Increasing the ratio from 1:1 to 2:1 results in a 7.98% improvement in recovery factor. However, further increasing the ratio to 3:1 slightly reduces recovery, and during secondary gas displacement, recovery at 3:1 is lower than that at 2:1.
The experimental results indicate that a gas–liquid ratio of 2:1 provides the best foam displacement efficiency among the three tested ratios, making it the optimal choice.

3.2.2. Horizontal Mode

(1)
Foam Type Optimization
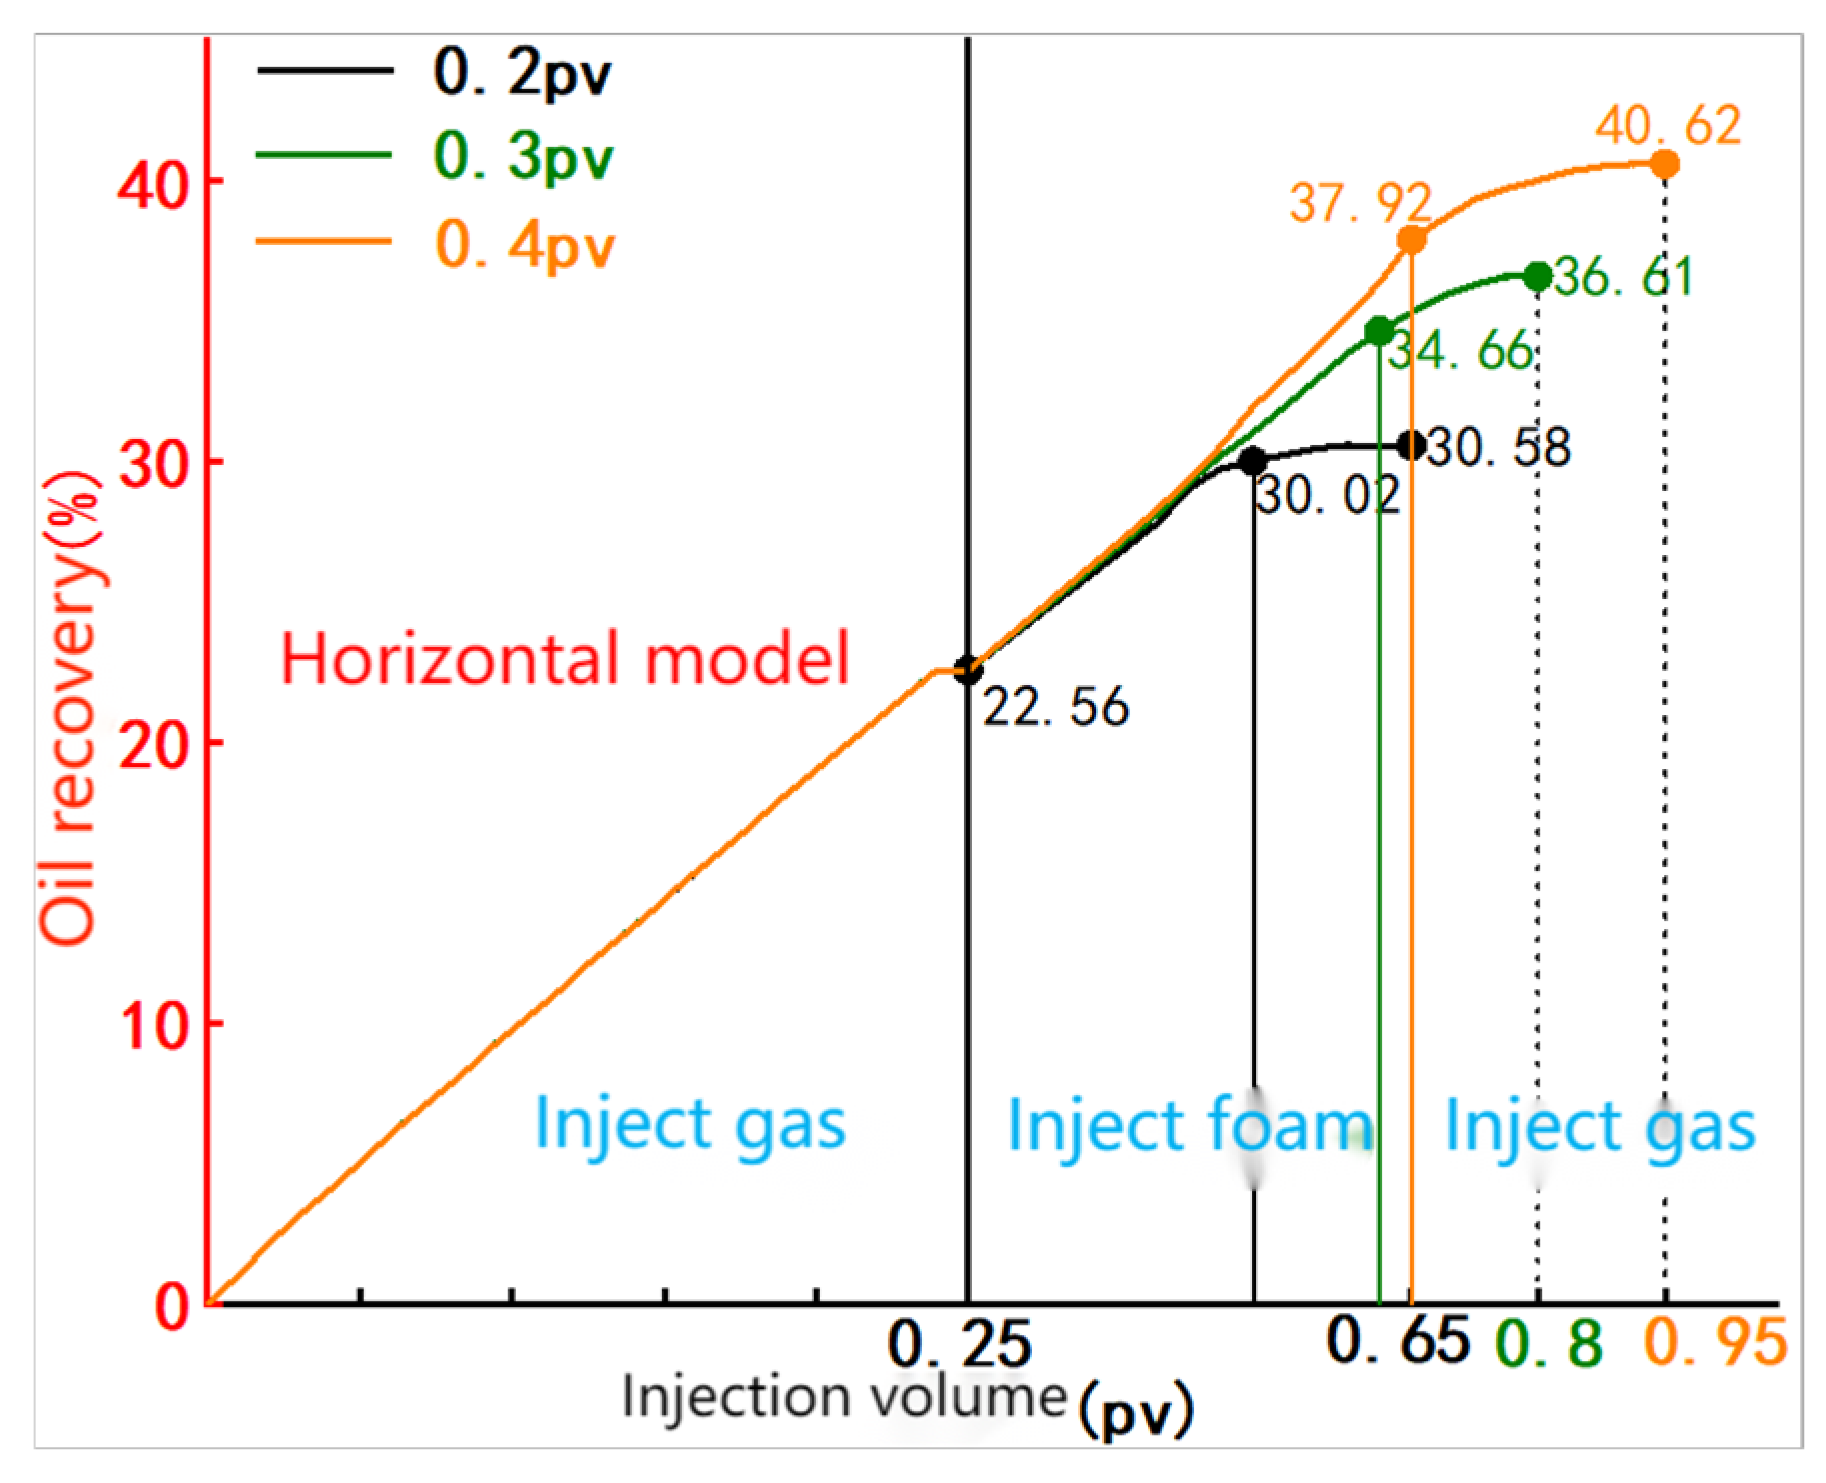
This study evaluated various foam types for foam-assisted gas displacement at an injection volume of 0.4 PV and a gas–liquid ratio of 2:1, following gas coning. The results are presented in Table 4 and Figure 11.
Foam stability tests show that the half-life of dispersed foam is 8 min, gel foam has a half-life of 500 min, and salt-sensitive foam demonstrates a half-life of 10 days.
Experimental results indicate that, among dispersed foam, gel foam, and salt-sensitive foam, salt-sensitive foam achieves the highest recovery factor in foam-assisted gas displacement. This advantage stems from its longer half-life and greater resistance to defoaming compared to gel and dispersed foams. Upon injection, the foam maintains stability longer in the model and mobilizes more residual oil.
Thus, when gas injection alone fails to enhance the recovery factor, using salt-sensitive foam for assisted displacement provides the greatest economic advantage.
(2)
Optimization of Foam Injection Volume
The study evaluated the oil displacement performance of varying injection volumes of salt-sensitive foam at a gas–liquid ratio of 2:1 during the gas coning stage. Results are presented in Table 5 and Figure 12.
Injecting 0.2 PV of foam results in a 3.73% recovery increase per 0.1 PV. At 0.3 PV injection, the recovery rises by 4.03% per 0.1 PV, while at 0.4 PV, it slightly decreases to 3.84% per 0.1 PV. The recovery factor improves by 6.03% when the injection volume grows from 0.2 PV to 0.3 PV, but only increases by 4.01% from 0.3 PV to 0.4 PV, showing a declining improvement rate.
Based on the average and range evaluations, the optimal foam injection volume for maximizing economic benefit is between 0.3 PV and 0.4 PV, with 0.3 PV identified as the preferred volume.
(3)
Optimization of Foam Gas–Liquid Ratio
The study assessed the performance of salt-sensitive foam-assisted gas displacement at various gas–liquid ratios with a fixed injection volume of 0.4 PV during the gas coning stage. The results are provided in Table 6 and Figure 13.
At a foam injection gas–liquid ratio of 1:1, recovery increases by 1.90% per 0.1 PV. Increasing the ratio to 2:1 results in a 3.93% increase per 0.1 PV, while at 3:1, the increase is 2.65% per 0.1 PV. Raising the ratio from 1:1 to 2:1 improves the recovery factor by 9.92%, but a further increase to 3:1 slightly lowers recovery. Additionally, recovery during secondary gas displacement at 3:1 is less than that at 2:1.
The experimental findings suggest that a gas–liquid ratio of 2:1 yields the highest foam displacement efficiency among the three tested ratios, making it the optimal choice.

3.3. Overall Recovery Factor

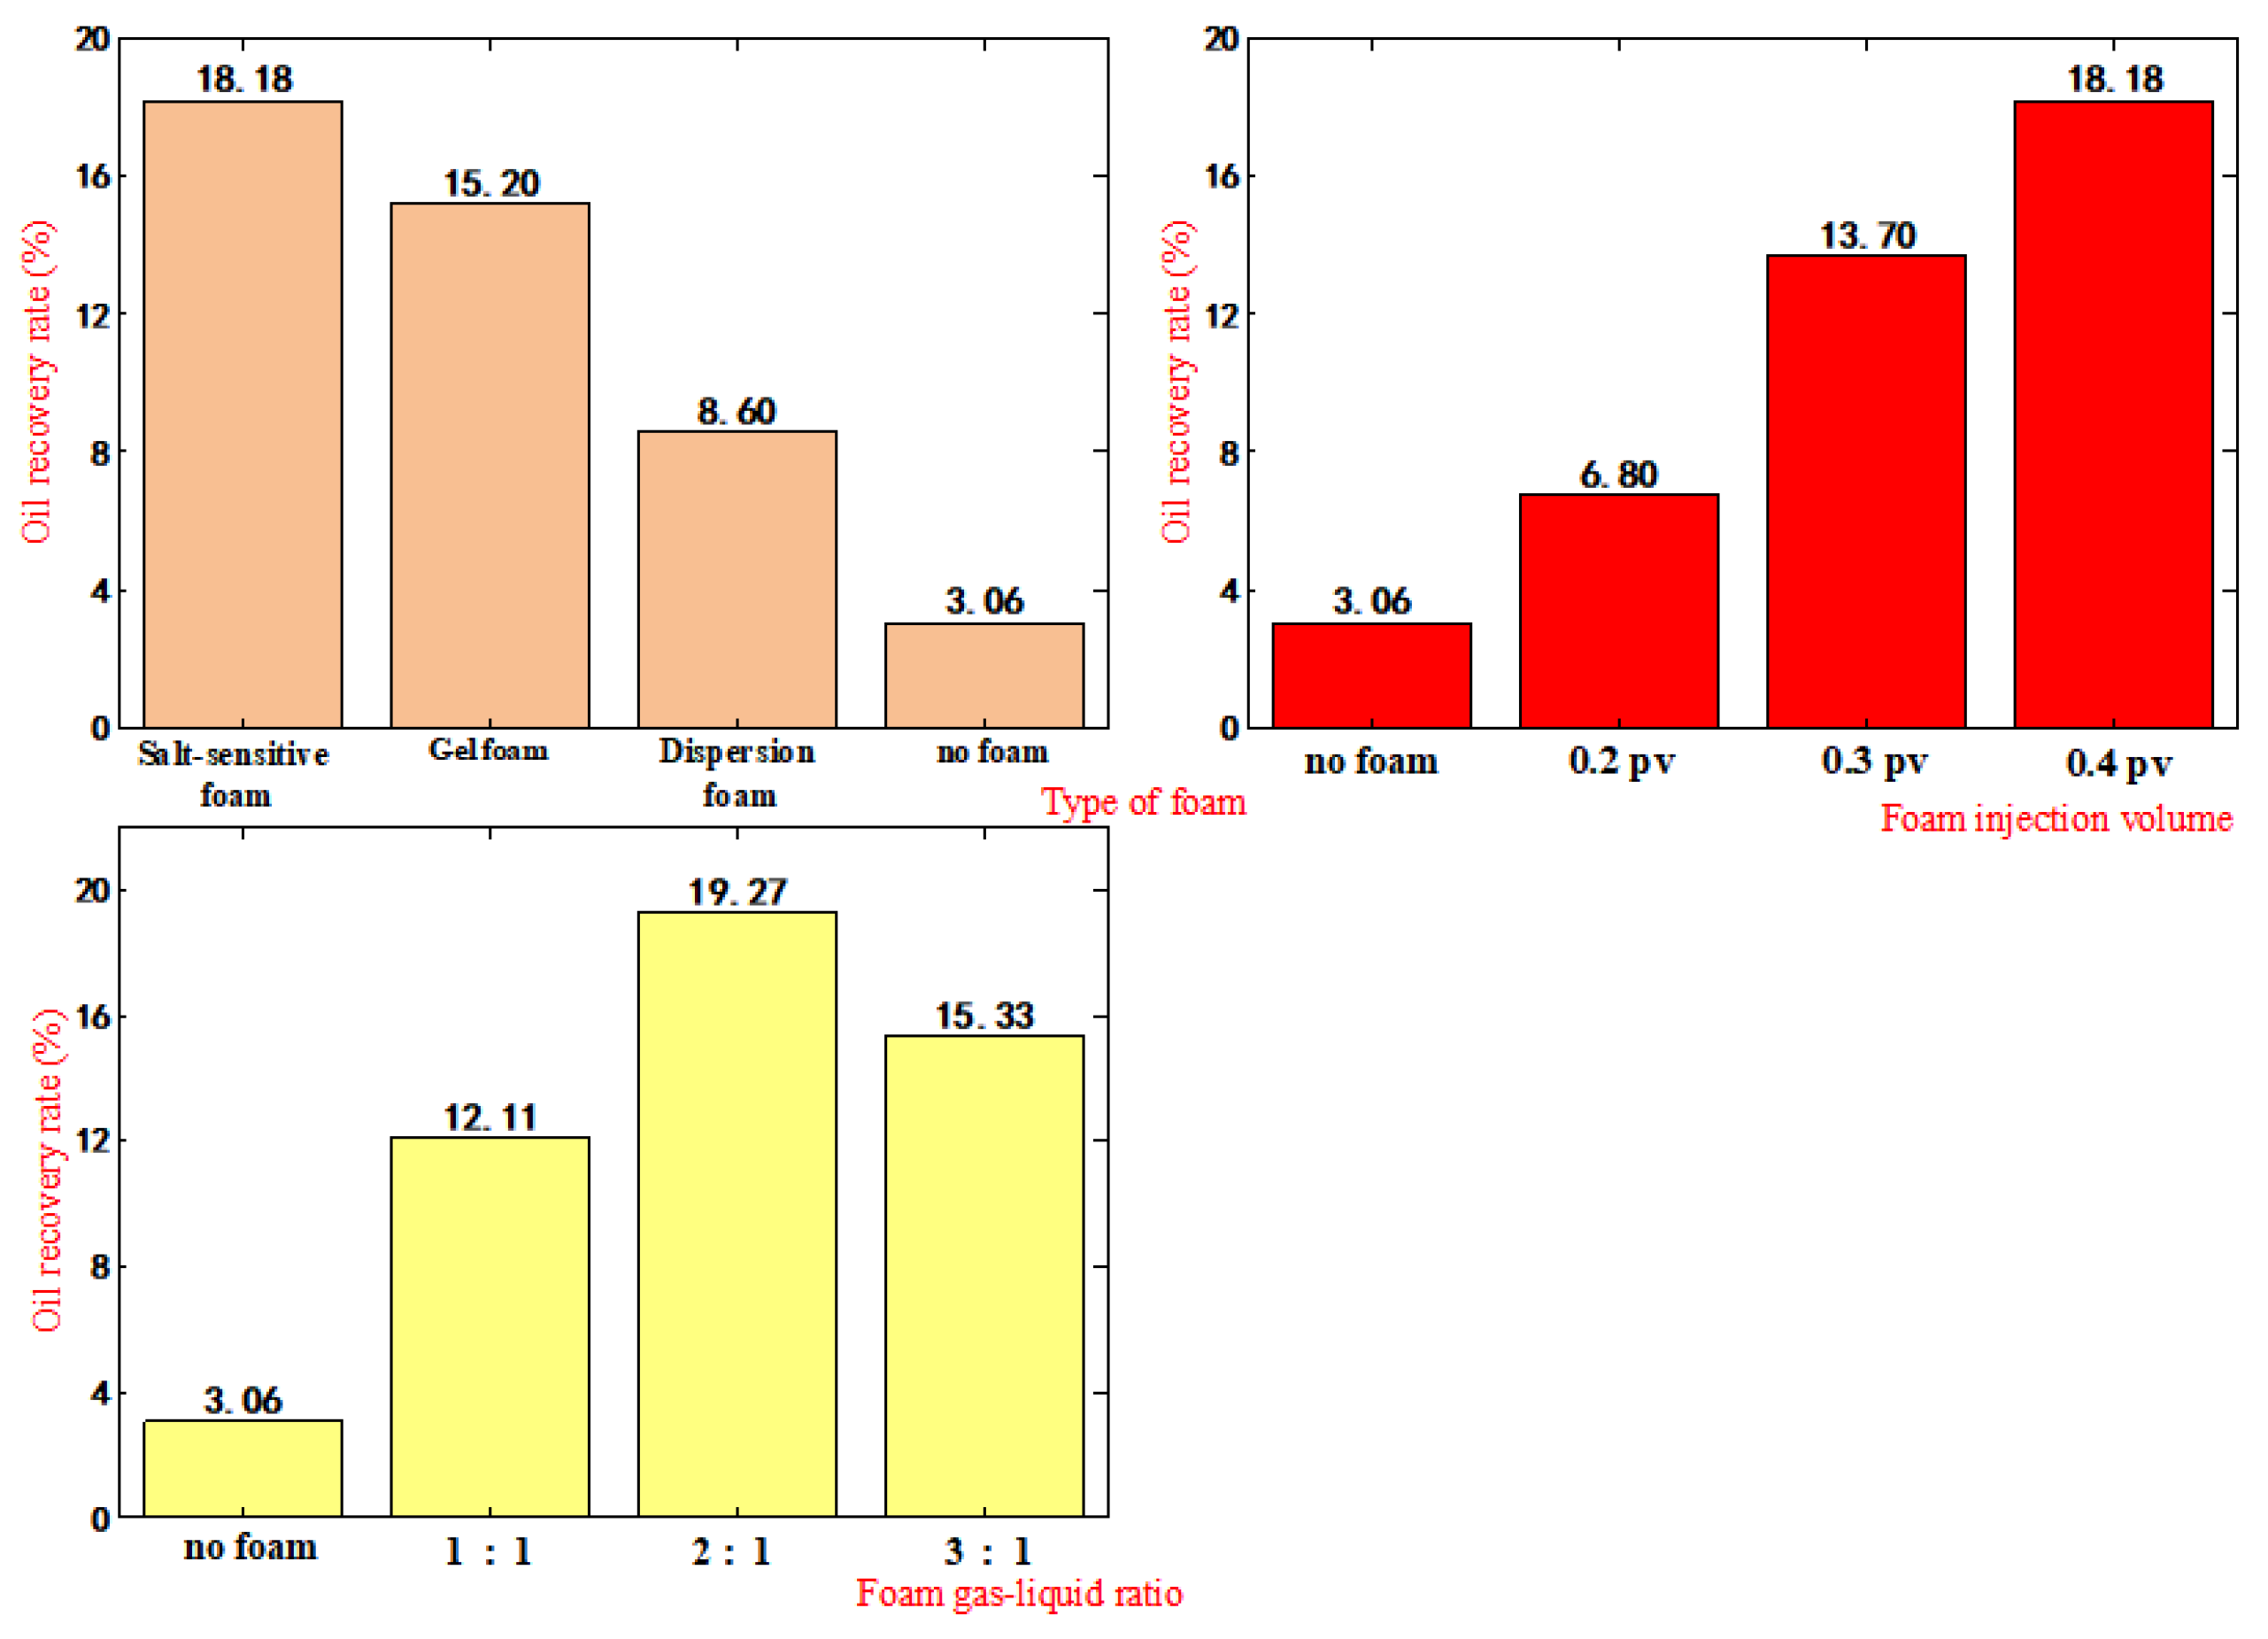
The total recovery factor for both horizontal and vertical models is calculated by multiplying the vertical and horizontal recovery factors. The findings are presented in Table 7 and Figure 14.
Experimental results demonstrate that salt-sensitive foam-assisted gas displacement provides the highest recovery efficiency. Regarding parameter optimization, an injection volume of 0.3 PV combined with a gas–liquid ratio of 2:1 yields the greatest economic advantage.

4. Conclusions

(1)
The foam-assisted gas displacement technology can effectively exploit the remaining oil resources that are inaccessible by conventional gas drives, significantly enhancing the crude oil recovery rate.
(2)
In the vertical heterogeneous model, the increase in recovery rate mainly relies on the direct displacement effect of the foam on the remaining oil, while its flow rate control and liquid flow redirection sealing and well control functions contribute relatively less; in contrast, in the horizontal model, the enhancement of recovery rate results from the effective displacement of the remaining oil by the foam and the dual mechanism of sealing and liquid flow redirection of the high-permeability channels.
(3)
This difference mainly stems from the different influences of gravity and medium structure on the behavior of the foam: in the vertical model, the gravitational differentiation effect is significant, and the foam is prone to float and aggregate, making it difficult to stably seal and block the dominant channels, and its effect is mainly on local oil displacement, whereas in the horizontal model, the foam can be more uniformly distributed under pressure drives, not only in sealing large pores through the Jamison effect to improve sweep efficiency, but also by directly emulsifying and carrying dispersed oil droplets to improve the microscopic oil-washing efficiency, thereby achieving the synergistic enhancement of displacement and well control.
(4)
In the fault dissolution model, the pore development is prominent, but the fractures are poorly developed, leading to poor connectivity in the model. Foam-assisted gas displacement primarily affects the residual oil near the injection end, with limited impacts on the far end. Future experiments could focus on the foam’s mobility to expand the foam’s sweep efficiency.
(5)
The optimization experiments for foam-assisted gas injection parameters show that salt-sensitive foam-assisted gas displacement achieves the best recovery effect. In terms of parameter selection, recovery increases with higher injection volumes, but an injection volume of 0.3 PV and a gas–liquid ratio of 2:1 provide the best economic benefits.
(6)
This study only investigates the immediate recovery rate of foam, and research on the delayed recovery rate of foam has not yet been conducted. Further studies can be carried out in the future to explore this aspect.
(7)
It is important to note that this study was performed under ambient temperature and pressure conditions. In a real reservoir, the foam’s half-life would be shorter, consequently shortening its effective period and potentially diminishing the extent of oil recovery enhancement.

Author Contributions

Conceptualization, Z.C. and L.W.; methodology, Z.C. and L.W.; software, Z.C.; validation, Z.C., Y.Z. and S.Z.; formal analysis, Z.C., L.W. and S.G.; investigation, Z.C.; resources, L.W. and S.G.; data curation, Z.C.; writing—original draft preparation, Z.C.; writing—review and editing, Z.C.; visualization, L.W. and S.G.; supervision, L.W. and S.G.; project administration, L.W. and S.G.; funding acquisition, L.W. and S.G. All authors have read and agreed to the published version of the manuscript.

Funding

This study was supported by the project team of “Optimization of Process Parameters for Gas Flight Channel Regulation in Slit Cave Reservoirs” of the Northwest Bureau of Sinopec under Grant No. 34400007-21-ZC0607-0114.

Data Availability Statement

The original contributions presented in this study are included in the article. Further inquiries can be directed to the corresponding author.

Acknowledgments

We thank the other authors for their support of the experimental methods, experimental materials, and amendments to the contents of the article.

Conflicts of Interest

Author Shanliang Ge was employed by Science and Technology Department of China Petrochemical Corporation. The remaining authors declare that the research was conducted in the absence of any commercial or financial relationships that could be construed as a potential conflict of interest.

References

  1. Chen, Z.-H.; Dai, Y.; Lang, Z.-X. Reservoir storage and permeability pattern and its exploitation characteristics in seam-hole carbonate reservoirs. Pet. Explor. Dev. 2005, 3, 101–105. [Google Scholar]
  2. Li, Y. Development Theory and Methods for Carbonate Fault-Cave Type Oil Reservoirs in the Tarim Oilfield. Acta Pet. Sin. 2013, 34, 115–121. [Google Scholar]
  3. Li, H.; Hou, J.; Li, W.; Yuan, D.; Zhang, L.; Jiang, Y. Visualization Study on the Mechanism of Nitrogen Foam Flooding to Improve Recovery in Carbonate Fault-Cave Type Reservoirs. Oil Gas Geol. Recovery Effic. 2014, 21, 93–96+106+117. [Google Scholar] [CrossRef]
  4. Sui, F.; Wei, H. Nitrogen Foam Assisted Gas Displacement Technology and Its Application in Fault-Cave Type Oil Reservoirs. Xinjiang Pet. Nat. Gas 2020, 16, 83–86+8. [Google Scholar]
  5. Chen, Z.; Dai, Y.; Lang, Z. Storage-percolation modes and production performance of the karst reservoirs in Tahe Oilfield. Pet. Explor. Dev. 2005, 3, 101–105. [Google Scholar]
  6. Yang, Y.; Rong, G.; Xin, Y.; Song, Y.; Li, B. Visualization Experimental Investigation on Flow Regulation and Oil Displacement Characteristics of Gel Foam in Fractured-Vuggy Carbonate Reservoirs. ACS Omega 2024, 9, 40810–40820. [Google Scholar] [CrossRef] [PubMed]
  7. Youssif, M.I.; Piri, M.; Goual, L. Review on Foam-Assisted gas injection in fractured carbonates for enhanced oil recovery. Energy Fuels 2024, 38, 15887–15912. [Google Scholar] [CrossRef]
  8. Fu, Q.; Yang, Z.; Liu, Y.; Chen, M. Research for Flow Behavior of Heavy Oil by N2 Foam-Assisted Steam (NFAS) Flooding: Microscopic Displacement Experiment Study. Processes 2024, 12, 1775. [Google Scholar] [CrossRef]
  9. Liang, T.; Hou, J. Fluids flow behaviors of nitrogen and foam-assisted nitrogen floods in 2D visual fault-karst carbonate reservoir physical models. J. Pet. Sci. Eng. 2021, 200, 108286. [Google Scholar] [CrossRef]
  10. Wen, Y.; Hou, J. Experimental Study on Multi-Dimensional Visualization Simulation of Gas and Gel Foam Flooding in Fractured-Vuggy Reservoirs. Gels 2023, 9, 722. [Google Scholar] [CrossRef] [PubMed]
  11. Wen, Y.; Hou, J.; Qu, M.; Wu, W.; Liang, T.; Zhang, W.; Wu, W. Field Pilot Test of Micro-Dispersed Gel Foam in Fractured-Vuggy Carbonate Reservoirs. In Proceedings of the SPE Annual Technical Conference and Exhibition, Dubai, United Arab Emirates, 21–23 September 2021. [Google Scholar] [CrossRef]
  12. Yao, F.; Zhou, X.; Zhang, T. Experimental and Numerical Study on Optimizing CO2 Foam-Assisted Gas Channeling Control in Tight Reservoirs: Geological Influences. ACS Omega 2025, 10, 35071–35085. [Google Scholar] [CrossRef] [PubMed]
Figure 1. Gas scramble production curves for seam-hole reservoirs.
Processes 13 03642 g001
Figure 2. Design diagram of fractured fluid reservoir model: (a) Vertical model and (b) horizontal model.
Processes 13 03642 g002
Figure 3. Physical image of fracture-type reservoir model: (a)Vertical model and (b) horizontal model.
Processes 13 03642 g003
Figure 4. Physical simulation experiment flowchart.
Processes 13 03642 g004
Figure 5. Density difference, gravity effect, and displacing loft oil: (a) Nitrogen flooding and (b) foam-assisted gas drive.
Processes 13 03642 g005
Figure 6. Gas diffusion and path selection. The black line represents the gas flow channel during the primary gas drive.
Processes 13 03642 g006
Figure 7. The Jamin Effect. The black line represents the gas flow channel during the primary gas drive. The yellow line represents the gas flow channel when foam-assisted gas flooding occurs. The blue line represents the gas flow channel during the secondary steam injection.
Processes 13 03642 g007
Figure 8. Foam type optimization.
Processes 13 03642 g008
Figure 9. Foam injection volume optimization.
Processes 13 03642 g009
Figure 10. Foam gas–liquid ratio optimization.
Processes 13 03642 g010
Figure 11. Foam type optimization.
Processes 13 03642 g011
Figure 12. Foam injection volume optimization.
Processes 13 03642 g012
Figure 13. Foam gas–liquid ratio optimization.
Processes 13 03642 g013
Figure 14. Modeled integrated recovery.
Processes 13 03642 g014
Table 1. Results of foam type optimization experiment.
Foam TypeOil Recovery Rate %
One Gas DriveInject FoamSecondary Gas Drive
Dispersion foam13.549.540.77
Jelly foam13.5424.921.39
Salt-sensitive foam13.5428.382.84
Table 2. Experimental results of foam injection volume optimization.
Foam Injection Volume/pvOil Recovery Rate/%
One Gas DriveInject FoamSecondary Gas Drive
0.213.546.760.93
0.313.5420.883
0.413.5426.594.63
Table 3. Experimental results of foam gas–liquid ratio optimization.
Foam Gas–Liquid RatioOil Recovery Rate/%
One Gas DriveInject FoamSecondary Gas Drive
1:113.54223.91
2:113.5429.494.4
3:113.5428.382.84
Table 4. Experimental results of foam type optimization.
Foam TypeOil Recovery Rate %
One Gas DriveInject FoamSecondary Gas Drive
Dispersion foam22.5612.451.04
Jelly foam22.5614.071.51
Salt-sensitive foam22.5615.352.71
Table 5. Experimental results of foam injection volume optimization.
Foam Injection Volume/pvOil Recovery Rate/%
Inject GasInject FoamInject Gas
0.222.567.460.56
0.322.5612.11.95
0.422.5615.352.71
Table 6. Experimental results of foam gas–liquid ratio optimization.
Foam Gas–Liquid RatioOil Recovery Rate/%
Inject GasInject FoamInject Gas
1:122.567.580.56
2:122.5615.72.36
3:122.5610.581.12
Table 7. Comprehensive recovery rate.
Experimental FactorsOil Recovery Rate/%
Vertical ModelHorizontal ModelComprehensive Recovery Rate
Type of foamDispersion foam13.5422.563.06
Jelly foam23.8536.058.60
Salt-sensitive foam39.8538.1415.20
Foam injection volume0.244.7640.6218.18
0.322.2330.586.80
0.437.4236.6113.70
Foam gas–liquid ratio1:144.7640.6218.18
2:139.4530.7012.11
3:147.4340.6219.27
Disclaimer/Publisher’s Note: The statements, opinions and data contained in all publications are solely those of the individual author(s) and contributor(s) and not of MDPI and/or the editor(s). MDPI and/or the editor(s) disclaim responsibility for any injury to people or property resulting from any ideas, methods, instructions or products referred to in the content.