Article

Prediction of Boil-Off Gas in Cryogenic Tanks with a Coupled Thermal Resistance and Thermodynamic Model

Department of Naval Architecture and Ocean Engineering, Inha University, Incheon 22212, Republic of Korea
*
Author to whom correspondence should be addressed.
Processes 2025, 13(11), 3584; https://doi.org/10.3390/pr13113584 (registering DOI)
Submission received: 12 September 2025 / Revised: 26 October 2025 / Accepted: 2 November 2025 / Published: 6 November 2025

Abstract

This study proposes an analytical model for the long-term prediction of boil-off gas (BOG) generation in cryogenic storage tanks. The model assumes a saturated liquid and a superheated vapor under open-vent conditions. Heat ingress is estimated using steady-state thermal conduction analysis, and evaporation is then computed from thermodynamic equilibrium. In the first stage, a thermal resistance network quantifies the heat flux transferred to the liquid and vapor regions inside the tank. The network represents external convection, insulation conduction, and internal convection as thermal resistances. In particular, natural convection on the external and internal tank walls, as well as heat transfer at the liquid–vapor interface, are incorporated through appropriate convective heat-transfer correlations. In the second stage, the temporal variations in temperature and phase change of the vapor and liquid are computed. Each phase is modeled as a lumped mass at equilibrium, and the heat ingress obtained from the thermal resistance network is used to simulate the temperature evolution and evaporation process. A numerical model is also developed to capture the time-dependent variations in liquid and vapor heights and the corresponding BOG generation. The proposed model is applied to a 1.0 m3 liquid nitrogen storage tank and validated through comparison with the BoilFAST and SINDA/FLUINT models. The results confirm the validity of the model in terms of heat ingress, vapor temperature evolution, and BOG history. This study provides a practical framework for predicting long-term evaporation phenomena in cryogenic storage tanks and is expected to contribute to the thermal design and performance evaluation of cryogenic storage systems.

1. Introduction

Accurate boil-off gas (BOG) prediction is essential for the efficient design and operation of cryogenic vessels such as liquid hydrogen (LH2) and liquefied natural gas (LNG) carriers and bunkering ships. Although LH2 enables efficient long-distance, large-scale storage, its low latent heat and specific heat lead to high boil-off rates (BOR) and mechanical stresses [1]. LH2 is stored under cryogenic conditions at approximately −253 °C in various tank configurations, including Type A, Type B, and Type C structures, as well as double-wall vacuum-insulated designs. Insulation systems commonly employ powdered materials such as perlite and aerogel under high-vacuum conditions, vacuum insulation panels (VIPs), polyurethane foam (PUF), or multi-layer insulation (MLI) [2]. Nevertheless, regardless of the insulation system, external heat ingress cannot be fully prevented, and BOG generation is inevitable. Thus, optimized insulation design and long-term BOG prediction remain critical challenges. BOG generation in cryogenic tanks is influenced by multiple factors, including convective and conductive heat fluxes through the tank wall, insulation thermal resistance, filling ratio, temperature distributions in the vapor and liquid phases, and phase-change dynamics at the liquid–vapor interface [3,4]. Therefore, accurate BOG prediction requires a comprehensive treatment of all heat transfer paths—from the outer wall through insulation and the inner wall to the internal fluids and interface—as well as the associated thermodynamic state changes.
Typically, BOG analysis proceeds in two stages: first quantifying the external heat ingress into the tank, and then computing vapor generation by assessing thermodynamic interactions, heat diffusion, and phase-change phenomena in the fluid phases. Conduction-based numerical methods are conventionally used to calculate heat flow, accounting for external convection, insulation conduction, and internal convection, but these methods alone do not capture the full dynamic behavior of BOG. To efficiently model long-term BOG behavior, thermodynamic models (TDMs) simplify internal fluid phases as lumped masses and integrate heat transfer to simulate temperature evolution and evaporation processes. Building upon this framework, the present study proposes an integrated modeling approach that couples a detailed thermal conduction network with a lumped-mass thermodynamic model to accurately predict long-term BOG generation in cryogenic storage tanks. The model’s analytical validity and practical applicability are demonstrated through comparative analyses, which underscore its capability to simulate dynamic BOG behavior with improved fidelity and computational efficiency.

1.1. Modeling Approaches for BOG Prediction

The generation of BOG depends on several factors, including tank insulation performance, filling ratio, thermodynamic states of the liquid and vapor phases, and external heat ingress [5,6,7,8]. Methods for predicting BOG generally fall into three categories: (1) thermal homogeneous models (THM), which solve conduction equations through finite element or finite difference methods; (2) computational fluid dynamics (CFD) approaches, which resolve multiphase thermo-fluid phenomena using governing fluid dynamics equations; and (3) thermodynamic models (TDM), which employ thermodynamic equilibrium relations to simulate phase change.
The THM estimates BOG by calculating heat transfer into the liquid phase and applying only the latent heat of vaporization. This approach solves conduction equations with convection and radiation boundary conditions to evaluate the heat flow rate delivered to the liquid. Consequently, BOG prediction is based on the heat ingress into a liquid phase assumed to be at thermodynamic equilibrium [9]. Lin et al. [5] employed a conduction-dominant FEM for LNG tanks, where the near-wall liquid layer was simplified as an equivalent conduction path to estimate wall heat ingress and boil-off rate. Steady-state results at various filling ratios were compared with experimental data. Kang et al. [10] modeled thermal stratification in cryogenic tanks using FEM validated against liquid nitrogen (LN2) data. The THM provides computational efficiency and ease of implementation by assuming thermal equilibrium between vapor and liquid phases, which means that both share identical temperature and pressure. This assumption makes THM suitable for analyzing self-pressurization and for gaining insights into tank pressure behavior, although its simplifications limit the detailed prediction of BOG dynamics.
CFD captures complex phenomena inside cryogenic tanks, including heat and mass transfer, phase change, turbulence, and sloshing. This capability enables detailed and physically accurate prediction of BOG [11]. Huerta and Vesovic [12] applied CFD with advanced turbulence models to resolve liquid–vapor interface dynamics and evaporation rates. Ferrín and Pérez-Pérez [13] used conjugate heat transfer (CHT) and volume of fluid methods to model heat transfer and phase change in LNG tanks. Despite these advances, CFD requires substantial computational resources and is sensitive to modeling assumptions, which limits its practicality for long-term BOG prediction [14]. To address these limitations, TDMs have been developed as efficient alternatives. These models simplify the system into lumped masses and assume thermodynamic equilibrium, which enables the successful prediction of long-term BOG generation.
TDM idealizes the liquid and vapor phases as lumped masses and efficiently predicts state variations, phase change, and internal pressure evolution in response to heat ingress. Perez et al. [15] conducted BOG measurement experiments using a 6.73 L cylindrical tank with LN2 and LNG and compared the results with BoilFAST predictions. Their work accounted for nonequilibrium heat transfer between liquid and vapor by incorporating the heat transfer coefficient at the vapor–liquid interface, which reflects energy transfer from superheated vapor to liquid. Ghafri et al. [16] extended this study using the same experimental apparatus to develop a nonequilibrium heat and mass transfer model that also considered LNG compositional changes due to weathering and self-pressurization within the tank. Experimental data validated their model predictions of BOG generation and temperature evolution. Subsequently, Ghafri et al. [17] applied the BoilFAST v1.1.0 to simulate BOG generation and self-pressurization in liquid hydrogen tanks. Experimental data from the 125 m3 horizontal capsule tank at NASA Kennedy Space Center and the 4.89 m3 ellipsoidal tank at Glenn Research Center were analyzed for validation. Heat transfer coefficients derived from experimental data were used to quantify temperature changes in the vapor and liquid phases and to predict phase-change behavior. However, this model does not incorporate the dynamic variation of convective heat transfer arising from changes in liquid and vapor states because heat ingress is not fully treated as a time-dependent phenomenon. Moreover, the convective heat transfer coefficients rely on empirical adjustment based on experimental data, which represents a fundamental limitation. In particular, tuning of the vapor–liquid interfacial heat transfer coefficient is required to match predicted BOG with experimental observations, which imposes constraints on the physical generality of the model. TDM (ranging from correlation-driven lumped solvers to multi-zone network codes) offers high computational efficiency for BOG and pressurization studies [18,19,20,21,22,23,24]. Joseph et al. [21] and Schallhorn et al. [22] used the TDM-based network code SINDA/FLUINT to evaluate insulation performance and near-equilibrium behavior in cryogenic propellant tanks. The group predicted BOG generation and pressure rise by coupling a lumped finite-difference thermal network for solids with a one-dimensional control-volume fluid network for conjugate heat transfer. Kashani et al. [23] likewise employed the same TDM framework to simulate the coupled thermal–fluid behavior of the NASA KSC propellant-loading system. As extensions of TDM, Nam et al. [9] and Wang et al. [24] developed thermal multi-zone models (TMZM) that incorporate vapor–liquid evaporation to predict self-pressurization in cryogenic tanks. These models, however, typically require fixed or correlation-based heat-flux inputs and tuning of interfacial transfer coefficients, which reduces predictive consistency under time-varying operating conditions.
Recently, coupled models combining the TDM with either CFD or FEM have gained increasing attention. Zhu et al. [25] coupled BoilFAST with ANSYS Fluent 2020 R2 to evaluate the performance of MLI and vapor-cooled shields (VCS) in liquid hydrogen tanks in terms of heat ingress. Lan et al. [26] integrated SINDA/FLUINT with ANSYS Fluent 2022 R1 to analyze self-pressurization and thermal stratification and achieved about a 33% reduction in computational cost compared to a standalone CFD analysis. Nevertheless, conventional BOG prediction models such as BoilFAST remain structurally constrained by their assumption of constant heat ingress or by their reliance on experimentally measured or separately computed heat flux as fixed input data.
As a result, these models cannot dynamically update heat ingress variations over time or reflect filling-ratio changes during operation. This limitation restricts their ability to account for the influence of varying filling ratios on BOG as well as the effects of evolving external thermal environments. As a result, it becomes difficult to represent the dynamic physical characteristics of BOG generation during long-duration storage or transport.
Lumped-node thermodynamic models offer efficient prediction of BOG generation by simplifying liquid and vapor phases into lumped masses and assuming thermodynamic equilibrium. However, as noted by Zuo et al. [27], lumped models trade fidelity for efficiency. Widely used implementations such as BoilFAST and multi-zone/network TDMs often rely on prescribed or correlation-based wall heat-flux inputs and tuned interfacial coefficients. These requirements undermine temporal consistency when insulation performance, filling ratio, or ambient conditions vary [9,15,16,17]. Therefore, a need remains for a framework that retains the computational advantages of lumped models while also computing heat ingress, self-consistently updating thermodynamic states dynamically as operating conditions evolve. The present study addresses this gap by coupling a thermal-resistance network for the tank–insulation–ambient system with a lumped-mass thermodynamic model of the vapor–liquid domains.
The framework achieves this by: (i) calculating time-resolved wall heat fluxes from external convection/radiation and temperature-dependent insulation properties, (ii) propagating these fluxes to phase temperatures and evaporation without prescribing fixed heat-flux inputs, (iii) updating interfacial area and relevant coefficients with filling-ratio and wall-temperature changes, and (iv) minimizing case-specific calibration through using published correlations with documented sensitivity bounds. This coupling enables dynamic, long-term BOG/BOR prediction at tractable cost while addressing the key limitations identified in prior TDM and hybrid approaches [9,14,15,16,17,25,26,27].

1.2. Research Objective

This study develops an analytical framework for efficient and accurate long-term prediction of BOG generation and internal fluid thermodynamic states in cryogenic storage tanks. Existing thermodynamic models (TDMs) often rely on fixed heat-flux inputs, which limit their ability to represent dynamic effects caused by time-varying environmental conditions such as fluctuating external heat ingress and filling ratios. The proposed framework employs a thermal resistance network to represent heat transfer paths from the ambient to the internal fluids. This approach allows for the dynamic consideration of heat transfer to the vapor and liquid phases from the external environment. The liquid and vapor phases are treated as lumped masses, while interfacial heat transfer and phase-change processes are described through a thermodynamic equilibrium model. In particular, unlike existing fixed-boundary-condition models such as BoilFAST, the proposed model updates the convective heat transfer at the vapor–liquid interface over time, enabling a more physically representative prediction of boil-off gas behavior. Integration of the thermal resistance network with the thermodynamic model enables coupled treatment of heat ingress and phase-change effects. This approach provides a computationally efficient model that significantly shortens computation time compared to the high-fidelity SINDA/FLUINT model while maintaining physical accuracy. Model validation is carried out by comparing predictions with established methods such as BoilFAST v1.0.0 (UWA Fluid Sciences and Resources Division, Perth, Australia) and SINDA/FLUINT 2024 R1 (Ansys, Inc., Canonsburg, PA, USA), focusing on accuracy and computational efficiency.

2. Modeling of BOG in Cryogenic Storage Tanks

2.1. Physical Phenomena

BOG in cryogenic storage tanks arises from the combined effects of external heat ingress, vapor superheating, liquid evaporation, and interfacial heat transfer. For clarity of analysis, the following assumptions are adopted:
  • The vapor phase is superheated, while the liquid phase remains saturated.
  • The tank operates under long-term storage with open-vent (vent-to-atmosphere) conditions; pressure is approximately ambient, and pressure-rise dynamics are neglected.
  • The tank is assumed to be installed in an indoor environment; solar radiation is neglected.
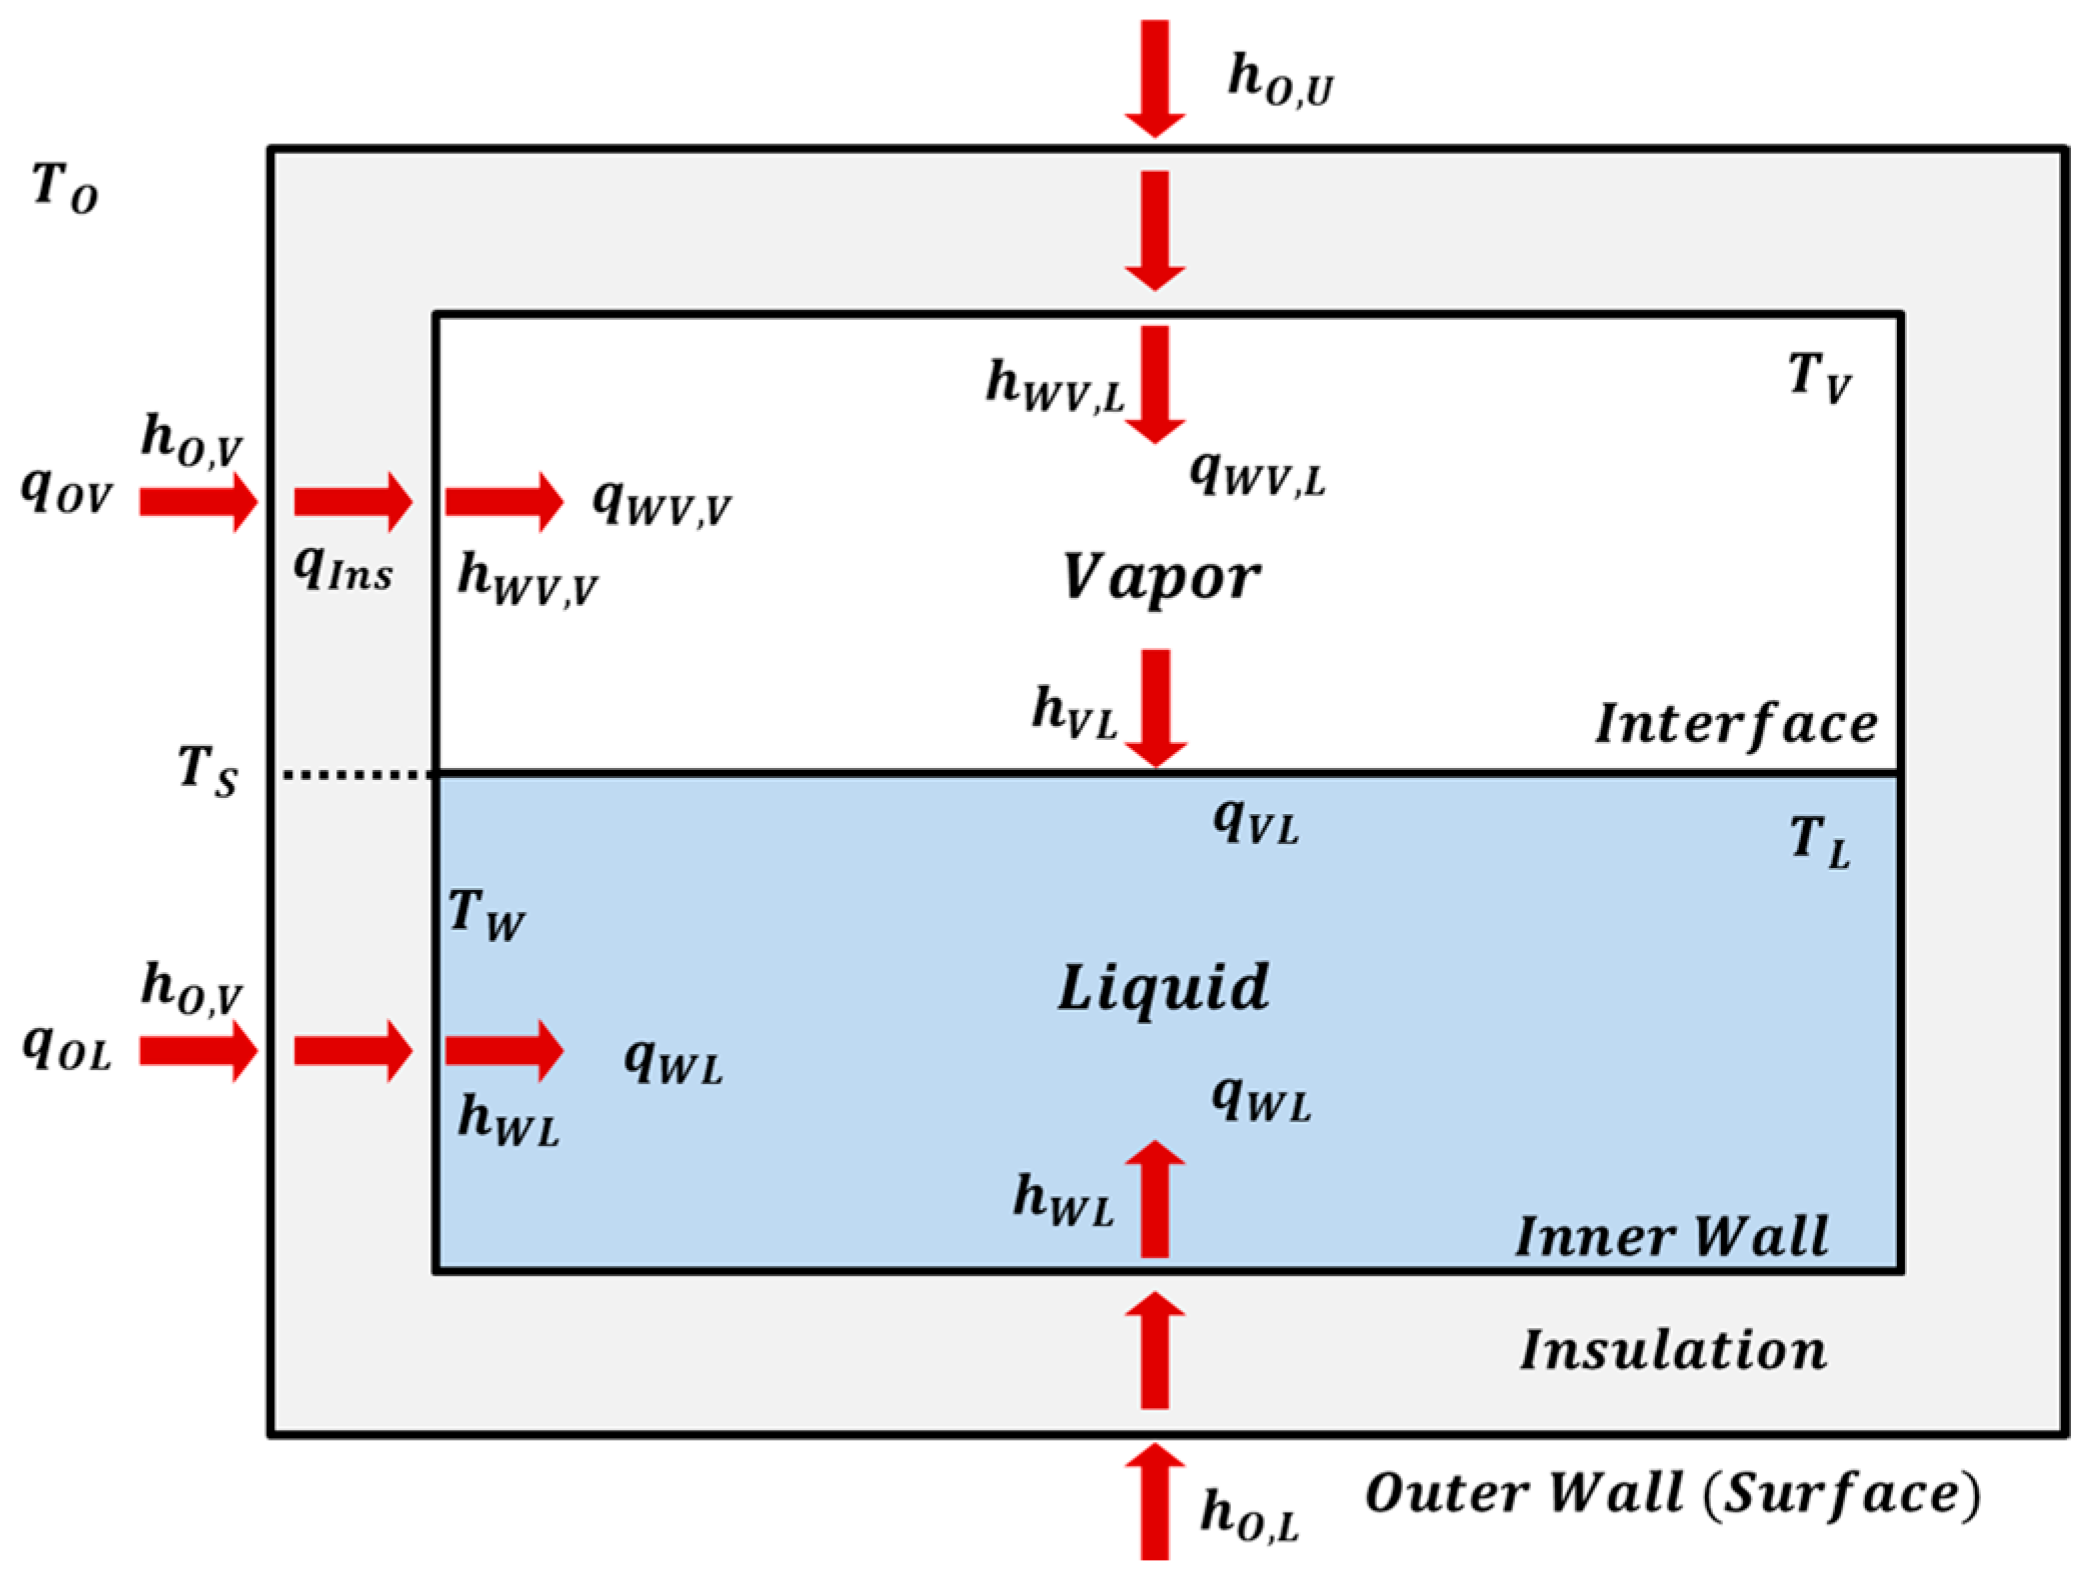
External heat ingress begins at the tank outer wall through natural convection with the ambient environment. This energy is then conducted through the insulation and inner structural walls to the cryogenic fluids. Subsequently, heat is transferred to the vapor and liquid phases at the inner wall–fluid interface via convection. At the vapor–liquid interface, nonequilibrium heat and mass transfer drive partial evaporation of the liquid phase. Two primary heat transfer pathways contribute to BOG generation: (1) heat flux conducted through the tank wall to the liquid boundary layer. (2) Heat flux transferred across the vapor–liquid interface due to temperature differences. Energy delivered through these pathways causes liquid evaporation, which increases the vapor volume in the ullage. Under open-vent conditions, the excess vapor is released to the environment.
Figure 1 schematically illustrates the physical processes of BOG generation in a cryogenic tank, highlighting conduction, convection, and evaporation as the dominant heat transfer mechanisms. Section 2.3 details how heat flow rates to the liquid and vapor regions are quantified through a thermal resistance network model.

2.2. Heat-Transfer Pathways and Boundary Conditions

The heat transfer pathways into the tank are defined along with the associated convective coefficients (HTCs, W / m 2 · K ) and temperature boundary conditions. As the tank is assumed to be installed in an indoor environment, heat transfer by solar radiation is not considered, and external heat transfer is represented only by natural convection. External heat ingress originates from natural convection between the ambient air and the outer wall, represented by the heat flow rate q O ( W ). Because the outer wall is divided into vapor and liquid regions, q O is separated into q O V and q O L , which represent heat ingress to the vapor-side and liquid-side outer walls, respectively. The transferred heat then passes through the insulation and reaches the inner wall, expressed as the heat-flow rate q I n s . Convective heat transfer between the inner wall and the internal fluids is considered next: q W V denotes heat flow from the inner wall to the vapor region, and q W L denotes heat flow from the inner wall to the liquid region.
Furthermore, the temperature difference between vapor and liquid phases drives interfacial heat transfer at the vapor–liquid interface, which is represented by the heat flow rate q V L . Figure 2 illustrates the structural relationships among these pathways, while the corresponding convective heat transfer coefficients and boundary temperatures are summarized.
Heat transfer pathways are classified according to tank geometry and wall. The external convective HTCs on the outer wall are defined as h O , U , h O , L and h O , V for the upper, lower, and vertical surfaces, respectively. On the inner wall, the convective HTC in contact with the liquid phase is defined as h W L , whereas for the vapor phase, the coefficients are defined separately for the horizontal and vertical surfaces as h W V , L and h W V , V , respectively. In addition, the convective HTC at the vapor–liquid interface is defined as h V L .
The temperature conditions contributing to convective heat transfer are differentiated between the ambient air, the outer wall, and the inner wall of the tank. The ambient air temperature is defined as T O , while the temperatures of the outer and inner tank walls are defined as T s and T W , respectively. The liquid and vapor temperatures are defined as T L and T V . In this study, these convective HTCs and temperature conditions are applied as boundary conditions in constructing the thermal resistance network. The network is then used to calculate heat fluxes along each ingress pathway. The resulting fluxes form the total heat input delivered to the vapor and liquid phases, which serves as an input variable for the thermodynamic model predicting BOG generation.

2.2.1. Convective HTCs of the Tank Outer Wall

The outer wall of a cryogenic storage tank is cooled by the cryogenic fluid inside, while the surrounding ambient air remains relatively warm. This temperature and density difference generates buoyancy, which drives natural convection along the outer wall surface. In this study, under natural convection conditions, the HTCs of the outer wall are classified by location: upper, lower, and vertical surfaces.
The horizontal surfaces are divided into upper and lower sections. At the upper surface, warm air lies above the cooled wall, which creates a thermally stable layer. Natural convection is therefore suppressed, and heat transfer remains relatively constant.
At the lower surface, warm air lies beneath the cooled wall, forming a thermally unstable layer. At the lower surface, warm air lies beneath the cooled wall, forming a thermally unstable layer. Buoyancy induces natural convection, resulting in enhanced heat transfer. On the vertical wall, a natural convection boundary layer develops along the surface.
To capture these behaviors, empirical correlations for HTCs are applied according to the magnitude of the Rayleigh number ( R a ). For the upper horizontal surface, the correlation for a cooled horizontal plate beneath a warmer fluid is used, as expressed in Equation (1). For the lower horizontal surface, the correlation for the inverse case is applied, as shown in Equation (2) [28,29,30]. For the vertical surface, the natural convection correlation of Churchill and Chu [31] is adopted, as given in Equation (3). The Rayleigh number ( R a a i r ) required for HTC calculation is defined as the product of the Grashof number ( G r a i r ) and the Prandtl number ( P r a i r ). These values are obtained using Equations (4)–(6). Thermophysical properties are evaluated at the film temperature, defined as T f = ( T s +   T O ) / 2 , where T s is the outer wall temperature and T O is the ambient air temperature.
h O , U   = 0.270   R a a i r 1 / 4 · k a i r L c   10 5   R a a i r 10 10
h O , L   = 0.540 k a i r L c R a a i r 1 / 4   1 0 4 R a a i r 10 7 0.150   R a a i r 1 / 3 · k a i r L c   1 0 7 R a a i r 1 0 11
h O , V   = [ 0.680 + 0.670   ·   R a a i r 1 / 4 1 + 0.492 / P r a i r 9 / 16   4 / 9 ] · k a i r L c   R a a i r 10 9 [ 0.825 + 0.387   R a a i r 1 / 6 1 + 0.492 / P r a i r 9 / 16   8 / 27 ] · k a i r L c   R a a i r > 10 9
R a a i r = G r a i r · P r a i r
G r a i r = g β a i r T s T a i r L c 3 ν a i r 2
  P r a i r = μ a i r C p , a i r k a i r
Here, k a i r denotes the thermal conductivity of air ( W / m · K ), and L c is the characteristic length ( m ) of the convective surface, defined as the ratio of heat transfer area to perimeter length. g represents the gravitational acceleration ( m / s 2 ), β a i r is the volumetric thermal expansion coefficient, T S is the surface temperature ( K ) of the tank outer wall, and T O is the ambient air temperature ( K ), v a i r is the kinematic viscosity ( m 2 / s ), μ a i r is the dynamic viscosity ( P a · s ), and C p , a i r is the specific heat at constant pressure ( J / k g · K ).

2.2.2. Convective HTCs of the Tank Inner Wall

Heat transfer from the inner wall of the tank to the vapor and liquid phases also occurs by natural convection. The corresponding HTCs depend on the surface condition and the fluid properties. In this section, HTCs are defined separately for the vapor and liquid regions. For the vapor region, natural convection along the upper horizontal surface and the vertical surface of the inner wall is distinguished according to the range of the Rayleigh number ( R a V ). The associated HTCs, h W V , L   and h W V , V are calculated using the empirical correlations reported in [28,29,30,31].
h   W V , L   = 0.540 k V L c ·   R a V 1 / 4   1 0 4 R a V 10 7 0.150 k V L c ·   R a V 1 / 3   1 0 7 R a V 1 0 11
h   W V , V   = [ 0.680 + 0.670   R a V 1 / 4 1 + 0.492 / P r V 9 / 16 4 / 9 ] · k V L c   R a V 10 9 [ 0.825 + 0.387   R a V 1 / 6 1 + 0.492 / P r V 9 / 16 8 / 27 ] · k V L c   R a V > 10 9
Here, k V denotes the thermal conductivity of the vapor ( W / m · K ), and L c is the characteristic length ( m ), R a V and P r V represent the Rayleigh and Prandtl numbers under vapor conditions, respectively. These dimensionless numbers are evaluated from the thermophysical properties of the vapor region inside the tank.
In the liquid region adjacent to the inner wall, the wall temperature T W generally exceeds the liquid saturation temperature T L . Under these conditions, nucleate boiling occurs. Bubble formation at the wall enhances heat transfer significantly. The heat transfer coefficient h W L is defined using the Rohsenow correlation (Equation (9)) [32]. The present formulation follows the approach of Joseph et al. [21], who applied the Rohsenow correlation to cryogenic tank boiling. The Prandtl number for the liquid phase P r L S is defined in Equation (10).
h W L =   μ L T h f g 2 g ρ L   ρ V σ 0.5 C p , L 0.01 P r L s 3
P r L S = μ L C p , L k L
Here, μ L is the liquid viscosity ( P a · s ), and T denotes the temperature difference between the liquid temperature T L and the inner wall temperature T W . ρ L and ρ V represent the liquid and vapor densities ( k g / m 3 ), respectively; h f g is the latent heat of vaporization ( J / k g ); σ represents the surface tension ( N / m ); C p , L is the specific heat of the liquid at constant pressure ( J / k g · K ); and k L denotes the thermal conductivity of the liquid ( W / m · K ). R e L and P r L are the Reynolds number and Prandtl number of the liquid, respectively. The exponent S in the Prandtl number was taken as 1.7, following Rohsenow et al. [33] for cryogenic liquid conditions.

2.2.3. Convective HTCs of the Vapor-Liquid Interface

As the vapor temperature T V increases over time, heat and mass transfer occur across the vapor–liquid interface. Following the approach of Joseph et al. [21], the vapor–liquid interface is modeled as a thin, uniform layer with heat transfer characteristics analogous to those of a horizontal flat plate. Accordingly, the convective HTC at the vapor–liquid interface, h V L is evaluated under natural convection conditions as follows:
h V L = C V L k V L C R a V L 0.25   1 0 5 R a V L 10 10
R a V L = G r V L · P r V L = g β T V T L L C 3 υ V 2 · μ V C P , V k V
Here, C V L is an empirical coefficient from Joseph et al. [21], taken as 0.27. k V denotes the thermal conductivity of the vapor ( W / ( m · K ) ), and L C is the characteristic length ( m ) of the interface. R a V L is the Rayleigh number, while G r V L and P r V L denote the Grashof and Prandtl numbers at the vapor–liquid interface. g is the gravitational acceleration ( m / s 2 ), β is the volumetric thermal expansion coefficient of the vapor ( 1 / K ), and T V and T L are the vapor and liquid temperatures ( K ). ν V is the kinematic viscosity of the vapor ( m 2 / s ), μ V is the dynamic viscosity ( P a · s ), and C p , V is the specific heat of the vapor at constant pressure ( J / ( k g · K ) ). The convective HTC h V L quantifies the heat flux across the interface that drives evaporation as the vapor temperature varies.

2.3. TDM-Based BOG Prediction Model

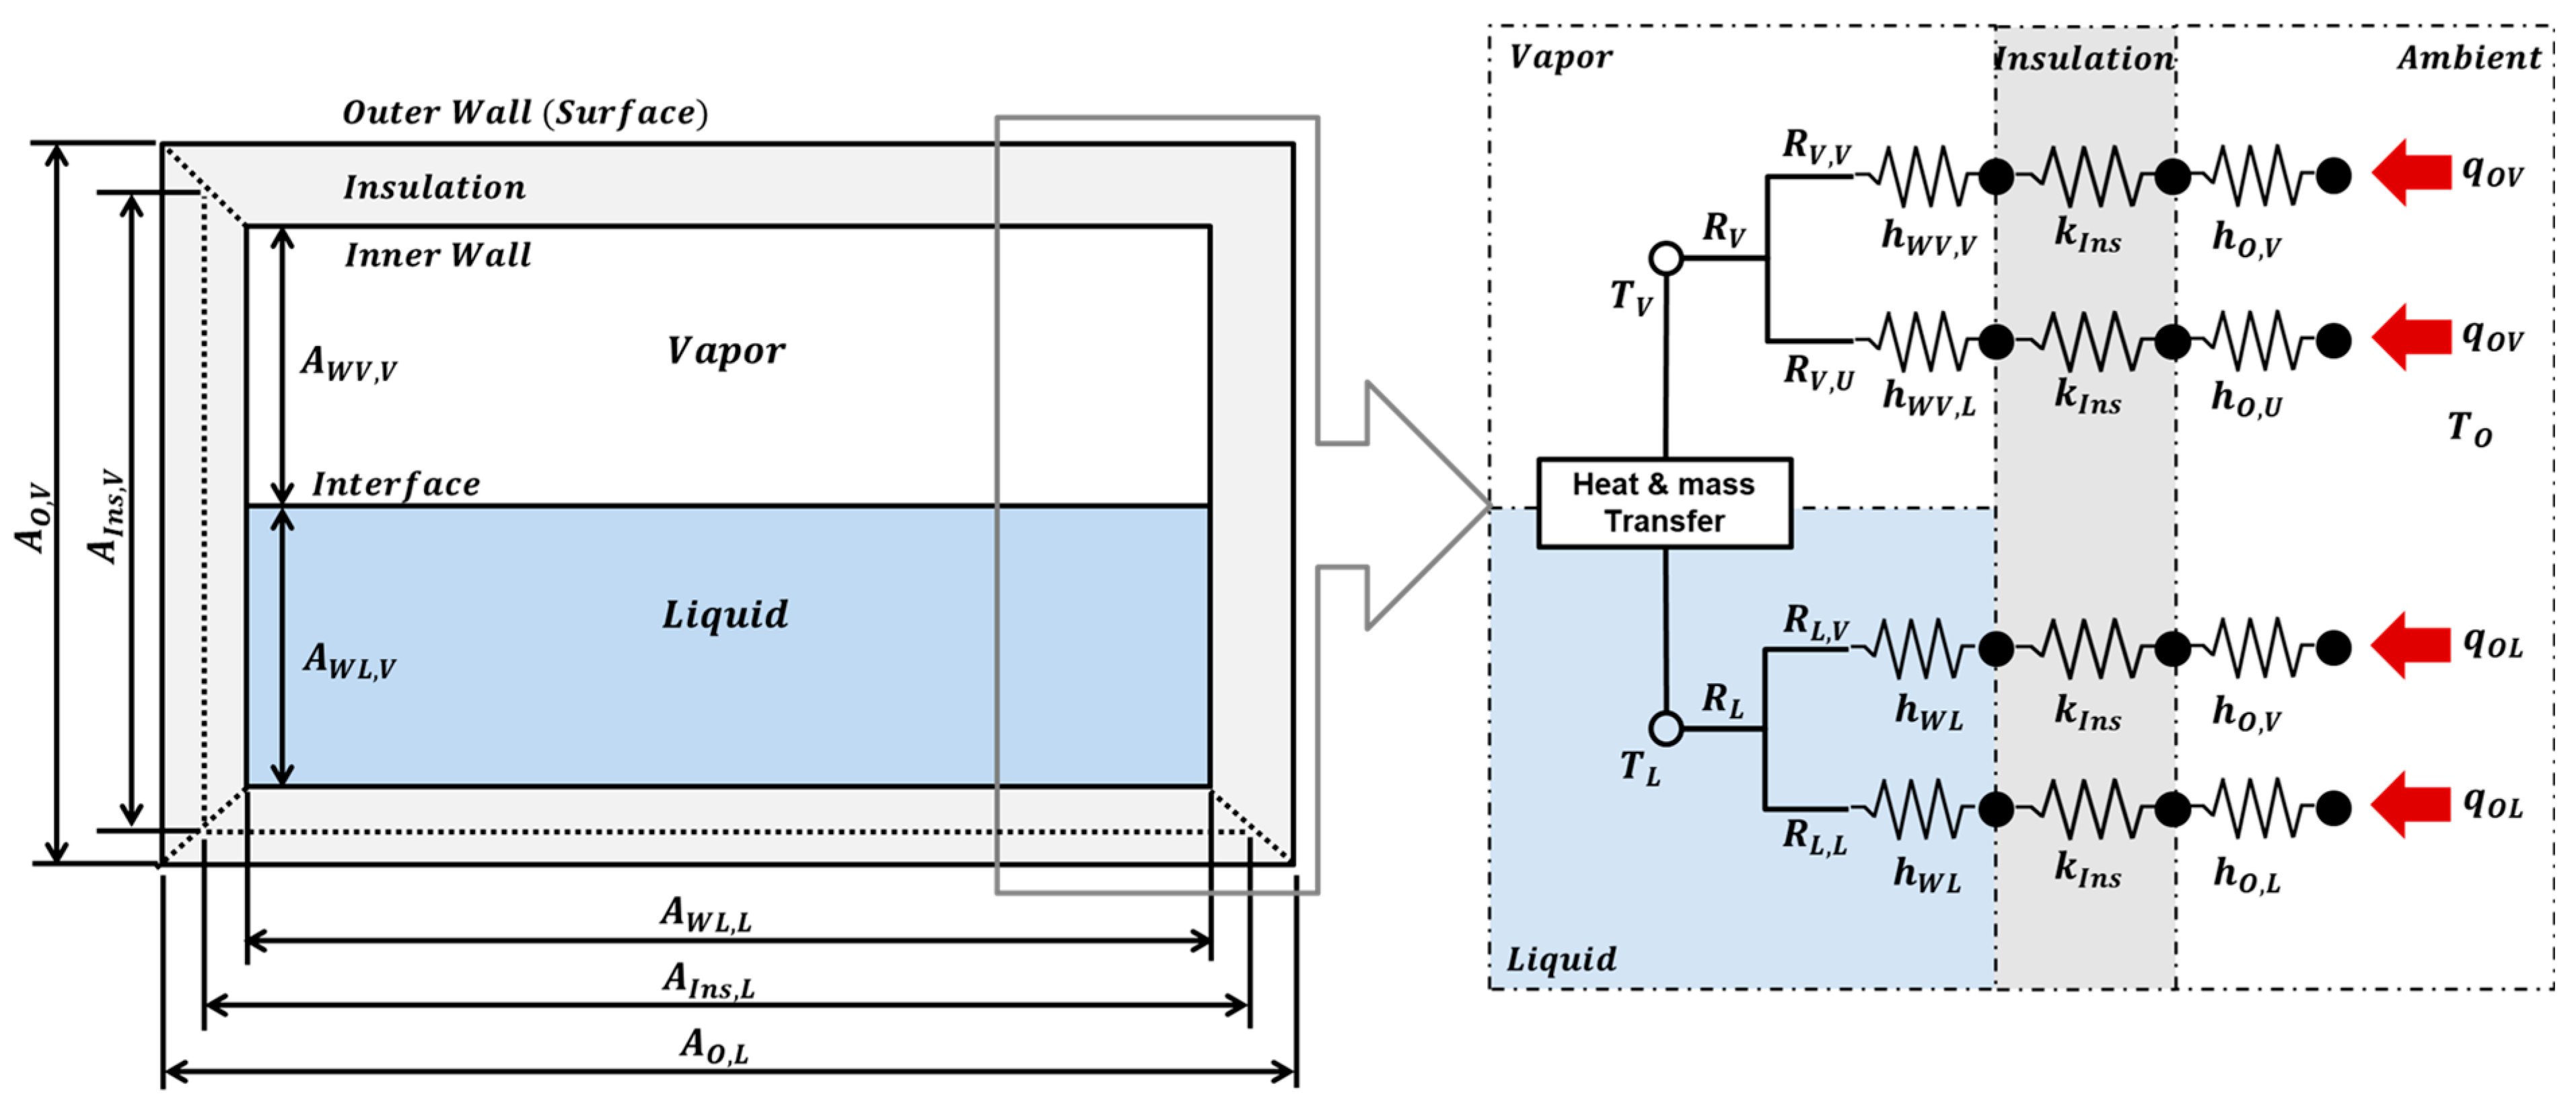
The BOG prediction model integrates a thermal resistance network with a lumped mass model. In this framework, the heat flux entering through convective and conductive heat-transfer pathways is calculated, and based on this, the temperature variation of the vapor phase and the evaporation of the liquid phase are predicted. Figure 3 illustrates the analytical framework, where the primary thermal resistance pathways within the cryogenic tank are represented as thermal resistance elements, while the internal fluid is simplified into a vapor and a liquid lump.
The prediction of BOG begins with the formulation of a thermal resistance model. Given the tank geometry, insulation properties, and initial fluid state, which is characterized by temperature, pressure, and filling ratio, the external heat ingress is evaluated at each exterior surface. Heat supplied by ambient natural convection is then conducted through the insulation and inner wall before reaching the vapor and liquid via convection at the inner wall. Each heat transfer pathway is represented as an equivalent thermal resistance, which together form the thermal resistance network. The thermal resistances of the liquid and vapor regions, R L and R V , are expressed in Equations (13) and (14).
R L = R L , L + R L , V = 1 h O , L A O , L + t I n s k I n s A I n s + 1 h W L A W L + 1 h O , V   A O L , V + t I n s k I n s A I n s + 1 h W L A W L
R V = R V , U + R V , V = 1 h O , U   A O , L + t I n s k I n s A I n s + 1 h W V , L A W V + 1 h O , V   A O V , V + t I n s k I n s A I n s + 1 h W V , V A W V
Here, R L , L , R L , V , R V , U and R V , V denote the thermal resistances of the liquid and vapor phases at the horizontal and vertical surfaces, respectively. In addition, h O , U , h O , L and h O , V represent the external HTCs at the upper, lower, and side surfaces of the tank outer wall, while A O , L , A O L , L and A O V , V denote the corresponding contact areas ( m 2 ) of the Outer surface at each location, respectively. t I n s and k I n s represent the insulation thickness ( m ) and thermal conductivity ( W / m · K ), respectively, and A I n s is the contact area of the insulation ( m 2 ). h W V , L and h W V , V represent the HTCs from the upper and side inner wall surfaces to the vapor region, while h W L denotes the HTC from the inner wall to the liquid region. A W L and A W V represent the contact areas ( m 2 ) between the inner wall and the liquid or vapor phases, respectively.
The thermal resistance network is integrated with a lumped-mass thermodynamic model to predict the BOG generation. At each discrete time step ( t ), the heat flow rates delivered to the vapor and liquid are calculated and supplied as inputs to the thermodynamic model. The external heat inputs to the liquid and vapor phases, Q O L and Q O V are defined in Equations (15) and (16), respectively. The interfacial heat input from the vapor to the liquid, Q V L is specified in Equation (17):
Q O L = q O L t = T O T L R L t
Q O V = q O V t = T O T V R V t
Q V L = q V L t = h V L A V L T V T L t
Here, A V L is the vapor–liquid interfacial area ( m 2 ) and t represents the time increment ( s ).
The developed BOG prediction model simplifies the liquid and vapor inside the tank as lumped masses. Heat transfer pathways are represented by a thermal resistance network, which enables quantitative BOG calculation over time. At each time step, the calculation assumes thermodynamic equilibrium, and state variables of the liquid and vapor are updated sequentially for time-series analysis.
The procedure proceeds as follows. First, the heat flow rates entering the liquid and vapor from the external environment ( q O L , q O V ) are assumed, based on energy conservation, to equal the heat flow rates from the inner wall to the liquid and vapor ( q W L , q W V ). In particular, the external heat flow rate to the vapor q O V increases the vapor temperature. The temperature rise T V represents the increase in vapor temperature caused by heat transferred from the inner wall to vapor. After a timestep t , this temperature rise is added to the initial vapor temperature T V , i to obtain the intermediate vapor temperature T V , i + 1 . This intermediate temperature enhances the temperature difference across the vapor–liquid interface and used to calculate the interfacial heat flow rate q V L . Equations (18) and (19) express the vapor temperature rise and the intermediate vapor temperature as follows:
T V = q W V · t m V · C p , V
T V , i + 1 = T V , i + T V
Here, m V and C p , V denote the vapor mass ( k g ) and the specific heat of the vapor at constant pressure ( J / ( k g · K ) ), respectively.
The increased vapor energy is transferred through the temperature difference between the vapor and liquid phases. As a result, the heat entering the vapor constitutes part of the energy transferred to the liquid through the interface. Thus, the total heat flow rate to the liquid phase, q L , is given by the sum of the heat flow rate from the inner wall to the liquid q W L and the interfacial heat flow rate q V L :
q L = q W L + q V L
In this study, it was assumed that the liquid phase remains at the saturation temperature under open-vent conditions. Hence, the mass flow rate of evaporation, m ˙ B O G , corresponding to the total heat flow rate q L is defined using the latent heat of vaporization h f g as follows:
m ˙ B O G = q L h f g
The evaporated vapor mixes with the pre-existing vapor. Its volume is calculated using Equation (22), which then combines with the pre-existing vapor to form a new vapor state. To estimate the vapor state inside the tank, the evaporated vapor volume V B O G derived from the evaporation mass flow rate m ˙ B O G and the remaining vapor volume V V , R e m a i n e d are determined using Equation (23). The remaining vapor mass inside the tank m V , R e m a i n e d is subsequently obtained by multiplying the remaining vapor volume V V , R e m a i n e d by the vapor density ρ V as expressed in Equation (24).
V B O G = m ˙ B O G t ρ B O G
V V , R e m a i n e d = V V V B O G
m V , R e m a i n e d = ρ V V V , R e m a i n e d
Here, V V denotes the total vapor volume, while ρ B O G and ρ V represent the densities of the evaporated and the remaining vapor, respectively.
Finally, the average vapor temperature T V , A v g is calculated as the mass-weighted average that takes into account the ratio between the evaporated mass m B O G and the remaining vapor mass m V , R e m a i n e d :
T V , A v g = m B O G C p , L T L + m V , R e m a i n e d C p , V T V m B O G + m V , R e m a i n e d
Here, C p , L and C p , V denote the specific heats at constant pressure of the liquid and vapor phases ( J / ( k g · K ) ), respectively. The average temperature is calculated using the Helmholtz equation of state [34].
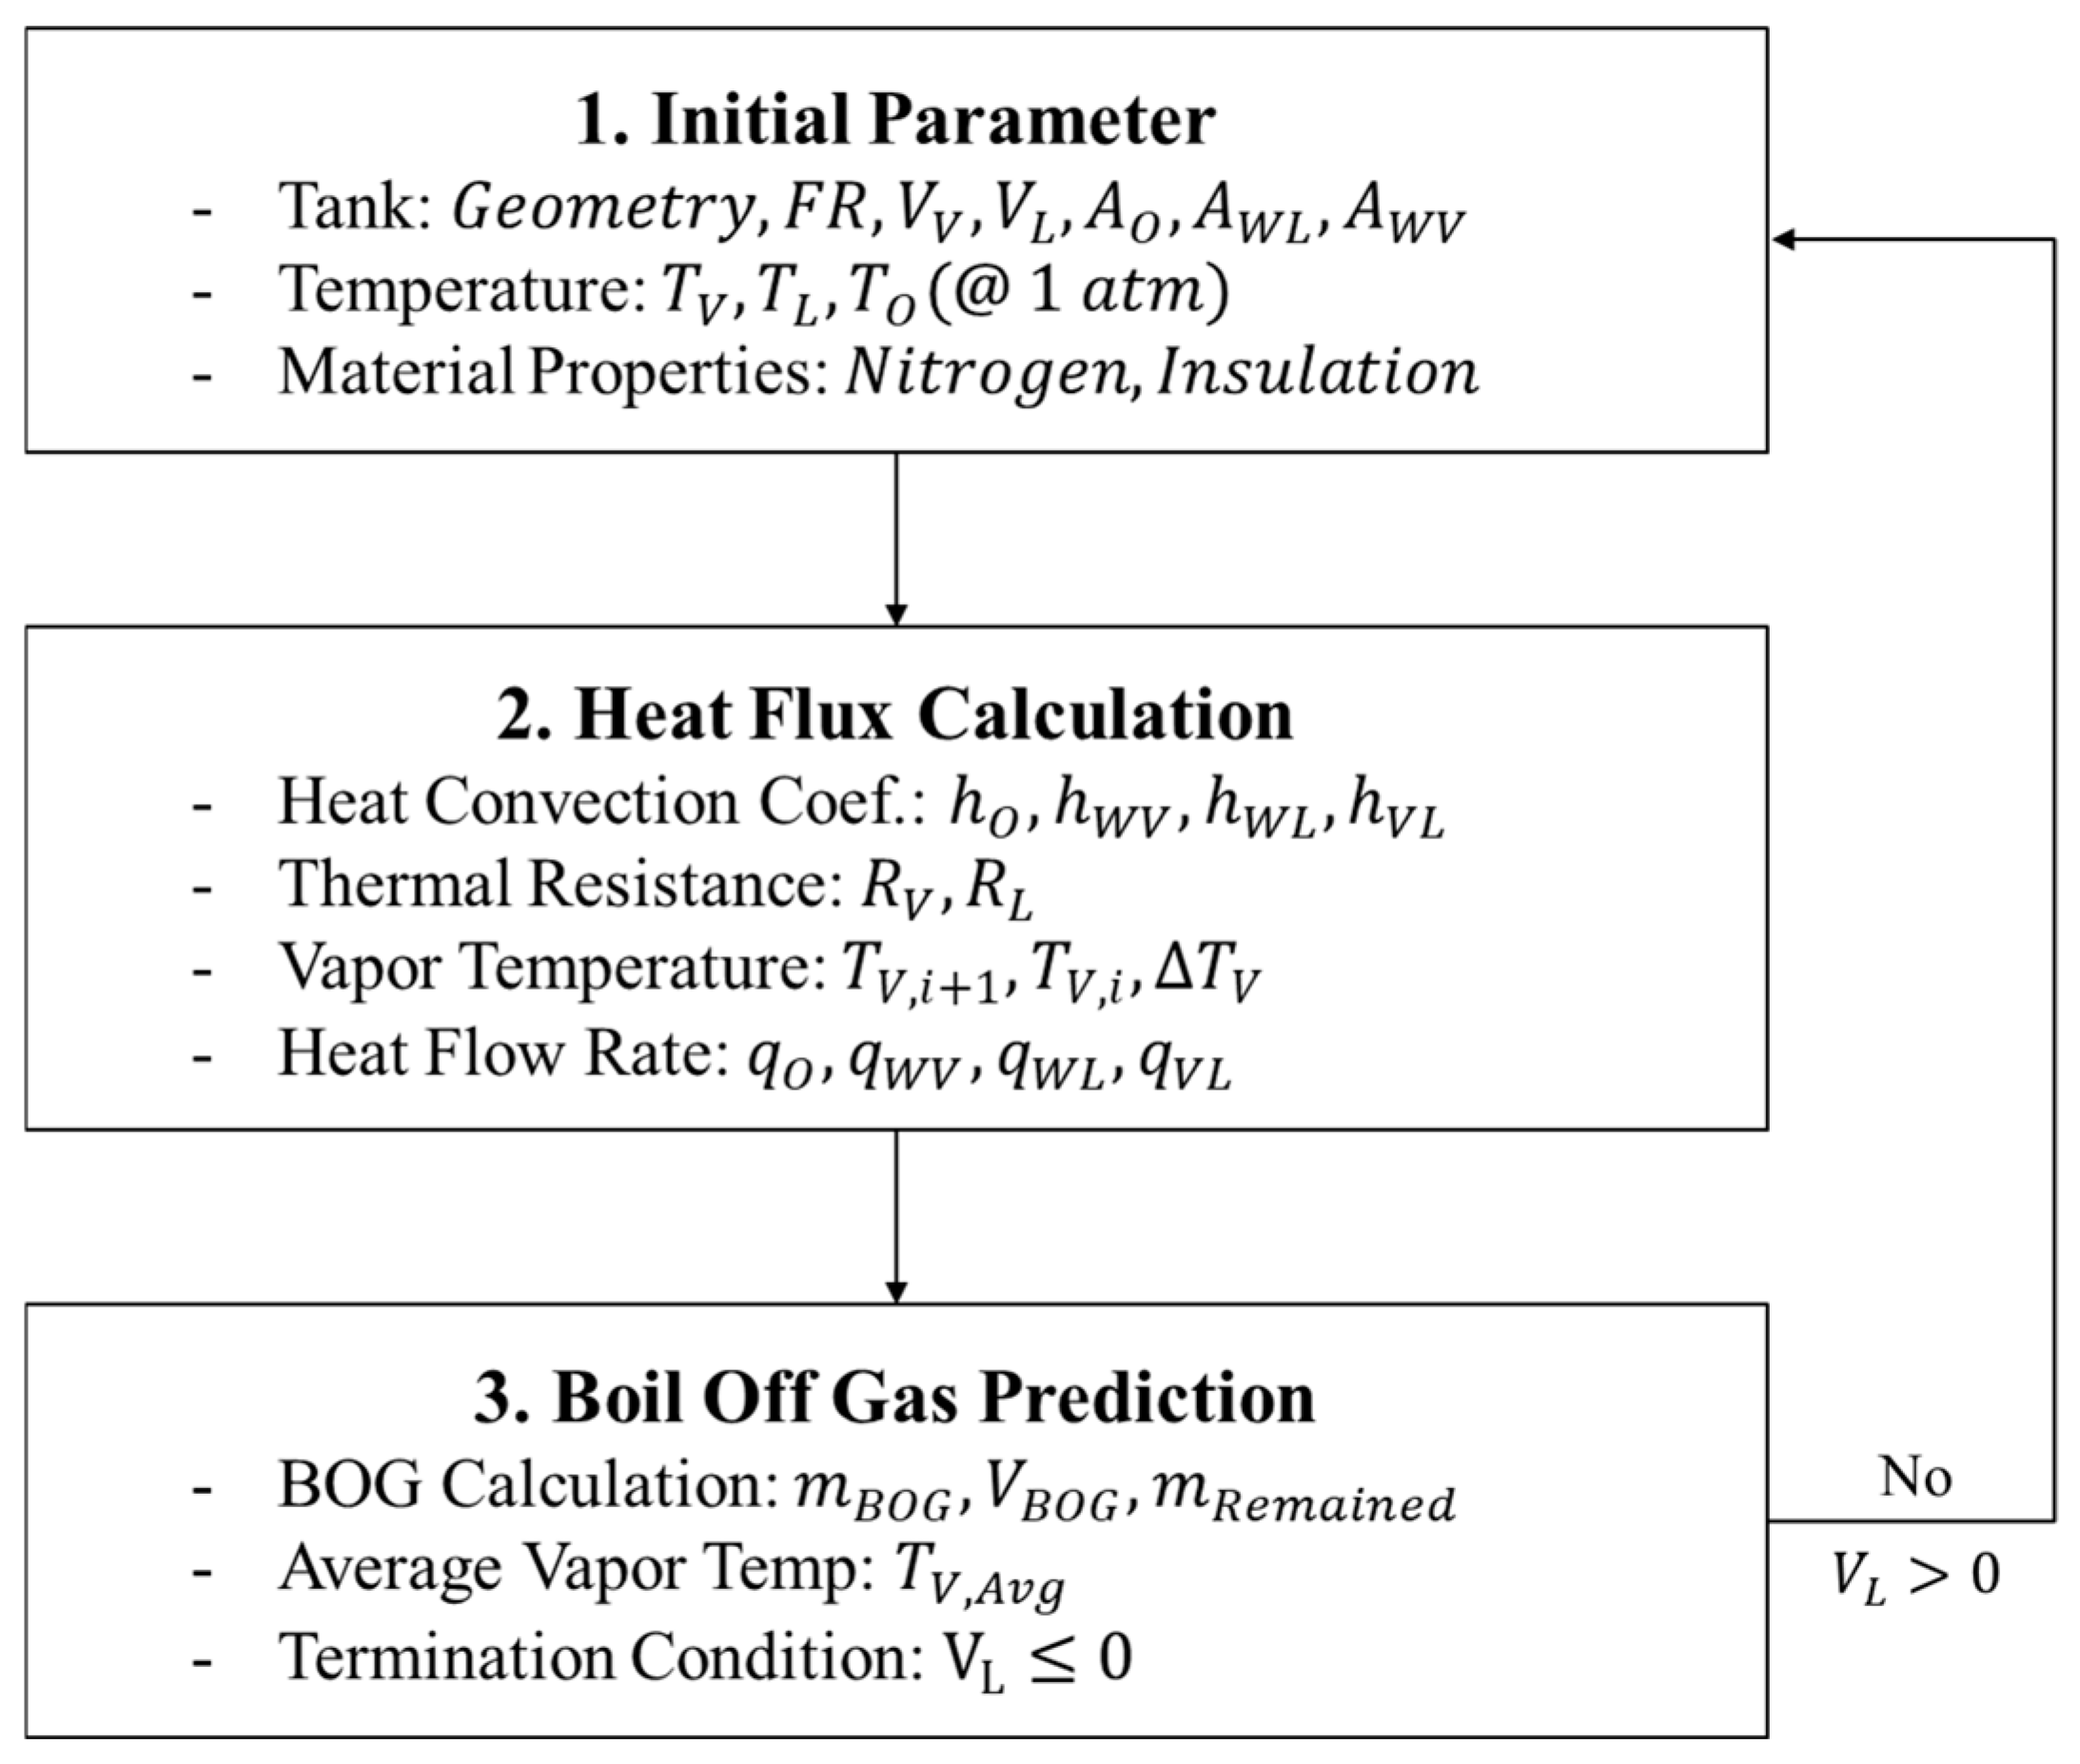
Furthermore, all thermophysical properties are applied dynamically as functions of temperature and pressure through NIST REFPROP [35]. The open-source library CoolProp is employed to iteratively calculate the time-dependent variations in filling ratio, heat flow rates, vapor and liquid temperatures, and evaporated mass. By applying the time increments defined in Equations (18)–(25), the model generates the time history of BOG production and vapor temperature evolution up to complete evaporation. The overall computational procedure is illustrated schematically in Figure 4.

2.4. BOG Prediction Model Using BoilFAST

The applicability of the TDM-based BOG prediction model developed in this study was examined using BoilFAST, an open-source software created at the University of Western Australia [36]. BoilFAST is built on the concept of a superheated vapor (SHV). In this framework, the saturated liquid and the superheated vapor inside the tank are each idealized as lumped masses, which allows the calculation of the time-dependent variations in thermodynamic states. Although the two phases remain in a nonequilibrium state, they gradually approach thermodynamic equilibrium through heat exchange across the interface. The heat transfer structure of BoilFAST and the relationships among the state variables are schematically shown in Figure 5.
In BoilFAST, the input variables required for BOG prediction include tank geometry, heat transfer boundary conditions, and the initial thermodynamic states of the liquid and vapor phases. The initial conditions are the vapor temperature T V , liquid temperature T L , relief pressure P r e l i e f , and the volumes of the liquid and vapor phases are determined by the filling ratio (F/R). From these values, the contact areas of the inner wall with the vapor A W V and with the liquid A W L are determined.
Heat-transfer boundary conditions can be specified in two ways: (i) by directly defining the convective HTCs at the external–liquid, external–vapor, and vapor–liquid interface boundaries, or (ii) by prescribing the heat input rates for each region. This study adopted the first approach, based on convective HTCs. However, BoilFAST assumes these HTCs to be constant and does not account for variation caused by changes in filling ratio or vapor temperature. In addition, BoilFAST cannot subdivide heat transfer pathways into a thermal resistance network. The heat transfer of each region must instead be simplified and input as equivalent convective HTCs. Accordingly, the empirical correlations of the TDM model (Equations (1)–(10)) were applied in this study to calculate the convective HTCs for each region ( h O , h W L , h W V ). These values were then used to derive the equivalent convective HTCs from the external environment to the liquid and vapor phases ( h O L , h O V ), following the BoilFAST input format. This conversion is expressed in Equations (26)–(29).
q O L = h O L A W L T O T L
h O L = 1 h O A O + t I n s k I n s A I n s + 1 h W L A W L A O
q O V = h O V A W V T O T V
h O V = 1 h O A O + t I n s k I n s A I n s + 1 h W V A W V A O
The interfacial heat flow rate q V L is traditionally calculated from the convective HTC ( h V L ) obtained through experiments. However, this experimentally derived h V L depends on specific factors such as tank geometry, size, and thermodynamic conditions during the BOG measurements. As a result, it is often assumed to be constant, which imposes a fundamental limitation [16]. To address this problem, the present study applies the empirical correlation in Equation (11) to calculate h V L dynamically as a function of vapor temperature over time. This method provides a more precise and physically consistent representation of the heat transfer boundary condition at the vapor–liquid interface, which captures its time-dependent variation with vapor temperature.
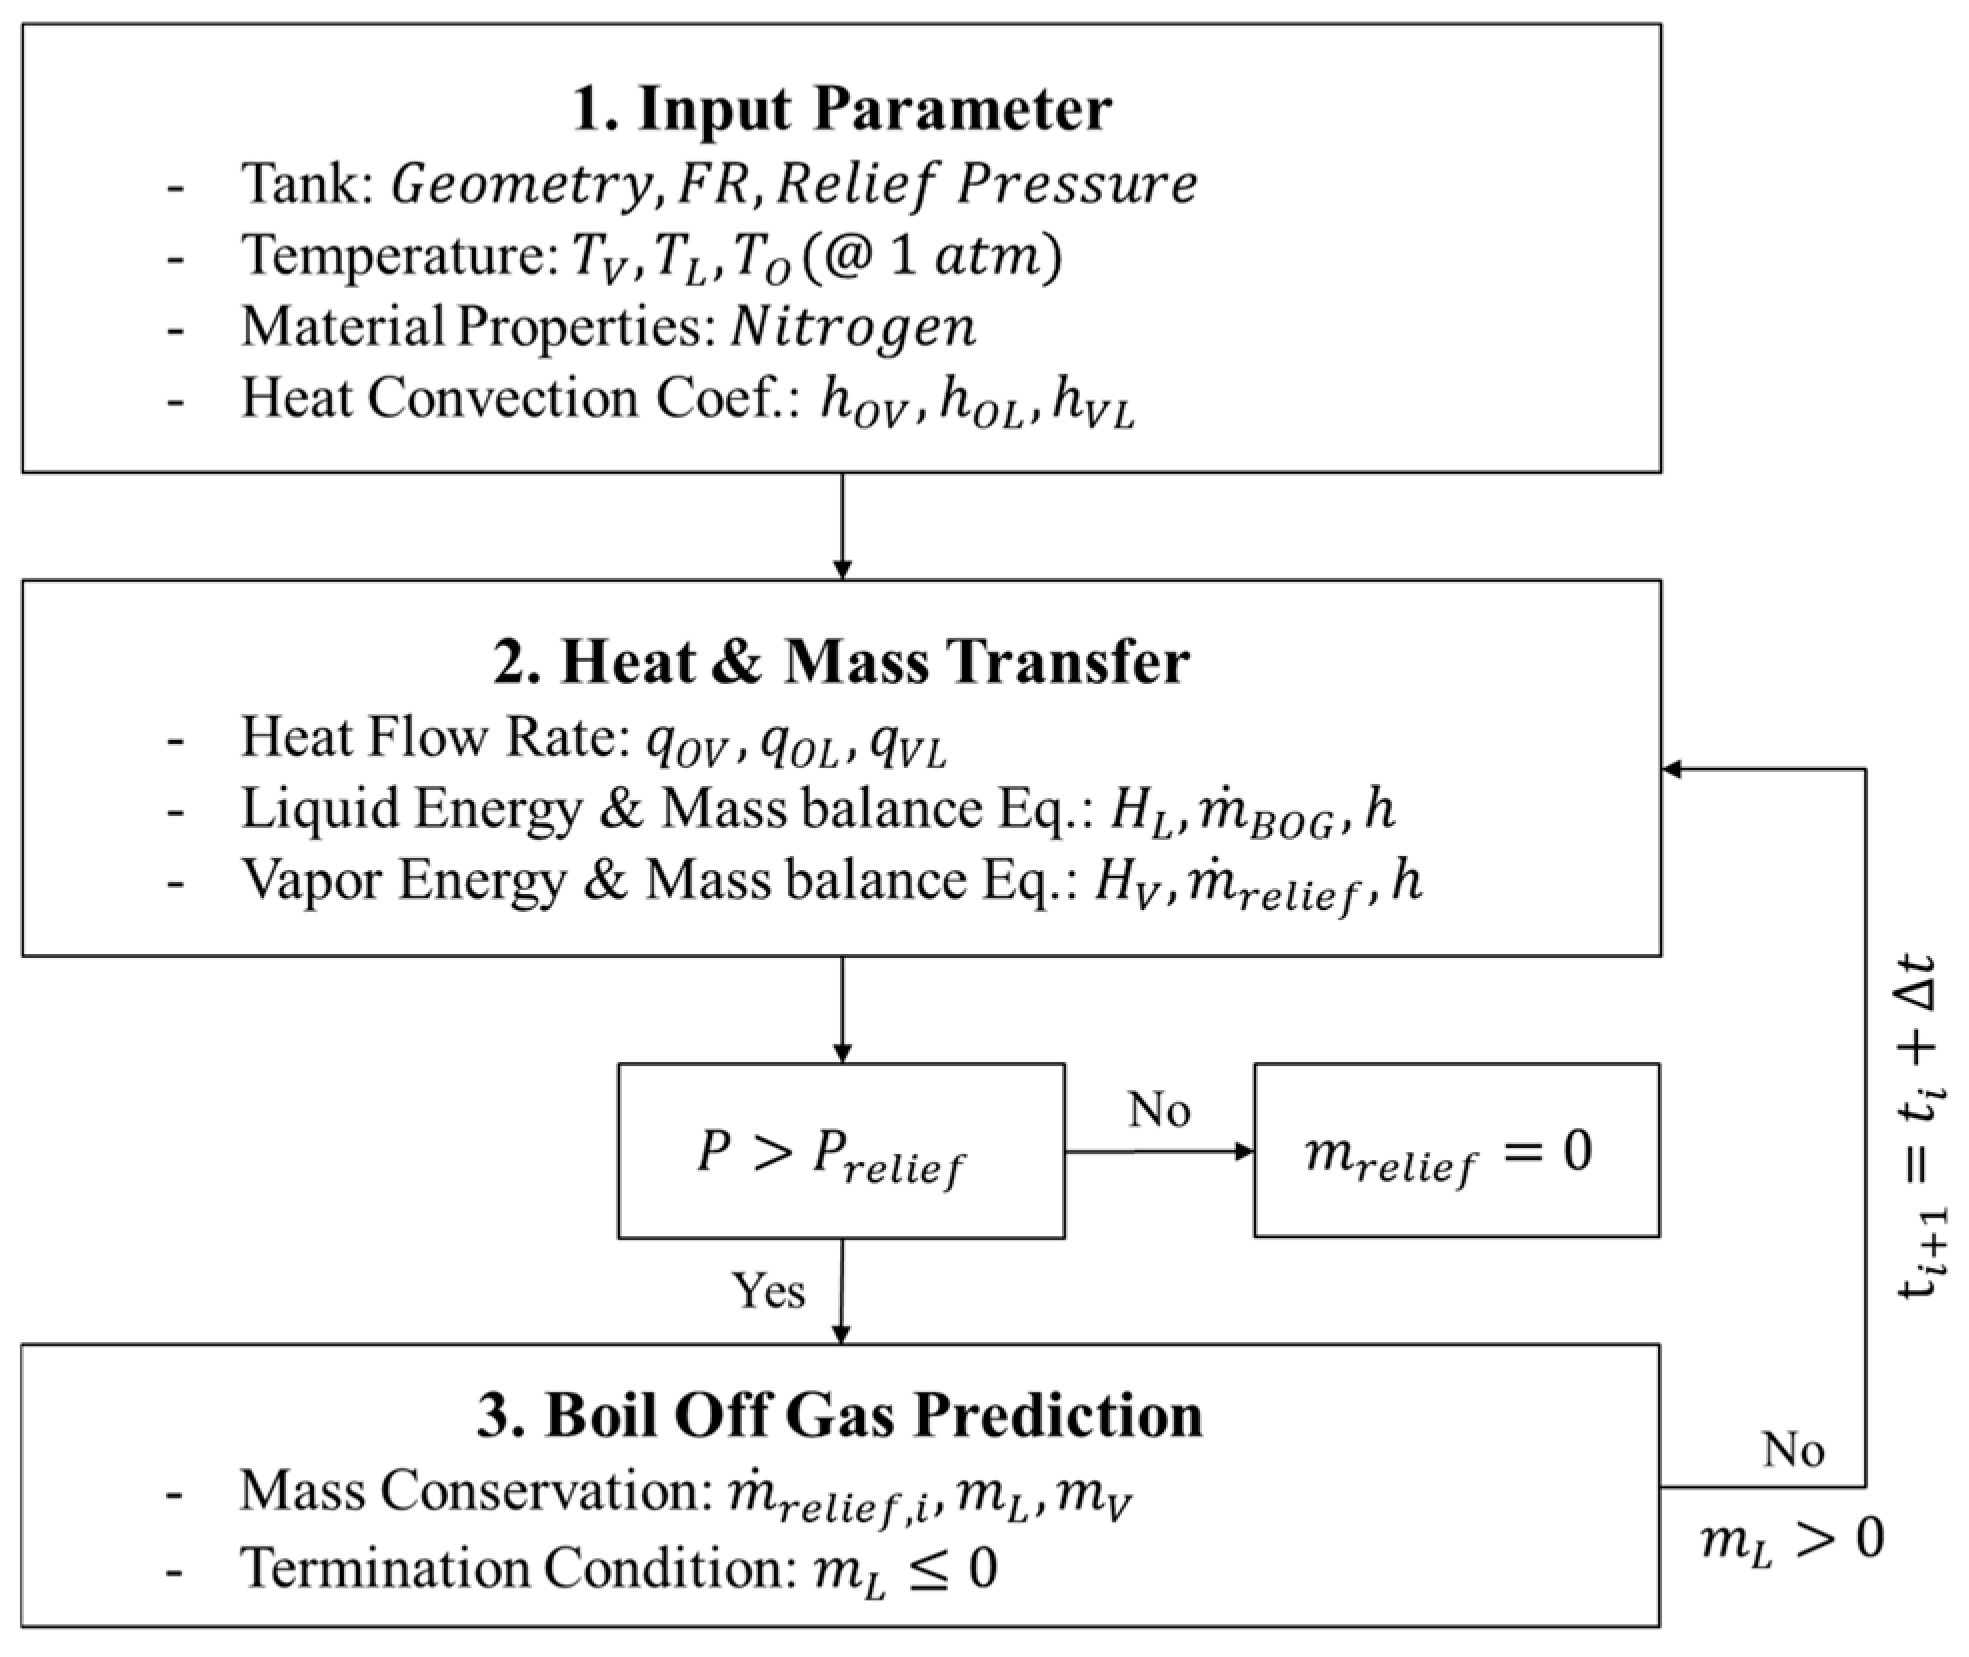
BoilFAST evaluates variations in the state variables of each phase based on the conservation of mass and energy. Denoting the enthalpies of the liquid and vapor phases ( J ) as H L and H V , respectively, and the specific enthalpy of the evaporated vapor ( J / k g ) as h , the corresponding energy balance equations are given in the following equations:
q O L + q V L = d H L d t m ˙ B O G h
q O V q V L = d H V d t m ˙ r e l i e f h + m ˙ B O G h
The mass flow rate of evaporated vapor m ˙ B O G ( k g / s ), is calculated from the energy variation of the fluid inside the tank, while the discharged BOG m ˙ r e l i e f ( k g / s ), is determined from the mass conservation equation using the Newton–Raphson numerical method. This can be expressed as Equation (32) [36]:
m ˙ r e l i e f , i = m L + m V i 1 m L + m V i
Here, i denotes the simulation time step, while m L and m V represent the masses of the liquid and vapor phases ( k g ), respectively. BoilFAST updates the thermodynamic states of the liquid and vapor phases (including mass, enthalpy, and temperature) iteratively over time, with the state variables calculated using the Helmholtz-based equation of state (HEOS). More specifically, the thermophysical properties of the vapor phase are evaluated based on the average temperature of the entire vapor region. The computational procedure is illustrated in Figure 6.

2.5. BOG Prediction Model Using SINDA/FLUINT

The accuracy of the BOG prediction model was further assessed using SINDA/FLUINT 2024 R1, a simulation software similar to BoilFAST v1.0.0 that applies the TDM framework for phase change and heat transfer. In SINDA/FLUINT, conduction, convection, and radiation between analysis nodes are represented as thermal resistances. Together, these resistances and nodes form a thermal resistance network that defines heat transfer pathways and system heat input [37]. The internal fluid within the tank is idealized using a twin-lump approach, where the liquid and vapor phases are modeled separately. This setup allows continuous calculation of filling ratio, pressure, and thermodynamic states over time.
Additionally, the software determines the filling ratio and interfacial area automatically based on tank geometry and gravitational orientation. By combining FDM-based conduction analysis with the lumped-mass approach, SINDA/FLUINT incorporates both thermodynamic state variations and phase change phenomena simultaneously [38,39]. The thermal resistance network structure and the twin-lump modeling concept of SINDA/FLUINT are schematically illustrated in Figure 7.
Heat transfer from the external environment through the outer wall and insulation is modeled in the thermal resistance network using Conductors, which represent the connecting elements between nodes. Heat transfer through the insulation is calculated based on the temperature difference between adjacent nodes T N o d e located between the outer and inner tank walls. The resulting temperature gradient is analyzed using the FDM conduction equation. Equation (33) defines the thermal resistance network within the insulation, where G I n s denotes the conductance given in Equation (34).
m c p N o d e ( j ) T N o d e j t = G I n s T N o d e j + 1 T N o d e j
G I n s = k I n s · A c o n d . t I n s
Here, m is the mass of the node ( k g ), C p is the specific heat of the node at constant pressure ( J / k g · K ), A c o n d represents the heat transfer area ( m 2 ) between nodes, and t I n s is the insulation thickness ( m ).
Heat transfer from the inner wall to the fluid is modeled through a combined structure of the thermal resistance network and the twin-lump approach. Heat transfer from the inner wall node to the fluid lump is implemented using Tie and FTie elements, which account simultaneously for thermodynamic state changes and fluid phase change. Mass transfer between fluid phases is modeled with Path elements. The discharge of evaporated BOG is also represented using Path elements, where the vapor lump is connected to a Plenum Lump (an assumed infinite volume lump) to simulate external venting conditions. The primary components used in the thermal resistance network are summarized in Table 1.
Convective heat transfer on the external and internal tank surfaces was calculated using the built-in empirical correlations of SINDA/FLUINT. For convection from the external environment to the outer wall, the HTC was determined by selecting the appropriate correlation for each surface location (upper, lower, and side) according to the flow characteristics [40]. Similar to the TDM-based model, the external heat ingress was divided into contributions from the upper, lower, and side surfaces. For the upper outer surface, the natural convection correlation proposed by Goldstein et al. [41] was applied, as expressed in Equation (35). This correlation is expressed in terms of the Rayleigh number ( R a ), Prandtl number ( P r ), thermal conductivity ( k ), and characteristic length ( L c ) of air:
h O , U   = 0.527 · R a a i r 0.2 1 + 1.9 / P r a i r 9 / 10 2 / 9 · k a i r L c
For the lower and side surfaces of the outer wall, the HTCs were calculated using Nusselt number correlations for natural convection, which account for the flow characteristics induced by wall temperature variations. Empirical correlations distinguishing laminar and turbulent regimes at each heat transfer location were introduced to improve the accuracy of the HTC calculation [42,43]. The principal correlations used to determine the HTCs are summarized in Table 2.
The heat ingress from the external environment is calculated using Equation (33) through the thermal conduction network, in which the nodes of the outer wall, insulation, and inner wall are connected via Conductors. Heat ingress from the inner wall to the fluid is modeled by connecting the inner wall nodes to the fluid lumps through Tie elements, which enables accounting for convective heat transfer as expressed in Equations (36) and (37).
q W L = h W L · A W L T N o d e T L u m p   D N o d e < D L u m p
q W V = h W V · A W V T N o d e T L u m p   D N o d e > D L u m p
Here, h W L and h W V are the convective HTCs from the inner wall to the liquid and vapor phases, respectively, while A W L and A W V represent the contact areas ( m 2 ) between the inner wall and the fluid. D N o d e and D L u m p indicate the depths of the inner wall node and the fluid lump within the tank, while the relative positions determine the contact areas and the corresponding convective heat transfer.
The convective HTC between the inner wall and the liquid phase ( h W L ) was evaluated using the nucleate boiling correlation of Rohsenow [32]. For the vapor phase, the convective HTC between the inner wall and the vapor phase ( h W V ) was calculated from Nusselt number correlations expressed as functions of the Rayleigh number ( R a W V ), as shown in Equations (38) and (39) [27,42].
h W V = N u W V · k V L c
N u W V = 0.59   R a W V 1 / 4   10 4 R a W V 10 9 0.13   R a W V 1 / 3 10 9 R a W V 10 12
At the vapor–liquid interface, the heat transfer q V L is implemented as convective heat transfer via an FTie element. The heat transfer q V L is divided into the heat transfer from the vapor to the interface ( q V I n t ) and heat transfer from the interface to the liquid ( q I n t L ), which are calculated as follows:
q V I n t = h V I n t A I n t ( T V T I n t )
q I n t L = h I n t L A I n t ( T I n t T L )
Here, the convective HTCs h V I n t and h I n t L are calculated using Equations (11) and (12), with the correction coefficients proposed by Joseph et al. [21] applied ( C V I n t = 0.54, C I n t L = 0.27).
Finally, the BOG generated in the liquid phase is discharged to the external environment via Path elements, while the variation of vapor mass inside the tank, d m V d t is calculated using the mass conservation equation given in Equation (42).
d m V d t = m ˙ V m ˙ r e l i e f
Here, m ˙ V denotes the increasing vapor mass ( k g / s ) over time, while m ˙ r e l i e f represents the mass flow rate of evaporated gas discharged externally ( k g / s ). The overall computational procedure is illustrated in Figure 8.
As summarized above, the three modeling approaches—TDM, BoilFAST, and SINDA/FLUINT—adopt distinct strategies in modeling heat transfer and phase-change phenomena. The proposed TDM model preserves the essential physical interactions among the wall, vapor, and liquid domains through a dynamically updated thermal-resistance network, while maintaining high computational efficiency. This intermediate-fidelity approach bridges the gap between the simplified BoilFAST method and the high-fidelity SINDA/FLUINT solver, offering both physical consistency and rapid convergence. To clarify the differences among these three models, Table 3 summarizes the main computational features and modeling procedures adopted for BOG prediction. This table outlines the characteristic modeling fidelity, boundary treatments, and numerical formulations applied in each method, thereby providing a clearer context for the comparative validation presented in Section 3.

3. Validation and Comparative Analysis of BOG Prediction Models

Although each model adopts different procedures, this study aims to comparatively assess their modeling fidelity and computational performance under identical boundary and material conditions.

3.1. Problem Definition

In this section, the proposed TDM-based BOG model is applied to a hypothetical liquid nitrogen storage tank. The model predicts the time-dependent BOG generation together with the temperature variations of the liquid and vapor phases. The analysis considers a simplified rectangular cuboid tank with a storage capacity of 1 m 3 . This geometry was selected because it simplifies modeling: the liquid volume decreases linearly under external heat ingress, while the interfacial area remains constant.
The tank is assumed to be a single-hull structure made of stainless steel (STS304), with expanded polystyrene (EPS) insulation on the outer wall. The initial condition is set to a filling ratio of 80%. Both liquid and vapor phases are assumed to be at saturation temperature under open-vent conditions. The external thermal environment of the tank and the initial conditions are illustrated in Figure 9. The main specifications are summarized in Table 4.

3.2. Comparative Performance of TDM, BoilFAST, and SINDA/FLUINT

Long-term BOG prediction was carried out by incorporating external heat transfer to the liquid and vapor phases together with convective heat transfer at the vapor–liquid interface. The TDM model calculated vapor temperature variation and BOG generation up to complete evaporation, starting from an initial filling ratio of 80% with a time step of 5 s. In this analysis, the time-dependent variation of convective HTCs was included in the thermal resistance network, which allows for precise modeling of heat input as the filling ratio changed.
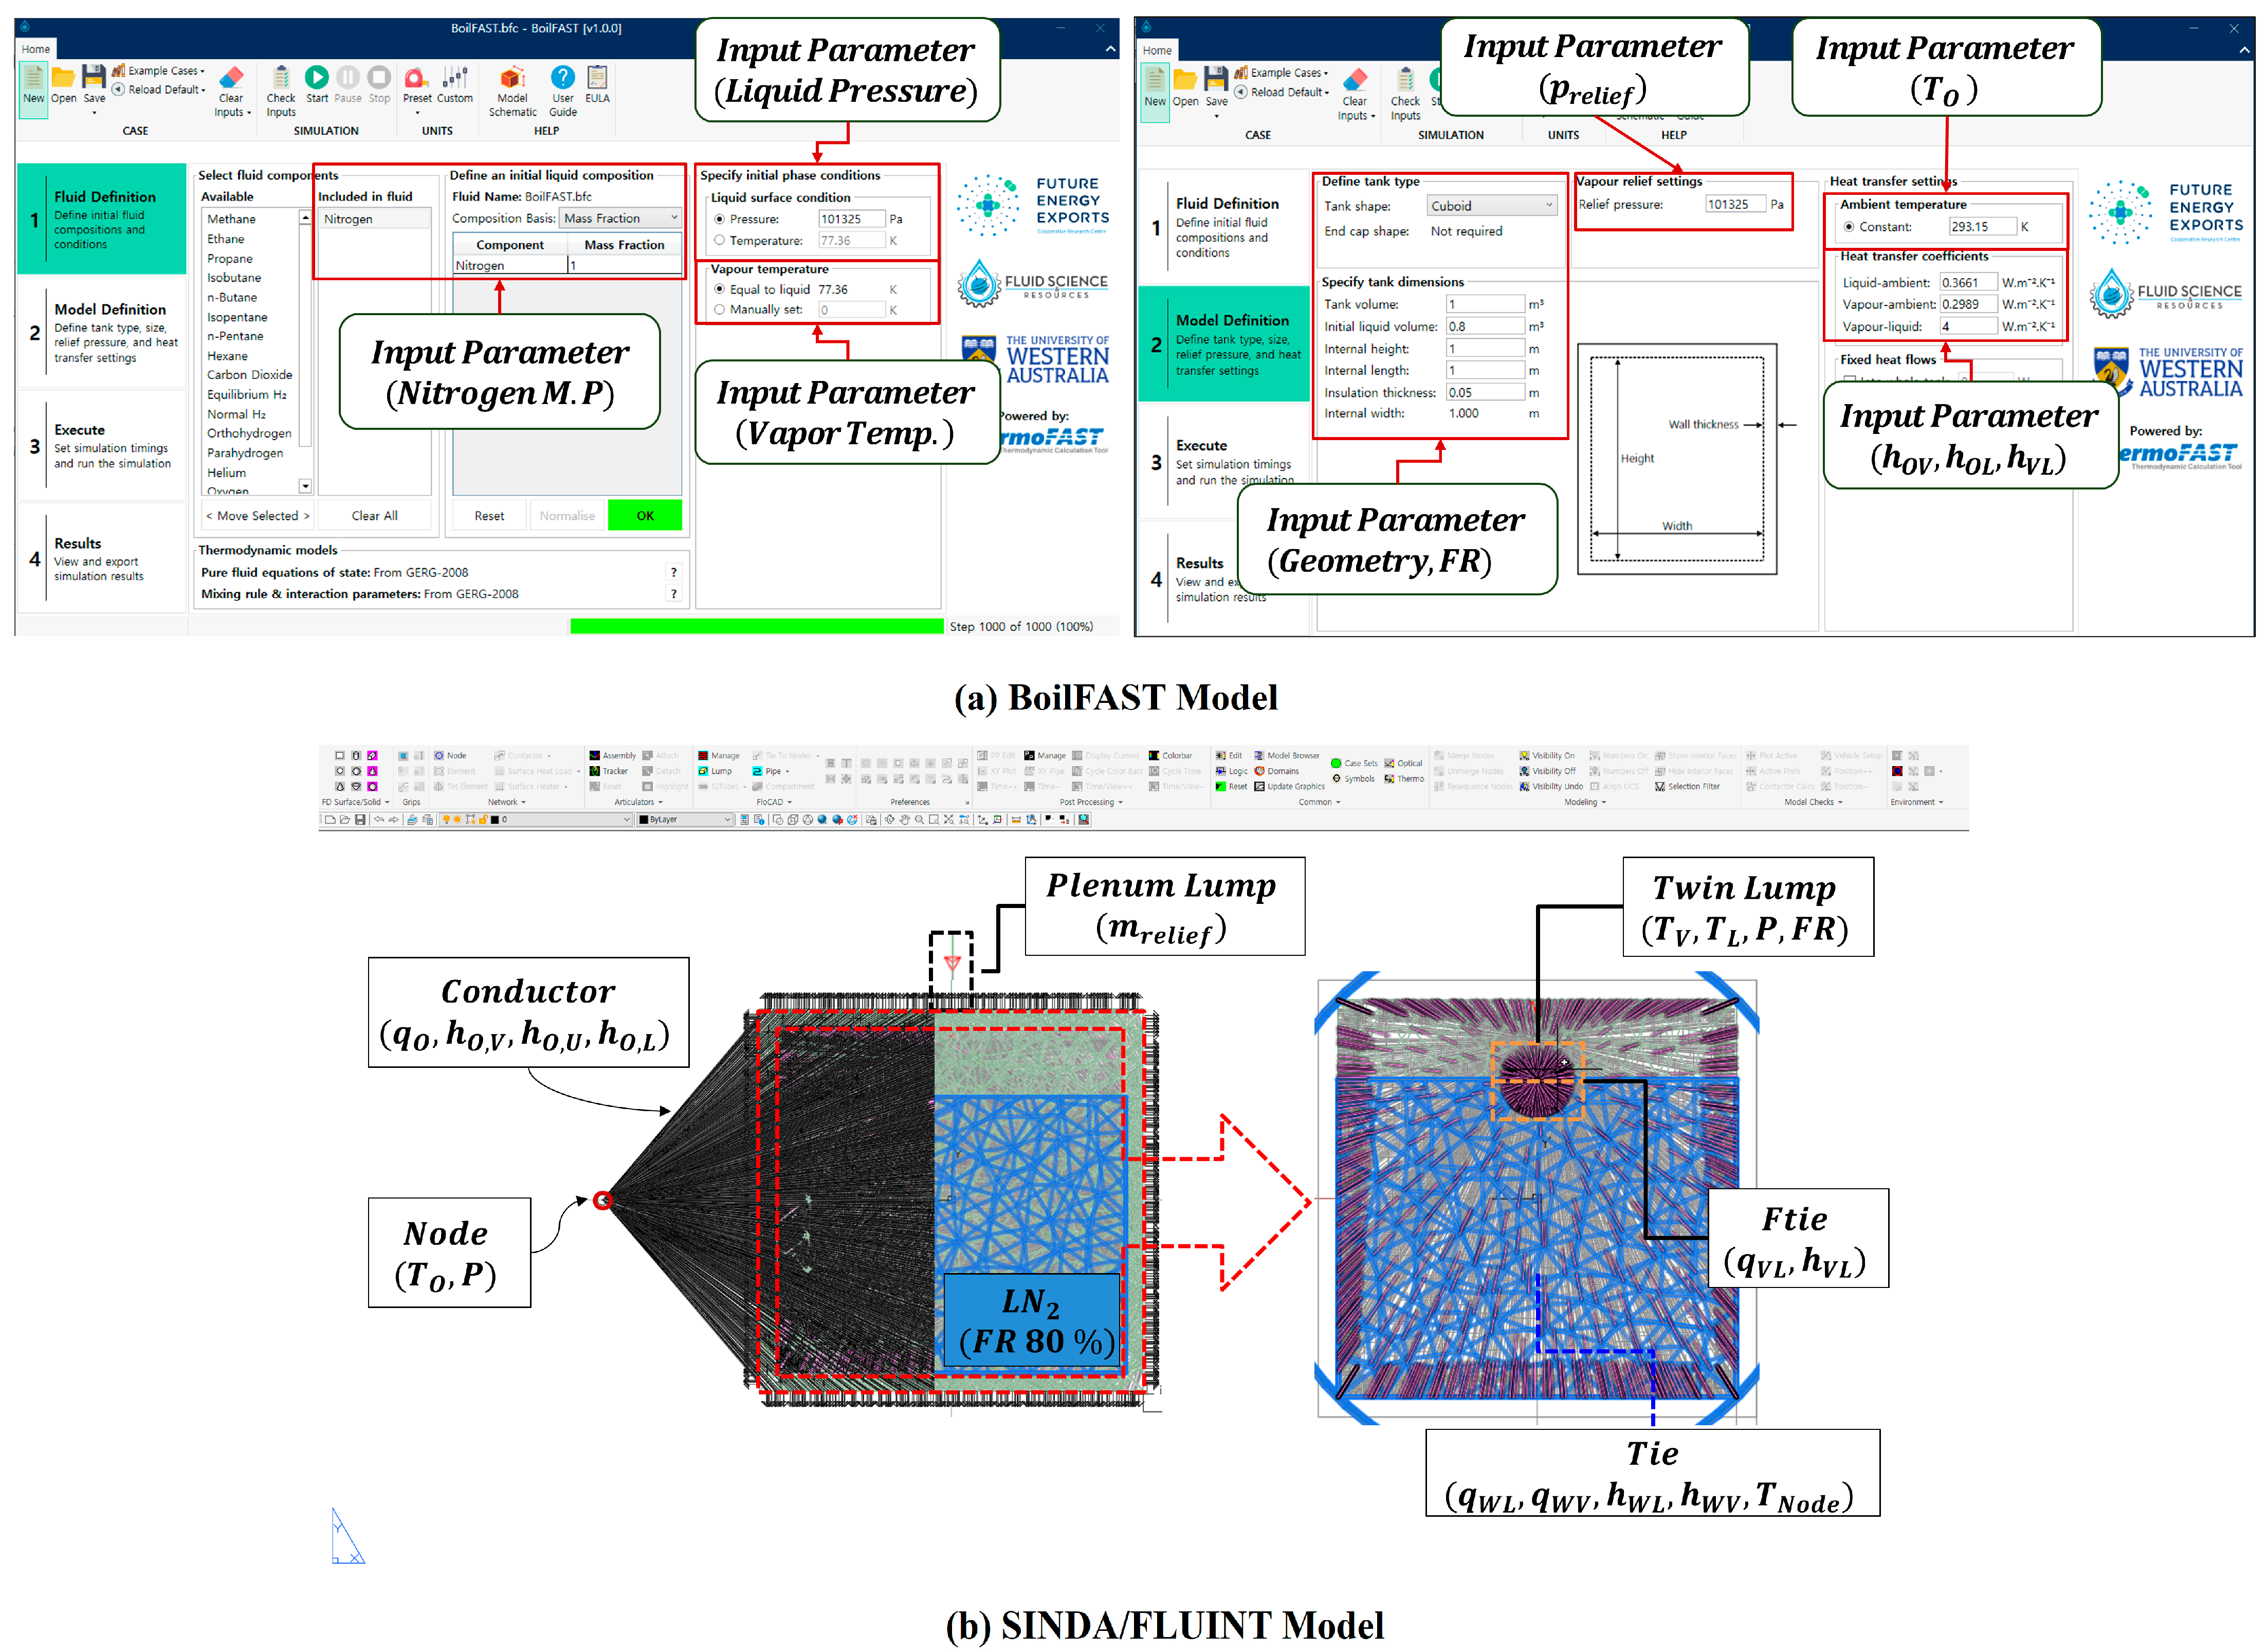
For comparison, the SHV model of BoilFAST and the twin-lump model of SINDA/FLUINT were also applied under the same conditions. Each analysis followed the specific computational procedure of its respective model. Temporal variations of convective HTCs and heat flow rates within the thermal resistance network were examined during these simulations. The BOG prediction results were compared based on the phase change of the liquid and the thermodynamic state variations of the vapor. The empirical correlations for convective HTCs at each heat transfer location, described in Section 2, were applied in all cases. The corresponding results are summarized in Table 5. The boundary conditions for BoilFAST and the modeling configuration of SINDA/FLUINT are illustrated in Figure 10.
The convective HTCs obtained from each model vary with the boundary condition configurations of the analytical framework, and their temporal trends also differ. In the TDM and SINDA/FLUINT models, the convective heat transfer from the external environment to the tank surface was classified by surface location as the upper ( h O , U ), lower ( h O , L ), and side ( h O , V ) surfaces. In this study, the average convective HTCs calculated with the TDM model were 3.63 W / m 2 K , 7.14 W / m 2 K , and 10.79 W / m 2 K for the upper, lower, and side surfaces, respectively, as obtained from Equations (1)–(6).
BoilFAST employed the same empirical correlations as the TDM model to evaluate HTCs. However, its simplified framework treated the heat transfer boundary conditions as constants acting directly between the external environment and the fluid. Accordingly, the multi-layered thermal resistances along the ambient–tank wall–fluid pathway were converted into equivalent HTCs, as illustrated in Figure 11a. The equivalent values were 0.366 W / m 2 K for the external–liquid path and 0.299 W / m 2 K for the external–vapor path.
Because BoilFAST uses simplified boundary conditions, direct comparison with detailed models such as TDM and SINDA/FLUINT is not meaningful. For this reason, the present study compared only the time-dependent convective HTCs from TDM and SINDA/FLUINT. Figure 11 shows the temporal variations of the external convective HTCs ( h O , U , h O , L , h O , V ) calculated by both models. The maximum difference between them reached a factor of about 2.5, due to differences in temperature gradients and airflow characteristics at the various surfaces.
The TDM model distinguishes laminar and turbulent flow regimes using the Rayleigh number for each surface and applies the appropriate Nusselt number correlations. This approach reflects the physical heat transfer behavior under natural convection and captures the time-dependent heat ingress with high fidelity. The calculated convective HTCs ranged from 1.8 to 18 W / m 2 K , remaining within the natural convection regime and confirming the physical validity of the model.
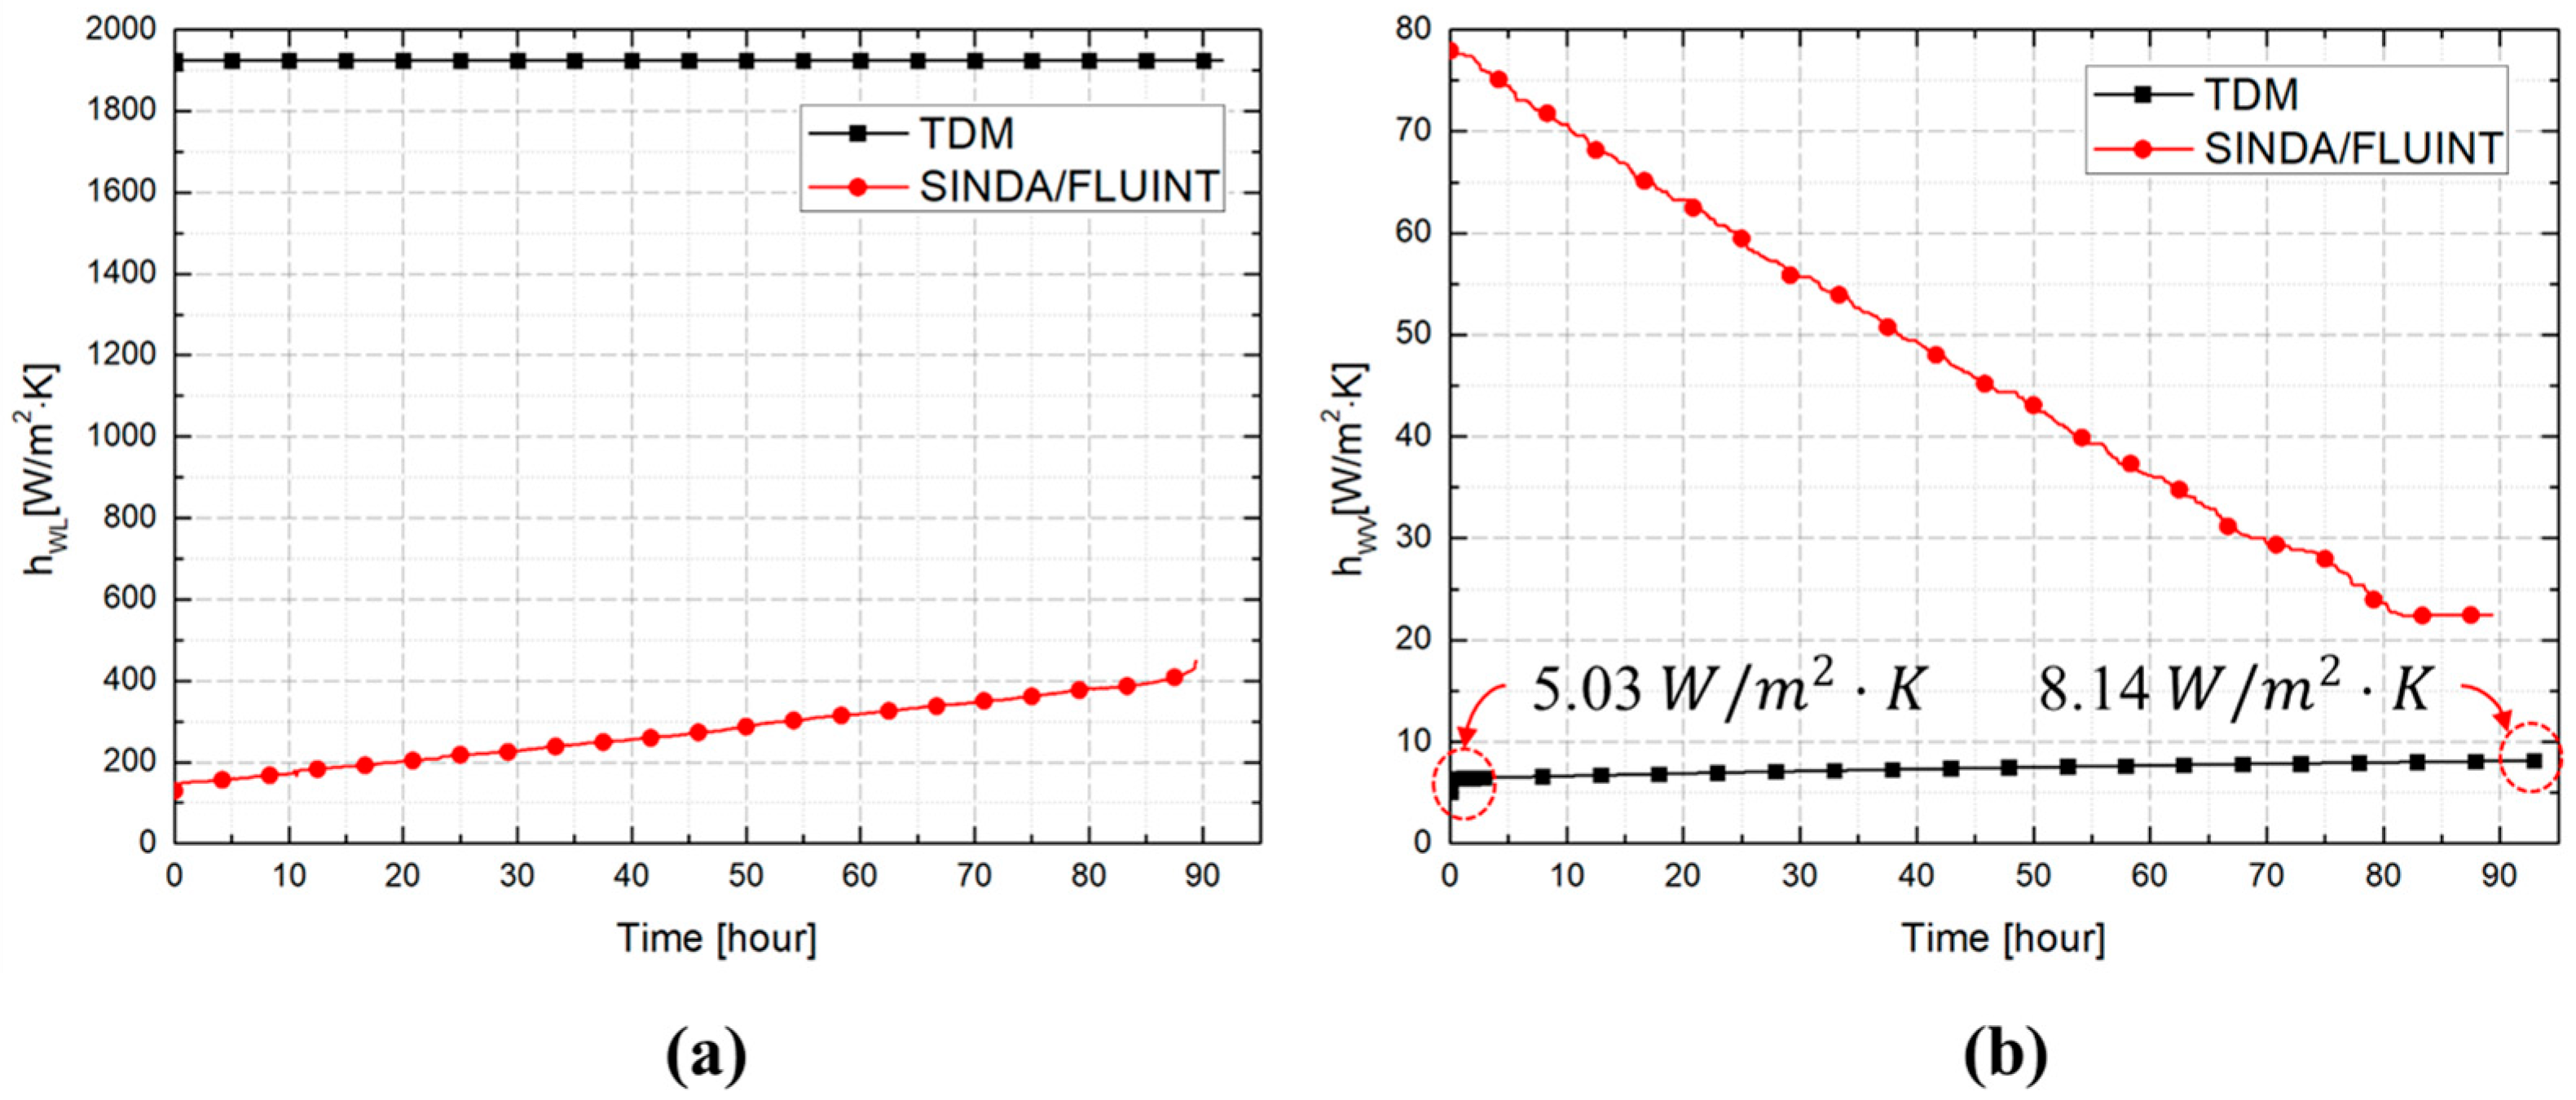
The convective HTCs from the inner wall to the liquid ( h W L ) and from the inner wall to the vapor ( h W V ) are presented in Figure 12. The analysis showed differences of up to a factor of 10 between the TDM and SINDA/FLUINT models, which can be attributed to differences in how the heat transfer boundary conditions are defined. In the TDM model, the intermediate insulation temperature for the natural convection correlation was taken as the average of the ambient temperature and the saturation temperature of nitrogen at 1 atm. The temperatures of the outer and inner walls were updated over time via the thermal resistance network, which also determined the intermediate temperature. Since the temperature difference between the outer wall and the ambient air was found to be minimal, the convective heat transfer coefficient at the outer wall in contact with the liquid region was considered nearly constant. As a result, the convective HTC at the inner wall in contact with the liquid phase ( h W L ) remained constant over time, while the convective HTC at the inner wall in contact with the vapor phase ( h W V ) increased gradually with rising vapor temperature. In contrast, the SINDA/FLUINT model used a coupled heat transfer approach that included conduction analysis of the tank wall and insulation. At each time step, the temperature distribution within the insulation was calculated, the inner wall temperature was updated, and the convective HTCs were derived from this updated condition. Because of these methodological differences, the two models produced significantly different HTC predictions under the same operating conditions.
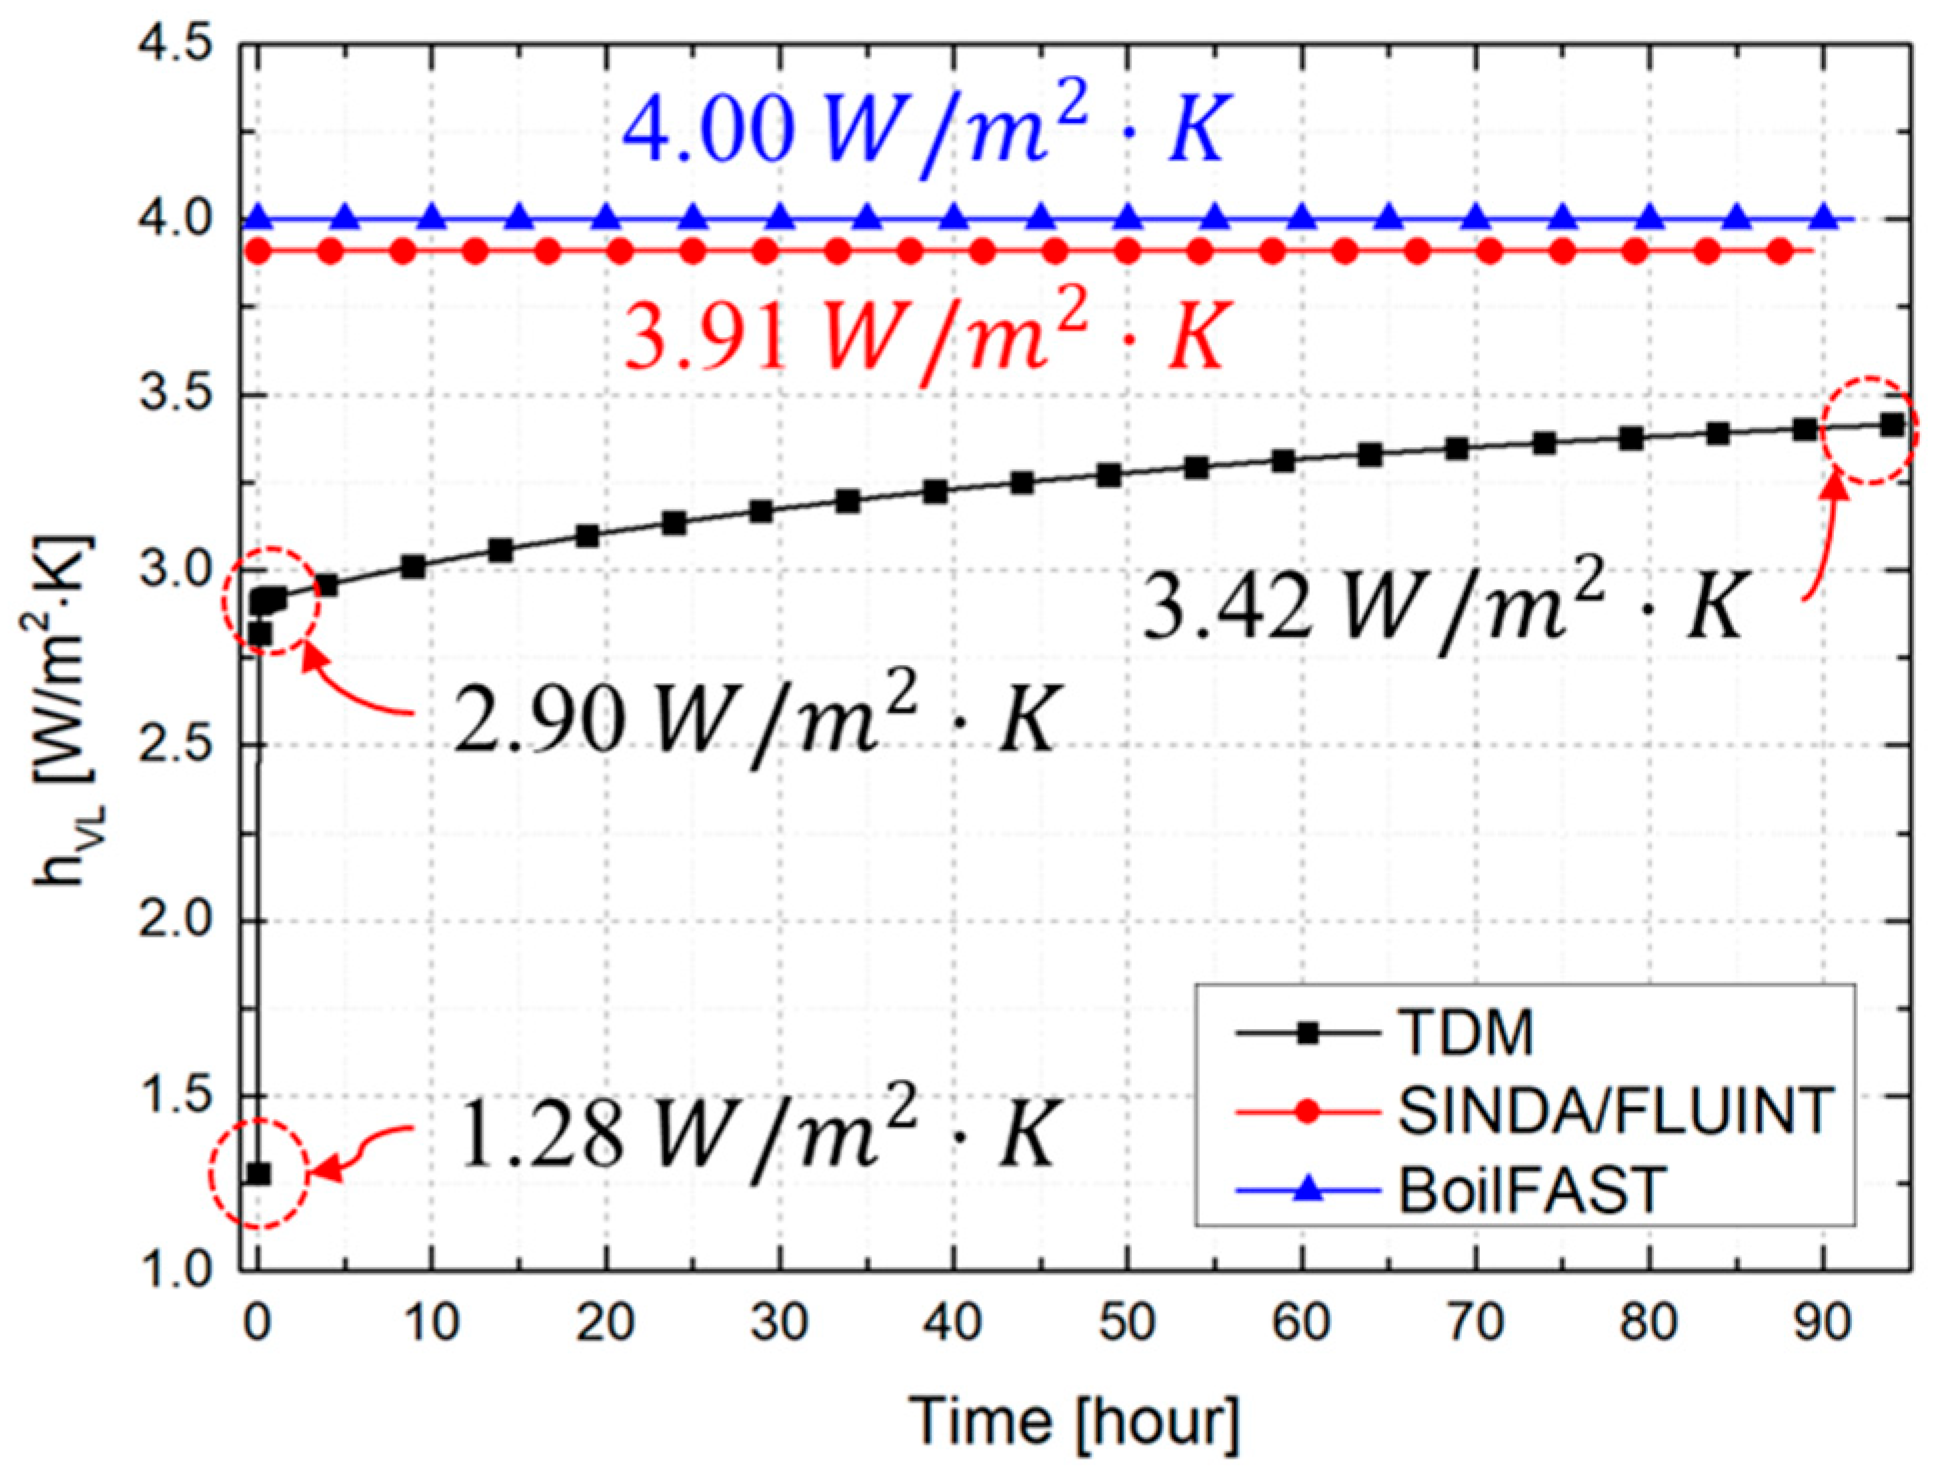
The convective HTC at the vapor–liquid interface ( h V L ) is presented in Figure 13, comparing results from the TDM, BoilFAST, and SINDA/FLUINT models. For external convective HTCs at the tank surface, direct comparison with BoilFAST was not possible because of its simplified boundary conditions. However, at the vapor–liquid interface, the coefficients could be applied consistently, which allows a direct comparison of the three models. In SINDA/FLUINT, the convective HTCs for the vapor–interface and interface–liquid regions were evaluated separately. For this study, they were converted into equivalent HTCs to enable comparison under a unified criterion.
BoilFAST applied a correction coefficient of 4.0 W / m 2 · K based on the experimental data of Perez et al. [15], while SINDA/FLUINT produced a nearly constant value of approximately 3.91 W / m 2 · K .
By contrast, the TDM model predicted a time-dependent increase in h V L , with an average of 3.26 W / m 2 · K up to complete evaporation—about 20% lower than the other models. These differences reflect the distinct empirical correlations used and the different ways in which each model incorporates fluid properties, even under the same natural convection conditions.
The TDM model was specifically formulated to capture the physical effect of the growing temperature difference between the vapor and liquid phases as vapor temperature rises, which enhances heat ingress. At the start of the analysis, h V L increased sharply from 1.28 W / m 2 · K to 2.90 W / m 2 · K . This early jump occurred because external heat ingress was mainly absorbed by the vapor region. Thanks to its relatively small heat capacity compared to the liquid, the vapor warmed quickly, which increased the temperature difference across the interface and drove a short-term rise in convective HTC.
The heat flow rates along the thermal pathways of the tank were classified into three categories, consistent with the convective HTC analysis: external–tank wall ( q O L , q O V ), inner wall–fluid ( q W L , q W V ), and vapor–liquid interface ( q V L ). The heat flow rates from the external environment to the tank wall ( q O L , q O V ) were compared between the TDM and SINDA/FLUINT models, while the heat flow rates from the inner wall to the fluid ( q W L , q W V ) were assumed to be identical to the ingress through the outer wall, consistent with the law of energy conservation. For this reason, the BoilFAST results were also included in the analysis.
Figure 14 compares heat flow rates at the tank outer wall for the upper, lower, and side surface. Overall, both models exhibited similar temporal trends in heat flow rate; however, discrepancies were observed depending on the surface location. For the upper and lower surfaces, the SINDA/FLUINT model predicted average heat flow rates that were 13.7% and 3.8% lower, respectively, than those predicted by the TDM model. By contrast, for the side surface, SINDA/FLUINT yielded an 11.8% higher heat flow rate. These differences are attributed to variations in the methods used by each model to determine HTCs and define surface temperatures, as discussed earlier.
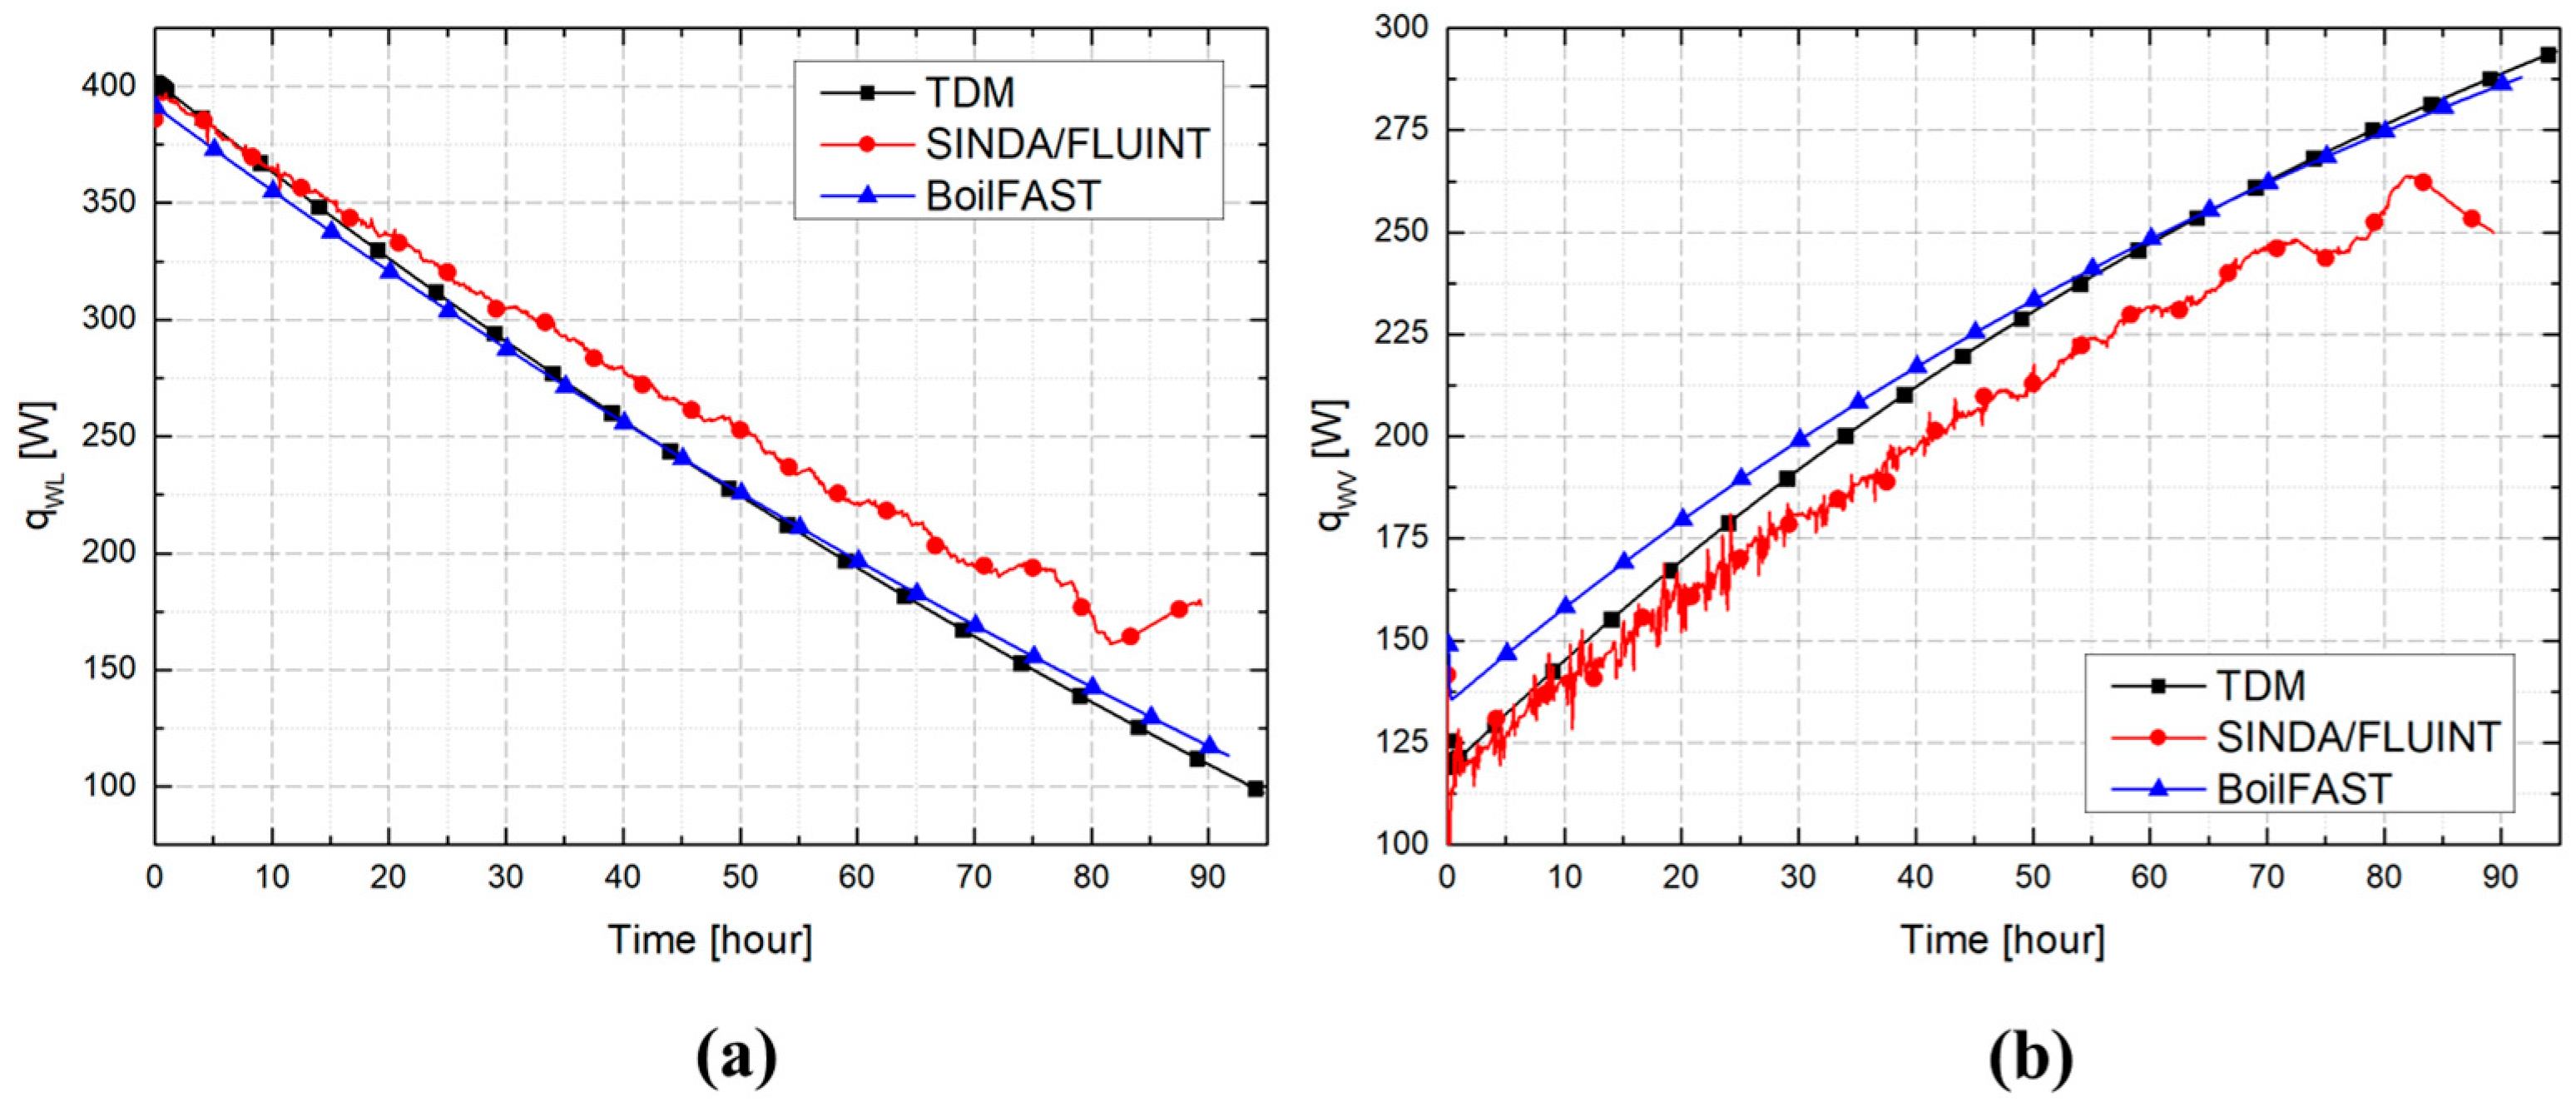
The heat ingress from the inner wall to the liquid and vapor phases ( q W L , q W V ) is shown in Figure 15, where the results of the TDM, SINDA/FLUINT, and BoilFAST models are compared. Unlike the temporal variations of the convective heat transfer coefficients ( h W V , h W L ), the overall heat flow rate trends predicted by the three models were similar. This outcome is attributed to the fact that, when calculating the heat ingress from the external environment to the fluid, the thermal conductivity of the insulation played a more dominant role than the convective HTCs, thereby reducing discrepancies among the models. As shown in Figure 15, the heat ingress into the liquid phase gradually decreased over time, whereas that into the vapor phase increased. This trend reflects the decline in filling ratio during evaporation. The resulting changes in the contact areas between the inner wall and the liquid and vapor redistributed the heat ingress between the two phases.
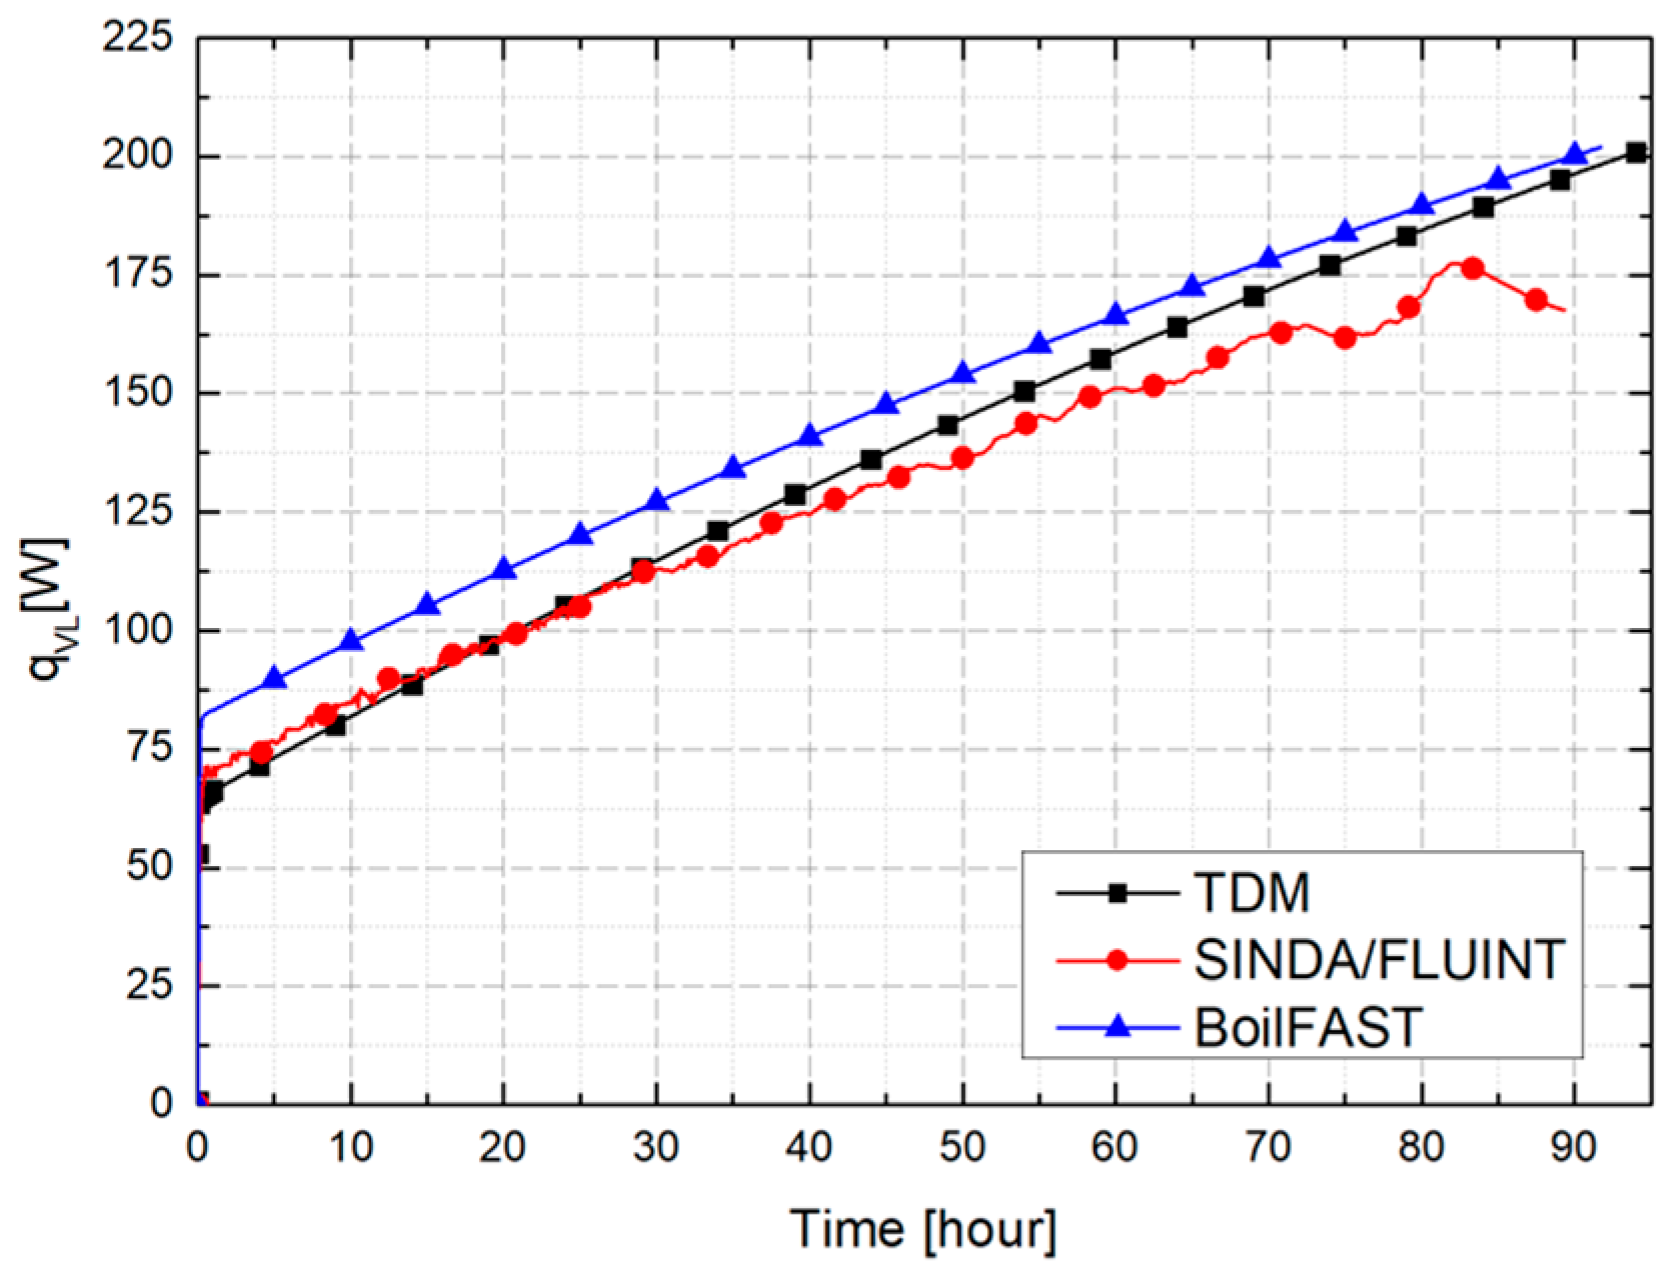
Figure 16 shows the temporal variation of the heat flow rate at the vapor–liquid interface ( q V L ). In all models, q V L showed an initial sharp increase in heat ingress, followed by a continuous rise over time. This behavior is attributed to the fact that, in the initial equilibrium state, external heat ingress caused the vapor temperature to increase more rapidly than the liquid temperature. As a result, the temperature difference across the interface increased, which promotes interfacial heat transfer.
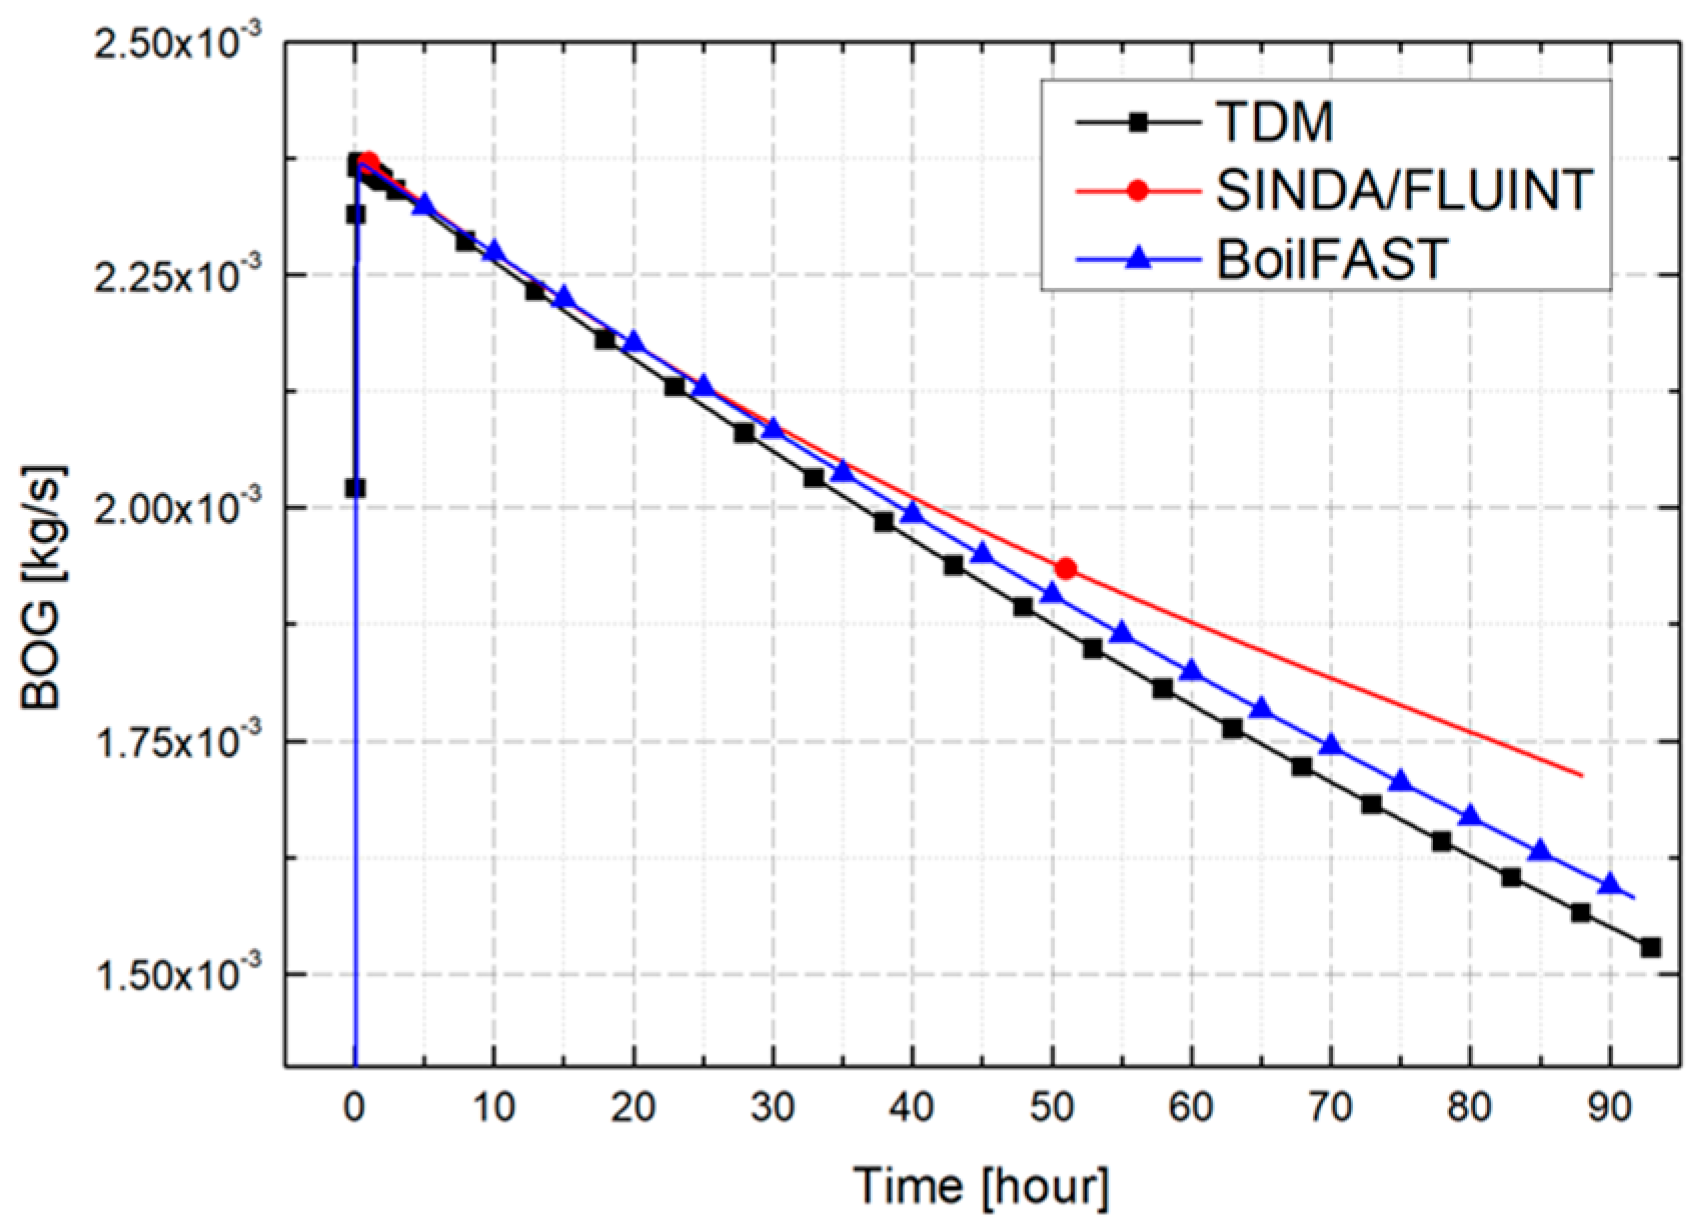
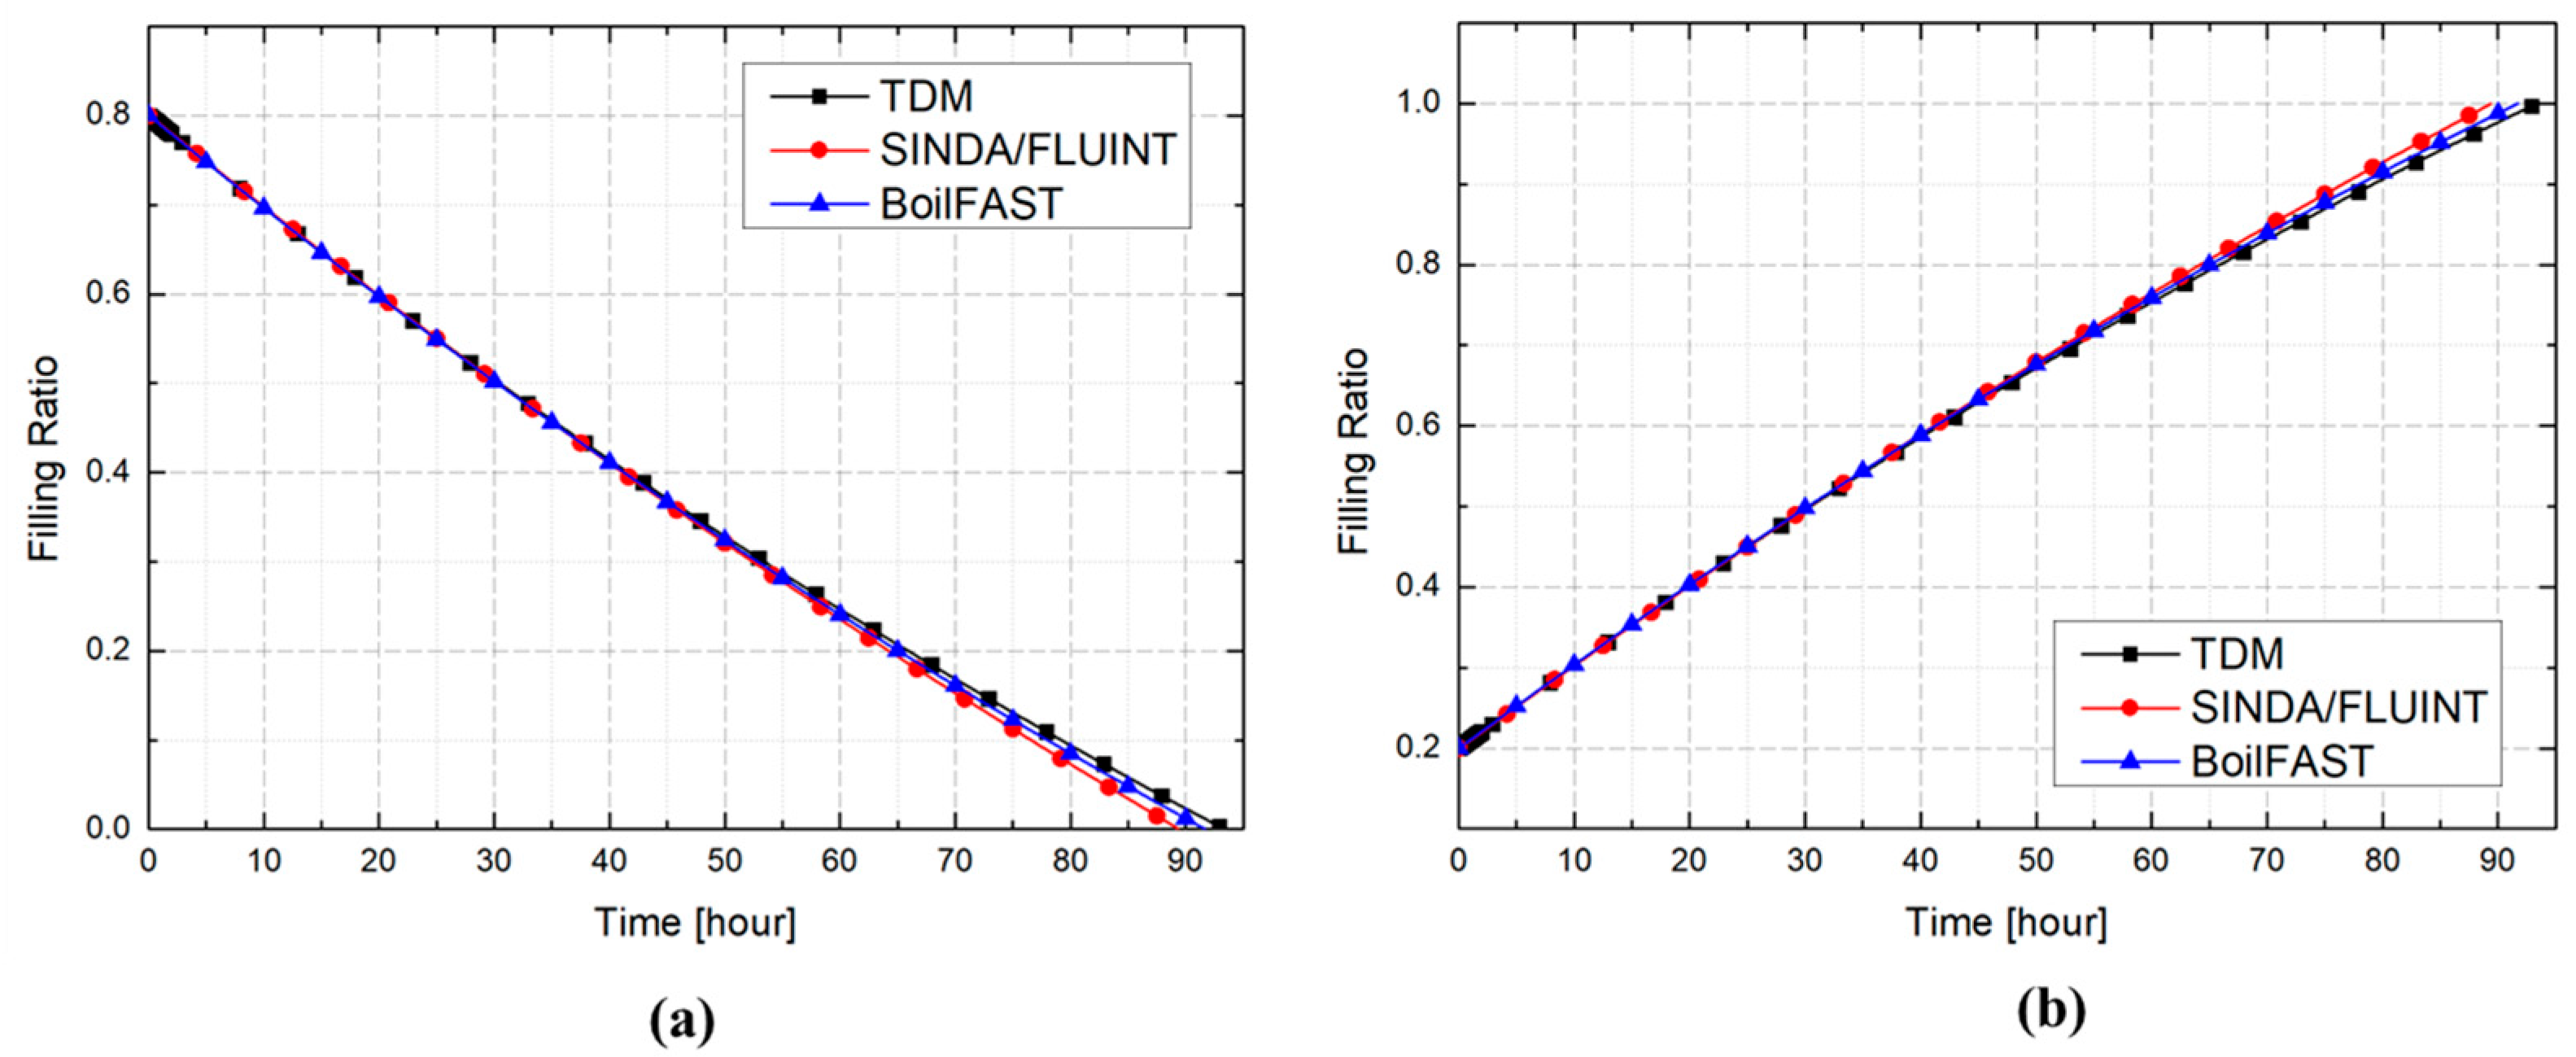
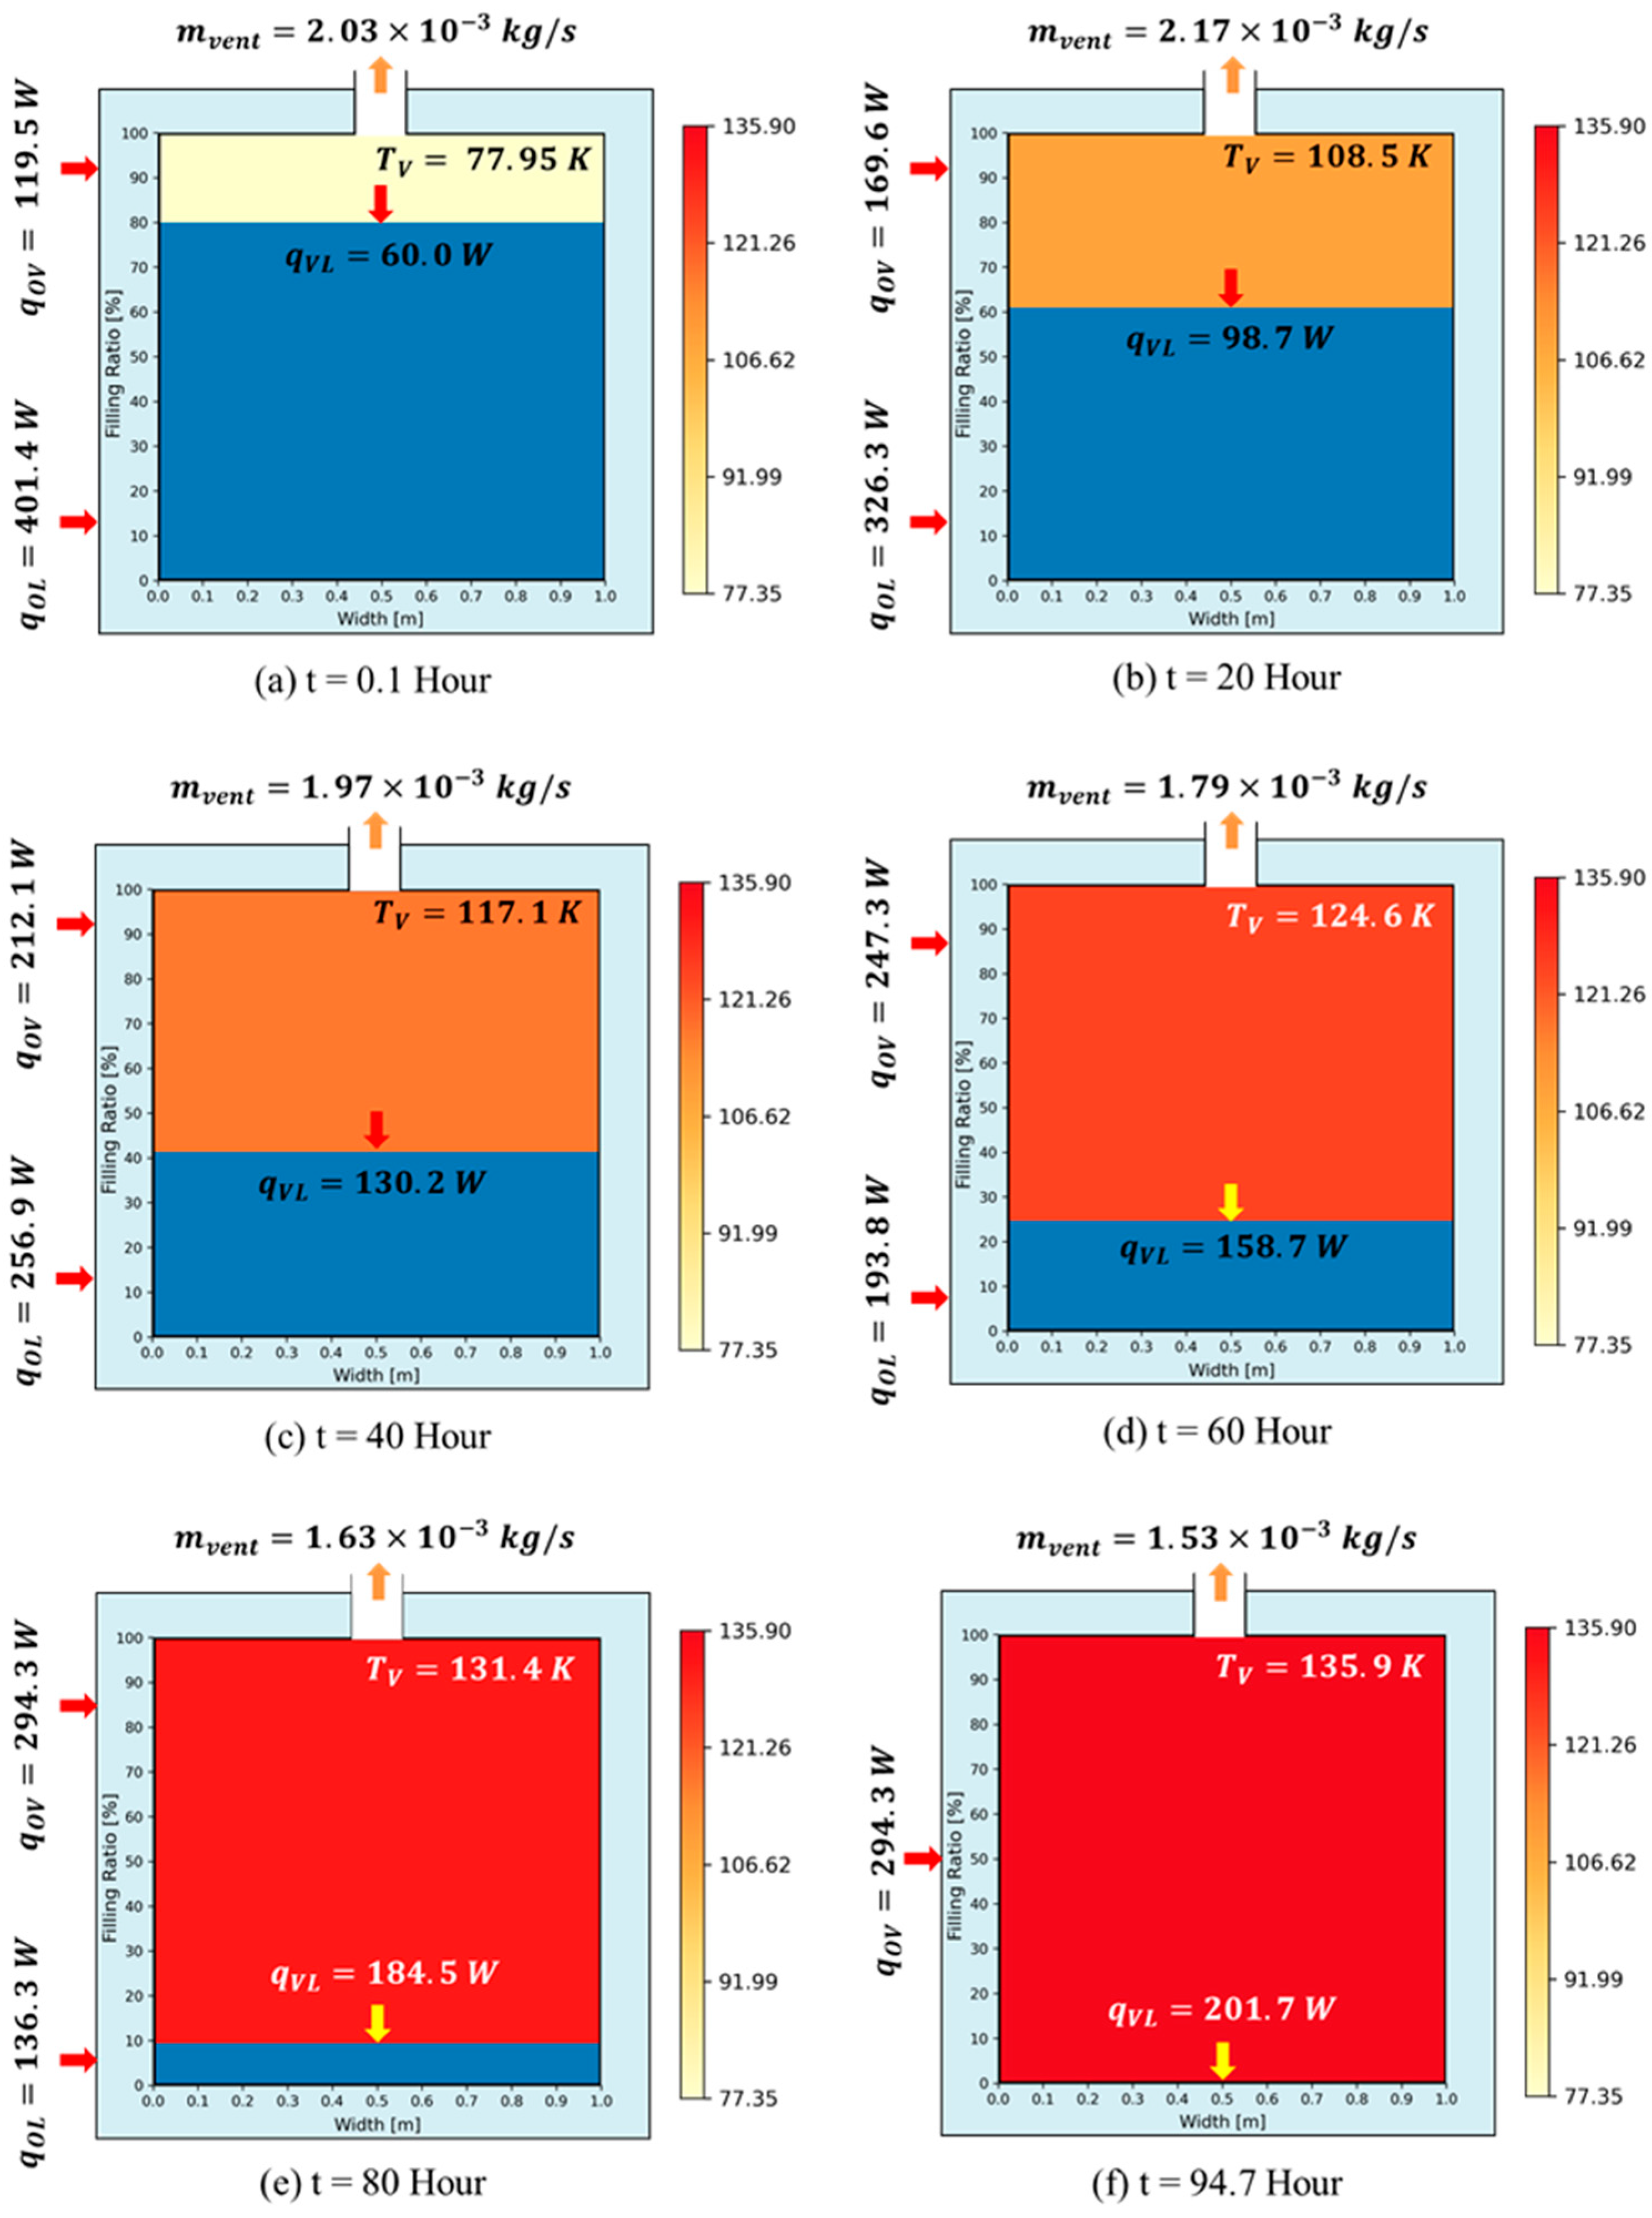
The phase–change behavior of the liquid was examined by analyzing the time histories of BOG generation, filling ratios of the liquid and vapor phases, and vapor temperature. Figure 17 and Figure 18 present the temporal variations of BOG generation and filling ratio. Both showed an initial sharp increase, followed by a gradual decrease after a certain period. This trend is attributed to external heat ingress being transferred predominantly to the liquid phase during the initial equilibrium stage, which caused a rapid rise in evaporation. As the process continued, the system gradually stabilized, which led to a decline in the BOG generation rate.
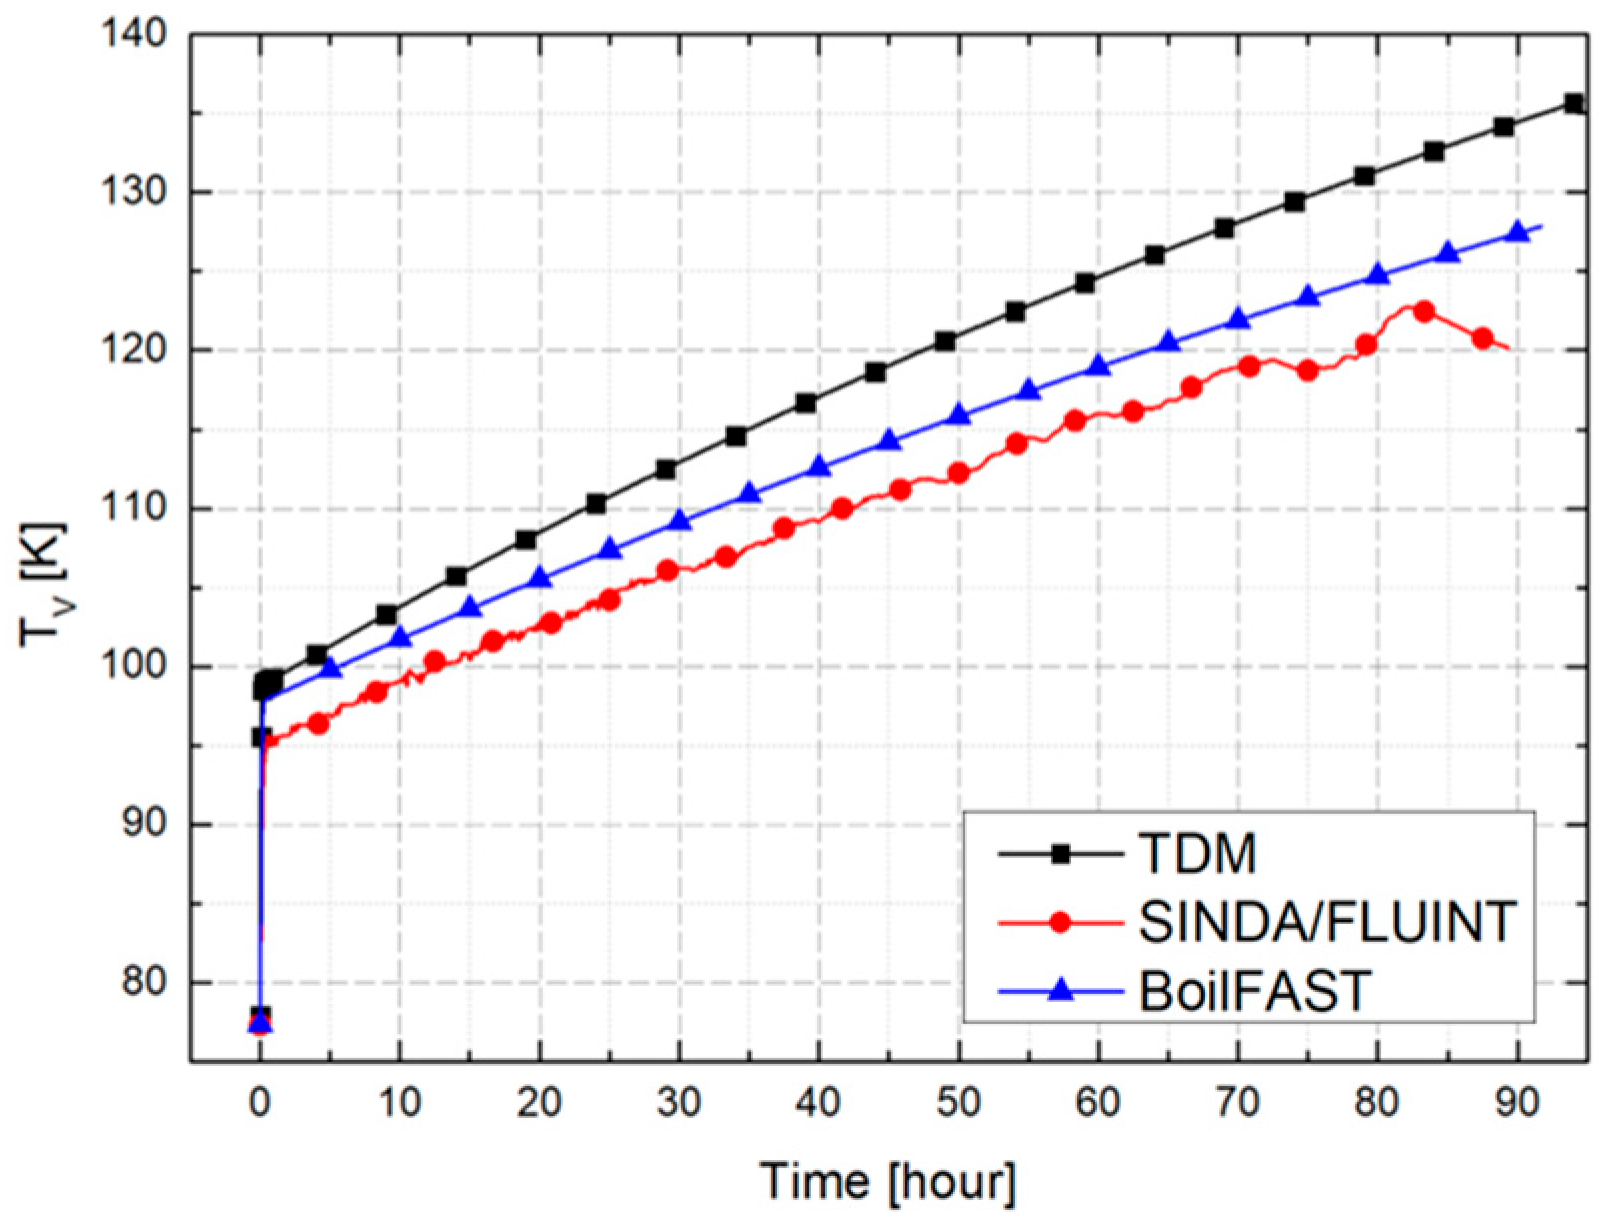
Figure 19 shows the temporal variation of vapor temperature. The TDM model predicted a slightly higher vapor temperature rise than the other models, as the dominant heat input through the inner wall to the vapor ( q W V ) led to a faster temperature increase, even though the interfacial heat transfer coefficient was comparatively lower.
The computational efficiency comparison of the three models was evaluated under identical hardware conditions: a workstation with an Intel Core i9-12900K CPU (3.2 GHz, 16 cores) (Intel Corp., Santa Clara, CA, USA), NVIDIA RTX 3080 Ti GPU (Nvidia Corp., Santa Clara, CA, USA), and 128 GB RAM. The proposed TDM model achieved the fastest computation time, approximately 3 s, which demonstrates superior efficiency. BoilFAST required about 30 s, which indicates relatively fast but still slower performance than the TDM. In contrast, SINDA/FLUINT, which incorporates conduction analysis within a coupled heat transfer framework, took approximately 3 h, showing a substantially longer computation time. These differences reflect the varying degrees of physical simplification and computational complexity inherent in each model’s methodology.
The TDM combines high physical fidelity with superior computational efficiency, making it an effective tool for long-term BOG prediction. The comprehensive prediction results from the TDM, BoilFAST, and SINDA/FLUINT models are presented in Figure 20, Figure 21 and Figure 22. These figures illustrate the temporal variations in key parameters such as heat ingress, vapor temperature, filling ratio, and evaporation mass relative to the initial conditions. The comparisons clearly depict the differences in thermal behavior inside and outside the cryogenic tank, highlighting each model’s approach to simulating dynamic thermal-fluid phenomena during long-duration storage.

4. Conclusions

In this study, an analytical model was developed to predict the long-term generation of BOG in cryogenic liquid storage tanks, such as those for liquid hydrogen and LNG. The proposed TDM-based model employed a thermal resistance network to define heat ingress as boundary conditions, while representing the liquid and vapor phases as lumped masses and incorporating their thermodynamic state variations and phase-change behavior.
The validity of the model was verified through comparative analyses with BoilFAST and SINDA/FLUINT. The results showed that the TDM reproduced similar trends to the commercial models in key aspects, including heat ingress into the vapor and liquid phases, BOG generation, and the thermodynamic responses of the fluid. This consistency is attributed to the similarity of the empirical heat transfer correlations and temperature assumptions applied across the models. Some deviations were observed during the first 1–2 h due to differences in thermodynamic state calculation methods, but the overall prediction trends throughout the complete evaporation process showed strong agreement. Additionally, it was confirmed that key parameters such as the filling ratio and convective heat transfer coefficient have a direct influence on the evaporation behavior. A decrease in the filling ratio leads to an increase in vapor volume, which accelerates heat ingress to the vapor region. variations in interfacial convective heat transfer characteristics were found to have a significant impact on the evaporation rate. This study assumed open-vent conditions with constant internal pressure. Although this assumption represents a limitation for pressurized tank conditions, the proposed TDM can still serve as a practical tool for reasonably predicting the long-term behavior of cryogenic storage tanks.
Future work will focus on acquiring experimental data to validate the quantitative accuracy of the model and to establish a verification framework linking experiments and simulations. The applicability of the model will also be extended to unsteady flow conditions, such as sloshing, to advance it as a detailed thermal analysis-based design tool for cryogenic storage systems.

Author Contributions

Conceptualization, M.-S.K. and J.H.L.; methodology, J.H.L.; software, M.-S.K.; validation, M.-S.K. and J.H.L.; formal analysis, M.-S.K.; investigation, M.-S.K.; resources, J.H.L.; data curation, M.-S.K.; writing—original draft, M.-S.K.; writing—review and editing, J.H.L.; visualization, M.-S.K.; supervision, J.H.L.; project administration, J.H.L. All authors have read and agreed to the published version of the manuscript.

Funding

This research received no external funding.

Data Availability Statement

The data presented in this study are available on request from the corresponding author.

Conflicts of Interest

The authors declare no conflicts of interest.

Abbreviations

Symbols and Variables
SymbolDescriptionUnit
A Area m 2
C p Specific heat at constant pressure J / k g K
F R Filling Ratio%
G r Grashof Number
g Gravitational acceleration m / s 2
H Entalpy J
h Convective Heat Transfer Coefficient W / m 2 · K
h f g Latent heat of vaporization J / k g
h ^ Specific Entalpy J / k g
L C Characteristic length m
kThermal conductivity W / m · K
m Mass k g
m ˙ Mass flow rate k g / s
N u Nusselt Number
P Pressure P a
P r Prandtl Number
Q Heat (Energy) J
q Heat Flow Rate W
R Thermal Resistance K / W
R a Rayleigh Number
R e Reynolds Number
T Temperature K
tTime s
Δ t Time increment s
V Volume m 3
Greek Letters
SymbolDescriptionUnit
β Thermal expansion coefficient 1 / K
v Kinematic viscosity m 2 / s
μ Dynamic viscosity P a · s
ρ Density k g / m 3
σ Surface tension N / m
Subscripts
SymbolDescription
A v g Average
B O G Boil-Off Gas
I n s Insulation
I n t Interface Surface
L Liquid Phase
L , L Liquid Phase at Horizontal surface
L , V Liquid Phase at Vertical surface
l a m Laminar flow
O Outside
O L Outside to Liquid Phase
O L , L Outside to Liquid for Horizontal surface
O L , V Outside to Liquid for Vertical surface
O V Outside to Vapor Phase
O V , V Outside to Vapor for Vertical surface
O , L Outer wall for Lower surface
O , U Outer wall for Upper surface
O , V Outer wall for Vertical surface
sTank outer wall
V Vapor Phase
V L Vapor-Liquid Interface
V , U Vapor Phase at Horizontal surface
V , V Vapor Phase at Vertical surface
W Inner Tank Wall
W L Wall to Liquid
W V Wall to Vapor
W V , L Wall to Vapor for Horizontal surface
W V , V Wall to Vapor for Vertical surface

References

  1. Yin, L.; Ju, Y. Review on the design and optimization of BOG re-liquefaction process in LNG ship. Energy 2022, 244, 123065. [Google Scholar] [CrossRef]
  2. Ratnakar, R.R.; Sun, Z.; Balakotaiah, V. Effective thermal conductivity of insulation materials for cryogenic LH2 storage tanks: A review. Int. J. Hydrogen Energy 2023, 48, 7770–7793. [Google Scholar]
  3. Matveev, K.I.; Leachman, J.W. The Effect of Liquid Hydrogen Tank Size on Self-Pressurization and Constant-Pressure Venting. Hydrogen 2023, 4, 444–455. [Google Scholar] [CrossRef]
  4. Jeon, G.M.; Park, J.C.; Choi, S. Multiphase-thermal simulation on BOG/BOR estimation due to phase change in cryogenic liquid storage tanks. Appl. Therm. Eng. 2021, 184, 116264. [Google Scholar]
  5. Lin, Y.; Ye, C.; Yu, Y.; Bi, S. An approach to estimating the boil-off rate of LNG in type C independent tank for floating storage and regasification unit under different filling ratio. Appl. Therm. Eng. 2018, 135, 463–471. [Google Scholar] [CrossRef]
  6. Khan, M.S.; Qyyum, M.A.; Ali, W.; Wazwaz, A.; Ansari, K.B.; Lee, M. Energy saving through efficient BOG prediction and impact of static boil-off-rate in full containment-type LNG storage tank. Energies 2020, 13, 5578. [Google Scholar] [CrossRef]
  7. Migliore, C.; Tubilleja, C.; Vesovic, V. Weathering prediction model for stored liquefied natural gas (LNG). J. Nat. Gas Sci. Eng. 2015, 26, 570–580. [Google Scholar] [CrossRef]
  8. Seo, Y.M.; Noh, H.W.; Koo, T.H.; Ha, D.W.; Ko, R.K. Development of Numerical Analysis Model on Cryogenic Vessel for Safety Pressure Maintenance and Control of Liquid Hydrogen BOG. J. Hydrogen New Energy 2024, 35, 280–289. [Google Scholar] [CrossRef]
  9. Nam, T.; Yu, T.; Lim, Y. Thermodynamic Modeling and Analysis of Boil-off Gas Generation and Self-Pressurization in Liquefied Carbon Dioxide Tanks. J. Ocean Eng. Technol. 2024, 38, 257–268. [Google Scholar] [CrossRef]
  10. Kang, M.; Kim, J.; You, H.; Chang, D. Experimental investigation of thermal stratification in cryogenic tanks. Exp. Therm. Fluid Sci. 2018, 96, 371–382. [Google Scholar] [CrossRef]
  11. Yu, K.; Ge, Z.; Korpus, R. CFD predictions of FLNG BOG including the influence of Filling, Offloading, and Vessel motion. In Proceedings of the Offshore Technology Conference, Houston, TX, USA, 2–5 May 2016. [Google Scholar]
  12. Huerta, F.; Vesovic, V. A realistic vapour phase heat transfer model for the weathering of LNG stored in large tanks. Energy 2019, 174, 280–291. [Google Scholar] [CrossRef]
  13. Ferrín, J.L.; Pérez-Pérez, L.J. Numerical simulation of natural convection and boil-off in a small size pressurized LNG storage tank. Comput. Chem. Eng. 2020, 138, 106840. [Google Scholar] [CrossRef]
  14. Sakowski, B.A.; Hauser, D.M.; Kassemi, M. SINDA/FLUINT and Thermal Desktop Multi-Node Settled and Unsettled Propellant Tank Modeling of Zero Boil Off Test. In Proceedings of the AIAA Propulsion and Energy 2019 Forum, Indianapolis, IN, USA, 19–22 August 2019. [Google Scholar]
  15. Perez, F.; Al Ghafri, S.Z.S.; Gallagher, L.; Siahvashi, A.; Ryu, Y.; Kim, S.; Kim, S.G.; Johns, M.L.; May, E.F. Measurements of boil-off gas and stratification in cryogenic liquid nitrogen with implications for the storage and transport of liquefied natural gas. Energy 2021, 222, 119853. [Google Scholar] [CrossRef]
  16. Al Ghafri, S.Z.S.; Swanger, A.; Park, K.H.; Jusko, V.; Ryu, Y.; Kim, S.; Kim, S.G.; Zhang, D.; Seo, Y.; Johns, M.L.; et al. Advanced boil-off gas studies of liquefied natural gas used for the space and energy industries. Acta Astronaut. 2022, 190, 444–454. [Google Scholar] [CrossRef]
  17. Al Ghafri, S.Z.S.; Swanger, A.; Jusko, V.; Siahvashi, A.; Perez, F.; Johns, M.L.; May, E.F. Modelling of Liquid Hydrogen Boil-Off. Energies 2022, 15, 1149. [Google Scholar] [CrossRef]
  18. Majumdar, A.K.; LeClair, A.; Moore, R.; Schallhorn, P.A. Generalized Fluid System Simulation Program (GFSSP)-Version 6. In Proceedings of the 51st AIAA/SAE/ASEE Joint Propulsion Conference, Orlando, FL, USA, 27–29 July 2015. [Google Scholar]
  19. LeClair, A.; Hartwig, J.W.; Hauser, D.M.; Kassemi, M.; Diaz-Hyland, P.G.; Going, T.R. Modeling Cryogenic Chilldown of a Transfer Line with GFSSP. In Proceedings of the Joint Propulsion Conference, Cincinnati, OH, USA, 9–11 July 2018. [Google Scholar]
  20. Bandyopadhyay, A.; Majumdar, A.K.; LeClair, A.; Valenzuela, J. Multi-Node Modeling of Cryogenic Tank Pressurization System Using Generalized Fluid System Simulation Program (GFSSP). In Proceedings of the AIAA Propulsion and Energy 2019 Forum, Indianapolis, IN, USA, 19–22 August 2019. [Google Scholar]
  21. Joseph, J.; Agrawal, G.; Agarwal, D.K.; Pisharady, J.C.; Kumar, S.S. Effect of insulation thickness on pressure evolution and thermal stratification in a cryogenic tank. Appl. Therm. Eng. 2017, 111, 1629–1639. [Google Scholar] [CrossRef]
  22. Schallhorn, P.; Campbell, D.; Chase, S.; Piquero, J.; Fortenberry, C.; Li, X.; Grob, L. Upper stage tank thermodynamic modeling using SINDA/FLUINT. In Proceedings of the 42nd AIAA/ASME/SAE/ASEE Joint Propulsion Conference & Exhibit, Sacramento, CA, USA, 9–12 July 2006. [Google Scholar]
  23. Kashani, A.; Luchinskiy, D.G.; Ponizovskaya-Devine, E.; Khasin, M.; Timucin, D.; Sass, J.; Perotti, J.; Brown, B. Optimization of cryogenic chilldown and loading operation using SINDA/FLUINT. IOP Conf. Ser. Mater. Sci. Eng. 2015, 101, 012115. [Google Scholar] [CrossRef]
  24. Wang, H.R.; Wang, B.; Pan, Q.W.; Wu, Y.Z.; Jiang, L.; Wang, Z.H.; Gan, Z.H. Modeling and thermodynamic analysis of thermal performance in self-pressurized liquid hydrogen tanks. Int. J. Hydrogen Energy 2022, 47, 30530–30545. [Google Scholar] [CrossRef]
  25. Zhu, X.Y.; Lee, J.H.; Kim, K.H.; Lim, C.H.; Lee, S.H. Coupled CFD modeling and thermal analysis of multi-layered insulation structures in liquid hydrogen storage tanks for various vapor-cooled shields. Case Stud. Therm. Eng. 2024, 63, 105317. [Google Scholar] [CrossRef]
  26. Lan, E.; Shi, S. Coupled modeling and simulation of tank self-pressurization and thermal stratification. Int. J. Heat Mass Transf. 2024, 232, 125885. [Google Scholar] [CrossRef]
  27. Zuo, Z.; Zhu, W.; Huang, Y.; Wang, L.; Tong, L. A review of cryogenic quasi-steady liquid-vapor phase change: Theories, models, and state-of-the-art applications. Int. J. Heat Mass Transf. 2023, 205, 123916. [Google Scholar] [CrossRef]
  28. McAdams, W.H. Heat Transmission, 3rd ed.; McGraw-Hill: New York, NY, USA, 1954. [Google Scholar]
  29. Incropera, F.P.; DeWitt, D.P.; Bergman, T.L.; Lavine, A.S. Fundamentals of Heat and Mass Transfer, 6th ed.; John Wiley & Sons: Hoboken, NJ, USA, 2006. [Google Scholar]
  30. Çengel, Y.A.; Ghajar, A.J. Heat and Mass Transfer: Fundamentals and Applications, 5th ed.; McGraw-Hill: New York, NY, USA, 2015. [Google Scholar]
  31. Churchill, S.W.; Chu, H.H.S. Correlating equations for laminar and turbulent free convection from a vertical plate. Int. J. Heat Mass Transf. 1975, 18, 1323–1329. [Google Scholar] [CrossRef]
  32. Rohsenow, W.M. A method of correlating heat-transfer data for surface boiling of liquids. Trans. ASME 1952, 74, 969–975. [Google Scholar]
  33. Rohsenow, W.M.; Hartnett, J.P.; Cho, Y.I. Handbook of Heat Transfer, 3rd ed.; McGraw-Hill: New York, NY, USA, 1998. [Google Scholar]
  34. Bell, I.H.; Wronski, J.; Quoilin, S.; Lemort, V. Pure and pseudo-pure fluid thermophysical property evaluation and the open-source thermophysical property library CoolProp. Ind. Eng. Chem. Res. 2014, 53, 2498–2508. [Google Scholar] [CrossRef]
  35. National Institute of Standards and Technology. NIST Standard Reference Database 23: Reference Fluid Thermodynamic and Transport Properties—REFPROP, Version 10.0. Available online: https://www.nist.gov/srd/refprop (accessed on 23 August 2025).
  36. Fluid Science and Resources. BoilFAST Software. The University of Western Australia. Available online: https://www.fsr.ecm.uwa.edu.au/software/boilfast/ (accessed on 23 August 2025).
  37. Cullimore and Ring Technologies, Inc. SINDA/FLUINT: Software for Thermal and Fluid Analysis. Available online: https://www.crtech.com/products/sindafluint (accessed on 23 August 2025).
  38. Cullimore, B.A. Optimization, data correlation, and parametric analysis features in SINDA/FLUINT version 4.0. SAE Trans. 1998, 107, 347–356. [Google Scholar]
  39. C&R Technologies, Inc. TD Suite Manual: For Thermal Desktop®, TD Direct®, and SINDA/FLUINT Version 6.3; C&R Technologies, Inc.: Boulder, CO, USA, 2022. [Google Scholar]
  40. Guyer, E.C. Handbook of Applied Thermal Design; CRC Press: Boca Raton, FL, USA, 1999. [Google Scholar]
  41. Goldstein, R.J.; Sparrow, E.M.; Jones, D.C. Natural Convection Mass Transfer Adjacent to Horizontal Plates. Int. J. Heat Mass Transf. 1973, 16, 1025–1035. [Google Scholar] [CrossRef]
  42. Raithby, G.D.; Hollands, K.G.T. A General Method of Obtaining Approximate Solutions to Laminar and Turbulent Free Convection Problems. Adv. Heat Transf. 1975, 11, 265–315. [Google Scholar]
  43. Kreith, F. Principles of Heat Transfer, 3rd ed.; Intext: New York, NY, USA, 1973. [Google Scholar]
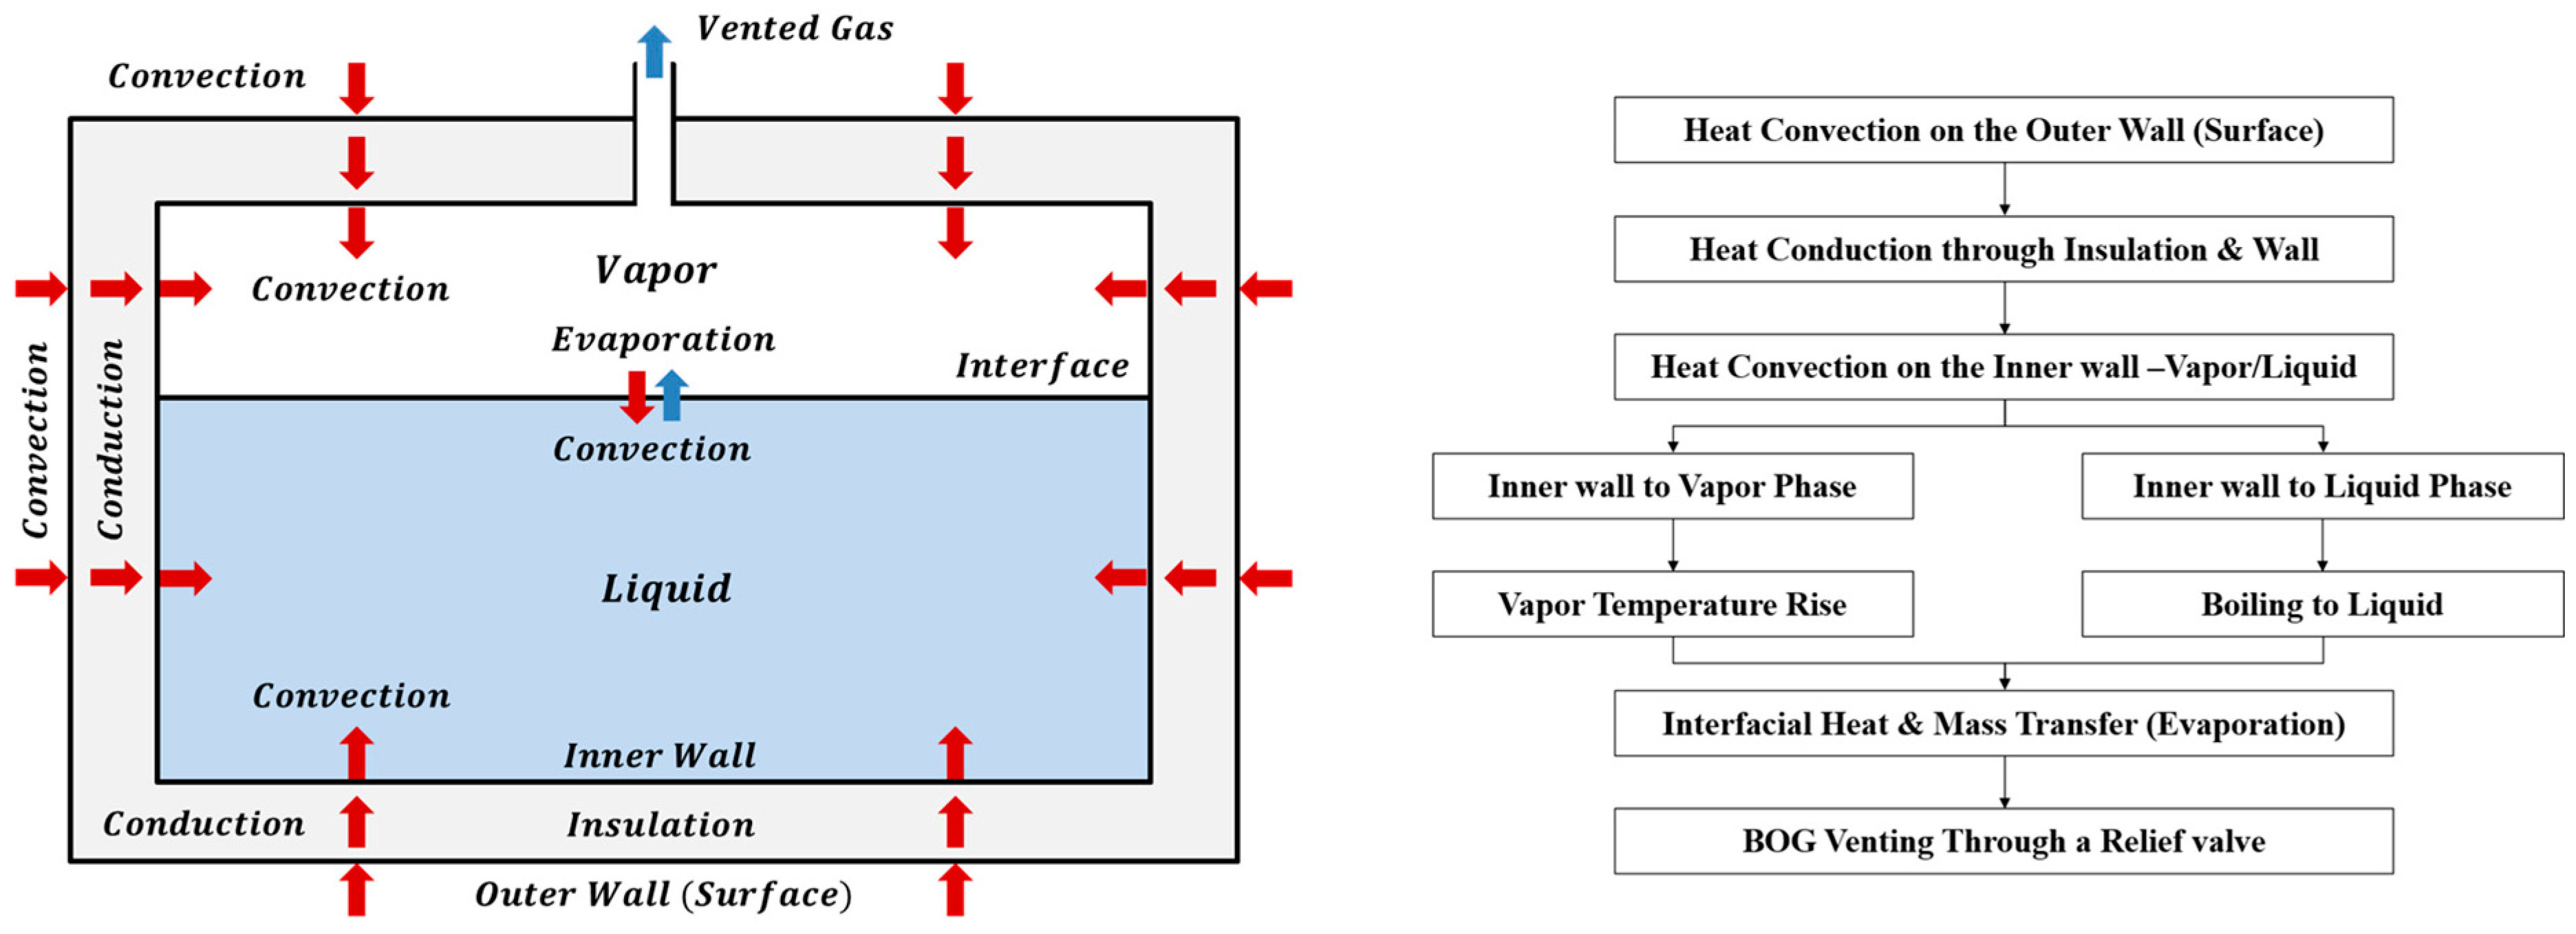
Figure 1. Schematic representation of the sequence of BOG generation in a cryogenic tank.
Processes 13 03584 g001
Figure 2. Schematic illustrating heat flow paths in a cryogenic tank.
Processes 13 03584 g002
Figure 3. Schematic of the coupled thermal resistance network and lumped mass model.
Processes 13 03584 g003
Figure 4. Flowchart of the BOG prediction procedure using thermal network and TDM.
Processes 13 03584 g004
Figure 5. Schematic of heat transfer and state variables in the BoilFAST model under the superheated vapor (SHV) assumption.
Processes 13 03584 g005
Figure 6. Computational procedure of bog prediction in the BoilFAST model.
Processes 13 03584 g006
Figure 7. Thermal network and twin lump modeling for cryogenic tank simulation in SINDA/FLUINT.
Processes 13 03584 g007
Figure 8. Computational flow of BOG prediction in SINDA/FLUINT.
Processes 13 03584 g008
Figure 9. Geometry and initial conditions for a 1 m3 rectangular cryogenic tank.
Processes 13 03584 g009
Figure 10. Comparison of the analysis models: (a) BoilFAST—parameter-based SHV model configuration, (b) SINDA/FLUINT—Twin Lump model structure with Node–Conductor–Tie–Plenum Lump network.
Processes 13 03584 g010
Figure 11. Temporal variation of convective heat transfer coefficients at the external tank surfaces: (a) upper surface, (b) lower surface, and (c) vertical surface, as predicted by the TDM and SINDA/FLUINT models.
Processes 13 03584 g011
Figure 12. Comparison of convective heat transfer coefficients at the tank inner wall–fluid interfaces: (a) inner wall–liquid, (b) inner wall–vapor.
Processes 13 03584 g012
Figure 13. Comparison of convective heat transfer coefficients at the vapor–liquid interface obtained from TDM, BoilFAST, and SINDA/FLUINT models.
Processes 13 03584 g013
Figure 14. Comparison of heat flow rates at the external tank surface: (a) top surface, (b) bottom surface, and (c) side surface.
Processes 13 03584 g014
Figure 15. Comparison of heat flow rates at the inner wall to the fluid: (a) liquid region, (b) vapor region.
Processes 13 03584 g015
Figure 16. Comparison of heat flow rates across the vapor–liquid interface.
Processes 13 03584 g016
Figure 17. Time history of BOG predicted by each model.
Processes 13 03584 g017
Figure 18. Time history of filling ratio predicted by each model: (a) liquid phase, (b) vapor phase.
Processes 13 03584 g018
Figure 19. Comparison of vapor temperature predicted by each model.
Processes 13 03584 g019
Figure 20. TDM: time-histories of BOG (evaporation rate, heat ingress, and vapor temperature).
Processes 13 03584 g020
Figure 21. SINDA/FLUINT model: time-histories of BOG (evaporation rate, heat ingress, and vapor temperature).
Processes 13 03584 g021
Figure 22. BoilFAST model: time-histories of BOG (evaporation rate, heat ingress, and vapor temperature).
Processes 13 03584 g022
Table 1. Components of the thermal network model in SIDNA/FLUINT.
ComponentConnection TypeVariables
ConductorNode to node q O ,   q I n s
TieNode to lump (twin lump) q W V , q W L
FtieLump (vapor) to lump (liquid) q V L
PathLump (vapor) to lump (plenum) d m V d t
Table 2. Correlations for convective heat-transfer coefficients at the tank bottom and side walls.
ComponentOutside-Tank Bottom Wall (hO,L)Outside-Tank Side Wall (hO,V)
HTC N u O , L · k a i r L c N u O , V · k a i r L c
Nusselt
Number
N u N u l a m 10 + N u t u r b 10 1 / 10
10 0 < R a a i r
N u l a m 6 + N u t u r b 6 1 / 6
10 0 < R a a i r < 10 12
N u l a m 1.4 l n 1 + 1.677 / ( 0.671 R a a i r 1 / 4 ( 1 + 0.492 / P r 9 / 16 ) 4 / 9 ) 2.8 l n 1 + 2.8 / ( 0.671 · R a a i r 1 / 4 ( 1 + 0.492 / P r 9 / 16 ) 4 / 9 )
N u t u r b 0.14 R a a i r 1 / 3 0.13 P r 0.22 R a a i r 1 / 3 1 + 0.61   P r 0.81 0.42
Table 3. Comparative summary of the computational procedures adopted in TDM, BoilFAST, and SINDA/FLUINT for BOG prediction.
ProcedureTDM ModelBoilFASTSINDA/FLUINT
Model typeLumped
thermodynamic model
Semi-empirical
lumped model
Finite-volume (node-based) transient solver
Heat-transfer mechanismHeat transfer via time-varying thermal resistanceConstant wall-to-fluid
heat flux
Full transient conduction through wall & insulation
HTCTime-dependent, updated
per time step
Fixed or averaged HTC under steady conditionsLocally computed, fully transient
Heat flux Coupled with dynamic HTC and interface temperaturePrescribed constant inputSolved per node and time step
Boundary conditionQuasi-steady Outer wall; transient inner wallFixed ambient & wall temperatureFully transient external & internal boundaries
Phase-change modelThermodynamic equilibrium at vapor–liquid interface Empirical boil-off
correlation
Transient evaporation from local temperature gradients
FidelityIntermediate
(Parametric studies)
Low
(Quick sizing)
High
(Detailed design)
Table 4. Specifications of the tank.
SpecificationDescription
TankTypeRectangular cuboid tank
Thickness ( m )0.0065
Thermal conductivity ( W / m K )16.2
Volume ( m 3 )Gross1.331
Net1.000
InsulationTypeExpanded polystyrene (EPS)
Thickness ( m )0.05
Thermal conductivity ( W / m K )0.021
Table 5. Convective heat transfer coefficients under different boundary conditions.
Boundary ConditionConvective HTC (W/m2·K)
TDMBoilFASTSINDA/FLUINT
Ambient to surface ( h O )To upper ( h O , U )3.632 (Equation (1))-Temperature dependent (Equation (35))
To lower ( h O , L )7.140 (Equation (2))-Temperature dependent (Table 2)
To vertical ( h O , V )10.790 (Equation (3))-Temperature dependent (Table 2)
Ambient to liquid ( h O L )-0.366 (Equation (27))-
Ambient to vapor ( h O V )-0.299 (Equation (29))-
Inner wall to vapor ( h W V )To lower ( h W V , L )Temperature dependent (Equation (7))-Temperature dependent (Equation (38))
To vertical ( h W V , V )Temperature Dependent (Equation (8))-
Inner wall to liquid ( h W L )1924 (Equation (9))-Temperature dependent
(Rohsenow et al. [32])
Vapor to liquid ( h V L )Temperature dependent (Equation (11))4.000
(Perez et al. [15])
3.908 (Equation (11))
Disclaimer/Publisher’s Note: The statements, opinions and data contained in all publications are solely those of the individual author(s) and contributor(s) and not of MDPI and/or the editor(s). MDPI and/or the editor(s) disclaim responsibility for any injury to people or property resulting from any ideas, methods, instructions or products referred to in the content.