Abstract
In high-sulfur environments, the failure risk of completion tubing increases due to the coupling effect of mechanical and electrochemical corrosion during the acidification production process. The corrosion behavior of P110SS tubing steel was investigated by an HTHP corrosion weight loss experiment and an electrochemical corrosion experiment. Scanning electron microscopy (SEM) and energy-dispersive X-ray spectroscopy (EDS) were used to analyze the surface morphology of the corrosion products. In addition, a prediction model for the remaining service life of completion tubing under the synergistic effect of corrosion and stress was established during the acidification production process. The results show that acidification operations have a significant impact on the subsequent service life of tubing; the corrosion rate of P110SS tubing in the full acidification production process is much higher than that after the produced gas field solution corrosion treatment alone. Obvious pitting marks, micropores, and microchannels are observed in the corrosion product film of P110SS steel after acidification treatment, and the corrosion product film structure of P110SS steel is loose and honeycomb-like after acidification production treatment. The corrosion products are mainly FexSy and FeCO3 after acidification production corrosion treatment. The corrosion during the acidification production stage is controlled by cathodic polarization. The remaining service life of tubing after production corrosion treatment can reach up to 29 years, while the remaining service life of tubing after acidification production corrosion treatment is significantly reduced, with a maximum of only 8 years. The research results have guiding significance for the selection, optimization, and design of high-sulfur-gas well tubing.
1. Introduction
Acid treatment, as one of the most cost-effective methods to enhance well productivity and improve hydrocarbon recovery, has been successfully used during the process of oil production for many years. Hydrochloric acid (HCl) is used to dissolve limestone (CaCO3) and dolomite (CaMg(CO3)2) by the following reactions [1,2]:
CaCO3 + 2HCl → CaCl2 + H2O + CO2
The removal of this carbonate scale is economically achieved with either HCl, acetic acid, or formic acid, and the dissolution process can be expressed by the following reaction [3].
CO2 + CaCO3 + H2O → Ca(HCO3)2
Low-porosity and low-permeability sulfur-containing gas reservoirs in the Sichuan Basin have been successfully acid-stimulated for many years. However, the corrosion effects of acid on the tubing are prominent, especially when using a high concentration of hydrochloric acid during acidification. Relevant records of the M019-H6 well showed that the tubing after acidification corrosion treatment failed after one year of production. In the process of acidizing transformation, the acid corrosion of the tubing generally includes fresh acid acidification corrosion and residual acid backflow corrosion processes. Fresh acid is injected into the formation through the completion tubing for about 2–8 h. Fresh acid interacts with the formation rock and corrodes the formation to form its own permeable channels. The acid produced after the reaction is called residual acid, which is then discharged back into the formation through the tubing. This process generally lasts for 3–7 days. In the production stage, the composition of the produced gas field solution is complex, including H2S, CO2, and a high concentration of chloride ions, which can easily cause serious electrochemical corrosion of the downhole tubing. The corrosion environment at different exploiting stages is shown in Figure 1.
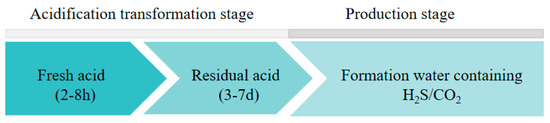
Figure 1.
Corrosion environment at different exploiting stages.
Failure events of completion tubing subjected to complex corrosive environments and stress states frequently occur, and some wells even cause major disaster accidents. The remaining service life of tubing under stress–corrosion coupling is of great significance for ensuring the safety of gas wells. At present, the prediction of the remaining corrosion life of completion tubing under the coupling effect of stress corrosion in high-temperature, high-pressure, and high-sulfur-gas wells is an international research hotspot [4,5]. However, the design life of on-site completion tubing is mainly based on tubing corrosion data after the produced gas field solution corrosion treatment, without considering the fresh acid corrosion and residual acid corrosion in the early stage or taking into account the stress state of downhole tubing. Previous research has mainly focused on improving stress-loading devices [6,7] and combining conventional corrosion electrochemical testing devices or high-temperature and high-pressure multiphase flow corrosion experimental devices to elucidate the corrosion electrochemical behavior and mechanism of tubing under stress loading [8,9,10,11,12,13,14,15,16]. In this work, the influence of acidification on the corrosion of completion tubing is explored by SEM and EDS technology; importantly, the effect of acidification on the corrosion remaining life of completion tubing is analyzed based on the thermodynamic and kinetic theories of the stress–electrochemical corrosion interaction. The “stress influence factor” is introduced, combined with indoor high-temperature and high-pressure corrosion experimental data, and based on the fourth strength theory, a prediction model for the remaining corrosion life of tubing based on the coupling effect of stress and electrochemical corrosion is finally established. A comparative analysis of the remaining service life of completion tubing that only experiences production conditions and the entire process of acidification production is conducted, and the sensitivity of different corrosion inhibitor concentrations to the corrosion remaining life of well completion tubing under stress is analyzed. In addition, the corrosion behavior of P110SS tubing steel is investigated by an HTHP corrosion weight loss experiment and an electrochemical corrosion experiment. Scanning electron microscopy (SEM) and energy-dispersive X-ray spectroscopy (EDS) are used to analyze the surface morphology of corrosion products. This model is of great significance for evaluating the remaining service life of well completion tubing, and the research results have guiding significance for the selection, optimization, and design of high-sulfur-gas well tubing.
2. Experimental
2.1. Test Solution Preparation
The fresh acid solution used in this work was formed by a mixture of hydrochloric acid (HCl) in concentrations of 20%. The composition of back-produced acid depends strongly on the nature of the fresh acid and the formation. According to on-site testing, the main composition of back-produced residual acid is 0.5% hydrochloric acid. The corrosion mediums at different exploiting stages are listed in Table 1.

Table 1.
The corrosive medium applied in the experiment.
2.2. Sample Preparation and Pretreatment
P110SS casing steel, with a composition (mass fraction) of 0.25% C, 0.019% Si, 0.009% P, 0.004% S, 1.3% Mn, 0.16% Cr, and 0.009% Ni and Fe balance, was employed in this test. The specimens were machined into a size of 30 mm × 15 mm × 3 mm. Prior to the tests, the working surface of each specimen was abraded with silicon carbide paper of decreasing roughness (up to 1200 grit) until the surface roughness reached about 10 μm. After that, the specimen was firstly washed with deionized water and then with acetone, placed in a vacuum desiccator for 24 h to remove water, and weighed using an electronic balance with a precision of 0.1 mg.
2.3. Weight Loss Experiment
To investigate the corrosion rates of P110SS steel in a full acid treatment cycle, weight loss tests were carried out in a self-designed high-temperature, high-pressure (HTHP) corrosion experimental device for simulating continuous working conditions. A schematic diagram of the apparatus for the corrosion test is shown in Figure 2, which mainly consists of a gas source supply device, a booster pump, HTHP autoclaves, a controller, and a waste gas treatment device. As listed in Table 2, seven tests were designed:
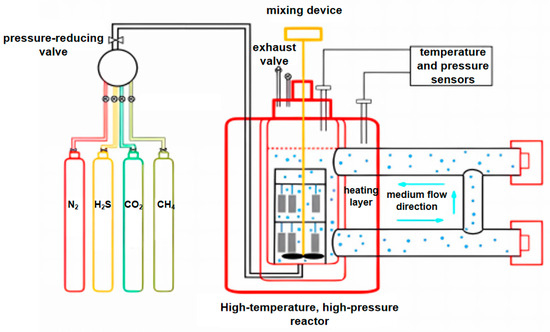
Figure 2.
Schematic of the HTHP corrosion experimental device.
Table 2.
Experiment plan.
Before the experiment, the test solution was strictly deoxygenated by bubbling pure N2 gas for 2 h; then, the oxygen-free solution was poured into the HT autoclave. While heating to the required experimental temperature, the total pressure of corrosive gases and the flowrate were set to start the experiment.
After the heated autoclave naturally cooled down to room temperature, the specimens were taken out, rinsed in deionized water, dehydrated in alcohol, and dried in air. One of the four specimens was retained for surface characterization of corrosion scales. The remaining three specimens were descaled in the solution consisting of hydrochloric acid (100 mL, density is 1.19 g/mL), hexamethylene tetramine (5 g), and deionized water (900 mL) at room temperature and then processed as above. After that, the specimens were weighed again to determine the weight loss. The corrosion rate was calculated through the following equation [17]:
where VCR is the corrosion rate, mm/y; Δm is the weight loss, g; A is the exposed surface area of the specimen, cm2; ρ is the density of coupon, g/cm3; t is the corrosion time, h; and 8.76 × 10⁴ is the unit conversion constant. The average corrosion rate with error bars was calculated from three parallel specimens for each test.
2.4. Characterization and Microanalysis of Corrosion Scales
The surface and cross-sectional morphologies of the corrosion scales were observed using SEM. The elemental compositions of the corrosion scales were analyzed using EDS with an acceleration voltage of 15 kV.
2.5. Electrochemical Corrosion Experiment
P110SS steel with an area of 1 cm2 was used in the experiment as the working electrode. The sample was connected with Cu wire, and the non-working surface was sealed with epoxy resin. The typical three-electrode system was used in the tests, where the Pt electrode was used as the counter electrode (CE) and the saturated calomel electrode with a Lukin capillary was used as the reference electrode (RE). Before the experiment, the surface of the sample was polished to 1500 #, oil was removed with acetone, and then the sample was rinsed with distilled water and blow-dried for 1 h. N2 was introduced to the solution for 2 h to remove oxygen. Electrochemical testing was conducted on the PGSTAT302N electrochemical comprehensive testing system. The experimental solution was a H2S-CO2-Cl− (Cl− concentration of 80,000 ppm) solution, and the experimental temperature was 30 °C. After stabilization in the solution for 30 min, the sample was subjected to electrochemical impedance spectroscopy and polarization curve testing. The testing frequency of the impedance spectrum was 10−2–105 Hz, scanning from high frequency to low frequency, and the impedance measurement signal amplitude was a 5 mV sine wave. The potential range for polarization curve testing was −0.15~0.15 V (vs OCP), with a scan rate of 1 mV/s. ZView v.2.0 and CView software v.3.5j were used to fit the impedance spectrum and polarization curve, respectively.
3. Residual Life Prediction Model of Tubing Under a Triaxial Stress State
In the production process of high-sulfur-gas wells, the corrosion current of the metal increases under the interaction of mechanical and electrochemical corrosion, which intensifies the corrosion process. In severe cases, it will lead to the failure and fracture of the tubing, causing huge economic losses and casualties. For the convenience of studying the stress conditions of the tubing, a macroscopic and basic unit stress model of the tubing body was established, as shown in Figure 3.
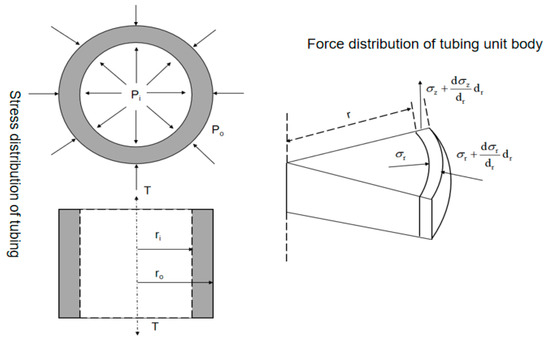
Figure 3.
Schematic diagram of macroscopic and microscopic stress on the tubing body.
The assumptions were made as follows: (1) Corrosion of the tubing preferentially occurs inside the tubing, and the corrosion direction is from the inside to the outside. (2) Corrosion is uniform, without considering local pitting. (3) The erosion effect of fluids during the production process is neglected. (4) The influence of cyclic dynamic loads on the corrosion of the tubing is neglected; only the effect of static loads is considered. (5) The influence of temperature effect on the mechanical properties of the tubing is neglected.
Based on the actual stress situation of the tubing, the tubing in the well is subjected to triaxial stress (axial stress, radial stress, and circumferential stress). Assuming that tubing with inner and outer diameters of Ri and Ro is filled with corrosive fluid, the inner wall is subjected to the constant internal pressure Pi and external pressure Po of the fluid.
In the analysis of the triaxial stress of the tubing, taking into account the influence of temperature, the following triaxial stress formula is derived based on the force balance equation of the tubing and the principle of axial symmetry (i.e., the famous Lame formula):
Circumferential stress:
Radial stress:
Axial stress:
where σo is circumferential stress, MPa; σr is radial stress, MPa; σz is axial stress, MPa; Pi is the pressure inside the tubing, MPa; Po is the external pressure of the tubing, MPa; ri is the inner diameter of the tubing, mm; ro is the outer diameter of the tubing, mm; r is the radius of any part of the tubing, mm; E is the elastic modulus of the tubing, MPa; α is the coefficient of linear expansion, 1/°C; Δt is the temperature difference inside and outside the tubing, °C; and μ is Poisson’s ratio, dimensionless.
The equivalent stress on the inner wall of the tubing is:
where σ is equivalent stress on the inner wall of the tubing, MPa. According to the dynamic theory of stress electrochemical corrosion, the accelerated effect of stress on tubing corrosion can be attributed to the promotion of an anodic dissolution process. Therefore, by introducing the “stress factor”, the corrosion rate at time t can be approximately equal to:
where Crt is the corrosion rate at time t, mm/y; t is an integer, a; and Cr0 is the corrosion rate under stress-free conditions, mm/y.
Taking a small time increment , it is assumed that corrosion occurs at the same rate within time. During the process of time t changing from 0, ∆t..., i∆t (i is an integer), the instantaneous wall thickness of the corroded tubing from time (i − 1) to time i is:
where Si is the instantaneous wall thickness corroded during the process from time (i − 1) to time i, mm. w(t) is the wall thickness loss at time t:
where w(t) is the total wall thickness corroded from 0 to t, mm.
At this point, the remaining wall thickness wr of the tubing is:
where wr is the remaining wall thickness of the tubing, mm.
Based on the fourth strength theory, the failure state of the tubing is defined as the equivalent stress on the pipe wall exceeding the allowable stress, as shown in Equation (9). The moment when the stress of the tubing reaches the yield state is defined as the service life of the tubing. The calculation process for the remaining service life of corroded tubing under stress is shown in Figure 4.
where σo,t is the circumferential stress of the tubing at time t, MPa; σr,t is the radial stress of the tubing at time t, MPa; σz,t is the axial stress of the tubing at time t, MPa; and [σ] is the allowable stress of the tubing, MPa.
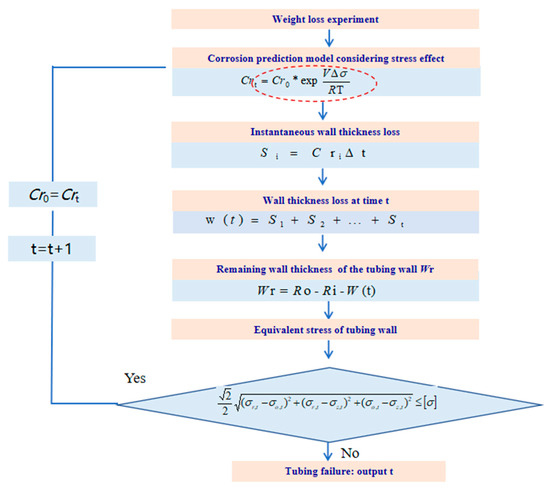
Figure 4.
The calculation process for the remaining service life of corroded tubing under stress.
Circumferential stress of the tubing at time t:
Radial stress of the tubing at time t:
Axial stress of the tubing at time t:
4. Results and Discussion
4.1. Weight Loss Result
Figure 5 shows the weight loss of P110SS tubing steel in the full acidification production process. It can be seen that the P110SS carbon steel tubing that has undergone the fresh acid stage is more severely corroded by secondary residual acid, and the failure risk of P110SS tubing after fresh acid treatment + secondary residual acid corrosion is much higher than that of the tubing that has undergone fresh acid/residual acid corrosion alone. In addition, comparing condition 3 and condition 7, the corrosion rate of P110SS tubing in the full acidification production process is much higher than that after the produced gas field solution corrosion treatment alone. This indicates that the conventional calculation of the remaining corrosion life of tubing based on production stages is unreasonable. Therefore, it is recommended that the remaining corrosion life of tubing after acidification transformation treatment should take into account the entire acidification production process.
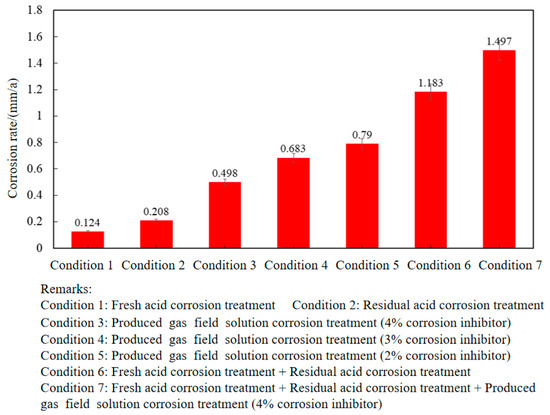
Figure 5.
Corrosion rate of P110SS tubing under different operating conditions.
4.2. SEM Observation and EDS Analysis of Corrosion Scales
The corrosion morphology of P110SS steel after the entire acidification process is shown in Figure 6. There are obvious pitting marks on the surface of P110SS tubing steel after fresh acid corrosion, as shown in Figure 6a. After further corrosion by residual acid, micropores and microchannels were observed in the corrosion product film of P110SS steel under a scanning electron microscope at 500 times magnification (Figure 6b), and the corrosive medium easily penetrated the corrosion product film and reacted further with the substrate. Chloride ions have two effects on the corrosion of metal materials: One is that chloride ions destroy the passivation film of metals, causing pitting corrosion of materials. The second is that chloride ions directly participate in the anodic dissolution process of metal materials. In hydrochloric acid, the passivation film on the surface of P110SS is easily dissolved, which disrupts the dynamic equilibrium process of dissolution and repair of the passivation film. After damaging the passivation film, Cl− continues to erode the substrate and infiltrate and accumulate into the interior of the steel. When it accumulates to a certain concentration, a large amount of corrosion occurs under the surface and produces corrosion products, resulting in a closed corrosion morphology. After the entire acidification production process, the corrosion product film structure of P110SS steel is loose, honeycomb-like, thick, and easy to peel off. According to the energy spectrum analysis results (Table 3), the corrosion products mainly contain Fe, S, C, and O elements, and it is speculated that the corrosion products are mainly a mixture of FexSy and FeCO3. According to atomic energy spectrum analysis, iron sulfide accounts for a large proportion and is believed to be the main component of corrosion products. The final stage of the corrosion reaction process is mainly controlled by H2S gas.
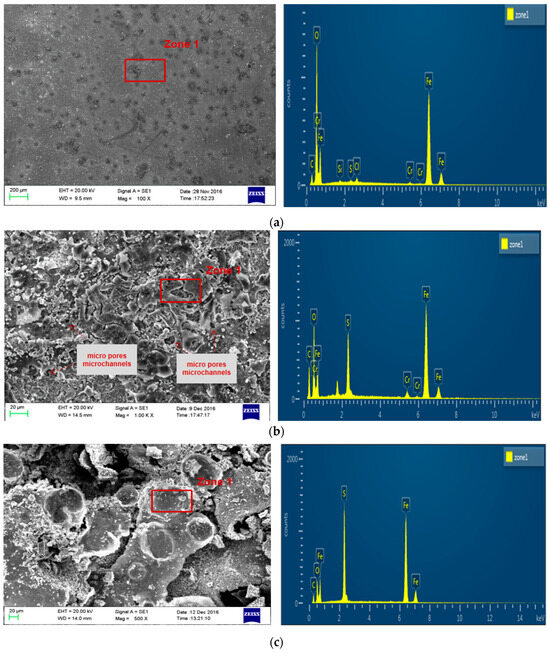
Figure 6.
Corrosion morphology and energy spectrum analysis result of P110SS steel after the entire acidification production process. (a) After fresh acid corrosion treatment; (b) after fresh acid + residual acid corrosion treatment; and (c) after fresh acid + residual acid + produced gas field solution corrosion treatment (4% corrosion inhibitor).
Table 3.
Energy spectrum analysis results of P110SS steel corrosion product (At%).
4.3. Corrosion Electrochemical Behavior
Table 4 and Figure 7 show the electrochemical corrosion behavior of P110SS steel in a H2S/CO2/Cl− environment. According to the cathodic Tafel slope, the cathodic slope of the sample is 186.56 mV/dec and the anodic Tafel slope is 81.558 mV/dec. The cathodic Tafel slope of the sample is significantly greater than the anodic Tafel slope, indicating that the corrosion is controlled by cathodic polarization.
Table 4.
Polarization curve fitting results of P110SS steel in a H2S/CO2/Cl− environment.
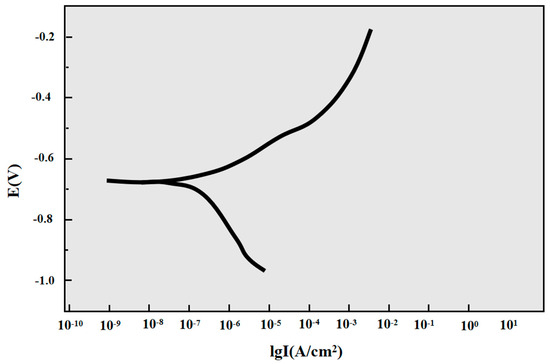
Figure 7.
Polarization curve of P110SS steel in a H2S/CO2/Cl− environment.
The characteristics of the half arc in the EIS spectra reflect the resistance encountered by corrosive ions during their transfer at the metal–corrosive liquid interface. The diameter Rt of the half circle corresponds to the interface transfer resistance, which is directly related to the corrosion rate. The larger the Rt, the lower the corrosion rate. In order to analyze the electrochemical corrosion characteristics of P110SS, the impedance spectrum curve (Figure 8) was fitted with corresponding equivalent current diagrams, and the equivalent simulation circuit is shown in Figure 9. In the equivalent simulation circuit, the solution resistance is Rs; CPEf and Rf represent the constant phase angle element and film resistance, respectively; CPEdl represents the double-layer capacitance at the interface between the metal and solution; and Rt represents the charge transfer resistance [18]. The corresponding fitting data are shown in Table 5.
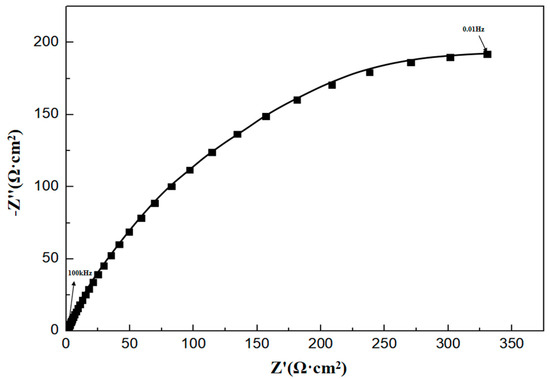
Figure 8.
Impedance spectrum of P110SS material in a H2S/CO2/Cl− environment.
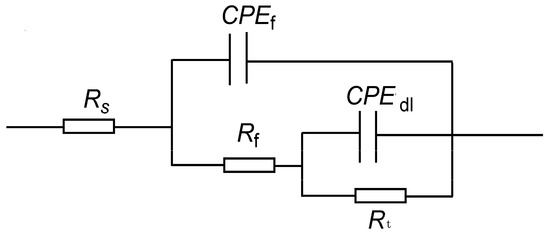
Figure 9.
Equivalent circuit diagram of P110SS steel in a H2S/CO2/Cl− environment.
Table 5.
Nyquist curve fitting results of P110SS steel in a H2S/CO2/Cl− environment.
4.4. Sensitivity Analysis of Corrosion Remaining Life of Completion Tubing
- The impact of different working conditions on the remaining service life of completion tubing
The elastic modulus of P110SS tubing material is 200 GPa, Poisson’s ratio is 0.23, and the linear expansion coefficient is 1.5 × 10⁻⁵(1/°C). The yield strength of P110SS steel-grade tubing material σs is 761 MPa, the molar volume of steel is 7.12 × 10⁻⁶ m3/mol, the gas constant R is 8.314 J·mol−1·K−1, and the underground temperature is 160 °C. Assuming a temperature difference of 5 °C between the inside and outside of the tube, we discussed the remaining service life of P110SS tubing under stress–corrosion coupling effect. Based on the residual life prediction model of corroded tubing under stress (Equations (5)–(12)), the corrosion residual life of tubing under different working conditions was discussed and analyzed, with an external extrusion pressure of 50 MPa, an oil and gas internal pressure of 50 MPa–80 MPa, and a tubing wall thickness of 12.09 mm, 9.53 mm, 6.45 mm, and 5.51 mm. The corrosion rate of P110SS tubing under different working conditions is shown in Table 6. The remaining corrosion life prediction of tubing that has only undergone production conditions and has undergone full acidification production conditions is shown in Figure 10.
Table 6.
Corrosion rate of P110SS tubing under different conditions.
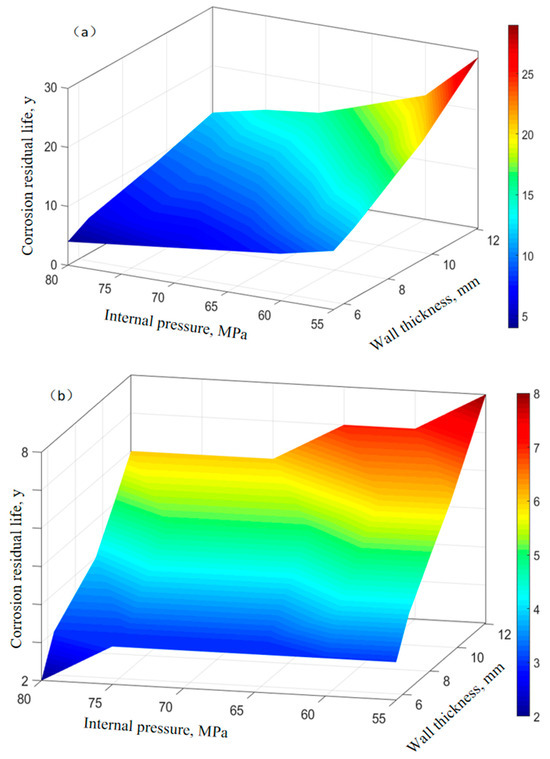
Figure 10.
Prediction of remaining corrosion life of tubing under different conditions. (a) In the production process. (b) In the full acidification production process.
It can be seen from Figure 10 that the remaining service life of tubing that has undergone full acidification production conditions has significantly decreased, with a maximum of only 8 years, while the remaining service life of tubing that has only undergone production working conditions has a maximum of 29 years, indicating that acidification operations have a significant impact on the subsequent service life of tubing. During the acidification stage, the corrosion rate of carbon steel tubing is relatively high, the wall thickness decreases rapidly, and the equivalent stress on the wall surface of the tubing is relatively high. Moreover, as shown in Figure 6, the corrosion products on the surface of the tubing during the acidification stage are loose and porous, which cannot effectively protect the pipe. Therefore, the remaining corrosion life of the tubing after acidification treatment is greatly reduced.
- 2.
- Effect of corrosion inhibitor concentration on the remaining service life of completion tubing
The corrosion rate of P110SS tubing with different corrosion inhibitor concentrations under production conditions is shown in Table 7. The relationship between the remaining corrosion life of P110SS tubing steel and the internal pressure and wall thickness of the tubing under different concentrations of corrosion inhibitor under production conditions is shown in Figure 11. The effect of the corrosion inhibitor concentration on the remaining life of the tubing is shown in Figure 12.
Table 7.
Corrosion rates of P110SS tubing at different concentrations of corrosion inhibitor.
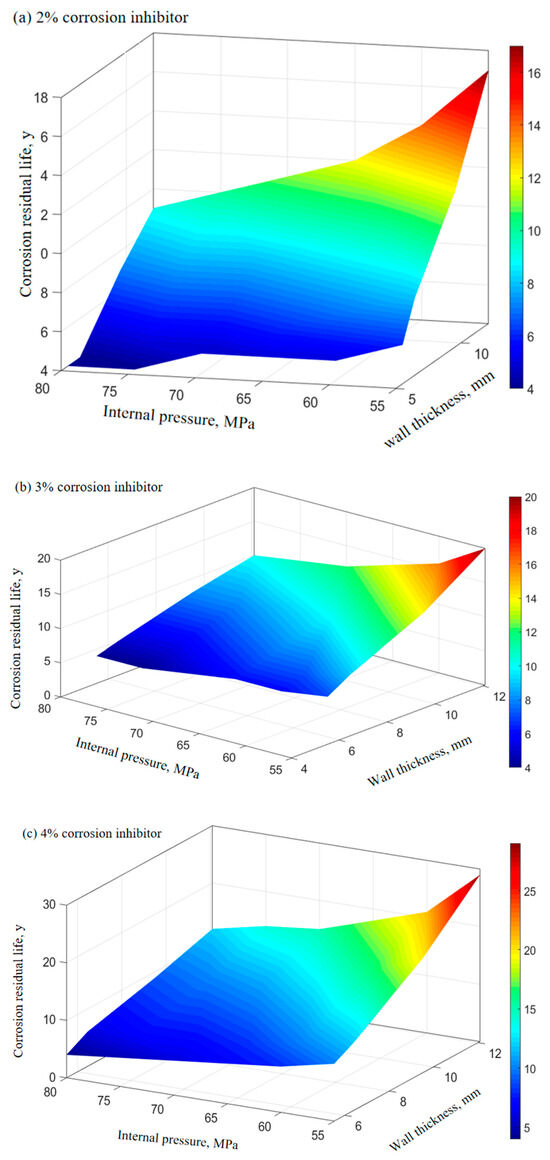
Figure 11.
Prediction of the remaining corrosion life of tubing under different concentrations of the corrosion inhibitor.
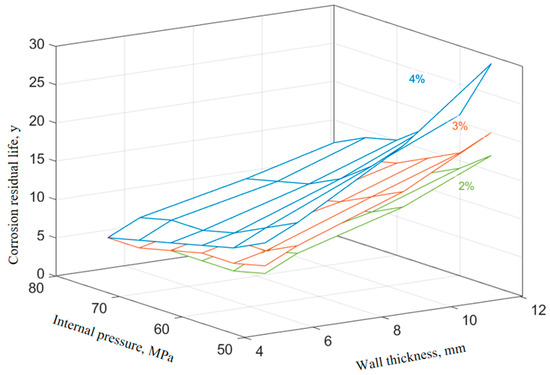
Figure 12.
Effect of corrosion inhibitor concentration on the remaining life of the tubing.
From Figure 11 and Figure 12, it can be seen that the increase in the corrosion inhibitor concentration to some extent inhibits the corrosion of P110SS tubing steel and prolongs the service life of the tubing. Under lower internal pressure conditions, the protective effect of the corrosion inhibitor is significant, which can to some extent extend the service life of the tubing. As the internal pressure increases, the effect of the corrosion inhibitor concentration on the remaining corrosion life of the tubing weakens. Wang et al. [19] studied the effect of wall shear force on the adsorption and desorption of a corrosion inhibitor and found that when the wall shear force increases, the same corrosion inhibition effect can be achieved by increasing the amount of corrosion inhibitor added. However, if the wall shear force is too high, even if the amount of corrosion inhibitor added is high, the corrosion rate cannot be reduced to the ideal value due to the high basic corrosion rate. When the corrosion inhibitor is added continuously, as the wall shear force increases, it is actually beneficial for the inhibitor to adsorb faster on the metal surface, and the final corrosion inhibition efficiency is basically the same. Once the injection is stopped, the corrosion inhibitor is also prone to failure. The effect of stress on the concentration of the corrosion inhibitor mainly includes two aspects: The increase in stress promotes the effective adsorption of the corrosion inhibitor, thereby inhibiting further corrosion of the substrate by the corrosive medium. At the same time, the effect of stress also causes the adsorption-type corrosion inhibitor molecules to desorb, reducing the adsorption efficiency of the corrosion inhibitor. The corrosion inhibitor molecules ultimately reach a dynamic equilibrium during continuous adsorption and desorption processes. The mechanism of the influence of force on the adsorption of the corrosion inhibitor is shown in Figure 13.
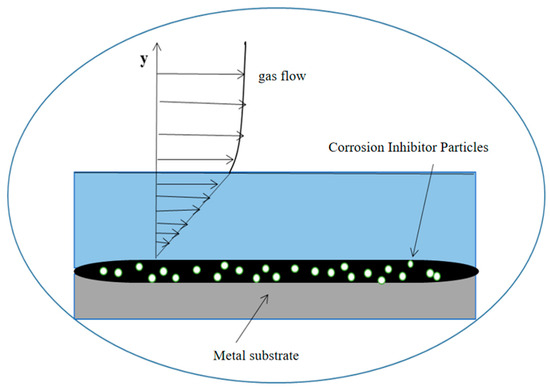
Figure 13.
Mechanism diagram of the effect of stresses on the adsorption of the corrosion inhibitor.
5. Conclusions
In this paper, the influence of acidification on the corrosion of completion tubing was explored. The corrosion rate of P110SS tubing in the full acidification production process is much higher than that after the produced gas field solution corrosion treatment alone. Obvious pitting marks, micropores, and microchannels are observed in the corrosion product film of P110SS steel after acidification treatment by SEM deep surface analysis technology, and the corrosion product film structure of P110SS steel is loose and honeycomb-like after acidification production treatment. The EDS results show that the corrosion products are speculated to be a mixture of FexSy and FeCO3 after acidification production corrosion treatment. The corrosion during the acidification production stage is controlled by cathodic polarization. Finally, a prediction model for the remaining corrosion life of completion tubing based on the coupling effect of stress and electrochemical corrosion is established based on the fourth strength theory, and the calculation process for the remaining service life of corroded tubing under stress is proposed. The calculation results of the remaining corrosion life show that the remaining service life of tubing that has only experienced production conditions can reach up to 29 years, while the remaining service life of tubing that has undergone acidification production conditions is significantly reduced, with a maximum of only 8 years, indicating that acidification operations have a significant impact on the subsequent service life of tubing. Under lower internal pressure conditions, the protective effect of the corrosion inhibitor is significant, which can to some extent extend the service life of the tubing. As the internal pressure increases, the effect of the acid corrosion inhibitor concentration on the remaining corrosion life of the tubing weakens. A mechanism diagram of the effect of stresses on the adsorption of the corrosion inhibitor is proposed.
Author Contributions
Conceptualization and draft preparation, N.Z.; methodology, Y.L. and G.T.; investigation, H.G.; calculations, writing—review and editing, N.Z. and D.Z.; manuscript revision, N.Z. and Q.H. All authors have read and agreed to the published version of the manuscript.
Funding
This research was funded by the national science and technology major project of China (No. 2011ZX05017) and the national natural science foundation of China (No. 51474187).
Data Availability Statement
The original contributions presented in the study are included in the article, further inquiries can be directed to the corresponding author.
Conflicts of Interest
Authors Naiyan Zhang, Yufei Li, Geng Tang, Hao Gong, Dajiang Zhu were employed by the PetroChina Southwest Oil & Gasfield Company. Author Qiyao He was employed by the CNPC and CNPC Tarim Oil Field Company.
References
- Wang, B.; Xiong, M.; Wang, P.; Shi, B. Chemical characterization in hydraulic fracturing flowback and produced water (HF-FPW) of shale gas in Sichuan of China. Environ. Sci. Pollut. Res. 2020, 27, 26532. [Google Scholar] [CrossRef] [PubMed]
- Demirbas, A.; Nurettin, C.; Sukru, A. Chemical analyses of shale gas and conventional natural gas. Petrol. Sci. Technol. 2018, 36, 1690–1695. [Google Scholar] [CrossRef]
- Kharazi Esfahani, P.; Akbari, M.; Khalili, Y. A comparative study of fracture conductivity prediction using ensemble methods in the acid fracturing treatment in oil wells. Sci. Rep. 2024, 14, 667. [Google Scholar] [CrossRef] [PubMed]
- Su, B.; Long, G.; Xu, X.; Wu, Q.; Ding, D.; Wang, Y. Safe completion and production technology of ultra-deep, high temperature, high pressure and high sulfur gas wells, Taking Yuanba gas field in Sichuan Basin as an example. Nat. Gas Ind. B 2014, 1, 13–16. [Google Scholar]
- Zhang, Z.; He, Y.; Wang, Y.; Wang, H.; Li, J.; Fu, Z. Study on risk assessment of wellbore integrity of sour gas well. China Saf. Sci. J. 2017, 13, 101–107. [Google Scholar]
- de Andrade, A.M.; Geers, C.; Chen, J.; Panas, I. Stress-corrosion cracking sensitization by hydrogen upon oxidation of nickel-base alloys by water—An experiment-guided first-principles study. J. Nucl. Mater. 2024, 595, 155044. [Google Scholar] [CrossRef]
- Dai, H.; Zhang, S.; Li, Y.; Yu, J.; Kuang, Y.; Xuan, F.; Chen, X. Stress corrosion cracking behavior of 316 L manufactured by different additive manufacturing techniques in hydrofluoric acid vapor. J. Mater. Sci. Technol. 2024, 191, 33–48. [Google Scholar] [CrossRef]
- Wang, Y.M.; Lu, C.Y.; Chen, R.Y. Influence of microstructural changes on intergranular corrosion and stress corrosion cracking of 5083-h116 alloys. Trans. Indian Inst. Met. 2024, 3, 77–89. [Google Scholar]
- Dong, L.; Wu, G.; Zhang, Y.; Shi, Z.; Wang, S.; Wang, Q.; Liu, L. Improvement of sulfide stress corrosion cracking resistance of the Inconel 625/X80 weld overlay by post-weld heat treatment. J. Mater. Sci. 2024, 59, 9574. [Google Scholar] [CrossRef]
- Wang, C.; Xu, L.; Zhang, Q. Effects of dual-phase deformation behaviors on simultaneously enhanced tensile properties and stress corrosion resistance of 2Cr13 martensitic stainless steel treated by laser shock peening. Surf. Coat. Technol. 2024, 5, 494. [Google Scholar] [CrossRef]
- Zhang, N.Y.; Zeng, D.Z.; Xiao, G.Q.; Shang, J.; Liu, Y.; Long, D.; He, Q.; Singh, A. Effect of Cl− accumulation on corrosion behavior of steels in H2S/CO2 methyldiethanolamine (MDEA) gas sweetening aqueous solution. J. Nat. Gas Sci. Eng. 2016, 12, 98–104. [Google Scholar] [CrossRef]
- Tang, X.; Cheng, Y.F. Micro-electrochemical characterization of the effect of applied stress on local anodic dissolution behavior of pipeline steel under near-neutral pH condition. Electrochim. Acta 2009, 5, 1499. [Google Scholar] [CrossRef]
- Zhang, C.; Cheng, Y.F. Corrosion of Welded X100 Pipeline Steel in a Near-Neutral pH Solution. J. Mater. Eng. Perform. 2010, 6, 834. [Google Scholar] [CrossRef]
- Saito, K.; Kuniya, J. Mechanochemical model to predict stress corrosion crack growth of stainless steel in high temperature water. Corros. Sci. 2001, 9, 1751. [Google Scholar] [CrossRef]
- Feitosa, J.L.C.S.; Da Cruz, A.G.B.; Souza, A.C.; Duda, F.P. Stress effects on hydrogen permeation through tubular multilayer membranes, Modeling and simulation. Int. J. Hydrogen Energy 2015, 40, 17031. [Google Scholar] [CrossRef]
- Zhao, W.; Zhang, T.; He, Z.; Sun, J.; Wang, Y. Determination of the Critical Plastic Strain-Induced Stress of X80 Steel through an Electrochemical Hydrogen Permeation Method. Electrochim. Acta. 2016, 214, 336. [Google Scholar] [CrossRef]
- Huang, F.; Cheng, P.; Zhao, X.Y.; Liu, J.; Hu, Q.; Cheng, Y.F. Effect of sulfide films formed on X65 steel surface on hydrogen permeation in H2S environments. Int. J. Hydrogen Energy 2017, 7, 4561. [Google Scholar] [CrossRef]
- Zhang, N.Y.; Zhang, Z. Synergistic effects of corrosion time and stress on corrosion of casing steel in H2S/CO2 gas wells. Mater. Corros. 2018, 69, 386. [Google Scholar] [CrossRef]
- Wang, B.; Jia, Q.Y.; Wang, Y.; Zhang, L.; Li, Q.; Chang, W.; Yao, H.; Lu, M. Study on the effect of wall shear force on the adsorption and desorption of corrosion inhibitor. In Proceedings of the 20th National Corrosion Inhibitor Symposium, Corrosion Inhibitor Professional Committee of Chinese Society for Corrosion and Protection, Wuhan, China, 24 July 2018; pp. 6–9. [Google Scholar]


Disclaimer/Publisher’s Note: The statements, opinions and data contained in all publications are solely those of the individual author(s) and contributor(s) and not of MDPI and/or the editor(s). MDPI and/or the editor(s) disclaim responsibility for any injury to people or property resulting from any ideas, methods, instructions or products referred to in the content. |
© 2024 by the authors. Licensee MDPI, Basel, Switzerland. This article is an open access article distributed under the terms and conditions of the Creative Commons Attribution (CC BY) license (https://creativecommons.org/licenses/by/4.0/).