Abstract
As a process fluid in oil reservoirs, carbon dioxide plays a dominant role in enhanced oil recovery by increasing volume and decreasing interfacial tension. To study the volume expansion behavior of a CO2–oil system under reservoir conditions, ten hydrocarbon components with carbon numbers ranging from 8 to 26 were selected to represent crude oil. Systems of CO2 with normal alkanes, cycloalkanes, and aromatic hydrocarbons were measured using a self-assembled high-pressure visible cell, with a temperature range of 313.15 K to 353.15 K and a pressure up to 25 MPa. Experimental results demonstrate that pressure and temperature significantly influence the relative volumetric expansion behavior. The expansion rate exhibits a positive correlation with pressure, whereas it shows a negative correlation with temperature. Among different molecular configurations, normal alkanes exhibit the most pronounced swelling effect. This study establishes that the volumetric expansion behavior of crude oil under CO2 exposure is predominantly governed by n-alkane components with carbon numbers less than 16. In the heavy hydrocarbon (carbon number > 16) and CO2 system, the influence of hydrocarbon structure and carbon number on the expansion extent is considerably reduced. This paper delivers critical theoretical foundations for elucidating the microscopic interaction mechanisms in CO2 enhanced oil recovery and optimizing injection parameter strategies.
1. Introduction
Carbon dioxide (CO2) is one of the long-lived greenhouse gases (GHGs) emitted by human activities [1,2,3,4]. Supercritical CO2 is considered as an attractive fluid for oil drive due to its low cost and high solubility in crude oil. Additionally, it contributes to the geological storage of CO2, supporting the global carbon neutrality goal [5,6,7,8]. Furthermore, carbon dioxide dissolved in crude oil reduces its viscosity and interfacial tension, thereby increasing the fluidity and volume expansion of crude oil [9,10]. In recent years, carbon dioxide has been widely utilized as an injection fluid in enhanced oil recovery (EOR) technologies, and it is regarded as an efficient and cost-effective method for secondary or tertiary extraction of crude oil [11,12,13]. Supercritical carbon dioxide combines the high diffusivity of a gas with higher density of a liquid, making it an effective fluid with excellent solubility in crude oil [14,15]. As the solubility of carbon dioxide in crude oil increases, it improves the mass transfer rate, increases the volume expansion coefficient, and significantly decreases the viscosity of crude oil. This volumetric expansion occupies pore volume, thereby increasing reservoir oil saturation. Simultaneously, it effectively supplements formation energy, both of which have a positive effect on crude oil extraction [16,17]. Volumetric swelling of crude oil forces oil droplets to migrate out of the pores, aggregating the dispersed droplets and facilitating crude oil extraction [18,19,20]. Volumetric swelling in a CO2–crude oil system is considered a major contributor to enhanced oil recovery (EOR) [9,10,21,22,23]. These factors play a significant role in enhancing wave efficiency and oil mobility.
Accurately measuring the parameters of crude oil or binary systems with typical components of crude oil-CO2 under reservoir conditions is of significant practical importance. Over the past few decades, researchers have investigated the volume expansion behavior of CO2-crude oil and CO2-pure hydrocarbon mixtures at high temperatures and pressures using pressure-volume-temperature (PVT) methods. Ren et al. measured volumetric expansion data for CO2-n-decane at 344.25 K and 10.1 MPa [24]. Yang et al. investigated the volume expansion behavior of CO2 in n-hexane, octane, decane, cyclohexane, and toluene under near-critical and supercritical conditions [21,25]. Subsequent studies extended the investigation to systems including CO2-kerosene, tetradecane, white oil, and mixed oils at 313.15 K using a fixed-volume PVT method [26]. Han et al. selected five representative chain alkanes (n-hexane, n-nonane, n-dodecane, n-tetradecane, and n-hexadecane) and investigated the volume expansion resulting from CO2 injection using constant mass expansion experiments. They introduced the concept of “molar density” for hydrocarbon components to characterize the influence of crude oil component properties on expansion performance. Their results demonstrated that the volume expansion coefficients of the CO2-hydrocarbon system exhibited a strictly increasing linear relationship with the molar density of the pure crude oil components under corresponding temperature and pressure conditions [22,27,28]. Further investigation of crude oil, consisting of eleven hydrocarbon fractions mixed with CO2 at various CO2 molar fractions, revealed that a higher concentration of light hydrocarbon molecules per unit volume resulted in a greater degree of volume expansion upon CO2 dissolution [26,27,28,29]. Through PVT experiments, Zhang et al. investigated the phase change characteristics of crude oil during direct contact with pure CO2. They observed that the dissolution rate of CO2 into the crude oil system decreased with increasing contact time under constant pressure [30]. Qian et al. found that the crude oil richer in light components dissolved more CO2 per unit volume and exhibited greater volume expansion [31]. Li et al. measured the expansion coefficients of solvent-CO2-heavy oil systems under high-pressure, high-temperature conditions (280.45 K to 396.15 K) using a PVT apparatus [32]. Their results indicated that changes in the volume expansion coefficient were more pronounced in CO2-light oil systems compared to heavier crude oils.
Crude oil is a complex fluid composed of various components, which can be categorized into saturated hydrocarbons, aromatic hydrocarbons, resins, and asphaltenes (SARA) based on its family composition [33,34]. Despite the dominant alkane fraction, the proportion of aromatic hydrocarbons in the oil gradually increases as the residual oil in the formation increases during the displacement process. Current experimental data are primarily limited to CO2-n-alkane systems or specific crude oil samples, lacking comprehensive and systematic conclusions. In this paper, the variation in CO2-hydrocarbon volume was measured by a self-assembled high-pressure visible cell in the temperature range of 313.15–353.15 K and at pressure up to 25 MPa. Ten hydrocarbon components with carbon numbers ranging from 8 to 26 were selected to represent crude oil, including normal alkanes, cycloalkanes and aromatic hydrocarbons—these three categories collectively cover the main hydrocarbon types in real crude oils, effectively addressing the prior limitation of over-reliance on single n-alkane systems or narrow crude oil samples to yield more comprehensive and systematic conclusions. The effects of hydrocarbon properties, carbon number, temperature, and pressure on volumetric expansion were systematically analyzed. Based on the macroscopic variation in hydrocarbon volume, the dispersion state of CO2 and various types of hydrocarbons were discussed.
2. Experiments
2.1. Materials
The materials used in this paper include CO2 with 99.99% purity, obtained from Beijing Haipu Gas Industry Corporation (China), and hydrocarbons, the details of which are listed in Table 1. Petroleum ether, used for cleaning the system, was purchased from Shanghai Aladdin Bio Chem Technology Co., Ltd (China). and is an analytical reagent.

Table 1.
Information of hydrocarbons.
2.2. Volume Expansion Measurement System
The schematic diagram of the apparatus used in the experiment is shown in Figure 1. All liquid phase volume measurements were performed using a self-assembled high-pressure unit with a viewing window, modified from the JEFRI suspended high-pressure interfacial tension meter manufactured by D.B. Robinson Company (Canada). The inner diameter of the high-pressure viewing container is 2.60 cm, and its total length is 2.80 cm. A magnetic stirrer was installed at the bottom of the container, with a stir bar submerged in the liquid phase (volume: 0.70 cm3) to facilitate rapid mixing of the oil phase and carbon dioxide. Its design aims to enable CO2 to dissolve rapidly and thoroughly in the oil phase, thereby facilitating the rapid achievement of system equilibrium. Additionally, a high-resolution Panasonic camera with 5 million pixels is connected to a computer, and this computer can process the photographic data through the program developed in our laboratory. The system is heated by heating bands wrapped around the container. The operating temperature is controlled by a PID power controller with an accuracy of 0.1 K. It is measured by a Pt100 temperature sensor inserted into the wall of the high-pressure container, and its average uncertainty is 0.01 K. Additionally, a pressure gauge is connected to monitor changes in system pressure, calibrated using a standard RUSKA deadweight pressure gauge with an uncertainty of 0.1 MPa.
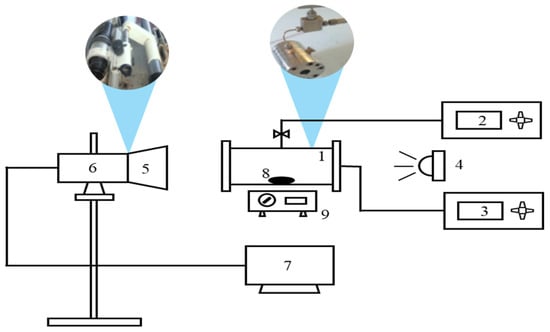
Figure 1.
Schematic diagram of the experimental apparatus (1. high-pressure visual cell; 2. pressure gauge; 3. thermostat; 4. lighting device; 5. image magnification system; 6. high resolution camera system; 7. computer; 8. stir bar; 9. magnetic stirrer).
2.3. Experimental Procedure
Initial preparation involved thoroughly cleaning of the high-pressure view cell and associated tubing with petroleum ether, followed by nitrogen purging to remove residual solvents and oxygen. Liquid hydrocarbon samples were introduced into the cell via a quantitative syringe injection. For solid samples (high-carbon-number hydrocarbons), the cell was disassembled to facilitate direct loading of the sample into the chamber. Following sample introduction, the system underwent dynamic vacuum evacuation for a minimum of 20 min to eliminate dissolved gases. A precise amount of carbon dioxide was subsequently injected into the cell. The assembled system, including connected piping, was then insulated with electrical heating jackets. Temperature ramping commenced at a controlled rate of 2 K/min, using a digital PID controller manufactured by Anthone Electronics Co., Ltd. (China). Concurrently with heating initiation, vigorous agitation was applied via a submerged magnetic stir bar to maximize the interfacial contact area and accelerate dissolution kinetics, thereby promoting rapid equilibration between the CO2 and hydrocarbon phases.
At each target temperature, the system pressure was recorded after reaching stabilization. Simultaneously, digital images capturing the liquid phase meniscus height within the view cell were acquired and stored using the self-developed CG Perf image acquisition software.(Version 1.2) To investigate varying CO2 concentrations, this procedure was repeated with systematically adjusted CO2 injection volumes. The equilibrated liquid phase volume at each condition was calculated from the digitized meniscus height measurements. All experimental conditions were replicated in triplicate, and the reported data points represent the arithmetic mean of the three measurements.
Thermodynamic equilibrium was confirmed prior to volume determination. Once confirmed, the volumetric expansion coefficient was calculated directly from the image-derived liquid phase volumes, relative to the initial volume under reference conditions. The methodology for calculating the image-based liquid volume within the cylindrical view cell is schematically detailed in Figure 2.
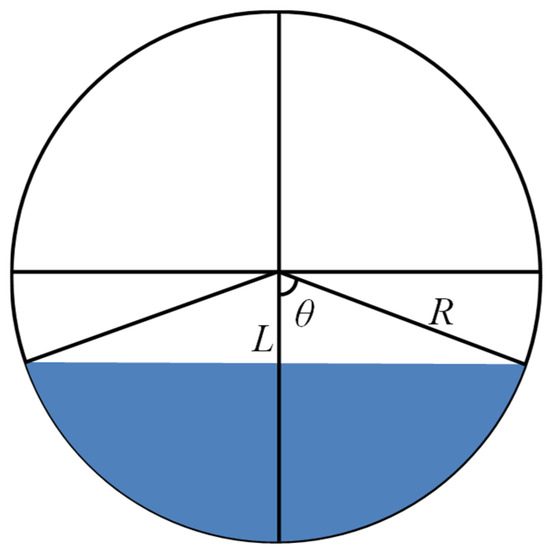
Figure 2.
Schematic of oil phase volume calculation.
According to Figure 2, the oil phase volume calculation formula is as follows:
where θ is the angle, L is the distance between the cell of the center of the circle and the liquid level. R and H represent the radius and length of the high-pressure visual cell, respectively. V is the volume of the liquid phase.
The volume expansion of a CO2-expanded oil phase is defined as [14]:
where ΔV/V represents the relative volume expansion of the hydrocarbon due to the addition of CO2. V2 is the total volume of the oil phase at the target temperature and atmospheric pressure. VL represents the total volume of a CO2-expanded oil phase.
3. Result and Discussion
3.1. Experimental Verification
The self-assembled high-pressure visualization vessel used in this study differs from conventional PVT reactors. To validate the reliability of our experimental data, the relative volume expansion values for the CO2-octane system at 333.15 K and 343.15 K were compared with the literature data from Yang et al. [21]. The absolute values of the average percentage errors calculated by linear interpolation for the two sets of data are 4.92% and 3.85%, respectively. As shown in Figure 3, the relative volume expansion values measured in this study closely align with the literature data. The observed deviations between the isothermal curves for the same system are attributed to differences in experimental methodology, instrument uncertainty, and the image-processing techniques used to determine liquid phase height. Therefore, the relative volume expansion data obtained with our visualization vessel demonstrate reliability and are consistent with those obtained from conventional PVT reactors.
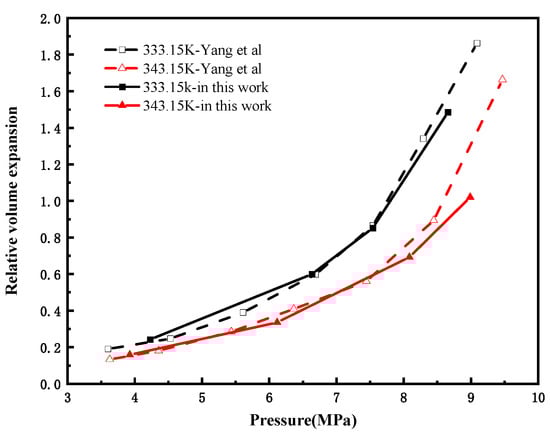
Figure 3.
Comparison of the relative volume expansion coefficient measured in this study with the pressure function of the reference data of the CO2-octane system [21].
3.2. Volume Expansion Behavior of Hydrocarbon Types
Figure 4 shows the CO2-injected oil phase undergoes three typical stages during volume expansion measurements conducted in the visualization reactor. Figure 4b illustrates a clear interface between liquid CO2 and the oil phase at an initial temperature of approximately 275.15 K. Subsequently, with increasing temperature and pressure during heating, liquid CO2 transitions first to a gaseous state and ultimately to a supercritical state. Figure 4c further depicts the dissolution of CO2 into the oil phase, leading to significant volumetric expansion.
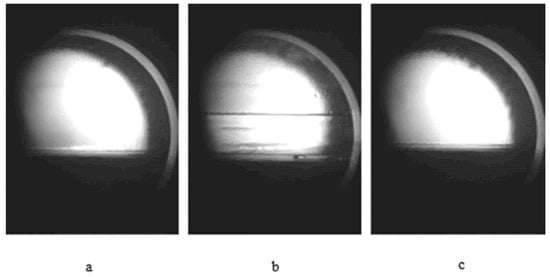
Figure 4.
Volume expansion stage during CO2 injection into the oil phase: (a) Oil phase without CO2 injection; (b) Oil phase interface after CO2 injection; (c) Significant volume expansion of the oil phase caused by CO2 dissolution after heating.
Figure 5 depicts the isothermal diagrams of the CO2–n-alkane systems at temperatures of 313.15 K, 333.15 K, and 353.15 K. The relative volume expansion increases with increasing pressure and decreases with increasing temperature, primarily owing to variations in the solubility of CO2 in the liquid phase. This phenomenon can be attributed to enhanced molecular thermal motion, which decreases the interaction efficiency between the CO2 and hydrocarbon molecules, thereby diminishing the overall expansion effect. For short-chain alkanes subjected to elevated pressures, even a moderate pressure increase induces significant volumetric expansion. This effect arises from the incorporation of numerous CO2 molecules into the intermolecular voids of hydrocarbons, which reduces intermolecular interaction forces and weakens the compressive effect associated with pressure increase. For high-carbon alkanes (carbon number > 16), the pressure-dependent behavior of their volume expansion curves differs significantly from that of low-carbon alkanes (carbon number < 16). Figure 5a shows that at lower pressures, CO2 dissolution induces volumetric expansion, causing the curve to rise. As pressure increases, the upward slope of the curve gradually decreases. With further increase in pressure, the volume expansion curve reverses and begins to decline, indicating that the compression effect becomes dominant and outweighs the expansion effect. Moreover, the expansion effect weakens as the alkane carbon number increases. Figure 5c shows that when the temperature rises to 353.15 K, the volume expansion coefficient curves of n-hexadecane and n-hexacosane nearly overlap, suggesting that at high carbon numbers, increasing temperature mitigates the differences in expansion behavior caused by variations in carbon number. In the CO2–hexacosane system, the volume expansion coefficient remains almost constant after the pressure reaches 18.69 MPa, indicating that a balance is achieved between the extraction and dissolution effects. Overall, high-carbon alkanes exhibit weaker volumetric expansion effects, with minimal changes in volume. Therefore, when injecting carbon dioxide into reservoirs, crude oils rich in light alkanes (carbon number < 16) will experience more pronounced volumetric expansion.
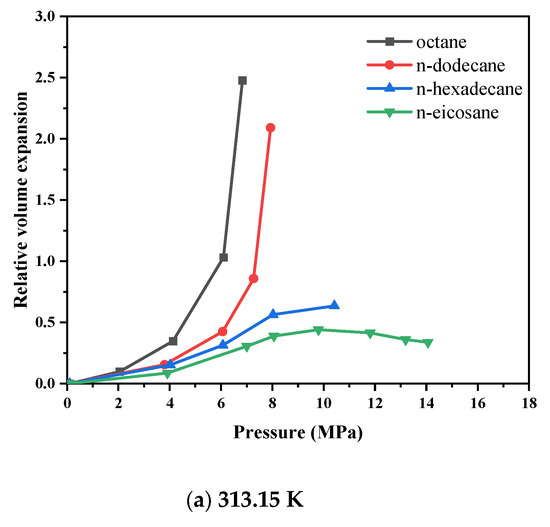
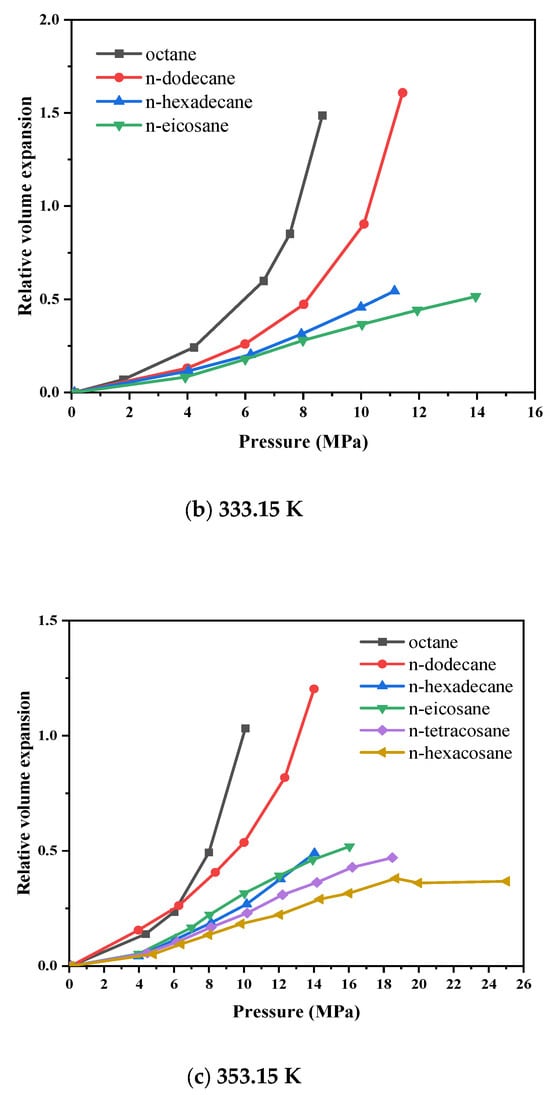
Figure 5.
Variation in volume expansion with pressure for CO2-n-alkane systems.
Cycloalkanes and aromatic hydrocarbons constitute important fractions of crude oil. Figure 6 and Figure 7 present the volume expansion coefficients of the CO2–cycloalkane and CO2–aromatic hydrocarbon systems under varying conditions. The volume expansion patterns of cycloalkanes and alkylbenzenes are similar to those of n-alkanes; specifically, the relative volumetric expansion increases with rising pressure and decreases with increasing temperature. In Figure 6, for hydrocarbons with the same number of carbon atoms, aromatic compounds containing benzene rings (e.g., bicyclohexane) exhibit significantly higher volume expansion coefficients than their cycloalkane counterparts (e.g., phenylcyclohexane). This suggests that the presence of an aromatic benzene ring in the molecular structure leads to a more pronounced volumetric expansion effect compared to cycloalkanes. The π system in aromatic hydrocarbons provides stronger directional interaction sites with CO2, making CO2 more easily soluble and stable, thereby enhancing the overall swelling effect. In Figure 7, n-decylbenzene (C16H26) shows only minor variation in its volume expansion coefficient across different temperatures and pressures, reflecting low sensitivity to such changes. In contrast, ethylbenzene (C8H10), a low-carbon-number aromatic, displays considerably greater fluctuation under the same conditions, along with a notably higher volumetric expansion coefficient than n-decylbenzene. These results indicate that among aromatic compounds with similar ring structures, those with higher carbon numbers exhibit more stable volumetric expansion behavior, reduced sensitivity to variations in temperature and pressure, and smaller changes in expansion coefficients.
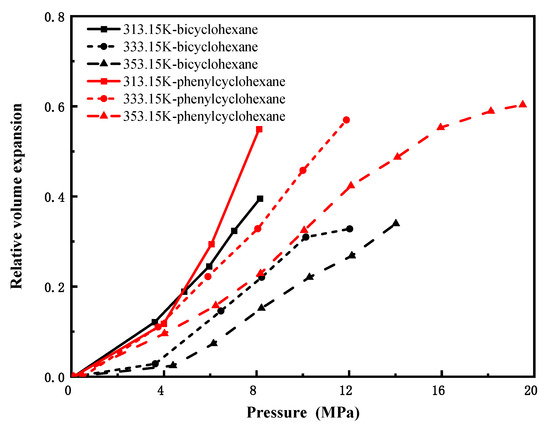
Figure 6.
Variation in volume expansion with pressure for CO2-cycloalkane systems.
Figure 7.
Variation in volume expansion with pressure for CO2-aromatic hydrocarbon systems.
Based on the experimental results, the dissolution mechanism of carbon dioxide in hydrocarbons was analyzed. Increasing pressure enhances the dissolution of CO2 into the hydrocarbon phase, thereby disrupting the original intermolecular equilibrium. At the initial stage, when the dissolution concentration of CO2 is low, the relatively small CO2 molecules primarily occupy the interstitial spaces between the larger hydrocarbon molecules. As pressure continues to rise, dissolved CO2 accumulates, leading to an increase in the average distance between hydrocarbon molecules. This weakens the intermolecular interactions and results in volumetric expansion.
Moreover, the larger intermolecular distances in light hydrocarbons, combined with the pronounced dispersive behavior of CO2 within them, facilitate more efficient permeation of CO2. In contrast, heavy hydrocarbons, with their more complex molecular structures, exhibit stronger intermolecular forces. These compounds show low sensitivity to pressure in terms of volume expansion; the expansion rate does not increase monotonically with pressure but rather follows a trend of initial increase, reaching a maximum, and then stabilizing. These variations originate from changes in the microscopic dispersion and aggregation states of CO2 within the crude oil, which alter the average distance between CO2 and hydrocarbon molecules and influence CO2 dissolution in the hydrocarbon phase. Simultaneously, the competing effects of CO2 dissolution and extraction also play a role in governing the volumetric expansion of the hydrocarbon phase [27,28,29].
3.3. Volume Expansion Behavior of Carbon Numbers
Figure 8 depicts the pressure-dependent volume expansion coefficients of CO2 in n-octane (C8H18) and ethylbenzene (C8H10) at 313.15 K, 333.15 K, and 353.15 K. Despite slight numerical differences between the two systems, their variation trends with pressure are highly consistent, indicating that molecular configuration exerts a limited influence on volume expansion for lower carbon number (C8) hydrocarbons. Figure 9 compares CO2-induced volume expansion of three C12 hydrocarbons with distinct structures: n-dodecane (linear alkane), bicyclohexane (dicyclic naphthene), and cyclohexylbenzene (aromatic-naphthenic hybrid). Under identical conditions, n-alkanes exhibit significantly higher expansion coefficients and greater variability than cycloalkanes and aromatics, reflecting superior CO2 swelling performance. This is attributed to looser molecular packing, larger intermolecular voids, and weaker intermolecular forces in n-alkanes—factors that facilitate pronounced expansion—demonstrating a considerable structural effect at this carbon number. Figure 10 presents isothermal expansion curves of n-hexadecane (C16H34) and n-decylbenzene (C16H26) at the same three temperatures. The CO2–n-hexadecane system shows a slightly higher relative volumetric expansion rate, but the two systems share consistent trend patterns, confirming that structural differences have only a minor impact on expansion behavior for high-carbon-number hydrocarbons, with overall expansion effects being insignificant.
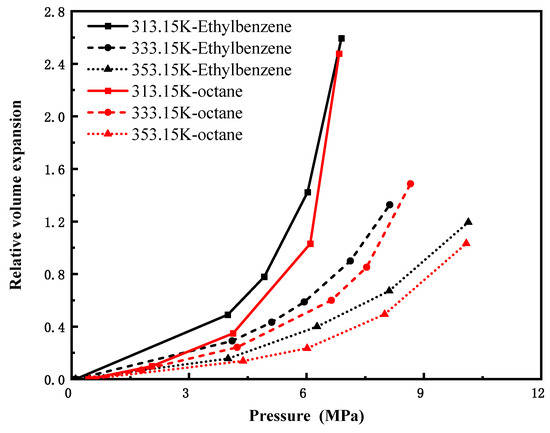
Figure 8.
CO2-Ethylbenzene and CO2-octane expansion coefficients versus pressure(C8).
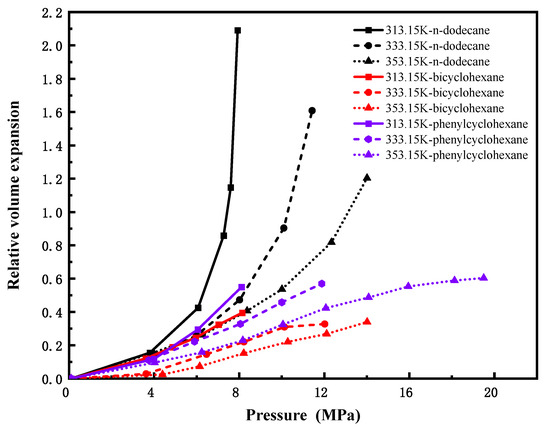
Figure 9.
CO2-n-dodecane, CO2-bicyclohexane and CO2-phenylcyclohexane expansion coefficients versus pressure(C12).
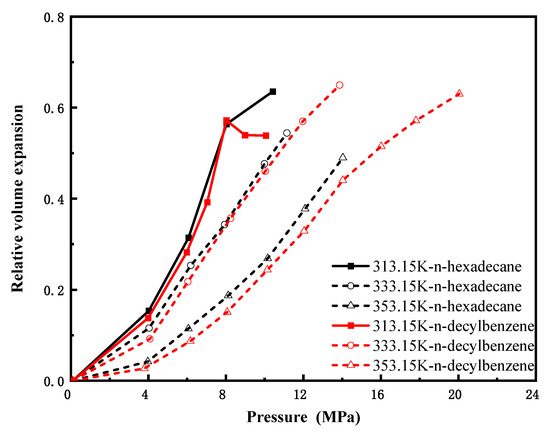
Figure 10.
CO2-n-hexadecane and CO2-n-decylbenzene expansion coefficients versus pressure(C16).
Molecular configuration influences volume expansion primarily through regulating intermolecular interactions: complex structures typically reduce intermolecular gaps and strengthen intermolecular forces, thereby inhibiting expansion. However, carbon number remains the dominant factor governing volume expansion. The expansion coefficient essentially reflects a hydrocarbon’s capacity to accommodate CO2, with enhanced CO2 uptake correlating with more notable volume expansion [26,35].
This study investigated three distinct structural types: n-alkanes, naphthenes, and aromatics. Owing to their lower molecular packing efficiency, n-alkanes possess substantial and irregular free volume, which enhances their capacity to dissolve and accommodate CO2, leading to a stronger swelling effect. Compounds containing benzene rings exhibit a slightly greater swelling effect than naphthenic structures. This may be attributed to the presence of benzene rings, which provide stronger, directional interaction sites (π-systems) for CO2, promoting dissolution and enabling more stable retention of CO2 molecules in their vicinity, thereby enhancing the overall swelling behavior. In contrast, bicyclohexane interacts with CO2 primarily through non-specific van der Waals forces, resulting in relatively weaker CO2 dissolution and retention capacity. However, further molecular-level investigations are necessary to fully elucidate these mechanisms [21,25,36].
4. Conclusions
This investigation involved experimental measurements of the relative volumetric expansion across ten different CO2 + hydrocarbon systems. The experiments were conducted under conditions of 313.15 K to 353.15 K, with pressures reaching a maximum of 25 MPa. The principal conclusions derived are as follows:
(1) Pressure and temperature exert significant regulatory effects on the relative volumetric expansion of diverse hydrocarbon systems. Specifically, the relative volumetric expansion rate exhibits a positive correlation with pressure and a negative correlation with temperature.
(2) The number of carbon atoms is the primary determinant of the volume expansion effect in the CO2-pure hydrocarbon system: for C < 16, the system exhibits good swelling; for C > 16, the heavy hydrocarbon system is less affected by the hydrocarbon components, structure, and carbon number, and the swelling is extremely weak. Under the same carbon number, the swelling effect of normal alkanes is stronger than that of cycloalkanes and aromatics, and this difference is most significant when C < 16. Therefore, the volume expansion induced by CO2 in crude oil is mainly dominated by C < 16 normal alkanes. These findings provide a foundation for optimizing CO2 EOR parameters in reservoir simulations.
Author Contributions
Conceptualization, Y.Z. and K.Z.; Methodology, Y.Z., M.W., W.L. and K.Z.; Validation, Y.Z., Z.Z. and J.G.; Formal analysis, Y.Z. and Z.Z.; Investigation, Y.Z., Z.Z. and J.G.; Resources, M.W., W.L. and K.Z.; Data curation, Y.Z. and Z.Z.; Writing—original draft, Y.Z. and Z.Z.; Writing—review & editing, Y.Z.; Supervision, W.L.; Project administration, W.L. and K.Z.; Funding acquisition, W.L. All authors have read and agreed to the published version of the manuscript.
Funding
This research was funded by Major national science and technology projects, Research on comprehensive regulation technology of CO2 miscible enhanced oil recovery grant number [2024ZD1406601] and science and technology research project of Science and Technology Research Project of PetroChina Company Limited, Research on enhanced oil recovery technology by mul-ti-component gas flooding grant number [2023ZZ0410]. The APC was funded by [2024ZD1406601].
Data Availability Statement
The original contributions presented in the study are included in the article, further inquiries can be directed to the author.
Conflicts of Interest
Authors Yu Zhang, Ziyang Zuo, Mingyuan Wang, Weifeng Lyu, Ke Zhang, and Jiahao Gao were employed by the China National Petroleum Corporation and State Key Laboratory of Enhanced Oil and Gas Recovery, PetroChina Company Limited.
References
- Zou, C.; Ma, F.; Pan, S.; Lin, M.; Zhang, G.; Xiong, B.; Wang, Y.; Liang, Y.; Yang, Z. Earth Energy Evolution, Human Development and Carbon Neutral Strategy. Pet. Explor. Dev. 2022, 49, 411–428. [Google Scholar] [CrossRef]
- Lv, W.; Wang, M.; Gao, M.; Gao, F.; Jia, N.; Dou, L. Global CCUS Industrial Cluster Status and Enlightenment to China. J. Bamti 2025, 1, 24–32. [Google Scholar]
- Wang, G.; Lv, W.; Cui, K.; Ji, Z.; Wang, H.; He, C. Technical Progress and Application of Global Carbon Dioxide Capture, Utilization and Storage Cluster. Pet. Explor. Dev. 2025, 52, 478–487. [Google Scholar] [CrossRef]
- Boot-Handford, M.E.; Abanades, J.C.; Anthony, E.J.; Blunt, M.J.; Brandani, S.; Mac Dowell, N.; Fernández, J.R.; Ferrari, M.-C.; Gross, R.; Hallett, J.P. Carbon Capture and Storage Update. Energy Environ. Sci. 2014, 7, 130–189. [Google Scholar] [CrossRef]
- Godec, M.L.; Kuuskraa, V.A.; Dipietro, P. Opportunities for Using Anthropogenic CO2 for Enhanced Oil Recovery and CO2 Storage. Energy Fuels 2013, 27, 4183–4189. [Google Scholar] [CrossRef]
- Fu, G.; Zheng, Z.; Zhang, Y.; Dai, Y.; Li, D.; Zhan, J.; Gao, C.; Fan, L. High-Pressure CO2 Solubility in Crude Oil and CO2 Miscibility Effects on Oil Recovery Performance in Low-Permeability Reservoirs. Energy Fuels 2024, 8, 23433–23446. [Google Scholar] [CrossRef]
- Song, X.; Wang, F.; Ma, D.; Gao, M.; Zhang, Y. Progress and Prospect of Carbon Dioxide Capture, Utilization and Storage in CNPC Oilfields. Pet. Explor. Dev. 2023, 50, 206–218. [Google Scholar] [CrossRef]
- Yuan, S.; Han, H.; Wang, H.; Luo, J.; Wang, Q.; Lei, Z.; Xi, C.; Li, J. Research Progress and Potential of New Enhanced Oil Recovery Methods in Oilfield Development. Pet. Explor. Dev. 2024, 51, 841–854. [Google Scholar] [CrossRef]
- Ferguson, R.C.; Nichols, C.; Leeuwen, T.V.; Kuuskraa, V. A Storing CO2 with enhanced oil recovery. Energy Procedia 2009, 1, 1989–1996. [Google Scholar] [CrossRef]
- Lv, G.; Li, Q.; Wang, S.; Li, X. Key techniques of reservoir engineering and injection–production process for CO2 flooding in China’s SINOPEC Shengli Oilfield. J. CO2 Util. 2015, 11, 31–40. [Google Scholar] [CrossRef]
- Ren, Q.; Chen, G.; Yan, W.; Guo, T. Interfacial Tension of (CO2+ CH4) + Water from 298 K to 373 K and Pressures up to 30 MPa. J. Chem. Eng. Data 2000, 45, 610–612. [Google Scholar] [CrossRef]
- Blunt, M.; Fayers, F.; Orr, F.M. Carbon dioxide in enhanced oil recovery. Energy Convers. Manag. 1993, 34, 1197–1204. [Google Scholar] [CrossRef]
- Kiran, E.; Debenedetti, P.G.; Peters, C.J. Supercritical Fluids: Their Properties and Applications. In Supercritical Fluids: Fundamentals and Applications; Springer: Dordrecht, The Netherlands, 2000; pp. 1–29. Available online: https://link.springer.com/book/10.1007/978-94-011-3929-8#accessibility-information (accessed on 6 October 2025).
- Fuente Badilla, J.C.; Peters, C.J.; de Swaan Arons, J. Volume Expansion in Relation to the Gas–Antisolvent Process. J. Supercrit. Fluids 2000, 17, 13–23. [Google Scholar] [CrossRef]
- Metcalfe, R.S.; Yarborough, L. The Effect of Phase Equilibria on the CO2 Displacement Mechanism. Soc. Pet. Eng. J. 1979, 19, 242–251. [Google Scholar] [CrossRef]
- Mykkeltvedt, T.S.; Gasda, S.E.; Sandve, T.H. CO2 Convection in Hydrocarbon Under Flowing Conditions. Transp. Porous Media 2021, 139, 155–170. [Google Scholar] [CrossRef]
- Amarasinghe, W.; Fjelde, I.; Guo, Y. CO2 dissolution and convection in oil at realistic reservoir conditions: A visualization study. J. Nat. Gas Sci. Eng. 2021, 95, 104–113. [Google Scholar] [CrossRef]
- Yuan, S.; Wang, Q.; Li, J.; Han, H. Advances and Prospects of Gas Injection Technologies for Enhanced Oil Recovery. Acta Pet. Sin. 2020, 41, 1623–1632. [Google Scholar] [CrossRef]
- Li, J.; Gao, H.; Yan, C.; Wang, S.; Wang, L. Molecular Dynamics Simulation Study on the Interaction Mechanism between Crude Oil and CO2. Pet. Reserv. Eval. Dev. 2024, 14, 26–34. [Google Scholar] [CrossRef]
- Li, X.; Li, H.; Yang, D. Determination of Multiphase Boundaries and Swelling Factors of Solvent(s)–CO2–Heavy Oil Systems at High Pressures and Elevated Temperatures. Energy Fuels 2013, 27, 1293–1306. [Google Scholar] [CrossRef]
- Yang, Z.; Li, M.; Peng, B.; Lin, M.; Dong, Z. Dispersion Property of CO2 in Oil 1 Volume Expansion of CO2 + Alkane at near Critical Supercritical Condition of CO2. J. Chem. Eng. Data 2012, 57, 882–889. [Google Scholar] [CrossRef]
- Han, H.; Yuan, S.; Li, S.; Liu, X.L.; Chen, X. Dissolving Capacity and Volume Expansion of Carbon Dioxide in Chain n-Alkanes. Pet. Explor. Dev. 2015, 42, 97–103. [Google Scholar] [CrossRef]
- Høgnesen, E.J.; Olsen, M.; Austad, T. Capillary and Gravity Dominated Flow Regimes in Displacement of Oil from an Oil-Wet Chalk Using Cationic Surfactant. Energy Fuels 2006, 20, 1118–1122. [Google Scholar] [CrossRef]
- Ren, W.; Scurto, A.M. High-Pressure Phase Equilibria with Compressed Gases. Rev. Sci. Instrum. 2007, 78, 125104. [Google Scholar] [CrossRef]
- Yang, Z.; Li, M.; Peng, B.; Lin, M.; Dong, Z. Dispersion Property of CO2 in Oil. 2: Volume Expansion of CO2 + Organic Liquid at Near-Critical and Supercritical Conditions of CO2. J. Chem. Eng. Data 2012, 57, 1305–1311. [Google Scholar] [CrossRef]
- Yang, Z.; Li, M.; Peng, B.; Lin, M.; Dong, Z. Volume Expansion of CO2 + Oil at Near Critical and Supercritical Conditions of CO2. Fuel 2013, 112, 283–288. [Google Scholar] [CrossRef]
- Han, H.; Li, Z.; Li, S.; Chen, X.; Qin, J. Volume Expansion Prediction of Supercritical CO2 + Crude Oil. Fluid Phase Equilibria 2017, 439, 9–17. [Google Scholar] [CrossRef]
- Han, H.; Li, S.; Chen, X.; Qin, J.; Zeng, B. Main Control Factors of Carbon Dioxide on Swelling Effect of Crude Hydrocarbon Components. Acta Pet. Sin. 2016, 37, 392–398. [Google Scholar] [CrossRef]
- Han, H.; Li, S.; Yao, X.; Chen, X.; Zhang, K.; Qin, J. Swelling Ability Prediction Method of Crude Oil-CO2 System Based on Molar Density. Acta Pet. Sin. 2018, 39, 456–462. [Google Scholar] [CrossRef]
- Zhang, X.; Wang, Z.; Wang, S.; Li, F.; Liu, H. Visual Contact Characteristics and Characterization of the CO2 and n-Pentane/Crude Oil Interface. Pet. Geol. Exp. 2017, 39, 402–408. [Google Scholar] [CrossRef]
- Qian, K.; Yang, S.; Dou, H.; Wang, Q.; Huang, Y.; Wan, T.; Zhang, Y. Interaction of the CO2-Oil System and Displacement Mechanisms during CO2 Flooding. Pet. Sci. Bull. 2019, 4, 69–82. [Google Scholar]
- Li, H.; Zheng, S.; Yang, D. Enhanced Swelling Effect and Viscosity Reduction of Solvent(s)/CO2/Heavy-Oil Systems. SPE J. 2013, 18, 695–707. [Google Scholar] [CrossRef]
- Sun, C.; Chen, G.; Yang, L. Interfacial Tension of Methane + Water with Surfactant near the Hydrate Formation Conditions. J. Chem. Eng. Data. 2004, 49, 1023–1025. [Google Scholar] [CrossRef]
- Sun, C.; Chen, G. Measurement of Interfacial Tension for the CO2 Injected Crude Oil + Reservoir Water System. J. Chem. Eng. Data 2005, 50, 936–938. [Google Scholar] [CrossRef]
- Fenghour, A.; Trusler, J.P.M.; Wakeham, W.A. Densities and bubble points of binary mixtures of carbon dioxide and n-heptane and ternary mixtures of n-butane, n-heptane and n-hexadecane. Fluid Phase Equilibria 2001, 185, 349–358. [Google Scholar] [CrossRef]
- Liu, J.; Qin, Z.; Wang, G.; Hou, X.; Wang, J. Critical properties of binary and ternary mixtures of hexane + methanol, hexane + carbon dioxide, methanol + carbon dioxide, and hexane + carbon dioxide + methanol. J. Chem. Eng. Data 2003, 48, 1610–1613. [Google Scholar] [CrossRef]


Disclaimer/Publisher’s Note: The statements, opinions and data contained in all publications are solely those of the individual author(s) and contributor(s) and not of MDPI and/or the editor(s). MDPI and/or the editor(s) disclaim responsibility for any injury to people or property resulting from any ideas, methods, instructions or products referred to in the content. |
© 2025 by the authors. Licensee MDPI, Basel, Switzerland. This article is an open access article distributed under the terms and conditions of the Creative Commons Attribution (CC BY) license (https://creativecommons.org/licenses/by/4.0/).