Article

Study on Borehole Trajectory Deviation Characteristics and Influencing Factors in Three-Soft Coal Seams

1
Guizhou Provincial Laboratory of Intelligent Development and Efficient Utilization of Energy, Guiyang 550025, China
2
Guizhou Mining Safety Science Research Institute Co., Ltd., Guiyang 550025, China
3
Guizhou Research Institute of Coal Mine Design Co., Ltd.,Guiyang 550025, China
4
School of Mining Engineering, Guizhou Institute of Technology, Guiyang 550003, China
*
Authors to whom correspondence should be addressed.
Processes 2025, 13(11), 3566; https://doi.org/10.3390/pr13113566
Submission received: 29 September 2025 / Revised: 16 October 2025 / Accepted: 20 October 2025 / Published: 5 November 2025

Abstract

The three-soft coal seam, characterized by its soft and fractured lithology, is prone to significant drilling trajectory deviation during construction, severely compromising gas drainage efficiency and posing potential safety hazards. In order to clarify the variation law of the drilling trajectory of the three-soft coal seam, this paper takes the 14205 working face of a mine in Guizhou Province as the engineering background, monitors and analyzes the drilling inclination and the change in the inclination, and then studies the influencing factors of the drilling deviation. During on-site drilling and coring operations and data monitoring, the formation lithology and fragmentation conditions were clarified, and the trajectories of gas drainage drilling holes at 15°, 30°, 45°, 60°, 75°, and 90° were obtained. It was observed that when the hole inclination is 15° or 90°, the change Δ value of the hole inclination is close to 0°. When the hole inclination is 30° or 75°, the change Δ value of the hole inclination is close to 2.5°. When the hole inclination is 45° or 60°, the change Δ value of the borehole inclination angle is close to 4.5°. The curve of the change Δ value of the borehole inclination angle and the borehole inclination angle was obtained by calculation and fitting, and the whole presents a quadratic function distribution. It was inferred that when the inclination angle of the borehole is 50°, the change Δ value of the inclination angle of the borehole reaches the maximum value, which is close to 5°, that is, the deflection of the gas drainage borehole is the largest. With the help of this curve, the deflection was predicted, controlled, and reduced. The AHP analysis model was used to rank the importance of the influencing factors of the borehole trajectory, and it was clear that the main controlling factor of the borehole deflection is the geological factor. This study provides a basis for obtaining the drilling deflection law and determining the appropriate drilling deflection control and correction technology.

1. Introduction

Gas drilling is one of the main means to prevent coal and gas outbursts. Preventing drilling deviation during drilling helps to ensure safe and efficient gas drainage. Therefore, it is necessary to clarify the law of stress distribution, permeability distribution, and the effective influence radius of gas drainage around the borehole. Scholars have conducted a lot of research on these topics [1,2]. They have studied the evolution law of coal and rock mass fractures to provide a basis for predicting the development of fractures around pores [3,4,5]. Computational fluid dynamics (CFD) simulations are an effective way to develop and optimize gas drainage designs for underground longwall coal mining [6]. The discrete element method (DEM) is combined with computational fluid dynamics (CFD) to accurately locate the gas-conducting fracture zone [7]. In practical engineering, the drainage radius of the borehole is a key parameter used to determine the design and arrangement of the drainage borehole, and the interaction between the boreholes in a multi-drilling system has a significant influence on the drainage radius of each borehole [8]. The area around the borehole is often damaged by borehole impact and stress redistribution during borehole installation [9]. According to parameters such as torque, thrust, rotational speed, and drilling speed during the drilling process, a three-dimensional numerical simulation model of the dynamic coal breaking of drill bits was established, and a three-dimensional drilling model and fitting function of the coal body stress and the drilling parameters were obtained [10]. In addition, dynamic monitoring devices for gas drainage borehole stability can also be used to conduct experiments on the three-dimensional deformation characteristics of boreholes under stable vertical loads [11]. Based on the gas gushing law of coal particles and the gas radial migration equation on well walls, a dynamic inversion model of gas pressure while drilling is established, which can measure the gas pressure in the process of coal seam drilling in real time, quickly, and accurately [12]. In a complex geological environment, a data-driven pore pressure estimation method based on mixed partial least squares regression is used to establish a real-time data-driven pore pressure estimation model integrating conventional empirical methods [13]. Aiming at the problem of gas accumulation in the upper corner caused by the high mining intensity of the working face, based on the key layer control theory, a numerical simulation study was carried out on the roof caving trend and development law of the sloping mining fissures. The evolution process of the advancement of the working face and the development height of the roof fissures were evaluated, and finally, the optimal drilling position and drilling structure of the near-horizontal high directional long drilling holes were obtained [14]. In addition, with the advancement in drilling equipment, directional drilling has the advantages of controllable trajectory and wide coverage area, which can provide a good solution to the problem of gas concentration exceeding the limit in the upper corner of the goaf and the return airway [15,16,17]. Notably, in hydrocarbon reservoirs, the drilling time for a 1 m borehole is strongly dependent on reservoir lithology and drilling parameters: in tight sandstone hydrocarbon reservoirs with uniaxial compressive strength (UCS) above 50 MPa, the drilling time per meter typically ranges from 8 to 15 min, while in relatively porous carbonate hydrocarbon reservoirs, it can be reduced to 3 to 6 min due to lower rock integrity. It is worth emphasizing that this 1 m drilling time not only directly reflects construction efficiency but also indirectly affects borehole trajectory stability—prolonged drilling in heterogeneous hydrocarbon reservoirs may increase trajectory deviation risks, as the drill tool interacts with variable lithology for a longer period, exacerbating the imbalance of drilling forces. The integrated drilling, protection, and sealing (IDPS) technology of drilling construction adopts high-purity nitrogen as the slag discharge medium, and the integrated screen tube insertion technology realizes the purpose of wellbore protection during the whole drilling process. The new airbag grouting technology guarantees high-quality wellbore plugging, with the use of dust removal devices to achieve a safe and clean operating environment, effectively avoiding the easy drilling of soft and broken coal seams, which is prone to drilling collapse; air leakage; and the production of CO, coal dust, and other environmental pollution problems during the drilling process [18].
A systematic review of the existing literature reveals three critical gaps in current research on borehole trajectory deviation within three-soft coal seams (soft coal, soft roof, and soft floor). First, most studies adopt a single-factor analytical framework, failing to synthesize the synergistic influences of geological, technical, and human-induced factors—all of which collectively govern borehole deviation. Second, few investigations target the unique composite geological setting of three-soft coal seams; instead, idealized rock mass models are commonly employed, which poorly replicate on-site conditions characterized by low rock strength and high fragmentation. Additionally, evaluations of deviation factors using the Analytic Hierarchy Process (AHP) often lack on-site validation, limiting the transferability of results to real-world construction scenarios.
To address these gaps, this study advances prior research through three contextually tailored approaches, specifically adapted to the challenges of three-soft coal seams. It centers on the 14205 working face of a coal mine in Guizhou Province—a representative three-soft coal seam site—ensuring tight alignment with the geological peculiarities inherent to such formations. It integrates high-precision on-site monitoring and AHP weighting analysis, thereby achieving the integration of multi-dimensional factors (geological, technical, and human) and bridging the divide between theoretical analysis and engineering practice. Furthermore, it quantifies borehole deviation patterns via quadratic function fitting and validates the AHP model through consistency testing, effectively resolving the lack of on-site verification that plagues the existing AHP-based studies.
Notably, discrepancies between actual and designed borehole trajectories are particularly pronounced during gas control drilling in three-soft coal seams. Variations in geological conditions, suboptimal drilling parameter design, inconsistent equipment performance, and uneven operational proficiency among personnel frequently result in significant deviations. This not only squanders construction resources (including time, labor, and costs) but also creates gas drainage blind zones and potential safety hazards [19]. The inherently soft nature of the coal seam and its roof/floor, coupled with the pronounced impact of soft interbeddings on rock strength and deformation, further exacerbates deviation issues [20,21]. Against this backdrop, this study addresses the problem of gas drainage blind zones and ineffective gas extraction caused by borehole deviation in three-soft coal seam environments. By analyzing the variation characteristics of borehole trajectories, it derives the trajectory equation describing changes in borehole inclination and identifies the primary controlling factors of deviation—ultimately providing a foundational basis for understanding borehole deviation laws and developing targeted deviation control and correction technologies.

2. Engineering Overview of Drilling Area

The coal seam at the 14205 working face of the Guizhou mine is characterized by soft texture, low strength, and poorly defined bedding. Part of the coal seam contains interbedded gangue. The working face has a strike length of 668 m, an inclination length of 187 m, an average coal thickness of 4.6 m, and an average dip angle of 6.5°. Analysis of drilling data, 3D seismic data, and detection results indicates that there are no magmatic bodies or collapse columns in or around the working face. The overall geological structure is monoclinic; however, the cut roadway is located near an anticline, and fault structures are well-developed in and around the working face.

2.1. Core Sampling in Drilling Area

To gain a detailed understanding of the geological conditions at the project construction site, a core drilling rig was employed to conduct coring operations in the drilling zone of the 14205 working face. Details of the obtained core samples are presented in Figure 1.
The cores obtained from the mudstone and sandy mudstone intervals—located 0–5 m and 16–21 m from the borehole collar—are presented in Figure 1a and Figure 1b, respectively, showing good formation integrity. In contrast, the cores from the limestone interval (12–16 m) are displayed in Figure 1c,d, exhibiting an agglomerated and fragmented state. For relatively intact mudstone and sandy mudstone in the 0–5 m and 16–21 m intervals, their shear strength typically ranges from 1.2 to 2.5 MPa (with sandy mudstone exhibiting slightly higher values, approximately 1.8–2.8 MPa). This is attributed to the dense arrangement of mineral particles. Their bulk density falls between 2.2 and 2.5 g/cm3; these physical and mechanical properties are responsible for the good formation integrity observed during coring. In contrast, the agglomerated and fragmented limestone in the 12–16 m interval has lower shear strength (approximately 0.8–1.5 MPa). Fragmentation weakens the intergranular bonding force, leading to this reduction. Its bulk density also decreases slightly, ranging from 1.9 to 2.2 g/cm3. This mechanical parameter variation is consistent with the fragmented state of the limestone observed in coring and directly manifests the disparity in rock stability across different intervals.

2.2. Three-Dimensional Model of Drilling Area

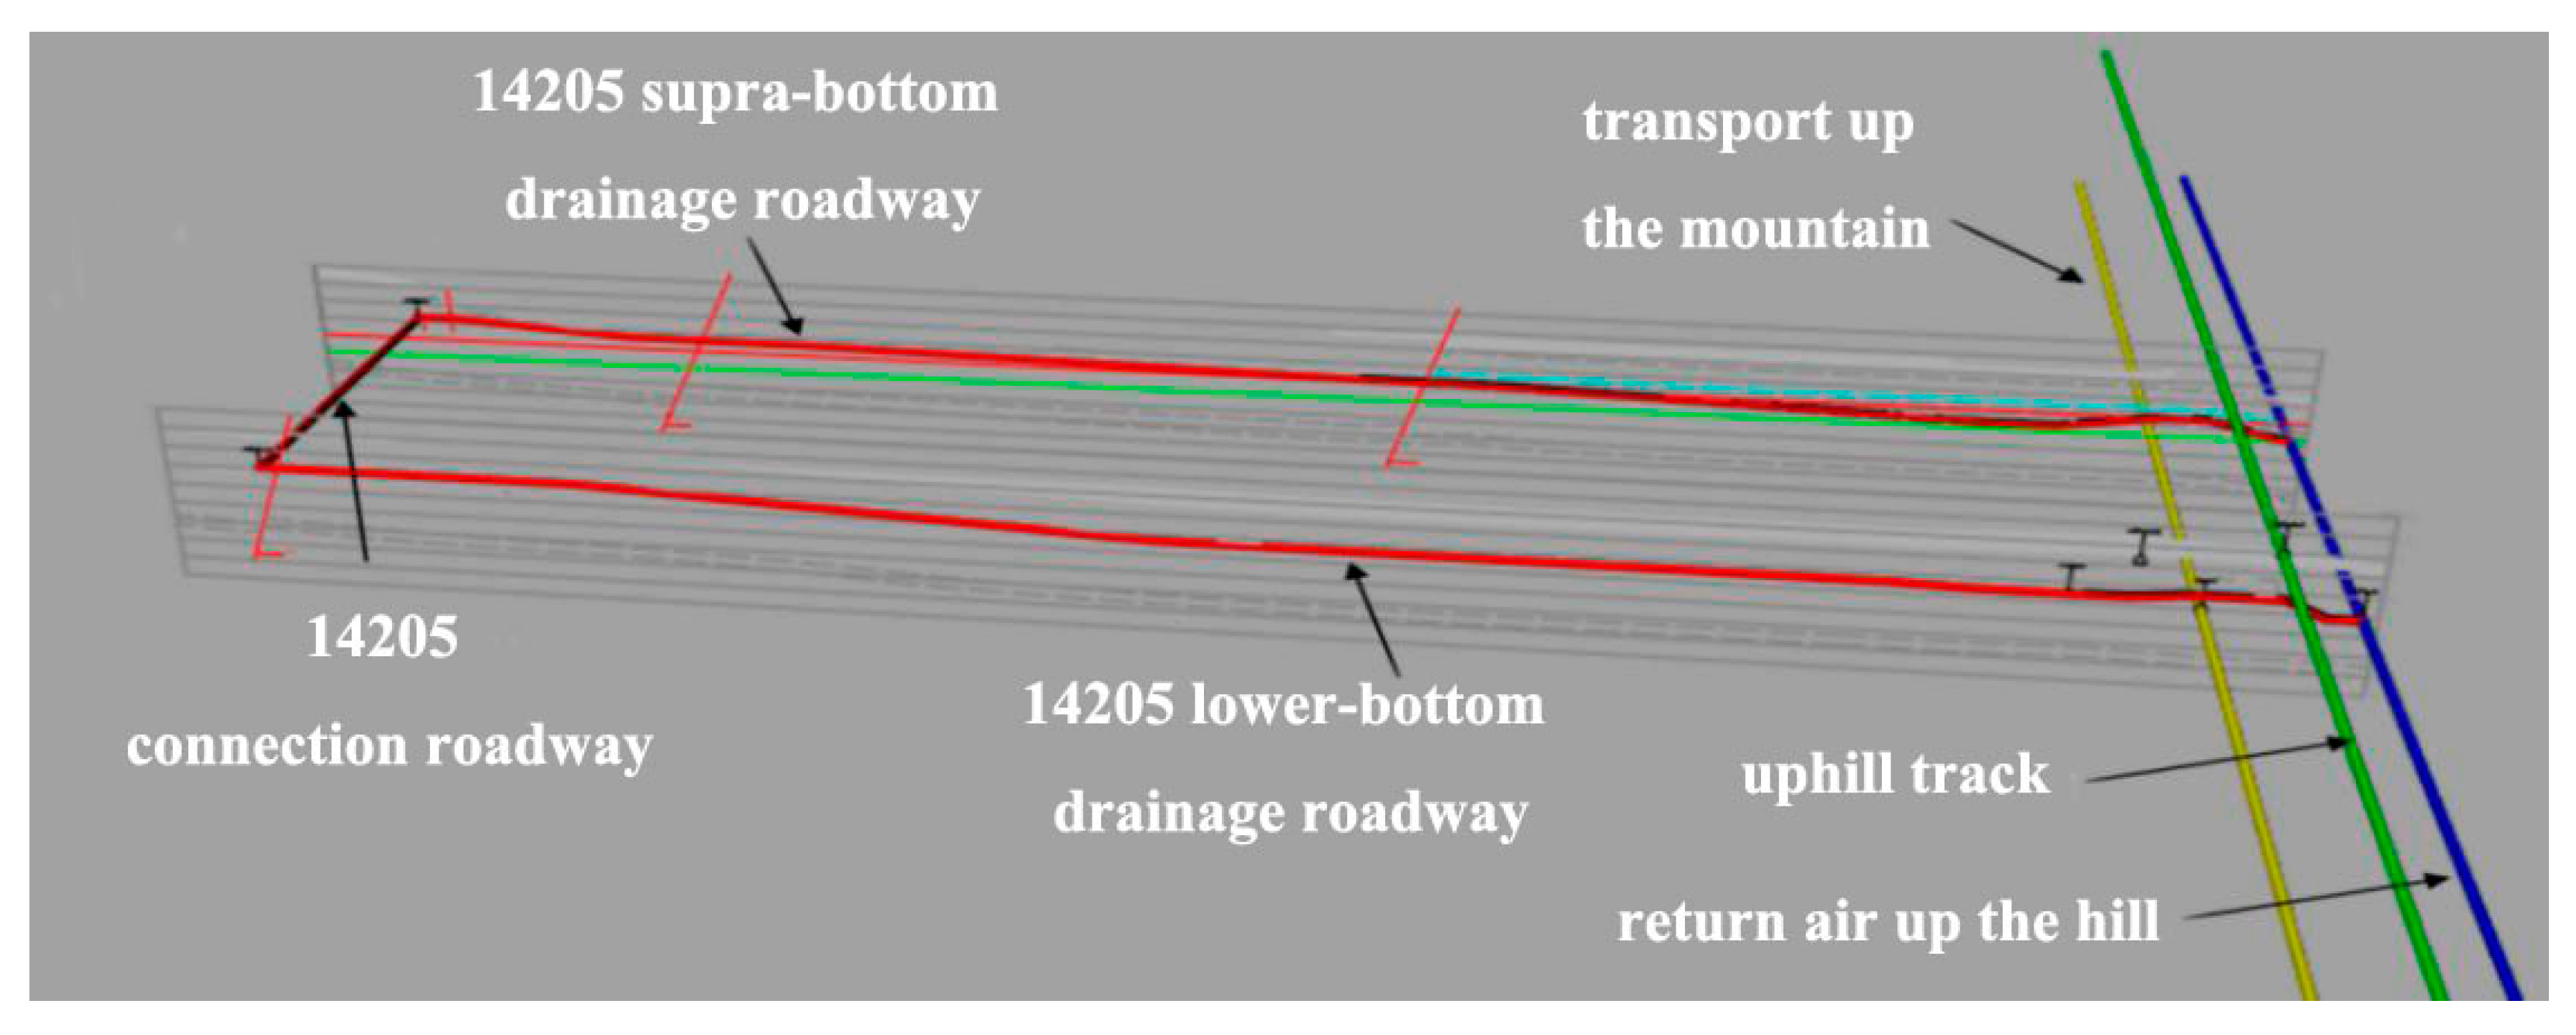
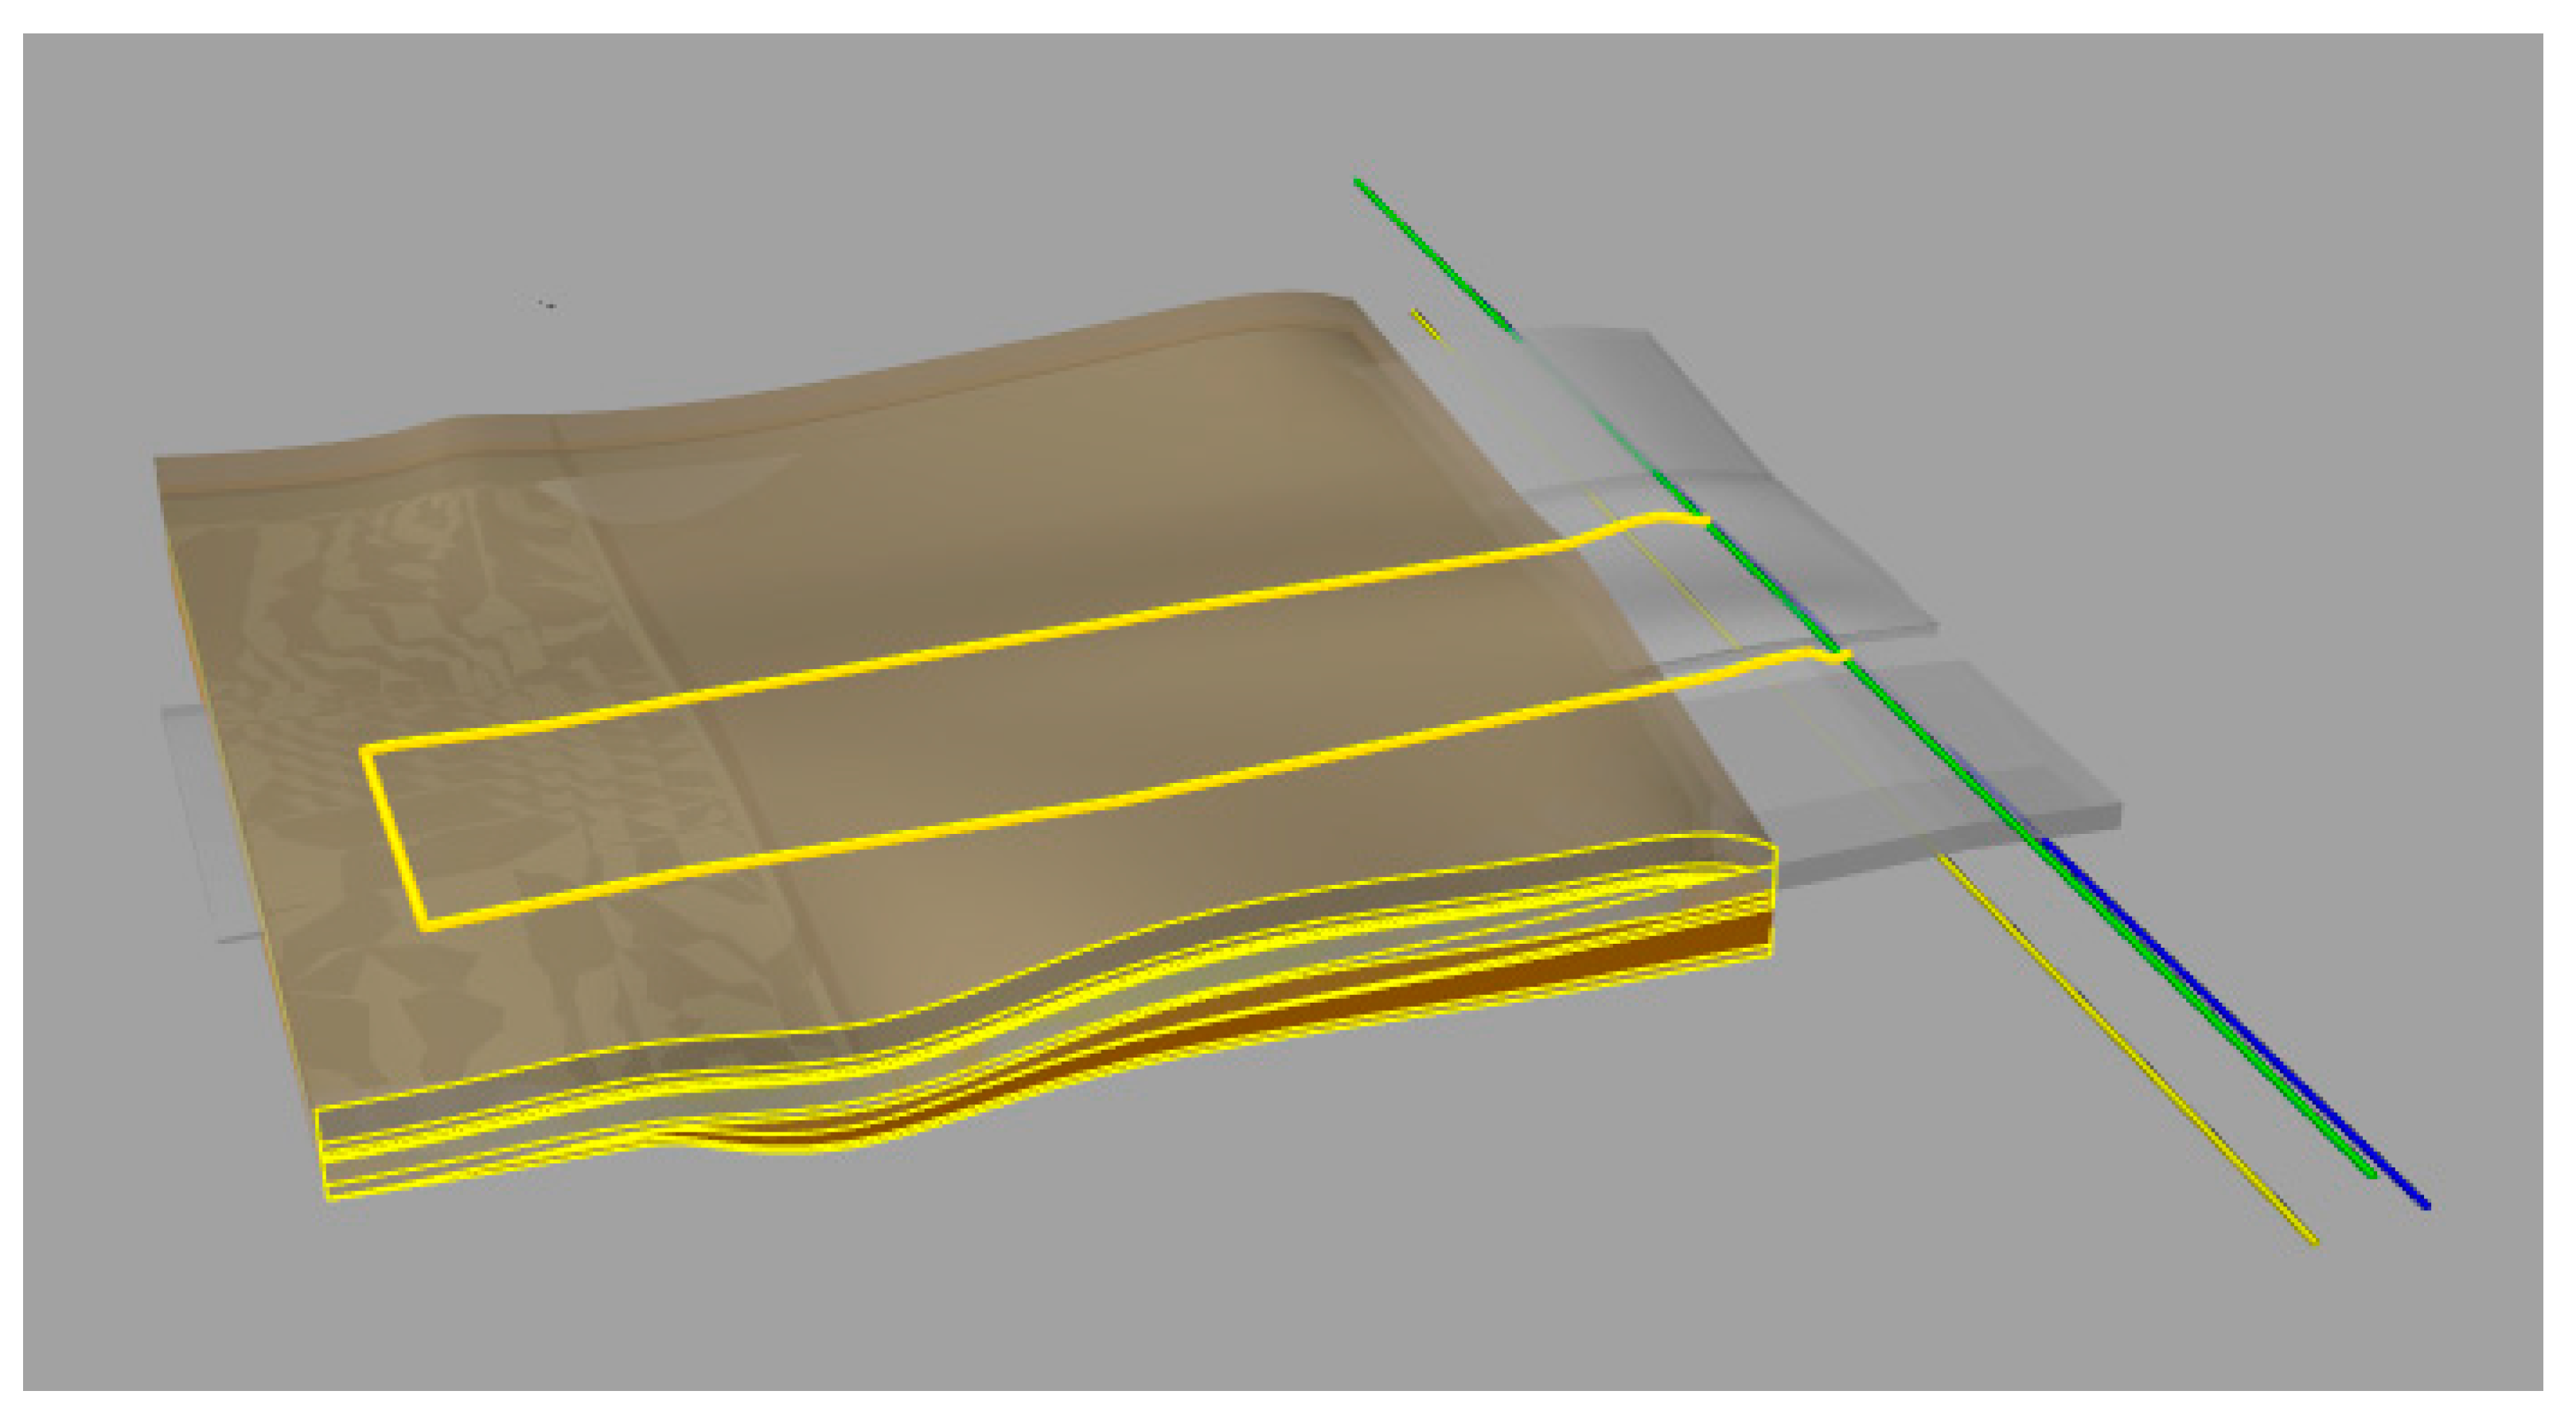
Based on on-site conditions—including roadway development layout and working face arrangement—and combined with the 14205 upper/bottom gas extraction lanes, 14205 bottom gas extraction connecting lane, 14205 lower bottom gas extraction lane, and floor contour maps, these engineering data were cross-referenced with the coring results. A surface modeling approach was then adopted to construct a 3D model of the drilling zone; the 3D model view is presented in Figure 2. Surfer—a widely used geoscientific software for 3D modeling—was employed for model visualization. This visualization process enabled the integration of on-site data (e.g., roadway layout and coring results) into a clear 3D geological representation, facilitating intuitive understanding of the drilling zone’s spatial characteristics.
Combined with the coring results, a visualized interpolation method was selected based on the actual distribution of the acquired data. To optimize the model’s lithology partitioning (Figure 3), the inverse distance weighted (IDW) interpolation function of Surfer 16.0 was, therefore, further employed. This function can effectively process discrete coring data, compute the lithology distribution probability of unmeasured areas, and generate smooth, logically consistent lithology partition contours, thus ensuring that the 3D model accurately reflects the actual geological structure of the 14205 working face.
For scenarios with large data volumes and relatively uniform data distribution, the IDW interpolation method was suitable for adoption. It not only yields smoother contours but also produces a more geologically reasonable surface, ultimately resulting in the lithology partition map presented in Figure 3.

3. Variation and Law of Borehole Deflection Trajectory

3.1. Variation Law of Borehole Deflection Angle

To ensure the accuracy of borehole straightness and inclination data, a high-precision gyro inclinometer (model: BJ-6A)—a device widely validated in coal mine drilling engineering—was adopted for on-site borehole trajectory measurement; this instrument relies on a micro-electromechanical gyroscope and accelerometer to sense the borehole’s spatial attitude, with data stored in a built-in memory module and exported via a USB interface for post-processing. Its key technical parameters are clearly specified as follows: measurement accuracy of ±0.1° for both inclination angle and azimuth angle (meeting the precision requirement for three-soft coal seam borehole monitoring) and a fixed data acquisition frequency of 5 m sampling interval along the borehole depth (i.e., one set of inclination–azimuth data collected every 5 m of drilling progress, ensuring continuous trajectory tracking without missing key depth intervals).
Potential sources of measurement error were systematically identified and controlled during the experiment to guarantee data reliability: for operation/reading errors, on-site construction personnel received pre-test training to standardize instrument lowering/retrieving operations, and the absolute error between the constructed inclination angle and the design angle was controlled within 1° via triple parallel measurements for each borehole; for environmental interference, the instrument was equipped with a waterproof and anti-vibration casing to mitigate the impact of downhole humidity (relative humidity ≤95%) and drilling-induced vibrations on sensor stability; for rock mass disturbance, in soft and fragmented intervals (e.g., the 12–16 m limestone section detailed in Section 2.1), the borehole wall was temporarily supported with a polymer casing before measurement to avoid instrument jamming or attitude misalignment caused by wall collapse.
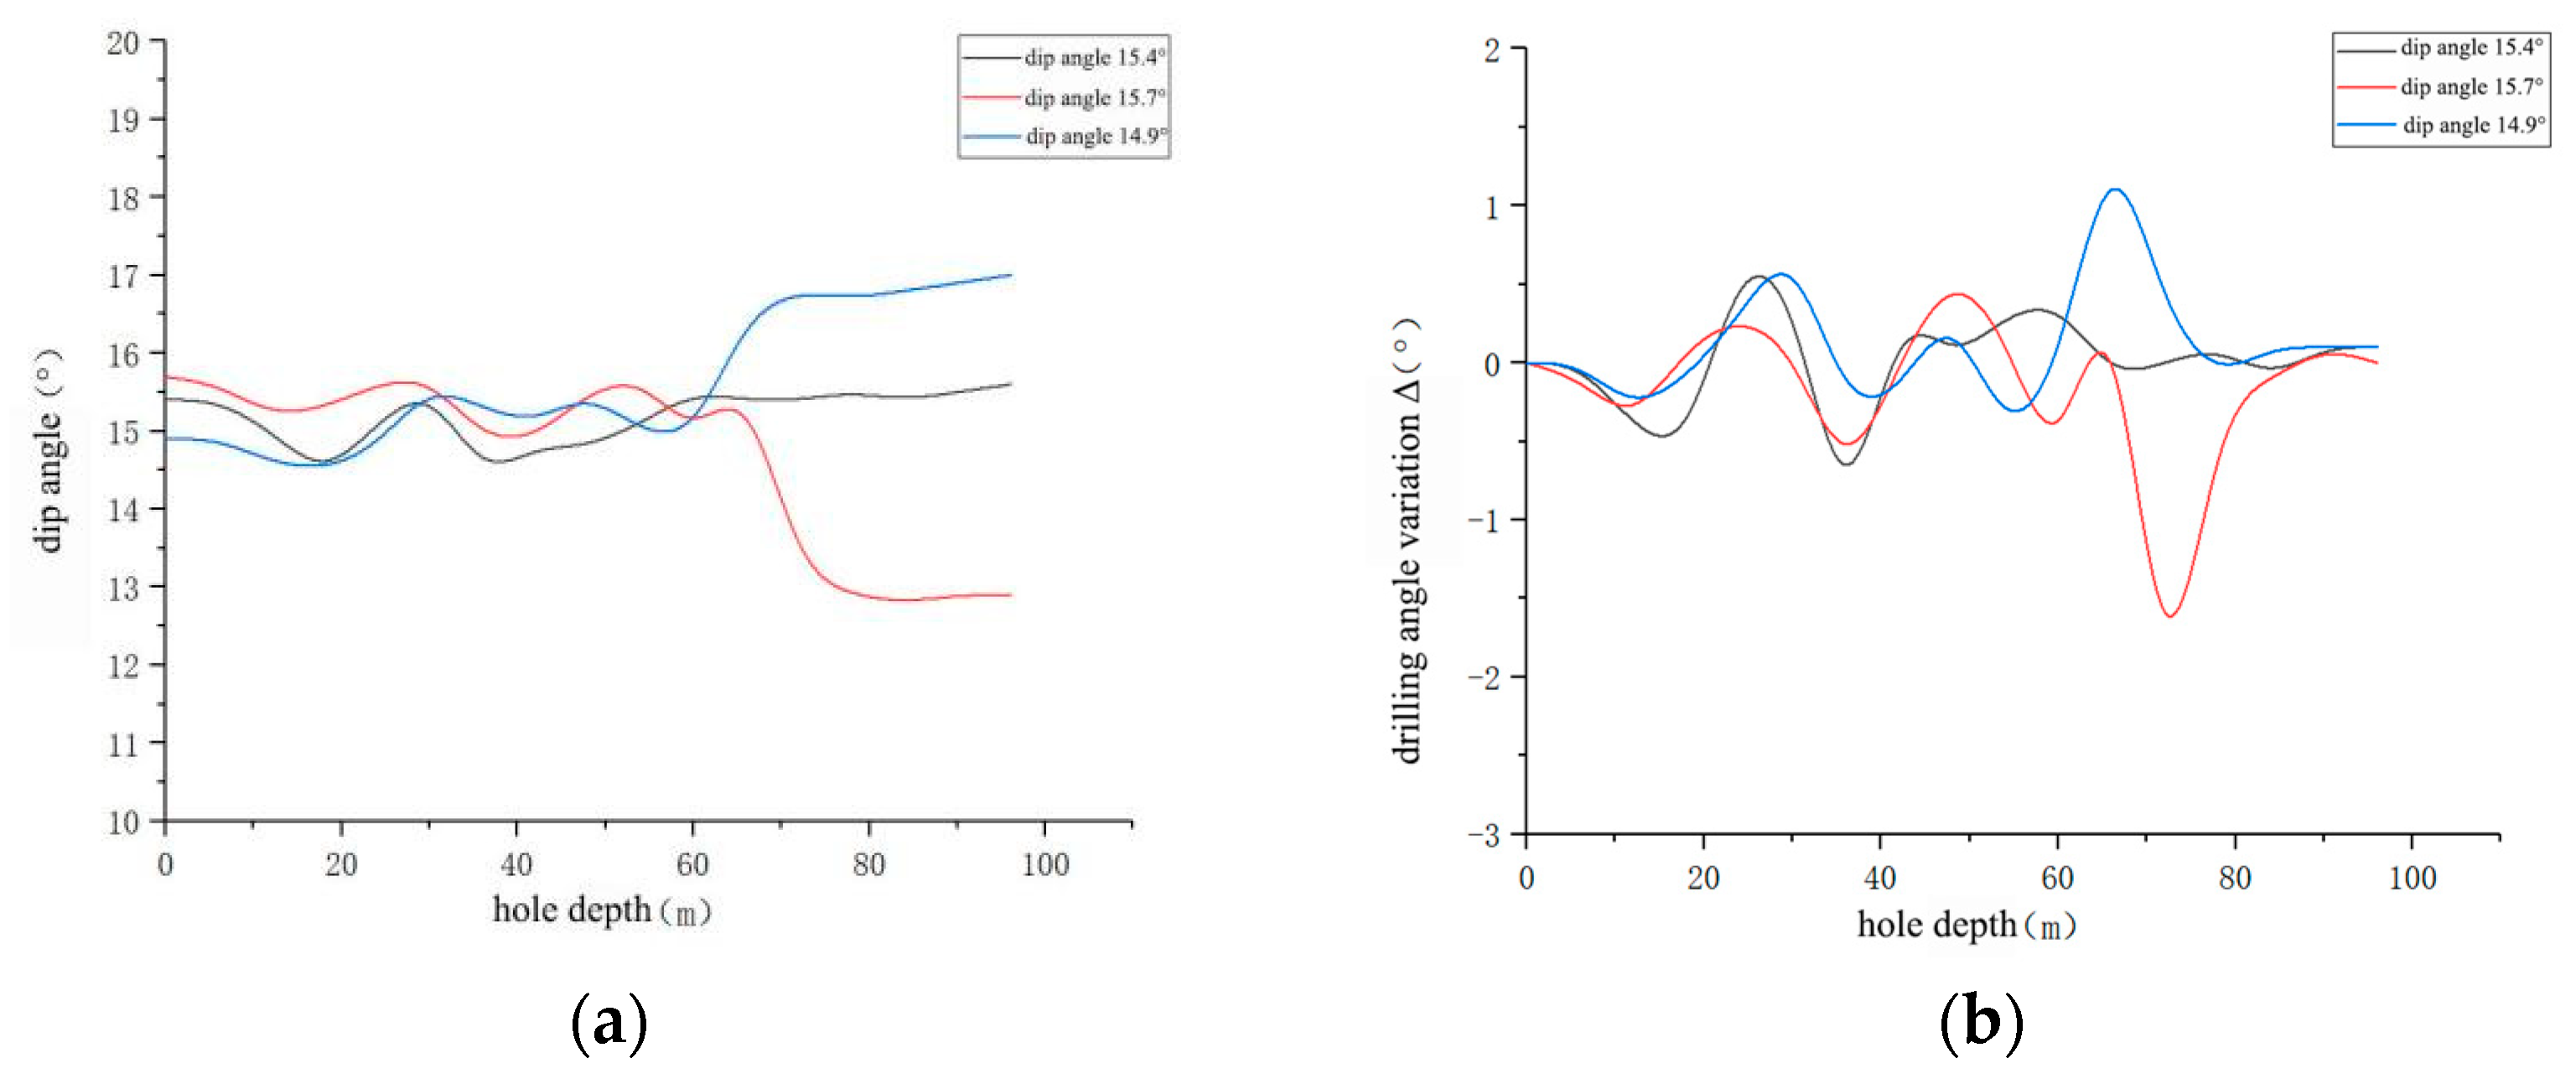
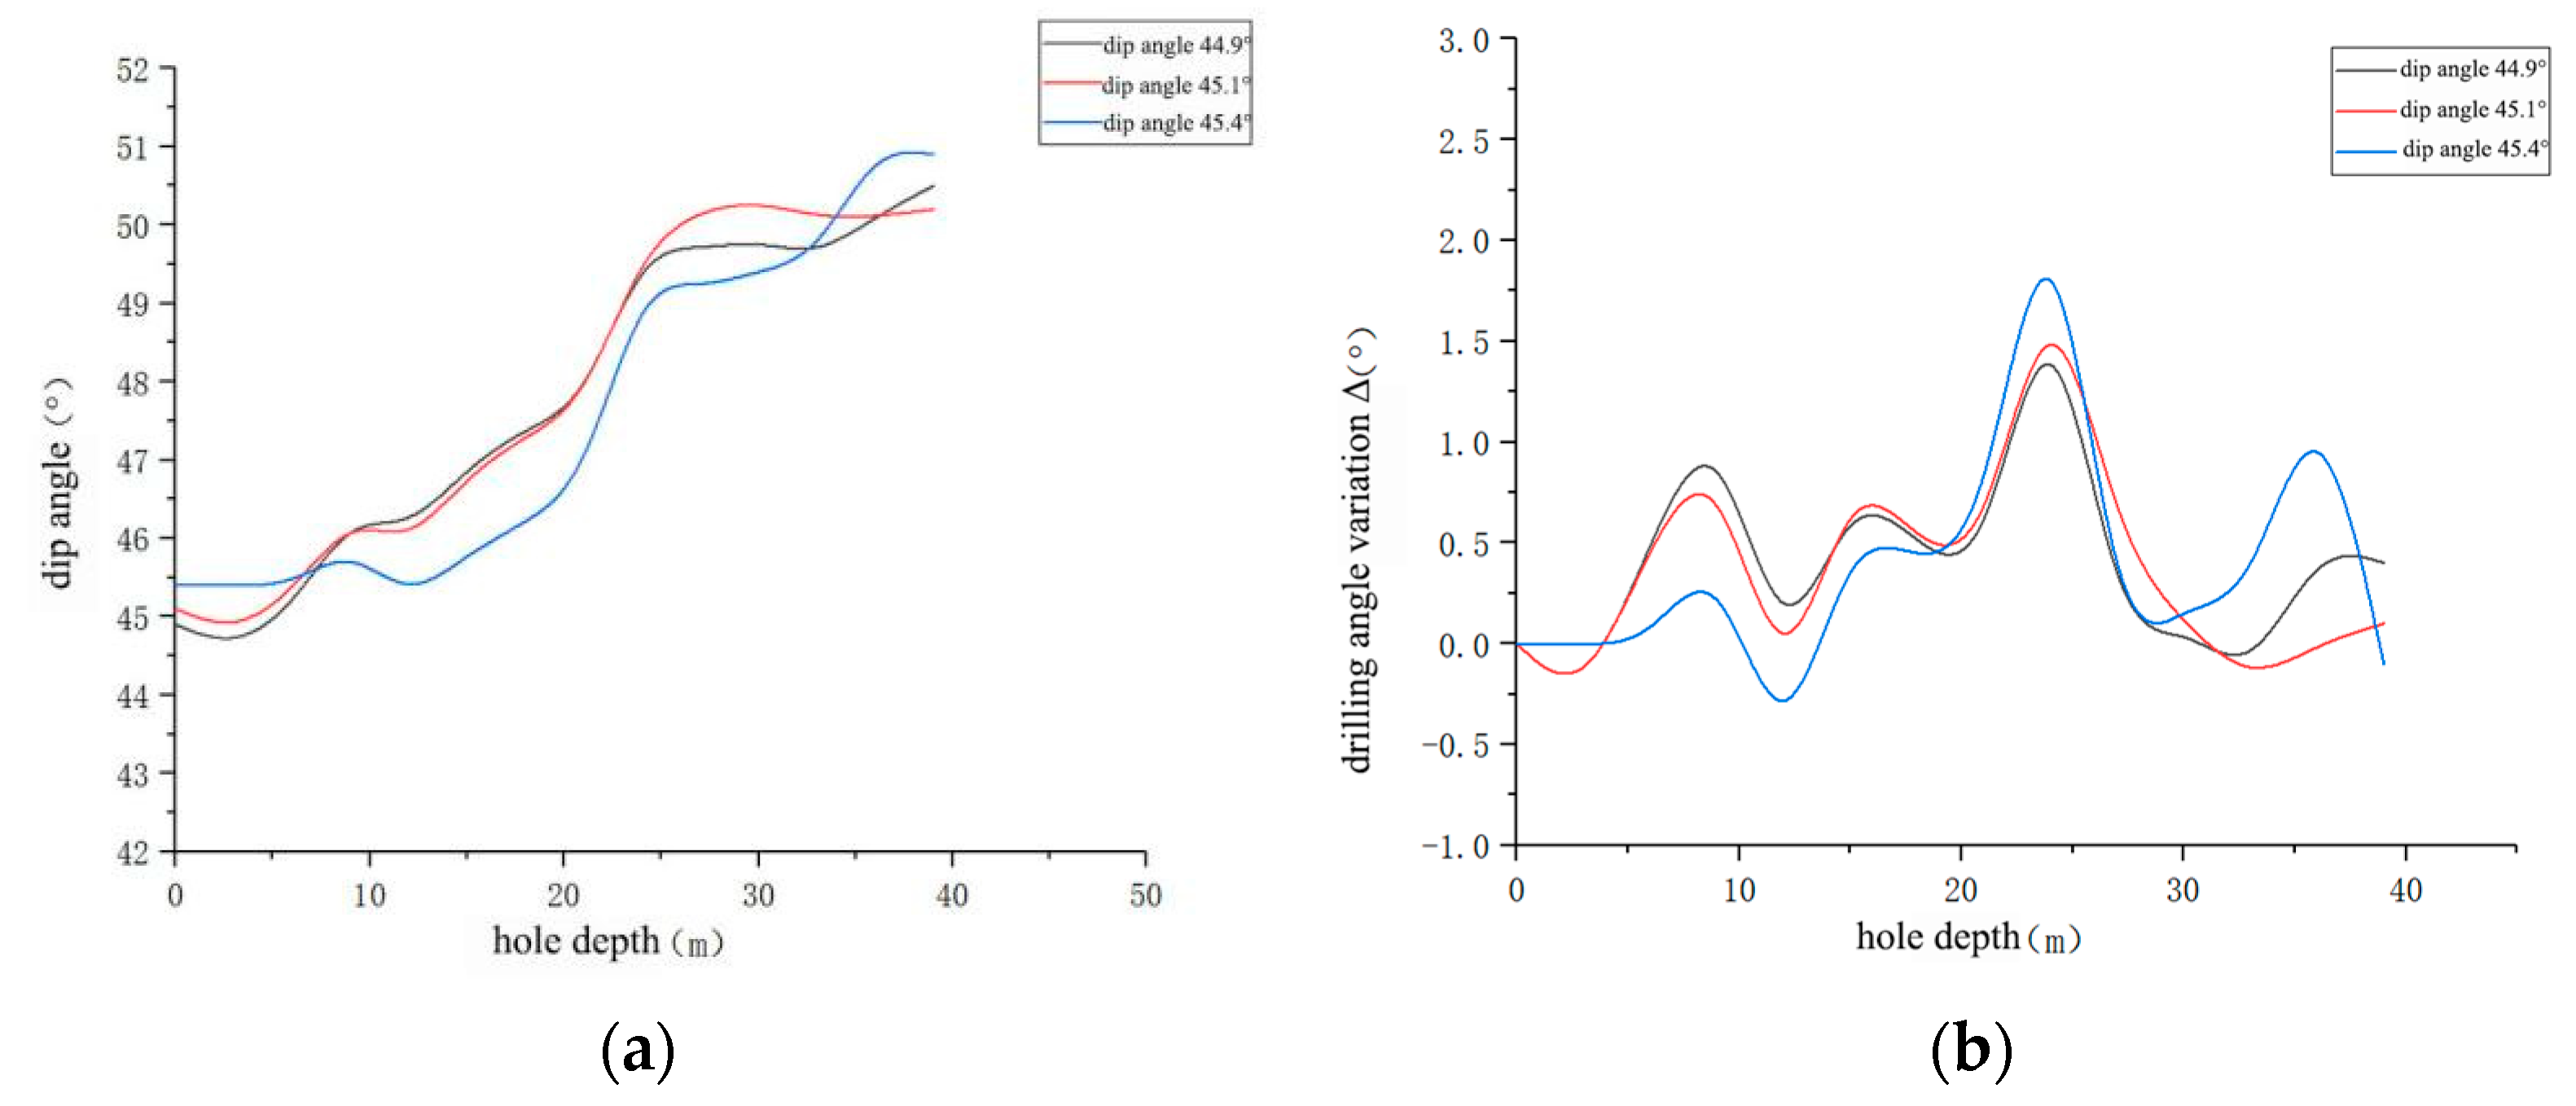
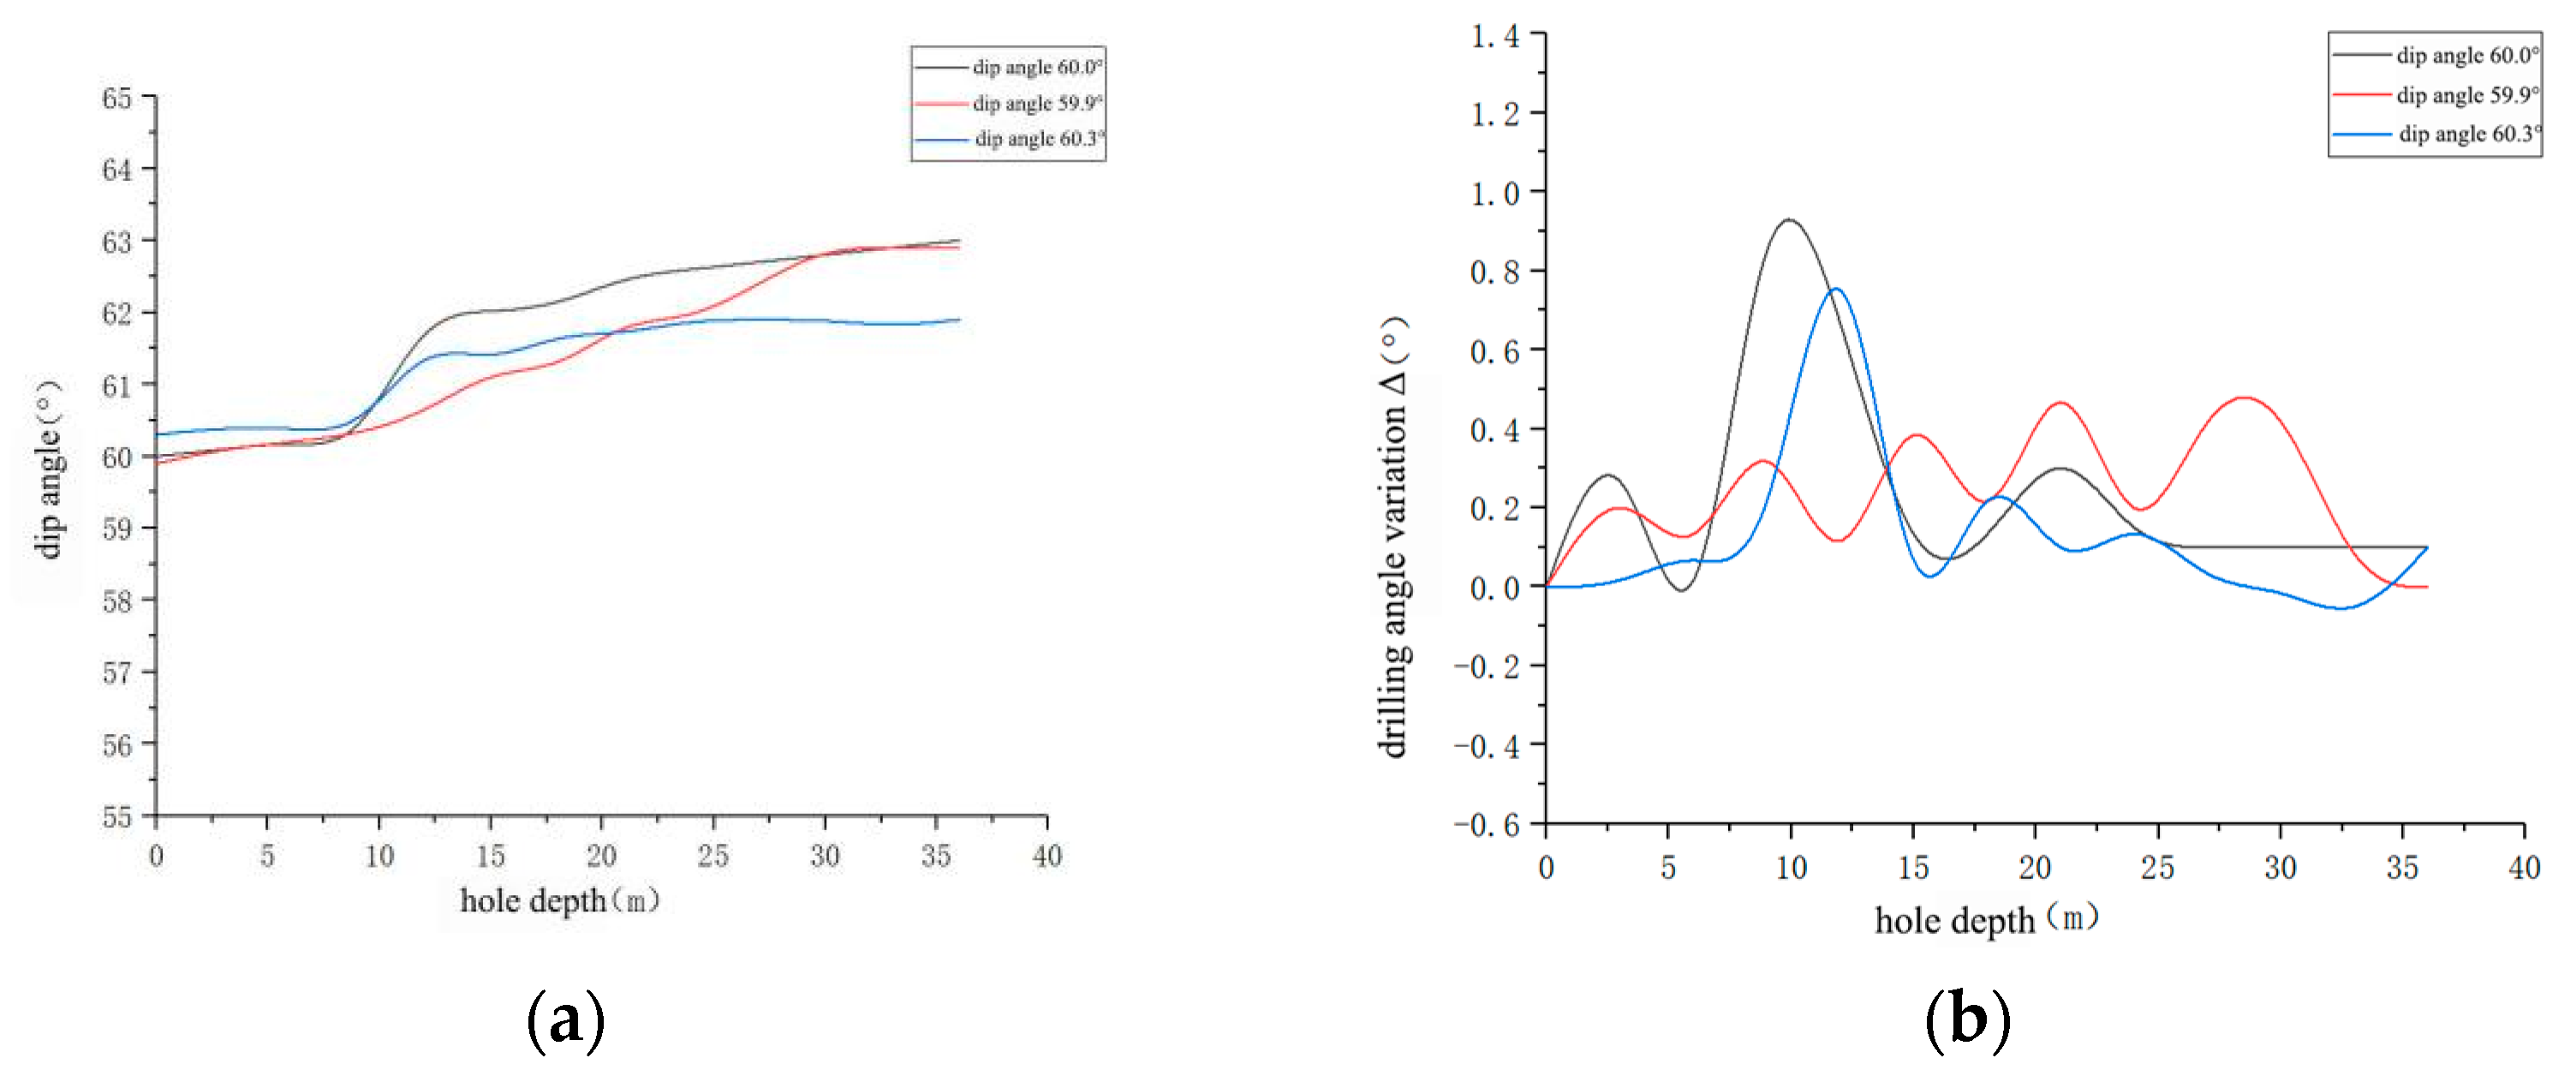
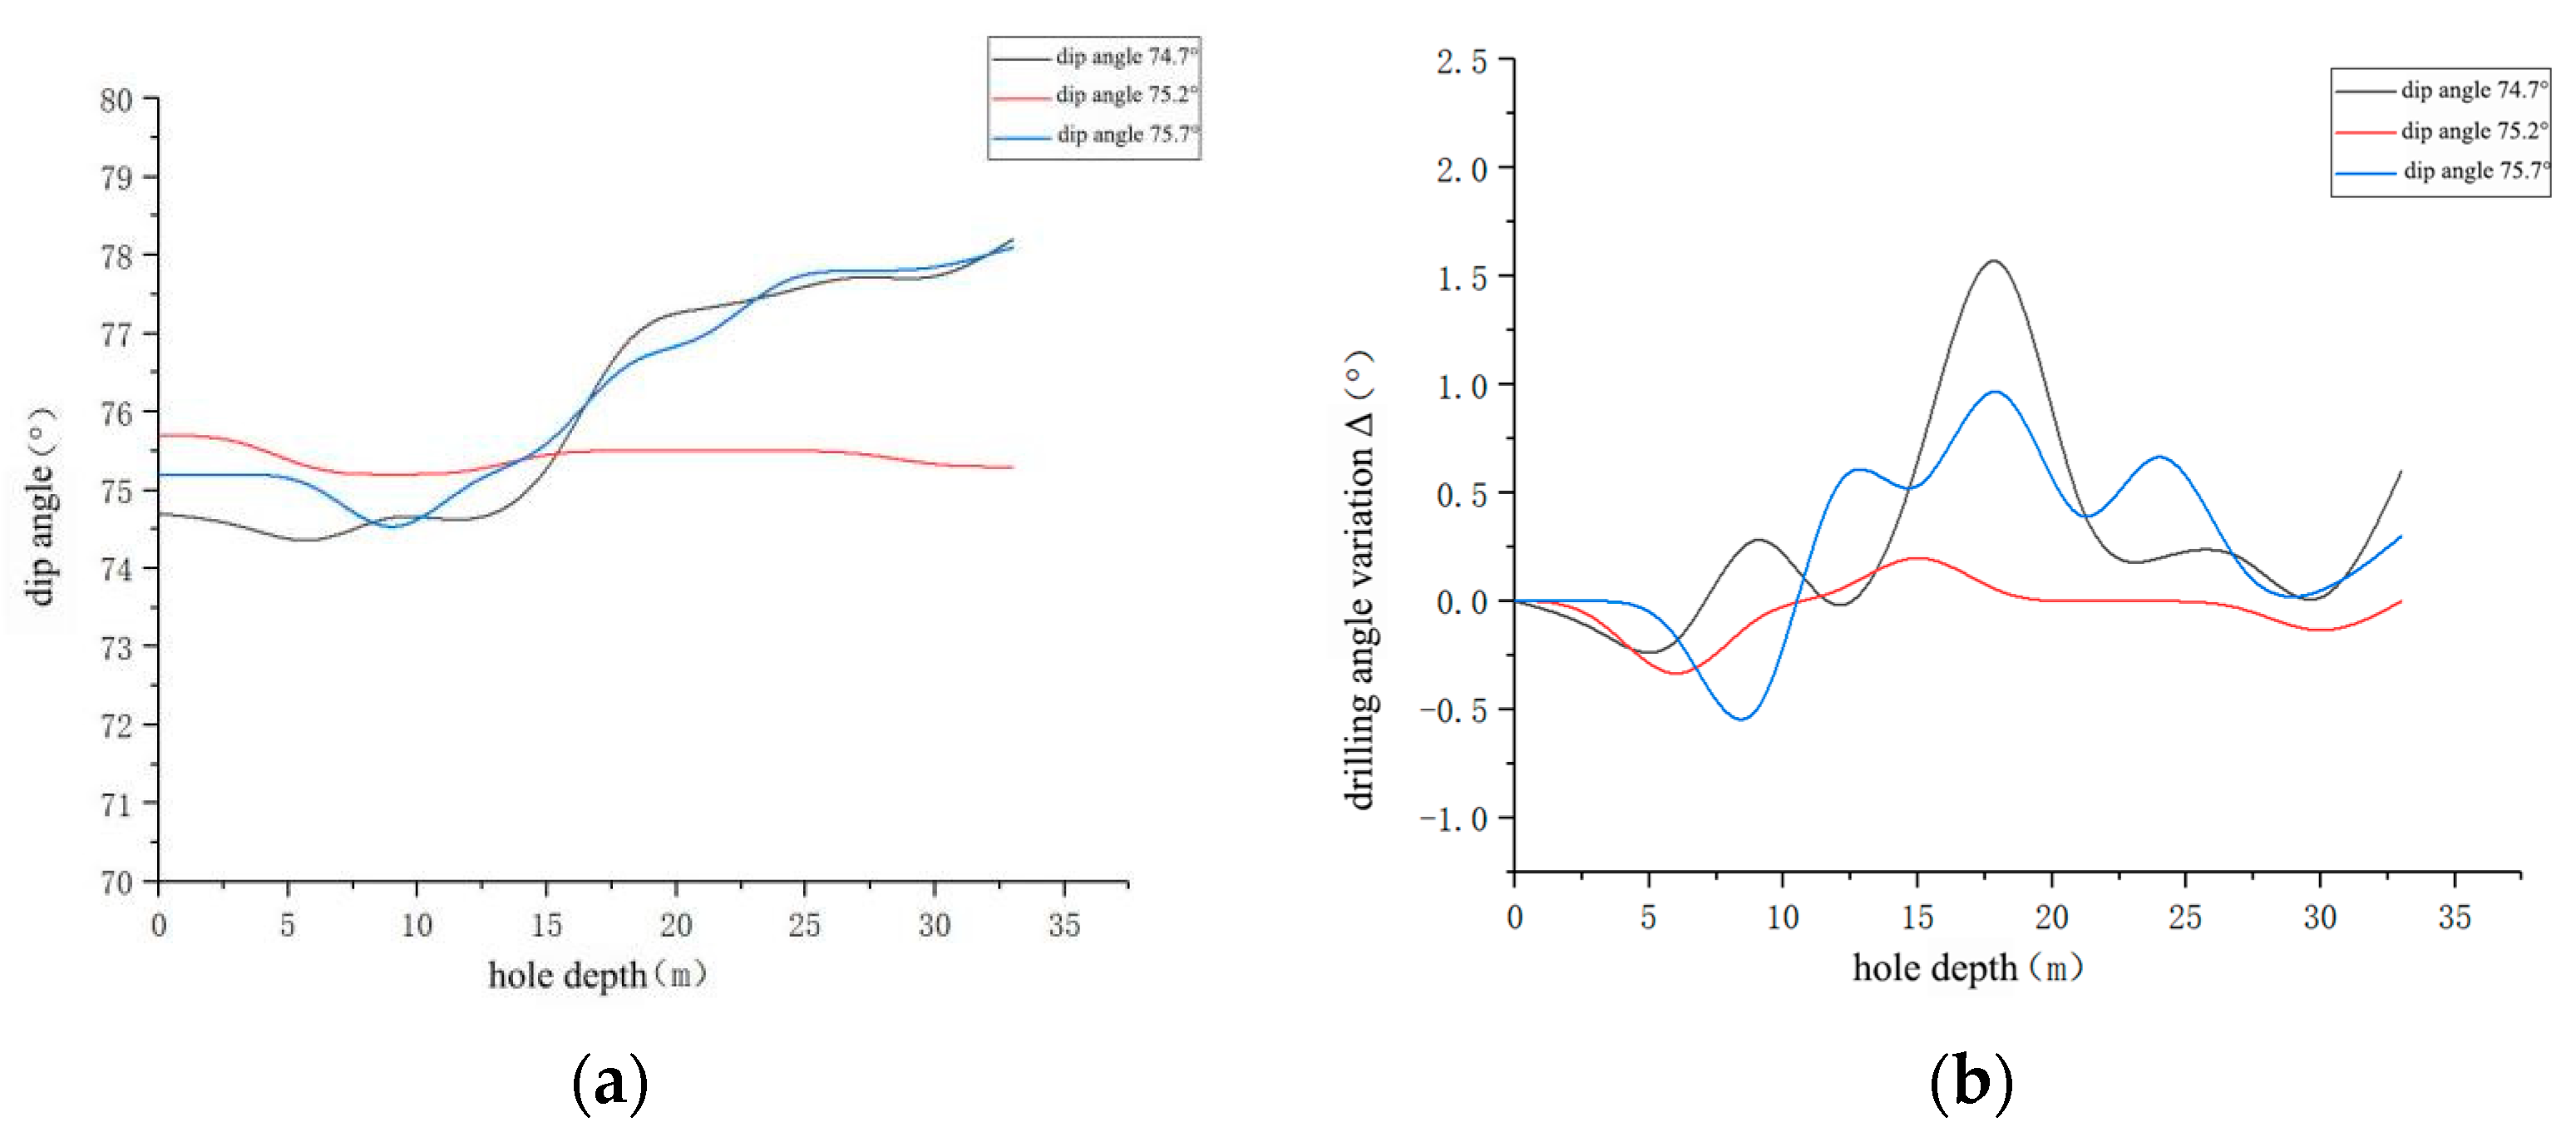
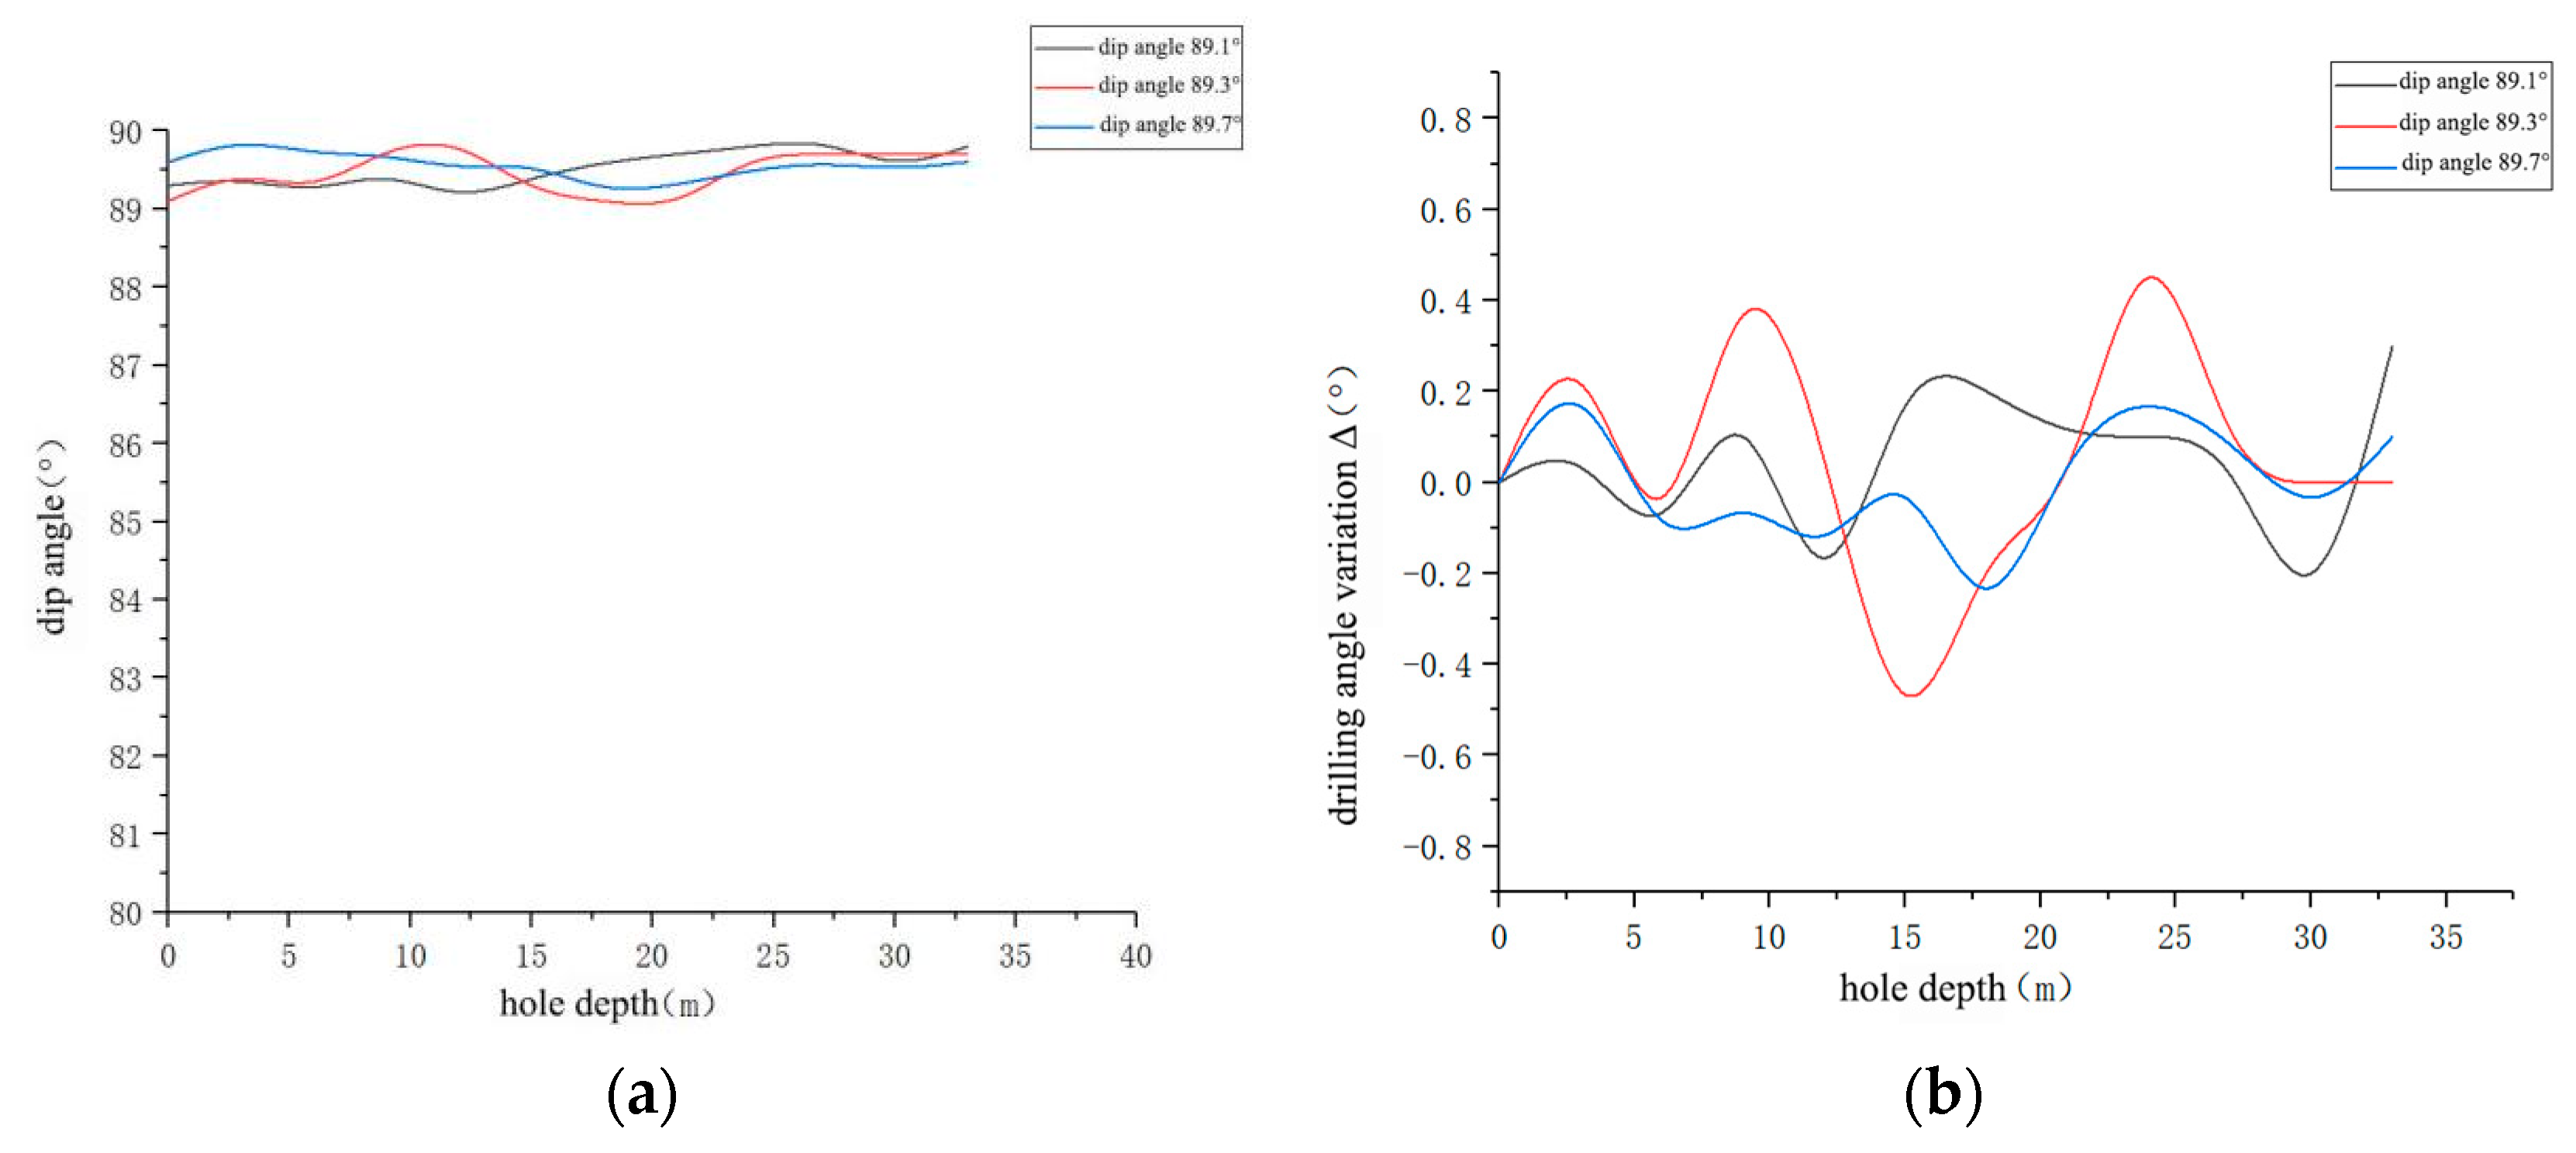
This measurement system, with fully specified parameters and strict error control, directly provides reliable original data for analyzing the variation law of borehole deflection angle. According to the field-collected data, three sets of measurements were obtained for each target gas drainage borehole inclination (15°, 30°, 45°, 60°, 75°, and 90°), and the absolute error between each construction angle and the design angle was controlled within 1°, as shown in Figure 4, Figure 5, Figure 6, Figure 7, Figure 8 and Figure 9.
The core characteristics of borehole deflection at different initial inclinations, extracted from the on-site measurement data, are summarized in Table 1.
Based on Figure 4, Figure 5, Figure 6, Figure 7, Figure 8 and Figure 9 and Table 1, the inclination variation in gas drainage boreholes with initial inclinations ranging from 14.9° to 89.7° exhibits both stage-specific patterns and overall consistencies: For boreholes with lower initial inclinations (14.9–15.7°, Figure 4), the inclination generally follows five stages—decreasing (0–13/15/17 m), increasing (13–28/15–27/17–27 m, ~1° variation), fluctuating or decreasing (25–55/27–37/28–40 m, ≤1°), sharp increase/decrease (55–65/65–75 m, ~2–2.5°), and gentle change (65–95/75–95 m, ≤0.5°). For those with moderate initial inclinations (29.6–30.6°, Figure 5; 44.9–45.9°, Figure 6), five stages are also observed, typically involving initial decrease (0–4/6/7/8 m), increase (4–17 m, ~0.4–1.5°), subsequent decrease or fluctuation (16–25/9–20 m, ≤1.5°), sharp increase (20–25/35–45 m, ~1.5–2.5°), and gentle variation (25–66/25–39 m, ≤0.5°). For boreholes with higher initial inclinations (59.9–60.3°, Figure 7), the variation simplifies to three stages: slight initial increase (0–9 m), sharp increase (9–13/28 m, ≤2°), and gentle change (13–36/28–36 m, ≤0.5°); those with 74.7–75.2° (Figure 8) show 2–4 stages, including initial decrease (0–5/7 m), fluctuation or sharp decrease (5–12/9 m), increase (12–18 m, ~2°), and gentle variation (17–33 m, ≤0.5°). Boreholes with very high initial inclinations (89.1–89.7°, Figure 9) maintain overall gentle variation (≤1°), with no obvious increasing/decreasing trend and small fluctuations (wavelength long, amplitude small). Overall, the maximum deflection of all boreholes is approximately 2° (some upward, some downward, average deviation ~0°, most significant at 60–70 m), and the variation range is generally ≤2° for lower-to-moderate inclinations and ≤1° for high inclinations, with common gentle variation (≤0.5°) in the deep section (e.g., 65–95/17–36 m).

3.2. The Trajectory Equation of the Change in Borehole Inclination

According to the actual data collected on site, the data was processed by mathematical methods, and the average value of the Δ value of the inclination angle of the gas drainage boreholes was within the range of 10–20°, 20–30°, 30–40°, 40–50°, 50–60°, 60–70°, 70–80°, 80–90°, and the mean value of the inclination angle of the borehole. And taking the average of the borehole inclination as the x-coordinate axis and the average of the Δ value of the deflection angle as the y-coordinate axis, a graph of the change between the Δ value of the inclination angle and the borehole inclination was drawn. Fitting was performed on these coordinate points, and the function formula of the change Δ value of the deflection angle and the inclination angle of the borehole was obtained as y = −0.00415x2 + 0.4379x − 6.7519. The correlation coefficient was 0.93; it can be considered that the correlation is good, and the skew amount can be predicted and corrected with this formula, as shown in Table 2 and Figure 10.
It can be seen from Figure 10 that the change Δ value of the borehole inclination varies with the borehole inclination, and the whole presents a quadratic function. When the borehole inclination is 15° and 90°, the change in the Δ value of the borehole inclination is close to 0°, that is to say, the deviation of the gas drainage hole is the smallest. When the drilling inclination is 30° and 75°, the change in the Δ value of the drilling inclination is close to 2.5°, that is, the deviation of the gas drainage hole. When the borehole inclination angle is 45° and 60°, the change in the Δ value of the borehole inclination is close to 4.5°, and when the borehole inclination is 50°, the change in the Δ value of the borehole inclination is close to 5°, that is, this sub-gas drainage borehole has the largest deflection. Combined with the actual engineering needs of the 14205 working face (the research site) for effective gas drainage, to ensure that the borehole can accurately reach the target gas-rich area and avoid forming drainage blind spots, the on-site actual limiting value of borehole deviation is set to ≤8°. The maximum borehole deviation Δ value (≈5°) obtained from Figure 10 is within this actual limiting range, indicating that the borehole deviation in this study meets the on-site practical requirements for stable and efficient gas drainage.

4. Analysis of Influencing Factors of Drilling Trajectory Deflection

Building on the existing research findings, the factors contributing to the deviation in gas control boreholes were analyzed, and the primary influencing factors of borehole trajectory deviation were preliminarily identified from three aspects: geological factors, technical factors, and human factors [22]. The Analytic Hierarchy Process (AHP) is a fuzzy comprehensive evaluation method used to determine the weight of each influencing factor; it is also a systematic, hierarchical analysis approach that integrates qualitative and quantitative analysis. By calculating the weight of each deviation-inducing factor, the key influencing factors can be targeted for control, thereby reducing borehole deviation.

4.1. Classification of Influencing Factors

4.1.1. Geological Factors

In the actual construction of a project site, the deviation in gas drainage boreholes is influenced by on-site geological conditions. Based on gas drainage borehole inclination measurement data and a review of the existing literature, the potential geological influencing factors of gas drainage borehole deviation include rock anisotropy, soft-hard interbedding, and rock stratum dip angle; studying these geological factors is of great significance for controlling the stability of gas drainage boreholes. Among these factors, horizontal stresses—including maximum and minimum horizontal principal stresses—exert a crucial impact on borehole stability in three-soft coal seams. Owing to the low strength and poor integrity of soft coal and its surrounding rock, the difference between the maximum and minimum horizontal principal stresses readily leads to uneven stress concentration around the borehole: when the maximum horizontal principal stress is significantly greater than the minimum one, the borehole wall tends to undergo compressive deformation in the direction of the minimum horizontal principal stress, and may even experience local collapse. This deformation not only directly reduces the borehole’s effective drainage cross-section but also alters the stress state of the drilling tool during drilling, resulting in uneven forces acting on the drill bit and further exacerbating borehole trajectory deviation. Additionally, if the direction of horizontal stresses is inconsistent with the designed orientation of the borehole, the shear effect of horizontal stresses on the borehole wall will be strengthened, further increasing the risk of borehole instability and deviation.

4.1.2. Factors Affecting Equipment

Construction equipment-related factors influencing borehole trajectory permeate the entire construction process and fall under the category of technical factors, which are mainly categorized into three aspects: equipment installation, drilling tool structure, and drilling tool self-weight. Among technical factors, some are significantly affected by human operations and thus can be avoided; others are human-induced subjective factors that can be mitigated through targeted measures.

4.1.3. Human Factors

In the downhole drilling process, human factors exhibit significant subjectivity, with key manifestations including drilling method selection, drilling rig parameters, weight on bit (WOB), and rate of penetration (ROP). These factors are highly dependent on human operations. Specifically, personnel vary in their on-site construction experience, depth of equipment knowledge, and operational proficiency—such differences can easily lead to borehole deviation during the construction process.

4.2. AHP Analysis Model

The parameter setting for the Analytic Hierarchy Process (AHP)—including the division of influencing factor hierarchies, the establishment of the 1–9 scale standard, and the validation of pairwise comparison logic—was jointly completed by two groups of highly experienced professionals with in-depth expertise. This joint effort ensured the rationality of parameters and the credibility of analysis results. Specifically, the first group comprised senior experts from the Guizhou Provincial Coal Mine Design and Research Institute—a national Grade-A qualification unit in coal mine engineering design and safety evaluation. These experts have long engaged in research on coal mine drilling technology and are well-versed in the application norms of AHP in mining engineering; they were responsible for ensuring the scientificity of factor classification and the theoretical rigor of parameter setting. The second group consisted of on-site construction personnel from the 14205 working face, who have accumulated over 8 years of practical experience in gas drainage borehole construction and have been involved in numerous on-site borehole deviation cases. They provided practical insights into the actual impact of factors such as “soft-hard interbedding” and “drilling parameter selection,” ensuring that the set parameters align with on-site engineering realities.

4.2.1. Constructing the AHP Analysis Model

According to the factors that affect the deflection of the borehole, it can be divided into three secondary targets: geological factors (U1), technical factors (U2), and human factors (U3). The secondary target is further divided into 10 influencing factors, including anisotropy (U11), soft and hard interlayer (U12), bedding angle (U13), equipment installation (U21), drilling tool structure (U22), drilling tool weight (U23), drilling method (U31), drilling parameters (U32), WOB selection (U33), and ROP selection (U34). These 10 impact factors were used as tertiary goals, and then a structural analysis model was established.

4.2.2. AHP Analysis Model Calculation Weight

According to the above-established AHP structural analysis model, the 1–9 scale method and the practical experience were used to construct the judgment matrix of the second-level target and the third-level target. Through the calculation, the weight values of the factors affecting the drilling deflection can be obtained (Table 3, Table 4, Table 5 and Table 6).
(1)
Determine the judgment matrix of each level
On the basis of each criterion layer, we established a pairwise comparison result table of its included elements. From the above judgment matrix tables (Table 1, Table 2, Table 3 and Table 4), the judgment matrix of each layer to the previous layer is obtained, as follows:
(a)
The judgment matrix AZ of the criterion layer to the target layer Z:
A Z = 1 2 5 1 / 2 1 2 1 / 5 1 / 2 1
(b)
The judgment matrix AU1 of the index layer to the criterion layer U1:
A U 1 = 1 1 / 6 1 / 2 6 1 3 2 1 / 3 1
(c)
The judgment matrix AU2 of the index layer to the criterion layer U2:
A U 2 = 1 1 / 2 1 2 1 1 1 1 1
(d)
The judgment matrix AU3 of the index layer to the criterion layer U3
A U 3 = 1 1 1 / 2 1 / 2 1 1 1 / 2 1 / 2 1 2 1 1 2 2 1 1
(2)
Calculate the importance ranking
P W = λ max W
According to the judgment matrix, the eigenvector corresponding to the maximum eigenroot λmax is obtained by the formula. In the formula, P is the judgment matrix, and the required eigenvector W is normalized to form the importance order of each evaluation factor, that is, the weight distribution. This is carried out by calculating the product M of the elements of each row of the judgment matrix P, and then calculating the third power W of Mi. Finally, the vector W = (W1, W2, W3) is normalized for positive planning processing, namely: W i = W i / i = 1 2 W i . Obtain the eigenvector W = (W1, W2, W3) = (0.606, 0.265, 0.129) of the judgment matrix AZ.
(3)
Consistency test
Whether the weight distribution obtained above is reasonable still needs to be checked for consistency of the judgment matrix by the following formula:
C R = C I / R I C I = λ max n / ( n 1 )
In the formula, CR is the consistency index value; CI is the random consistency ratio of the judgment matrix; RI is the average consistency index of the judgment matrix; and n is the order of the judgment matrix. For the RI values of the judgment matrices of orders 1–9, see Table 7.
Calculate the maximum eigenvalue of the judgment matrix, and convert it to obtain
λ max = i = 1 3 ( P W ) i n W i = 1 n i = 1 3 ( P W ) i W i
In the formula, (PW)i represents the i-th element of PW, and the order of the judgment matrix is n = 3.
P W = ( P W ) 1 ( P W ) 2 ( P W ) 3
Bring the known data in Table 2 into Equations (4)–(9) to calculate λmax = 3.03. Consistency test is carried out by Formulas (4)–(8): from Table 4, Table 5 and Table 6, it can be known that RI = 0.58, and CR = 0.025 < 0.1. It shows that the judgment matrix has satisfactory consistency, so each component of W = (W1, W2, W3) can be used as its weight coefficient. Similarly, the second-level weight set can be calculated: λmax = 3.01, CR1 = 0.01 < 0.1; λmax = 3.08, CR2 = 0.060 < 0.1; λmax = 4.06, CR3 = 0.02 < 0.1.
(4)
Calculate the composite weight of each layer element for the target layer
The composite weight of each element to the target layer refers to the composite of the relative weights of each factor of each judgment matrix to the target layer (the top layer). The calculation of this weight adopts a top-down approach, layer-by-layer synthesis. The composite skew factor weights and their total ranking are shown in Table 8.
(5)
Total sort consistency ratio
CR = i = 1 3 W i CI i i = 1 3 W i RI i = 0.606 × 0.01 + 0.265 × 0.06 + 0.129 × 0.02 0.606 × 0.58 + 0.265 × 0.58 + 0.129 × 1.12 = 0.026 < 0.1
Then the total ranking result of the hierarchy meets the requirement of consistency, and the soft and hard variation in rock formation is one of the main reasons for the deflection of the borehole.

5. Conclusions

(1)
Through on-site drilling and coring operations, the lithology and fragmentation characteristics of cores from each rock stratum were observed. A large volume of on-site data was collected via on-site monitoring, and trajectory data of gas drainage boreholes with inclination angles of 15°, 30°, 45°, 60°, 75°, and 90° were obtained. Analysis shows that the Δ value of borehole inclination variation changes with the borehole inclination angle, and the overall relationship presents a quadratic function. Specifically, when the borehole inclination angle is 15° or 90°, the Δ value is close to 0°; when the borehole inclination angle is 30° or 75°, the Δ value is close to 2.5°; and when the borehole inclination angle is 45° or 60°, the Δ value is close to 4.5°.
(2)
Through computer-based fitting, a function formula describing the relationship between the Δ value of borehole inclination variation and the borehole inclination angle was derived from the corresponding relationship graph: y = −0.00415x2 + 0.4379x − 6.7519 (where x represents the borehole inclination angle, and y represents the Δ value of inclination variation). Using this formula, it was determined that when the borehole inclination angle is 50°, the Δ value reaches its maximum (close to 5°), meaning the gas drainage borehole has the largest deviation. This formula can be used to predict and control the deviation magnitude, thereby reducing borehole deviation.
(3)
The influencing factors of borehole trajectory deviation primarily include geological factors, equipment factors, and human factors. Among these, geological factors are objective causes of borehole deviation, mainly manifested in variations in rock hardness, rock stratum dip angle, and rock anisotropy of the drilled formation; these factors exhibit low controllability. However, based on the AHP analysis model, it was determined that during cross-stratum drilling, geological factors are one of the primary causes of borehole deviation, and targeted control can still be implemented for key geological influencing factors.

Author Contributions

Conceptualization and supervision, Q.L.; methodology and formal analysis, X.W. and Y.S.; investigation and validation, L.H.; data curation and visualization, C.W. and Y.S.; writing—original draft preparation, Y.S.; writing—review and editing, Q.L. All authors have read and agreed to the published version of the manuscript.

Funding

This research was funded by Guizhou Provincial Science and Technology Plan Project (Qiankehe Support 2025 General 027) and Guizhou Provincial Science and Technology Plan Project (Qiankehe Service Enterprise [2022]010).

Data Availability Statement

The data presented in this study are available upon request from the corresponding author due to legal reasons.

Acknowledgments

The authors thank the editor and anonymous reviewers for their valuable advice.

Conflicts of Interest

Authors Xiaodong Wang, Qingsong Li and Chunhua Wang were employed by the companies Guizhou Mining Safety Science Research Institute Co., Ltd. and Guizhou Research Institute of Coal Mine Design Co., Ltd.; Author Yuqi Shang was employed by the company Guizhou Research Institute of Coal Mine Design Co., Ltd. The remaining authors declare that the research was conducted in the absence of any commercial or financial relationships that could be construed as a potential conflict of interest.

References

  1. Tang, M.; Zheng, P.; Zheng, C.; Hu, Z.; Wang, J.; Dai, G. Numerical Analysis and Prediction of Coal Mine Methane Drainage Based on Gas-Solid Coupling Model. Teh. Vjesn. 2019, 26, 752–761. [Google Scholar] [CrossRef]
  2. Zhang, T.J.; Zhang, L.; Pan, H.Y.; Zhang, C. Stability of Gas Drainage Borehole Analysis on Rock Mechanics Parameters with Roadway of Complex Stress. Appl. Mech. Mater. 2015, 3753, 330–335. [Google Scholar] [CrossRef]
  3. Cleary, P.W.; Pereira, G.G.; Lemiale, V.; Piane, C.D.; Ben Clennell, M. Multiscale model for predicting shear zone structure and permeability in deforming rock. Comput. Part. Mech. 2016, 3, 179–199. [Google Scholar] [CrossRef]
  4. Zhou, C.; Gao, W.; Hu, C.J.; Chen, X.; Cui, S. Numerical study of related factors affecting mechanical properties of fractured rock mass and its sensitivity analysis. Comput. Part. Mech. 2022, 10, 369–386. [Google Scholar] [CrossRef]
  5. Zárate, F.; Cornejo, A.; Oñate, E. A three-dimensional FEM–DEM technique for predicting the evolution of fracture in geomaterials and concrete. Comput. Part. Mech. 2018, 5, 411–420. [Google Scholar] [CrossRef]
  6. Johnny, Q.; Qu, Q.D.; Hua, G. CFD simulations for longwall gas drainage design optimisation. Int. J. Min. Sci. Technol. 2017, 27, 777–782. [Google Scholar] [CrossRef]
  7. Fan, C.; Xu, H.; Wang, G.; Wang, J.; Liu, Z.; Cheng, Q. Determination of roof horizontal long drilling hole layout layer by dynamic porosity evolution law of coal and rock. Powder Technol. 2021, 394, 970–985. [Google Scholar] [CrossRef]
  8. Zhang, C.L.; Xu, J.; Peng, S.J.; Li, Q.; Yan, F. Experimental study of drainage radius considering borehole interaction based on 3D monitoring of gas pressure in coal. Fuel 2019, 239, 955–963. [Google Scholar] [CrossRef]
  9. Park, K.-W.; Choi, C.-S.; Park, B.-H.; Ji, S.-H. Numerical and experimental investigation of the hydrogeological evolution around a borehole due to stress redistribution in fractured rock. Tunn. Undergr. Space Technol. 2022, 124, 104461. [Google Scholar] [CrossRef]
  10. Zheng, Y.H.; Zhao, Z.G.; Wu, W.B.; Zhang, K.; Sun, X. Numerical simulation study on measuring coal stress by drilling parameters. Arab. J. Geosci. 2021, 14, 2110. [Google Scholar] [CrossRef]
  11. Zhao, H.B.; Li, J.Y.; Liu, Y.H.; Wang, Y.; Wang, T.; Cheng, H. Experimental and measured research on three-dimensional deformation law of gas drainage borehole in coal seam. Int. J. Min. Sci. Technol. 2020, 30, 397–403. [Google Scholar] [CrossRef]
  12. Wang, H.; Wang, E.Y.; Li, Z.G.; Shen, R.; Liu, X. Study and application of a new gas pressure inversion model in coal seam while drilling based on directional drilling technology. Fuel 2021, 306, 121679. [Google Scholar] [CrossRef]
  13. Chen, X.; Cao, W.H.; Gan, C.; Wu, M. A hybrid partial least squares regression-based real time pore pressure estimation method for complex geological drilling process. J. Pet. Sci. Eng. 2022, 210, 109771. [Google Scholar] [CrossRef]
  14. Duan, H.J.; Wang, Y.; Xiao, Q.; Wang, J.; Peng, D. Gas extraction technology and application of near horizontal high directional drilling. Energy Rep. 2022, 8 (Suppl. S4), 1326–1333. [Google Scholar] [CrossRef]
  15. Shang, Y.Q.; Wu, G.Y.; Liu, Q.Z.; Kong, D.; Li, Q. The Drainage Horizon Determination of High Directional Long Borehole and Gas Control Effect Analysis. Adv. Civ. Eng. 2021, 11, 3370170. [Google Scholar] [CrossRef]
  16. Shang, Y.; Zhang, L.; Kong, D.; Wang, Y.; Cheng, Z. Overlying strata failure mechanism and gas migration law in close distance outburst coal seams: A case study. Eng. Fail. Anal. 2023, 148, 107214. [Google Scholar] [CrossRef]
  17. Shang, Y.; Wang, Y.; Zhang, L.; Wu, G.; Kong, D.; Zhang, P.; Jia, T. Impact of Lower Protective Coal Seam Mining on Overlying Strata: Deformation, Pressure Relief, and Permeability Enhancement. Int. J. Geomech. 2024, 24, 04024178. [Google Scholar] [CrossRef]
  18. Hong, L.; Wei, W.; Liu, Y.W.; Ma, J.; Gao, H. An integrated drilling, protection and sealing technology for improving the gas drainage effect in soft coal seams. Energy Rep. 2020, 6, 2030–2043. [Google Scholar] [CrossRef]
  19. Zhang, Q.; Liu, Q.Z.; Lou, Y.H.; Kong, D. Deviation Principles of Gas Drainage Drilling in Three-Soft Outburst Coal Seams. Geotech. Geol. Eng. 2022, 40, 3147–3168. [Google Scholar] [CrossRef]
  20. Xie, L.Q.; Jin, P.; Su, T.C.; Li, X.; Liang, Z. Numerical simulation of uniaxial compression tests on layered rock specimens using the discrete element method. Comput. Part. Mech. 2020, 7, 753–762. [Google Scholar] [CrossRef]
  21. Yang, T.; Zhang, J. Gob-Side Entry Retaining Technology with Advanced Empty Hole Butterfly-Shaped Weakening in Three-Soft Coal Seam in China. Adv. Mater. Sci. Eng. 2020, 2020, 2476789. [Google Scholar] [CrossRef]
  22. Sun, X.Y.; Cheng, Z.H.; Chen, L.; Li, Z.; Wang, H.; Yin, S. Deflection Laws of Gas Drainage Boreholes in Interbedded Soft and Hard Seams: A Case Study at Xinzheng Coal Mine, China. Adv. Civ. Eng. 2021, 2021, 5533879. [Google Scholar] [CrossRef]
Figure 1. Core situation of gas drainage borehole trajectory.
Processes 13 03566 g001
Figure 2. Schematic diagram of 14205 working surface.
Processes 13 03566 g002
Figure 3. Three-dimensional geological map of 14205 working face.
Processes 13 03566 g003
Figure 4. Schematic diagram of the gas drainage borehole inclination angle of 15° and its variation value with hole depth: (a) Schematic diagram of the variation in the inclination angle of the gas drainage hole with the hole depth. (b) Schematic diagram of the variation in the inclination angle of the gas drainage hole with the hole depth.
Processes 13 03566 g004
Figure 5. Schematic diagram of the gas drainage borehole inclination angle of 30° and its variation value with hole depth: (a) Schematic diagram of the variation in the inclination angle of the gas drainage hole with the hole depth. (b) Schematic diagram of the variation in the inclination angle of the gas drainage hole with the hole depth.
Processes 13 03566 g005
Figure 6. Schematic diagram of the gas drainage borehole inclination angle of 45° and its variation value with hole depth: (a) Schematic diagram of the variation in the inclination angle of the gas drainage hole with the hole depth. (b) Schematic diagram of the variation in the inclination angle of the gas drainage hole with the hole depth.
Processes 13 03566 g006
Figure 7. Schematic diagram of the gas drainage borehole inclination angle of 60° and its variation value with hole depth: (a) Schematic diagram of the variation in the inclination angle of the gas drainage hole with the hole depth. (b) Schematic diagram of the variation in the inclination angle of the gas drainage hole with the hole depth.
Processes 13 03566 g007
Figure 8. Schematic diagram of the gas drainage borehole inclination angle of 75° and its variation value with hole depth: (a) Schematic diagram of the variation in the inclination angle of the gas drainage hole with the hole depth. (b) Schematic diagram of the variation in the inclination angle of the gas drainage hole with the hole depth.
Processes 13 03566 g008
Figure 9. Schematic diagram of the gas drainage borehole inclination angle of 90° and its variation value with hole depth: (a) Schematic diagram of the variation in the inclination angle of the gas drainage hole with the hole depth. (b) Schematic diagram of the variation in the inclination angle of the gas drainage hole with the hole depth.
Processes 13 03566 g009
Figure 10. Schematic diagram of the change Δ value of the borehole inclination with the change in the borehole inclination.
Processes 13 03566 g010
Table 1. Core characteristics of borehole deflection at different initial inclinations.
Initial Borehole InclinationNumber of
Variation Stages
Key Depth Intervals and Deflection
Characteristics
Maximum
Deflection Value
Average Deviation
15°50–16 m: inclination decreases (decrease range ≤0.5°); 16–30 m: inclination increases (increase ≈1°); 30–60 m: inclination fluctuates (fluctuation range ≤1°); 60–65 m: inclination changes by ±2°; 65–95 m: inclination stabilizes (change range ≤0.5°)~2°~0°
30°50–7 m: inclination decreases (decrease ≈0.5°); 7–16 m: inclination increases (increase ≈0.5°); 16–25 m: inclination decreases (fluctuation range ≤1°); 25–35 m: inclination gently increases (increase ≈0.5°); 35–45 m: inclination increases (increase ≈1.5°); 45–66 m: inclination stabilizes (change range ≤0.5°)~1.5°~0.5°
45°50–4 m: inclination has no obvious change (change range ≤0.5°); 4–10 m: inclination increases (change range ≤1°); 10–20 m: inclination fluctuates (fluctuation range ≤1.5°); 20–25 m: inclination rises rapidly (increase ≈2.5°); 25–39 m: inclination stabilizes then gradually increases (change range ≤1°)~2.5°~1°
60°30–9 m: inclination has no obvious change (change range ≤0.5°); 9–13 m: inclination rises rapidly (increase ≈2°); 13–36 m: inclination stabilizes (change range ≤0.5°)~2°~0.8°
75°2–40–5 m: inclination decreases (change range ≤0.5°); 5–12 m: inclination fluctuates (fluctuation range ≤1°); 12–17 m: inclination increases (increase ≈2°); 17–33 m: inclination stabilizes (change range ≤0.5°)~2°~0.6°
90°10–40 m: inclination has no obvious increase/decrease trend; 5–25 m: inclination shows slight fluctuation (fluctuation range ≤1°); overall inclination variation ≤1°≤1°~0.1°
Table 2. Average value of borehole inclination angle and average value of Δ value in each angle interval.
Inclination IntervalAverage Borehole InclinationAverage Borehole Inclination Angle Change Value (Δ)
10~20°15.253−0.813
20~30°25.2160.989
30~40°33.2563.309
40~50°49.0925.798
50~60°56.1774.775
60~70°66.0793.095
70~80°75.1762.698
80~90°88.230−0.172
Table 3. Judgment matrix Z.
Drilling Deflection ZU1U2U3Weights
U11250.606
U21/2120.265
U31/51/210.129
Table 4. Judgment matrix U1.
Geological Factors U1U11U12U13Weights
U1111/61/20.11
U126130.67
U1321/310.22
Table 5. Judgment matrix U2.
Technical Factors U2U21U22U23Weights
U2111/210.25
U222110.5
U231110.25
Table 6. Judgment matrix U3.
Human Factors U3U31U32U33U34Weights
U31111/21/20.2
U32111/21/20.2
U3312120.2
U34221/210.4
Table 7. The RI value of the average random consistency index.
n R I
1 0
2 0
3 0.58
4 0.90
5 1.12
6 1.24
7 1.32
8 1.41
9 1.45
Table 8. Overall ranking of skew factor index composite weights.
Impact FactorTotal SortWi
Soft and hard interlayer10.406
bedding angle20.133
Drilling tool structure30.133
Anisotropy40.067
Device installation50.066
Drilling tool weight60.066
ROP selection70.052
Drilling method80.026
Drilling parameters90.026
WOB selection100.025
Disclaimer/Publisher’s Note: The statements, opinions and data contained in all publications are solely those of the individual author(s) and contributor(s) and not of MDPI and/or the editor(s). MDPI and/or the editor(s) disclaim responsibility for any injury to people or property resulting from any ideas, methods, instructions or products referred to in the content.