Abstract
Polyphenols have gained significant attention in recent decades due to their protective role against cancer, diabetes, obesity, osteoporosis, neurodegenerative, and cardiovascular diseases. This study explored the influence of radiation time, microwave power, and sample-to-solvent ratio on the microwave-assisted extraction of polyphenols from Pithecellobium dulce fruit peels. Extraction efficiency, antioxidant activity, and anti-cholesterol activity were optimised using both response surface methodology (RSM) and artificial neural networks combined with a genetic algorithm (ANN-GA). The ANN-GA model exhibited higher predictive accuracy (R2 = 0.9805–0.9813) and lower statistical error compared to quadratic RSM models (R2 = 0.9566–0.9767). Under optimised conditions, ANN-GA yielded 244.35 mg/g total polyphenols, 92.51% antioxidant activity, and 73.96% anti-cholesterol activity, outperforming RSM (242.35 mg/g, 92.18%, and 73.26%, respectively). These findings demonstrate the scientific novelty of ANN-GA as a more robust and reliable tool than RSM for process optimisation. Moreover, the study highlights the practical application of utilizing P. dulce fruit peels as a low-cost, natural source of health-promoting bioactives. Importantly, this work presents a broader impact by providing a sustainable strategy for waste valorisation into nutraceutical and pharmaceutical products.
1. Introduction
Pithecellobium dulce (commonly known as Manila tamarind) is an underutilised tropical fruit widely grown in Asia, Africa, and Latin America While the edible arils are consumed fresh or processed, the fruit peels are generally discarded despite being reported to contain significant levels of polyphenols, flavonoids, tannins, saponins, and sterols with documented antioxidant, anti-cholesterol, anti-inflammatory, and antimicrobial properties. A nutraceutical profile of P. dulce fruit peels is presented in Table 1 to illustrate their bioactive potential. Despite this, limited scientific attention has been given to systematically exploring the extraction and optimisation of polyphenols from P. dulce peels [1]. Different plant parts are utilised for various purposes. For example, leaves have been claimed to have abortifacient, antidiabetic, emollient, anticonvulsant, and antiulcer qualities. To treat discomfort and sores on the genitalia, the leaves can be used as plasters. There have been reports of the usage of leaf decoctions for larvicide, leprosy, and ear, tooth, and digestive disorders [2]. The bark is made up of 37% catechol-type tannins and can be used as an astringent in cases of dysentery, as a febrifuge, and as a treatment for dermatitis and eye inflammation. According to reports, the leaves are astringent, emollient, abortifacient, and antidiabetic. The seeds have been found to contain steroids, lipids, saponins, phospholipids, glycolipids, glycosides, and polysaccharides [3].

Table 1.
Nutraceutical profile of Pithecellobium dulce fruit peels (and related fruit parts).
The process of extracting medicinal plants involves separating active plant components or secondary metabolites, such as alkaloids, flavonoids, terpenes, saponins, steroids, and glycosides, from inert or inactive components using a suitable solvent and accepted extraction techniques from the sources as shown in the Figure 1a–f. The choice of a suitable extraction method is crucial, and in certain circumstances, it relies on how the extract will be used [4]. Polyphenolic substances are significant secondary metabolites/phytochemicals found mostly in plant tissues. The possible health benefits of polyphenols, such as prevention of the development of cancer, diabetes, obesity, osteoporosis, neurodegenerative and cardiovascular diseases, etc., have sparked a lot of interest in recent decades. Fruit-processing by-products, such as peels, seeds, and pomace, are rich reservoirs of bioactive compounds, yet they are often discarded as waste, leading to both environmental and economic concerns. Valorisation of these by-products into nutraceutical ingredients offers a sustainable strategy to minimise waste while providing high-value compounds for health applications [5]. Antioxidant studies on Pithecellobium dulce leaves’ aqueous extract exhibited phenolics, including flavonoids, which strong free radical scavenging action [6]. In addition to reducing or delaying the start of cell necrosis, flavonoids are known to improve vascularity and lower lipid peroxidation. The potential activity against free radicals of P. dulce’s leaves, seeds, fruits, and wood bark extract has been demonstrated. The entire plant has the ability to actively scavenge synthetic radicals of DPPH, NO, superoxide, and hydroxyl ions [7]. Pithecellobium dulce fruit also exhibit significant antioxidant and glucosidase inhibitory activity. These properties have mostly been linked to the presence of unidentified anthocyanins [8].

Figure 1.
Picture of Pithecellobium dulce—leaves, bark, flower, fruit pods, fruit, and tree.
Conventional extraction procedures require a lot of time, effort, and solvent, such as heat-reflux extraction (HRE), Soxhlet extraction (SE), and cold maceration [9,10]. The most straightforward and affordable method for extracting organic molecules from plant material is microwave-assisted extraction (MAE). Microwave-assisted extraction has many benefits, including quick extraction times and minimal solvent usage while extracting biologically active compounds from various matrices [11]. Microwave-assisted extraction (MAE) has emerged as a rapid, efficient, and green technology for recovering phenolic compounds from plant matrices [12]. Poor heating occurs in non-polar liquids because there is no other method of energy transmission besides dielectric absorption. It is possible to think of MAE as selection processes that favour polar molecules and liquids with high dielectric constants [13].
Chronic lifestyle-related disorders are the main cause of morbidity and mortality worldwide, and ayurveda can treat many of these conditions because of its emphasis on adaptogenic medicines and healthy living habits. Research into drugs that can contribute to the prevention and treatment of diseases of prosperity has escalated due to the significant increase in these illnesses [14]. Numerous studies and findings indicated that adopting a healthy lifestyle, including eating a well-balanced diet and exercising regularly, can effectively ward off the development of many diseases. In the context of nutrition and health, bioactive food is a new field. In meals or dietary supplements originating from both animal and plant sources, including those required to meet basic human nutritional needs, there are physiologically active components known as bioactive food components. These components have been shown to play a role in human health and to be safe for ingestion. The medicinal properties of P. dulce include antiulcer, antifungal, antidiabetic, and antivenom actions, among others [15].
Process optimisation of MAE is commonly achieved using statistical tools such as response surface methodology (RSM), which evaluates the effect of multiple variables on extraction efficiency. However, traditional models like RSM may not fully capture nonlinear and complex interactions among process parameters. Artificial neural networks (ANNs), particularly when combined with optimisation algorithms such as genetic algorithms (GAs), have recently gained prominence for their superior predictive accuracy and ability to handle complex datasets in food and bioprocess engineering.
The present study aims to compare the effectiveness of RSM and ANN–GA in modelling and optimizing the microwave-assisted extraction of polyphenols from P. dulce fruit peels. Extraction efficiency, antioxidant activity, and anti-cholesterol activity were evaluated under varying process conditions to determine the best predictive model. By establishing P. dulce peels as a sustainable source of bioactive compounds and demonstrating the superiority of ANN–GA over conventional modelling approaches, this work not only contributes to the valorisation of fruit-processing waste but also offers a sustainable strategy for developing nutraceutical and pharmaceutical products.
2. Materials and Methods
2.1. Raw Material
Fresh fruit peels of Pithecellobium dulce were obtained from Dindigul District, Tamil Nadu, India. After thorough washing with water to remove impurities, the peels were transported to Bannari Amman Institute of Technology, Sathyamangalam, Tamil Nadu, for subsequent experimental procedures. The cleaned peels were dried under shade in a tray dryer (Optics Technology, Delhi, India) at 60 °C, ground to a fine powder using a mechanical grinder, and sieved to obtain uniform particle size for extraction experiments.
2.2. Sample Preparation
The Pithecellobium dulce peel powder (PDPP) was mixed with a solution (water) at room temperature for 15 min while continuous magnetic stirring was applied (model KEMI KMS-500, Bangalore, India). The subsequent microwave-assisted extraction was carried out employing this concentrated extract.
2.3. Chemicals and Reagents
These analytical-grade substances and reagents were procured from HiMedia Laboratories Pvt. Ltd. Bangalore, India and utilised in the research. All chemicals and reagents used in this study were of analytical grade unless otherwise stated. Ethanol (99.8% purity) and methanol (99.9% purity) were procured from Merck, Bangalore, India. Folin–Ciocalteu reagent, 2,2-diphenyl-1-picrylhydrazyl (DPPH), and other standard chemicals for antioxidant assays were obtained from Sigma-Aldrich (St. Louis, MO, USA) with ≥98% purity. Enzymes and substrates used for anti-cholesterol activity assays were purchased from HiMedia Laboratories (Bangalore, India). Deionised water was used throughout the experiments for the preparation of all solutions and dilution.
2.4. Microwave Assisted Extraction
This study was carried out employing a microwave unit (Morphy Richards 25 CG Mumbai, India) which had a steady radiation frequency that was 2450 MHZ, a power level of 1400 W, and a maximum duration of 30 s. The extractions were carried out using polar solvents; namely, water was chosen as the solvent for extraction [16,17]. It was treated using variable microwave power, treatment time for the extraction, and the volume of sample-to-solvent (w/v) ratios in accordance with the combinations described in the design of experiments. The sample was heated in the microwave and afterwards centrifuged for approximately 15 min at 3900 rpm (model 6–15 H, Sigma, Bangalore, India). After filtering the concentrated extract, the supernatant was transferred into containers that would be used for research investigation of the total polyphenols, antioxidant activity, and anti-cholesterol activity.
2.5. Experimental Design
The current research used the Box–Behnken design (BBD) to figure out various combinations of the independent variables and the overall number of runs. Microwave power (X1), time of treatment (X2), and sample ratio of solvent (X3) were independent factors and total amount of phenolic compounds (TPC), antioxidant activity, and anti-cholesterol activity are dependent parameters. The coded and true values of each of the independent variables, which were chosen primarily as the outcome of the preliminary assessments, are shown in Table 2.
Table 2.
Independent variables’ ranges.
The experiment comprised 17 runs overall, with each one having a distinct central point. The response surface methodology’s statistical model of regression formula (Equation (1)) was applied for assessing the dependent factors to find their optimal and expected values.
2.6. Response Surface Methodology
To achieve the optimum values of the dependent parameters, the response surface model (RSM) was used to create models and optimise each combination of the process variables. A second-order polynomial regression model was used to evaluate the predicted optimised condition for these experimental results.
where Y stands for the projected response variable. Regression coefficients for terms which are linear, interactive, and quadratic are denoted by the characters b0, b1, blm, and bmm. The variables that are independent are xl and xm. For each bioactive analysis, samples that had been microwaved were compared to control samples [18].
The software Design Expert (version 10.0.3.0, Stat-Ease Inc., Minneapolis, MN, USA) was utilised to analyse the method of investigation, regression modelling, and visualisation. ANOVA was performed to evaluate the importance of the coefficients of regression in the formula, statistical evaluation, and confirmation of the constructed regression method, as well as the significance of the impact of the independent variables [19].
2.7. Artificial Neural Network (ANN) Modelling
Modelling and response optimisation were carried out by ANN by utilising the MATLAB neural network (ANN) fitting resources (version R2023a (9.14.0.2267918), The MathWorks, Inc., Natick, MA, USA). The artificial neural network (ANN) utilised in this study has a single input layer and a single hidden layer, along with one output layer, correspondingly. An artificial neural network (ANN) was utilised for determining a nonlinear correlation among the three input parameters (X1, X2, and X3) and the outcome parameters (Y1, Y2, Y3). Three neurons were determined to be present in the data input layer (microwave power [X1], treatment time [X2], and sample solvent ratio [X3]). The greatest R2 and least MSE values were obtained at 10 neurons, which were selected for the layer that was hidden utilising an experimental approach. Although TPC [Y1], antioxidant activity [Y2], and anti-cholesterol activity [Y3] responses were provided independently, there was only one neuron in the output layer.
Before commencing ANN training, both the input and output datasets were formatted into coded dimensional types for simple processing. In addition to the output data, which were assigned codes of 0 or 1, depending on the input, sets of data were separated into these ranges. The three input parameters mentioned above were employed for developing the RCCD approach for the MAE of PDPP. As an outcome, 20 sets of data, containing three neurons as input, were utilised for developing every output neuron, and those data collections were subsequently divided into three groups for validating, preparing, and evaluating every response.
The outcome of the visible layer’s transfer function (Figure 2) was linear (purelin), whereas the hidden layer’s transfer function was a hyperbolic sigmoid formula (tansig). During training, 15% of the total data were utilised for evaluation, an additional 15% for verifying, and the remaining 70% were used to training utilising the Levenberg–Marquardt backpropagation (trainlm) approach. The developed ANN model’s optimum training efficiency was determined through achieving a minimal RMSE and the greatest R2 [20].

Figure 2.
ANN model for microwave-assisted extraction.
2.8. Determination of Total Phenolic Contents
The Folin–Ciocalteu reagent method (FCR) was adopted to quantify the total phenolic content (TPC) of the MAE of PDPP extracts by [21]. To prepare up to 2 mL, distilled water was added to dilute the supernatant, which was assigned a value of 0.1 mL. Following that, FC reagent (0.5 mL) was mixed, and then the mixture was allowed to settle at ambient condition for 5 min. Subsequently, 2 mL of 7.5% Na2CO3 was added to this mixture. After thoroughly mixing this solution, it was placed in the dark at actual room temperature. Thermo 4001/4 UV-Vis Spectrophotometer, Thermo Scientific, Raleigh, NC, USA was employed to examine the wavelength at 760 nm, where the maximum absorbance was attained to determine the total polyphenols by using change in colour. The total phenolic content (TPC) of the extract was estimated as milligrams of gallic acid equivalent (mg GAE) per gram of PDPP utilizing a standard curve constructed at different gallic acid concentrations (25–500 ppm). The data was determined in triplicate and displayed as mean standard deviation.
2.9. Determination of Antioxidant Activity
The antioxidant potential of PDPP extract was measured using the DPPH scavenging method reported in [22,23]. A 0.4 mM DPPH solution was made with the use of methanol. Subsequently, 2 mL of DPPH solution and 2 mL of methanol were added in addition to the supernatant. The mixture was stored at room temperature for approximately 30 min in the dark after being gently mixed with these solutions. Similarly, its absorbance was compared with the control; in addition, its wavelength at 517 nm was measured by using BIO-RAD, Hercules, CA, USA, iMarkmicroplate Reader. For the control, methanol should be employed in place of the tested sample (0.1 mL). A blank was also created utilizing methanol. To calculate the supernatant’s capacity to scavenge DPPH, the following formula was used:
where AC represents the control absorbance, and AS represents the absorbance of the supernatant.
2.10. Determination of Anti-Cholesterol Activity
The cholesterol measurement using the enzymatic endpoint approach and anti-cholesterol test was performed according to the instructions provided by [24]. A 2.5 mg/mL volume of cholesterol was mixed with chloroform. Afterwards, 10 mL of the extract was poured into the microtiter plate, and 10 μL and 2000 μL of cholesterol and Randox reagent were added. As a blank, 20 μL and 2000 μL of distilled water and Randox reagent were employed. An amount of 2000 μL of Randox reagent and 20 μL of cholesterol constituted the negative control; 20 μL of simvastatin and 2000 μL of Randox reagent made up the standard. The UV spectrophotometer was utilised for measuring the absorbance at 500 nm when compared to a blank reagent throughout the incubation period of 0 to 30 min at ambient temperature. The following equation was used to determine the anti-cholesterol efficacy of the extract:
2.11. Statistical Analysis
In order to assess the efficacy of the model, an average absolute deviation (AAD), the mean square error (MSE), mean percentage of error (MPE), the root mean square error (RSME), and coefficient of determination (R2) in both the actual and anticipated results were obtained using Equations (4)–(8).
where n, Xa, Xp, and Xm are the number of experiments, experimental data, predicted data, and mean experimental data. As the best model for representing the response, it had the lowest values of AAD, MSE, MPE, and RSME and the maximum R2. The Duncan homogeneity test was statistically employed using SPSS software 23.0 to evaluate if there was a statistically significant difference between the experimental results from the optimised condition and the findings anticipated. Using the paired samples t-test in SPSS software 23.0, samples were statistically evaluated to determine the significant difference between the control and spray-drying groups. Each experiment was carried out in triplicate, and the results were represented as mean standard deviation [19].
3. Results and Discussion
3.1. Influence of the Various Process Parameters on MAE of Pithecellobium dulce
Due to its antioxidant properties and its antiproliferative, anti-inflammatory, and antibacterial features, P. dulce chemical compounds that exist naturally offer a wide range of substantial therapeutic advantages. The major goal of this study was to determine how microwave radiation affects the total quantity of polyphenols that may be collected from fruit peels using water. A significant number of polyphenols are extracted from the plant material using a significant, cost-effective solvent. Since water has the most noticeable dielectric coefficient among common solvents, it absorbs microwave radiation faster than the system can generate heat, according to [25].
3.2. Model Fitting
The significant results for the breakdown and extraction of phytochemicals were influenced by the microwave power, treatment time, and sample solvent ratio [26]. For this experiment, three alternative values (1, 0, +1) of the microwave power (700, 1050, 1400 watt), treatment time (20, 25, 30 s), and sample solvent ratio (1:20, 1:25, 1:30 w/v) have been determined. The whole set of experimental runs contained seventeen factorial points and five axial points with five replications each. In order to find an adequate match, the technique of multiple regression analysis was used to explore the second-order quadratic mathematical models of the target outcomes as functions of the independent factors in coded format. The inconsequential parameters (p < 0.05) were removed from the framework using a backward exclusion technique in order to create a simpler and more accurate framework [26]. The fitted second-order quadratic formulas were assessed for statistical significance using ANOVA.
The effects of three independent variables (microwave power [X1], treatment time [X2], and sample solvent ratio [X3]) on three dependent variables (total phenolic content [Y1], antioxidant activity [Y2], and anti-cholesterol activity [Y3]) are shown in Table 3 for a microwave-treated PDPP solution. Table 4 displays the second-order polynomial formulas for the AAD, MSE, MPE, RSME, R2, adjusted R2, and anticipated R2 correlation coefficients of the microwave-treated PDPP solution. For each of the two dependent variables, the results of the ANOVA of the built-in model show the intended R2, adjusted R2, and forecast R2. A regression-based model should have an R2 value greater than 0.8, according to [27]. Additionally, a minimal fit issue is present in the majority of the dependent variables. These values show how well the proposed hypothesis matches the data.
Table 3.
The experimental values of different conditions.
Table 4.
The regression coefficients, AAD, MSE. MPE, RSME, R2, adjusted R2, and predicted R2 of the responses.
3.3. Total Polyphenol Yield
3.3.1. Response Surface Methodology
Influence of the Process Variables on Total Polyphenol Yield
The results for the total quantity of phenolic compounds TPC (Y1) obtained under the different MAE settings shown by the BBD matrix are shown in Table 3. TPC (Y1) displayed a positive correlation with all the independent variables such as microwave power (X1) (p < 0.001), treatment time (X2) (p < 0.001), and sample solvent ratio (X3) (p < 0.001). Also, the interactive components (X1X2) (p < 0.01), (X2X3), and (X1X3) (p < 0.001) showed a significantly favourable influence on TPC, whereas the all-quadratic factors in X12 (p < 0.001), X22 (p < 0.05) and X32 (p < 0.001) showed a linearly negative effect on TPC. In addition, the Box–Behnken method was used to derive the quadratic equation, and the results of the experiment revealed the following experimental interaction between the independent variables and various responses (Figure 3):

Figure 3.
Predicted and actual graph for TPC.
The aggregated polyphenol quantity present in MAE-derived extracts is shown in Table 3 based on the BBD matrix and the ideal extraction conditions. Multiple linear regression (MLR) analysis was used to evaluate the model’s coefficients and empirical data in order to determine statistical significance. Table 4 shows that the R2 value of 0.9767 indicates that 97.67% of variations in the total amount of phenolic compounds are due to variations in the MAE’s independent process parameters [28]. Additionally, there was a good agreement between the adjusted R2 value (0.9468) and the expected R2 value from the RSM model (0.7546). When the RSM model’s estimated levels of phenolic compounds and the actual phenolic content values were compared (Figure 4, Figure 5 and Figure 6) an R2 value of 0.9808 was discovered. The higher R2 value of the suggested RSM model for Y1 shows its dependability. A great p-value (0.0707) that showed a non-significant “lack of fit” further demonstrated the quadratic model’s reliability for the created (TPC) Y1 response [29].

Figure 4.
Effect of microwave power and treatment time on TPC.

Figure 5.
Effect of solvent sample ratio and microwave power on TPC.

Figure 6.
Effect of treatment time and solvent sample ratio on TPC (c).
3.4. Antioxidant Activity
Influence of the Process Variables on Antioxidant Activity
Table 4 lists the outcomes that were attained along with the antioxidant activity (%) that was attained under various MAE settings that were specified by the BBD matrix. Pithecellobium dulce peel powder’s antioxidant activity was positively impacted by all linear variables—power (X1) (p < 0.001), time (X2) (p < 0.05), and ratio of sample solvent (X3)—and by combinations of the interactive variables X1X3 and X2X3, but additional combined variables X1X2 and the quadratic variables X12 (p < 0.001), X22 (p < 0.001), and X32 had a linearly negative impact on the antioxidant activity of microwave treatment. Table 4 shows that each model term significantly influenced the results. The investigation’s findings showed that variables like sample size, solvent fraction, and treatment duration considerably improved the material’s ability to fight free radicals when it was being exposed to microwaves. The Box–Behnken method was used to create a quadratic formula, and the experiment findings were then used to generate the empirical relationship between the independent variables and multiple replies in the following coded forms:
R2 evaluation yielded a value for the peel powder of Pithecellobium dulce of 0.9556. According to the adjusted R2 of 0.8984, the coefficient of determination (R2 = 0.9556), adjusted determination coefficient (adj. R2 = 0.8984), and high relationship between the theoretical and experimental results, these findings are acceptable. The outcome demonstrates a remarkable interaction between the actual and predicted values, and the model correctly predicts 95% of the fluctuations in the data as shown in the Figure 7. Antioxidant activity ranged from 98.67 (highest) to 80.61 (lowest) [30]. The results can be understood if one considers that the activity of antioxidants was brought about by molecules other than polyphenols, as suggested in [31]. Figure 8, Figure 9 and Figure 10 shows how the interaction of the antioxidant activity, solvent and time, and sample all had a significant impact.

Figure 7.
Predicted and actual graph for antioxidant activity.

Figure 8.
Effect of microwave power and treatment time on antioxidant activity.

Figure 9.
Effect of sample solvent ratio and microwave power on antioxidant activity.

Figure 10.
Effect of treatment time and sample solvent ratio on antioxidant activity (c).
3.5. Anti-Cholesterol Activity
Influence of the Process Variables on Anti-Cholesterol Activity
Influence of the Process Variables on Anti-Cholesterol Activity
Twenty random trials were carried out on the basis of a single-factor statistical analysis to investigate the influence of three independent factors on the anti-cholesterol activity. The results of the response surface design are shown in Table 4 along with the layout level. In order to determine the quadratic polynomial equation between the anti-cholesterol activity and the independent variables, the results obtained from the BBD experiment were evaluated using multiple regression analysis.
The analysis of variance for the response surface quadratic model was performed, and the results of the analysis are shown in Table 4. An indicator of a model’s effectiveness is the coefficient of determination (R2). The quadratic model can modify the experimental findings in a similar manner when the coefficient of determination was significant. The model’s R2 and Adj-R2 values are 0.9760 and 0.9452, respectively, illustrating that the model demonstrates outstanding correlation with good fit. The power (X1) (p < 0.0001) and S/S ratio (X3) have the most significant influence on the anti-cholesterol activity (%), whereas the period of treatment X2) (p < 0.001) has no significant effect on the anti-cholesterol activity (%). A significant influence on overall anti-cholesterol activity (%) were similarly observed with the interactive variables of X1X2 (p < 0.05), X2X3 (p < 0.05), When consideration of the other interactive variables, power of microwave and S/S ratio (X1X3), and quadratic term of power X12 (p < 0.001) all showed a non-significant (p < 0.001) impact and positive impact of other quadratic terms of time (X22) and S/S ratio (X32) on the percentage of anti-cholesterol activity as shown from the above Figure 11, Figure 12, Figure 13 and Figure 14.
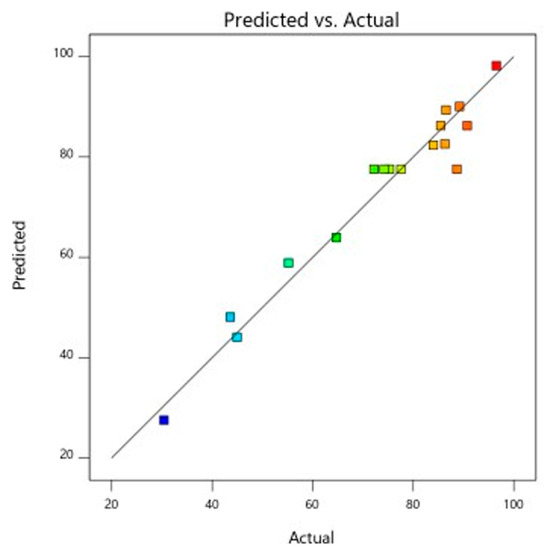
Figure 11.
Predicted and actual graph for anti-cholesterol activity.

Figure 12.
Effect of microwave power and treatment time on anti-cholesterol activity.

Figure 13.
Effect of solvent sample ratio and microwave power on anti-cholesterol activity.

Figure 14.
Effect of treatment time and solvent sample ratio on anti-cholesterol activity (c).
3.6. ANN Modelling
Artificial neural networks are an advanced optimisation and modelling software that possess an immense number of applications because of their outstanding estimation and prediction characteristics. Several research articles that have been published suggest that ANNs are superior to RSMs in both accuracy and predictability capacity [32]. In order to analyse the nonlinear relationship between all three input parameters and their responses, an ANN-based simulation has been developed using a feedforward backpropagation approach and a structure optimisation technique. A neural network was built, utilising BBD design, which consists of three input layers (X1, X2, and X3), a hidden layer, and output layers (Y1, Y2, Y3).
The target responses that included TPC, % of DPPH inhibition, and anti-cholesterol activity displayed the greatest validating effectiveness. The Levenberg–Marquardt technique was utilised to develop the network for validation purposes. Plenty of feedforward artificial neural networks with various configurations were constructed and then assessed through quantifying the number of neurons present in the hidden layer of the network in order to identify an optimum ANN structure with a lowest RMSE and greatest R2 values as an indication of reliability and precision.
As shown in Figure 15, the constructed ANN model measured total phenolic content, antioxidant capacity and anti-cholesterol activity at epoch 7, epoch 4, and epoch 3, respectively. According to TPC validation, training was carried out on trails 1, 2, 3, 5, 6, 8, 9, 10, 11, 14, 15, 16, and 17, and 13 validation runs were additionally tested. Testing runs 4, 7, and 12 were also performed. The neural network operated at its greatest efficiency in the second epoch, with a mean square error (MSE) for the validation result of 0.36. A performance graph for the designed model is displayed in Figure 15 [21].
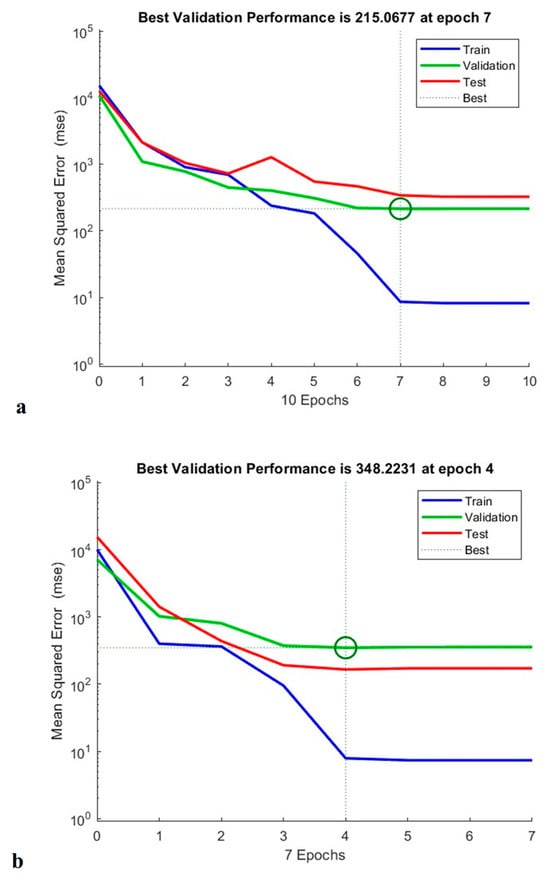
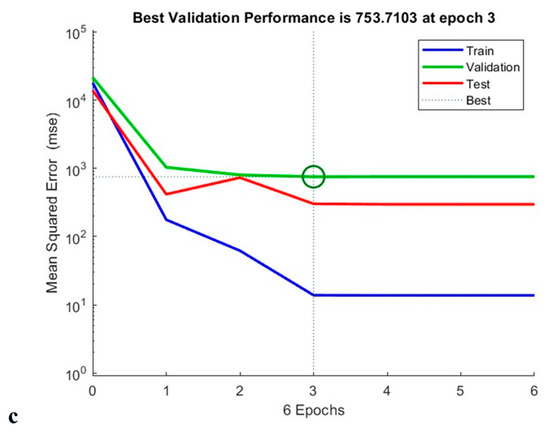
Figure 15.
Training performance of TPC (a), antioxidant activity (b), and anti-cholesterol activity (c) of generated artificial neural network model.
Similarly, when performing the modelling of the antioxidant activity, experimental runs 1, 2, 3, 4, 6, 8, 9, 10, 11, 13, 14, 17, 19, and 20 were utilised for training; 12, 15, and 16 for validation; and 5, 17, and 18 for testing. From the circle shown in Figure 15, shows that the Machine learning model is well trained for the provided data which supports for the best fit for the training model. In addition to this, experimental runs 4, 6, 7, 8, 9, 10, 11, 12, 13, 14, 15, 18, 19, and 20 were utilised for training; 2, 3, and 16 for verification; and 1, 5, and 17 for evaluation of anti-cholesterol activity. The regression coefficient (R2) obtained 0.991, 0.989, and 0.983 for total phenolic content, antioxidant activity, and anti-cholesterol activity; this value indicates that the neural network has an outstanding ability to predict unidentified data [21].
Additionally, an interaction between the experimental outcomes for all response variables, with their estimated values based on the ANN model, is provided in Table 5. The ANN model has greater ability to predict and estimate; this was demonstrated by greater R2 values obtained from the neural network model. In addition, every point was placed nearer to the straight line, demonstrating that the artificial neural network (ANN) model is capable of predicting the experimental results for response variables (Y1, Y2, Y3) with precision and reliability.
Table 5.
List of all statistical variables (RSM and ANN).
3.7. Comparison Between RSM and ANN Models
RSM and ANN models’ estimation capabilities and predictive capacity are examined in this research. The desired outcomes were generated from artificial neural network (ANN) models, and their anticipated outcomes can be observed. The ANN algorithm’s anticipated outcomes for all responses (Y1, Y2, Y3) were mathematically validated through the use of statistical similarity graphs. Regarding reliability, precision, and prediction skills that were required to construct the experimental findings for all desired outcomes, the findings indicate that the artificial neural network (ANN) model’s results were superior to those of the response surface model (RSM) [33]. Compared with the ANN approach, which exhibited steady residuals with minimal fluctuation, the RSM approach possessed a greater variance in the residuals, which indicates variations between expected and actual outcomes [34,35].
The root mean square error (RMSE) and coefficient of determination (R2) were utilised for assessing the results of the RSM and ANN models [36]. ANN design is ultimately more efficient compared to RSM design when it comes to estimation and fitting the observed outputs (Y1, Y2, Y3) with the purpose of enhancing the modelling and evaluation process of MAE. Additionally, it has been observed that when used for obtaining artemisinin from Artemisia annua, the artificial neural network (ANN) model was better than the RSM approach for effective artemisinin recovery [37,38].
3.8. Optimisation of the Extraction Process
A quantitative analysis was conducted using the acceptability approach to determine the level of processing factors that would result in the best polyphenol yield, antioxidant capacity, and anti-cholesterol activity. Additionally, the study was conducted in triplicate in ideal circumstances so that the difference between the expected and actual results could be assessed. It was found that 1316 wattpower of microwave, 28 s of microwave treatment, and 30 g/mL of S/S ratio were the ideal conditions for obtaining maximum yield. The average of the actual values were 242.35 mg/g of TPC, 92.18% of antioxidant activity, and 73.26% of anti-cholesterol activity, and the projected values (242.35 mg/g of TPC, 92.18% of antioxidant activity, and 73.26% of anti-cholesterol activity) were remarkably similar. This confirms the validity and viability of the response model that reflects the expected optimisation. But independent of the test or dissolvable items, the TPC of the microwave-treated PDPP remained unaltered. The conclusions of this investigation affirmed the results of the initial examination detailed by [5]. The observed results fell short of the expected perfect circumstances. Table 4 displays the anticipated values together with the real values. The anticipated results coordinated well with the test results, which were approved by the RSM model.
4. Conclusions
In this study, the MAAE variables were optimised using RSM and ANN modelling methodologies to determine the total amount of phenolics in the powdered peels of Pithecellobium dulce. In both validation and training assessments, the ANN model performed better than the RSM model, displaying higher R2 and lower RMSE values. As a result, despite a limited number of experimentations runs, the artificial neural network (ANN) model demonstrated that it was superior in terms of its ability to determine and forecast. MAAE optimisation of the procedure by ANN and RSM indicated the highest levels of both output variables under optimal conditions (1316 watt power of microwave, 28 s of microwave treatment, and 30 g/mL of S/S ratio): results of 242.35 mg/g of TPC, 92.18% of antioxidant activity, and 73.26% of anti-cholesterol activity.
Since the medical treatment of autoimmune disorders, cardiovascular, and tumour diseases began, plant-based therapeutics have become recognised as one of most important research topics in the past few years. In the current research, a more effective and efficient technique to perform microwave-assisted aqueous extraction of phytochemicals and these substances from Pithecellobium dulce fruit peels is investigated.
Microwave power, time, and sample solvent ratio all were determined to be statistically significant using the method of Pareto analysis, whereas quadratic models for predicting responses were determined. Response surface methodology–BBD was successfully used to maximise the quantity of polyphenol substances obtained from dried fruit peels, which are exceptionally rich in phenolic compounds and possess excellent antioxidant and anti-cholesterol properties. The obtained phenols showed substantial antioxidant and anti-cholesterol properties.
Author Contributions
Conceptualization, Data analysis & curation, Supervision, B.R.; Methodology, investigation, Data curation, Writing the draft, result analysis—V.L.; Analysis, Project methodology, review writing—L.V. All authors have read and agreed to the published version of the manuscript.
Funding
The Project work received no external funding.
Data Availability Statement
The original contributions presented in this study are included in the article. Further inquiries can be directed to the corresponding author.
Acknowledgments
The authors would like to the Department of Biotechnology, Bannari Amman Institute of Technology for providing laboratory support to carry out the research work.
Conflicts of Interest
The authors declare that they have no known competing financial interests or personal relationships that could have appeared to influence the work reported in this paper.
References
- Megala, J.; Geetha, A. Free radical-scavenging and H+, K+-ATPase inhibition activities of Pithecellobium dulce. Food Chem. 2010, 121, 1120–1128. [Google Scholar] [CrossRef]
- Tiwari, U.L.; Adhikari, B.S.; Rawat, G.S.; Chandola, S. Population Status of Commercially Important Medicinal Plants in Dehradun Forest Division, Uttarakhand (India). Not. Sci. Biol. 2013, 5, 175–182. [Google Scholar] [CrossRef]
- Murugesan, S.; Lakshmanan, D.K.; Arumugam, V.; Alexander, R.A. Nutritional and therapeutic benefits of medicinal plant Pithecellobium dulce (Fabaceae): A review. J. Appl. Pharm. Sci. 2019, 9, 130–139. [Google Scholar] [CrossRef]
- Kulkarni, K.V.; Jamakhandi, V.R. Medicinal uses of Pithecellobium dulce and its health benefits. J. Pharmacogn. Phytochem. 2018, 7, 700–704. [Google Scholar]
- Selvakumar, M.; Palanichamy, P.; Arumugam, V.; Venkatesan, M.; Aathmanathan, S.; Krishnamoorthy, H.; Pugazhendhi, A. In silico potential of nutraceutical plant of Pithecellobium dulce against GRP78 target protein for breast cancer. Appl. Nanosci. 2023, 13, 1737–1749. [Google Scholar] [CrossRef]
- Pal, P.B.; Pal, S.; Manna, P.; Sil, P.C. Traditional extract of Pithecellobium dulce fruits protects mice against CCl4 induced renal oxidative impairments and necrotic cell death. Pathophysiology 2012, 19, 101–114. [Google Scholar] [CrossRef]
- Adeniyi, A.; Asase, A.; Ekpe, P.K.; Asitoakor, B.K.; Adu-Gyamfi, A.; Avekor, P.Y. Ethnobotanical study of medicinal plants from Ghana; confirmation of ethnobotanical uses, and review of biological and toxicological studies on medicinal plants used in Apra Hills Sacred Grove. J. Herb. Med. 2018, 14, 76–87. [Google Scholar] [CrossRef]
- Alonso-Castro, A.J.; Domínguez, F.; Maldonado-Miranda, J.J.; Castillo-Pérez, L.J.; Carranza-Álvarez, C.; Solano, E.; Isiordia-Espinoza, M.A.; del Carmen Juárez-Vázquez, M.; Zapata-Morales, J.R.; Argueta-Fuertes, M.A.; et al. Use of medicinal plants by health professionals in Mexico. J. Ethnopharmacol. 2017, 198, 81–86. [Google Scholar] [CrossRef] [PubMed]
- Orio, L.; Alexandru, L.; Cravotto, G.; Mantegna, S.; Barge, A. UAE, MAE, SFE-CO2 and classical methods for the extraction of Mitragynaspeciosa leaves. Ultrason. Sonochem. 2012, 19, 591–595. [Google Scholar] [CrossRef]
- Vinatoru, M.; Mason, T.J.; Calinescu, I. Ultrasonically assisted extraction (UAE) and microwave assisted extraction (MAE) of functional compounds from plant materials. TrAC Trends Anal. Chem. 2017, 97, 159–178. [Google Scholar] [CrossRef]
- Azwanida, N.N. A review on the extraction methods use in medicinal plants, principle, strength and limitation. Med. Aromat. Plants 2015, 4, 2167–2412. [Google Scholar]
- Sun-Waterhouse, D.; Wadhwa, S.S.; Waterhouse, G.I.N. Spray-drying microencapsulation of polyphenol bioactives: A comparative study using different natural fibre polymers as encapsulants. Food Bioprocess Technol. 2013, 6, 2376–2388. [Google Scholar] [CrossRef]
- Chan, C.-H.; Yusoff, R.; Ngoh, G.-C.; Kung, F.W.-L. Microwave-assisted extractions of active ingredients from plants. J. Chromatogr. A 2011, 1218, 6213–6225. [Google Scholar] [CrossRef]
- Murugesan, R.; Orsat, V. Spray drying for the production of nutraceutical ingredients—A review. Food Bioprocess Technol. 2012, 5, 3–14. [Google Scholar] [CrossRef]
- Kumar, M.; Nehra, K.; Duhan, J.S. Phytochemical analysis and antimicrobial efficacy of leaf extracts of Pithecellobium dulce. Asian J. Pharm. Clin. Res. 2013, 6, 70–76. [Google Scholar]
- da Rocha, C.B.; Noreña, C.P.Z. Microwave-assisted extraction and ultrasound-assisted extraction of bioactive compounds from grape pomace. Int. J. Food Eng. 2020, 16, 20190191. [Google Scholar] [CrossRef]
- Panchal, B.; Deshmukh, S.; Sharma, M. Optimization of oil extraction and characterization from Tamarindus indica Linn seed oil. Int. J. Oil Gas. Coal Eng. 2014, 2, 1–6. [Google Scholar] [CrossRef]
- Yolmeh, M.; Jafari, S.M. Applications of response surface methodology in the food industry processes. Food Bioprocess Technol. 2017, 10, 413–433. [Google Scholar] [CrossRef]
- Hunter, W.G.; Hunter, J.S. Statistics for Experimenters; Interscience: New York, NY, USA, 1978; Volume 453. [Google Scholar]
- Jaddu, S.; Abdullah, S.; Dwivedi, M.; Pradhan, R.C. Multipin cold plasma electric discharge on hydration properties of kodo millet flour: Modelling and optimization using response surface methodology and artificial neural network–Genetic algorithm. Food Chem. Mol. Sci. 2022, 5, 100132. [Google Scholar] [CrossRef]
- Patra, A.; Abdullah, S.; Pradhan, R.C. Application of artificial neural network-genetic algorithm and response surface methodology for optimization of ultrasound-assisted extraction of phenolic compounds from cashew apple bagasse. J. Food Process Eng. 2021, 44, e13828. [Google Scholar] [CrossRef]
- Fonteles, T.V.; Leite, A.K.; Silva, A.R.; Carneiro, A.P.; de Castro Miguel, E.; Cavada, B.S.; Fernandes, F.A.; Rodrigues, S. Ultrasound processing to enhance drying of cashew apple bagasse puree: Influence on antioxidant properties and in vitro bioaccessibility of bioactive compounds. Ultrason. Sonochem. 2016, 31, 237–249. [Google Scholar] [CrossRef]
- Hoskin, R.T.; Xiong, J.; Esposito, D.A.; Lila, M.A. Blueberry polyphenol-protein food ingredients: The impact of spray drying on the in vitro antioxidant activity, anti-inflammatory markers, glucose metabolism and fibroblast migration. Food Chem. 2019, 280, 187–194. [Google Scholar] [CrossRef]
- Swantini, D.; Nurenda, D.; Sugita, P. Fractionation and characterization of active compounds from Bangle (ZingibercassumunarRoxb.) as an activator of the enzyme cholesterol oxidase. In Simposium nasional Kimia BahanAlam XV.; Himpunan Kimia BahanAlam: Bogor, India, 2005. [Google Scholar]
- Vernès, L.; Vian, M.; Chemat, F. Ultrasound and microwave as green tools for solid-liquid extraction. In Liquid-Phase Extraction; Elsevier: Amsterdam, The Netherlands, 2020; pp. 355–374. [Google Scholar]
- Patra, A.; Abdullah, S.; Pradhan, R.C. Microwave-assisted extraction of bioactive compounds from cashew apple (Anacardium occidenatale L.) bagasse: Modeling and optimization of the process using response surface methodology. J. Food Meas. Charact. 2021, 15, 4781–4793. [Google Scholar] [CrossRef]
- Fang, Z.; Bhandari, B. Effect of spray drying and storage on the stability of bayberry polyphenols. Food Chem. 2011, 129, 1139–1147. [Google Scholar] [CrossRef] [PubMed]
- Preethi, S.; Saral, A.M. GC-MS analysis of microwave assisted ethanolic extract of Pithecellobium dulce. Malaya J. Biosci. 2014, 1, 242–247. [Google Scholar]
- Mestry, A.P.; Mujumdar, A.S.; Thorat, B.N. Optimization of spray drying of an innovative functional food: Fermented mixed juice of carrot and watermelon. Dry Technol. 2011, 29, 1121–1131. [Google Scholar] [CrossRef]
- Gupta, S.; Cox, S.; Abu-Ghannam, N. Effect of different drying temperatures on the moisture and phytochemical constituents of edible Irish brown seaweed. LWT-Food Sci. Technol. 2011, 44, 1266–1272. [Google Scholar] [CrossRef]
- Mishra, P.; Mishra, S.; Mahanta, C.L. Effect of maltodextrin concentration and inlet temperature during spray drying on physicochemical and antioxidant properties of amla (Emblica officinalis) juice powder. Food Bioprod. Process. 2014, 92, 252–258. [Google Scholar] [CrossRef]
- Alara, O.R.; Mudalip, S.K.A.; Olalere, O.A. Optimization of mangiferinextrated from Phaleriamacrocarpa fruits using response surface methodology. J. Appl. Res. Med. Aromat. Plants 2017, 5, 82–87. [Google Scholar]
- Bezerra, M.A.; Santelli, R.E.; Oliveira, E.P.; Villar, L.S.; Escaleira, L.A. Response surface methodology (RSM) as a tool for optimization in analytical chemistry. Talanta 2008, 76, 965–977. [Google Scholar] [CrossRef] [PubMed]
- Ciric, A.; Krajnc, B.; Heath, D.; Ogrinc, N. Response surface methodology and artificial neural network approach for the optimization of ultrasound-assisted extraction of polyphenols from garlic. Food Chem. Toxicol. 2020, 135, 110976. [Google Scholar] [CrossRef] [PubMed]
- Ameer, K.; Bae, S.-W.; Jo, Y.; Lee, H.-G.; Ameer, A.; Kwon, J.-H. Optimization of microwave-assisted extraction of total extract, stevioside and rebaudioside-A from Stevia rebaudiana (Bertoni) leaves, using response surface methodology (RSM) and artificial neural network (ANN) modelling. Food Chem. 2017, 229, 198–207. [Google Scholar] [CrossRef]
- Yang, Q.-Q.; Gan, R.-Y.; Zhang, D.; Ge, Y.-Y.; Cheng, L.-Z.; Corke, H. Optimization of kidney bean antioxidants using RSM & ANN and characterization of antioxidant profile by UPLC-QTOF-MS. Lebensm. Wiss. Technol. 2019, 114, 108321. [Google Scholar]
- Pilkington, J.L.; Preston, C.; Gomes, R.L. Comparison of response surface methodology (RSM) and artificial neural networks (ANN) towards efficient extraction of artemisinin from Artemisia annua. Ind. Crops Prod. 2014, 58, 15–24. [Google Scholar] [CrossRef]
- Al-Nemari, R.; Bacha, A.B.; Al-Senaidy, A.; Almutairi, M.H.; Arafah, M.; Al-Saran, H.; Abutaha, N.; Semlali, A. Cytotoxic effects of Annona squamosa leaves against breast cancer cells via apoptotic signaling proteins. J. King Saud. Univ. Sci. 2022, 34, 102013. [Google Scholar] [CrossRef]


Disclaimer/Publisher’s Note: The statements, opinions and data contained in all publications are solely those of the individual author(s) and contributor(s) and not of MDPI and/or the editor(s). MDPI and/or the editor(s) disclaim responsibility for any injury to people or property resulting from any ideas, methods, instructions or products referred to in the content. |
© 2025 by the authors. Licensee MDPI, Basel, Switzerland. This article is an open access article distributed under the terms and conditions of the Creative Commons Attribution (CC BY) license (https://creativecommons.org/licenses/by/4.0/).