Article

Robust THRO-Optimized PIDD2-TD Controller for Hybrid Power System Frequency Regulation

by
Mohammed Hamdan Alshehri
,
Ashraf Ibrahim Megahed
,
Ahmed Hossam-Eldin
,
Moustafa Ahmed Ibrahim
* and
Kareem M. AboRas
*
Department of Electrical Power and Machines, Faculty of Engineering, Alexandria University, Alexandria 21544, Egypt
*
Authors to whom correspondence should be addressed.
Processes 2025, 13(11), 3529; https://doi.org/10.3390/pr13113529
Submission received: 28 September 2025 / Revised: 31 October 2025 / Accepted: 31 October 2025 / Published: 3 November 2025
(This article belongs to the Special Issue AI-Based Modelling and Control of Power Systems)

Abstract

The large-scale adoption of renewable energy sources, while environmentally beneficial, introduces significant frequency fluctuations due to the inherent variability of wind and solar output. Electric vehicle (EV) integration with substantial battery storage and bidirectional charging capabilities offers potential mitigation for these fluctuations. This study addresses load frequency regulation in multi-area interconnected power systems incorporating diverse generation resources: renewables (solar/wind), conventional plants (thermal/gas/hydro), and EV units. A hybrid controller combining the proportional–integral–derivative with second derivative (PIDD2) and tilted derivative (TD) structures is proposed, with parameters tuned using an innovative optimization method called the Tianji’s Horse Racing Optimization (THRO) technique. The THRO-optimized PIDD2-TD controller is evaluated under realistic conditions including system nonlinearities (generation rate constraints and governor deadband). Performance is benchmarked against various combination structures discussed in earlier research, such as PID-TID and PIDD2-PD. THRO’s superiority in optimization has also been proven against several recently published optimization approaches, such as the Dhole Optimization Algorithm (DOA) and Water Uptake and Transport in Plants (WUTPs). The simulation results show that the proposed controller delivers markedly better dynamic performance across load disturbances, system uncertainties, operational constraints, and high-renewable-penetration scenarios. The THRO-based PIDD2-TD controller achieves optimal overshoot, undershoot, and settling time metrics, reducing overshoot by 76%, undershoot by 34%, and settling time by 26% relative to other controllers, highlighting its robustness and effectiveness for modern hybrid grids.

1. Introduction

1.1. Background and Motivation

The provision of dependable and cost-effective electricity has played a crucial role in driving technological progress over an extended period of time. The use of power has experienced a notable increase due to the simultaneous growth of people and technology. Historically, traditional finite sources of energy were utilized to operate facilities within the energy industry. However, there is a growing shift in concerns over these sources due to their limited availability, detrimental environmental impacts, and the increasing use of renewable energy sources (RESs) [1]. Placing a heightened focal point on green sources is an utmost importance in order to replace conventional resources with RESs, involving but not limited to wind and solar energy, biomass, and geothermal energies. In addition, there has been significant scholarly, corporate, and governmental attention towards the utilization of energy storage systems to augment green energy-based power systems. Furthermore, there has been significant interest in the joint management of installed electric autos. According to reference [2], these entities possess the capability to make valuable contributions towards the preservation of the resilience and reliability of electricity systems. Furthermore, the efficacy of the power sector’s actions may be enhanced by the use of modern single- and multiple-constraint optimization techniques: for instance stochastic [3] and resilient [4] methods.
Power systems that rely on green energy supplies have many obstacles, including intermittent, reduced inertia, and unexpected loading patterns, which need careful consideration and resolution. The incorporation of green energy-based power grids offers several notable benefits. Nevertheless, the use of RESs may result in power grids that exhibit instability and sluggish responsiveness to disturbances [5]. The key reason leading to the instability of the power grid is the poor inertial response, in contrast to conventional systems reliant on non-renewable resources. Photovoltaic and wind generation cannot maintain significant inertial performance due to their relations with power interface converters [6]. This limitation in their ability to effectively manage power requirements arises from the aforementioned interplay.
According to reference [7], power networks that exhibit low inertial responses are prone to experiencing significant power imbalances and less flexibility in managing harmonic distortion. This phenomenon is particularly observed in power grids that rely on renewable energy sources. This phenomenon arises due to diminished inertial responses, resulting in a decrease in the capacity to transfer energy across the grid. Currently, the incorporation of wind farm electricity in the power system is seeing a gradual increase because of the significant availability of wind resources and the objective of mitigating CO2 emanations [8]. However, due to the inherent unpredictability of wind energy, there is a possibility of inequity between the generation and load demand. Consequently, this might lead to significant concerns related to frequency fluctuation [9]. The aforementioned concern may present itself significantly in the major scenario when the capacity of load frequency control (LFC) becomes insufficient during overnight periods [10].

1.2. Literature Review

There has been a significant increase in the adoption of electric vehicles (EVs) in recent years, mostly determined by environmental considerations such as the desire to decrease reliance on fossil fuels, the availability of more affordable charging options, and the aim to mitigate greenhouse gas emissions [11]. Electric vehicles (EVs) are utilized in a diverse array of applications owing to the inherent traits of vehicle-to-grid (V2G) knowledge. Recently, El-Sayed et al. [12] proposed a particle swarm optimizer (PSO)-based multi-objective optimization framework for optimal placement and sizing of EV charging stations in the IEEE 69-bus system. Their study achieved notable reductions in power loss, voltage deviation, and cost while improving reliability and voltage stability indices, emphasizing the effectiveness of optimization techniques for enhancing grid performance under EV integration. Moreover, other applications of these technologies have been identified, such as the optimization of renewable resources [13] and the provision of supplemental services [14]. Their dynamic battery response characteristics make EVs particularly attractive for frequency control, addressing power imbalances when LFC capabilities are insufficient. However, a critical challenge remains, which is the complexity of controlling networked systems across multiple regions. Integrated renewable energy sources present significant obstacles for load balancing approaches. Moreover, the participation of EVs in frequency regulation will yield supplementary advantages for the whole economy through the utilization of frequency control markets. Consequently, the integration of EVs into frequency regulation matters is poised to be advanced in the near future. However, because of the difficulty of controlling networked systems spanning various regions, the implementation of green energy systems has emerged as a challenging issue for demand load balancing approaches.
A variety of regulators have been suggested in scholarly works for implementation in LFC problems [15,16,17]. The aforementioned categories encompass several approaches in the field of control systems, namely integer and fractional orders, predictive models, artificially intelligent regulators, artificial neural networks (ANNs), and complex control networks. Several LFC case studies have been documented in the scholarly literature, which encompass interconnections among the tilt (T), derivative (D), proportional (P), integrator (I), and filtered derivative (DF) components. The EV-specific proportional-integral (PI) controller was first presented in reference [18]. Nevertheless, the regulator in question exhibits stability issues, particularly when taking into account communication time delays (CTDs). The TIDF controller for electrical grids that include renewable energy sources (RESs) was optimized for optimal performance utilizing the differential evolution technique, as described in reference [18]. In the analysis of power networks, the author of [19] integrated the configurations of the PI regulator, the TD regulator, and the filter regulator. While these approaches improved performance, they primarily focused on conventional power systems and lacked comprehensive treatment of renewable energy integration challenges.
The hybrid strategy proposed in reference [20] utilizes an enhanced edition of the genetic algorithm (GA) methodology to develop a controller for stabilizing the frequency of power networks. According to the study in [21], it is recommended to employ a fractional order regulator in multi-generational networks. The settings of this regulator should be carefully adjusted using the imperialist competitive search (ICS) method. The previously stated controller demonstrates the capability to boost the performance of the power approach when multiple-step adjustments are taken into account during generation and/or loading. The achievement of frequency regulation in linked power grids including two separate zones is carried out by the cascading of a fractional-order proportional-integral derivative (FOPID) controller and a fuzzy logic controller (FLC) [22]. Furthermore, the utilization of the grey wolf strategy for the development of LFC in multiple-generation electric systems was suggested as a potential solution [23]. However, these methods often resulted in computationally intensive optimization processes with convergence limitations in high-dimensional parameter spaces. The researchers of reference [24] recommended that a fractional-order proportional-integral derivative (FOPID) regulator be used with a fractional-order (FO) filter in order to obtain the desired results. To effectively optimize the controller settings, the Sine Cosine Algorithm (SCA) technique was employed. Furthermore, the study conducted by [25] proposes the utilization of an optimal self-tuning FO fuzzy (OSTFOF) controller to boost the effectiveness of the frequency regulation of a multi-region interconnected power grid. This is accomplished by utilizing the Pathfinder Algorithm (PFA) to fine-tune both the settings of the OSTFOF regulator and the output membership functions. Ref. [26] introduces a pumped storage system that adheres to IEEE standards. Additionally, it proposes a control methodology in order to maintain the pumped-storage power units’ regional frequency stability, which is built on a FOPID controller. The utilization of the chaotic particle swarm optimizer (CPSO) technique is employed for refining the controller’s settings. Despite the theoretical advantages of the previously mentioned controllers, several gaps persist, such as increased computational complexity that limits real-time applicability, challenges in parameter tuning that require sophisticated optimization algorithms, and a lack of comparative analysis against simpler controller structures, which might achieve comparable performance with reduced complexity.
In addition, the researchers of reference [27] conducted a study to determine the most effective method for improving frequency regulation within a shipboard microgrid that incorporates different power supplies. They investigated three control strategies: PIDF, FOPIDF, and 2DOF-PIDF. The present study additionally included the delay im-posed by the communication links of the sensors and controller. The researchers employed jellyfish search optimization (JSO), a bio-inspired optimization approach, to finely enhance the regulators. The authors of research [28] utilized the Harris Hawk method as a strategy to optimize the creation of PI-based load frequency controller settings. In their study, Daraz et al. [29] employed the FOI-TDN method to analyse multisource power grids, accounting for a range of non-linearities. This achievement was attained using capacitive energy storage. Modifications are implemented to the settings of the suggested technique by employing an algorithmic fusion that combines SCA and fitness-dependent methods. The researchers in [30] utilized controlled electric vehicles (EVs) that were equipped with regulators based on the bee colony optimizer and term frequency-inverse document frequency (TIDF). The technique for quantifying virtual inertia, as outlined in reference [31], has undergone additional refinement through the utilization of particle swarm optimization (PSO). The challenges associated with automated generation control (AGC) in interconnected power grids have served as a catalyst for the advancement of an energy storage unit utilizing ultra-capacitors, as elucidated in reference [32]. The authors have also designed an enhanced architecture for the FOTID controller using the pathfinder optimization technique [33]. A common limitation across these works is the absence of systematic comparative analysis between cascaded integer-order controllers and their fractional-order counterparts, particularly regarding the trade-off between performance improvement and implementation complexity.
Amil et al. [34] proposed the utilization of finely tuned MFOPID/FOPID controllers as a means to improve frequency management within a hybrid electrical network. These regulators employed the JSO approach. Within the scope of their research, the authors of reference [35] offered a novel strategy that makes use of the imperialist competitor method in order to determine the highest-value advantages of the controller that was presented in the context of frequency control power systems. One of the feasible alternatives that was presented was the strategy that was stated before. The authors in [36] provided a TDF regulator that is improved and is based on fractional order. Using the artificial hummingbird approach, the regulator was optimised for optimal performance. In a previous study [37], it was suggested that the salp swarm algorithm has potential for tunning the settings of PID regulators in the context of two-area networks. Furthermore, the utilization of the butterfly optimizer has been employed in the creation of the two-phase regulator, which is reported in reference [38].
The paper referenced as [39] proposed the implementation of separate cascaded FO-ID control systems, coupled with filter regulators, for LFC loops in electrical networks incorporating both traditional and green energy-based sources. It has become evident that the existing scientific literature has several concepts related to LFC, which employs diverse optimization methodologies. The selection of the LFC type, in conjunction with the selected optimizer, exerts a substantial influence on the operational efficiency of the electrical network in its reaction to transients. Furthermore, reference [40] introduces a fuzzy logic interface that utilizes a fault-tolerant compensatory control method. The main goal of constructing this system was to offer safeguards against simultaneous additive and multiplicative actuator defects while also tackling nonlinearity problems in Markov jump networks. In their study, the authors of reference [41] addressed the issue of fault-tolerant compensation control for Markovian jump networks by employing neural network-based methods. Ref. [42] utilized a gorilla troop optimizer to achieve optimal control of network power flow. This study was carried out in partnership with the deployment of thyristor-controlled series capacitor (TCSC) units, with the aim of enhancing the stability of the electrical network, reducing fuel expenses, and minimizing grid emissions. The authors of research [43] employ a coyote optimizer to finetune the gains of a hybrid control system consisting of two proportional-integral (PI) regulators (PI-PI) and proportional-derivative to proportional-integral (PD-PI) regulators. This control system is utilized for the purpose of effectively regulating frequencies in power grids with many interconnected areas.
The study described in reference [44] focuses on the operation of a novel type two fuzzy PID regulator (T2-FPID) in a multi-region power grid. The regulator’s parameters have been adjusted using the water cycle approach (WCA), taking into account the generation rate limits. In order to address the limitations of AC transmission, a study conducted in reference [45] investigated the application of an arithmetic optimizer so as to adjust a fuzzy-based PID regulator. The researchers considered the effects of the high-voltage direct current connection in their study. Ref. [46] presents the development of a hybrid optimizer that combines the gravitational search method with the firefly technique. This hybrid optimizer is designed to refine the proposed regulator’s settings. This action was undertaken with the purpose of facilitating its utilization within a hydrothermal power grid encompassing two distinct regions. The settings of a fuzzy PID controller, along with an extra filter for the derivative parameter, have been optimized using the Bees optimizer, as outlined in reference [47]. The resulting control methodology was effectively evaluated in a multi-region connected power grid.

1.3. Research Gaps

Based on the comprehensive literature review, this study addresses the following critical research gaps:
  • Limited exploration of novel cascaded controller architectures: Most studies focus on single-stage controllers or well-established cascaded structures (e.g., PI-PID, PD-PI). The potential benefits of innovative combinations such as PIDD2-TD remain unexplored.
  • Insufficient validation under diverse disturbance scenarios: While individual studies test specific disturbances (step loads and random variations), comprehensive evaluation under simultaneous RES fluctuations, multi-step changes, and random disturbances with parameter variations is lacking.
  • Many studies employ established algorithms without systematic comparison against recently proposed meta-heuristics that might offer superior convergence characteristics and solution quality.
  • Few studies comprehensively assess controller performance under parameter uncertainties and system configuration changes, limiting confidence in real-world applicability.
  • While EV participation in frequency regulation is recognized [18,30,31], their integration with novel cascaded control architectures optimized by state-of-the-art algorithms requires further investigation.

1.4. Main Contributions

Building upon the identified gaps, this study proposes a novel endeavour to integrate the favourable attributes of the TD and PIDD2 regulators with the aim of developing an outstanding regulatory mechanism. The suggested controller is referred to as PIDD2-TD, and its parameters are optimized through the utilization of Tianji’s Horse Racing Optimization (THRO). THRO is a novel meta-heuristic optimizer, based on the Chinese legend of Tianji’s horse, where Tianji won a race by strategically matching his horses against his opponent’s rather than competing directly. This tale of using tactical positioning to exploit weaknesses while avoiding direct confrontation serves as the foundation for THRO’s optimization approach [48]. The below enumeration presents the primary contributions that can be derived from this corpus of research:
i.
Enhancing the frequency stability of a two-region connected power grid with RESs by utilizing a first-of-its-kind regulator, known as PIDD2-TD.
ii.
Application of an innovative and recently reported optimization algorithm (i.e., THRO) for LFC design in order to optimally chose the gains of the proposed PIDD2-TD regulator.
iii.
Proving the dominance of the THRO by contrasting its effectiveness with that of other, more advanced techniques (such as the Dhole Optimization Algorithm (DOA) [49] and Water Uptake and Transport in Plants (WUTPs) [50]).
iv.
Evaluating the performance of various control methodologies provided in previous work, such as the PIDD2-PD regulator and PID-TID regulator, to confirm the efficacy of the presented PIDD2-TD regulator.
v.
Evaluating the suggested regulator’s performance and stability in the presence of a variety of disturbances, including RES fluctuations, step, multi-step, and random load fluctuations.
vi.
Evaluating the robustness of the suggested PIDD2-TD regulator against the system parameters’ variations.
The succeeding sections of the manuscript are constructed as follows: In Section 2, a model of the hybrid system with electric vehicle integration is shown. In Section 3, a comprehensive explanation of the optimization approach employed in this study, namely THRO, is provided. In Section 4, we arrange a detailed account of the control methodology and the manner by which the problem is proposed. In Section 5, the results are presented and discussed. The conclusions and recommendations for further research are enumerated in Section 6. At last, limitations of our research and plans of future studies are summarized in Section 7.

2. Dual-Area Hybrid Power Grid Architecture

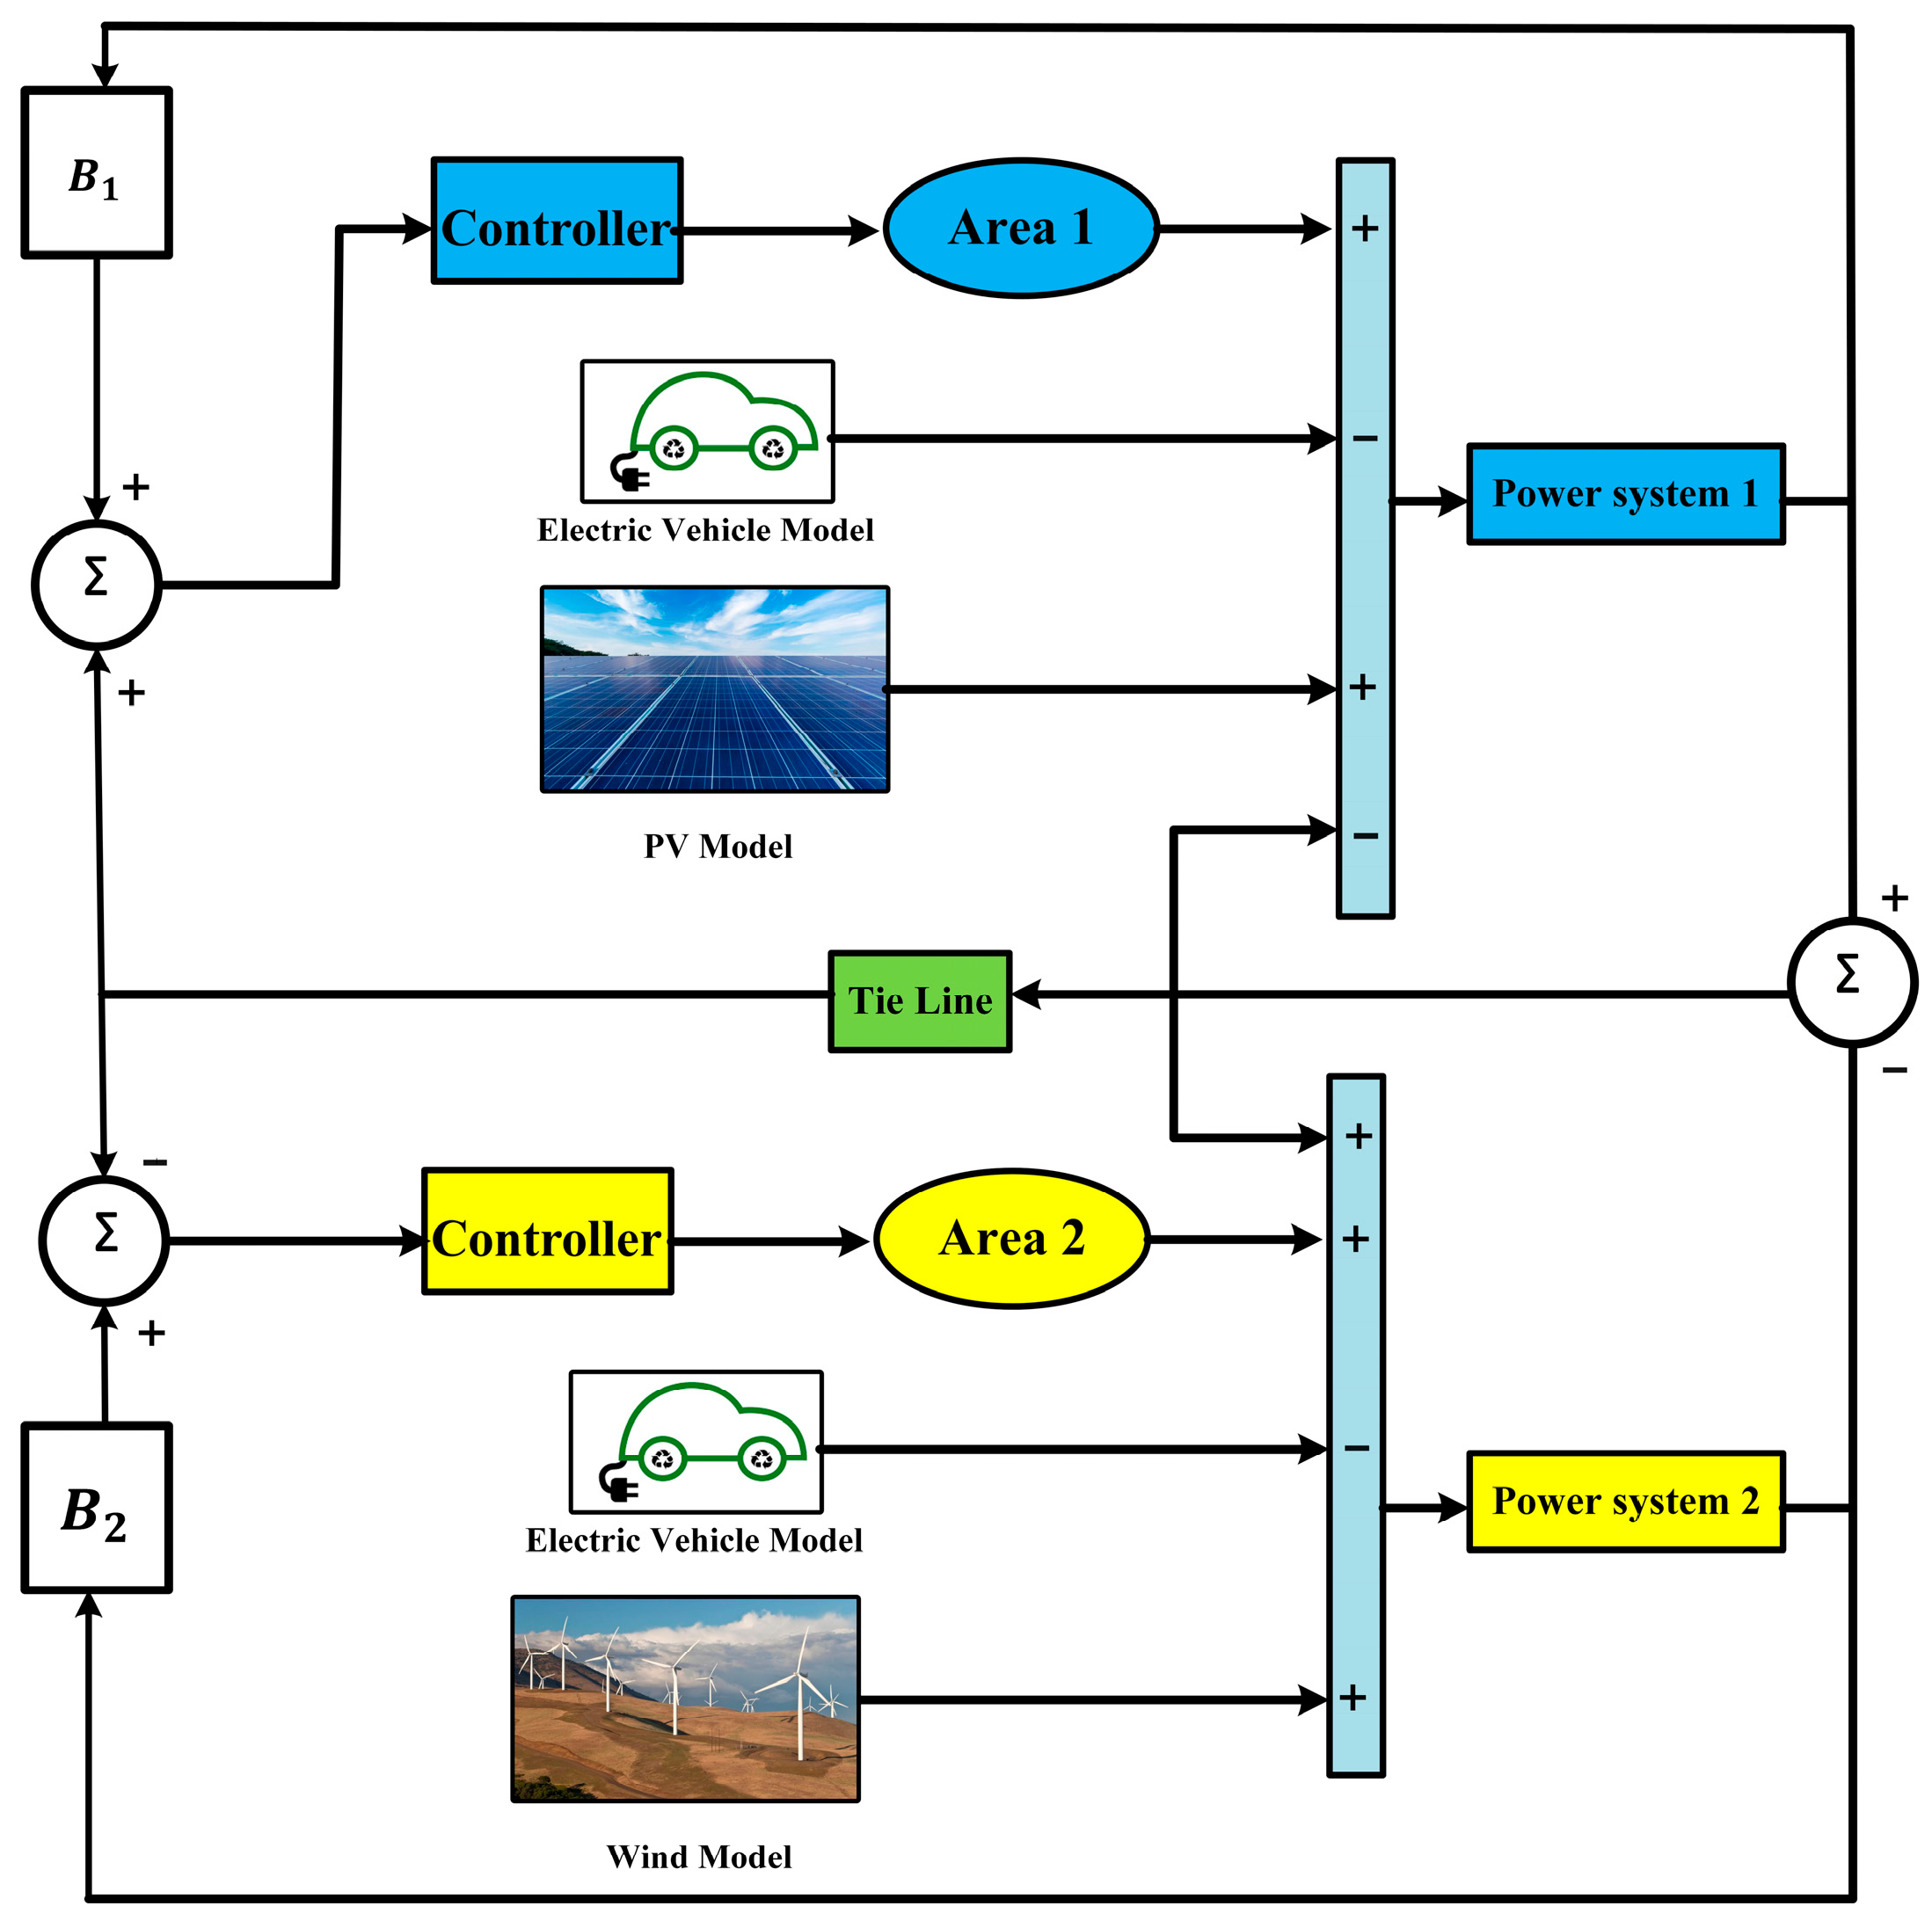
The subject of analysis is a hybrid power system with a networked structure, consisting of two interconnected areas. As demonstrated in Figure 1, adopted from [51], every region includes three dynamic subsystems, including a gas unit, a thermal power plant with reheat turbines, and a hydraulic power plant. When studying the nonlinearity of the power system, it is critical to consider the system’s physical bounds, such as the governor deadband (GDB) and the generation rate constraint (GRC). As seen in Figure 2, the renewable energy sources (RESs) are encompassed inside the analysis, with a solar unit situated in the first region and a wind unit located in the other area. The nominal load of each region is recorded as 1740 MW, with a 2000 MW rated power. The selection of this method was based on its ability to subject the suggested controller to various barriers, hence enabling a comprehensive investigation into its performance on frequency control and tie-line power swings [51].

2.1. Dynamic Subsystems Models

2.1.1. Thermal Power Plant

The plant has a capacity of 1000 MW power rating and contains the following:
  • Governor Dead Band (GDB)
The GDB nonlinearity calculations might be reduced as a function of speed changes [52]. The transfer function (TF) is estimated using the Fourier series as follows:
G D B   =     1 T s g S + 1
where T s g stands for the steam turbine’s time constant.
  • Steam Turbine Reheating Unit
The first-order transfer function is utilized to mathematically represent the reheater [1,51], where steam turbine reheating constant is K r :
R e h e a t e r   =   K r T r S + 1 T r S + 1

2.1.2. Hydraulic Power Plant

The plant has a capacity of 500 MW power rating and includes the following:
  • Hydraulic Governor
The TF used to model the hydro turbine governor is as follows [1,51]:
G o v e r n o r   =   1 T g h S + 1
where T g h is the governor time constant.
  • Transient Droop Correction
A first-order TF is employed in order to elucidate the phenomenon of transient droop correction [1,51], which encompasses the incorporation of a hydro turbine’s speed reset of the governor ( T r s ) and a transient droop time constant ( T r h ):
T r a n s i e n t   D r o o p   C o r r e c t i o n   =   T r s S + 1 T r h S + 1
  • Penstock Hydraulic Turbine
The turbine is represented by a mathematical model that employs a first-order transfer function [1,51], incorporating the time at which water enters the hydro turbine ( T w ):
P e n s t o c k   T u r b i n e =   T w S + 1 0.5   T w S + 1

2.1.3. Gas Power Plant

The plant has a capacity of 240 MW power rating and contains the following:
  • Valve Positioner
A first-order TF, with an interval of the valve positioner’s time B g and the gas turbine valve positioner C g , is used to model the valve positioner [1,51]:
V a l v e   P o s i t i o n e r   =   1 B g S + C g
  • Speed Governor
The TF, with the gas turbine governor’s lead and lag time constants X g and Y g , respectively, is used to simulate the speed governor [1,51]:
S p e e d   G o v e r n o r   =   X g S + 1 Y g S + 1
  • Compressor Discharger
A first-order TF is used to describe fuel and combustion processes [1,51], using a delay in the combustion reaction time of a gas turbine T c r and a temporal constant for gas turbine fuel T f :
G a s   T u r b i n e   C o m b u s t i o n   = T c r S + 1 T f S + 1  
  • Compressor Discharge
A first-order TF with a constant compressor volume of discharge time T c d is used to represent compressor discharge [1,51]:
C o m p r e s s o r   D i s c h a r g e   =   1 T c d S + 1
The values of the previously mentioned system parameters, as well as the participation factors for each unit, namely, P F h y d , P F g , and P F T h , are listed in Appendix A.

2.2. Wind Farm Modelling

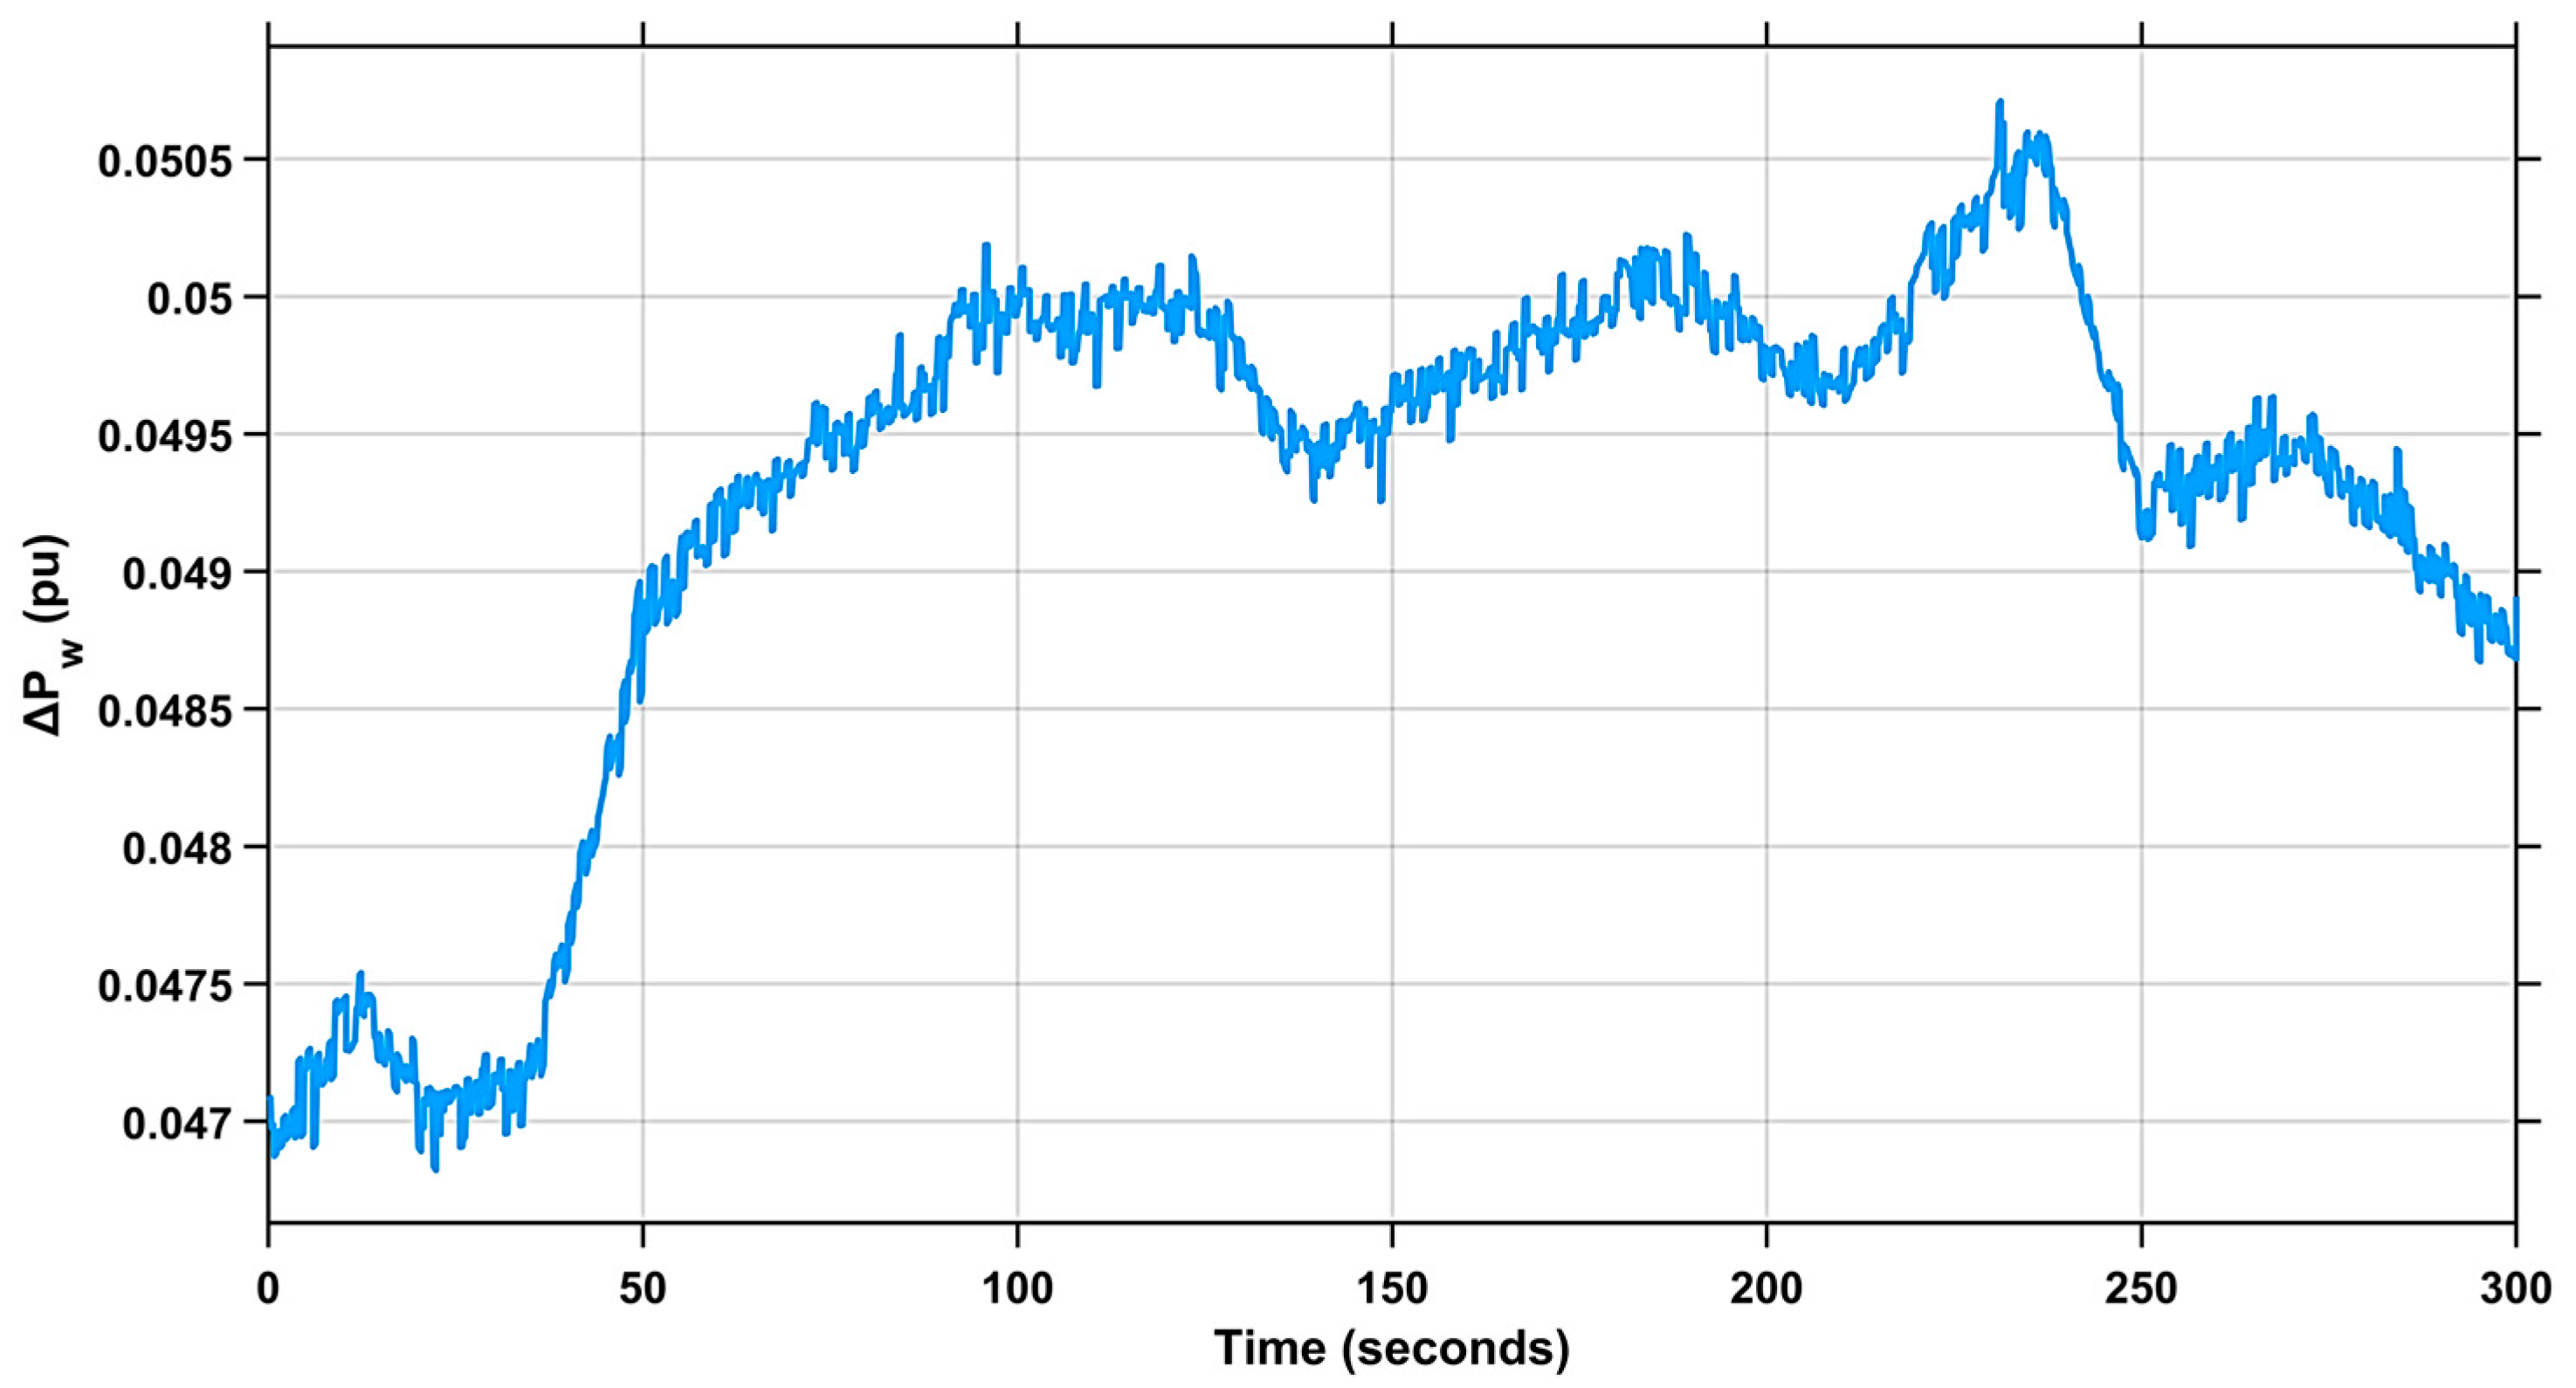
As seen in Figure 3, the white noise block employed inside the wind farm model in the MATLAB-Simulink R2024b framework functions just as a stochastic variable, which is augmented by the velocity of the wind flow. In addition, the wind system generation unit has a participation factor of PFWT = 0.025. Figure 4 denotes the wind turbine’s changing power output. The below equation can be employed to ascertain the wind farm generation units’ output power [53]:
P W = 1 2   ρ   A T   V W 3   C P   λ , β
where P W represents the output power generated by the wind engine, ρ denotes air density in k g / m 3 , A T denotes the rotor’s swept area in m 2 , V W denotes the speed of the wind in m / s , and CP denotes the blade parameter. The parameters of the turbine are C 1 through C 7 , and C P is computed using Equation (11):
C P λ , β = C 1 C 2 λ I C 3 β C 4 β 2 C 5 . e C 6 λ I + C 7 λ T
where β denotes the pitch angle of the blade, and λ T is the optimum tip speed ratio ( T S R ), which can be calculated utilizing Equation (12):
λ T = λ T O P = ω T r T V W
where r T represents the rotor’s radius. λ I represents the discontinuous tip velocity ratio as resolved by Equation (13). The normal wind farm generation unit parameters can be seen in Table 1.
1 λ I = 1 λ T + 0.08 β 0.035 β 3 + 1 λ T = λ T O P = ω T r T V W

2.3. PV Farm Modelling

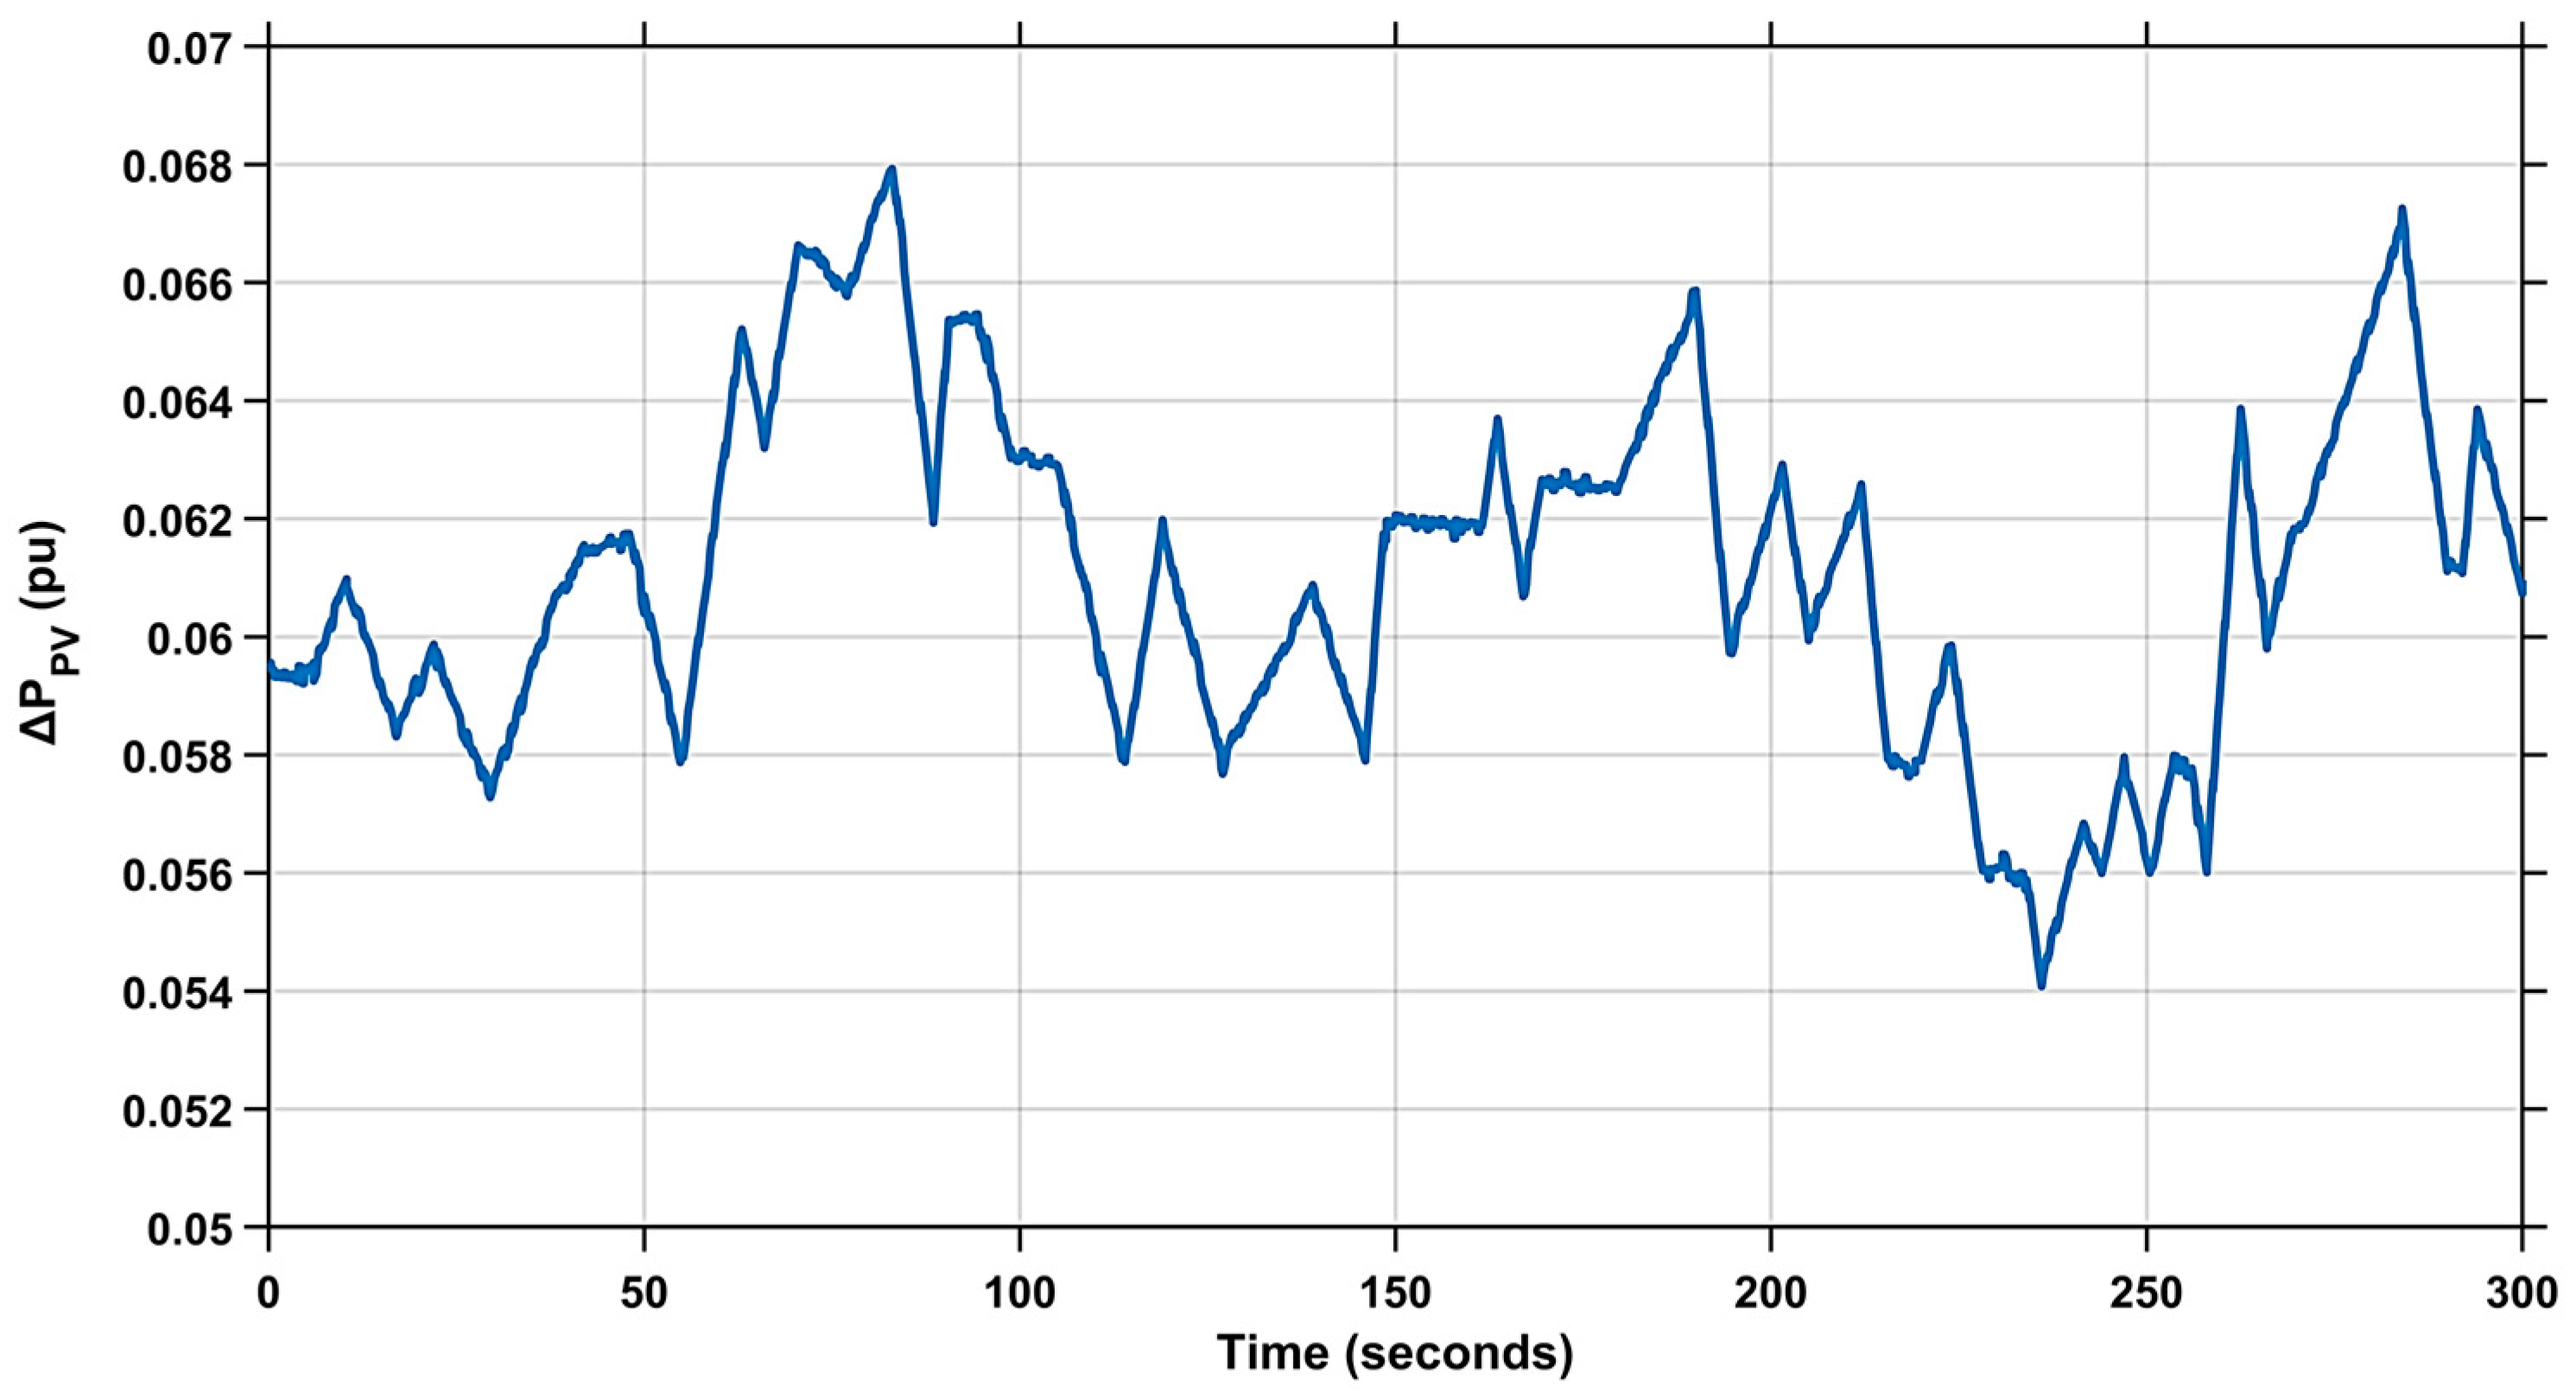
The variability in PV system production can be attributed to the substantial influence exerted by weather conditions. Hence, the system’s frequency stability is jeopardized due to significant fluctuations in frequency caused by photovoltaic (PV) output power. Consequently, the assessment of power fluctuations from solar photovoltaic (PV) systems should account for variations in both uniform and non-uniform solar irradiation. As can be observed in Figure 5 where the PV solar power system is analysed [53], a white noise block in the MATLAB R2024b software is responsible for capturing the power variation that would occur in the solar system in real life. Equation (14), which is used to imitate the real solar power fluctuation, is utilized in order to determine the variable output power of the PV system model. Figure 6 illustrates the amount of power output produced by the photovoltaic (PV) model. Furthermore, a participation factor of 0.015, denoted as PFPV, is employed for the photovoltaic system’s production unit.
Δ P S o l a r = 0.6 P S o l a r

2.4. EVs Modelling

Electric vehicles (EVs) can actively support LFC by receiving control signals and adjusting their charging or discharging power accordingly. Through this bidirectional interaction, EVs contribute to mitigating frequency deviations in the grid. However, the degree of their participation is constrained by two primary factors: the number of EVs that can be controlled at a given time and the state of charge (SoC) of their batteries. Since EVs are primarily designed for mobility and user energy demand, their batteries are not always fully charged, which reduces the reserve capacity available for frequency regulation. This inherent limitation means that the contribution of EVs to LFC depends strongly on their instantaneous charging state.
From a modelling perspective, EVs exhibit a similar behavior to battery energy storage systems, as both rely on electrochemical storage to inject or absorb power in response to fluctuations. Nevertheless, the dual role of EVs as both mobile loads and potential grid resources introduces variability in their availability. To capture their dynamic behavior, the power output of EVs can be represented using a first-order transfer function. This formulation incorporates the EV system’s gain, K E V , and the characteristic time constant, T E V , which together describe the response of EVs to LFC signals. Equation (15) defines this transfer function and provides a mathematical representation of the EV model in the context of frequency regulation studies [15]:
E V   m o d e l   =   K E V T E V S + 1

3. Tianji’s Horse Racing Optimizer

The story of Tianji’s horse race, set during China’s Spring Autumn Period more than 20 centuries ago, is a classic case in point of using strategic thinking to turn disadvantages into strengths [48]. This well-known historical tale inspired the development of the THRO-based approach to global optimization. In this phase, we link key events from the story to the core mechanisms of the THRO algorithm, as illustrated in Figure 7.
A military leader in the Qi State, called Tianji, often raced horses with the king, each grouping their horses into three speed classifications: fast, medium, and slow. Each race consisted of three rounds, with the winner being the one who secured at least two wins. Initially, both matched horses of equal speed classes, such as fast vs. fast and so on, but since the king’s horses were superior in every class, and Tianji always lost. Sunbin, Tianji’s advisor, noticed that the speed gap was minimal and devised a new strategy: In the first phase of racing, Tianji deliberately matched his slow horse verses the fastest one of the king, accepting a loss. In the second phase of racing, he deployed his fastest horse verses the king’s medium-speed horse, securing a win. In the third phase of racing, the medium horse challenged the king’s slowest and won again. Through this clever mismatch strategy, Tianji managed to win two out of three rounds.
This race can be viewed as a metaphor for a search process: each round represents an iteration, and the evolving strategy reflects adaptive learning. In the algorithm, the slow horse enhances exploration, the fast one strengthens exploitation, and the medium horse balances both. The level of disparity between competing horses corresponds to the fitness differences between solutions, guiding the choice of search strategy. Tianji’s flexible and adaptive approach is mirrored in the THRO algorithm’s exploration–exploitation dynamics, forming the foundation for its global optimization framework.

3.1. Initialization

In the THRO approach, consider two separate groups: one representing horses of Tianji and the other representing the king’s horses, with each population containing n horses. Tianji’s horses are represented as follows:
X T = x T 1 x T i x T n = x T 1 1 x T 1 j x T 1 d x T i 1 x T i j x T i d x T n 1 x T n j x T n d
where x T i denotes the i - t h horse in Tianji’s population; each horse possesses various characteristics, including breed, physical condition, and age, that impact its running speed. The term x T i j represents the j - t h attribute of the i - t h horse, with d being the total number of attributes. In the context of a minimization objective, the objective function reflects the speed of the horse, where a lower value signifies a faster horse.
In the same manner, the horses of the king can be represented as follows:
X K = x K 1 x K i x K n = x K 1 1 x K 1 j x K 1 d x K i 1 x K i j x K i d x K n 1 x K n j x K n d
where x K i represent the i - t h horse in the population of the king’s horses. In the classic tale of horse racing, each side uses three horses only. However, the THRO algorithm expands upon this concept by considering n horses per side (where n > 3 ). These horses are individually organized from fastest to slowest, which corresponds to an ascending order of fitness values in a minimization problem. Based on their speed, the horses are categorized into n distinct classes, with the top-ranked horse as the fastest and the n - t h ranked as the slowest.

3.2. Competition

Each iteration of the algorithm consists of n racing rounds. In each round, one horse from Tianji’s team competes with the corresponding horse from the king’s team, after which both are removed from the population. For this extended scenario involving n horses per side, the THRO algorithm employs five strategic competition methods, as outlined in [48].
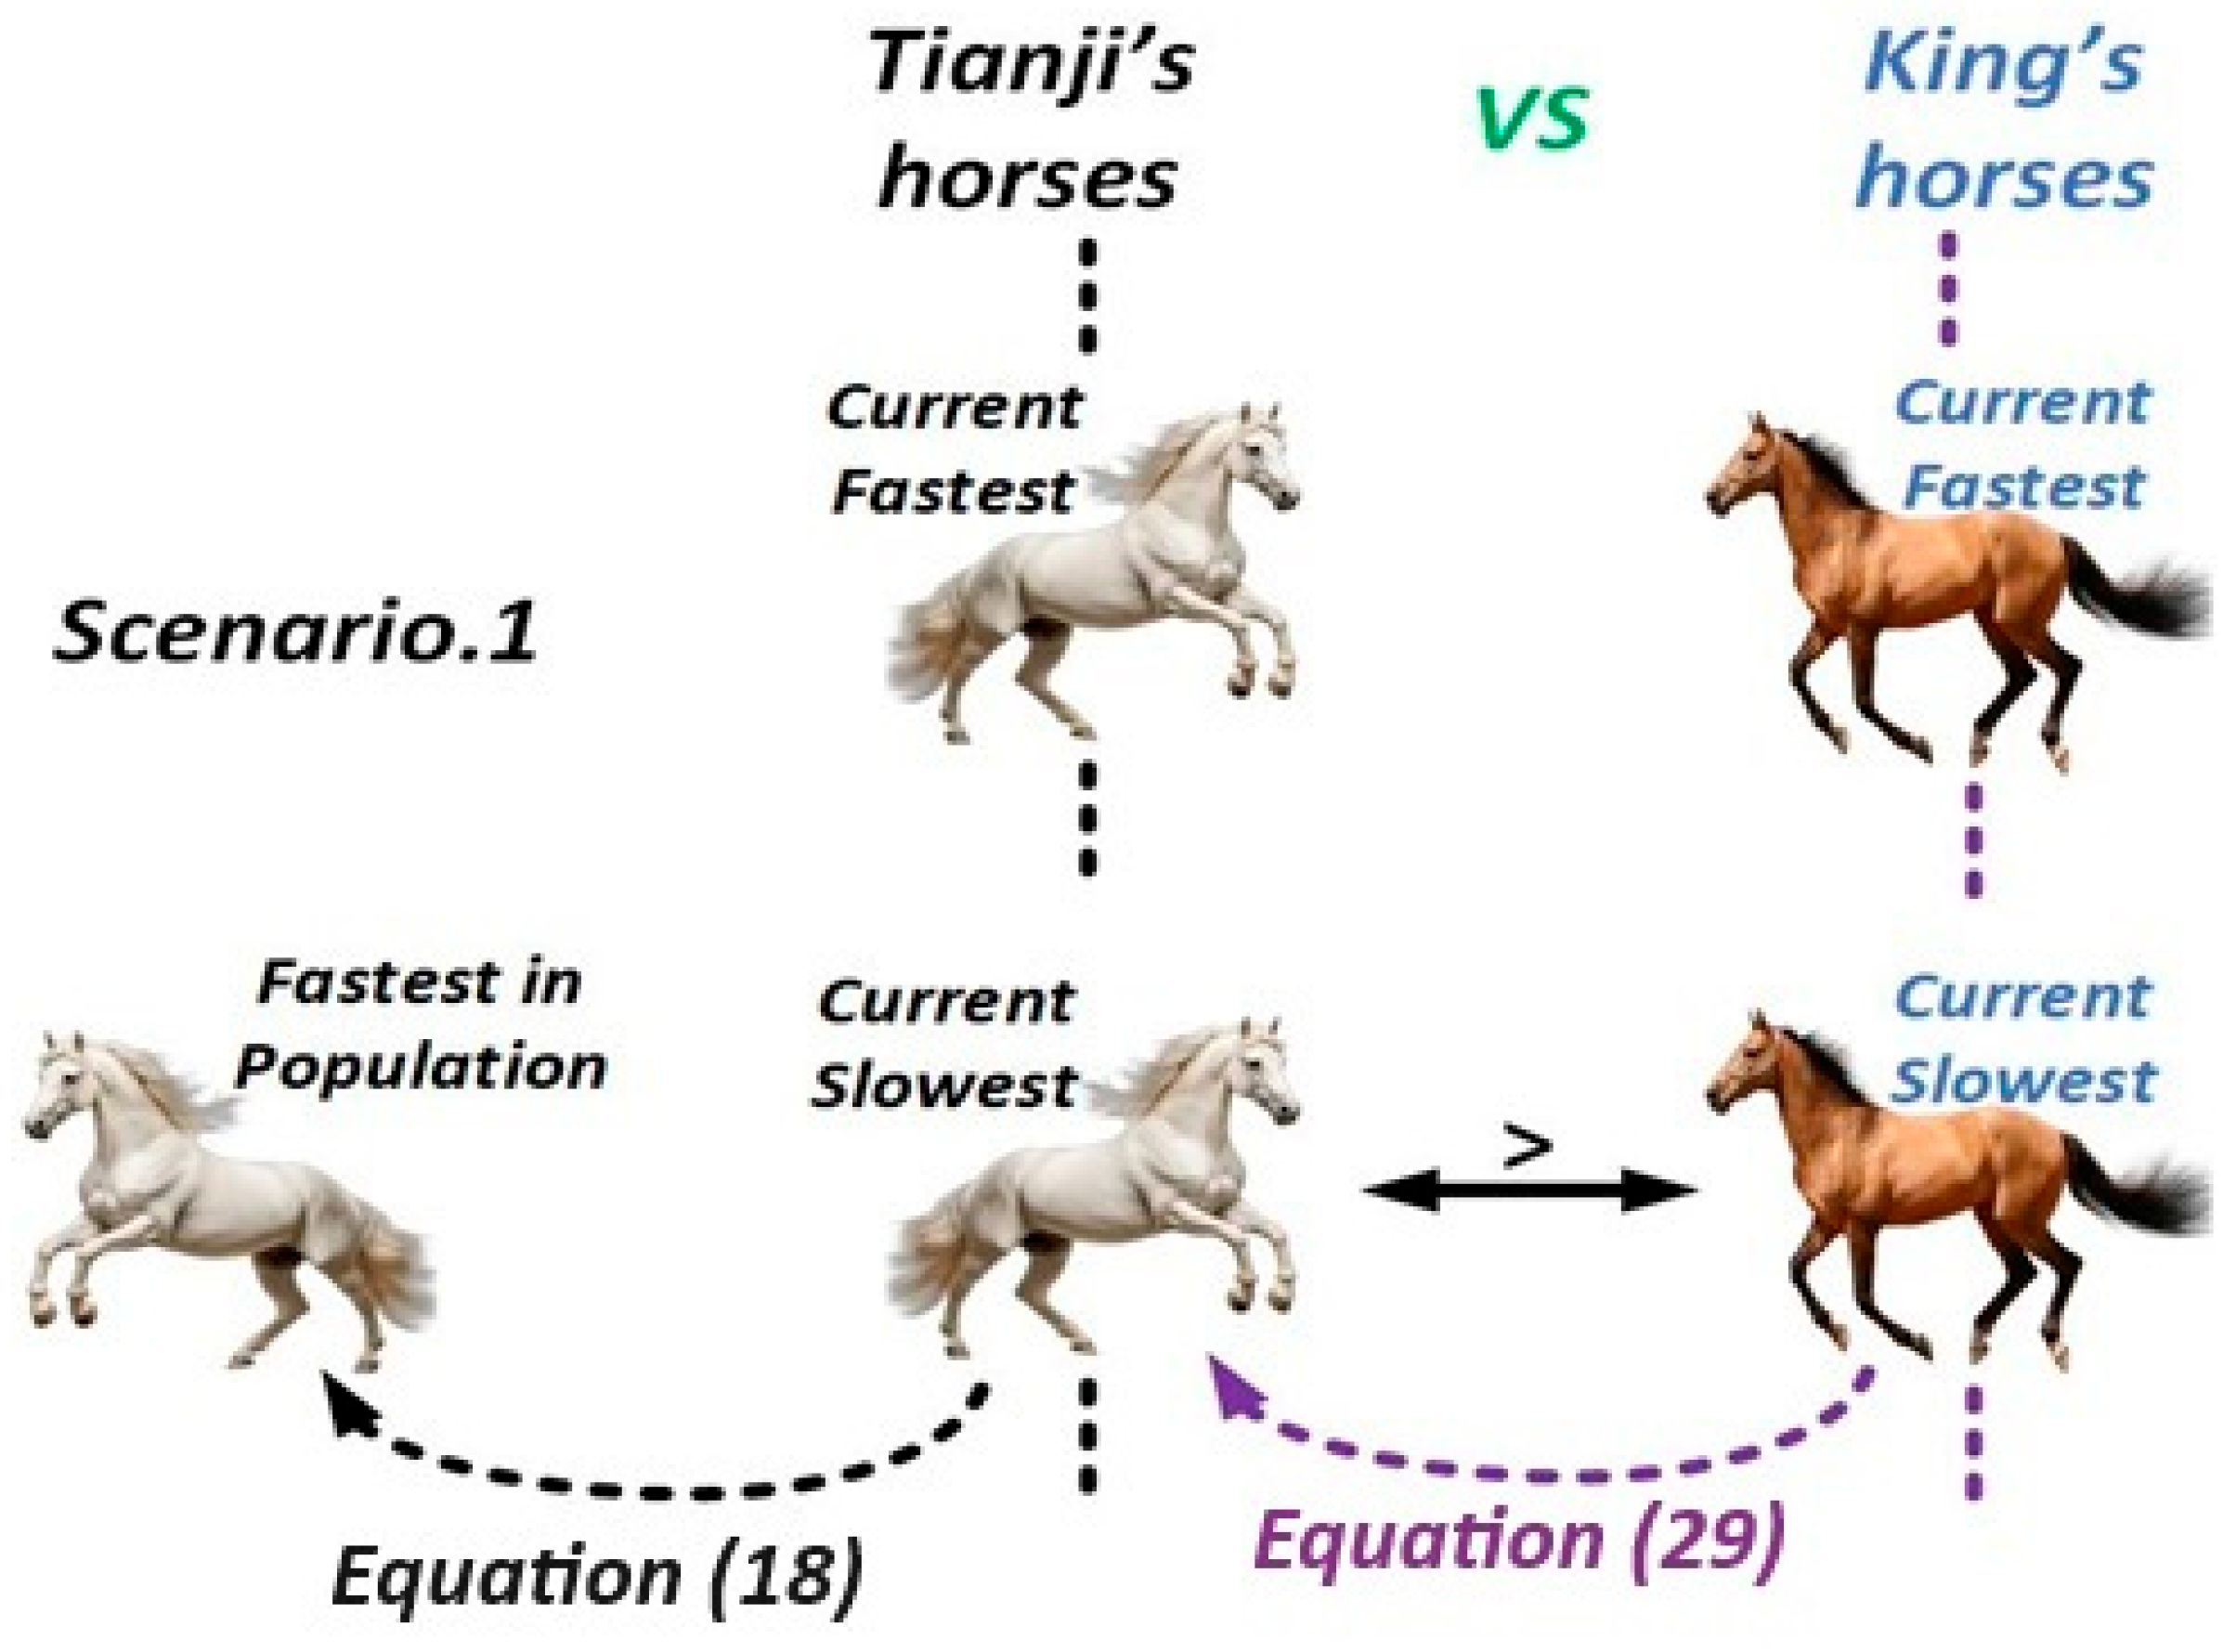
  • Scenario 1: When the slowest current horse of Tianji outperforms the slowest horse of the king, it is selected in the race and secures a win for Tianji. To maintain this advantage, the algorithm updates Tianji’s slowest current horse based on the characteristics of the fastest horse of Tianji. During this update, the influence of Tianji’s top-performing horse and the overall quality gap between both populations are taken into account. The updated formulation for the slowest horse of Tianji is as follows:
v T s i ( t + 1 ) = α × p × x T s i t + 1 p × x T f t + R × x T f t x T s i t + p × x T ¯ t x K ¯ t + β T s i = T s i 1  
α = 1 + r o u n d ( 0.5 × 0.5 + r a n d ) × n 1
β = r o u n d ( 0.5 × 0.1 + r a n d ) × n 2
p = 1 t T
R = L × B
L = u · σ v 1 b
σ = Γ ( 1 + b ) × sin π b 2 Γ 1 + b 2 × b × 2 b 1 2 1 b
B = [ b 1 , ,   b K , ,   b d ]
b k = 1           i f   k = = g ( l ) 0                                           e l s e  
g = r a n d p e r m ( d )
l = 1 , ,   s i n π r 1 2 × d
Let x T s i represent Tianji’s current slowest horse, where T s i denotes its index in the population. The coefficient α serves as a dynamic population update parameter that determines the number of horses to be removed and replaced in each competition round. As defined in Equation (19), α is calculated based on the population size n 1 (number of horses in Tianji’s population) with a randomization component. This parameter plays several critical roles:
  • Population Renewal Control: α determines how many solutions are modified in each iteration. This ensures controlled population diversity while maintaining algorithmic stability.
  • Adaptive Search Intensity: By incorporating the random component (rand), α introduces adaptive variation in the update process. Larger α values promote exploration by affecting more horses, while smaller values enhance exploitation by focusing on fewer, promising solutions.
  • Quality Difference Amplification: In Equation (18), α acts as a weighting factor for the term x T ¯ t x K ¯ t , which represents the overall quality gap between Tianji’s and the king’s populations. This amplifies or dampens the influence of population quality differences on the slowest horse’s update, enabling strategic positioning in the search space.
  • Strategic Competition Depth: α mirrors the tactical horse-matching strategy from the ancient legend, determining how deeply the competition affects the current population and thus controlling the balance between preserving good solutions and exploring new regions.
The variables n 1 ,   n 2 ,   u ,   a n d   v adhere to a standard normal distribution. x T f denotes the fastest horse within Tianji’s population, while x T and x K demonstrate the typical standard of Tianji’s and the king’s populations, respectively. The coefficient p is a weighting factor, Γ refers to the gamma function in its standard form, and b = 1.5 . The running factor R is used to guide the algorithm through the search space using Lévy flight across randomly selected dimensions. This results in a combination of long-distance jumps in random directions over time and short-distance adjustments, enabling both global exploration and escape from local optima. In Equation (18), the term p × x T s i t + R × x T f t x T s i t adjusts the slowest horse x T s i to bring its performance closer to the fastest horse x T f . The component 1 p × x T f t further amplifies the influence of the fastest horse on the update process. Meanwhile, p × x T t x k t accounts for the overall quality gap between horses of both Tianji and king, influencing the update direction of x T s i .
The symbol β denotes a mutation parameter developed to maintain diversity in the population and enhance the efficiency of the search process. The running factor R enables the algorithm to perform searches in randomly selected dimensions, allowing both short-range adjustments and long-distance jumps. In two-dimensional and three-dimensional spaces, this facilitates flexible exploration across one or multiple dimensions, enhancing the algorithm’s ability to escape local optima and improving global search performance. Meanwhile, the slowest current horse of the king tries to match the progress of Tianji’s horse. As a result, the algorithm updates the king’s slowest horse based on the slowest currently horse of Tianji using the following update rule:
v K s i ( t + 1 ) = α × p × x K s i t + 1 p × x T s i t + R × x T s i t x K s i t + p × x T ¯ t x K ¯ t + β K s i = K s i 1  
In Equation (29), x K s i is updated to approach x T s i while also accounting for the overall quality gap between both populations of horses and the performance level of x T s i . This update enhances the algorithm’s ability to balance local and wide-ranging search.
Figure 8 illustrates the THRO competition strategy under Scenario 1. In the diagram, the symbol “>” denotes that the left horse is quicker than the right one. Black double arrows represent challenging horses for both populations, while dashed arrows indicate that the targeted horse is being updated based on the one it points to.
  • Scenario 2: When the slowest current horse of Tianji is not faster than the slowest horse of the king, it is deliberately matched verses the fastest horse of the king. Even this results in a loss for Tianji in that round, and the strategy aims to sacrifice the weakest horse to offset the king’s strongest. In this case, knowing that the slowest one in the populations of Tianji is inferior to any horse in the king’s group, the strategy replaces the slowest horse of Tianji by referencing a selected horse from population of Tianji randomly. The replacement rule for Tianji’s slowest horse is as follows:
v T s i ( t + 1 ) = α × p × x T s i t + 1 p × x T r 1 t + R × x T r 1 t x T s i t + p × x T ¯ t x K ¯ t + β T s i = T s i 1  
Let x T r 1 represent a horse randomly selected from the population of Tianji. In Equation (30), x T s i is updated to move closer to x T r 1 , taking into consideration the overall unequal in strength as well between the two populations and the quality of x T r 1 . As for the king, to maintain his advantage, he aims to ensure that his horses continue to outperform Tianji’s. Therefore, the algorithm replaces the king’s fastest horse based on the best-performing horse within his population. The replacement rule for the fastest currently horse of the king’s is as follows:
v K f i ( t + 1 ) = α × p × x K f i t + 1 p × x K f t + R × x K f t x K f i t + p × x T ¯ t x K ¯ t + β K f i = K f i 1  
Here, x K f denotes the fastest horse in the king’s team, and K f i represents the index of the fastest current horse of the king. Figure 9 illustrates the THRO algorithm’s challenging strategy for Scenario 2.
  • Scenario 3: In the case where Tianji’s slowest horse equals the king’s slowest and his fastest horse outperforms the king’s fastest, Tianji selects his fastest horse to compete in the round and secures a win. To help Tianji’s horse keep this leading advantage, the algorithm updates the current fastest horse based on the top-performing horse within Tianji’s group. This update is defined in the following equation:
v T f i ( t + 1 ) = α × p × x T f i t + 1 p × x T f t + R × x T f t x T f i t + p × x T ¯ t x K ¯ t + β T f i = T f i 1  
Here, T f i denotes the index of Tianji’s current fastest horse, and x T f represents the fastest horse in his population. In Equation (32), x T f i is updated to move closer to x T f , taking into account the overall difference gap between the two populations and the performance level of x T f . To keep up with Tianji’s lead, the king’s current fastest horse is replaced based on Tianji’s quickest horse at present. This update is defined as follows:
v K f i ( t + 1 ) = α × p × x K f i t + 1 p × x T f i t + R × x T f i t x K f i t + p × x T ¯ t x K ¯ t + β K f i = K f i 1  
Figure 10 illustrates the THRO competition strategy for Scenario 3, where the symbol “=” signifies that the both sides horses are running at equal speeds.
  • Scenario 4: At the point where Tianji’s slowest horse matches the king’s slowest, but his fastest horse is not as fast as the king’s fastest, Tianji strategically uses his slowest horse to compete against the king’s strongest. Although this results in a loss, the goal is to offset the opponent’s best horse. Given that defeat in this round is inevitable, the algorithm updates Tianji’s current slowest horse by referencing any horse randomly taken from Tianji’s collection. The replacement is defined as per the following equation:
v T s i ( t + 1 ) = α × p × x T s i t + 1 p × x T r 2 t + R × x T r 2 t x T s i t + p × x T ¯ t x K ¯ t + β T s i = T s i 1  
Let x T r 2 represent a randomly selected member of Tianji’s horse population. In Equation (34), x T s i is adjusted to move closer to x T r 2 , while considering both the overall strength disparity between the two populations and the performance level of x T r 2 . For the king, as in Scenario 2, the algorithm replaces his fastest horse currently based on the top-performing horse within his own population. This update is given by the following:
v K f i ( t + 1 ) = α × p × x K f i t + 1 p × x K f i t + R × x K f t x K f i t + p × x T ¯ t x K ¯ t + β K f i = K f i 1  
Figure 11 illustrates the THRO algorithm’s competition strategy in Scenario 4.
  • Scenario 5: When the weakest horse in Tianji’s stable currently matches the speed of the king’s bottom-ranked horse and his fastest horse also matches the speed of the king’s fastest, Tianji chooses his slowest horse to compete against the king’s fastest, resulting in a loss. In this case, the algorithm applies the same update strategy as in Scenario 4. The update for the lowest-speed horse currently in Tianji’s team is given by the following:
v T s i ( t + 1 ) = α × p × x T s i t + 1 p × x T r 3 t + R × x T r 3 t x T s i t + p × x T ¯ t x K ¯ t + β T s i = T s i 1
Here, x T r 3 denotes any horse randomly taken from Tianji’s collection. The king’s current fastest one is replaced as follows:
v K f i ( t + 1 ) = α × p × x K f i t + 1 p × x K f t + R × x K f t x K f i t + p × x T ¯ t x K ¯ t + β K f i = K f i 1  
Figure 12 illustrates the THRO algorithm’s competition strategy for Scenario 5.

3.3. Training

Since THRO operates as an iterative search process, it is essential to effectively reinforce the solutions obtained in previous iterations. To prevent stagnation during this reinforcement phase, a dedicated training strategy is introduced. After each round of competition, horses from both populations undergo training to improve their performance in future races. This training involves interactions with horses of varying speeds to progressively enhance their capabilities, as well as concentrated training utilizing the fastest horse in the group to help them reach their full potential. This strategy can be mathematically formulated as
v T i j ( t + 1 ) = x T i j t + L T × x T r 4 j x T r 5 j                       i f   r a n d < 0.5 x T f j t + M T × x T f j ( t ) x T i j ( t )                                         e l s e
L T = 0.2 × L M T = 0.5 × 1 + 0.001 × 1 t T 2 × sin π × r a n d
v K i j ( t + 1 ) = x K i j t + L K × x K r 1 j x K r 2 j                       i f   r a n d < 0.5 x K f j t + M K × x K f j ( t ) x K i j ( t )                                         e l s e
L K = 0.2 × L M K = 0.5 × 1 + 0.001 × 1 t T 2 × sin π × r a n d
Here, x T i j denotes the j - t h aspect of the T i - t h horse in the lineup of Tianji, and x K i j represents the j - t h attribute of the K i - t h horse in the king’s population. x T f j refers to the j - t h aspect of the quickest horse in Tianji’s lineup, while x K f j corresponds to the j - t h aspect of the quickest horse in the king’s lineup. Indices T r 4 and T r 5 represent two randomly selected horses from Tianji’s team, and K r 1 and K r 2 denote two randomly selected horses from the king’s population. T is the upper limit of iterations, while L T and M T are training parameters for Tianji’s horses, and L K and M K are training parameters for the king’s horses.

3.4. THRO Working Mechanism

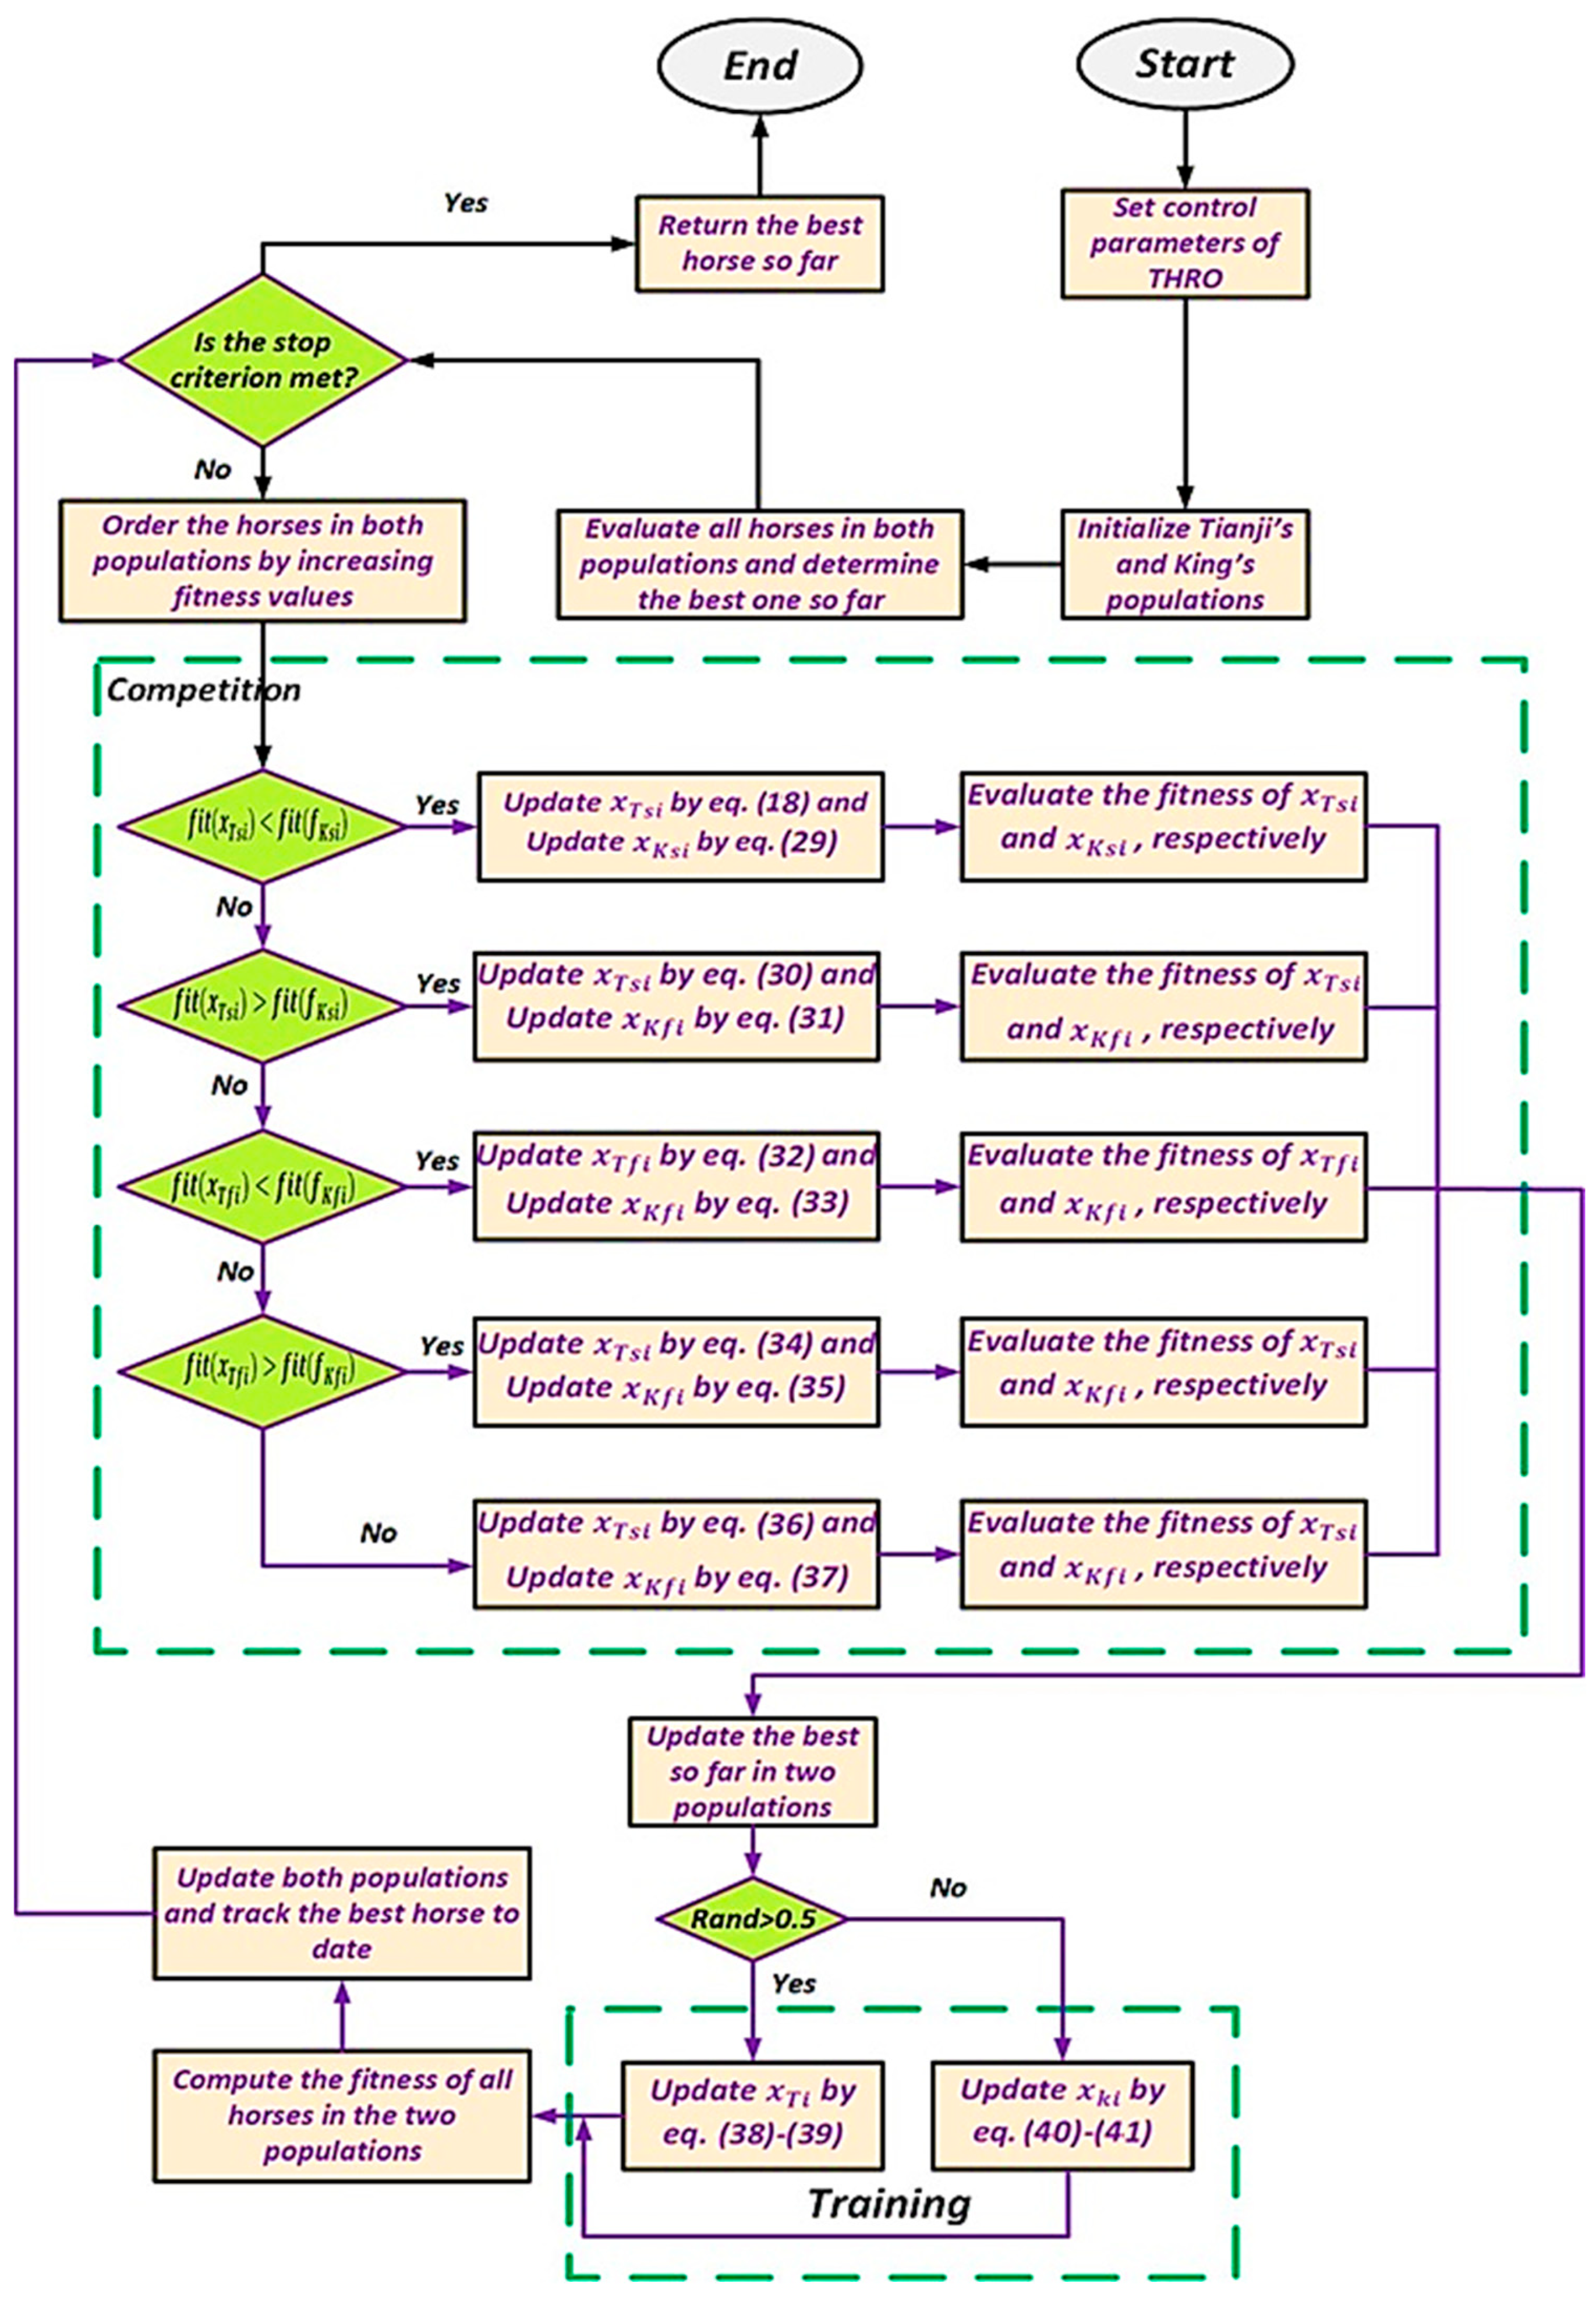
The THRO approach starts by initializing several control parameters, including the population sizes for both Tianji and the king, as well as the maximum number of iterations. Initially, both sets are produced by random sampling within the defined search space. At each iteration, the horses in both groups are reorganized and ranked from up to down relative to speed (i.e., ascending fitness values in the case of a minimization problem). Based on the case encountered in every round, the following cases are presented:
  • Case 1: The slowest horse in Tianji’s group is swapped with the fastest horse, whereas the king’s slowest horse is replaced in relation to Tianji’s slowest horse.
  • Case 2: The slowest horse in Tianji’s lineup is replaced by a randomly picked horse from his population, while the king replaces his fastest horse based on his group’s fastest.
  • Case 3: The fastest horse in Tianji’s lineup is replaced with the best-performing horse from his population, whereas the king’s fastest horse is replaced in relation to Tianji’s top-speed horse as of now.
  • Cases 4 and 5: Tianji updates his current slowest horse by substituting it with a randomly picked horse from his group, whereas the king updates his fastest horse based on his population’s fastest.
Once n rounds of challenges have been completed, all horses are updated using their corresponding candidate solutions. Subsequently, a training phase is applied to both populations to further improve performance. Each horse is replaced by its candidate counterpart only if the latter demonstrates superior performance. This iterative process continues until a predefined stopping criterion is met. Finally, the best-performing horse identified from both populations is returned as the solution. Figure 13 presents the flowchart of the THRO algorithm.

3.5. Computational Complexity Examination

To fully understand and assess the performance of the THRO optimizer, analyzing its computational complexity is essential, as it directly influences the approach’s functionality. Key factors that contribute to this complexity include the size of population of the horse groups of Tianji and the king alike n , the problem dimensionality of the optimization d , and the high limit of iterations T . Taking these parameters into account, the overall computational cost of the THRO approach can be determined.
To gain a comprehensive understanding and accurate assessment of the THRO optimizer, it is essential to examine its processing complexity, as it plays a vital role in determining the algorithm’s overall performance. Many key parameters influence this complexity, including the following:
  • The size of the population of the horse groups of Tianji and the king alike n .
  • The problem dimensionality d .
  • The high limit of iterations T .
By accounting for these factors, the total computational cost of the THRO algorithm can be expressed as
O T H R O = O P r o b l e m   D e f i n i t i o n + O I n i t i a l i z a t i o n + O F u n c t i o n   E v a l u a t i o n             + O T i a n j i s   H o r s e   U p d a t e s   i n   C o m p e t i t i o n + O ( K i n g s   H o r s e   U p d a t e s   i n   C o m p e t i t i o n )             + O ( T i a n j i s   H o r s e   U p d a t e s   i n   T r a i n i n g ) + O ( K i n g s   H o r s e   U p d a t e s   i n   T r a i n i n g )             + O ( S o r t i n g   T i a n j i s   H o r s e s ) + O ( S o r t i n g   K i n g s   H o r s e s )
Breaking this down, we obtain
= O 1 + O 2 n + O 2 T n + 5 O 1 5 T n d + 5 O 1 5 T n d + O T n d + O T n d + O Tnlog n + O Tnlog n
This simplifies to
O ( 2 T n   l o g   n + 4 T n d + 2 T n + 2 n + 1 ) O ( T n ( d + l o g   n ) )
Thus, the asymptotic complexity of the computational of THRO is approximately O ( T n ( d + l o g   n ) ) , which reflects its dependency on the problem’s size, dimensionality, and iteration count.

4. Problem Formulation and Controller Structure

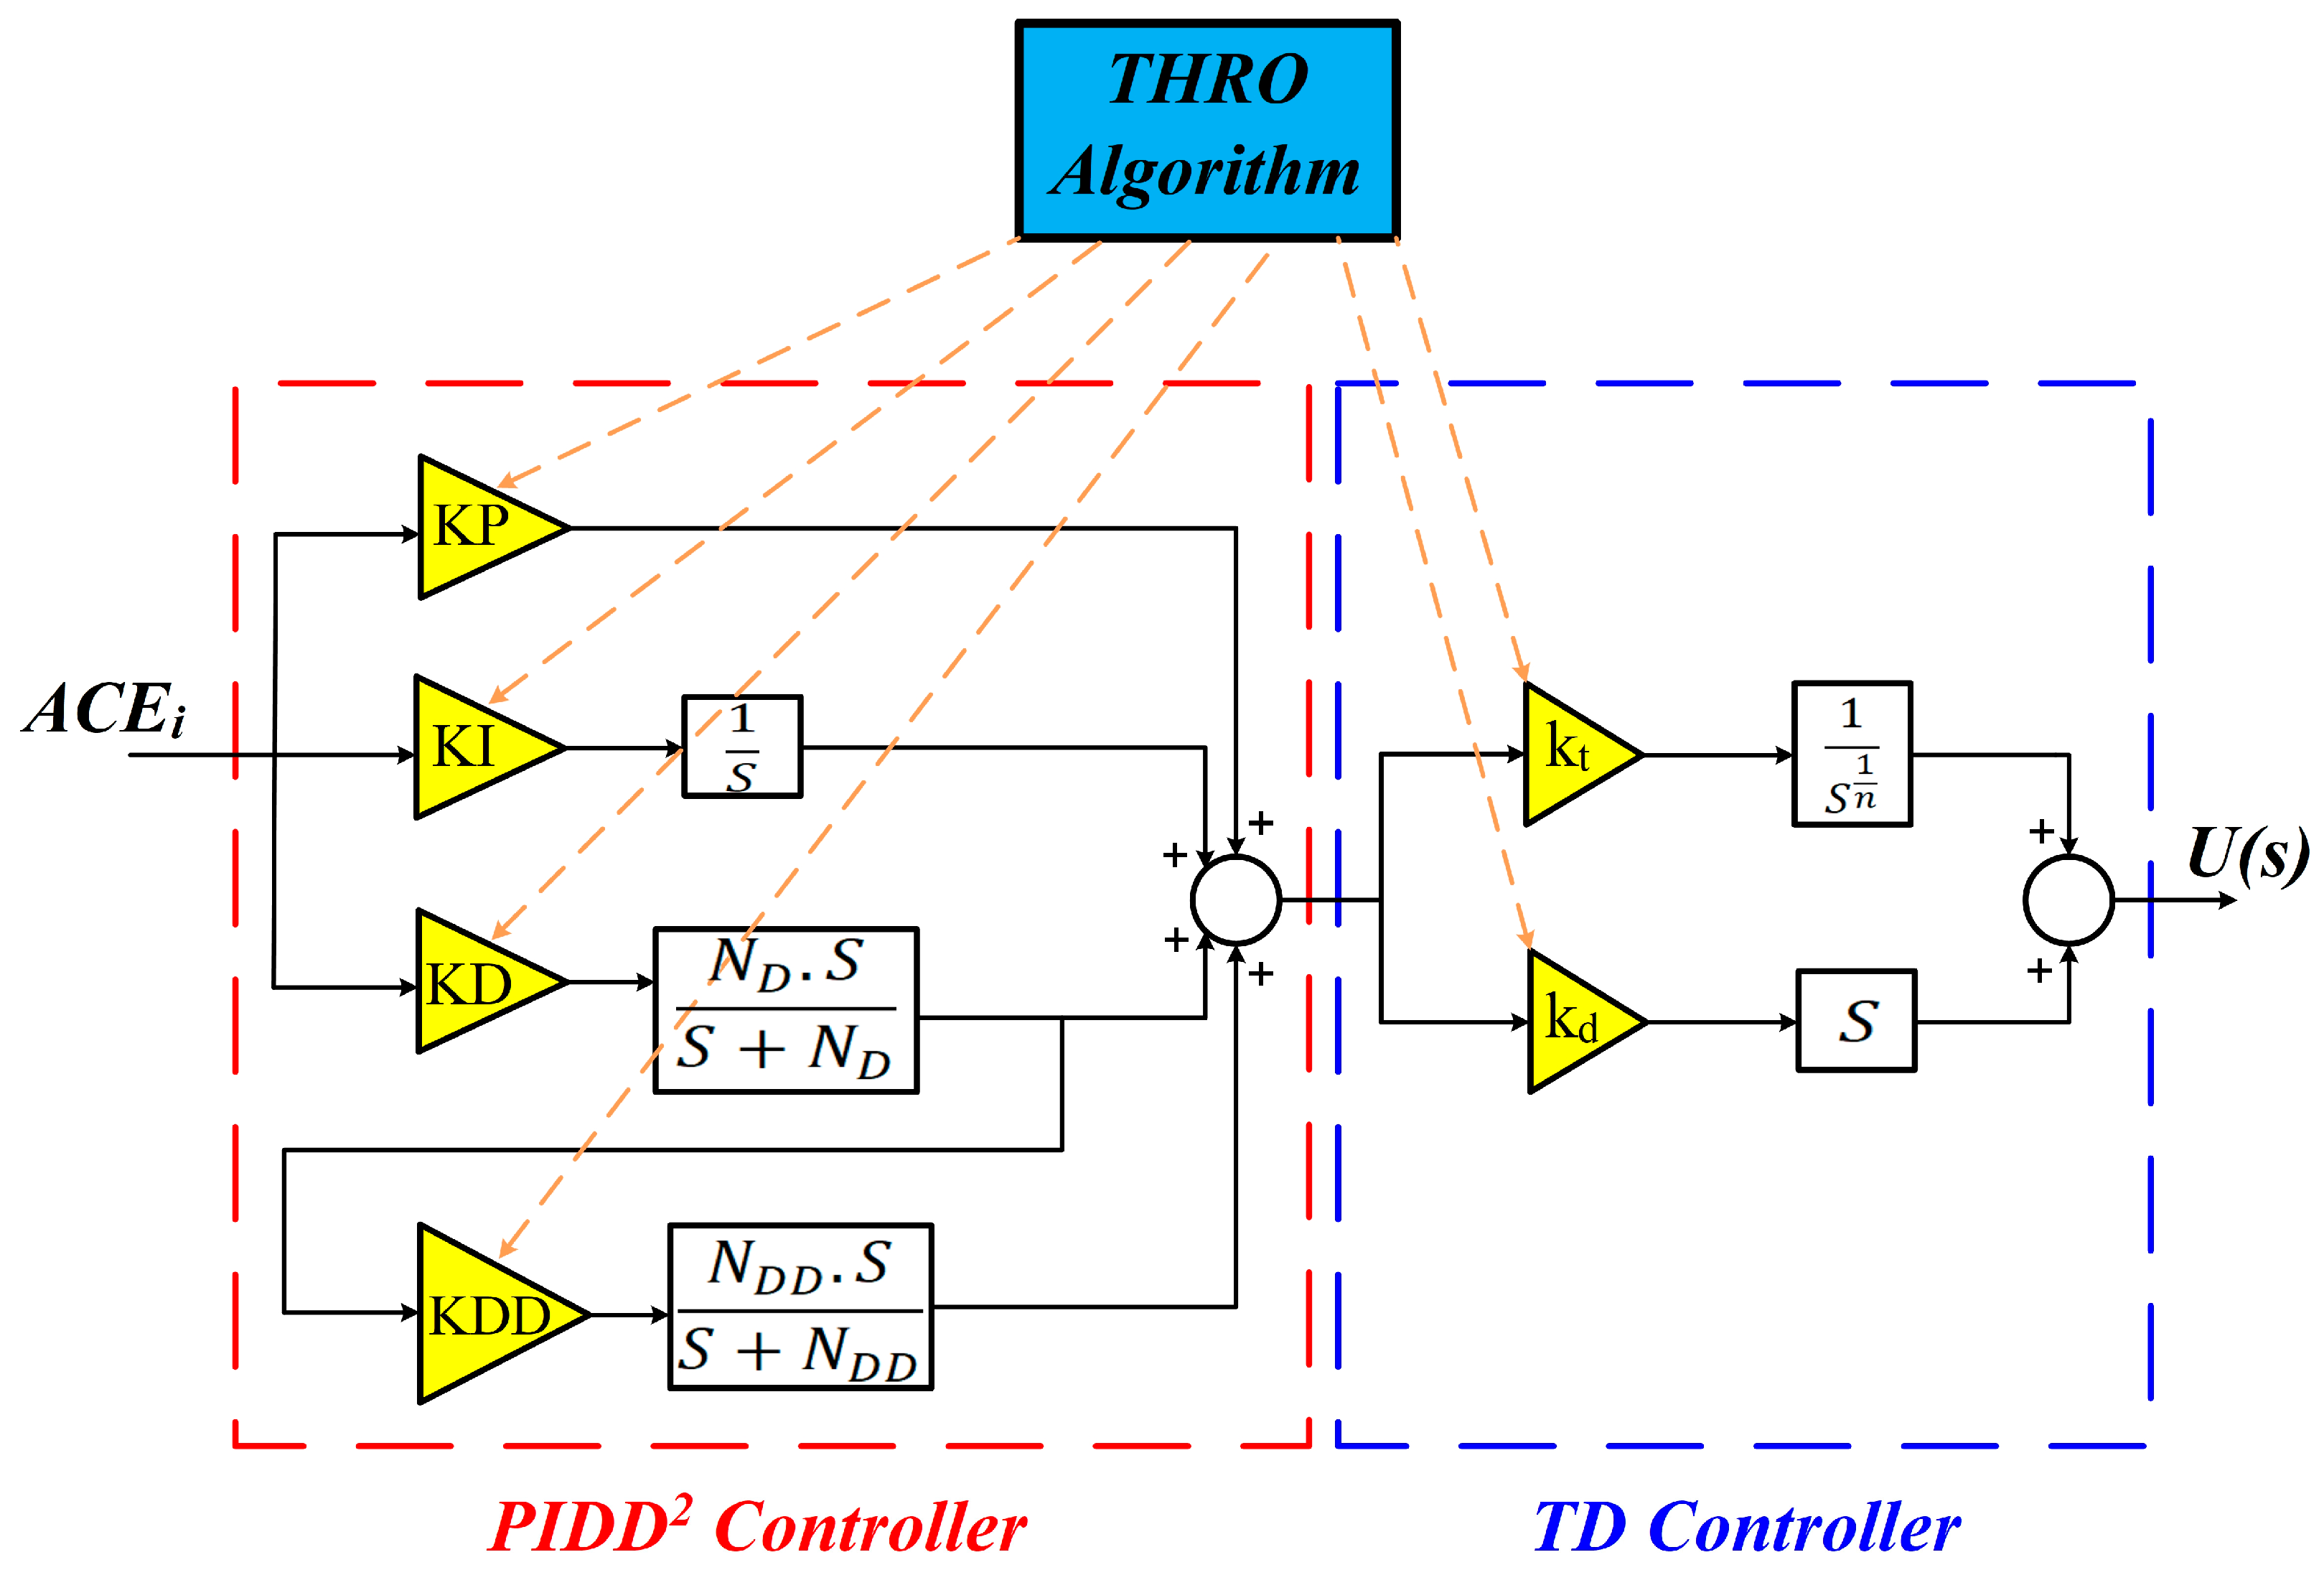
The primary objective of the suggested regulator structure, known as PIDD2-TD, is to effectively regulate and improve the frequency performance of a power grid that incorporates many sources of energy. This regulator is specifically designed to address the challenges given by unforeseen load swings and fluctuations originating from RES. The controller is implemented in both regions to mitigate frequency variations (Δf1 and Δf2) and minimize the fluctuation of tie-line power (ΔPtie) caused by several load disturbances and renewable energy sources. Figure 14 illustrates the schematic architecture of the integrated controller structure. The potential exists for the mitigation of disruptions d(s) to have an influence on the total efficacy of the control system. Moreover, the equation might potentially serve as a representation of the primary loop transfer function:
Y s =   G s U ( s )   +   d s
where the symbol G ( s ) represents the operation being performed, whereas U ( s ) denotes the input signal sent to G ( s ) . The value of U ( s ) may be determined by the utilization of Equation (46).
U s = C 1 s C 2 ( s )
A PIDD2-TD controller is used in this case study of a hybrid power system for both areas. Because of the classic PID controller’s simple design and effective operation, researchers frequently utilize it. The PIDD2 structure is the same as the normal PID structure, but it also includes a second-order derivative gain [54]. Moreover, the proposed PIDD2-TD controller includes a tracking differentiator (TD) mechanism. The D2 term enhances the regulator’s capability to respond to acceleration-level frequency deviations, while the TD component provides dynamic signal tracking and noise suppression, overcoming the derivative noise amplification commonly found in higher-order derivative controllers [20]. This synergy between PIDD2 and TD yields faster transient recovery, improved damping, and superior noise resilience, representing a new control paradigm for LFC applications. The PIDD2 and TD controllers’ transfer functions may be shown using (45) and (46), respectively, as shown below:
C 1 s = K P + K I s + K D N D s s + N D + K D K D D N D N D D s 2 ( s + N D ) ( s + N D D )
C 2 s = k t s 1 n + k d s
With regard to the PIDD2 controller, the variables ( K P , K I , K D , K D D , N D , and N D D ) are representative of the proportional, integral, and derivative actions, as well as the coefficients of the filters. In addition, the terms “ k t ” and “ k d ” are used to denote the proportional gain and derivative gain, respectively, of the TD controller. The schematic representation of a PIDD2-TD is seen in Figure 15.
The ideal settings for the PIDD2-TD controller may be determined using the THRO optimizer by lowering the fitness function (FF). The selection of the fitness function is based on the integral time squared error ( I T S E ), which is known to potentially decrease settling time and effectively dampen excessive oscillations [55]:
I T S E = 0 T s i m t Δ f 1 2 + Δ f 2 2 + Δ p t i e 2 d t
where T s i m refers to the simulation time, whereas the regulator gains are subjected to the following constraints:
K P m i n K P K P m a x K I m i n K I K I m a x K D m i n K D K D m a x K D D m i n K D D K D D m a x N D   m i n N D N D   m a x N D D   m i n N D D N D D   m a x k t m i n k t k t m a x k d m i n k d k d m a x n m i n n n m a x  

5. Simulation Results and Discussion

This section examines how well a hybrid power grid performs in a variety of situations, including the penetration of renewable energy sources, numerous load disturbances (step, random, and multi-step), and changes in system parameters. Under various operating situations, the assessment of the recently utilized PID-TID and PIDD2-PD controllers optimized by the THRO optimizer is contrasted with that of the recommended PIDD2-TD regulator to prove the supremacy of this regulator.

5.1. Performance Analysis of the THRO Algorithm

According to LFC investigation, the transient search algorithm’s competency is validated in this section. By comparing the suggested THRO optimization’s performance to that of other optimization procedures from the literature, such as DOA and WUTP, its efficacy and performance are verified. The comparison is carried out by adjusting the intended regulator parameters to boost the frequency regulation capability of the power system under consideration, which compromises two regions that are each supplied with different types of energy. The first region receives the step load disturbance (SLD) with a 1% value. To ensure a fair comparison, identical optimization settings were employed across all three algorithms (THRO, DOA, and WUTP). Each algorithm was evaluated using a maximum of 200 iterations with 30 search agents. All computational experiments were performed on a workstation equipped with an Intel Core i9-13900K processor (3.0 GHz base, 5.8 GHz boost), 64 GB DDR5 RAM, operating under Windows 11 Professional (64-bit). The optimization algorithms were implemented in MATLAB/Simulink R2024b, with system dynamics numerically integrated using the ODE15s stiff solver configured with a variable time step and a maximum step size of 1 × 10 5 . All simulations were executed in normal simulation mode. The convergence characteristics curve for the three methods is described in Figure 16. The THRO approach has a higher convergence rate than other algorithms when compared to the efficacy of DOA and WUTP. Among all optimization methods, the THRO optimizer stands out for its exceptional performance, achieving the lowest fitness function value of 0.0331. In comparison, the WUTP and DOA algorithms had fitness function values of 0.0345 and 0.0454, respectively.

5.2. Simulation Outcomes

Through simulation results obtained using the computer program MATLAB/Simulink, the effectiveness of the proposed controller in enhancing the performance of the examined power system with various power sources is assessed. The simulation is configured according to the methodology outlined as follows:
  • Case (1): Analysing the electricity grid’s dynamic response under the impact of step load disturbance (SLD).
  • Case (2): Analysing the electricity grid’s dynamic response under the impact of multi-step load disturbance (MSLD).
  • Case (3): Analysing the dynamic reaction of the power grid under the impact of random load disturbance (RLD).
  • Case (4): Analysing the dynamic reaction of the power grid under penetration of renewable energy sources (RESs).
  • Case (5): Sensitivity analysis.

5.2.1. Case (1): Analysing the Electricity Grid’s Dynamic Response Under the Impact of SLD

The present section examines the power system under inquiry by subjecting it to a 1% step load disturbance (SLD) that is supplied to the first area after a duration of 5 s. It can be noted that a simulation time of 50 s has been used in this specific case. Simulating SLD in the electrical system can be achieved by selectively disconnecting specific generators, causing interruptions brought on by the loss of each station’s generators. Moreover, in this particular case, we compare the performance effectiveness of the presented PIDD2-TD regulator, which has been optimized using the THRO methodology, with that of other controllers such as the PID-TID and PIDD2-PD regulators, which have also been optimized using the same technique. The parameters pertaining to the controllers that have been considered in this section are presented in Table 2. Moreover, Table 3 summarizes the search space range of these parameters during the optimization process. The dynamics of the system exhibits an initial deterioration in response to step load disruptions, as seen in the data presented in Table 4 and Figure 17. When it comes to mitigating system oscillations, employing the THRO strategy to enhance the PIDD2-TD regulator is more advantageous compared to utilizing the PID-TID and PIDD2-PD controllers that have been upgraded using the same technique. The PIDD2-TD regulator suggested in this study, which was optimized using the THRO approach, exhibits the most favourable objective function in terms of the Integral Time Square Error (ITSE) and demonstrates the lowest values for overshoot, undershoot, and settling time compared to the other two regulators. According to Table 4, it can be observed that for Δf1, the proposed PIDD2-TD regulator achieves a 76% and 63% reduction in overshoot compared to the PID-TID and PIDD2-PD regulators, respectively. Similarly, the proposed controller exhibits a 19% and 34% reduction in undershoot and a 26% and 11% decrease in settling time relative to the PID-TID and PIDD2-PD regulators, respectively.

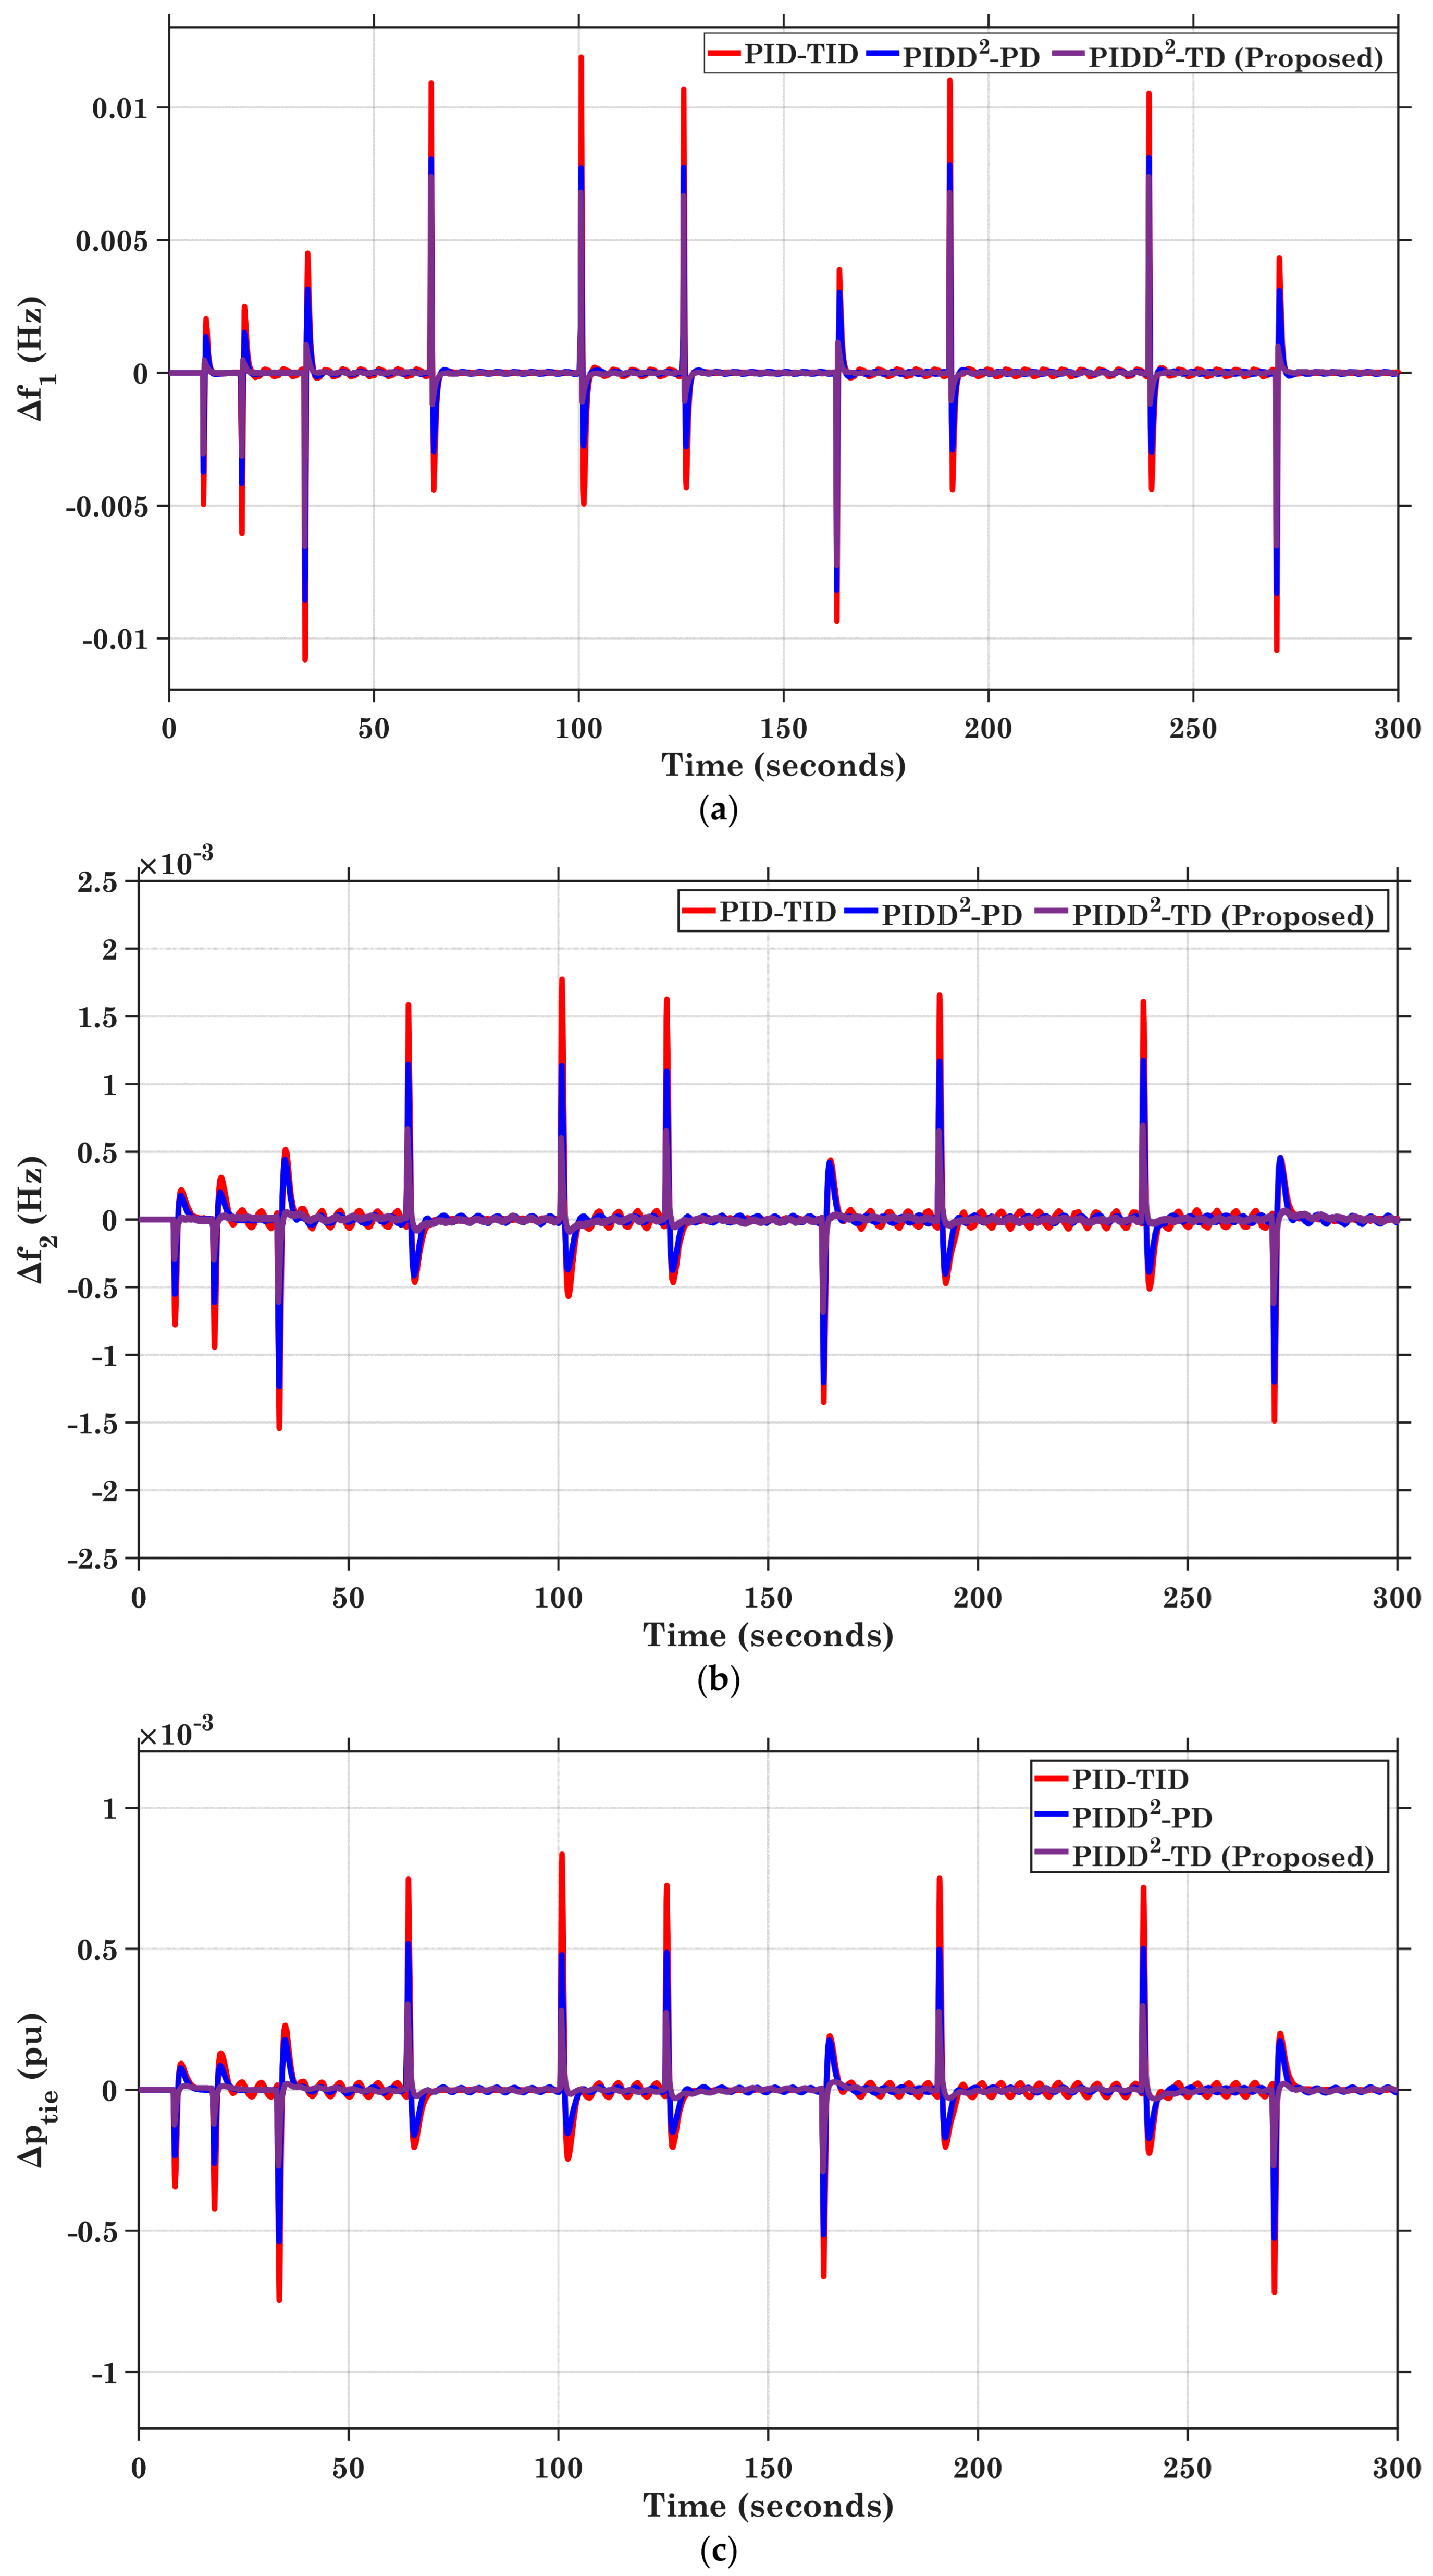
5.2.2. Case (2): Analysing the Electricity Grid’s Dynamic Response Under the Impact of MSLD

Herein, the dual-area power grid under consideration is exposed to multi-step load disturbance (MSLD) in order to replicate a load fluctuation that occurs in real-world scenarios. MSLD is visually seen in Figure 18. MSLD is a term used to describe a series of forced generator shutdowns or an unforeseen fluctuation in electrical loads. It is worth noting that the simulation time of this case and all upcoming cases is 300 s. The efficacy of the suggested PIDD2-TD regulator, optimized using the THRO methodology, has been assessed and appraised by the incorporation of a sequence of load modifications in the initial domain, followed by a comparative analysis with alternative control methodologies. The dynamics of the studied system is seen in Figure 19. Table 5 presents the shown dynamic response of the power supply within the specified region. Consequently, the recommended PIDD2-TD controller exhibits the lowest values for undershoot, overshoot, and settling time. The suggested PIDD2-TD regulator exhibits improved performance compared to previous controllers optimized using the THRO method in terms of achieving a higher reduction in system frequency fluctuations and the tie line’s electricity flow in this specific scenario. As a result, the implementation of the PIDD2-TD enhances the overall dependability of the system.

5.2.3. Case (3): Analysing the Dynamic Reaction of the Power Grid Under the Impact of RLD

The term “RLD” refers to a heterogeneous assortment of numerous interruptions, which may be exemplified by industrial loads that are connected to an interconnected power network. This description is based on the evaluation of the superiority of the suggested PIDD2-TD regulator in the two preceding situations. The initial segment seen in Figure 20 experiences random load disturbances. The dynamics of the system for this section is likewise depicted in Figure 21, utilizing a range of control strategies such as PIDD2-PD and PID-TID controllers based on the THRO. The performance characteristics of the system have been succinctly presented in Table 6. The PIDD2-TD controller, which is proposed based on the THRO approach, demonstrates favorable performance in effectively handling both rapid and gradual changes in load. Furthermore, comparative analysis reveals that the suggested controller outperforms both the PIDD2-PD and PID-TID regulators in terms of performance. It is evident that the system rapidly attenuates oscillations, exhibits little undershoot and overshoot, and enhances the overall quality of control. This observation highlights the reliability of the THRO-based PIDD2-PD controller in the context of LFC.

5.2.4. Case (4): Analysing the Dynamic Reaction of the Power Grid Under Penetration of RES

This case study elucidates the dynamic characteristics of the power grid depicted in Figure 2 with respect to the disturbances produced by RESs, as seen in Figure 4 and Figure 6. The system employs several control strategies, including PIDD2-PD, PID-TID, and PIDD2-TD regulators based on the THRO approach. The photovoltaic solar unit, which has a power rating of 50 MW, is inserted into the first region at a time of 250 s. Additionally, the wind unit, with a nominal power of 70 MW, is inserted into the second region at a time of 100 s. Figure 22 describes the dynamics response of the power grid, specifically showcasing the frequency deviation of the grid (∆f1 and ∆f2), the changes in tie-line power generated from series load disruptions, and the integration of RESs within this particular scenario. Significant fluctuations in tie-line power, both in terms of frequency and flow, are seen over the whole duration of RES’s connection, as depicted in Figure 22. Table 7 displays the synopsis of the dynamic behavior of the power network. The proposed PIDD2-TD controller has the potential to effectively mitigate fluctuations in frequency and tie-line power flow. Furthermore, when rivaled with the PID-TID and PIDD2-PD regulators, this particular controller has the lowest magnitudes for overshoot, undershoot, and settling time while also demonstrating superior convergence properties.

5.2.5. Case (5): Sensitivity Analysis

Sensitivity is the capability of a system to retain stability when its parameters are altered within a specific tolerance range. In this section, the proposed PIDD2-TD controller’s optimal settings from scenario (1) are used to evaluate the power grid’s resilience by adjusting system parameters, including τ r h , τ r ,   T l i n e , X g ,   Y g , τ c d , and τ f c , from their typical values within ± 25 % . The dynamics of the explored system is listed in Table 8 for the scenario of 1% SLD in the first region under both nominal and variable circumstances. It is feasible to see that Δf1, Δf2, and ΔPtie responses are not significantly impacted when the aforementioned parameters are altered. It is worth noting that no adjustments to the other system attributes have any impact on the recommended system’s dynamic performance. The THRO-based PIDD2-TD controller that was introduced as a result of this is trustworthy and exhibits a high level of efficacy in maintaining system reliability even when system parameters are changed.

6. Conclusions

This research presents the development of a novel controller architecture, the combined PIDD2-TD regulator, aimed at enhancing frequency stability in the dual-area hybrid power system considered, which integrates conventional power plants and renewable energy sources within each region. The scientific originality of this work lies in the design and implementation of the PIDD2-TD regulator, which synergistically combines proportional–integral–derivative and second-derivative control actions, and its integration with the THRO, DOA, and WUTP algorithms to optimize controller parameters for faster response and improved system performance. The THRO algorithm, in particular, contributes to enhanced tuning efficiency and reduced response times compared to conventional optimization approaches. A comprehensive comparative analysis demonstrates that the proposed PIDD2-TD regulator significantly outperforms PID-TID and PIDD2-PD regulators across a variety of operating conditions.
This study systematically evaluates the controller’s effectiveness in mitigating load frequency control challenges under diverse load patterns, disturbances from renewable energy sources, and variations in system parameters. Multiple scenarios were considered to thoroughly assess the robustness and adaptability of the proposed controller. The results indicate that the PIDD2-TD regulator consistently improves system stability, enhances dynamic response, and strengthens the network’s resilience to disturbances. Furthermore, the regulator exhibits superior performance in addressing transient and steady-state deviations, highlighting its potential as a flexible and adaptive solution for modern hybrid power systems.
Based on these findings, it can be concluded that the proposed PIDD2-TD regulator not only demonstrates competitive performance in mitigating frequency deviations and disturbances but also represents a significant scientific contribution by introducing a novel controller structure, an advanced optimization approach, and a systematic validation methodology. The demonstrated superiority of the PIDD2-TD regulator establishes it as an effective and innovative approach for improving frequency regulation, dynamic performance, and overall reliability in hybrid power networks.

7. Limitations and Future Trends

Although the proposed controller exhibits commendable performance, several limitations must be recognized, presenting opportunities for further exploration. The controller has primarily been assessed under a limited range of operating conditions. Conversely, real power systems experience significantly more intricate, dynamic, and unpredictable disturbances. Future research should validate the controller’s performance across various real-time scenarios to ensure broader applicability, including large-scale grid deployments and exposure to multiple disruption vectors, especially cyberattacks and coordinated malicious intrusions. The application of the THRO approach significantly increases computational complexity, particularly in adjusting the various parameters associated with the PIDD2-TD structure. This may constrain its implementation in systems with limited processing capabilities, underscoring the necessity for effective parameter optimization strategies. Future endeavours may investigate lightweight or real-time optimization methods, along with hardware-accelerated solutions, to reduce latency and improve scalability.
Extending the existing framework to include extensive interconnected power networks and distributed energy resource systems constitutes a significant research avenue. Integrating robust cyber–physical security measures and adaptive or real-time control strategies will enhance resilience against emerging operational threats. Improving the controller’s resilience against parameter uncertainty is essential; methodologies such as uncertainty modelling, interval analysis, Monte Carlo simulations, and sophisticated robust control techniques (e.g., H-infinity, μ-synthesis) should be evaluated. Furthermore, incorporating artificial intelligence (AI)-based control paradigms, including predictive control, reinforcement learning, or hybrid metaheuristic optimization, could substantially enhance the controller’s adaptability to swiftly evolving grid conditions. Ultimately, validating the proposed control strategy on real-time hardware-in-the-loop platforms such as OPAL-RT or dSPACE will yield essential insights into its practical feasibility, performance under real-world conditions, and the challenges related to implementation in contemporary smart grid infrastructures.

Author Contributions

Conceptualization, M.H.A., M.A.I. and K.M.A.; Methodology, M.H.A., M.A.I. and K.M.A.; Software, M.H.A., M.A.I. and K.M.A.; Validation, M.H.A. and K.M.A.; Formal analysis, M.H.A., M.A.I. and K.M.A.; Investigation, K.M.A.; Resources, A.H.-E., A.I.M., M.A.I. and K.M.A.; Data curation, A.I.M., A.H.-E., M.A.I. and K.M.A.; Writing—original draft, A.I.M. and K.M.A.; Writing—review & editing, A.I.M., A.H.-E. and K.M.A.; Visualization, A.I.M., A.H.-E. and K.M.A.; Supervision, A.I.M., A.H.-E. and K.M.A.; Project administration, A.H.-E., K.M.A.; Funding acquisition, K.M.A. All authors have read and agreed to the published version of the manuscript.

Funding

This research received no external funding.

Data Availability Statement

The original contributions presented in this study are included in the article. Further inquiries can be directed to the corresponding author.

Conflicts of Interest

The authors declare no conflicts of interest.

Nomenclature

EVElectric vehicleΔf1, Δf2Frequency variations
PVPhotovoltaicΔPtieFluctuation of tie-line power
TDTilt derivativeSLDStep load disturbance
PIDD2Proportional–integral–derivative with second derivativeMSLDMulti-step load disturbance
DOADhole optimization algorithmRLDRandom load disturbance
WUTPWater uptake and transport in plantsSCASine cosine algorithm
THROTianji’s horse racing optimizationAGCAutomated generation control
RESsRenewable energy sourcesTCSCThyristor-controlled series capacitor
LFCLoad frequency controlWCAWater cycle approach
V2GVehicle-to-gridGDBGovernor deadband
ANNsArtificial neural networksGRCGeneration rate constraint
GAGenetic algorithmSOCState of charge
CTDsCommunication time delaysITSEIntegral time squared error
ICSImperialist competitive searchFFFitness function
FLCFuzzy logic controllerJSOJellyfish search optimization
CPSOChaotic particle swarm optimizerPSOParticle swarm optimization
PFAPathfinder algorithmAIArtificial intelligence

Appendix A. The Studied Power System Parameters’ Values

ParameterNominal ValueParameter Definition
τ s g 0.08 sGovernor time constant
k r 0.3 sGain of reheater steam turbine
τ r 10.2 sThe time constant of reheater steam turbine
τ t 0.3 sSteam turbine time constant
τ g h 0.2 sSpeed governor time constant of hydro turbine
τ r s 4.9 sHydro turbine speed governor reset time
τ r h 28.749 sTime constant of the transient droop
τ w 1.1 sNominal string time of water in penstock
b g 0.049 sGas turbine constant of valve positioner
c g 1Gas turbine valve positioner
x c 0.6 sGovernor lead time constant for a gas turbine
y c 1.1 sGovernor lag time constant for a gas turbine
τ c r 0.01 sDelay in the combustion response time of a gas turbine
τ f c 0.239 sGas turbine fuel time constant
τ c d 0.2 sConstant discharge volume-time for gas turbine compressor
k p s 68.965Power system gains
τ p s 1 11.49 sPower system time constants
T l i n e 0.0433 MWCoefficient of synchronizing
k E V ( a ) , k E V ( b ) 1Gains of EVs
τ E V ( a ) , τ E V ( b ) 0.28 sTime constants of EVs
B a , B b 0.431, 0.431 MW/HzFrequency bias coefficients
R 2.4 Hz/MWConstant governor regulation of speed for thermal, hydro, and gas units
P F h y d , P F g , P F T h 0.2873, 0.138, 0.5747Participation factors for hydro, gas and thermal units
GRC with Hydro--------0.045 pu.MW/s and 0.06 pu.MW/s for both rising and decreasing rates, respectively
GRC with Thermal--------The GRC for the thermal unit is set (0.0017 pu.MW/s) for rising and decreasing rates

References

  1. Khudhair, M.; Ragab, M.; AboRas, K.M.; Abbasy, N.H. Robust Control of Frequency Variations for a Multi-Area Power System in Smart Grid Using a Newly Wild Horse Optimized Combination of PIDD2 and PD Controllers. Sustainability 2022, 14, 8223. [Google Scholar] [CrossRef]
  2. Hassan, M.; Aly, A.; Elmelegi, M.; Nasrat, L.; Watanabe, M.; Mohamed, E.A. Optimal Frequency Control of Multi-Area Hybrid Power System Using New Cascaded TID-PIλDμN Controller Incorporating Electric Vehicles. Fractal Fract. 2022, 6, 548. [Google Scholar] [CrossRef]
  3. Xiao, A.; Chen, H.; Wei, C.; Bai, X. Statistical Measure for Risk-Seeking Stochastic Wind Power Offering Strategies in Electricity Markets. J. Mod. Power Syst. Clean Energy 2021, 10, 1437–1442. [Google Scholar] [CrossRef]
  4. Gulzar, M.M.; Murawwat, S.; Sibtain, D.; Shahid, K.; Javed, I.; Gui, Y. Modified Cascaded Controller Design Constructed on Fractional Operator ‘β’ to Mitigate Frequency Fluctuations for Sustainable Operation of Power Systems. Energies 2022, 15, 7814. [Google Scholar] [CrossRef]
  5. Zhang, P.; Daraz, A.; Malik, S.A.; Sun, C.; Basit, A.; Zhang, G. Multi-Resolution Based PID Controller for Frequency Regulation of a Hybrid Power System with Multiple Interconnected Systems. Front. Energy Res. 2023, 10, 1109063. [Google Scholar] [CrossRef]
  6. Khairalla, A.G.; Kotb, H.; AboRas, K.M.; Ragab, M.; ElRefaie, H.B.; Ghadi, Y.Y.; Yousef, A. Enhanced Control Strategy and Energy Management for a Photovoltaic System with Hybrid Energy Storage Based on Self-Adaptive Bonobo Optimization. Front. Energy Res. 2023, 11, 1283348. [Google Scholar] [CrossRef]
  7. Zaid, S.A.; Bakeer, A.; Magdy, G.; Albalawi, H.; Kassem, A.M.; El-Shimy, M.E.; AbdelMeguid, H.; Manqarah, B. A New Intelligent Fractional-Order Load Frequency Control for Interconnected Modern Power Systems with Virtual Inertia Control. Fractal Fract. 2023, 7, 62. [Google Scholar] [CrossRef]
  8. Khooban, M.H.; Niknam, T.; Blaabjerg, F.; Dragičević, T. A New Load Frequency Control Strategy for Micro-Grids with Considering Electrical Vehicles. Electr. Power Syst. Res. 2017, 143, 585–598. [Google Scholar] [CrossRef]
  9. Margaris, D.; Papathanassiou, S.A.; Hatziargyriou, N.D.; Hansen, A.D.; Sørensen, P. Frequency Control in Autonomous Power Systems with High Wind Power Penetration. IEEE Trans. Sustain. Energy 2012, 3, 189–199. [Google Scholar] [CrossRef]
  10. Kerscher, S.; Arboleya, P. The Key Role of Aggregators in the Energy Transition Under the Latest European Regulatory Framework. Int. J. Electr. Power Energy Syst. 2022, 134, 107103. [Google Scholar] [CrossRef]
  11. Zhu, X.; Xia, M.; Chiang, H.D. Coordinated Sectional Droop Charging Control for EV Aggregator Enhancing Frequency Stability of Microgrid with High Penetration of Renewable Energy Sources. Appl. Energy 2018, 210, 936–943. [Google Scholar] [CrossRef]
  12. Maghami, M.R.; Thang, K.F.; Mutambara, A.G.; Firoozi, A.A.; Yaghoubi, E.; Jahromi, M.Z.; Yaghoubi, E. Optimized Planning of Electric Vehicle Charging Infrastructure for Grid Performance Improvement. Discov. Sustain. 2025, 6, 706. [Google Scholar] [CrossRef]
  13. Zheng, Y.; Shang, Y.; Shao, Z.; Jian, L. A Novel Real-Time Scheduling Strategy with Near-Linear Complexity for Integrating Large-Scale Electric Vehicles into Smart Grid. Appl. Energy 2018, 217, 1–13. [Google Scholar] [CrossRef]
  14. Liu, H.; Hu, Z.C.; Song, Y.H.; Lin, J. Decentralized Vehicle-to-Grid Control for Primary Frequency Regulation Considering Charging Demands. IEEE Trans. Power Syst. 2013, 28, 3480–3489. [Google Scholar] [CrossRef]
  15. Alharbi, M.; Ragab, M.; AboRas, K.M.; Kotb, H.; Dashtdar, M.; Shouran, M.; Elgamli, E. Innovative AVR-LFC Design for a Multi-Area Power System Using Hybrid Fractional-Order PI and PIDD2 Controllers Based on Dandelion Optimizer. Mathematics 2023, 11, 1387. [Google Scholar] [CrossRef]
  16. AboRas, K.M.; Ragab, M.; Shouran, M.; Alghamdi, S.; Kotb, H. Voltage and Frequency Regulation in Smart Grids via a Unique Fuzzy PIDD2 Controller Optimized by Gradient-Based Optimization Algorithm. Energy Rep. 2023, 9, 1201–1235. [Google Scholar] [CrossRef]
  17. Alghamdi, S.; Alqarni, M.; Hammad, M.R.; AboRas, K.M. First-of-Its-Kind Frequency Enhancement Methodology Based on an Optimized Combination of FLC and TFOIDFF Controllers Evaluated on EVs, SMES, and UPFC-Integrated Smart Grid. Fractal Fract. 2023, 7, 807. [Google Scholar] [CrossRef]
  18. Yogendra, A.; Narendra, K. BFOA-Scaled Fractional Order Fuzzy PID Controller Applied to AGC of Multi-Area Multi-Source Electric Power Generating Systems. Swarm Evol. Comput. 2017, 32, 202–218. [Google Scholar]
  19. Sahu, R.K.; Panda, S.; Biswal, A.; Sekhar, G.C. Design and Analysis of Tilt Integral Derivative Controller with Filter for Load Frequency Control of Multi-Area Interconnected Power Systems. ISA Trans. 2016, 61, 251–264. [Google Scholar] [CrossRef]
  20. Malik, S.; Suhag, S. A Novel SSA Tuned PI-TDF Control Scheme for Mitigation of Frequency Excursions in Hybrid Power System. Smart Sci. 2020, 8, 202–218. [Google Scholar] [CrossRef]
  21. Elmelegi, A.; Mohamed, E.A.; Aly, M.; Ahmed, E.M.; Mohamed, A.A.A.; Elbaksawi, O. Optimized Tilt Fractional Order Cooperative Controllers for Preserving Frequency Stability in Renewable Energy-Based Power Systems. IEEE Access 2021, 9, 8261–8277. [Google Scholar] [CrossRef]
  22. Arya, Y. A New Optimized Fuzzy FOPI-FOPD Controller for Automatic Generation Control of Electric Power Systems. J. Franklin Inst. 2019, 356, 5611–5629. [Google Scholar] [CrossRef]
  23. Paliwal, N.; Srivastava, L.; Pandit, M. Application of Grey Wolf Optimization Algorithm for Load Frequency Control in Multi-Source Single Area Power System. Evol. Intell. 2020, 15, 563–584. [Google Scholar] [CrossRef]
  24. Ayas, M.S.; Sahin, E. FOPID Controller with Fractional Filter for an Automatic Voltage Regulator. Comput. Electr. Eng. 2021, 90, 106895. [Google Scholar] [CrossRef]
  25. Zamani, A.-A.; Shafiee, M.; Sajadinia, M. Optimal Self-Tuning Fractional Order Fuzzy Load Frequency Control Considering Sustainable Energy Sources and Electric Vehicle. Int. J. Ambient Energy 2023, 44, 2170–2184. [Google Scholar] [CrossRef]
  26. Gong, X.; Yang, K.; Dong, X.; Jiang, X.; Liu, D.; Luo, Z. Fractional Order PID Optimal Control Method of Regional Load Frequency Containing Pumped Storage Plants. Energies 2023, 16, 1703. [Google Scholar] [CrossRef]
  27. Karnavas, Y.L.; Nivolianiti, E. Optimal Load Frequency Control of a Hybrid Electric Shipboard Microgrid Using Jellyfish Search Optimization Algorithm. Appl. Sci. 2023, 13, 6128. [Google Scholar] [CrossRef]
  28. Yousri, D.; Babu, T.S.; Fathy, A. Recent Methodology-Based Harris Hawks Optimizer for Designing Load Frequency Control Incorporated in Multi-Interconnected Renewable Energy Plants. Sustain. Energy Grids Netw. 2020, 22, 100352. [Google Scholar] [CrossRef]
  29. Daraz, A.; Malik, S.A.; Azar, A.T.; Aslam, S.; Alkhalifah, T.; Alturise, F. Optimized Fractional Order Integral-Tilt Derivative Controller for Frequency Regulation of Interconnected Diverse Renewable Energy Resources. IEEE Access 2022, 10, 43514–43527. [Google Scholar] [CrossRef]
  30. Oshnoei, A.; Khezri, R.; Muyeen, S.M.; Oshnoei, S.; Blaabjerg, F. Automatic Generation Control Incorporating Electric Vehicles. Electr. Power Compon. Syst. 2019, 47, 720–732. [Google Scholar] [CrossRef]
  31. Magdy, G.; Bakeer, A.; Nour, M.; Petlenkov, E. A New Virtual Synchronous Generator Design Based on the SMES System for Frequency Stability of Low-Inertia Power Grids. Energies 2020, 13, 5641. [Google Scholar] [CrossRef]
  32. Arya, Y. Impact of Ultra-Capacitor on Automatic Generation Control of Electric Energy Systems Using an Optimal FFOID Controller. Int. J. Energy Res. 2019, 43, 8765–8778. [Google Scholar] [CrossRef]
  33. Priyadarshani, S.; Subhashini, K.R.; Satapathy, J.K. Path Finder Algorithm Optimized Fractional Order Tilt-Integral-Derivative (FOTID) Controller for Automatic Generation Control of Multi-Source Power System. Microsyst. Technol. 2021, 27, 23–35. [Google Scholar] [CrossRef]
  34. Daraz, A.; Malik, S.A.; Basit, A.; Aslam, S.; Zhang, G. Modified FOPID Controller for Frequency Regulation of a Hybrid Interconnected System of Conventional and Renewable Energy Sources. Fractal Fract. 2023, 7, 89. [Google Scholar] [CrossRef]
  35. Arya, Y. Impact of Hydrogen Aqua Electrolyzer-Fuel Cell Units on Automatic Generation Control of Power Systems with a New Optimal Fuzzy TIDFII Controller. Renew. Energy 2019, 139, 468–482. [Google Scholar] [CrossRef]
  36. Mohamed, E.A.; Aly, M.; Watanabe, M. New Tilt Fractional-Order Integral Derivative with Fractional Filter (TFOIDFF) Controller with Artificial Hummingbird Optimizer for LFC in Renewable Energy Power Grids. Mathematics 2022, 10, 3006. [Google Scholar] [CrossRef]
  37. Khudhair, M.; Ragab, M.; AboRas, K.M.; Abbasy, N.H. A Newly Resilient Combination of PIDD2 and PD Controllers to Boost the Frequency Response in a Two-Area Hybrid Power System with Nonlinearities Using Wild Horse Optimizer. In Proceedings of the 2022 International Conference on Electrical, Computer and Energy Technologies (ICECET), Prague, Czech Republic, 20–22 July 2022; pp. 1–11. [Google Scholar]
  38. Latif, A.; Hussain, S.M.S.; Das, D.C.; Ustun, T.S. Optimum Synthesis of a BOA Optimized Novel Dual-Stage PI-(1+ID) Controller for Frequency Response of a Microgrid. Energies 2020, 13, 3446. [Google Scholar] [CrossRef]
  39. Arya, Y.; Kumar, N.; Dahiya, P.; Sharma, G.; Çelik, E.; Dhundhara, S.; Sharma, M. Cascade-IDN Controller Design for AGC of Thermal and Hydro-Thermal Power Systems Integrated with Renewable Energy Sources. IET Renew. Power Gener. 2021, 15, 504–520. [Google Scholar] [CrossRef]
  40. Yang, H.; Jiang, Y.; Yin, S. Adaptive Fuzzy Fault-Tolerant Control for Markov Jump Systems with Additive and Multiplicative Actuator Faults. IEEE Trans. Fuzzy Syst. 2021, 29, 772–785. [Google Scholar] [CrossRef]
  41. Yang, H.; Yin, S.; Kaynak, O. Neural Network-Based Adaptive Fault-Tolerant Control for Markovian Jump Systems with Nonlinearity and Actuator Faults. IEEE Trans. Syst. Man Cybern. Syst. 2021, 51, 3687–3698. [Google Scholar] [CrossRef]
  42. Ginidi, A.; Elattar, E.; Shaheen, A.; Elsayed, A.; El-Sehiemy, R.; Dorrah, H. Optimal Power Flow Incorporating Thyristor-Controlled Series Capacitors Using the Gorilla Troops Algorithm. Int. Trans. Electr. Energy Syst. 2022, 2022, 8344749. [Google Scholar] [CrossRef]
  43. El-Ela, A.A.A.; El-Sehiemy, R.A.; Shaheen, A.M.; Diab, M.A.I.-G. Enhanced Coyote Optimizer-Based Cascaded Load Frequency Controllers in Multi-Area Power Systems with Renewable. Neural Comput. Appl. 2021, 33, 8459–8477. [Google Scholar] [CrossRef]
  44. Kalyan, C.N.S.; Goud, B.S.; Reddy, C.R.; Ramadan, H.S.; Bajaj, M.; Ali, Z.M. Water Cycle Algorithm Optimized Type II Fuzzy Controller for Load Frequency Control of a Multi-Area, Multi-Fuel System with Communication Time Delays. Energies 2021, 14, 5387. [Google Scholar] [CrossRef]
  45. Elkasem, M.H.A.; Khamies, M.; Magdy, G.; Taha, I.B.M.; Kamel, S. Frequency Stability of AC/DC Interconnected Power Systems with Wind Energy Using Arithmetic Optimization Algorithm-Based Fuzzy-PID Controller. Sustainability 2021, 13, 12095. [Google Scholar] [CrossRef]
  46. Gupta, D.K.; Soni, A.K.; Jha, A.V.; Mishra, S.K.; Appasani, B.; Srinivasulu, A.; Bizon, N.; Thounthong, P. Hybrid Gravitational–Firefly Algorithm-Based Load Frequency Control for Hydrothermal Two-Area System. Mathematics 2021, 9, 712. [Google Scholar] [CrossRef]
  47. Hossam-Eldin, A.; Negm, E.; Ragab, M.; AboRas, K.M. A Maiden Robust FPIDD2 Regulator for Frequency-Voltage Enhancement in a Hybrid Interconnected Power System Using Gradient-Based Optimizer. Alex. Eng. J. 2023, 65, 103–118. [Google Scholar] [CrossRef]
  48. Wang, C.; Du, H.; Zhang, Z.; Hu, G.; Mirjalili, S.; Khodadadi, N.; Hussien, A.G.; Liao, Y.; Zhao, W. Tianji’s Horse Racing Optimization (THRO): A New Metaheuristic Inspired by Ancient Wisdom and Its Engineering Optimization Applications. Artif. Intell. Rev. 2025, 58, 282. [Google Scholar] [CrossRef]
  49. Oveis, B.; Aghdasi, H.S.; Salehpour, P. Dhole Optimization Algorithm: A New Metaheuristic Algorithm for Solving Optimization Problems. Cluster Comput. 2025, 28, 430. [Google Scholar]
  50. Braik, M.; Al-Hiary, H. A Novel Meta-Heuristic Optimization Algorithm Inspired by Water Uptake and Transport in Plants. Neural Comput. Appl. 2025, 37, 13643–13724. [Google Scholar] [CrossRef]
  51. Pahadasingh, S. TLBO Based CC-PID-TID Controller for Load Frequency Control of Multi Area Power System. In Proceedings of the 2021 1st Odisha International Conference on Electrical Power Engineering, Communication and Computing Technology (ODICON), Bhubaneswar, India, 8–9 January 2021; pp. 1–7. [Google Scholar]
  52. Parmar, K.P.S.; Majhi, S.; Kothari, D.P. LFC of an Interconnected Power System with Thyristor Controlled Phase Shifter in the Tie Line. Int. J. Comput. Appl. 2012, 41, 27–30. [Google Scholar] [CrossRef]
  53. Morsali, J.; Zare, K.; Hagh, M.T. Comparative Performance Evaluation of Fractional Order Controllers in LFC of Two-Area Diverse-Unit Power System with Considering GDB and GRC Effects. J. Electr. Syst. Inf. Technol. 2018, 5, 708–722. [Google Scholar] [CrossRef]
  54. Kalyan, C.N.S.; Suresh, C.V. PIDD Controller for AGC of Nonlinear System with PEV Integration and AC-DC Links. In Proceedings of the 2021 International Conference on Sustainable Energy and Future Electric Transportation (SEFET), Hyderabad, India, 21–23 January 2021; pp. 1–6. [Google Scholar]
  55. Ahmed, M.; Magdy, G.; Khamies, M.; Kamel, S. Modified TID Controller for Load Frequency Control of a Two-Area Interconnected Diverse-Unit Power System. Int. J. Electr. Power Energy Syst. 2022, 135, 107528. [Google Scholar] [CrossRef]
Figure 1. The transfer function representation of the studied dual-area power grid with several conventional sources (thermal, hydro, and gas) incorporating the proposed controller.
Processes 13 03529 g001
Figure 2. Block diagram of the two-area hybrid microgrid system equipped with RESs. Area 1 includes a PV system and an EV model, while Area 2 contains a wind system and an EV model.
Processes 13 03529 g002
Figure 3. Wind unit modelling representation.
Processes 13 03529 g003
Figure 4. The variation in wind farm output power.
Processes 13 03529 g004
Figure 5. PV unit modelling representation.
Processes 13 03529 g005
Figure 6. The variation in solar output power.
Processes 13 03529 g006
Figure 7. Strategic horse race plan of Tianji, illustrating the core idea of the THRO algorithm in transforming disadvantages into overall optimization advantages.
Processes 13 03529 g007
Figure 8. THRO competition approach in Scenario 1, where Tianji’s slowest horse wins and is updated based on the fastest horse’s traits and the population performance gap.
Processes 13 03529 g008
Figure 9. THRO competition approach in Scenario 2, where Tianji’s weakest horse is strategically sacrificed against the king’s strongest, followed by replacement using a randomly selected horse to preserve diversity.
Processes 13 03529 g009
Figure 10. THRO competition approach in Scenario 3, where Tianji’s fastest horse secures victory and is updated using the top-performing horse to reinforce exploitation and maintain optimization superiority.
Processes 13 03529 g010
Figure 11. THRO competition approach in Scenario 4, where Tianji’s slowest horse is strategically used against the king’s strongest, followed by random replacement to preserve diversity and exploration capability.
Processes 13 03529 g011
Figure 12. THRO competition approach in Scenario 5, where Tianji’s weakest horse matches the king’s lowest-ranked and fastest horses, and his slowest is deliberately raced against the king’s strongest.
Processes 13 03529 g012
Figure 13. Flowchart of the THRO.
Processes 13 03529 g013
Figure 14. Combined regulator schematic representation illustrating the integrated controller structure, where disturbance mitigation influences the overall control performance.
Processes 13 03529 g014
Figure 15. Structure of the suggested PIDD2-TD controller tuned by the THRO algorithm.
Processes 13 03529 g015
Figure 16. Convergence curves of the compared algorithms including DOA, WUTP, and THRO techniques.
Processes 13 03529 g016
Figure 17. Power grid dynamics for case (1): (a) Δf1, (b) Δf2, and (c) ΔPtie.
Processes 13 03529 g017aProcesses 13 03529 g017b
Figure 18. Multi-step load variation pattern.
Processes 13 03529 g018
Figure 19. Power grid dynamics for case (2): (a) Δf1, (b) Δf2, and (c) ΔPtie.
Processes 13 03529 g019
Figure 20. Random load variation pattern.
Processes 13 03529 g020
Figure 21. Power grid dynamics for case (3): (a) Δf1, (b) Δf2, and (c) ΔPtie.
Processes 13 03529 g021
Figure 22. Power grid dynamics for case (4): (a) Δf1, (b) Δf2, and (c) ΔPtie.
Processes 13 03529 g022aProcesses 13 03529 g022b
Table 1. The value of the coefficients of the wind power plant.
CoefficientValueCoefficientValue
P W 750   k W C 2 116
V W 15   m / s C 3 0.4
r T 22.9   m C 4 0
ρ 1.225   k g / m 3 C 5 5
A T 1684   m 2 C 6 21
λ T 22.5   r p m C 7 0.1405
C 1 0.6175
Table 2. The optimal values of different controller gains under case (1).
AREA 1
Controller K P 1 K I 1 K D 1 K D D 1 N D 1 N D D 1 k t 1 n 1 k p 1 k i 1 k d 1 n f 1
PIDD2-PD49.0665010.7330.104100366----38.475--1.49386.649
PID-TID50049.929------49.9992.674--02.622--
PIDD2-TD (Proposed)49.06749.95932.8890.121495498508.9732----39.013--
AREA 2
Controller K P 2 K I 2 K D 2 K D D 2 N D 2 N D D 2 k t 2 n 2 k p 2 k i 2 k d 2 n f 2
PIDD2-PD48.627010.7050.3367490499----49.998--0.559150
PID-TID35.8350.0026.215------49.2419.844--9.47734.938--
PIDD2-TD (Proposed)48.627049.9910.005459102508.349----5.614--
Table 3. Parameter search space defining the bounds of controllers’ gains during optimization process.
ParameterLower BoundUpper BoundParameterLower BoundUpper Bound
k p 050 K I 050
k i 050 K D 050
k d 050 K D D 01
k t 050 N D D 100500
N D 100500 n 110
K P 050 n f 50300
Table 4. Dynamic system characteristics under effect of case (1).
ControllerΔf1 (Hz)Δf2 (Hz)ΔPtie (pu)
Max.
OS
Max.
US
Set-Time (s)Max.OSMax.
US
Set-Time (s)Max.
OS
Max.
US
Set-
Time (s)
PIDD2-TD (THRO)0.000480.0031.70.000170.000544.60.000010.000123.4
PID-TID (THRO)0.0020.00372.30.000210.000785.90.000070.000234.8
PIDD2-PD (THRO)0.00130.00451.90.000230.000545.70.000090.000236.8
Table 5. Dynamic system characteristics under effect of case (2).
ControllerΔf1 (Hz)Δf2 (Hz)ΔPtie (pu)
Max.
OS
MAX.
US
Set-Time (s)Max.OSMAX.
US
Set-Time (s)Max.
OS
MAX.
US
Set-
Time (s)
PIDD2-TD (THRO)0.00470.00952.20.000440.00092.250.000190.000383.1
PID-TID (THRO)0.00760.01363.20.000840.002094.20.000370.000665.1
PIDD2-PD (THRO)0.00620.01062.60.001180.001564.80.000520.000954.6
Table 6. Dynamic system characteristics under effect of case (3).
ControllerΔf1 (Hz)Δf2 (Hz)ΔPtie (pu)
Max.
OS
MAX.
US
Set-Time (s)Max.OSMAX.
US
Set-Time (s)Max.
OS
MAX.
US
Set-
Time (s)
PIDD2-TD (THRO)0.007250.00722.20.00060.000662.250.000190.000382.8
PID-TID (THRO)0.011770.00852.90.001730.001534.40.000370.000664.9
PIDD2-PD (THRO)0.007780.0112.70.00110.00123.80.000520.000954.2
Table 7. The system dynamic characteristics for case (4).
ControllerΔf1 (Hz)Δf2 (Hz)ΔPtie (pu)
Max.
OS
MAX.
US
Set-Time (s)Max.OSMAX.
US
Set-Time (s)Max.
OS
MAX.
US
Set-
Time (s)
PIDD2-TD (THRO)0.005160.00134.10.0170.000112.20.000370.00174.1
PID-TID (THRO)0.0180.00764.30.04970.0154.80.001250.00584.4
PIDD2-PD (THRO)0.01040.00385.20.03460.000254.20.000650.0054.8
Table 8. The dynamics of the investigated system for case (5).
ControllerCoefficient% AlterationΔf1Δf2ΔPtie
Max.OS
(Hz)
Max.US
(Hz)
ST
(s)
Max.OS
(Hz)
Max.US
(Hz)
ST
(s)
Max.OS
(Hz)
Max.US
(Hz)
ST
(s)
PIDD2-TD
(proposed)
Normal 0 0.000480.0031.70.000170.000544.60.000010.000123.4
τ r h + 25 % 0.000480.0041.80.000190.00064.70.000010.000123.4
25 % 0.000480.0031.70.000170.000544.70.000010.000123.5
τ r + 25 % 0.000480.0041.80.000170.00064.70.000010.000123.4
25 % 0.000480.0041.70.000170.000544.60.000010.000183.6
T L i n e + 25 % 0.000480.0031.70.000190.000544.60.000010.000123.4
25 % 0.000480.0031.80.000170.000544.60.000010.000123.4
X g + 25 % 0.000480.0021.70.000150.000544.60.000010.000143.5
25 % 0.000480.0031.70.000170.000514.60.000010.000123.4
Y g + 25 % 0.000490.0031.70.000150.000544.50.000010.000123.4
25 % 0.000480.0031.70.000170.000544.60.000010.000123.3
τ c d + 25 % 0.000490.0031.60.000170.000524.60.000010.000123.4
25 % 0.000480.0021.70.000170.000544.50.000010.000123.2
τ f c + 25 % 0.000480.0031.70.000190.000514.50.000010.000123.4
25 % 0.000480.0031.60.000170.000544.60.000010.000123.3
Disclaimer/Publisher’s Note: The statements, opinions and data contained in all publications are solely those of the individual author(s) and contributor(s) and not of MDPI and/or the editor(s). MDPI and/or the editor(s) disclaim responsibility for any injury to people or property resulting from any ideas, methods, instructions or products referred to in the content.