Article

Assessing Different Passive Treatment Pathways of Acid Mine Drainage in an Ecologically Engineered Wetland After a Veldfire

1
Centre of Environmental Management, University of the Free State, Bloemfontein 9300, South Africa
2
Department of Genetics, University of Stellenbosch, Stellenbosch 7601, South Africa
3
Engineering Science, University of the Free State, Bloemfontein 9300, South Africa
*
Author to whom correspondence should be addressed.
Processes 2025, 13(11), 3494; https://doi.org/10.3390/pr13113494
Submission received: 10 September 2025 / Revised: 23 October 2025 / Accepted: 29 October 2025 / Published: 30 October 2025
(This article belongs to the Section Environmental and Green Processes)

Abstract

In this paper, different physiochemical and biological indicators were tested to determine and compare the water quality of the Zaalklapspruit ecologically engineered wetland before and after a veldfire. Five sampling sites and a reference site 2.2 km upstream of an acid mine drainage (AMD)-decanting coal mine were selected and sampled before and after the veldfire. The “black box” method was also employed to determine the percentage change in the selected in- and outflow variables before and after the veldfire. After the veldfire, Al was reduced by 97.43%. The same trend was observed for Fe, which decreased by 99.65% at the outflow, and Mn and sulphate levels decreased by 98.41% and 68.16%. Possible pathways of the reduction in acid mine drainage impacts on the wetland were identified after the veldfire, including the increase in waterflows during the wet season causing a dilution factor, and phycoremediation by macroalgae drifting mats that accumulate metals and ash slurry from the burned-out macrophyte plant material that may have increased the wetland’s alkalinity. A comprehensive framework for the digital twinning and monitoring of the effects of natural disasters on wetlands is also presented.

1. Introduction

Wetlands are known as naturally occurring ecosystems that have become crucial in the provision of ecosystem services [1]. Similarly, the authors of [2] defined wetlands as mosaics of habitats containing both permanent open water areas and temporary ones on their edges. Despite their benefits, wetlands are both being modified and subject to threats which affect their functioning [3].
Therefore, wetland protection and management are vital for water resource management. Coal mining in South Africa plays a key role in contributing to national economic growth and produces nearly 56% of the country’s electricity [4]; hence, there is a relationship between coal mining and aquatic ecosystem services, with these mining activities relying heavily on a variety of goods and services that aquatic ecosystems provide to sustain them. Coal mining affects wetlands in various ways, including destruction, water quality deterioration and the modification of ground- and surface water flows [5]. Wetland systems can also be adversely affected by coal mining through acid mine drainage containing high concentrations of metals, e.g., iron, aluminium, manganese and dissolved sulphates [6].
These disturbances are likely to affect wetland functioning. Naturally occurring wetland systems can remediate acid mine drainage through adapting (processing via biological or geological factors) to low pH values and high metal concentrations [7]. However, a great proportion of wetlands (35–60%) in South Africa are at risk due to anthropogenic activities [8] such as agricultural, urban and industrial development, which all contribute to the loss of wetlands in South Africa [9].
According to [10], acid mine drainage (AMD) occurs because of the oxidation of sulphides like pyrite and chalcopyrite during and after mining activities. Also referred to as acid rock drainage (ARD) in some cases [11], AMD can affect soil, aquatic assemblages and water resources because of its characteristic low pH and high concentrations of sulphates and heavy metals like iron, manganese, aluminium [12], and zinc (Zn) [11]. The following gives a general formation of sulphide to sulphate oxidation, see [11].
F e S 2 s + 15 / 4 O 2 + 7 / 2 H 2 O F e O H 3 s + 2 S O 4 2 a q . + 4 H +
While the effects of acid mine drainage (AMD) on water systems are well documented, no previous studies have investigated the physiochemical changes that occur before and after a veldfire in an ecologically engineered wetland receiving AMD, with most studies in the literature focusing on the impact of veldfires occurring in natural wetlands receiving water not impacted by acid mine drainage from coal mines. A natural valley-bottom wetland that was ecologically engineered in 2014 to improve its water quality, the Zaalklapspruit ecologically engineered wetland under study receives a high volume of AMD water from an upstream dysfunctional coal mine, affecting its downstream water quality and reducing its ecosystem services [13].
The water quality of the ecologically engineered Zaalklapspruit wetland is poor at the inflow, with high dissolved metal concentrations and a low pH value. However, after flowing through ecological engineering interventions, the water’s quality improves [14]. External environmental drivers like floods, drought and veldfires can, however, have a major adverse effect on natural wetlands. Veldfires refer to fires that occur in vegetation, as opposed to wildfires which include all forms of unplanned vegetation fire [15]. Ref. [16] highlighted that the severity of veldfire effects on wetlands depends on climatic and hydrological characteristics, wetland characteristics and disturbance interactions. In some cases, veldfires are not always detrimental; instead, they can be beneficial in terms of biodiversity protection and maintaining ecosystem services [15].
However, veldfires can promote landscape change through plant invasion [15], such as in the case of the Mpumalanga province, South Africa, veldfire in August 2007, which caused soil erosion that led to the sedimentation of river channels and wetlands downstream [15]. In addition, soil-surface ash deposition from veldfires can alter wetland soil pH. Despite the occurrence of wetland veldfires, vegetation regrowth will slowly counter these effects [16]. This is evident in aquatic plants that resprout after their seeds have been burned by veldfires [16], allowing resprouting plants to occupy open spaces left by fires and thus promoting wetland vegetation recovery [16].
Nevertheless, little is known in the literature about the effects of a veldfire on the passive treatment processes of an ecologically engineered wetland receiving AMD. The objective of this current study was to investigate different pathways and environmental conditions that could have reduced the impact of acid mine drainage on the ecologically engineered wetland after a veldfire in 2020.

2. Materials and Methods

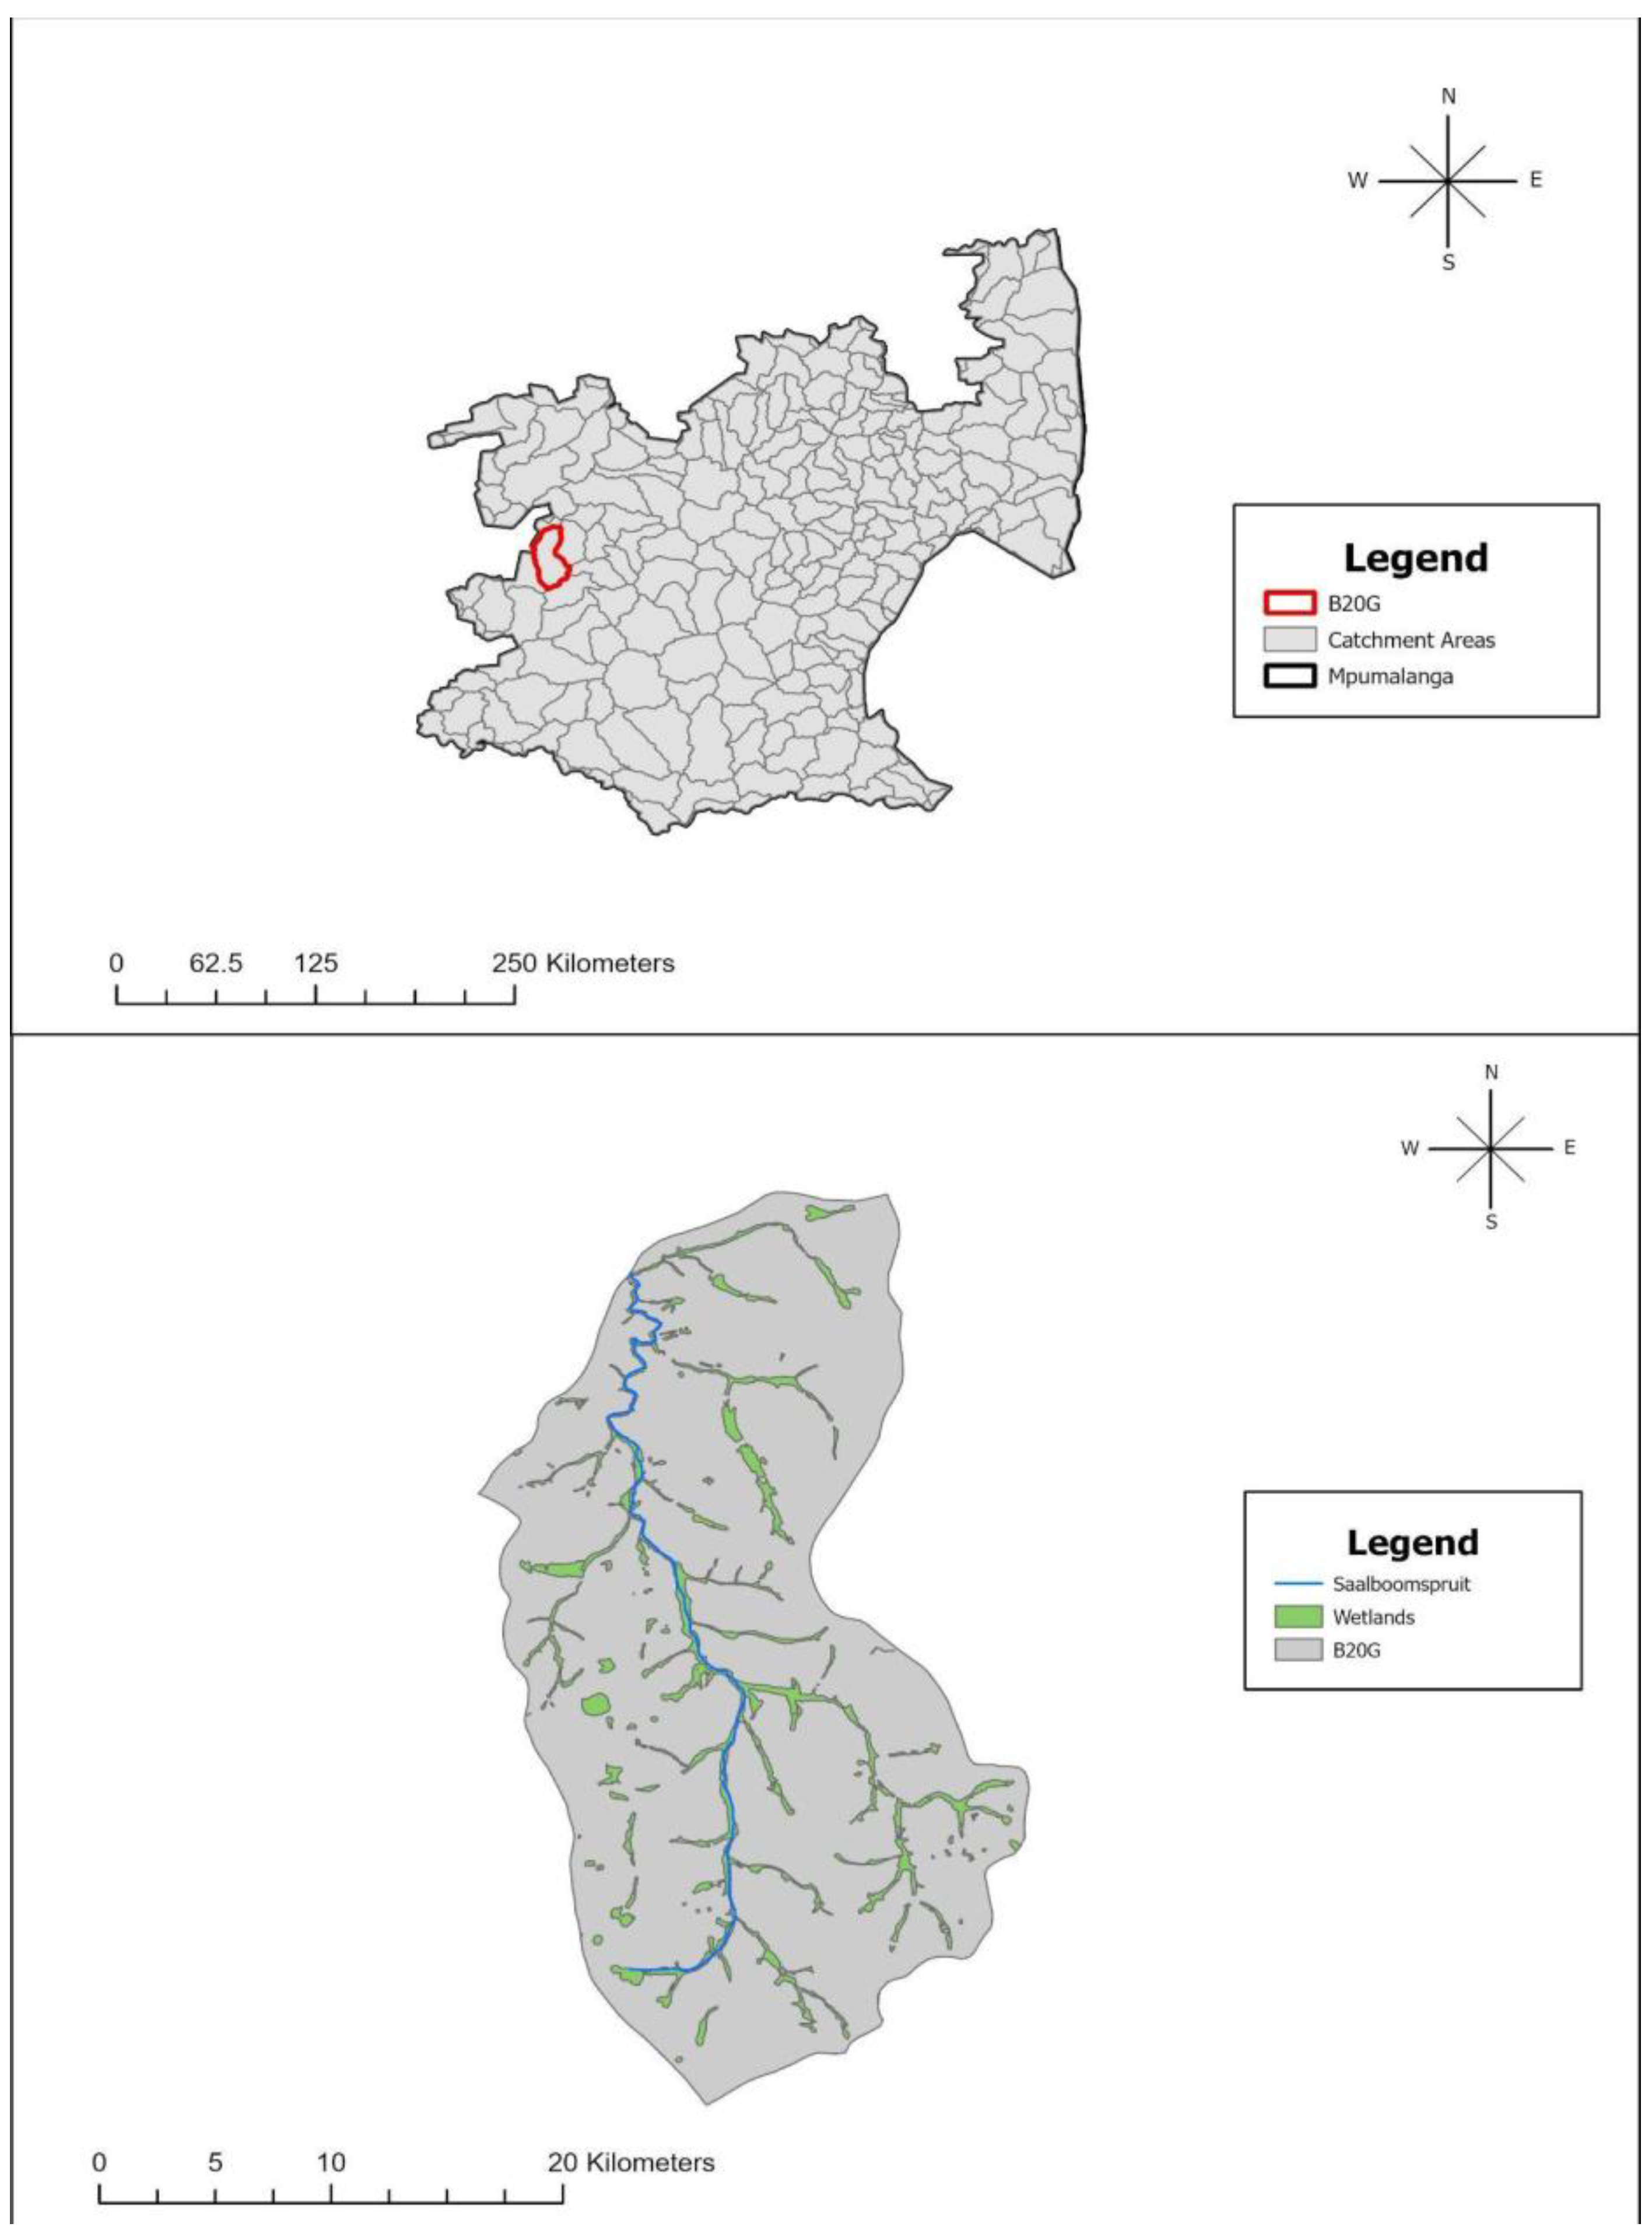
The Zaalklapspruit wetland covers an area of 139 ha. Due to acid mine drainage (AMD) from a non-operational underground coal mine upstream, its inflowing water is contaminated by metals and high sulphate concentrations [17]. The Zaalklapspruit wetland is an ecologically engineered valley-bottom wetland situated in Mpumalanga Province, South Africa, part of the Upper Olifants River quaternary catchment B20G [1], shown in Figure 1 (see Appendix A). The Mpumalanga Highveld constitutes 80% of national coal mining activity; hence, impacts of decanting mines on wetlands are unavoidable and detrimental to ecological infrastructure to some extent. The wetland has been classified as a ‘National Freshwater Ecosystem Area’ and falls in the ‘critically endangered wetland type’ category, hence identified as a Critical Biodiversity Area (CBA). Through ecological engineering, the size of the Zaalklapspruit wetland was increased by 9.4 hectares through the redirection of water flows using concrete structures in order to enlarge the wetland’s passive treatment surface area and reduce resident time [14,18].

2.1. Data Collection and Analysis

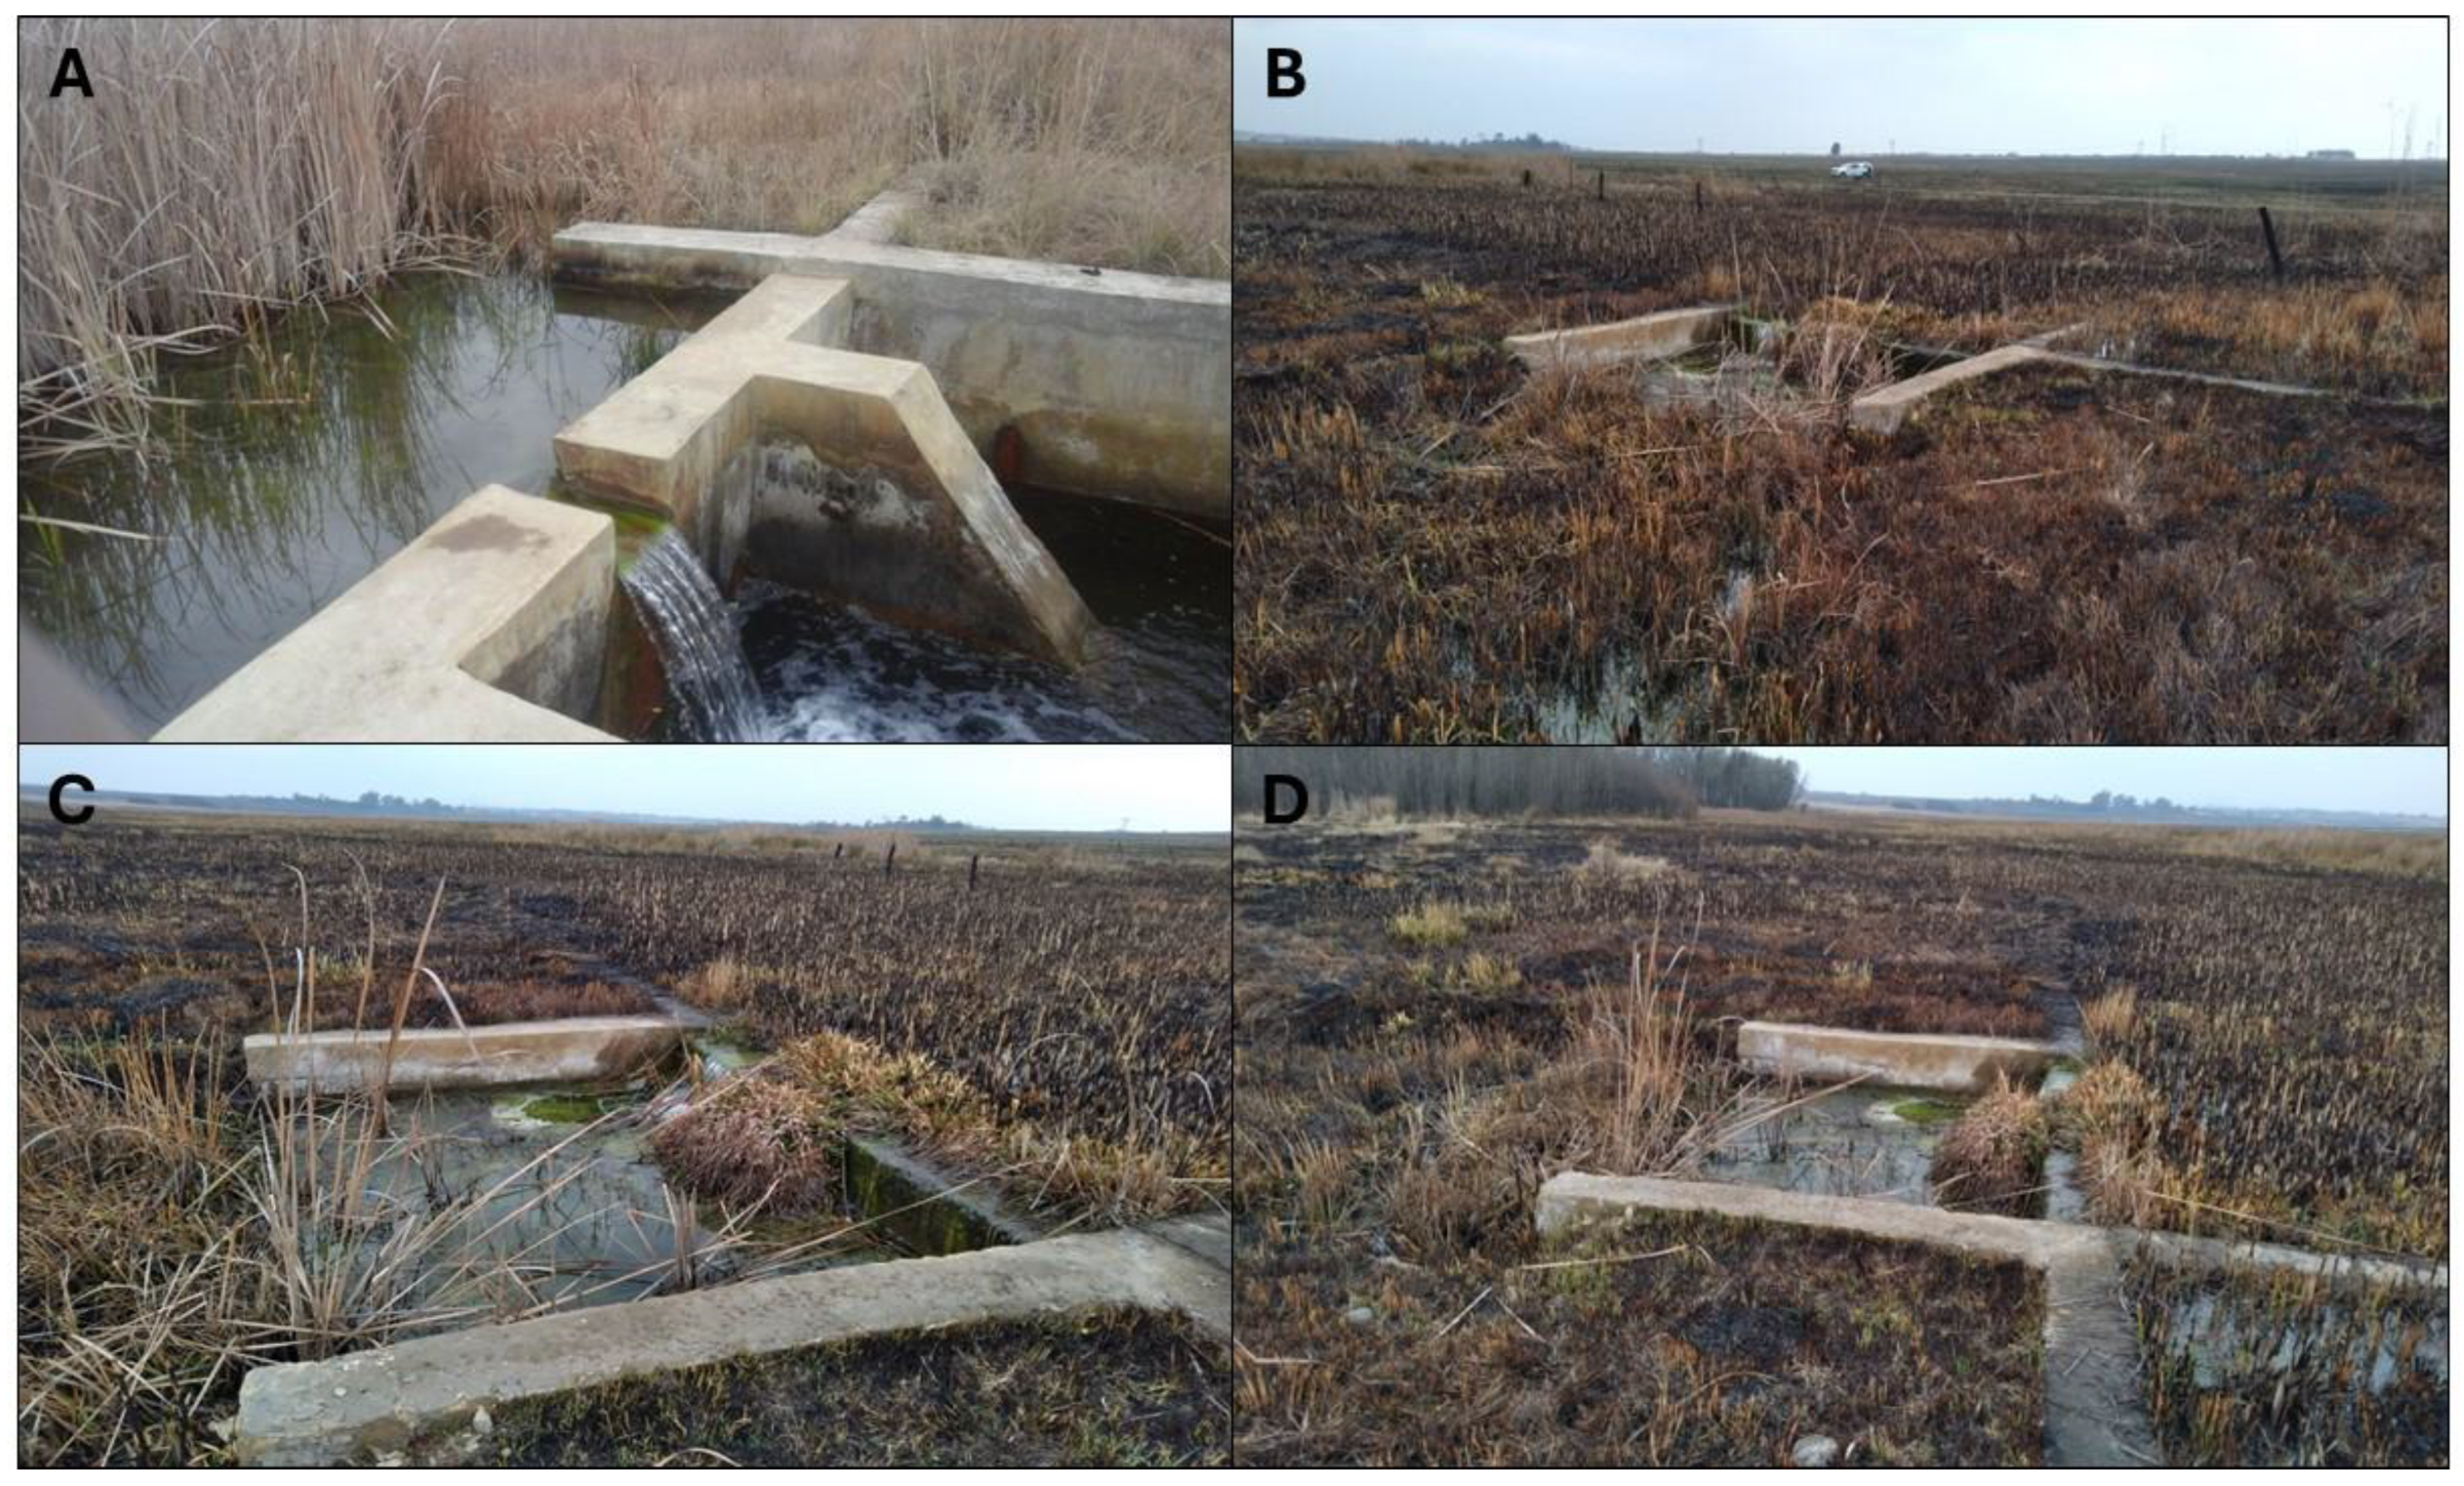
Surface water samples from five locations in the Zaalklapspruit ecologically engineered wetland were collected before and after the veldfire and analysed (Figure 1). Sampling commenced in June 2020 (dry season) before the veldfire, which occurred in July 2020, and wet-season sampling was conducted in October 2020. The reference site, unimpacted by acid mine drainage, was located 2.2 km upstream of the Zaalklapspruit ecologically engineered wetland, as shown in Figure 1. Sites 1 (inflow) and 5 (outflow) were located upstream and downstream of the ecologically engineered wetland, while the other sampling sites (2, 3, 4) were situated between its inflow and outflow (Figure 1; Table 1). The vegetation status of the Zaalklapspruit wetland before and after the veldfire is shown in Figure 2, below.

2.2. Physical–Chemical Sampling

During the sampling, on-site (in situ) water quality parameters such as temperature, pH, and electrical conductivity were measured using a Hanna HI991300 handheld water-quality meter in June (winter) and October 2020 (spring). Samples were taken before and after the veldfire during the dry and the start of the wet seasons. Surface water samples for chemistry analyses were collected in triplicate at each wetland sampling site at a depth of ± 10 cm from the surface in 1 litre glass bottles and kept on ice following the sampling method according to [19]. The sampled water from each site was divided into three subsamples for the following analyses: (a) one litre was filtered through 0.45 µm pore-size Whatman GF/filters for dissolved nutrient analyses, (b) one litre was filtered through 1 µm Gelman glass fibre filters and preserved in nitric acid for metal analyses, (c) one litre was tested for selected major ions. Samples were sent to an accredited chemical laboratory for analysis within 48 h of collection. Water quality parameters related to AMD-contaminated surface water were selected from the literature to establish the water quality in the ecologically engineered wetland [8]. The water samples were analysed for the following major ions and metals using inductively coupled plasma-mass spectrometry (ICP-MS) or inductively coupled plasma atomic emission spectroscopy (ICP-AES): sodium (Na), calcium (Ca), magnesium (Mg), sulphate (SO4), aluminium (Al), iron (Fe) and manganese (Mn). The total nitrate (TN) level was determined via ICP-MS after converting the nitrates to detectable nitrogen. For quality control purposes, matrix-matched standards were analysed in parallel, and the ionic balance was determined using the formula in [20].
Wetland treatment capacity has, in earlier studies, been assessed using treatment efficiency ( C i n C o u t ): C i n C o u t [21,22], determining the percentage of contaminant removed by the wetland based on influent ( C i n ) and effluent ( C o u t ) concentrations. This black box measure has the advantage of being based on effluent concentration, the regulatory basis of compliance, and was used in the current study.

2.3. Drifting Macroalgae Mat Sampling

Drifting filamentous macroalgae mats (5 cm2) were collected only in October, after the veldfire, from each sampling site, except for the reference site, where macroalgae mats were totally absent. Large areas covered with these drifting macroalgae mats were only observed in the ecologically engineered wetland after the veldfire during spring sampling (October), not being present before. Five samples (macroalgae mats = 5 cm2) were taken 5 m apart along a wetland transect and pooled together to form a well-mixed composite sample at each sampling site. The composite samples were divided into two subsamples: (a) a preserved sample for microscope filamentous algae identification; (b) an unpreserved sample for metal bioaccumulation analyses. The soft algae subsamples were fixed in 2.5% glutaraldehyde in the field and kept cold and in the dark until laboratory analyses were performed. All filamentous algae were identified using a compound microscope (Carl Zeis, Stuttgart, Germany) at 1250× magnification, as previously described [23,24,25,26,27]. Samples were sedimented in a Sedgewick–Rafter sedimentation chamber and analysed using the strip-count method [28].
The relative abundance of each filamentous algal taxon in the drifting mats was grouped as follows: + = ≤50 (rare); ++ = 51–250 (scarce); +++ = 251–1000 (common); ++++ = 1001–5000 (abundant); and +++++ = 5001–25,000 (predominant) cells/5 cm2. The Berger–Parker dominance index [29] was used to measure the evenness or dominance of each filamentous algae species at each sampling site using actual algae filaments:
D = N m a x N
where Nmax is the number of individuals of the most abundant species present in each sample and N is the total number of individuals collected at each site.

2.4. Metal Biosorption Analysis of Drifting Macroalgae Mats

All drifting macroalgae samples were stored in acid-washed glass bottles at 4 °C and kept in the dark during transfer from the field to the laboratory. To determine metal (Al, Fe and Mn) biosorption (adsorption and absorption) in the macroalgae mats after the veldfire, samples were not rinsed but directly dried to a constant weight at 80 °C. Triplicate subsamples (50–100 mg dry weight) were digested in concentrated 69% (v/v) nitric acid to extract metals, which were then determined by inductively coupled plasma atomic emission spectroscopy (ICP-AES). Sample-based standards were used, as described by [30].

2.5. Wetland Substrate Cover, Rainfall and Erosion

Wetland substrate cover (i.e., macrophytes) for transect sampling was determined visually according to the method in [31]. Rainfall data was obtained from the South African Weather Service (SAWS).

2.6. Statistical Methods

In this paper, the statistical methods are concerned with comparing two collected samples for each water parameter of interest separated by a clear epoch in the form of a veldfire disturbing the dynamics of the complex wetland system. The main hypothesis related to whether a difference in parameters could be observed or not following the epoch of disturbance. For the latter, we assumed a one-tailed distribution and homoscedasticity, meaning that statistical tests were performed relating to only one truth direction and the variances of the samples and error terms are equal across observations.

3. Results and Discussion

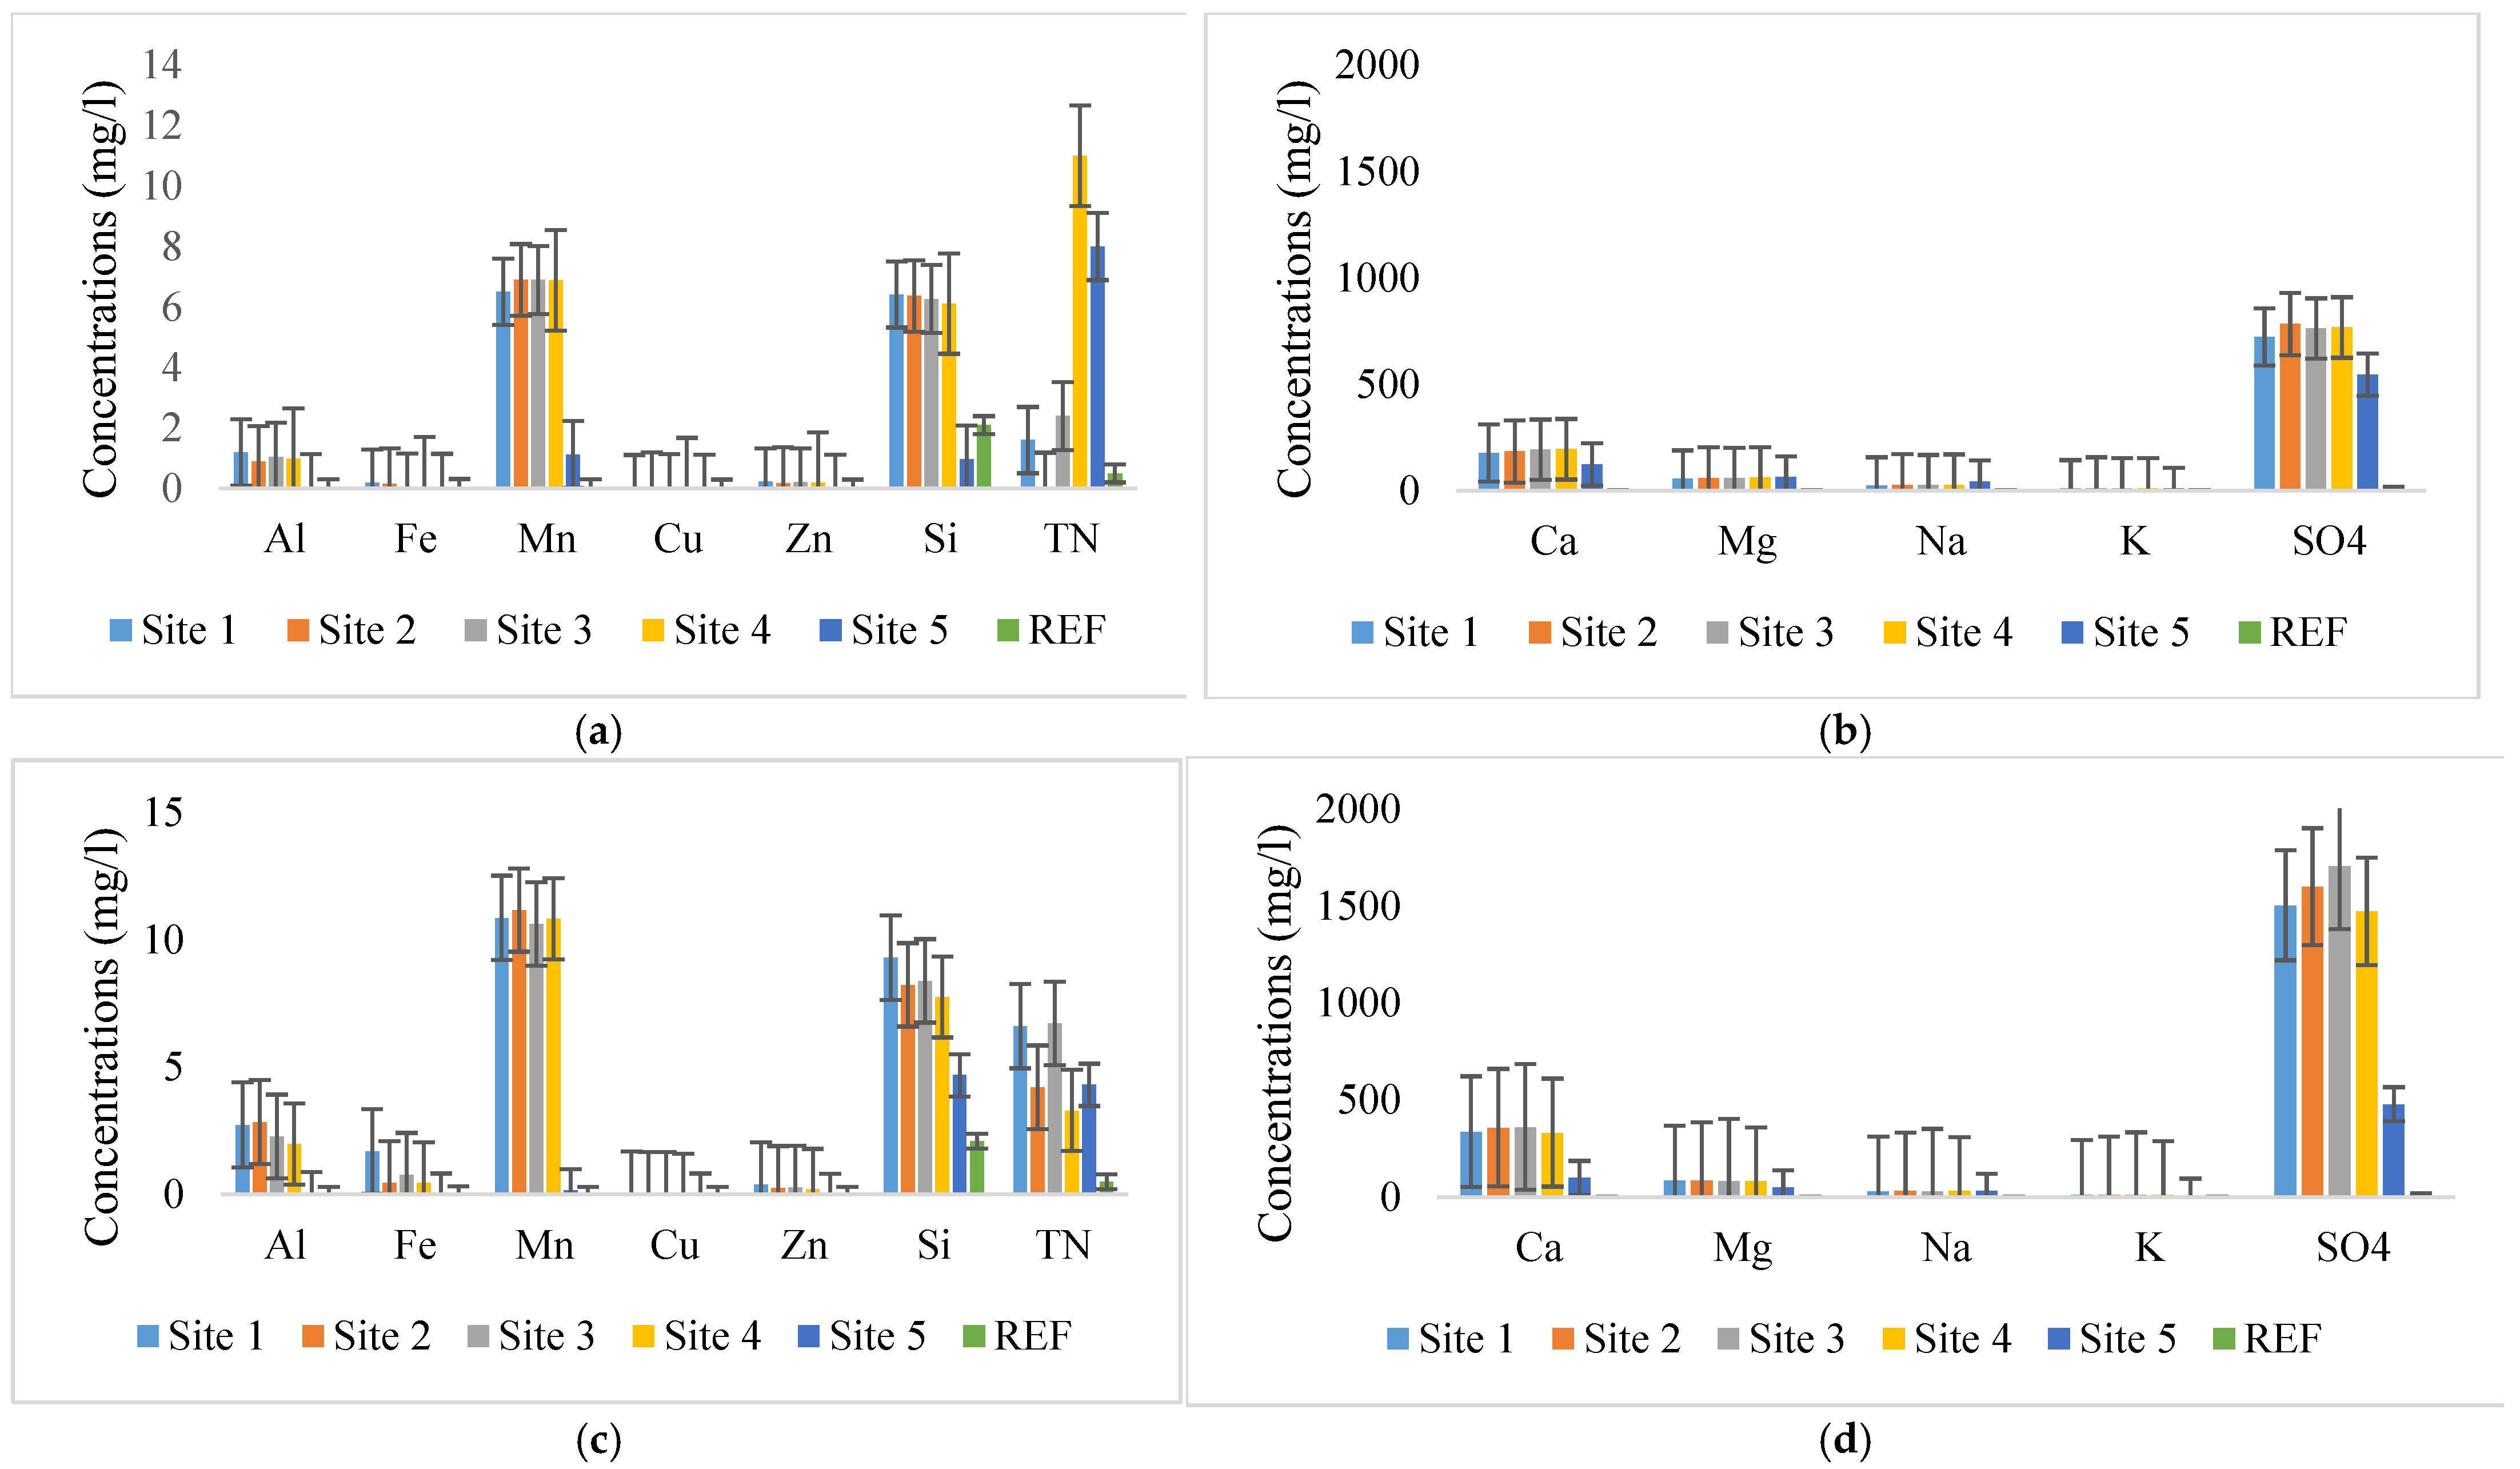
Reference water quality values before and after the veldfire (dry and wet season) were compared with South African Water Quality Guidelines (TWQR) for Aquatic Ecosystems and Resource Quality Objectives (RQOs). Figure 3 and Figure 4 compactly illustrate the measurables for each site before and after the veldfire. Descriptive statistics (means and standard deviations) of the parameters were used to describe the fluctuations that occurred before and after the veldfire, see Table 2, and the results of a two-sampled T-test (assuming a one-tailed distribution and homoscedastic state of variances) indicated that there were differences in variables (Cu, Fe, Mn, Cu, Zn and Si) at all wetland sites, with p A l = 0.033 ,   p F e = 0.056 ,   p M n = 0.121 ,   p C u = 0.099 ,   p Z n = 0.229 and p S i = 0.051 . However, there was no significant difference in Tn before and after the veldfire, with p T n = 0.433 .

3.1. Selected Parameter Concentrations Before and After Veldfire

Before the veldfire, the Al values across the wetland decreased from 1.19 mg/L at the inflow (Site 1) to 0.03 mg/L at the outflow (Site 5), as shown in Figure 3a, meaning that Al was reduced by 97.91%. The same trend was observed for Fe, decreasing from 0.20 mg/L at the inflow to 0.04 mg/L (80%) at the outflow; Mn, from 6.51 mg/L at the inflow to 1.13 mg/L (82.68%) at the outflow; Cu, from 0.02 mg/L to 0.01 mg/L (60%); and Zn, from 0.23 mg/L to 0.01 (96.58%). SO4 concentrations increased from 721.90 mg/L at inflow Site 1 to 783.30, 762.20 and 767.10 mg/L at Sites 2, 3 and 4, respectively. However, at the outflow, the SO4 concentration decreased significantly to 545 mg/L, resulting in an overall decrease of 24.50%.
After the veldfire, a comparable pattern was noticed. The Al concentrations decreased from 2.92 mg/L at the inflow (Site 1) to 0.07 mg/L at the outflow, as shown in Figure 3c, reducing overall Al by 97.43%. The same trend was found for Fe, which decreased from 1.69 mg/L at the inflow to 0.01 mg/L (99.65%) at the outflow; Mn, from 10.86 mg/L to 0.17 mg/L (98.41%); Cu, from 0.02 mg/L to 0.01 mg/L (62.50%); and Zn, from 0.39 mg/L to 0.02 mg/L (94.87%) (Figure 3c). At the inflow, Site 1, the SO4 concentration was at 1502.9 mg/L, increasing to 1599.04, 1704.09 and 1471.36 mg/L at Sites 2, 3 and 4, respectively. However, the SO4 concentration decreased to 478.51 mg/L at the outflow, as shown in Figure 3d, resulting in an overall sulphate decrease by 68.16%.
Many anthropogenic and natural disturbances influence wetland characteristics. Fire is a frequent natural disturbance that has both immediate and long-term consequences for wetland ecosystems because it affects water temperature, nutrient dynamics, water chemistry, channel morphology, wetland biota and habitat complexity and structure [32]. Nevertheless, the magnitude and extent of the initial effects of veldfires on wetlands and the rate of recovery to pre-fire conditions are poorly understood. Fire-related stream warming has been of particular concern because water temperature affects primary and secondary productivity and the vital rates, distribution and diversity of wetland biota [16]. Although fires may alter the surface water temperature for the time period when the veldfire is intensive, this change’s primary driver is usually solar radiation following the loss of riparian vegetation [33].
Few veldfires, however, burn hot and long enough for complete combustion of organic material. Therefore, the soil is usually covered with black, partially organic ash mixed with charred plant parts, rather than with white inorganic ash, as in the case of the Zaalklapspruit ecologically engineered wetland [34]. Laboratory studies have shown that inorganic ash components consist mostly of carbonates and oxides of alkali and alkaline earth metals; silica; and in much smaller amounts, phosphorus, sulphur and nitrogen [34], with the relative concentrations of these compounds varying according to plant species. Inorganic nitrogen is present in ash mostly in organic forms of low solubility, and the inorganic nitrogen forms are largely volatilized [35]. The amount of inorganic phosphorus in the ash slurry in the Zaalklapspruit ecologically engineered wetland may have failed to leach out due to the low solubility of calcium and magnesium polyphosphates [36]. However, laboratory experiments [37] have reaffirmed the field observations that nitrogen is lost primarily.
Previous studies have shown pH increases in the ash slurries after a wildfire up to a pH of 12, while the pH of surface soils after the deposition of ash can increase by three or more units [34]. However, in the Zaalklapspruit wetland, no large pH increase was measured at the burning sites (Sites 2, 3 and 4), possibly related to the characteristics of the AMD water. However, the higher pH measured at Site 5 in October 2020 after the veldfire could be related to the accumulation of ash slurries downstream due to the increase in the flow regime after the start of the rainy season and the reduction in macrophytes [38] (see Figure 4). An experimental plot study in [39] showed a 24% decrease in total nitrate (TN) in the burned plot compared to the unburned plot immediately after the fire, possibly attributed to volatilization during the fire. However, in the October sampling after the veldfire, total surface water nitrogen had increased at Sites 2, 3 and 4 of the Zaalklapspruit wetland (see Figure 3).
These findings correspond with those reported by [34], who studied rivers in severely burned areas after a wildfire in Australia and found an approximately 10-fold increase in stream-water nitrate in the severely burned watersheds in the 12 months following the wildfire. Ref. [40] suggested that the increased concentrations of nitrates in stream water from burned areas were a combination of accelerated mineralization of organic nitrogen to nitrate and reduced demand from plants that burned down.

3.2. Rainfall and Overland Flows

During the winter sampling (June 2020, i.e., dry season), only 3 mm of rainfall was recorded before the July 2020 veldfire, see Figure 5, whereas in the spring sampling (October 2020), 26.2 mm of rain was recorded. The average flow rate in June 2020 at the wetland inflow site was (0.271 m/s × 3 m × 0.15 m) 0.121 m3/s, increasing to (0.412 m/s 5.3 × 0.18 m) 0.393 m3/s in October 2020 after the veldfire. This increased flow rate in the upper catchment of the ecologically engineered wetland may have had a dilution effect, decreasing the proportion of pollutants observed in the wetland in the October 2020 water chemistry analyses. However, an increase in flow rate would also have decreased the residence time for passive treatment in the ecologically engineered wetland. Furthermore, a higher flow rate and the lower flow resistance due to burned-down macrophytes would also have played a role in reducing residence time for passive treatment by macrophytes in the wetland. A previous groundwater study by [41] showed that groundwater hydrochemical and stable isotope contents indicated that the ecologically engineered wetland was not supported by sub-surface water discharges during the dry and wet seasons.
Nevertheless, in a previous study by [42], the authors collected 66 samples throughout the atmospheric precipitation seasons in the Upper Olifants River catchment, where the Zaalklapspruit ecologically engineered wetland is situated. Their study reported that 39 (59%) of the total samples had a pH ≥ 5.6 and could therefore be classified as acid rain [43]. Although atmospheric precipitation was not sampled in the current study, the latter finding also indicated that contaminated rainwater in this catchment could have contributed to the presence of aquatic pollutants in the wetland system, and therefore the pollutant dilution factor may have been less relevant. Ref. [44] also reported that large portions of industrial infrastructure are concentrated on the Highveld Plateau, which includes the Upper Olifants River catchment and accounts for approximately 90% of South Africa’s scheduled emissions of industrial dust, sulphur dioxide and nitrogen oxides.

3.3. Drifting Algae Mats and Metal Bioaccumulation (Phycoremediation)

In June 2020, before the veldfire, patches of periphyton (benthic phytoplankton) were detected on the bottom substrate of the wetland between the macrophytes at all sampling sites. Sampling after the veldfire in October 2020 indicated large areas of drifting macroalgae mats in the absence of the thick macrophyte leaves above the water column. This phenomenon may have been related to the better sunlight penetration in the absence of macrophyte leaves and an increase in flow that detached the benthic filamentous algae mats.
Two dominant filamentous macroalgae were microscopically identified from the drifting macroalgae mats collected at the five field sampling sites, namely Klebsormidium klebsii and Oedogonium crassum. The bioaccumulation of the different selected metals by the filamentous macroalgae mats in October 2020, as revealed by the bioconcentration factor (BCF), was not related to the concentrations measured in the surface water column at the five sampling sites, indicating that the drifting macroalgae mats may have played a role in the passive treatment of the wetland. The concentration of the selected metals measured in the macroalgae drifting mats at the different sites was as follows: Site 1—O. crassum: Al > Fe > Mn > Zn; Site 2—O. crissum: Al > Fe > Mn > Zn; Site 3—O. crissum: Fe > Al > Mn > Zn; Site 4—M. klebsii: Fe > Mn > Al > Zn; Site 5—M. klebsii: Fe > Mn > Al > Zn. A previous study by [8] reported on the filamentous green algae Oedogonium sp. collected from an ecologically engineered wetland where Al, Fe and Mn concentrations were effectively reduced during a laboratory study under different pH values.
Previous research by [45] has shown that both intracellular and extracellular processes may be important in metal accumulation by algae. These algal accumulation processes are in turn affected by biotic and abiotic factors, such as the production of extracellular polymeric substances (EPSs), light availability [46], metal speciation [47], other physicochemical properties of the contaminated water [48] and the metal-binding capacity of specific algae species [49]. According to [50], the abundance and distribution of the filamentous macroalgae Klebsormidium sp. in AMD-affected water make them good ecological indicators of such drainage; for example, Klebsormidium-dominated algae mats are good indicators of high iron concentrations in water affected by AMD [51]. Furthermore, specific algae species do have the potential to influence AMD in different ways. By assimilating nitrate, they can directly affect water acidity and may have played a role in the Zaalklapspruit wetland after the veldfire, when total nitrogen increases in the wetland system were observed. However, according to [52], the most important role that algae play in the passive treatment of AMD is that algal biomass, as well as extracellular products, serves as a carbon source for sulfate-reducing bacteria (SRB), which in turn produce alkaline conditions [53]. Nevertheless, in the Zaalklapspruit wetland, sulphate concentrations in the water column did not reduce after the veldfire except for at Site 5, which could possibly be related to the lack of carbon sources in the form of macrophyte material, which had burned to ash slurry.
According to [54], specific algae species can release extracellular polysaccharides (EPSs). Numerous studies have indicated that organisms able to produce EPSs have the capacity for metal uptake, including acidophilic and acid-tolerant algae [55]. The most widely recognized biological processes for metal removal in wetlands involve macrophyte uptake [56]; however, macrophyte metal storage capability was reduced by the veldfire in the Zaalklapspruit ecologically engineered wetland.

3.4. Towards a Framework of Twinning Wetlands to Quantify Passive Treatment Pathways After Future Catastrophes

It is well known that some complex systems contain too many parts and interactions to model in their entirety [57], a challenge that can be approached through complexity science to find and model certain metrics that allude to the characteristics of the complex systems under question. As a starting point towards the measurement of the emergence, non-linearity, self-organization and unpredictability of the some of the elements related to ecologically engineered wetlands, analysts most often utilize the “black box” methodology, that is, representing the complex system as a black box that transforms a certain input to a certain output as time evolves, where a precise description of the “black box” is not accounted for (see Figure 6). Wetlands are no different, since a plethora of micro- and macro-dynamics govern the evolution of the wetland service functions, and most of the time, not all of these dynamics can be measured sufficiently to reconstruct the entire inner workings of the complex system (or wetland) under question.
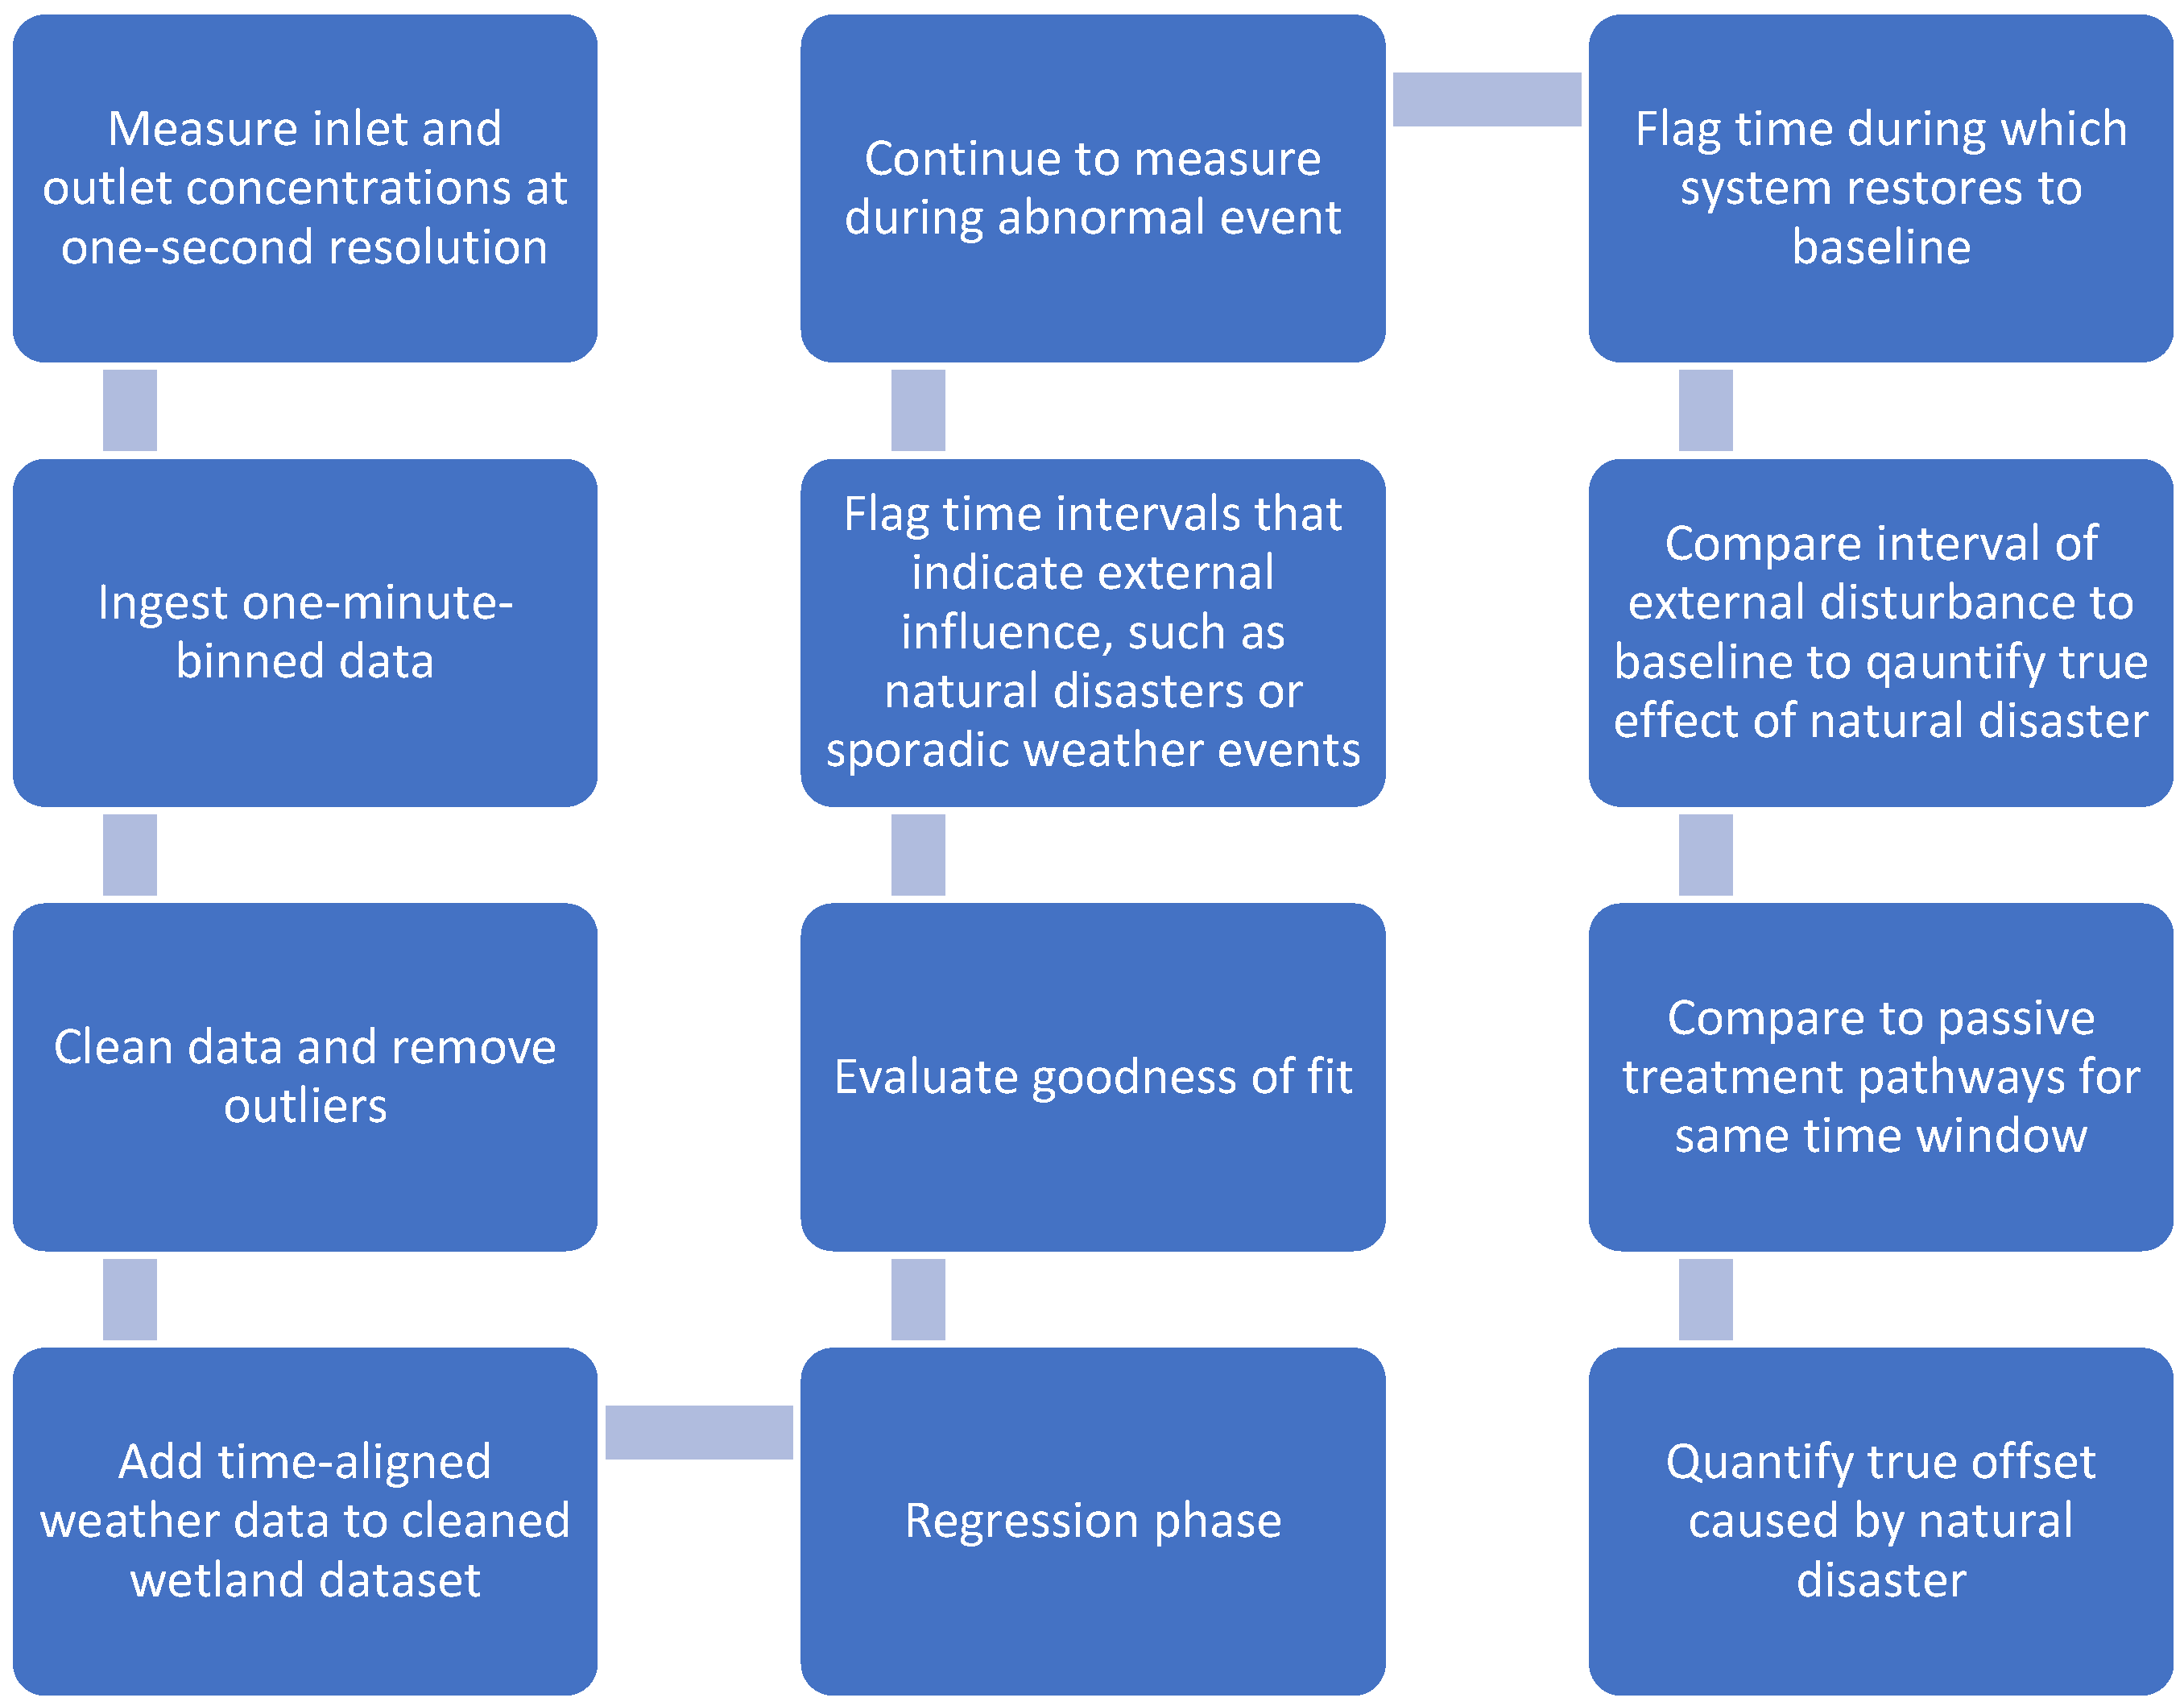
Black box methods (assuming that the complex system under question is a wetland) range from simple regression models and first-order models to more intermediate time-dependent retardation models, tank-in-series (TIS) models and Monod models and to more data-driven techniques such as neural network representations of the system that transform the input characteristics to the output characteristics [58]. It is noteworthy that, in principle, the injection of AMD can be accounted for in the input and the veldfire effect can be extracted by comparing the different “versions” of the back box before and after the veldfire, as well as the fact that the black box in its entirety accounts for the complex interactions of localized weather. To set the scene for developing a framework of wetland twinning that could best optimize these black box models, we investigate the immediate shortcomings of a simple regression, or first-order black box model, based on a limited number of measurements associated with the wetland, see Equations (2) and (3) [58]:
C o u t = k C i n + d
C o u t C C i n C = e ( k A / q )
with C o u t ,   C i n ,   C , k ,   d ,   k A   a n d   q representing outlet concentration, inlet concentration, background concentration (such as sediment release), constants, the first-order areal rate constant (LT−1) and hydraulic loading rate HLR (LT−1), respectively. Since first-order black box models (such as Equations (2) and (3)) compress the entirety of the complex system into a single entity, it becomes clear that less data translates to less accurate predictions, which will in turn translate to less accurate quantifications of the effect of the veldfire (or any other external disturbance) on ecologically engineered wetlands. This highlights the need for data-driven black box models to quantify the effect of external disturbances on wetlands, see Figure 7.
Transforming Equations (2) and (3) towards data-driven black box methods, by utilising the metrics outlined in Table 3 specifically for the quantification of natural disasters’ impact on the treatment capacity of ecologically engineered wetlands (or complex systems), relies on a pipeline that typically involves data ingestion (at 1 s intervals), pre-processing (cleaning data), model training (regressing), evaluation (goodness of fit) and deployment (new C i n and C o u t values with ever-increasing accuracy), all executed continuously as new data are measured. The resulting black box method-driven digital twin can be represented as in Figure 7 below.

4. Conclusions

From the current study, it was evident that different pathways of passive treatment and their relationships with environmental conditions may have played a role in reducing metal concentrations in the ecologically engineered wetland after the veldfire. The combination of environmental conditions in the form of increased precipitation and flows, the accumulation of metals in drifting wetland macroalgae mats (phycoremediation) and ash slurry from burned-out macrophyte plant material may have contributed to the decrease in metals at the wetland’s outflow. Although the microbial cycle in the wetland could also have played a role in the metal reduction, it was not investigated in the current study.
It was concluded, via complexity science frameworks, that catastrophic events such as veldfires must generate measurable effects on the underlying elements of the system under question, since they drastically perturb the system’s larger interlinked role players. However, as outlined in this study, alternative servicing elements can drive treatment in the wetland. Hence, the quantification of the true effect of the natural disaster cannot be fully realized by manual measurement campaigns, since historic and high-resolution data are needed to generate a baseline function that represents the system. In this paper, the occurrence of a veldfire and the impact thereof on an ecologically engineered wetland and its alternative treatment pathways were leveraged to gain an understanding of what is needed to truly quantify the effect of natural disasters on wetland treatment capacity. The proposed framework was also supported by spatial–temporal image analysis using Sentinel 2 data associated with the Zaalklapspruit wetland and the quantification of water quality parameters and vegetation indices before and after the veldfire.

Author Contributions

Conceptualization, P.O. (Paul Oberholster), Y.S. and A.-M.B.; methodology, P.O. (Petri Oberholster), Y.S. and A.-M.B.; software, P.O. (Petri Oberholster) and J.M.; validation P.O. (Paul Oberholster), Y.S. and A.-M.B.; formal analysis, P.O. (Paul Oberholster), Y.S., A.-M.B., P.O. (Petri Oberholster) and J.M.; investigation, P.O. (Paul Oberholster), Y.S., A.-M.B., P.O. (Petri Oberholster) and J.M.; resources, P.O. (Paul Oberholster), Y.S., A.-M.B., P.O. (Petri Oberholster) and J.M.; data curation, P.O. (Paul Oberholster), Y.S., A.-M.B., P.O. (Petri Oberholster) and J.M.; writing—original draft preparation, P.O. (Petri Oberholster), Y.S., A.-M.B., P.O. (Petri Oberholster) and J.M.; writing—review and editing, P.O. (Paul Oberholster), Y.S., A.-M.B., P.O. (Petri Oberholster) and J.M.; visualization, P.O. (Paul Oberholster), Y.S., A.-M.B., P.O. (Petri Oberholster) and J.M.; supervision, P.O. (Petri Oberholster), Y.S., A.-M.B., P.O. (Petri Oberholster) and J.M.; project administration, P.O. (Paul Oberholster), Y.S., A.-M.B., P.O. (Petri Oberholster) and J.M.; funding acquisition, P.O. (Paul Oberholster). All authors have read and agreed to the published version of the manuscript.

Funding

This research received no external funding.

Data Availability Statement

The data used in this paper are available from the authors upon reasonable request.

Acknowledgments

We acknowledge the students A. Mncwabe, C. Katzke, J. De Wet, K.V. Monyemogonwe and T.A. Ndhlovu for their geospatial processing.

Conflicts of Interest

The authors declare no conflicts of interest.

Appendix A

For this study, satellite imagery was obtained from the Copernicus Open Access Hub (https://dataspace.copernicus.eu/), which provides free access to Earth observation data collected by the European Space Agency. The Sentinel-2 mission was chosen because of its high spatial resolution, frequent revisit time and suitability for vegetation and water monitoring. Specifically, Sentinel-2 Level-2C products were used, as these datasets are atmospherically, radiometrically and geometrically corrected, which reduces the need for further calibration during analysis. Access to the Copernicus portal required the creation of a registered account, after which the data was filtered by location, date and cloud cover percentage to meet the requirements of this paper. The temporal scope of the data was selected to capture conditions before and after the wildfire event of interest, focusing on the period between April and June 2020. Scenes with cloud cover greater than 10% were excluded to ensure clear imagery suitable for analysis. The study area was defined using a shapefile of the catchment boundary, which was first converted into the KMZ format for compatibility with the Copernicus platform. This boundary was then applied as a filter to download only the imagery covering the relevant area, avoiding unnecessary data outside the study region. From the Sentinel-2 archive, five key spectral bands were downloaded: Bands 1, 2, 3, 4 and 8. These bands were selected because of their importance in vegetation and water index calculations, with Bands 2–4 corresponding to the visible spectrum (blue, green, red) and Band 8 capturing near-infrared reflectance, which is strongly correlated with vegetation health. Band 1, the coastal aerosol band, was included for atmospheric correction purposes. The downloaded imagery covered two Sentinel-2 tiles, as the study site extended across adjacent scenes. To ensure full coverage, both tiles were acquired and later integrated into a single dataset during pre-processing.
Satellite imagery was used in this study. Sentinel data was acquired on the official Copernicus websites for two dates, one before (21 May 2020) and one after (8 September 2020) the wildfire. The following bands of the Sentinel 2 mission were downloaded: 1, 2, 3, 4 and 8. Table A1, below, presents a short summary of what each band entails. It turned out that the wetland catchment area (B20G) fell over two tiles. Therefore, for each band, both tiles were uploaded into ArcGIS pro v3.5, and then, the “Mosaic to new Raster” function was used to merge the two tiles into one usable layer. Then, the study area map was uploaded as a new layer and the Clip feature was used to cut down the merged tiles to match the study area’s form exactly. The ArcGIS map was then ready for raster calculations for the different map results.
Figure A1. Location of wetland (ArgGIS).
Processes 13 03494 g0a1
Table A1. A summary of the bands used.
BandsResolutionWavelengthDescription
Band 120 m443 nmUltra-Blue (Coastal and Aerosol)
Band 210 m490 nmBlue
Band 310 m560 nmGreen
Band 410 m665 nmRed
Band 810 m842 nmVisible Near-Infrared

References

  1. de Klerk, A.; Oberholster, P.; van Wyk, J.; Truter, J.; Schaefer, L.; Botha, A.-M. The effect of rehabilitation measures on ecological infrastructure in response to acid mine drainage from coal mining. Ecol. Eng. 2016, 95, 463–474. [Google Scholar] [CrossRef]
  2. Akcil, A.; Koldas, S. Acid Mine Drainage (AMD): Causes, treatment and case studies. J. Clean. Prod. 2006, 14, 1139–1145. [Google Scholar] [CrossRef]
  3. Xu, X.; Wu, Y.; Rao, Y.; Fu, T.; Wu, X. Influence of litter decomposition on iron and manganese in the sediments of wetlands for acid mine drainage treatments. Acta Geochim. 2019, 38, 68–77. [Google Scholar] [CrossRef]
  4. Gorjão, L.R.; Maritz, J.J. The stochastic nature of power-grid frequency in South Africa. Phys. Complex. 2023, 4, 15007. [Google Scholar] [CrossRef]
  5. Ochieng, G.M.; Seanego, E.S.; Nkwonta, O.I. Impacts of mining on water resources in South Africa: A review. Sci. Res. Essays 2010, 5, 3351–3357. [Google Scholar]
  6. Singh, S.; Chakraborty, S. Performance of organic substrate amended constructed land treating acid mine drainage (AMD) of North-Eastern India. J. Hazard. Mater. 2020, 397, 122719. [Google Scholar] [CrossRef] [PubMed]
  7. Bwapwa, J.; Jaiyeola, A.; Chetty, R. Bioremediation of acid mine drainage using algae strains: A review. S. Afr. J. Chem. Eng. 2017, 24, 62–70. [Google Scholar] [CrossRef]
  8. Oberholster, P.J.; McMillan, P.; Durgapersad, K.; Botha, A.M.; de Klerk, A.R. The development of a wetland classification and risk assessment index (WCRAI) for non-wetland specialists for the management of natural freshwater wetland ecosystems. Water Air Soil Pollut. 2014, 225, 1833. [Google Scholar] [CrossRef]
  9. Adeeyo, A.O.; Ndlovu, S.S.; Ngwagwe, L.M.; Mudau, M.; Alabi, M.A.; Edokpayi, J.N. Wetland Resources in South Africa: Threats and Metadata Study. Resources 2022, 11, 54. [Google Scholar] [CrossRef]
  10. Blodau, C. A review of acidity generation and consumption in acidic coal mine lakes and their watersheds. Sci. Total Environ. 2006, 369, 307–332. [Google Scholar] [CrossRef]
  11. Kuyucak, N. Role of microorganisms in mining: Generation of acid rock drainage and its mitigation and treatment. Ejmp Ep (Eur. J. Miner. Process. Environ. Prot.) 2002, 2, 179–196. [Google Scholar]
  12. Kefeni, K.K.; Msagati, T.A.M.; Mamba, B.B. Acid mine drainage: Prevention, treatment options, and resource recovery: A review. J. Clean. Prod. 2017, 151, 475–493. [Google Scholar] [CrossRef]
  13. Staebe, K. Determination of the Bacterial Diversity of a Natural Freshwater Land Impacted by Acid Mine Drainage. Ph.D. Thesis, Stellenbosch University, Stellenbosch, South Africa, 2015. [Google Scholar]
  14. Oberholster, P.J.; De Klerk, A.R.; Chamier, J.; Cho, M.; Crafford, J.; De Klerk, L.P.; Dini, J.A.; Harris, K.; Holness, S.D.; Le Roux, W.; et al. Assessment of the Ecological Integrity of the Zaalklapspruit Land in Mpumalanga (South Africa) Before and After Rehabilitation: The Grootspruit Case Study: Report to the Water Research Commission, Pretoria, South Africa. 2016. Available online: https://wrcwebsite.azurewebsites.net/wp-content/uploads/mdocs/2230%20Volume%202%20-%20Jo.pdf (accessed on 10 September 2025).
  15. Forsyth, G.; Kruger, F.; Le Maitre, D. National Veldfire Risk Assessment: Analysis of Exposure of Social, Economic and Environmental Assets to Veldfire Hazards in South Africa; National Resources and the Environment CSIR, Fred Kruger Consulting cc: Stellenbosch, South Africa, 2010. [Google Scholar]
  16. Kotze, D. The effects of fire on wetland structure and functioning. Afr. J. Aquat. Sci. 2013, 38, 237–247. [Google Scholar] [CrossRef]
  17. Staebe, K.; Botes, M.; Madlala, T.; Oberholster, P.J.; Cloete, T.E. Microbial community diversity as a potential bioindicator of AMD and steel plant effluent in a channeled valley bottom wetland. Water Air Soil Pollut. 2018, 229, 397. [Google Scholar] [CrossRef]
  18. Jansen van Vuuren, M.; Schoeman, Y.; Botha, A.-M.; Oberholster, P.J. Revealing the Protective Dynamics of an Ecologically Engineered Wetland against Acid Mine Drainage: A Case Study in South Africa. Appl. Sci. 2024, 14, 7441. [Google Scholar] [CrossRef]
  19. Shelton, L.; Capel, P. Guidelines for Collecting and Processing Samples of Stream Bed Sediment for Analysis of Trace Elements and Organic Contaminants for the National Water-Quality Assessment Program; U.S. Geological Survey: Reston, VA, USA, 1994. [CrossRef]
  20. Apello, C.A.J.; Potsma, D. Geochemistry, Groundwater and Pollution, 2nd ed.; Buaikema Publishers: Leiden, The Netherlands, 2005. [Google Scholar]
  21. Girts, M.A.; Kleinmann, R.L.P.; Erickson, P.E. Performance data on Typha and Sphagnum wetlands constructed to treat coal mine drainage. In Proceedings of the 8th Annual Surface Mine Drainage Task Force Symposium, Morgantown, WV, USA, 7–8 April 1987. [Google Scholar]
  22. Wieder, R.K. Ion input:output budgets for five wetlands constructed for acid coal mine drainage treatment. Water Air Soil Pollut. 1993, 71, 231–270. [Google Scholar] [CrossRef]
  23. Ostenfeld, C.H.; Nygaard, G. On the phytoplankton of the Gatun lake, Panama Canal. Dan. Bot. Ark. 1925, 4, 1–16. [Google Scholar]
  24. Truter, E. An Aid to the Identification of the Dominant and Commonly Occurring Genera of Algae Observed in Some South African Impoundments; Department of Water Affairs: Pretoria, South Africa, 1987; pp. 1–97.
  25. Komarek, J.; Anagnostidis, K. Cyanoprokaryota: Chroococcales. In Susswasserflora von Mitteleuropa 19/1; Ettl, H., Gartner, G., Heynig, H., Mollenhauer, D., Eds.; Gustav Fischer: Stutgart, Germany, 1999. [Google Scholar]
  26. Wehr, J.D.; Sheath, R.G. Freshwater Algae of North America Ecology and Classification; Academic Press: San Diego, CA, USA, 2003. [Google Scholar]
  27. American Public Health Association (APHA). Standard Methods for Examination of Water and Wastewater, 20th ed.; American Public Health Association: Washington, DC, USA, 2006. [Google Scholar]
  28. Berger, W.H.; Parker, F.L. Diversity of planktonic Foraminifera in deep sea sediments. Science 1970, 168, 1345–1347. [Google Scholar] [CrossRef]
  29. Vanhaecke, F.; Vanhoe, H.; Dams, R.; Vandecasteele, C. The use of internal standards in ICP-MS. Talanta 1992, 39, 737–742. [Google Scholar] [CrossRef]
  30. Stevenson, R.J.; Bahls, L.L. Periphyton protocols. In Rapid Bioassessment Protocols for Use in Streams and Wadeable Rivers: Periphyton, Benthic Macroinvertebrates and Fish, 2nd ed.; EPA 841-B-99-002; Barbour, M.T., Gerritren, J., Snyder, B.D., Stribling, J.B., Eds.; U.S. Environmental Protection Agency: Washington, DC, USA, 1999; Volume 6, pp. 1–22. [Google Scholar]
  31. Dube, T.; Wepener, V.; van Vuren, J.; Smit, N.; Brendonck, L. The case for environmental flow determination for the Phongolo River, South Africa. Afr. J. Aquat. Sci. 2015, 40, 269–276. [Google Scholar] [CrossRef]
  32. Brown, T.J.; Hall, B.L.; Westerling, A.L. The Impact of Twenty-First Century Climate Change on Wildland Fire Danger in the Western United States: An Applications Perspective. Clim. Change 2004, 62, 365–388. [Google Scholar] [CrossRef]
  33. Qian, Y.; Miao, S.L.; Gu, B.; Li, Y.C. Effects of Burn Temperature on Ash Nutrient Forms and Availability from Cattail (Typha domingensis) and Sawgrass (Cladium jamaicense) in the Florida Everglades. J. Environ. Qual. 2009, 38, 451–464. [Google Scholar] [CrossRef] [PubMed]
  34. Gluns, D.R.; Toews, D.A. Effect of a major wildfire on water quality in southeastern British Columbia. In Proceedings of the Symposium on Headwaters Hydrology, Bethesda, MD, USA, 27–30 June 1989; American Water Resources Association: Middleburg, VA, USA; pp. 487–499. [Google Scholar]
  35. Ranalli, A.J. A Summary of the Scientific Literature on the Effects of Fire on the Concentration of Nutrients in Surface Waters; US Geological Survey: Reston, VA, USA, 2004; 23p. [Google Scholar]
  36. Spencer, C.N.; Hauer, F.R. Phosphorus and nitrogen dynamics in streams during a wildfire. J. N. Am. Benthol. Soc. 1991, 10, 24–30. [Google Scholar] [CrossRef]
  37. Du Plessis, J.A.; Van Zyl, H. The effect of veld fires on the hydrological response of streamflow. Water SA 2021, 47, 185–193. [Google Scholar] [CrossRef]
  38. Kutiel, P.; Inbar, M. Fire impacts on soil nutrients and soil nutrients and soil erosion in a Mediterranean pine forest plantation. Catena 1993, 20, 129–139. [Google Scholar] [CrossRef]
  39. Mackay, S.M.; Robinson, G. Effects of wildfire and logging on stream water chemistry and cation exports of small forested catchments in south-eastern New South Wales, Australia. Hydrol. Process. 1987, 1, 359–384. [Google Scholar] [CrossRef]
  40. Oberholster, P.J.; Madlala, T.; Oberholster, P.F. Post Restoration Monitoring of the Zaalklapspruit Wetland with Special Reference to Groundwater-Surface Water Interaction; Coaltech Technical Report: E2019-7; Coaltech: Johannesburg, South Africa, 2019; pp. 1–21. [Google Scholar]
  41. Oberholster, P.J.; Botha, A.-M.; Hill, L.; Strydom, W.F. River catchment responses to anthropogenic acidification in relationship with sewage effluent: An ecotoxicology screening application. Chemosphere 2017, 189, 407–417. [Google Scholar] [CrossRef]
  42. Wang, Y.; Wai, K.M.; Gao, J.; Liu, X.H.; Wang, T.; Wang, W.X. The impacts of anthropogenic emissions on the precipitation chemistry at an elevated site in North-eastern China. Atmos. Environ. 2008, 42, 2959–2970. [Google Scholar] [CrossRef]
  43. Josipovic, M.; Annegarn, H.J.; Kneen, M.A.; Pienaar, J.J.; Piketh, S.J. Atmospheric dry and wet deposition of sulphur and nitrogen species and assessment of critical loads of acidic deposition exceedance in South Africa. S. Afr. J. Sci. 2011, 107, 10. [Google Scholar] [CrossRef]
  44. Behra, R.; Landwehrjohann, R.; Vogel, K.; Wagner, B.; Sigg, L. Copper and zinc content of periphyton from two rivers as a function of dissolved metal concentration. Aquat. Sci. 2002, 64, 300–306. [Google Scholar] [CrossRef]
  45. Hill, W. Effects of light. In Algal Ecology: Freshwater Benthic Ecosystems; Stevenson, R., Bothwell, M., Lowe, R., Eds.; Academic Press: Cambridge, UK, 1996; pp. 121–148. [Google Scholar]
  46. Meylan, S.; Behra, R.; Sigg, L. Influence of metal speciation in natural freshwater on bioaccumulation of copper and zinc in periphyton: A microcosm study. Environ. Sci. Technol. 2004, 38, 3104–3111. [Google Scholar] [CrossRef]
  47. Brouwer, J.F.C.; Deckere, E.M.G.T.; Stal, L.J. Distribution of extracellular carbohydrates in three intertidal mudflats in Western Europe. Estuar. Coast. Shelf Sci. 2003, 56, 313–324. [Google Scholar] [CrossRef]
  48. Pal, A.; Paul, A.K. Microbial extracellular polymeric substances: Central elements in heavy metal bioremediation. Indian J. Microbiol. 2008, 48, 49–64. [Google Scholar] [CrossRef]
  49. Valente, T.M.; Gomes, C.L. The role of two acidophilic algae as ecological indicators of acid mine drainage sites. J. Iber. Geol. 2007, 33, 283–294. [Google Scholar]
  50. Stevens, A.E.; McCathy, B.C.; Vis, M.L. Metal content of Klebsormidium-dominated (Chlorophyta) algal mats from acid mine drainage waters in southeastern. J. Torrey Bot. Soc. 2001, 128, 226–233. [Google Scholar] [CrossRef]
  51. Boshoff, G.; Duncan, J.; Rose, P.D. The use of micro-algal biomass as a carbon source for biological sulphate reducing systems. Water Res. 2004, 38, 2659–2666. [Google Scholar] [CrossRef] [PubMed]
  52. Molwantwa, J.B.; Molipane, N.P.; Rose, P.D. Biological sulfate reduction utilizing algal extracellular products as a carbon source. In Proceedings of the WISA 2000 Biennial Conference, Sun City, South Africa, 20 May 2000; Volume 28. [Google Scholar]
  53. Van Hille, R.P.; Boshoff, G.A.; Rose, P.D.; Duncan, J.R. A continuous process for the biological treatment of heavy metal contaminated acid mine water. Resour. Conserv. Recycl. 1999, 27, 157–167. [Google Scholar] [CrossRef]
  54. Nordi, C.; Vieira, A.; Nascimento, O. The metal binding capacity of Anabaena spiroides extracellular polysaccharide: An EPR study. Process Biochem. 2005, 40, 2215–2224. [Google Scholar] [CrossRef]
  55. Greenway, M. Nutrient content of wetland plants in constructed wetlands receiving municipal effluent in tropical Australia. Water Sci. Technol. 1997, 35, 135–142. [Google Scholar] [CrossRef]
  56. Christakis, N.; Cross, M.; Patel, M.K.; Tüzün, U. A Hybrid Approach for the Modelling of Complex Systems: Methodologies and Applications. J. Algorithms Comput. Technol. 2013, 7, 113–143. [Google Scholar] [CrossRef]
  57. Rojas Cala, E.F.; Béjar, R.; Mateu, C.; Borri, E.; Romagnoli, A.; Cabeza, L.F. Modeling of TES Tanks by Means of CFD Simulation Using Neural Networks. Energies 2025, 18, 511. [Google Scholar] [CrossRef]
  58. Rousseau, D.P.; Vanrolleghem, P.A.; De Pauw, N. Model-based design of horizontal subsurface flow constructed treatment wetlands: A review. Water Res. 2004, 38, 1484–1493. [Google Scholar] [CrossRef]
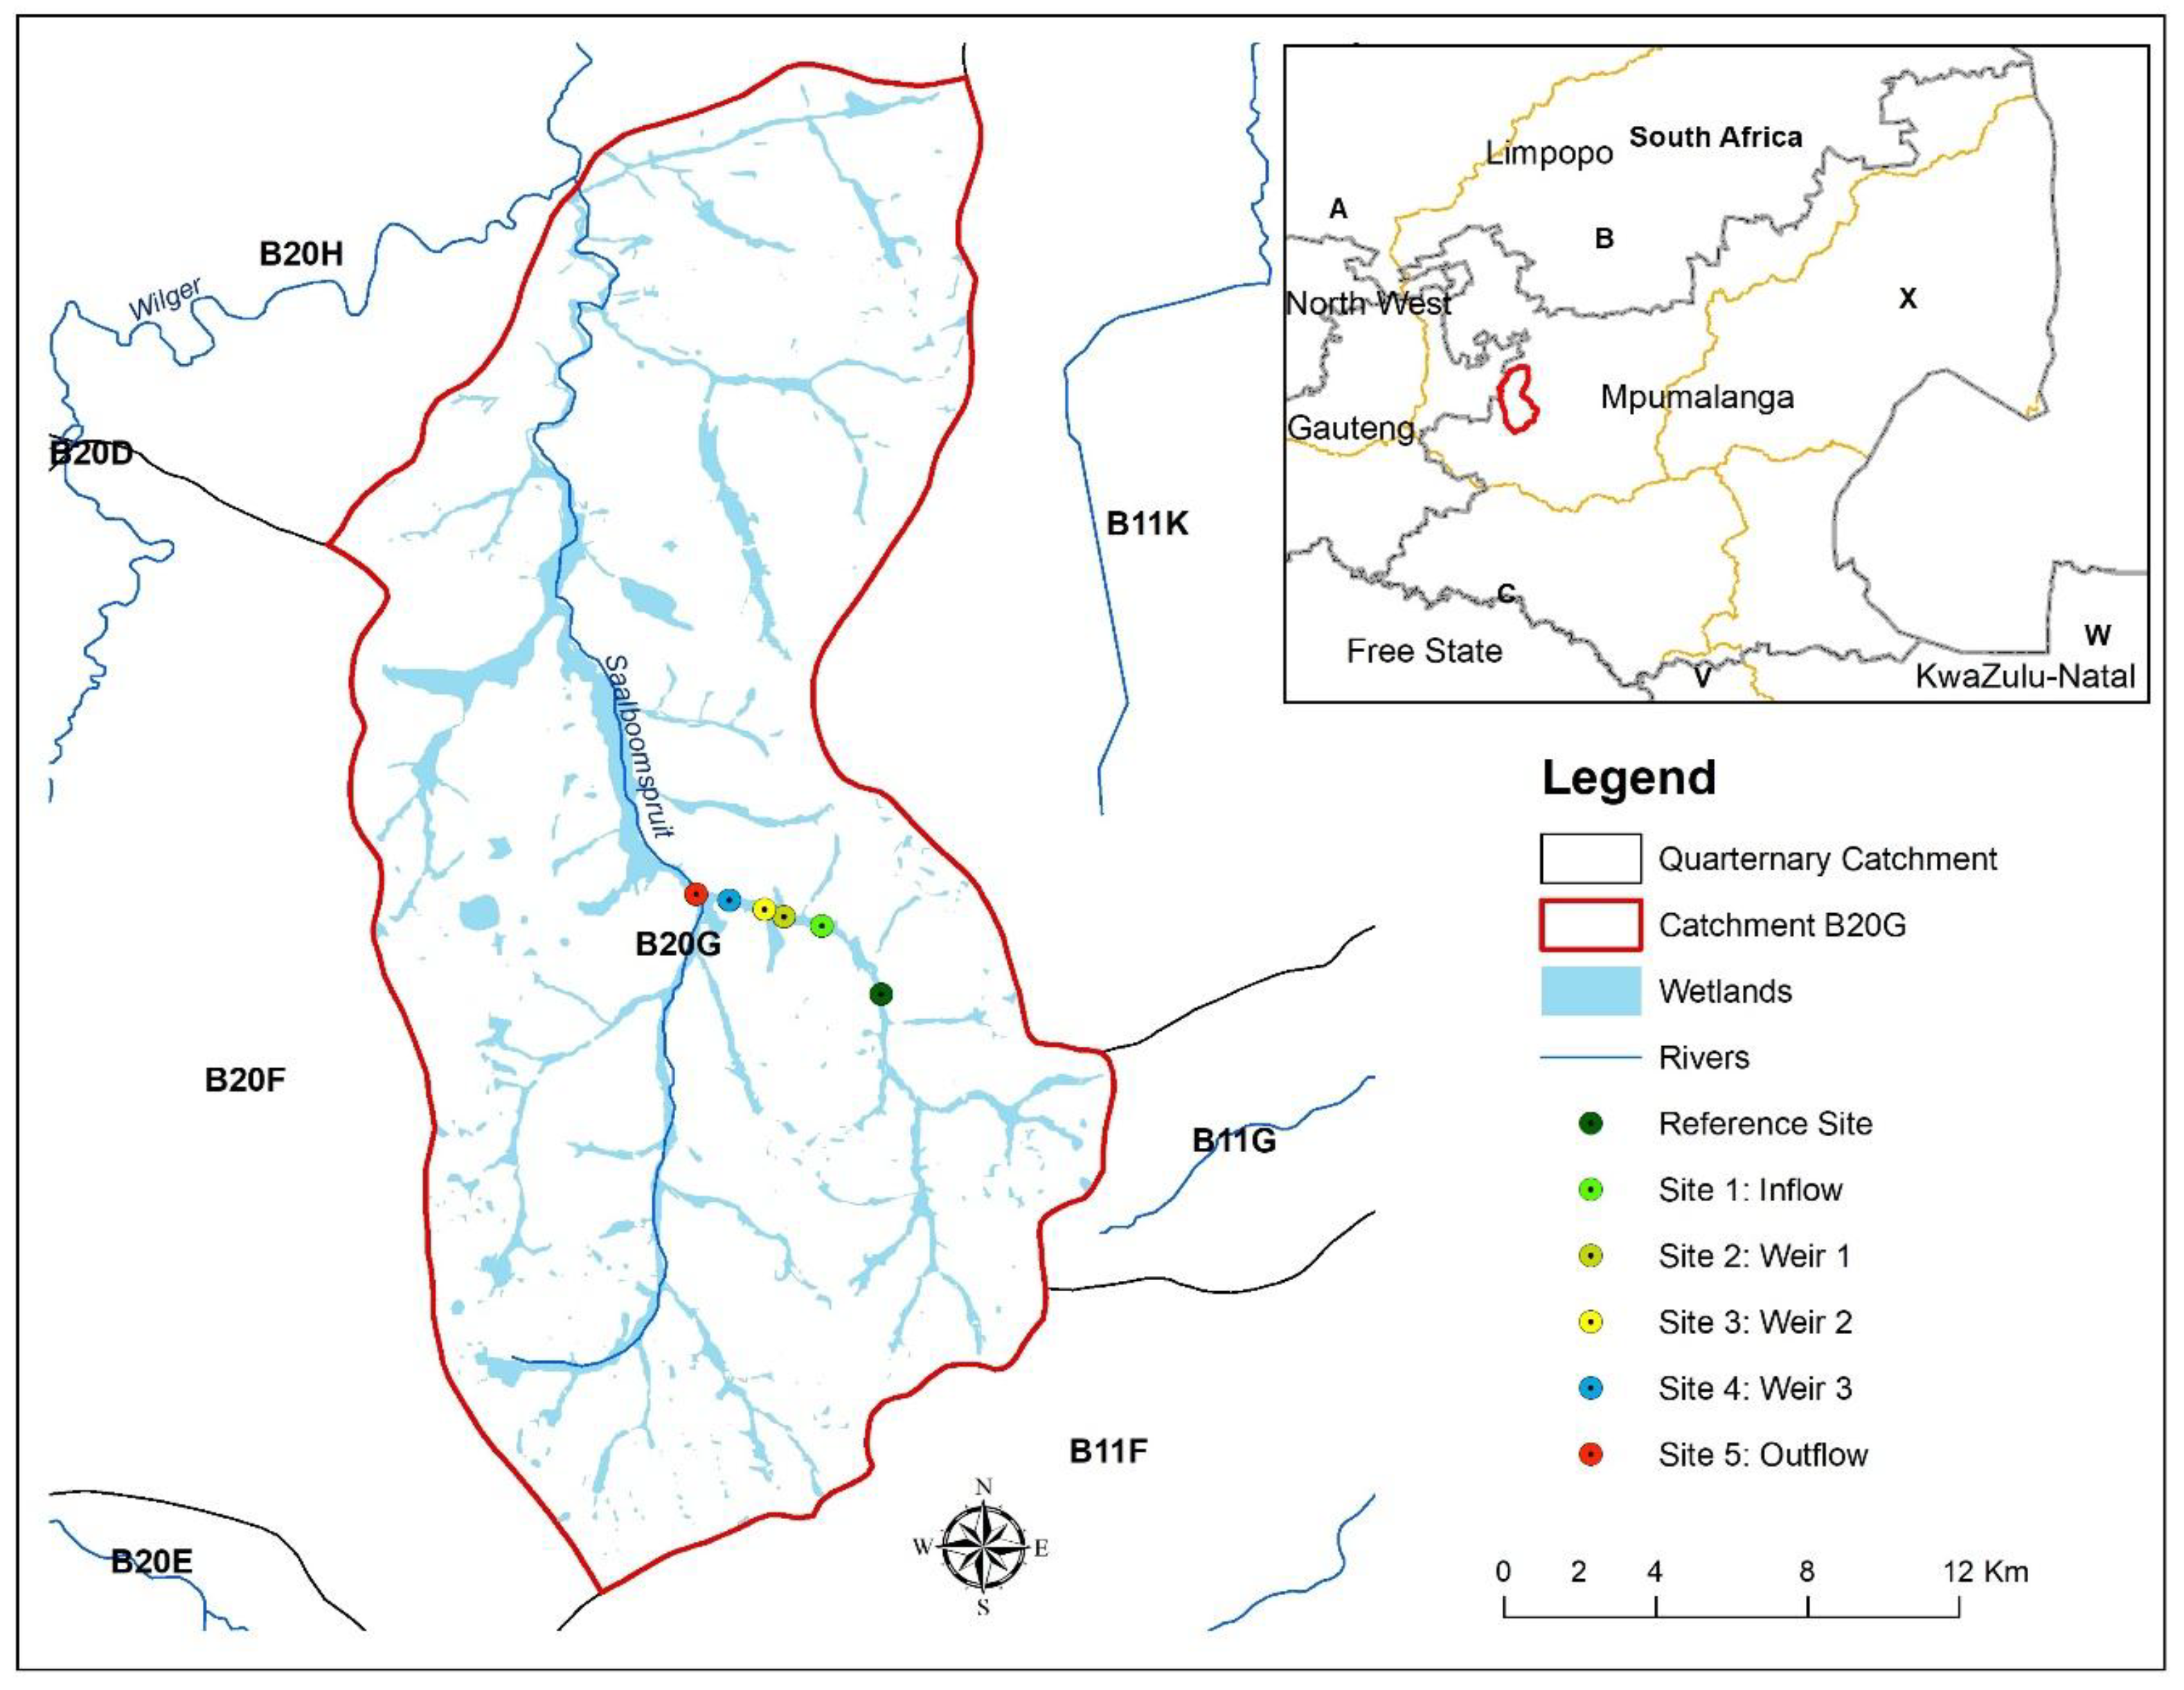
Figure 1. A map of the Zaalklapspruit wetland indicating the 5 water-sampling locations as well as the reference site in Mpumalanga Province, South Africa. Letters A, B, X and W represent labels of catchment areas in Souh Africa.
Processes 13 03494 g001
Figure 2. (A) Before the veldfire, June 2020 (winter), and after the veldfire, July 2020 (winter) (BD) (source of photo: Oberholster P.J.).
Processes 13 03494 g002
Figure 3. Selected physical and chemical parameters measured before and after the veldfire per site. (a) Concentrations of Al, Fe, Mn, Cu, Zn, Si and TN before veldfire per site; (b) concentrations of Ca, Mg, Na, K and SO4 before veldfire per site; (c) concentrations of Al, Fe, Mn, Cu, Zn, Si and TN after veldfire per site; (d) concentrations of Ca, Mg, Na, K and SO4 after veldfire per site.
Processes 13 03494 g003
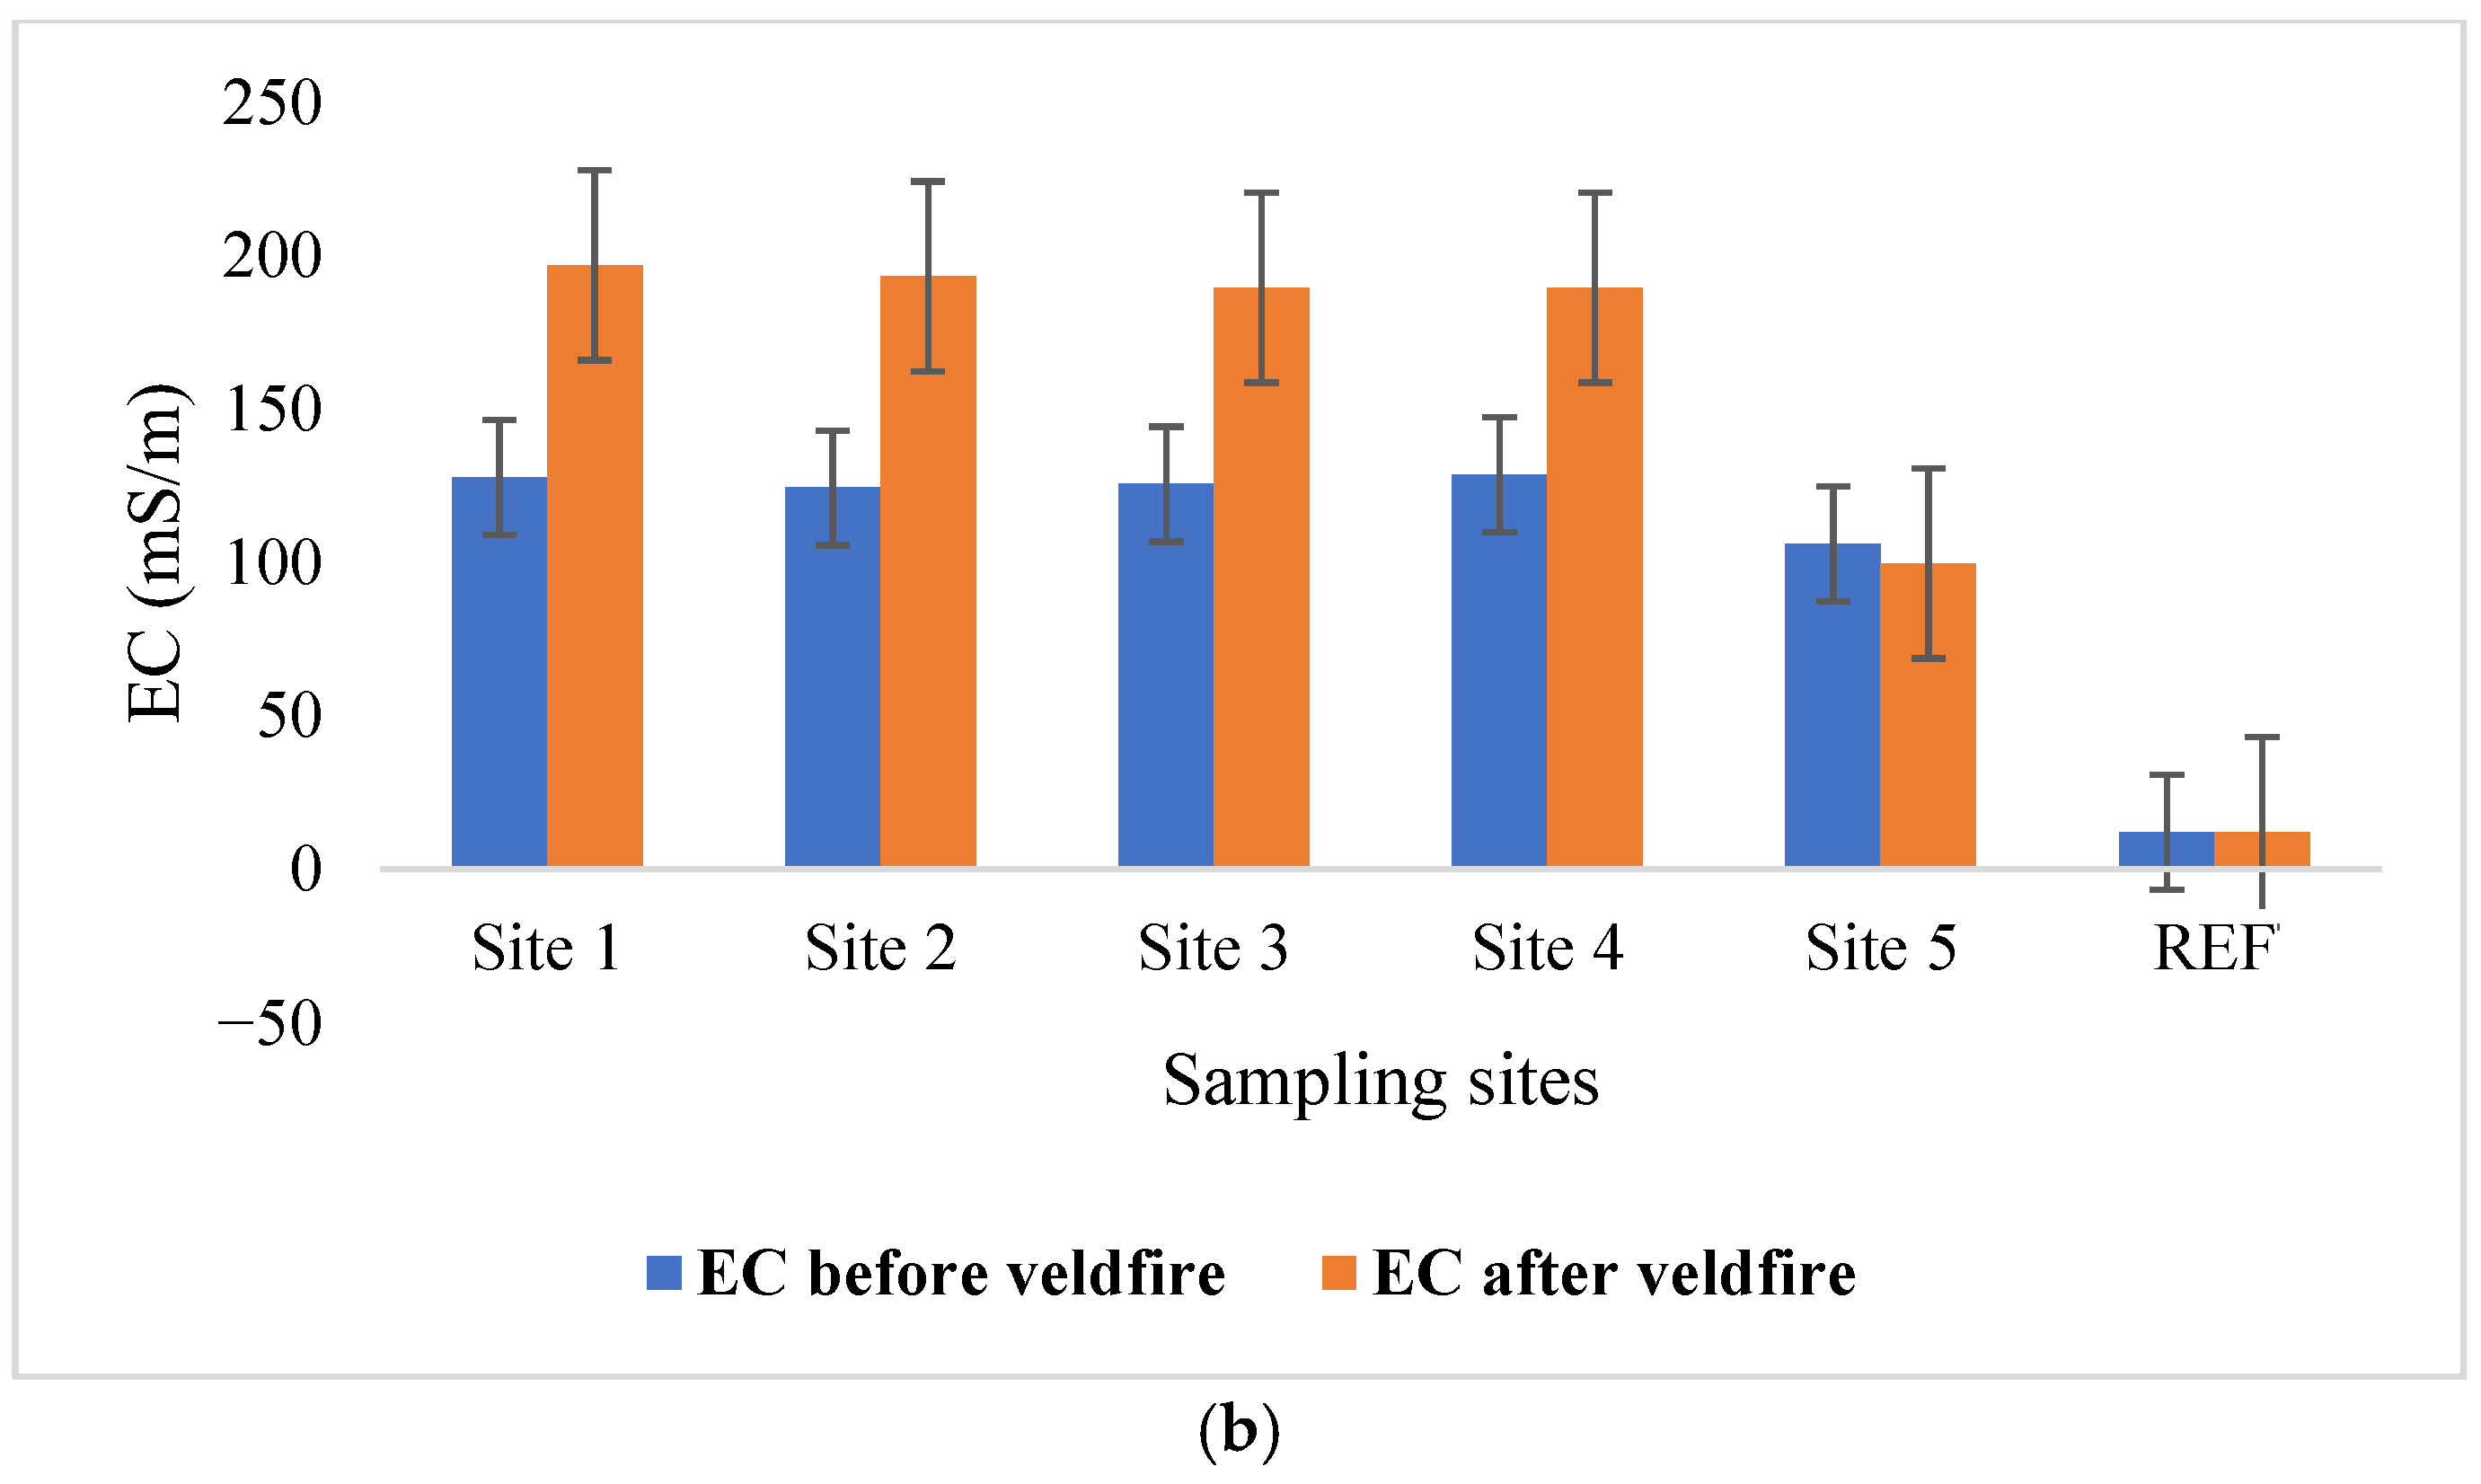
Figure 4. pH and electrical conductivity measured before and after the veldfire per site. (a) pH before and after veldfire; (b) EC before and after veldfire.
Processes 13 03494 g004aProcesses 13 03494 g004b
Figure 5. Atmospheric precipitation in the wetland during 2020.
Processes 13 03494 g005
Figure 6. A flow diagram of the concept of a black box representing a complex system. In principle, with enough inputs and outputs, some characteristics of the complex system can be inferred.
Processes 13 03494 g006
Figure 7. A flow diagram of the concept of a digital twin-driven black box model for accurately quantifying the influence of external disturbances (such as natural disasters) on the treatment capacity of ecologically engineered wetlands.
Processes 13 03494 g007
Table 1. The characteristics of the Zaalklapspruit ecologically engineered wetland sampling sites after the veldfire in 2020.
SitesBottom Substrate CharacteristicAverage Water Column Depth Per Site (cm)Source of Land-Use ImpactsAsh Slurry Macroalgae Mat Formation After Veldfire (>5 m2) at Each Sampling SiteAverage Thickness (mm) of Bottom Hydroxide Precipitate Observed
Reference siteSand, silt 51 cmAgriculture activities and sand mining upstream None00 mm
Site 1 (inflow)Sand17 cmAMD effluent from coal miningLow quantities6 m20 mm
Site 2Silt and clay15 cmAgriculture and AMD effluent from coal miningLow quantities4 m21 mm
Site 3Clay11 cmAgriculture and AMD effluent from coal miningMedium quantities9 m21 mm
Site 4Clay, Sand13 cmAgriculture and AMD effluent from coal miningMedium quantities8 m21 mm
Site 5 (outflow)Clay10 cmAgriculture and AMD effluent from coal miningLarge quantities15 m20 mm
Table 2. Parameter means and standard deviations before and after the veldfire in the Zaalklapspruit ecologically engineered wetland at five sampling sites.
ParametersUnitsRQOsTWQRMean and (SD) Before Veldfire Across Sites 1–5Mean and (SD) After Veldfire Across Sites 1–5Before Veldfire
(REF Site)
After Veldfire
(REF Site)
pH 94.71 (0.82)4.31 (1.38)8.98.9
ECmS/m 70–250122.42 (8.32)173.77 (37.18)1212
SO4mg/L200N/A715.90 (87.81)1351.19 (443.84)1616
TNmg/L N/A4.60 (4.18)5.02 (1.38)0.50.5
Almg/L0.1050.0050.83 (0.41)1.98 (1.00)0.010.01
Mnmg/L0.990.0145.66 (2.27)8.73 (4.28)0.010.01
Femg/L 0.00010.09 (0.06)0.68 (0.56)0.020.02
Simg/LN/AN/A5.22 (2.38)7.66 (1.76)2.12.1
Namg/L N/A28.90 (7.08)31.59 (1.62)
Camg/L N/A174.3 (26.09)281.16 (105.33)
Clmg/L3.1 free Cl0.000218.90 (2.66)23.73 (3.08)
Znmg/L25.20.0020.16 (0.08)0.28 (0.07)
Cumg/L60.00120.01(0.00)0.02 (0.00)
Table 3. Critical metrics to consider when designing a digital twin black box model of ecologically engineered wetlands.
MeasurableAccuracyResolutionTime Scales Captured and Represented
in Complex System (or Black Box)
C i n Optimally based on complex mixEvery 1 s, long-term online monitoringHourly, daily and seasonal effects
C o u t Optimally based on complex mixEvery 1 s, long-term online monitoringHourly, daily and seasonal effects
F l o w i n
F l o w O u t
±0.01 m/sEvery 1 s, long-term online monitoringHourly, daily and seasonal effects
Macro- + micro-governing dynamics
Localized weather (temperature, humidity at different heights and windspeeds) ± 0.2   ° C for digital temperature and ± 3 % for humidity and windspeedEvery 1 s, long-term online monitoringHumidity rallies, stratification, abnormal transient weather effects
Disclaimer/Publisher’s Note: The statements, opinions and data contained in all publications are solely those of the individual author(s) and contributor(s) and not of MDPI and/or the editor(s). MDPI and/or the editor(s) disclaim responsibility for any injury to people or property resulting from any ideas, methods, instructions or products referred to in the content.