Abstract
Feed quality has been found to be related to both reactivity and sediment formation propensity in the residue hydrocracking process defining the conversion level. In this research, unlike other investigations, which examine hydrocrackability of individual vacuum residues, 529 mixtures of 33 vacuum residues were investigated for their hydrocrackability in a commercial H-Oil ebullated bed reactor unit. Intercriteria and regression analyses, together with singular value decomposition (SVD) and deep learning neural network techniques were employed to analyze data and model the vacuum residue conversion in the H-Oil unit. It was found that SVD model provided the best fit of H-Oil conversion training data (standard error of 0.95 wt.%). However, due to overfitting, the SVD model failed to predict H-Oil conversion on unseen data (standard error of 5.1 wt.%). The deep learning neural network exhibited standard error for all data (training, validation and testing) of 1.99 wt.%, while for the test data it was 2.35 wt.%. The linear regression model showed a standard error of 3.9 wt.% for the training data and 7.5 wt.% for the test data. Eleven properties of the vacuum residue (density, microcarbon residue, sulfur, nitrogen, saturate, aromatic, resin, C5-asphaltene, C7-asphaltene, Na, and Ni+V content) seem to be sufficiently informative for the purposes of modeling and predicting H-Oil conversion, thus enabling the assessment of the suitability of a given vacuum residue to be used as a feedstock for the H-Oil process. The best predicting model was found to be the deep learning neural network, which can be used for the purpose of the crude selection process.
1. Introduction
The most complex fraction of crude oil in terms of chemical structure and composition is the vacuum residue [1]. The number of constituents making up the vacuum residues is considered to be between several thousands and one million [2,3,4]. It is reported that only 5% of species of the vacuum residues have been isolated or identified and characterized [2]. Based on this finding, it is easy to understand that vacuum residues have been and are still a conundrum to those who work with them. Over the years, attempts have been made to reduce the complexity of the vacuum residues and simulate their intricate chemical nature by their reconstruction from predefined individual molecules, which are appropriately mixed so that to mimic measured vacuum residue properties [5,6,7,8]. The reconstitution techniques aim to understand the processes of vacuum residue upgradation at the molecular level, accurately predict product properties, optimize processes, and increase their added value [9,10,11]. The various reconstitution techniques try to reduce complexity by using fundamental chemistry in representing molecular structure, mixture composition and process chemistry [12,13,14]. Their intention is not to drastically reduce the number of components in the mixture, but to include a manageable number of residue molecules that are representative enough to simulate the properties of the vacuum residue [9]. Trauth et al. [13] constructed between 1 000 and 100 000 residue molecules to represent a residual feedstock. They found that 10,000 residue molecules were sufficient to simulate the properties of the vacuum residue, such as H/C ratio, molecular weight, and SARA composition. Petti et al. [14] deduced that the number of residue molecules to be used for vacuum residue reconstruction should be between 1000 and 10,000. However, they calculated that the standard deviation of predicted residue property using 10,000 molecules was less than one compared to about five when the reconstruction was performed with 1000 residue molecules. Zhang et al. [6] reported that they generated about 400,000 residue molecules using FT-ICR MS data and probability distribution functions (PDFs) and quantitative structure–property relationships (QSPRs). Campbell and Klein [15] defined that from a practical point of view, given the optimization of CPU time, the number of molecules used in the reconstruction process should be limited to 100,000. Jaffe et al. [16] established that ~1500 composite molecules are sufficient to cover the compositional diversity found in residua. The IFP group of scientists dealing with the vacuum residue reconstruction [3,4,17,18,19,20] established that 5000 vacuum residue molecules are the optimal balance between the required CPU time and the accuracy of the residue representation. Kinetic models based on reconstituted vacuum residue have been developed to predict residue hydroprocessing performance [4,17,18,19,20,21]. Engineering practice in oil refineries using hydrocracking of residues has not yet reported the application of predictive models developed based on vacuum residue reconstruction. The likely reason for this may be the lack of analytical information needed to verify the correctness of the reconstructed vacuum residue composition, as such information is usually not available to oil refineries. Since petroleum refining engineers have neither the information provided by sophisticated analytical techniques nor the models discussed above, they must rely on empirical correlations developed based on a specific data set to predict the behavior of different feedstocks during residue hydrocracking. Typically, empirical correlations are developed using pilot plant data and then verified in commercial residue hydrocracking plants [22,23]. Some of the correlations use vacuum residue characteristics such as specific gravity, Conradson carbon, sulfur, asphaltene and metal content [22], which are easily available for refiners while others employ techniques for asphaltene characterization like asphaltene solubility profile and solubility fractions [23] that are not easily available for refiners. The present study examines several cases of the operation and performance of a commercial ebullated bed vacuum residue hydrocracker during the processing of high and low asphaltene vacuum residues mixed with other miscellaneous residues, heavy oils, and aromatic diluents under different catalyst conditions and liquid hourly-space velocities (LHSV). A limited set of data about the ratio of difficult-to-dissolve to easy-to-dissolve asphaltenes as such determined by the method of Ovalles et al. [24] and by the SAR-AD method [25] of some vacuum residues investigated in this work are contrasted to their behavior in commercial ebullated bed hydrocracker.
The aim of this work is to investigate the behavior of mixtures of several different vacuum residues hydrocracked in a commercial H-Oil plant, and to seek a relationship between the characteristics of the vacuum residues and the operation and performance of H-Oil hydrocracker.
2. Materials and Methods
The properties of vacuum residues hydrocracked in the commercial H-Oil hydrocracker under study are summarized in Table 1. True boiling point (TBP) fraction yields of the crude oils whose vacuum residues were blended in various ratios and hydrocracked in the commercial H-Oil hydrocracker, along with specific gravity (SG) and sulfur content data, are presented in Table 2. The range of variation of the percentage content of individual crude oils and their derived vacuum residues in mixtures of crude oils and vacuum residues processed during the study is given in Table 3.

Table 1.
Physicochemical properties of vacuum residues hydrocracked in the commercial H-Oil hydrocracker under study.

Table 2.
Data on the specific gravity, sulfur content and TBP fraction yields from crude oils whose vacuum residues were blended and processed in the commercial H-Oil hydrocracker under study.

Table 3.
Range of variation in the content of crude oils and their derived vacuum residues in mixtures of crude oil and vacuum residues processed during the study.
The content of saturates in the vacuum residues was computed by Equation (1) as discussed in [26].
where,
Saturates = content of saturates in vacuum residue, wt.%.
SG = specific gravity at 15.6 °C of vacuum residue.
The content of resins was calculated as a difference between C5-asphaltenes and C7-asphaltenes. The content of aromatics was estimated as 100%–Saturates–Resins–C7-asphaltenes. In this way, SARA composition of vacuum residues was determined in this study. The SARA composition of vacuum residue mixtures is calculated as the percentage of each individual vacuum residue in the mixture divided by 100 and multiplied by the percentage of SARA fractions of each individual vacuum residue.
The molecular weight of vacuum residues was estimated by the correlation of Goosens, as exemplified in Equation (2) [27].
where,
T50% = boiling point of 50% evaporate of vacuum residue, determined by ASTM D 7169 method, °C [28];
d = density of vacuum residue at 20 °C, g/cm3.
The diapason of change in the characteristics of the vacuum residue mixtures, the number of which in this research is 529, is summarized in Table 4.

Table 4.
Ambit of alteration in the characteristics of the vacuum residue mixtures being hydrocracked in the commercial H-Oil hydrocracker.
The vacuum residue mixtures were hydrocracked in the commercial H-Oil unit of LUKOIL Neftohim Burgas refinery. A process diagram and the operating conditions of the H-Oil hydrocracker under study are detailed in [29]. Weight average bed temperature (WABT) varied between 418 and 436 °C, while the liquid hourly space velocity (LHSV) fluctuated between 0.15 and 0.19 h−1.
Conversion of vacuum residue in the H-Oil hydrocracker was calculated as shown in Equation (3).
where,
= mass flow rate of H-Oil feed fraction boiling above 540 °C, determined by high temperature simulated distillation ASTM D 7169 [28].
where,
= viscosity of vacuum residue measured at temperature T, cSt;
= temperature at which vacuum residue viscosity is measured, °C;
= mass flow rate of H-Oil product fraction boiling above 540 °C, determined by high temperature simulated distillation ASTM D 7169 [28].
In short, the idea of intercriteria analysis (ICrA) is as follows. Let us have an index matrix (IM, see, e.g., [30]) whose rows are indexed with the identifiers of m objects and whose columns are indexed with the identifiers of n criteria (see, for example, the matrices from Table 5 and Table 6 discussed Section 3.1 of this article—they have forms of IMs). For every two fixed criteria, we take the evaluations of a pair of objects (a total of m (m−1)/2 pairs) and check the relationships between the evaluations of the two objects on the first and second of the selected criteria. We count the pairs of relations that are one-way (“<“ and “<“, or “>” and “>”), the pairs of relations that are two-way (“<“ and “>”, or “>” and “<“), and those pairs in which there is equality in at least one place. Let M be the total number of one-way inequalities, N be the total number of two-way inequalities, and P be the total number of equalities. It is obvious that M + N + P = m (m − 1)/2. Let , , . Then, the pair is an intuitionistic fuzzy pair (IFP, see, e.g., [31]), i.e., it is a pair of the form , where a, b, a + b [0, 1], a corresponds to the degree of membership, validity, proximity, etc., b corresponds to the degree of non-membership, non-validity, non- proximity and 1 − a − b corresponds to the degree of uncertainty. Each IFP is represented as a point in the intuitionistic fuzzy interpretation triangle (see Figure 1). When the IFP is close to the vertex with coordinates ⟨1,0⟩ (see the green dots in Figure 1), we say that the two criteria whose proximity evaluation corresponds to this point are in positive consonance. When the IFP is close to the vertex with coordinates ⟨0,1⟩ (see the blue dots in Figure 1), we say that the two criteria that correspond to this point are in negative consonance. For the remaining IFPs (the purple ones in Figure 1), we say that they are in dissonance. ICrA estimates two intuitionistic fuzzy functions: μ and υ, whose values determine the extent of the relationship between the studied parameters.

Table 5.
μ-values from ICrA evaluation of vacuum residue property data from Table 1.

Table 6.
υ-values from ICrA evaluation of vacuum residue property data from Table 1.
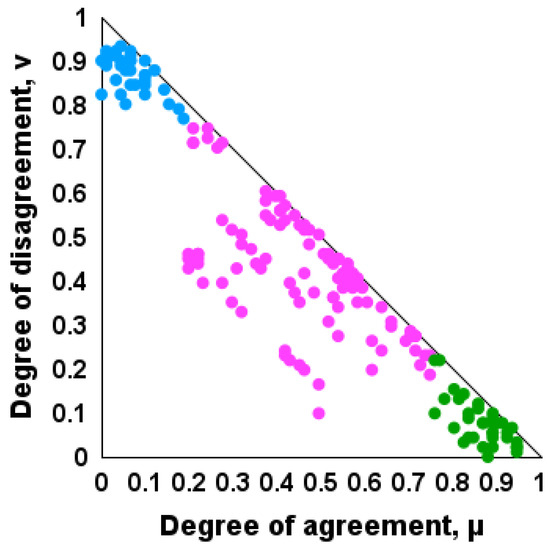
Figure 1.
Results of the application of ICrA to the data from Case 1 with increased sedimentation rate in the commercial H-Oil vacuum residue hydrocracker after a major overhaul carried out in March–April 2025, discussed in Section 3.2 of this article, visualized into the intuitionistic fuzzy interpretational triangle. (Green dots indicate positive consonances; blue dots display negative consonances; purple dots exhibit dissonances).
Since correlation analyses assign a number to each pair of criteria, this number (after normalization to the interval [0, 1]) can be represented as a point on the hypotenuse of the interpretation triangle. This point has an x-coordinate close in value to —the evaluation obtained through ICrA. The correlation analyses establish a degree of closeness between criteria. When such a degree is high (close to 1), its value is close to (in many cases-equal to) the number that corresponds to positive consonance in ICrA. Unlike correlation analyses, as we showed above, ICrA distinguishes lower proximity values of those that are in dissonance and those that are in negative consonance. Furthermore, ICrA shows whether a point lies on the hypotenuse (this corresponds to a fuzzy, but not a proper intuitionistic fuzzy evaluation) or is distant from it. While the coordinates of the point in the interpretation triangle correspond exactly to its - and -degrees, the distance of the point from the hypotenuse corresponds to its degree of uncertainty . Points that have a high degree of uncertainty (for example, when their < 0.5) indicate a lack of certainty in the evaluation.
Following [32], it is very important to note that when the evaluations of the objects on the different criteria are in the interval [0, 1], ICrA allows one to search for the degree of proximity both between the criteria (the procedure described above) and between the objects—the criteria and the objects are simply swapped in the matrix.
The theory and application of ICrA are detailed in [33]. In Figure 1, μ = 0.75 ÷ 1.00 and υ = 0 ÷ 0.25, a region of statistically meaningful positive consonance is defined, while at μ = 0 ÷ 0.25 and υ = 0.75 ÷ 1.00, an area of statistically meaningful negative consonance is derived. Usually, all other cases are considered to be dissonance—the purple points in Figure 1). But, as we see from Figure 2, we can divide the points in the interpretation triangle into those that correspond to dissonance between the criteria (the purple points in Figure 1 and Figure 2), and those that correspond to full uncertainty (the black points in Figure 2), which indicate a strong degree of uncertainty, i.e., inability to determine the dependence between the pairs of criteria that correspond to these points.
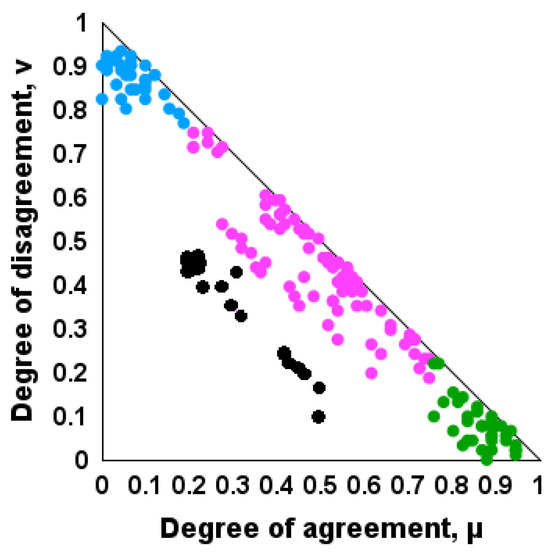
Figure 2.
Modification of Figure 1 with a zone of dissonance with a high degree of uncertainty (the black dots). Green dots indicate positive consonances; blue dots display negative consonances; purple dots exhibit dissonances).
Two software packages for ICrA were developed and freely available as open source from https://intercriteria.net/software/ (accessed on 25 October 2025) and detailed in [34,35,36].
The linear–nonlinear model combines linear regression with simple nonlinear transforms (signed power and hyperbolic tangent) applied to scaled input features, optimizing parameters such as the power exponent, tanh scale, and Ridge (or Tikhonov)-regularization strength. Model fitting relies on Iteratively Reweighted Least Squares (IRLS) with singular value decomposition for robust coefficient estimation, while nonlinear parameters are efficiently selected via Bayesian optimization using Python 3.12 and Optuna 4.5. The main objective is to minimize the mean absolute relative error between predictions and true values, with feature scaling (z-score or robust normalization) ensuring comparable input distributions. Ridge regularization penalizes large coefficients to prevent overfitting and improve generalization. All software components are implemented in Python, leveraging numpy for numerical operations and Optuna for automated hyperparameter tuning.
The deep learning modeling was implemented using Matlab 2020 software. The training, validation, and test sets of the data employed by the deep learning neural network were divided as follows: 70% for training; 10% for validation; and 20% for testing. The architecture of the deep learning used in this research to model the H-Oil vacuum residue conversion consisted of six layers with the following structure: 64, 32, 16, 10, 8, and 1 neurons. The first layer contained 64 neurons, the second 32, the third 16, the fourth 10, the fifth 8, and the sixth (output) layer contained a single neuron. This architecture was selected to effectively process the input data of size 11 × 529. The number of neurons in each successive layer was approximately halved, starting from 64 neurons in the first layer. This configuration was considered optimal for capturing the essential features of the input data. Increasing the number of neurons leads to information redundancy and, consequently, an increase in the mean squared error (MSE), which negatively affects modeling performance [37].
3. Results and Discussion
3.1. Relationship Between Vacuum Residue Properties
ICrA was used to assess the relationship between the various properties of the vacuum residues from Table 1. Table 5 and Table 6 display μ and υ values of all vacuum residue properties shown in Table 1.
It is evident from the data in Table 5 and Table 6 that specific gravity has positive consonances with the contents of micro-carbon residue, sulfur, and C5-, and C7-asphaltenes. A regression Equation (5) was developed to quantify the relationship between SG and MCR content.
where,
MCR = micro carbon residue content, wt,%.
MCR exhibits stronger positive consonances with the contents of sulfur and asphaltenes than SG. Regression Equations (6) and (7) were developed to quantify the relationship between MCR and C5-, and C7-asphaltene contents (wt.%).
Interestingly, the content of C5- and C7-asphaltenes shows positive consonances with the softening point, but not with the other rheological property, viscosity, although it has been reported that both rheological properties depend on the asphaltene content [38,39,40,41]. Luo and Gu [40] and Ganavati et al. [41] communicated the existence of an exponential dependence of the viscosity of heavy oil on the asphaltene content. Such a dependence was not confirmed with the data of vacuum residues from Table 1. The vacuum residue data in Table 1, quantitatively assessed by ICrA (Table 5 and Table 6) show a lack of any relationship between viscosity and other vacuum residue properties. This can be considered as an issue as the measurement of viscosity of highly heavy oils may report incorrect values [42,43]. To avoid this in the current study, the viscosity of high-viscosity vacuum residues was measured at 145 °C and, to compare with the viscosity of lower-viscosity vacuum residues, it was converted to a viscosity value at 100 °C, following the relationship shown in Equation (4).
Viscosity is one of the vacuum residue properties, which has a specified maximum limit of 3000 cSt at 100 °C as a feed for the LNB H-Oil hydrocracker. Therefore, the correct determination of the viscosity of the H-Oil feed is of paramount importance to ensure the smooth operation of the commercial hydrocracking unit. The viscosity of crude and lighter oils has been modeled using the characterization parameters: density, T50% or molecular weight and KW-characterizing factor [44,45,46,47]. In this research, an equation approximating the KW-characterizing factor was developed, where the boiling point was replaced by viscosity. It has the following form.
where,
Vis = kinematic viscosity of vacuum residue at 100 °C, cSt.
The KW-characterizing factor was calculated using Equation (9).
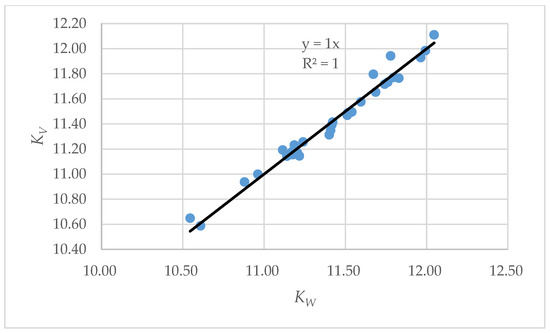
Figure 3.
Relationship between KW (Equation (9)) and KV (Equation (8)).
Despite the good congruity between KV and KW calculating the viscosity using KW in Equation (8) gives results with a very large deviation from the measured values. All attempts to develop a correlation predicting vacuum residue viscosity availing various sets of properties could not provide an absolute average relative error lower than 50%. Given that the oil viscosity depends on the type and size of the molecules constituting the oil [48] the very low accuracy of viscosity prediction suggests that the prognosis about the type and size of the molecules based on the other vacuum residue properties is a rather uncertain task. As can be seen from the data in Figure 4 (intuitionistic fuzzy interpretation triangle of ICrA), where the black dots reflect the dissonance (with a high degree of uncertainty) between viscosity and all other properties of the vacuum residue, which means that it is impossible to determine the relationship between viscosity and any other property of the vacuum residue.
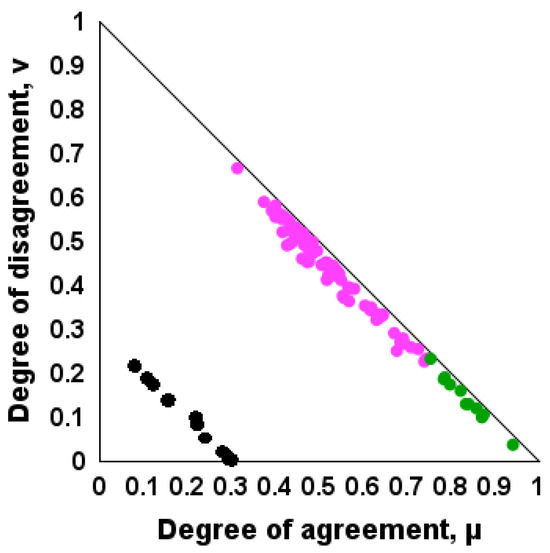
Figure 4.
Results from ICrA application for the vacuum residue properties from Table 1 visualized into the intuitionistic fuzzy interpretation triangle. (Green dots indicate positive consonances; purple dots exhibit dissonances; black dots display dissonance with a high degree of uncertainty).
Broeke [49] communicated that the estimated number of potential organic compounds having such a broad carbon number range (between C45 and C100) was astronomically high, in the order of 1060. Although Law et al. [50] speculate that the number of different molecules is not as astronomical as predicted by simple combinatorics, and that there is general agreement among petroleum geochemists that all crude oils are formed from the same type of compounds, the exact number of which is, however, unknown. All possible combinations between the different species constituting the vacuum residue and their influence on its behavior during hydrocracking have also not been discovered. That is why the prediction of behavior of an individual vacuum residue or vacuum residue blend during hydrocracking is extremely difficult.
Stratiev [22] developed a correlation that related the vacuum residue conversion obtained during hydrocracking under constant operating conditions with the properties: sulfur, nitrogen, Conradson carbon residue (CCR) and C7-asphaltenes content. It is shown as Equation (10).
where,
S = content of sulfur in vacuum residue, wt.%;
N = content of nitrogen in vacuum residue, wt.%;
CCR = content of Conradson carbon residue, wt.%;
This correlation was developed for the following range of variations of the variables from Equation (10): 2.7 wt.% < S < 6.6 wt.%; 0.357 wt.% < N < 0.853 wt.%; 7.1 wt.% < C7 asphaltenes < 29.6 wt.%; 18.6 wt.% < CCR < 33.5 wt.%.
In this work data about hydrocracking of the vacuum residue derived from Arab Light crude oil and the 85% Arab Heavy/15% CPC vacuum residue blend along with characterizing data of these two hydrocracking feeds were used to verify the applicability of Equation (10) for these vacuum residues.
The data in Figure 5 indicate that both feeds deviate more than the uncertainty of conversion measurement of 1.7 wt. % from the regression line. The deviation for the Arab Light vacuum residue was 4 wt.%, while for the blend 85% Arab Heavy/15% CPC it was 10 wt.%. This example confirms the thought of Alfred North Whitehead: “The aim of science is to seek the simplest explanations of complex facts. Seek simplicity and distrust it”. The vacuum residue is so complex that available techniques for its characterization cannot provide a complete picture of this complexity to relate to its behavior during hydrocracking. Then, the only reliable way to assess the vacuum residue hydrocrackability remains the pilot plant tests. Admittedly, the data in Figure 3 suggest that a certain prediction could be made, but this prognosis cannot always come true.
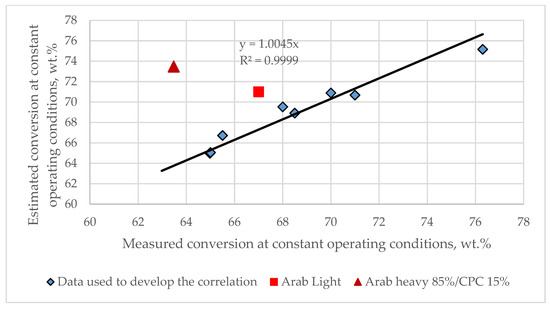
Figure 5.
Test of the validity of Equation (10) for predicting conversion under constant operating conditions in a pilot plant during hydrocracking of the vacuum residue Arab Light and the vacuum residue mixture 85% Arab Heavy/15% CPC.
3.2. Case 1 with Increased Sedimentation Rate in the Commercial H-Oil Vacuum Residue Hydrocracker After the Major Overhaul Carried Out in March–April 2025
After the overhaul of the H-Oil vacuum residue hydrocracking plant in March–April 2025 and its resumption of operation in May 2025, during the processing of vacuum residue mixtures derived from Arab Heavy, CPC, Mandji and KEBCO major crude oils processed in the period 10 May 2025–23 May 2025, an exponential increase in the sediment level in the hydrocracked atmospheric residues of H-Oil was observed (Figure 6). The data of sediment content in H-Oil hydrocracked atmospheric residue and composition of vacuum residue blend processed in the H-Oil hydrocracker for the period 10 May 2025–23 May 2025 along with H-Oil feed rate, and flow rates of H-Oil feed diluents (FCC slurry oil (SLO) and heavy cycle oil (HCO)) weight average bed temperature (WABT), and H-Oil conversion are summarized in Table S1.
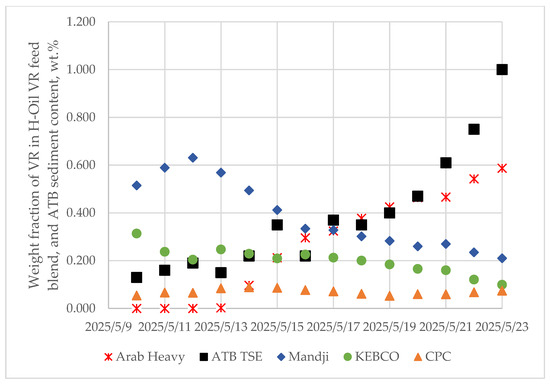
Figure 6.
Variation of H-Oil feed vacuum residue blend composition and hydrocracked atmospheric residue sediment content (ATB TSE = atmospheric tower bottom total sediment existent).
In order to evaluate which component of H-Oil feedstock may cause the sedimentation rate enhancement an ICrA assessment of the data in Table S1 was performed. Table 7 and Table 8 present μ and υ values of from ICrA evaluation. The data in Table 7 and Table 8 indicate that the sediment content in the hydrocracked atmospheric residue (ATB TSE) has positive consonances with the content of Arab Heavy vacuum residue in the H-Oil feed, with the H-Oil feed rate, and with the content of slop oils, accumulated during the shutdown and start-up before and after the major overhaul, in the H-Oil feed. Previous experience with processing Arab Heavy vacuum residue in the H-Oil hydrocracker has shown that it has not been associated with increased sediment formation rate. Based on this previous experience, we put our focus on the H-Oil feed rate and the amount of slop oils processed in the H-Oil hydrocracker in that period. Analyzing the data in Table S1, one can see that the main component of H-Oil feed is the straight run vacuum residue, which was not increased during the examined period. Actually, the increment of H-Oil feed rate resulted from the augmented amount of processed slop oils. Analysis of these slop oils, shown in Table S2, reveals that these oils have a high content of distillate fractions and relatively high KW-characterizing factor, suggesting that they may promote the sediment formation process in the H-Oil hydrocracker. The suspension of slop oil processing in the H-Oil hydrocracker, as shown in Figure 7, led to a decrease in ATB TSE from 1.0 down to about 0.3 wt.%.

Table 7.
μ-values from ICrA evaluation of data from Table S1.

Table 8.
υ-values from ICrA evaluation of data from Table S1.
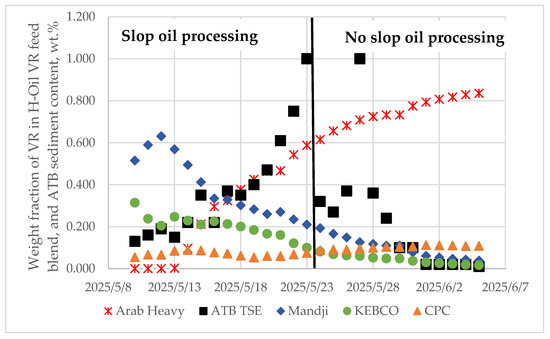
Figure 7.
Fluctuation of hydrocracked atmospheric residue sediment content during slop oil processing and its suspension in H-Oil hydrocracker along with changing the composition of vacuum residue blend for the examined period of time. (The black line separates the periods of slop oil processing from no slop processing).
The data in Figure 7 exhibit that the content of Arab Heavy vacuum residue in the H-Oil feed mixture continually increases, although the ATB TSE does not increase, confirming our initial expectation that the content of Arab Heavy vacuum residue in the H-Oil feed mixture is not the cause of the observed sedimentation enhancement. Therefore, the noted positive consonance between ATB TSE and the content of Arab Heavy vacuum residue in the H-Oil feed can be considered a chance correlation.
The two operating factors known to have an effect on sediment formation rate—liquid hourly space velocity (LHSV) [51] and reaction temperature (WABT) [52,53,54] —are shown in Figure 8, where their influence on the ATB TSE for the period 10 May 2025–5 June 2025 can be seen.
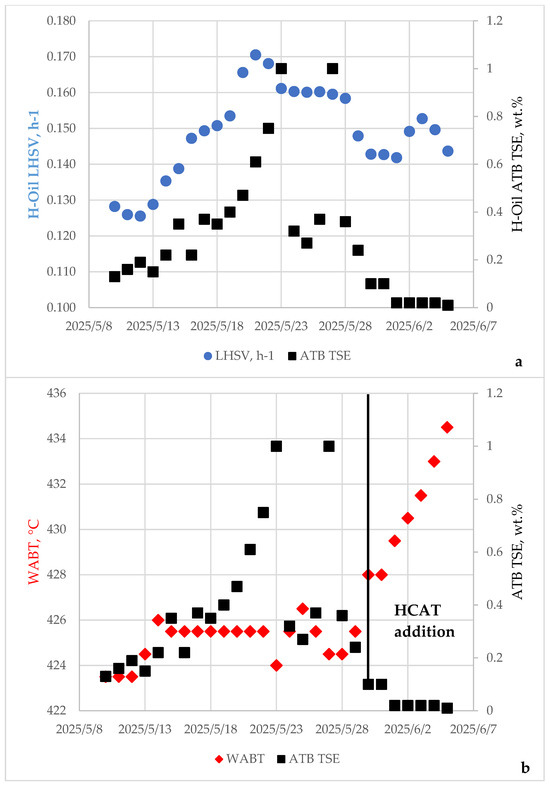
Figure 8.
Variation of H-Oil hydrocracked sediment content (ATB TSE) with LHSV (a) and with reaction temperature (WABT) (b). (The black line indicates the start of injection of HCAT).
Interestingly, neither LHSV nor WABT demonstrate any effect on the hydrocracked atmospheric residue sediment content in the data of Figure 8a,b. Other factors seem to have a greater impact on sedimentation in the H-Oil hydrocracker for the examined period of time. These are the fresh solid catalyst addition rate, which was increased by 50%, and the addition of HCAT liquid nano-dispersed catalyst, which started on 30 May 2025. The data in Figure 6 show that despite the WABT increases from 424.5 °C to 434.5 °C, the ATB sediment content drops from 0.36 to 0.02 wt.% as a result of increased fresh solid catalyst addition rate and the injection of HCAT nano-dispersed catalyst. All these results discussed in this section suggest that the combination of appropriate feed composition with the right solid and liquid nano-dispersed catalyst addition rate can significantly improve H-Oil hydrocracker performance. Another important message from this section is that a statistical analysis such as ICrA may report the presence of consonance, which can be classified as a chance correlation. An algorithm to diminish the risk for a chance correlation is necessary to develop in order to avoid making incorrect hypotheses during analyzing the data.
3.3. Case 2 with Increased Sedimentation Rate in the Commercial H-Oil Vacuum Residue Hydrocracker After the Major Overhaul Carried Out in March–April 2025
With optimized H-Oil feed composition and fresh catalyst addition rate, the conversion in H-Oil hydrocracker was kept between 82 and 85 wt.%, while the ATB TSE averaged at 0.03 wt.% for the whole of June 2025. However, in July, August and September 2025, the LNB H-Oil hydrocracker again encountered the problem of high sediment formation rate, despite the optimized catalyst addition rates. The vacuum residues processed in the LNB H-Oil hydrocracker and the change in their content in the feed mixture for the period July–September 2025 are presented in Table 9 and Figure S1.

Table 9.
Variation in the content of vacuum residues hydrocracked in the LNB H-Oil plant for the period July–September 2025.
Figure 9 shows the change in the hot middle pressure separator skin temperature, an indicator about H-Oil fouling rate and the sediment content in the hydrocracked atmospheric residue for the period late July 2025–September 2025. Figure 10 displays the variation of the WABT and vacuum residue conversion for the same period. One can see from these data that, for a period of 10 days (between the 5th of July and the 15th of July), the hot middle pressure separator skin temperature dramatically dropped from 273 °C to 236 °C indicating a very high fouling rate. To curb this very high fouling rate, the reaction temperature (WABT) was decreased from 435.5 to 418 °C for the same period. The data in Figure 9 and Figure 10 display the presence of several low and high fouling rate periods of the investigated space of time of operation of the LNB H-Oil hydrocracker. The performed ICrA evaluation of the data for the investigated period late July 2025–September 2025 of LNB H-Oil operation was not capable of either identifying which crude contains vacuum residue fraction with high affinity to precipitate during hydrocracking or which vacuum residue property has statistically meaningful consonance with the hydrocracked atmospheric residue sediment content. Only one statistically significant consonance was found, and it was a negative consonance between the ATB TSE and the WABT (μ = 0.18; υ = 0.76). It indicates that the feed with a high sediment formation affinity will require a lower reaction temperature to suppress the precipitate formation. The explanation for the lack of consonance between sediment formation rate, H-Oil vacuum residue composition and properties may lie in the continuous change in the composition of the H-Oil vacuum residue feed mixture, as evident from the data in Figure S1, which does not allow the establishment of a stable statistically significant consonance between the studied variables. This frequent H-Oil feed composition change and the resulting frequent alteration of sediment content in the hydrocracked atmospheric residue was the reason why the hydrocracking reaction temperature was raised and lowered repeatedly, as shown in Figure 10. In order to try to identify the vacuum residues responsible for the observed high sedimentation rate, lower reaction temperature and lower conversion, the composition of the H-Oil vacuum residue feed of the periods with high and low sedimentation are summarized in Table 9. Table 9 presents data about the vacuum residue composition of H-Oil feed, WABT, liquid hourly space velocity (LHSV), ATB TSE, partially blended fuel oil (PBFO) total sediment potential (TSP), and H-Oil conversion for the identified periods of low and high fouling (sedimentation) rates shown in Figure 9. The data in Figure 9 and Figure 10, and Table 10 demonstrate that the most unfavorable for the operation of H-Oil plant was the High fouling (sedimentation) rate-1 period. In this period, in addition to the very high sedimentation and fouling rate, a loss of catalyst bed expansion in the second reactor in the H-Oil unit was experienced that was about to shut down the H-Oil reaction section. Additional FCC HCO in an amount of about 3 wt.% of feed was injected in the second reactor to decrease the viscosity of the liquid and to prohibit the formation of a separate asphaltene-rich phase inside the reactor, which was the suspected reason for this instability event [55]. During ebullated bed pilot plant hydrocracking tests with vacuum residues from Vasconia, Castilla, Maya, Chichimene, and Ku-Maloob-Zaap crude oils, the same instability and loss of catalyst bed expansion was observed in the second reactor. Although the mechanism of the reduced catalyst bed expansion is not fully understood, it is hypothesized that the cause is the formation of a separate, asphaltene-rich phase inside the reactor, which causes this instability event during the processing of these residues with high asphaltene content, high viscosity and high micro-carbon content. The processing of such vacuum residues in an ebullated bed hydrocracker is risky from operational and performance point of view, because the hydrocracker could be shut down in an emergency due to the loss of catalyst bed expansion.
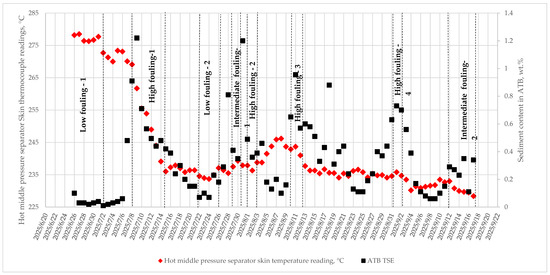
Figure 9.
Fluctuation of hydrocracked atmospheric residue sediment content and hot middle pressure separator skin temperature for the examined period late July 2025–September 2025.
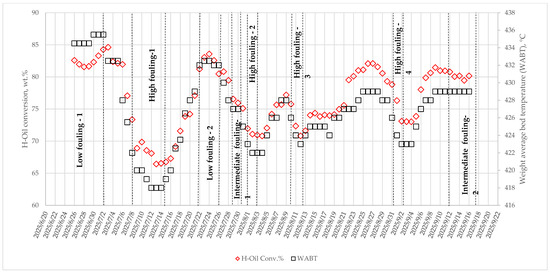
Figure 10.
Variation of WABT and H-Oil conversion for the examined period late July 2025–September 2025.

Figure S2 illustrates how close the LNB H-Oil hydrocracking unit was to an emergency shutdown due to loss of catalyst bed expansion, which is symptomatically expressed by increased catalyst density in the lowest levels of the catalyst bed at the expense of reduced catalyst density in the higher levels of the catalyst bed. Based on the information from the pilot plant results, the Vasconia vacuum residue was identified as the culprit for the observed instability event in the second ebullated bed reactor. However, as can be seen from the data in Table 9, during the low fouling (sedimentation) rate-2 period, despite the presence of vacuum residue from Vasconia in a concentration close to the minimum at the High fouling (sedimentation) rate-1, neither increased fouling nor reactor instability was observed. This finding suggests that the right combination of vacuum residues processed in the ebullated bed hydrocracking unit can suppress the negative effects of processing problematic vacuum residues, such as that from Vasconia crude oil. Besides the vacuum residue from Vasconia crude oil, it was reported in [56,57] that the vacuum residue from El Bouri crude oil, which was processed in the LNB H-Oil hydrocracker during this study, promoted sedimentation. Indeed, the data in Table 9 indicate that during high fouling (sedimentation) rate-3 and high fouling (sedimentation) rate-4 periods, which featured with high sedimentation rate, an appreciable amount of El Bouri vacuum residue (between 37.3 and 57.8 wt.%) was hydrocracked in the LNB H-Oil hydrocracking unit. Therefore, the vacuum residue from El Bouri crude oil can be classified as one of those H-Oil feeds that have a high tendency to form sediments. The replacement of vacuum residue from Payara Gold crude oil with that of Arabian Heavy crude oil in H-Oil feed blend was associated with deterioration of H-Oil performance as one can see comparing low fouling (sedimentation) rate-2 with Intermediate sedimentation rate periods from the data in Table 9. The additional introduction of the vacuum residue from Helm crude oil further impaired H-Oil hydrocracker performance as can be seen from the high fouling (sedimentation) rate-2 period in Table 9. Thus, the vacuum residue from Helm crude oil can also be classified as one of those that facilitate the formation of sediments in the ebullated bed hydrocracking unit. Admittedly, each of these vacuum residues with a high tendency to precipitate exhibits its high ability to form sediments when surrounded by other vacuum residues with suitable properties for this purpose. For example, Basrah Heavy seems to assist Vasconia vacuum residue, demonstrating its strong ability to form sediments, while Payara Gold seems to inhibit this feature of Vasconia vacuum residue, whereas the El Bouri vacuum residue appears to manifest its high inclination to precipitate when its concentration in H-Oil feed is sufficiently high, irrespective of the other vacuum residues making up the H-Oil feed.
The vacuum residue from crude oil Mero seems to inhibit sediment formation in H-Oil hydrocracker as observed from the low fouling (sedimentation) rate-3 period (Table 9). Its replacement by the vacuum residue from Johan Sverdrup crude oil apparently promotes sedimentation as seen from Intermediate sedimentation rate-2 period.
The content of asphaltenes and their solubility profile was reported to affect fouling in operating hydrocracking units [23,24]. The asphaltene solubility profile allows the determination of the ratio of difficult to easy to dissolve asphaltenes. Two methods for determining the ratio of difficult- to easy-to-dissolve asphaltenes have been published in the literature: that of Ovalles et al. [58] and that of Adams et al. [59,60]. Both methods indicate that during hydrocracking the easy-to-dissolve asphaltenes are easy-to-react, while the difficult-to-dissolve are hard-to-react [25,58]. Some of the problematic vacuum residues tested in a pilot ebullated bed plant, and some of the vacuum residues processed in the LNB H-Oil hydrocracker were analyzed by the methods mentioned above. Table 11 presents data about the content of asphaltenes along with the ratio of difficult-to-dissolve to easy-to-dissolve asphaltenes analyzed by the two methods. From the data in Table 11, it can be seen that all difficult-to-hydrocrack vacuum residues, with the exception of that of Isthmus crude oil, are characterized by an asphaltene content higher than or equal to 24 wt.%. They also demonstrate a higher ratio of difficult-to-dissolve to easy-to-dissolve asphaltenes. Vacuum residues from Isthmus crude oil, tested in a pilot ebullated bed reactor, and El Bouri and Rhemoura crude oil, processed in the LNB H-Oil hydrocracking unit, did not exhibit instability in the reactor, as did vacuum residues from Vasconia, Castilla, Chichimene, and Ku-Maloob-Zaap crude oils, but showed high sedimentation and low conversion.

Table 11.
Content of asphaltenes together with the ratio of easy-to-dissolve to difficult-to-dissolve analyzed by the methods of Ovalles et al. [58] and Adams et al. [59,60] of some difficult- and easy-to-hydrocrack vacuum residues.
It is very difficult to determine from the available data which oil’s vacuum residue may create problems during its processing in the ebullated bed hydrocracking. For example, the ratio of difficult-to-dissolve to easy-to-dissolve asphaltenes of Arab Medium is higher than that of Urals when using the asphaltene solubility fractionation method [58], while the SAR-AD method [59,60] displays the opposite, as shown in Table 11. The high asphaltene content also does not seem to be the only factor suggesting the occurrence of difficulties during hydrocracking of a vacuum residue with an asphaltene content higher than or equal to 24 wt.%. For example, Tempa Rossa crude oil vacuum residue with an asphaltene content almost the same as that of Vasconia vacuum residue, as shown in the data in Table 12, did not cause any problems during their processing in the LNB H-Oil hydrocracking unit at concentrations similar to those of Vasconia vacuum residues, which caused instability in the second reactor. Although the lower solubility of asphaltenes from Tempa Rossa crude oil was identified as the cause of the observed incompatibility of the crude oil blend processed in Case-2 of Table 11, as noted in [61], no H-Oil performance issues related to high sedimentation and lower conversion were recorded, as evident from the data in Table 12.

Table 12.
Two cases of processing high viscous, high asphaltene vacuum residue from Tempa Rossa crude oil in the LNB H-Oil hydrocracker.
All these examples illustrate how difficult it is to make the right decision during the crude oil selection phase to pick out the appropriate crude oil blend for processing in an oil refinery that has an ebullated bed hydrocracking unit in its process flow. In search of an adequate approach to predict the performance of the commercial H-Oil hydrocracker when processing blends of different crude oils in the refinery, we decided to use the deep learning neural network and regression analysis toolkit. Next section will discuss the development of deep learning neural model and its comparison with regression models to forecast H-Oil performance on the base of data of crude oil assays.
3.4. Development of Deep Learning Neural Network and Regression Models to Predict H-Oil Conversion During Processing Blends of Various Vacuum Residues
Prior to the development of a model capable of predicting the conversion of H-Oil as a function of feedstock characteristics and operating conditions (WABT, LHSV), another model was developed to forecast the reaction temperature (WABT) from the 11 properties of the H-Oil mixture listed in Table 4. The data used to develop the WABT model are presented in Table S3. Through multiple regression analysis, the correlation shown as Equation (11) was developed.
where,
Aromatics = content of aromatics in vacuum residue, wt.%;
Resins = content of resins in vacuum residue, wt.%;
Na = content of sodium in vacuum residue, wt. ppm;
Ni + V = content of sodium in vacuum residue, wt. ppm.
Noting that WABT can be predicted by multiple correlation with sufficient accuracy, and the positive experience with deep learning neural network that we had from our previous study, improving the coefficient of determination from R = 0.808 for multiple correlation to 0.94 by deep learning neural network [62], we decided to model the data in Table S3 using the deep learning neural network technique.
Figure 11 exemplifies how the deep learning network training process has been implemented to construct the deep learning WABT prediction model. The data in Figure 10 show that the attained minimum mean squared error was , which occurred at epoch 36. After epoch 36, the mean squared error started to increase for validation, meaning that no further improvement in the model accuracy could be expected.
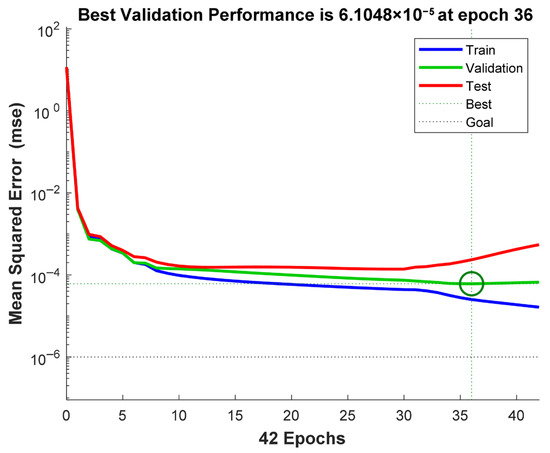
Figure 11.
Deep learning network training performance for prediction of commercial H-Oil hydrocracker reactor temperature (WABT).
Figure 12 is a graphical representation of the agreement between the predicted and measured (target) H-Oil hydrocracker WABT for the three types of data: training, testing, and validation. The coefficients of determination of the three types of data were found to be R = 0.99219 for training, R = 0.927 for testing, R = 0.97917 for validation, and overall R = 0.97725. The standard error of the deep learning model for H-Oil WABT prediction is 0.8 °C, which is almost three times lower than that of multiple correlation.
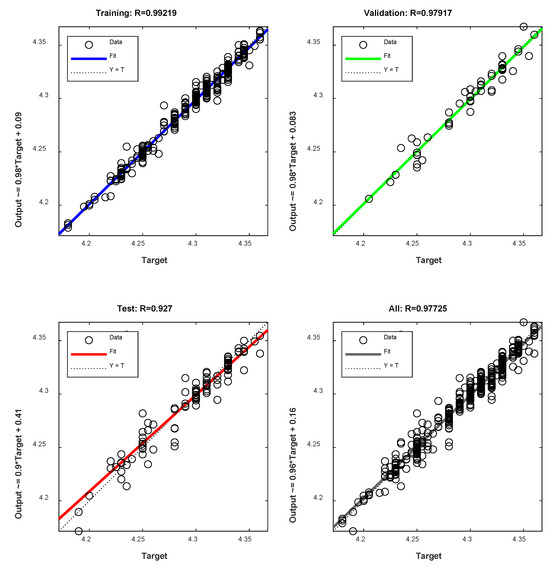
Figure 12.
Deep learning neural network predicted versus measured H-Oil WABT for the training, validation and testing.
Considering the computational efficiency of the singular value decomposition (SVD) technique [63,64,65], we decided to also process the data in Table S3 by the SVD method. Figure 12 presents a plot of the WABT predicted by a cubic target function (SVD-based least squares, a Python) versus the measured WABT. The data in Figure 13 show excellent describing of WABT from the 11 properties of the 529 (training data). However, using test data showed that the SVD model suffers from overfitting, failing to perform well on new, unseen test data.
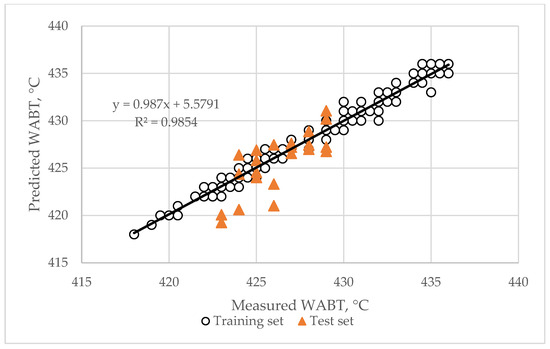
Figure 13.
Agreement between calculated by the SVD model and measured H-Oil WABT.
It is clear that predicting WABT provides an indication of the sedimentation propensity of the H-Oil vacuum residue blend feed. The lower the WABT, the higher the sedimentation affinity of the H-Oil feedstock.
Knowing the reaction temperature, three approaches can be taken to predict conversion as discussed in [66]: using CSTR reactor kinetic model, plug flow reactor kinetic model or multiple correlation. As the plug flow reactor kinetic model demonstrated the highest accuracy of prediction of H-Oil vacuum residue conversion in [66], in this study, we decided to use this reactor model with the established reaction order of n = 1.59, and the activation energy was of EA = 215 kJ/mol [66] as exemplified in Equation (12).
where,
k0 = collision factor; h−0.59frac.−1;
R = universal gas constant; (R = 8.31446261815324 joules/mol.K);
T = reaction temperature (WABT), K;
t = reaction time = , hour.
We assumed the same activation energy for all feeds, although Singh et al. [67] showed in their study that the different vacuum residues can exhibit diverse activation energies during thermal conversion, and the catalytic hydrocracking conversion was proved to be thermally driven [68,69,70,71].
The collision factor (k0) in Equation (12) of the H-Oil plug flow reactor kinetic model was modeled by deep learning neural network using the same feed properties presented in Table S3. Figure 14 displays the deep learning network training process used to develop the model to prognosticate k0. One can see from the data in Figure 14 that the accomplished minimum mean squared error was 0.18098, which took place at epoch 33. After epoch 33, the mean squared error began increasing, signifying that no further improvement in the model accuracy could be expected.
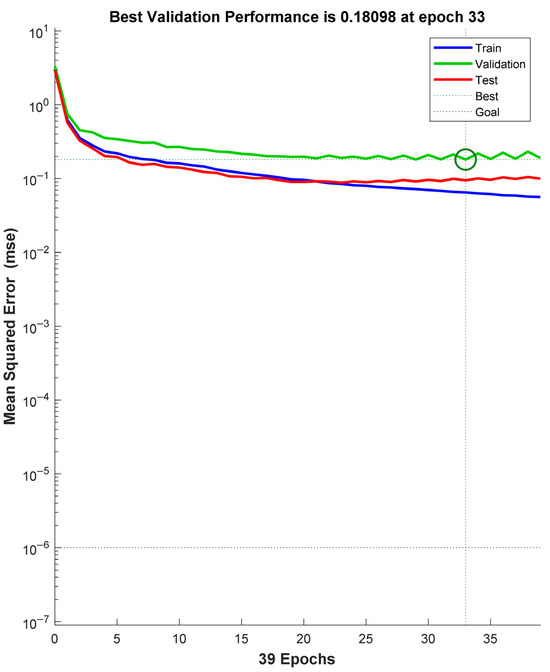
Figure 14.
Deep learning network training performance for prediction of the collision factor in Equation (12) of the H-Oil plug flow reactor kinetic model.
Figure 15 presents graphs of the parity of the predicted and observed k0 for the three data sets: training, testing, and validation. The coefficients of determination of the three types of data were found to be R = 0.91456 for training, R = 0.8731 for testing, R = 0.78452 for validation, and overall R = 0.89077.
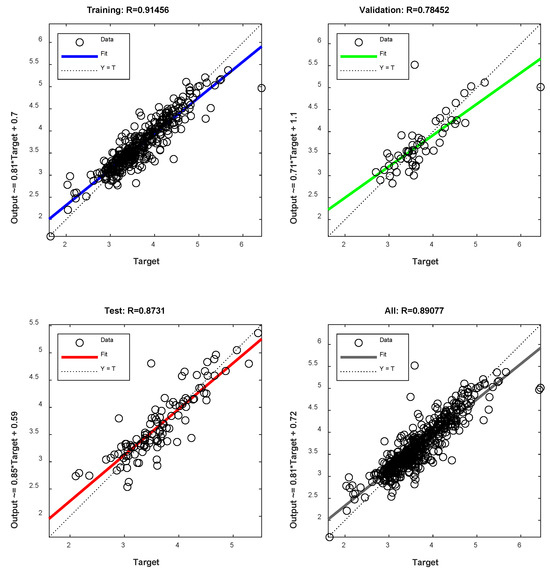
Figure 15.
Deep learning predicted versus observed collision coefficient in collision factor in Equation (12) of the H-Oil plug flow reactor kinetic model for the training, validation and testing.
The agreement between modeled H-Oil vacuum residue conversion using WABT forecast by the deep learning neural network model and prognosticated k0 along with data about LHSV for the 529 investigated points (370 points for training, 53 points for validation and 106 points for testing), and the observed H-Oil conversion is presented in Figure 16. The standard error of H-Oil conversion calculated by the deep learning neural network model for all data is 1.99 wt.%, while for the test data, it is 2.35 wt.%. The test data show the predictive ability of the deep learning neural network model for H-Oil conversion.
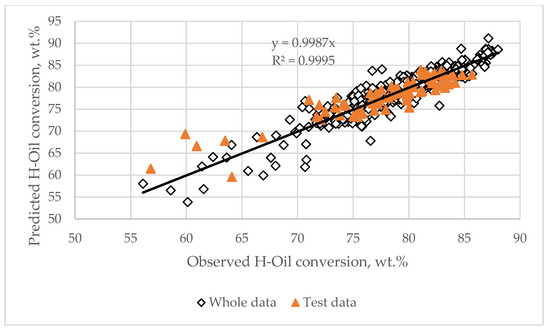
Figure 16.
Predicted by the deep learning model versus observed H-Oil conversion.
In addition to the deep learning neural network model of k0, a cubic polynomial function (SVD-based least squares, a Python) was also applied to model k0.
Figure 17 presents the graph of the parity of the measured values against the interpolated and predicted ones from the SVD-based least squares k0. This dataset demonstrates excellent description of k0 by the SVD cubic polynomial function. Unfortunately, similarly to the SVD modeling of WABT (Figure 13), in the case with k0, the same overfitting phenomenon was observed.
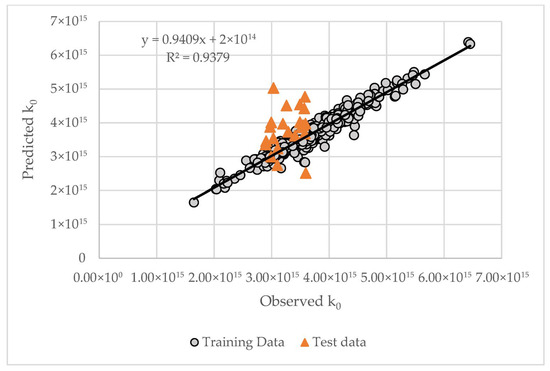
Figure 17.
Predicted by the SVD-based least squares k0 model versus observed k0.
The placement SVD-based least squares k0 model in Equation (12) demonstrates, as illustrated in Figure 18, an excellent agreement between observed and calculated H-Oil conversions for the training set (standard error of 0.95%), whereas for the test set, the standard error of 5.1% indicates a poor predictive performance of the SVD model due to overfitting.
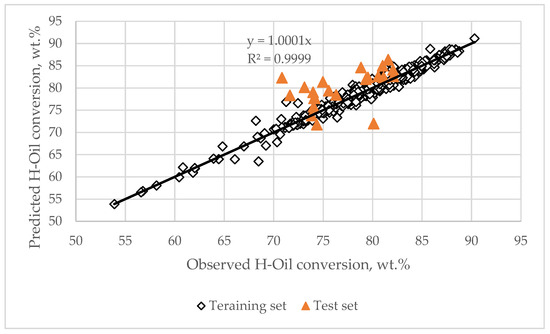
Figure 18.
Predicted by the SVD-based least squares model versus observed H-Oil conversion.
Modeling of H-Oil conversion using the linear regression models of WABT (Equation (11)) and k0 (Figure S3) shows a standard error of 3.9 wt.% for the training data and 7.5 wt.% for the test data.
The models developed in this study indicate that the deep learning neural network model shows the best prediction accuracy of H-Oil conversion. Compared to the models developed in [66], it demonstrates higher prediction accuracy of H-Oil conversion (AAD of 1.75 wt%) over the best model (flow model in [66] which reported AAD of 2.23 wt%) and therefore can be used for the purpose of H-Oil performance evaluation in the linear programming model of LNB refinery when different crudes are assessed.
3.5. Thoughts on the Results
As can be seen from the data in Table 1, the range of variation in the properties of the vacuum residues processed in the LNB H-Oil hydrocracker is quite wide and could be considered that it embraces the possible fluctuations of properties in any vacuum residue. Therefore, the catalytic hydrocracking data of these vacuum residues may be deemed representative of the behavior of any vacuum residue in an ebullated bed hydrocracker. Vacuum residues were reported that can have a different reactivity during hydrocracking [72]. They were also reported to have distinct propensity to form sediments [73]. It was found that vacuum residue properties such as density, microcarbon residue, C7-asphaltene, sulfur, and nitrogen content may describe its reactivity during hydrocracking [22]. However, the data generated in pilot plants to develop the correlation for calculating the vacuum residue conversion from the microcarbon residue, C7-asphaltene, sulfur, and nitrogen content [22] were not very large (only seven diverse vacuum residues). The verification of this correlation, as shown in Figure 5, exhibited a significant deviation for the vacuum residues Arab Light and the mixture 85% Arab Heavy/15% CPC from the calculated value. This suggests that the vacuum residue properties used in Equation (10) are not sufficient to describe hydrocracking reactivity. The use of 11 characteristics (density, microcarbon residue, sulfur, nitrogen, saturate, aromatic, resin, C5-asphaltene, C7-asphaltene, Na, and Ni+V content) along with the application of the deep learning neural model with the structure described in Section 2 allowed a satisfactory prediction of the vacuum residue reactivity, expressed as k0. The application of linear regression demonstrated inferior performance compared to that of the deep learning neural technique. While the employment of SVD method displayed an excellent modeling using a cubic target function, which unfortunately suffered from overfitting in this case, which does not allow its use for prediction purposes. The H-Oil vacuum residue feed features mentioned above seems to well capture the essence of the relation of the vacuum residue hydrocracking reactivity to the vacuum residue itself. In addition to the feed reactivity, which can be definitely different for the diverse vacuum residues, H-Oil conversion depends on reactor temperature as well, which in turn depends on the vacuum residue sediment formation propensity. The sediment formation affinity was quantified by an empirical correlation relating vacuum residue properties to sediment content in the hydrocracked atmospheric residue as shown in Equation (13).
where,
C7asp = H-Oil feed (vacuum residue) C7-asphaltene content, wt.%;
C5asp = H-Oil feed (vacuum residue) C5-asphaltene content, wt.%;
CCR = Conradson carbon residue (micro carbon residue) content
V = vanadium content in vacuum residue (H-Oil feed), ppm;
Ni = nickel content in H-Oil feed (vacuum residue), ppm;
KV = characterizing parameter of vacuum residue, calculated by Equation (8);
N = nitrogen content in vacuum residue, wt.%;
S = sulfur content in vacuum residue, wt.%.
Unfortunately, the calculation of sediment content in the hydrocracked atmospheric residue at constant operating conditions cannot provide information about the reactor temperature at which the H-Oil unit can run with a specific vacuum residue feed. That is why predicting the reactor temperature can provide both the information needed to calculate H-Oil conversion and the tendency to form sediments, because the higher the reactor temperature at which H-Oil can operate, the lower the tendency to form precipitates with a given vacuum residue feed. The results discussed in Section 3.4 show that, again, the deep learning neural network is the most suitable technique for modeling H-Oil reactor temperature for the purposes of its prediction. In this case, the same 11 vacuum residue properties were found sufficiently informative to model the H-Oil reactor temperature. The positive results of modeling both k0 and WABT using the deep learning neural network technique in this study may erroneously lead one to think that machine learning is capable of modeling everything. However, the experience of these authors with modeling artificial neural networks shows that if the input characteristics of the object being modeled are not sufficiently informative for modeling the outlet property, the model fails to correctly calculate the output property. A good example of not very successful modeling of the aromatic content of crude oil using artificial neural networks (ANNs) based on the density and viscosity of the oil is reported in the work of Kulkarni et al. [74], suggesting that these properties are not sufficiently informative for modeling the aromatic content of crude oil. Therefore, it may be concluded that the 11 properties of the vacuum residue are sufficiently informative for the purposes of modeling and predicting H-Oil conversion, thus enabling the assessment of the suitability of a given vacuum residue to be used as a feedstock for the H-Oil process.
4. Conclusions
Vacuum oil residues are an extremely complex mixture of hydrocarbons and organic compounds containing heteroatoms. Despite attempts to describe the vacuum residue on a molecular level, the observed lack of any relationship of whichever residue property to viscosity, which depends on the type and size of its molecules, suggests that molecular reconstitution seems very difficult to achieve. The elaborate chemical nature of vacuum residue makes it very difficult to prognosticate its behavior in the hydrocracking process. For that reason, the developed correlations based on the contents of sulfur, nitrogen, Conradson carbon residue and C7-asphaltenes fail to predict the behavior of some vacuum residues in the hydrocracking process. The hydrocracking of blends of vacuum residues in a commercial hydrocracker is much more difficult to comprehend. Intercriteria analysis may help to reveal the root cause for observed poor performance of the commercial hydrocracker and assist in finding the proper strategy to improve operations, but not in all cases. The characterization of vacuum residue blends by specific gravity, contents of sulfur, nitrogen micro carbon residue, SARA fractions and metals along with the technique deep learning neural network seems to allow a fair prediction of H-Oil conversion of blends of various vacuum residues originating from diverse crude oils. This finding can be used in the process of crude selection for refineries possessing ebullated bed hydrocracking in their processing scheme.
Supplementary Materials
Supporting information can be downloaded at: https://www.mdpi.com/article/10.3390/pr13113486/s1, Figure S1: Variation of composition of vacuum residue blend processing in the LNB H-Oil hydrocracker for the studied space of time; Figure S2: Image of the distributed control system (DCS) of the second ebullated bed reactor of the LNB H-Oil hydrocracker during the instability event observed when the feed from the feed from High fouling (sedimentation) rate -1 period from Table 9 was processed; Figure S3: Linear regression calculated versus observed collision coefficient in collision factor in Equation (12) of the H-Oil plug flow reactor kinetic model; Table S1: Sediment content in H-Oil hydrocracked atmospheric residue and composition of vacuum residue blend processed in the H-Oil hydrocracker for the period 10 May 2025–23 May 2025 along with H-Oil feed rate, and flow rates of H-Oil feed diluents (FCC slurry oil (SLO) and heavy cycle oil (HCO)) weight average bed temperature (WABT), and H-Oil conversion; Table S2: Properties of heavy oil fractions from tanks R-13, R-14 and T-6203 (Slop oils) processed in H-Oil hydrocracker for the period 14 May 2025–23 May2025; Table S3: Data used to develop model predicting WABT in the LNB H-Oil unit.
Author Contributions
Conceptualization, D.S. (Dicho Stratiev) and I.S.; methodology, R.D.; software, S.S. and D.S. (Denis Stratiev); validation, I.K., G.A. and A.N.; formal analysis, E.S. and S.N.; investigation, V.B.; resources, K.A.; data curation, D.Y.; writing—original draft preparation, D.S. (Dicho Stratiev) and I.S.; writing—review and editing, D.S. (Dicho Stratiev); visualization, D.Y.; supervision, K.A.; project administration, D.S. (Dicho Stratiev). All authors have read and agreed to the published version of the manuscript.
Funding
This work has been carried out with the support of the project “Universities for Science, Informatics and Technologies in the e-Society (UNITE)”.
Data Availability Statement
Data are contained within the article.
Conflicts of Interest
The authors Dicho Stratiev, Ivelina Shiskova, Georgi Argirov, Rosen Dinkov, Angel Nedelchev and Iliyan Kolev were employed by the company LUKOIL Neftohim Burgas. The remaining authors declare that the research was conducted in the absence of any commercial or financial relationships that could be construed as a potential conflict of interest.
References
- Alvarez-Majmutov, A.; Gieleciak, R.; Chen, J. Modeling the molecular composition of vacuum residue from oil sand bitumen. Fuel 2019, 241, 744–752. [Google Scholar] [CrossRef]
- Redelius, P.; Soenen, H. Relation between bitumen chemistry and performance. Fuel 2015, 140, 34–43. [Google Scholar] [CrossRef]
- de Oliveira, L.P.; Trujillo Vazquez, A.; Verstraete, J.J.; Kolb, M. Molecular reconstruction of petroleum fractions: Application to vacuum residues from different origins. Energy Fuels 2013, 27, 3622–3641. [Google Scholar] [CrossRef]
- de Oliveira, L.P.; Verstraete, J.J.; Kolb, M. Molecule-based kinetic modeling by Monte Carlo methods for heavy petroleum conversion. Sci. China Chem. 2013, 56, 1608–1622. [Google Scholar] [CrossRef]
- Verstraete, J.J.; Schnongs, P.; Dulot, H.; Hudebine, D. Molecular reconstruction of heavy petroleum residue fractions. Chem. Eng. Sci. 2010, 65, 304–312. [Google Scholar] [CrossRef]
- Zhang, L.; Hou, Z.; Horton, S.R.; Klein, M.T.; Shi, Q.; Zhao, S.; Li, Z.; Wang, J. Molecular representation of petroleum vacuum resid. Energy Fuels 2014, 28, 1736–1749. [Google Scholar] [CrossRef]
- Lyu, W.; Zhang, L.; Li, K.; Wang, G.; Shi, Q.; Zhao, S.; Xu, C. Average Molecule Construction of Petroleum Fractions Based on 1 H-NMR. AIChE J. 2019, 65, 270–280. [Google Scholar] [CrossRef]
- Ren, Y.; Liao, Z.; Sun, J.; Jiang, B.; Wang, J.; Yang, Y.; Wu, Q. Molecular reconstruction: Recent progress toward composition modeling of petroleum fractions. Chem. Eng. J. 2019, 357, 761–775. [Google Scholar] [CrossRef]
- Quann, R.J.; Jaffe, S.B. Building useful models of complex reaction systems in petroleum refining. Chem. Eng. Sci. 1996, 51, 1615–1631. [Google Scholar] [CrossRef]
- Neurock, M.; Nigam, A.; Trauth, D.; Klein, M.T. Molecular representation of complex hydrocarbon feedstocks through efficient characterization and stochastic algorithms. Chem. Eng. Sci. 1994, 49, 4153–4177. [Google Scholar] [CrossRef]
- Klein, M.T.; Bertolacini, R.J.; Broadbelt, L.J.; Fuels Group. Molecular Modeling in Heavy Hydrocarbon Conversions; Klein, M.T., Hou, G., Bertolacini, R.J., Broadbelt, L.J., Kumar, A., Eds.; Taylor & Francis: Boca Raton, FL, USA, 2006. [Google Scholar]
- Deniz, C.U.; Yasar, M.; Klein, M.T. Stochastic Reconstruction of Complex Heavy Oil Molecules Using an Artificial Neural Network. Energy Fuels 2017, 31, 11932–11938. [Google Scholar] [CrossRef]
- Trauth, D.M.; Stark, S.M.; Petti, T.F.; Neurock, M.; Klein, M.T. Representation of the molecular structure of petroleum resid through characterization and Monte Carlo modeling. Energy Fuels 1994, 8, 576–580. [Google Scholar] [CrossRef]
- Petti, T.F.; Trauth, D.M.; Stark, S.M.; Neurock, M.; Yasar, M.; Klein, M.T. CPU issues in the representation of the molecular structure of petroleum resid through characterization, reaction, and Monte Carlo modeling. Energy Fuels 1994, 8, 570–575. [Google Scholar] [CrossRef]
- Campbell, D.M.; Klein, M.T. Construction of a molecular representation of a complex feedstock by Monte Carlo and quadrature methods. Appl. Catal. A Gen. 1997, 160, 41–54. [Google Scholar] [CrossRef]
- Jaffe, S.B.; Freund, H.; Olmstead, W.N. Extension of structure-oriented lumping to vacuum residua. Ind. Eng. Chem. Res. 2005, 44, 9840–9852. [Google Scholar] [CrossRef]
- de Oliveira, L.P.; Verstraete, J.J.; Kolb, M. Molecular representation of petroleum fractions and molecule-based kinetic modeling by Monte Carlo methods. In Proceedings of the 244th American Chemical Society National Meeting & Exposition, Philadelphia, PA, USA, 19–23 August 2012; Volume 57, p. 984. [Google Scholar]
- de Oliveira, L.P.; Verstraete, J.J.; Trujillo Vazquez, A.; Kolb, M. Modelling of vacuum residue conversion. In Proceedings of the Multiscale Approaches for Process Innovation–MAPI, Lyon, France, 25–27 January 2012. [Google Scholar]
- de Oliveira, L.P.; Verstraete, J.J.; Kolb, M. Simulating vacuum residue hydroconversion by means of Monte-Carlo techniques. Catal. Today 2014, 220, 208–220. [Google Scholar] [CrossRef]
- de Oliveira, L.P.; Verstraete, J.; Kolb, M. Development of a general modelling methodology for vacuum residue hydro-conversion. Oil Gas Sci. Technol. 2013, 68, 1027–1038. [Google Scholar] [CrossRef]
- de Oliveira, L.P.; Hudebine, D.; Guillaume, D.; Verstraete, J. A review of kinetic modeling methodologies for complex processes. Oil Gas Sci. Technol.–Rev. D’ifp Energ. Nouv. 2016, 71, 45. [Google Scholar] [CrossRef]
- Stratiev, D. Hydrocracking of various vacuum residues. Fuels 2025, 6, 35. [Google Scholar] [CrossRef]
- Rogel, E.; Ovalles, C.; Pradhan, A.; Leung, P.; Chen, N. Sediment formation in residue hydroconversion processes and its correlation to asphaltene behavior. Energy Fuels 2013, 27, 6587–6593. [Google Scholar] [CrossRef]
- Ovalles, C.; Rogel, E.; Moir, M.E.; Brait, A. Hydroprocessing of vacuum residues: Asphaltene characterization and solvent extraction of spent slurry catalysts and the relationships with catalyst deactivation. Appl. Catal. A Gen. 2016, 532, 57–64. [Google Scholar] [CrossRef]
- Adams, J.J.; Rovani, J.F.; Planche, J.-P.; Loveridge, J.; Literati, A.; Shishkova, I.; Palichev, G.; Kolev, I.; Atanassov, K.; Nenov, S.; et al. SAR-AD method to characterize eight SARA fractions in various vacuum residues and follow their transformations occurring during hydrocracking and pyrolysis. Processes 2023, 11, 1220. [Google Scholar] [CrossRef]
- Stratiev, D.; Nenov, S.; Shishkova, I.; Georgiev, B.; Argirov, G.; Dinkov, R.; Yordanov, D.; Atanassova, V.; Vassilev, P.; Atanassov, K. Commercial investigation of the ebullated-bed vacuum residue hydrocracking in the conversion range of 55–93%. ACS Omega 2020, 5, 33290–33304. [Google Scholar] [CrossRef]
- Goossens, A.G. Prediction of molecular weight of petroleum fractions. Ind. Eng. Chem. Res. 1996, 35, 985–988. [Google Scholar] [CrossRef]
- ASTM D7169-20e1; Standard Test Method for Boiling Point Distribution of Samples with Residues Such as Crude Oils and Atmospheric and Vacuum Residues by High Temperature Gas Chromatography. ASTM International: West Conshohocken, PA, USA, 2020.
- Stratiev, D.S.; Shishkova, I.K.; Dinkov, R.K.; Petrov, I.P.; Kolev, I.V.; Yordanov, D.; Sotirov, S.; Sotirova, E.N.; Atanassova, V.K.; Ribagin, S.; et al. Crude slate, FCC slurry oil, recycle, and operating conditions effects on H-Oil® product quality. Processes 2021, 9, 952. [Google Scholar] [CrossRef]
- Atanassov, K. Index Matrices: Towards an Augmented Matrix Calculus; Springer: Cham, Switzerland, 2014. [Google Scholar]
- Atanassov, K. Intuitionistic Fuzzy Logics; Springer: Cham, Switzerland, 2017. [Google Scholar]
- Atanassov, K.; Mavrov, D.; Atanassova, V. Intercriteria decision making: A new approach for multicriteria decision making, based on index matrices and intuitionistic fuzzy sets. In Issues in Intuitionistic Fuzzy Sets and Generalized Nets; Atanassov, K., Kacprzyk, J., Krawczak, M., Szmidt, E., Eds.; Warsaw School of Information Technology: Warsaw, Poland, 2014; pp. 1–8. [Google Scholar]
- Atanassov, K.; Atanassova, V.; Gluhchev, G. Intercriteria analysis: Ideas and problems. Notes Intuitionistic Fuzzy Sets 2015, 21, 81–88. [Google Scholar]
- Mavrov, D. Software for intercriteria analysis: Implementation of the main algorithm. Notes Intuitionistic Fuzzy Sets 2015, 21, 77–86. [Google Scholar]
- Mavrov, D. Software for intercriteria analysis: Working with the results. Annu. Inf. Sect. Union Sci. Bulg. 2015, 8, 37–44. [Google Scholar]
- Ikonomov, N.; Vassilev, P.; Roeva, O. ICrAData—Software for intercriteria analysis. Int. J. Bioautomation 2018, 22, 1–10. [Google Scholar] [CrossRef]
- Sotirov, S.; Sotirova, E.; Dinkov, R.; Stratiev, D.; Shishkova, I.; Kolev, I.; Argirov, G.; Georgiev, G.; Bureva, V.; Atanassov, K.; et al. Heavy fuel oil quality dependence on blend composition, hydrocracker conversion, and petroleum basket. Fuels 2025, 6, 43. [Google Scholar] [CrossRef]
- Piskunov, I.V.; Bashkirceva, N.Y.; Emelyanycheva, E.A. The mathematical modeling of bitumen properties interrelations (Review). J. Chem. Technol. Metall. 2022, 57, 464–479. [Google Scholar]
- Li, J.; Ma, J.; Wu, J.; He, W.; Xiang, Q.; Ma, J.M.; Hu, M. Exploring generic fractions of multi-origin asphalts and revisiting the linkage to their bulk properties via machine learning. J. Mater. Inf. 2025, 5, 37. [Google Scholar] [CrossRef]
- Luo, P.; Gu, Y. Effects of asphaltene content on the heavy oil viscosity at different temperatures. Fuel 2007, 86, 1069–1078. [Google Scholar] [CrossRef]
- Ghanavati, M.; Shojaei, M.-J.; Ramazani, A.S.A. Effects of asphaltene content and temperature on viscosity of Iranian heavy crude oil: Experimental and modeling study. Energy Fuels 2013, 27, 7217–7232. [Google Scholar] [CrossRef]
- Miller, K.A.; Nelson, L.A.; Almond, R.M. Should you trust your heavy oil viscosity measurement? J. Can. Pet. Technol. 2006, 5, 42–48. [Google Scholar]
- Zhao, H.; Memon, A.; Gao, J.; Taylor, S.D.; Sieben, D.; Ratulowski, J.; Alboudwarej, H.; Pappas, J.; Creek, J.L. Heavy oil viscosity measurements—Best practices and guidelines. Energy Fuels 2016, 30, 5277–5290. [Google Scholar] [CrossRef]
- Abbott, M.M.; Kaufmann, T.G.; Domash, L. A correlation for predicting liquid viscosities of petroleum fractions. Can. J. Chem. Eng. 1971, 49, 379–384. [Google Scholar] [CrossRef]
- Aboul-Seoud, A.L.; Moharam, H.M. A generalized viscosity correlation for undefined petroleum fractions. Chem. Eng. J. 1999, 72, 253–256. [Google Scholar] [CrossRef]
- Kotzakoulakis, K.; George, S.C. A simple and flexible correlation for predicting the viscosity of crude oils. J. Pet. Sci. Eng. 2017, 158, 416–423. [Google Scholar] [CrossRef]
- Sinha, U.; Dindoruk, B.; Soliman, M.Y. Physics augmented correlations and machine learning methods to accurately calculate dead oil viscosity based on the available inputs. SPE J. 2022, 27, 3240–3253. [Google Scholar] [CrossRef]
- McCain, W.D., Jr. Reservoir-fluid property correlations—State of the art. SPE Reserv. Eng. 1991, 6, 266–272. [Google Scholar] [CrossRef]
- Broeke, T. PAC core GC portfolio. In Proceedings of the IV ROFA Symposium, Belgrade, Serbia, 8–9 May 2025. [Google Scholar]
- Law, J.; Headen, T.F.; Jiménez-Serratos, G.; Boek, E.S.; Murgich, J.; Muller, E.A. A catalogue of plausible molecular models for the molecular dynamics of asphaltenes and resins obtained from quantitative molecular representation. Energy Fuels 2019, 33, 9779–9795. [Google Scholar] [CrossRef]
- Dreillard, M.; Marques, J.; Barbier, J.; Feugnet, F. Deep conversion of vacuum residue while limiting sediment formation. The Chateaux at Deer Valley. In Proceedings of the Petrophase Conference, The Chateaux at Deer Valley, Uta, Park City, UT, USA, 11 July 2018. [Google Scholar]
- Marques, J.; Maget, S.; Verstraete, J.J. Improvement of ebullated-bed effluent stability at high conversion operation. Energy Fuels 2011, 9, 3867–3874. [Google Scholar] [CrossRef]
- Kunnas, J.; Ovaskainen, O.; Respini, M. Mitigate fouling in ebullated-bed hydrocrackers. Hydrocarb. Process. 2010, 10, 59–64. [Google Scholar]
- Chabot, J.; Shiflett, W. Residuum hydrocracking: Chemistry and catalysis. PTQ 2019, Q3, 1–9. [Google Scholar]
- Gray, M.R.; Yarranton, H.W.; Chacón-Patiño, M.L.; Rodgers, R.P.; Bouyssiere, B.; Giusti, P. Distributed properties of asphaltene nanoaggregates in crude oils: A review. Energy Fuels 2021, 35, 18078–18103. [Google Scholar] [CrossRef]
- Stratiev, D.; Shishkova, I.; Nikolaychuk, E.; Dinkov, R.; Stoilov, G.; Yankov, V.; Mitkova, M. Impact of severity in the H-Oil vacuum residue hydrocracking on sediment formation. Pet. Coal 2019, 61, 1166–1182. [Google Scholar]
- Shishkova, I.; Stratiev, D.; Kirov, P.; Dinkov, R.; Sotirov, S.; Sotirova, E.; Bureva, V.; Atanassov, K.; Toteva, V.; Vasilev, S.; et al. Root cause analysis for observed increased sedimentation in a commercial residue hydrocracker. Processes 2025, 13, 674. [Google Scholar] [CrossRef]
- Ovalles, C.; Rogel, E.; Moir, M.; Thomas, L.; Pradhan, A. Characterization of heavy crude oils, their fractions, and hydrovisbroken products by the asphaltene solubility fraction method. Energy Fuels 2012, 26, 549–556. [Google Scholar] [CrossRef]
- Adams, J.; Elwardany, M.; Planche, J.-P.; Boysen, R.; Rovani, J. Diagnostic techniques for various asphalt refining and modification methods. Energy Fuels 2019, 33, 2680–2698. [Google Scholar] [CrossRef]
- Adams, J.J.; Schabron, J.F.; Boysen, R. Quantitative vacuum distillation of crude oils to give residues amenable to the asphaltene determinator coupled with saturates, aromatics, and resins separation characterization. Energy Fuels 2015, 29, 2774–2784. [Google Scholar] [CrossRef]
- Stratiev, D.; Shishkova, I.; Georgiev, G.; Dinkov, R.; Nedelchev, A.; Nikolova, R.; Veli, A.; Bureva, V.; Atanassov, K.; Berg, F.v.d.; et al. The incompatibility pitfall in refining opportunity crude oils. Processes 2025, 13, 593. [Google Scholar] [CrossRef]
- Stratiev, D.; Shishkova, I.; Argirov, G.; Dinkov, R.; Ivanov, M.; Sotirov, S.; Sotirova, E.; Bureva, V.; Nenov, S.; Atanassov, K.; et al. Roles of catalysts and feedstock in optimizing the performance of heavy fraction conversion processes: Fluid catalytic cracking and ebullated bed vacuum residue hydrocracking. Catalysts 2024, 14, 616. [Google Scholar] [CrossRef]
- Sircar, A.; Yadav, K.; Rayavarapu, K.; Bist, N.; Oza, H. Application of machine learning and artificial intelligence in oil and gas industry. Processes 2021, 6, 379–391. [Google Scholar] [CrossRef]
- Li, H.; Hu, X.; Deng, S.; Xu, M. Fast multidimensional NMR inversion based on randomized singular value decomposition. J. Pet. Sci. Eng. 2020, 190, 107044. [Google Scholar] [CrossRef]
- Zhang, F.; Mei, Y.; Jiang, Y.; Zheng, S.; Zheng, K.; Zhou, Y. Research progress of transient absorption spectroscopy in solar energy conversion and utilization. Acta Phys.-Chim. Sin. 2025, 41, 100118. [Google Scholar] [CrossRef]
- Stratiev, D.; Toteva, V.; Shishkova, I.; Nenov, S.; Pilev, D.; Atanassov, K.; Bureva, V.; Vasilev, S.; Stratiev, D.D. Industrial investigation of the combined action of vacuum residue hydrocracking and vacuum gas oil catalytic cracking while processing different feeds and operating under distinct conditions. Processes 2023, 11, 3174. [Google Scholar] [CrossRef]
- Singh, J.; Kumar, M.M.; Saxena, A.K.; Kumar, S. Studies on thermal cracking behavior of residual feedstocks in a batch reactor. Chem. Eng. Sci. 2004, 59, 4505–4515. [Google Scholar] [CrossRef]
- Zepeda, H.M.P. Novel Mesoporous Catalysts for Vacuum Residue Hydrocracking. Ph.D. Thesis, Imperial College London, London, UK, 2013. [Google Scholar]
- Miki, Y.; Yamadaya, S.; Oba, M.; Sugimoto, Y. Role of catalyst in hydrocracking of heavy oil. J. Catal. 1983, 83, 371–383. [Google Scholar] [CrossRef]
- Fortain, P.D.; Gauthier, T.; Merdrignac, I.; Budzinski, H. Reactivity study of Athabasca vacuum residue in hydroconversion conditions. Catal. Today 2010, 150, 255–263. [Google Scholar] [CrossRef]
- Mosiewski, J.M.; Morawski, I. Study on single-stage hydrocracking of vacuum residue in the suspension of Ni-Mo catalyst. Appl. Catal. A Gen. 2005, 283, 147–155. [Google Scholar] [CrossRef]
- Murray, A. Feed Effects on Sediment and Catalyst. In Proceedings of the Criterion—LukOil Workshop, Burgas, Bulgaria, 26–27 January 2017. [Google Scholar]
- Alonso, F.; Ancheyta, J.; Centeno, G.; Marroquín, G.; Rayo, P.; Silva-Rodrigo, R. Effect of Reactor Configuration on the Hydrotreating of Atmospheric Residue. Energy Fuels 2019, 33, 1649–1658. [Google Scholar] [CrossRef]
- Kulkarni, A.D.; Khurpade, P.D.; Nandi, S. Estimation of SARA Composition of Crudes Purely from Density and Viscosity using Machine Learning Based Models. Petroleum 2024, 10, 620–630. [Google Scholar] [CrossRef]
Disclaimer/Publisher’s Note: The statements, opinions and data contained in all publications are solely those of the individual author(s) and contributor(s) and not of MDPI and/or the editor(s). MDPI and/or the editor(s) disclaim responsibility for any injury to people or property resulting from any ideas, methods, instructions or products referred to in the content. |
© 2025 by the authors. Licensee MDPI, Basel, Switzerland. This article is an open access article distributed under the terms and conditions of the Creative Commons Attribution (CC BY) license (https://creativecommons.org/licenses/by/4.0/).