Article

Coal Tar Naphtha Refining: Phenol Alkylation with 1-Hexene and the Impact of Pyridine

Department of Chemical and Materials Engineering, University of Alberta, 9211–116th Street, Edmonton, AB T6G 1H9, Canada
*
Author to whom correspondence should be addressed.
Processes 2025, 13(1), 194; https://doi.org/10.3390/pr13010194
Submission received: 17 December 2024 / Revised: 1 January 2025 / Accepted: 8 January 2025 / Published: 12 January 2025
(This article belongs to the Special Issue Synthesis, Catalysis and Applications of Organic Chemistry)

Abstract

:
Coal tar naphtha is produced from coal carbonization, moving bed coal gasification, and thermal liquefaction of coal. The naphtha can contain up to 60% aromatics and 15% olefins, as well as nitrogen-, oxygen-, and sulfur-containing compounds. Usually only hydrotreating is considered, but when producing motor gasoline, olefin–aromatic alkylation could reduce the associated octane number loss due to olefin hydrogenation by converting olefins to alkylated phenols and aromatics. The plausibility of using acid-catalyzed alkylation with coal tar naphtha, which contains nitrogen bases, was investigated by studying a model system comprising phenol and 1-hexene in the absence and presence of pyridine. It was found that pyridine only inhibited conversion over a range of amorphous silica–alumina catalysts. The most effective catalyst was Siral 30 (30% silica, 70% alumina) and at 315 °C, 0.05 wt% pyridine caused a 35% inhibition of phenol conversion compared to conversion in the absence of pyridine. Catalyst activity could be restored by rejuvenating the catalyst with clean feed at a higher temperature. The results supported a description of phenol alkylation with olefins that took place by at least two pathways, one involving protonation of the olefin (typical for Friedel–Crafts alkylation) and one where the olefin is the nucleophile.

1. Introduction

Coal tar naphtha is the naphtha range (typically C5–175 °C boiling range) material obtained from coal pyrolysis. Sources of this product are low- and high-temperature coal pyrolysis in coke ovens to produce coke [1,2,3], moving bed gasification of coal to produce synthesis gas [4,5], and direct thermal liquefaction of coal [6,7]. The composition of the coal tar naphtha depends on the process and coal used as feed material, but it comprises a mixture of aromatics, paraffins, naphthenes, olefins, and heteroatom-containing species.
On account of its aromatic-rich nature, the coal tar naphtha can be refined to produce aromatic commodity chemicals [8,9]. There is also the possibility of refining specialty aromatics for smaller markets. Alternatively, coal tar naphtha can be refined to produce transport fuel, which is the application of interest in this study.
Producing motor gasoline from coal tar naphtha is faced with one particular challenge, namely, to retain octane number in the final product. In terms of aromatic and olefinic content, coal tar naphtha from different sources can contain up to 60% aromatics and 15% olefins, as is the case with coal tar naphtha from moving bed gasification. One would expect the octane number of such a product to be high. However, coal tar naphtha must also be hydrotreated to reduce the heteroatom content and herein lies the problem.
Coal tar naphtha has nitrogen-, oxygen-, and sulfur-containing compounds, such as pyridines, phenols, and thiophenes. Isostructurally, sulfur is usually the easiest heteroatom to remove by hydrotreating [10,11,12]. Sulfur is also the only heteroatom with a specific concentration limit imposed on the final product by fuel specifications (typically 10–15 μg∙g−1). The nitrogen content is not directly regulated, but it is indirectly regulated through storage-stability-related specifications. Motor gasoline may contain oxygen, but phenol is problematic due to its acidity. The phenol content of the fuel is indirectly regulated through the total acid number specification.
When the heteroatom content in the coal tar naphtha is reduced by hydrotreating, the olefins are also hydrotreated to produce paraffins. The olefins typically have high octane numbers, but unless paraffins are highly branched, they have low octane numbers [13]. It is therefore found that, in practice, hydrotreated coal tar naphtha has a poor octane number rating despite its high aromatic content but as a consequence of the high paraffin content. To illustrate the point, two examples are given. The hydrotreated coal tar naphtha from moving bed coal gasification has a research octane number (RON) of 80–85 and a motor octane number (MON) of 70–76 [5]. The hydrotreated coal tar naphtha from high-temperature coal coking has a RON of 79–81 and a MON of 68–76 [14].
The use of alkylated phenols to improve storage stability is well known and industrially practiced [15,16]. At the same time, alkylated phenols and phenol ethers have good octane number ratings [17,18,19]. Retaining some phenolic compounds in the naphtha would therefore be acceptable, as long as the total amount of phenols did not cause the fuel to exceed the total acid number. The same restriction did not apply to phenyl ethers, which had high octane numbers and no acidity. At the same time the argument is academic because it is unlikely that the alkylated products would remain in the naphtha boiling range.
It was reasoned that the olefin content and the phenol content of coal tar naphtha could be decreased, with less loss in the octane number, if the phenol was alkylated with olefins to produce alkylated phenols and phenol ethers. In principle, the same reaction could produce alkylated aromatic hydrocarbons. This means that it would be possible to substantially reduce the olefin content of the coal tar naphtha prior to hydrotreating and thereby limit the octane number loss during hydrotreating.
The primary objective of performing phenol alkylation is to reduce the olefin content before hydrotreating since the main octane number loss is associated with olefin hydrogenation to paraffins. Alkylation will cause a change in the boiling point of the alkylated products, which will distill in the kerosene or atmospheric gas oil boiling range. It may therefore seem as if the octane number benefit is lost due to the loss of aromatics, but this is not the case.
To illustrate this point, consider the following example. An arbitrary naphtha is employed that contains cresol and 1-hexene in a mixture of hydrocarbons that will not be affected by hydrogenation. The concentration of cresol and 1-hexene is 10 and 12 vol%, respectively, i.e., an equimolar mixture of phenolic and olefinic species. The naphtha has the same octane number as the equimolar mixture of cresol and 1-hexene, RON = 96 and MON = 82. If the cresol and 1-hexene are hydrogenated to toluene and n-hexane, the octane number of the naphtha decreases to RON = 89 and MON = 77, because an equimolar mixture of toluene and n-hexane has a RON = 68 and a MON = 61. When cresol and 1-hexene are completely converted to hexyl cresol and removed by distillation, the naphtha retains its octane number.
However, there was still a challenge in the implementation because olefin–aromatic alkylation is an acid-catalyzed process and coal tar naphtha usually contains pyridines. Pyridines are basic compounds and would strongly adsorb on acid sites of acid catalysts, potentially poisoning the catalyst.
The working hypothesis in this study was that nitrogen bases are not necessarily catalyst poisons but inhibitors of acid catalysis. It should therefore be possible to perform target conversion, acid-catalyzed olefin–aromatic alkylation, despite the presence of basic nitrogen compounds in the feed. There are two equilibria that can potentially be manipulated for this purpose. The first is the liquid–solid equilibrium and the second is the acid–base equilibrium. Both equilibria are temperature-dependent. The acid–base equilibrium is also dependent on the relative strength of the acids (catalyst acid sites) and the bases (nitrogen bases in coal tar naphtha).
The temperature-dependent equilibria favored a reaction at higher temperatures, but the onset of dealkylation and cracking placed an upper limit on temperature. An operating temperature of 315 °C was selected for this study as a compromise.
The approach that was taken was to experimentally explore acid-catalyzed olefin–aromatic alkylation using a model feed comprising phenol and 1-hexene in the presence and absence of pyridine as a nitrogen base. Although the aim is to ultimately apply the knowledge gained to coal tar naphtha, this study did not include coal tar naphtha as feed material.

2. Experimental Section

2.1. Materials

Phenol (>99%), 1-hexene (97%), and pyridine (>99%) were commercially obtained from Sigma-Aldrich and used without further purification. Additionally, n-pentane (99.5%) solvent for preparing samples for gas chromatography was commercially obtained from Acros Organics.
The alumina and amorphous silica–alumina catalyst types were commercially obtained from Sasol, Germany (former Condea GmbH). These were Siral series catalysts (silica-doped silica–alumina, with the silica content varying from 5 to 40 wt% over the series, e.g., Siral 5 contains 5 wt% SiO2). All amorphous silica–alumina catalysts were calcined in air at 550 °C for 6 h before use. The average particle size of the catalysts, as provided by the supplier, was 50 μm. Catalyst characterization is presented as part of the results in Section 3.1.

2.2. Equipment and Procedure

Batch reactor conversion of phenol and 1-hexene. These experiments were conducted using 15 mL micro-batch reactors manufactured from stainless steel Swagelok tubing and fittings with a diameter of 1.3 cm (½ inch). The reactors were externally heated by submerging them in a hot fluidized sand bath heater. The reaction temperature was controlled indirectly by adjusting the temperature of the sand bath heater. In a typical experiment, the micro-batch reactor was loaded with approximately 5.2 g phenol, 4.3 g 1-hexene and 0.5 g catalyst. This corresponded to a molar ratio phenol/1-hexene of 1:1 in the feed. The reactions were performed under autogenous pressure at the indicated temperatures (in the range of 220–350 °C) for a duration of 1 h, equivalent to a weight hourly space velocity (WHSV) of 19 h−1. These conditions were selected to limit overall conversion to better study the impact of pyridine deactivation.
Five sets of experiments were performed using batch reactor conversion phenol and 1-hexene:
(i)
Catalytic conversion at 315 °C, using the Siral 5, 10, 20, 30 and 40 catalysts.
(ii)
Catalytic conversion at 315 °C, using the Siral 5, 10, 20, 30 and 40 catalysts pretreated with pyridine, i.e., catalyst exposed to flowing He saturated with pyridine vapor for 1 h, followed by purging with He only for 1 h.
(iii)
Catalytic conversion as in (ii), but adding 6 mg (0.05 wt%) pyridine to the feed mixture.
(iv)
Thermal conversion at 220, 250, 315, and 350 °C, i.e., no catalyst added.
(v)
Thermal conversion as in (iv), with 0.05 wt% pyridine added to the feed.
Flow reactor conversion of phenol and 1-hexene. These experiments were conducted using a packed bed reactor, with a diameter of 1.3 cm, with a central thermowell. The reactor was loaded with 1 g catalyst dilute with an equivalent amount of silicon carbide (38 μm particle diameter). The total bed volume was 5 mL. The catalyst bed was kept in place using glass wool. The feed was a 1:1 molar ratio of phenol and 1-hexene and was delivered to the reactor using a positive displacement pump at a rate of 0.15 mL∙min−1, corresponding to a WHSV of 17 h−1. To reduce the risk of poor catalyst wetting, the flow direction was from the bottom to the top and the catalyst was pre-wetted by feeding at a high flow rate beforehand. The temperature inside the reactor was controlled by adjusting the temperature of an external heater element. Conversion was performed at 315 °C and near atmospheric pressure using Siral 30 and Siral 40 catalysts only.
In a typical experiment, conversion was performed using phenol and 1-hexene for a predetermined time period (5 h), after which pyridine was added to the feed, with the pyridine concentration being increased hourly with steps at 0.05, 0.07, 0.10, 0.15, 0.20, and 0.25%. At the end of this period, the catalyst was rejuvenated by switching to clean feed again and increasing the temperature briefly to 450 °C to assist with pyridine desorption, before reducing it to 315 °C again. The sequence was repeated once.

2.3. Analyses

Catalyst pore volume and surface area were determined by mercury porisometry with a Quantachrome PoreMaster® Hg intrusion porosimeter. BET surface area was provided by the catalyst supplier.
The composition of the catalysts was determined by energy-dispersive X-ray fluorescence (XRF) analysis with a Bruker S2 Ranger, with a silicon drift detector. The X-ray source uses a Pd target. The analyses were performed at 10 kV with a total count rate in the order of 20,000 counts per second; no filters or secondary targets were employed.
Total acid concentration and the acid strength of the catalysts were determined by ammonia temperature-programmed desorption (NH3-TPD). The NH3-TPD analysis was performed using a Quantachrome ChemBET TPR/TPD Chemisorption Flow Analyzer equipped with a thermal conductivity detector (TCD). For each analysis, about 60 mg of catalyst was pretreated under flowing helium (50 mL∙min−1) at 550 °C for 6 h and then cooled down to room temperature. Ammonia adsorption was then performed at room temperature by exposing the catalyst to an NH3 flow of 70 mL∙min−1 for 1 h. Physisorbed NH3 was removed by keeping the sample in a He flow for 100 min. For the TPD experiments, the sample was heated from room temperature to 650 °C at a heating rate of 15 °C∙min−1 under a He flow of 50 mL∙min−1.
The nature of the acid sites was determined using Fourier-transform infrared (FTIR) analysis. The spectra were collected on an ABB MB3000 FTIR with a Pike DiffusIR attachment. The DiffusIR has an environmental chamber that is temperature-controlled and can heat up to 500 °C. The analytical procedure was as follows. The catalyst (2 mg) was pressed into a ceramic cup. The catalyst was then exposed to flowing He saturated with pyridine vapor for 1 h, followed by purging with clean He flow for about 1 h. Purging with clean He also removed physisorbed pyridine from the surface, leaving only the stronger chemisorbed species. This cleaning process could be followed by FTIR and was continued until no further spectral changes were observed. The analysis of the catalyst with adsorbed pyridine started at ambient temperature and the ceramic cup was heated at a rate of 10 °C∙min−1 under a He flow from 25 to 500 °C. The temperature was held constant during spectral acquisition. The spectra were recorded at 50 °C intervals at a resolution of 16 cm−1 and as the average of 120 scans.
The reaction products from the batch and continuous-flow reactor experiments were identified using an Agilent 7890 GC with 5975C mass selective detector (GC-MS). The products were quantified by analysis with an Agilent 7890 gas chromatograph with flame ionization detector (GC-FID). The peak areas from the GC-FID chromatograms were related to product mass by employing appropriate FID response factors. A 50 m HP-PONA column was employed for product separation. The temperature program started at 40 °C, with a hold of time of 5 min, whereafter the temperature was increased by 4 °C∙min−1 up to 120 °C, and then at 20 °C∙min−1 to 300 °C and holding for 5 min.

3. Results

3.1. Characterization of Amorphous Silica–Alumina

The amorphous silica–alumina catalysts are commercial catalysts and characterization data for these catalysts are available [20]. The catalysts were nevertheless characterized as part of the study. Pore volume, surface area and catalyst compositions are reported in Table 1. The BET surface areas were comparable to those previously reported [20]. The direct measurement of pore volume by mercury porosimetry and derived surface area indicated that about 200 m2∙g−1 was readily accessible by molecules with a diameter of 6 nm (60 Å), which is the smallest pore diameter measurable using mercury porosimetry.
Total acid concentration was measured using ammonia temperature-programmed desorption (NH3-TPD) and is reported in Table 2. The NH3 evolution was observed as three overlapping peaks and these are indicated together with the temperature where maximum NH3 desorption was observed for each peak.
To confirm that the NH3-TPD measurements provided reasonable acid characterization for a study employing pyridine as a nitrogen base, pyridine temperature-programmed desorption was performed on one of the catalysts (Siral 30) and the results are also reported in Table 2. The acid site concentrations measured by NH3 (1127 μmol∙g−1) and pyridine (1148 μmol∙g−1) were close in value. The main difference was that the temperature of maximum desorption was higher for pyridine than ammonia.
The nature of the acid sites was determined using infrared spectrometry of pyridine-treated catalysts [21]. Infrared absorption around 1450 cm−1 is characteristic of coordinative adsorption of pyridine on Lewis acid sites. Infrared absorption around 1540 cm−1 is characteristic of the pyridinium ion formed on Brønsted acid sites.
The Lewis-to-Brønsted acid site ratio of the amorphous silica–alumina catalysts is reported in Table 3, when not adjusted for differences in the molar extinction coefficients. The molar extinction coefficient ratios reported for amorphous silica–alumina are >1 [22], which means that the actual Lewis-to-Brønsted acid site ratio is proportionally lower. No attempt was made to determine the molar extinction coefficient ratio in this work. The calculated Brønsted acid site concentration (Table 3) was based on the Lewis-to-Brønsted acid molar ratio at 25 °C without applying a correction for molar extinction coefficient. A non-unity molar extinction coefficient would change the calculated concentrations but not their relative rank order.

3.2. Batch Reactor Catalyzed Phenol Alkylation with 1-Hexene

The purpose of testing amorphous silica–alumina catalysts with different Brønsted acid strengths for phenol alkylation was to evaluate how the reaction would be affected by the presence of a nitrogen base. For a clean feed with no pyridine, it was expected that the conversion would increase with an increase in the total Brønsted acid concentration of the catalysts. When pyridine was present, it was expected that the conversion would decrease compared to the clean feed and that the highest phenol conversion would be found for the catalysts with the highest concentration of weaker Brønsted acid sites. This followed from the reasoning that pyridine would be thermally desorbed at reaction conditions from the weaker acid sites, but not the stronger acid sites, analogous to the TPD results presented in Table 2.
The alkylation of phenol with 1-hexene was performed in the absence of pyridine, as well as in its presence, and the results are shown in Table 4.
Phenol conversion of the clean feed with no pyridine did not exactly match the expected outcome. For the Siral 5, Siral 10, Siral 30, and Siral 40 catalysts, there was a seemingly systematic increase but this did not match the total acidity (Table 2) or total acidity taking the Lewis-to-Brønsted acid ratio (Table 3) into account. The highest phenol conversion was observed using Siral 20.
When pyridine was present, there was little difference in the phenol conversion over Siral 5, Siral 10, and Siral 20 (Table 4) despite differences in their acid site concentration and Brønsted acid site strength. Pyridine only inhibited the reaction and, for Siral 20, that led to the highest decrease in conversion, though it still retained about one third of its apparent activity. Siral 30, which had the highest Brønsted acid concentration, fared best when pyridine was present, but Siral 40 was severely affected and had the lowest phenol conversion in the presence of pyridine.
Phenol conversion was generally lower when there was pyridine in the feed and not just pyridine pre-adsorbed on the catalyst (Table 4). At the same reaction conditions, the amount of pyridine present affected the phenol conversion.
It was possible to classify the products from phenol alkylation into phenyl ethers (O-alkylated products), ortho-alkylated phenol, meta/para-alkylated phenol, and products alkylated more than once. Differentiating between mono-alkylated and multi-alkylated products was based mainly on retention time, with support from mass spectrometry. Differentiating between the mono-alkylated products was based on characteristics of the electron impact fragmentation in the mass spectra (Figure 1) [23]. Identification of individual isomers within each main category was not attempted.
In terms of retention times, it was found that there was a clear chromatographic separation between the phenyl ethers (27–31 min), the mono-alkylated phenols (31–33 min), and the multi-alkylated phenols (>33 min). The retention times of the mono-alkylated phenols, i.e., ortho-, meta-, and para-C-alkylated phenols, were not chromatographically separated in distinct retention time regions based on orientation, and identification had to rely on mass spectrometry.
Using this approach, the product selectivity of catalyzed conversion of phenol with 1-hexene was determined for clean feed and catalyst (Table 5), pyridine-treated catalyst with clean feed (Table 6) and pyridine-treated catalyst with 0.05 wt% pyridine in the feed (Table 7). Apart from isomerization of 1-hexene and the detection of some hexanol, caused by hydration of the hexene, hexene oligomerization was negligible.
The most obvious changes in product selectivity between the clean feed and catalyst (Table 5) and when pyridine was present (Table 6 and Table 7) were the increase in ortho-alkylated phenol and the decrease in meta/para-alkylated and multi-alkylated phenols. Beyond experimental variability, there was no change in phenyl ether selectivity.

3.3. Batch Reactor Phenol Alkylation with 1-Hexene in the Absence of a Catalyst

To assist with the interpretation of the results presented in Section 3.2, control experiments were performed without the addition of a catalyst because it was expected that some phenol alkylation would be observed in the absence of a catalyst [24]. The experiments were performed over a temperature range of 220–350 °C in the absence and presence of pyridine (Table 8).
Over the temperature range investigated, phenol conversion monotonically increased with an increase in temperature. At 315 °C, acid-catalyzed conversion (Table 4) was about 4–9 times that of the self-catalyzed reaction (Table 8). Self-catalyzed phenol conversion could therefore not explain all of the acid-catalyzed phenol conversion.
The addition of 0.05 wt% pyridine to the feed suppressed self-catalyzed phenol conversion in the absence of a catalyst. The relative impact of pyridine on phenol alkylation depended on the temperature and, as temperature increased, the proportional decrease in phenol conversion due to pyridine decreased. Relative suppression of phenol conversion by pyridine at 220 °C was 85%, and, at 350 °C, it was 43% (Table 8).
To facilitate a comparison with Table 5, Table 6 and Table 7, the phenol product selectivity from conversion at 315 °C in the absence and presence of pyridine is reported in Table 9.

3.4. Flow Reactor Catalyzed Phenol Alkylation with 1-Hexene

The batch reactor studies revealed that phenol conversion was suppressed by pyridine but that the acid catalysts were not completely poisoned. It was also found that phenol conversion was mainly acid-catalyzed, but not exclusively so, and uncatalyzed phenol conversion took place in parallel, albeit at a slower rate. These were tentative conclusions because catalyst poisoning is the result of accumulation and the potential accumulation of a species on a catalyst over time cannot be determined using batch reactors. To determine whether the partitioning of pyridine between the catalyst and the liquid was indeed dynamic, proportional to pyridine concentration, and potentially reversible, experiments were conducted with a flow reactor.
Phenol conversion with time-on-stream in a flow reactor is shown in Figure 2. The behavior of Siral 30 and Siral 40 was comparable and it reflected the batch reactor conversion data in Table 4. Siral 40 was more reactive for conversion of the clean phenol and 1-hexene feed but was proportionally more inhibited by pyridine than Siral 30.
The extent of inhibition of phenol conversion increased with increasing pyridine concentration in the feed. It also appeared that the impact of pyridine on conversion was reversible. The activity of Siral 30 for phenol conversion could be completely restored by rejuvenation (heating the catalyst in clean feed to 450 °C). It was less clear whether this was also the case for Siral 40 and whether the slightly lower phenol conversion achieved after catalyst rejuvenation was caused by retained pyridine.

4. Discussion

4.1. Phenol Alkylation in the Absence of a Catalyst

The study of phenol alkylation is somewhat complicated by the contribution of phenol alkylation in the absence of a catalyst, as shown in 
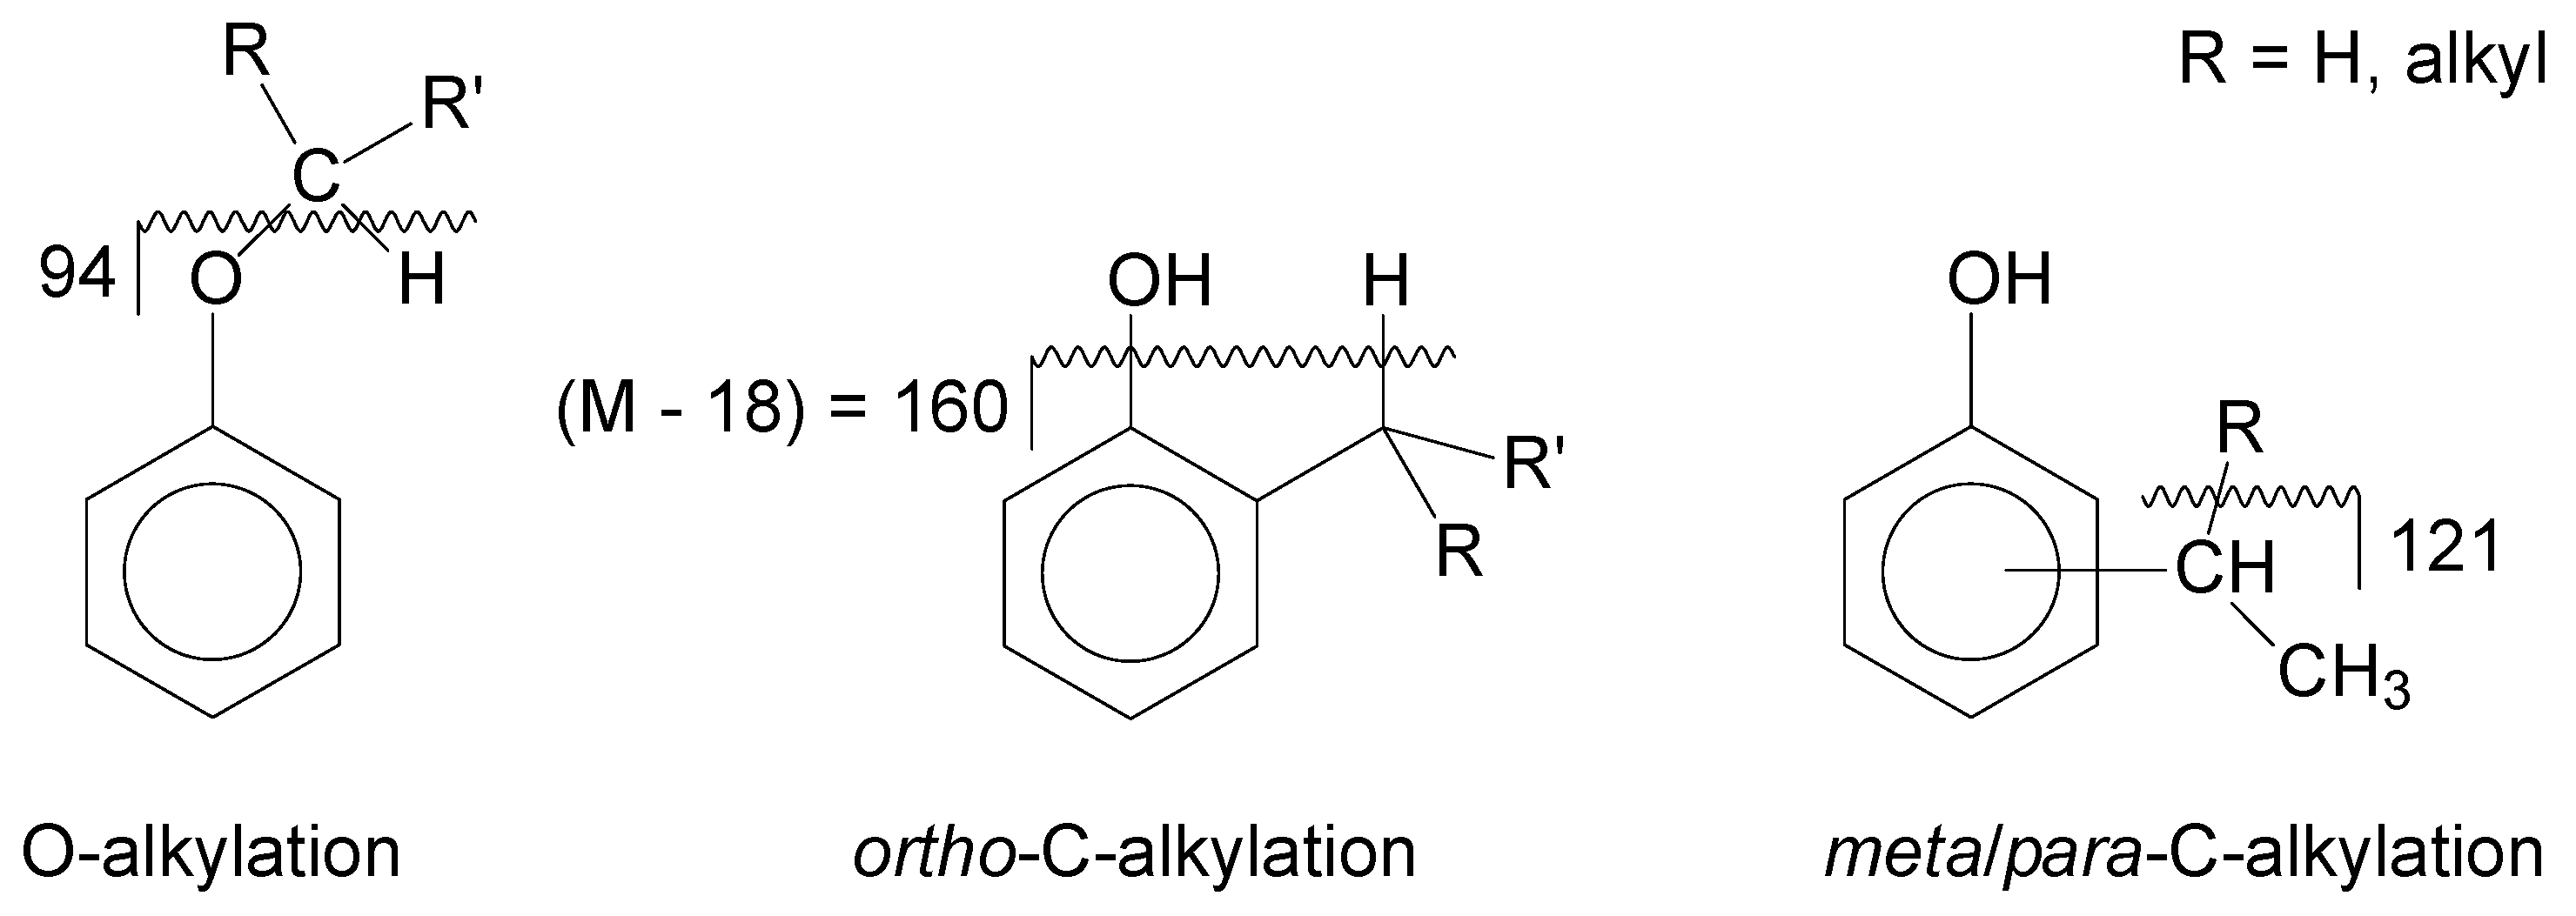
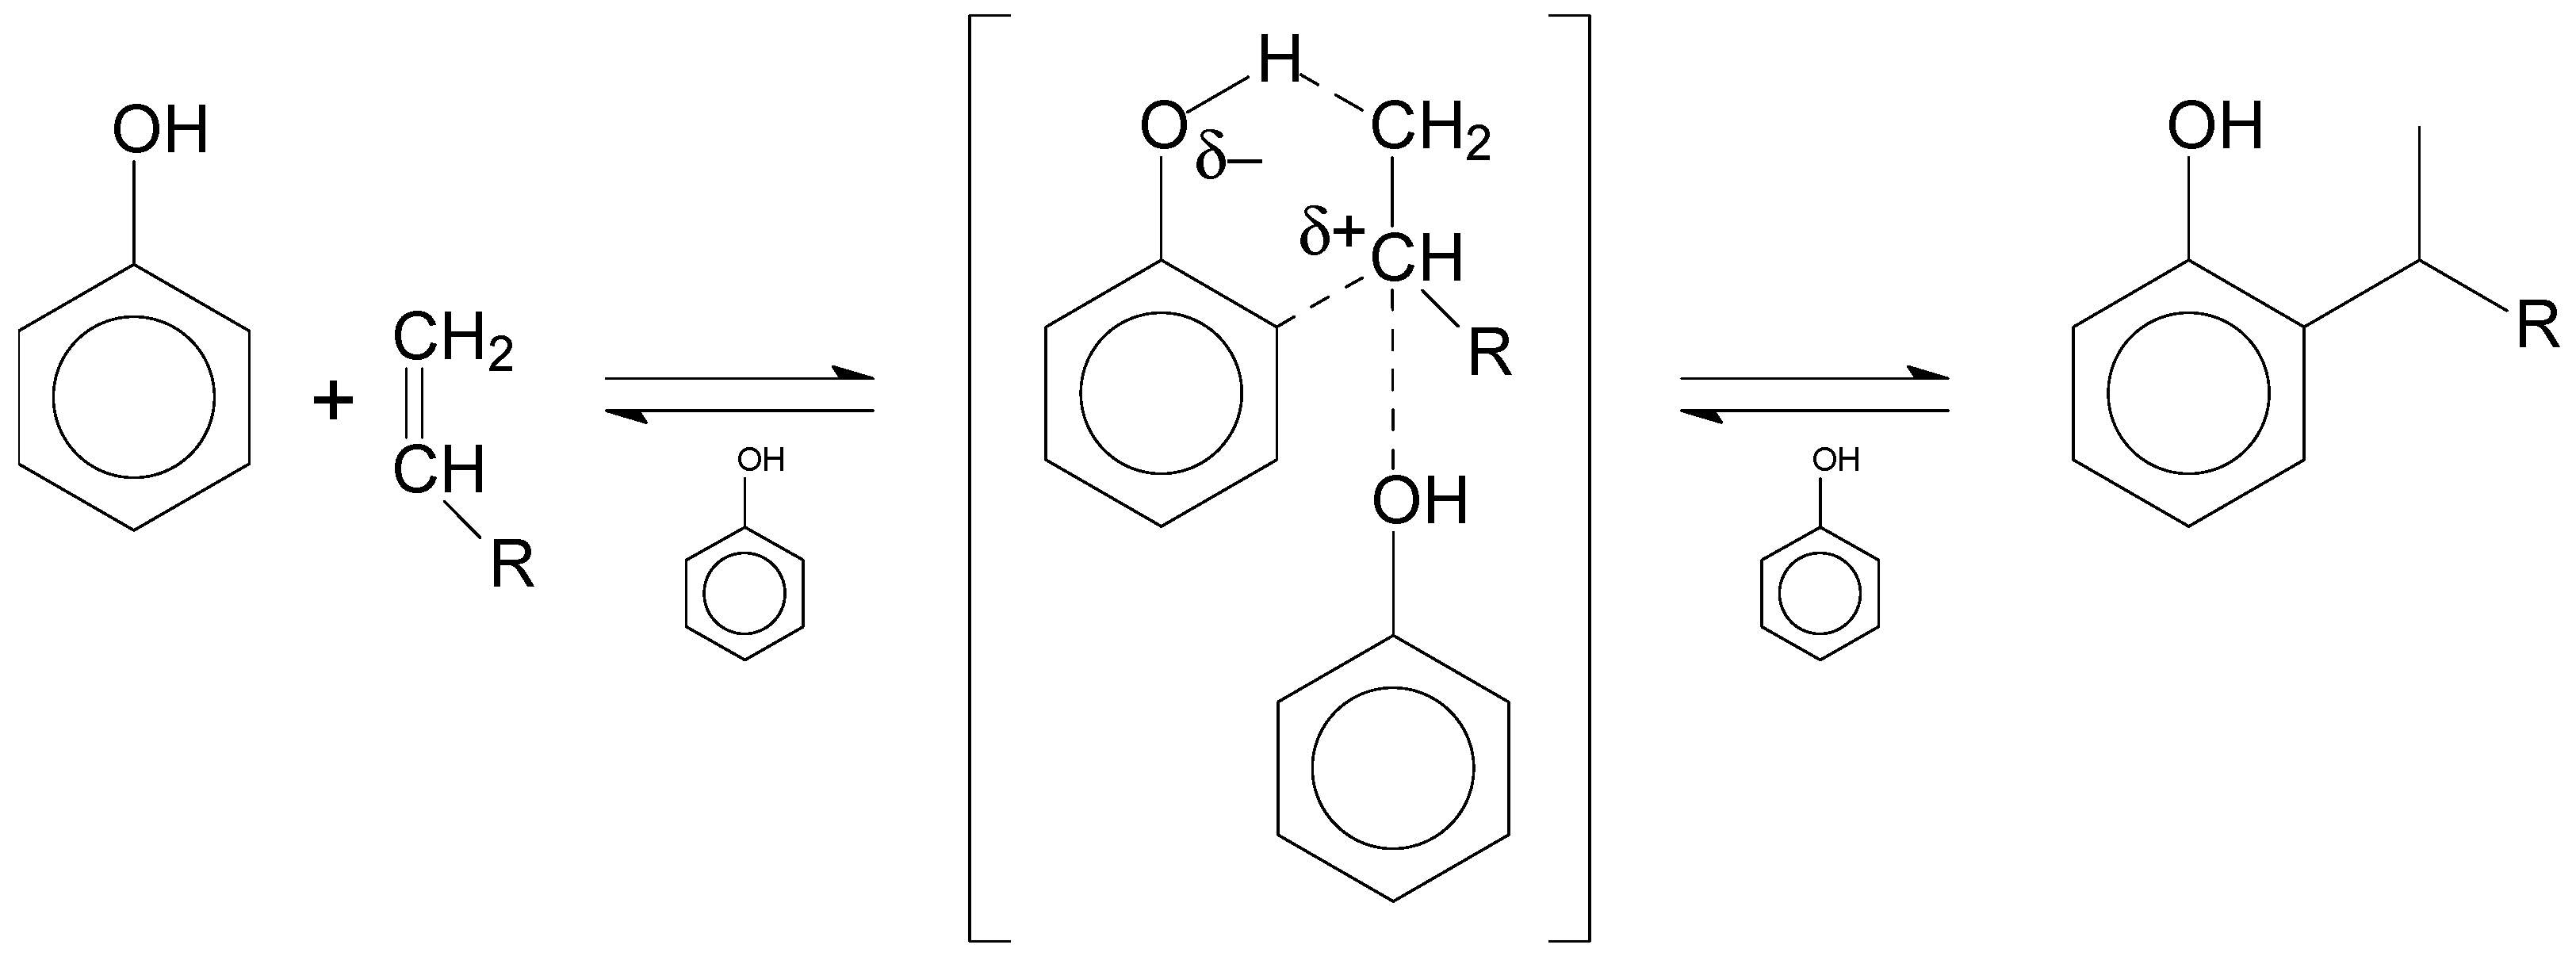
Table 8. The reaction is described in terms of the formation of a six-membered ring as a transition state, which is stabilized by additional phenol in proximity (Figure 3) and leads to the formation of alkylated phenol as product. Considering this, it is appropriate to refer to phenol alkylation as self-catalyzed because it is not truly an uncatalyzed reaction.
Direct and indirect support for the pathway in Figure 3 can be found from various sources. It offers a plausible explanation for the high ortho-alkylation selectivity (Table 9) observed in the present study and by Goldsmith et al. [24]. Direct spectroscopic support for hydrogen bonding of olefins to phenol was presented by West [25]. In the presence of olefins, the 3610 cm−1 infrared absorption of unbonded phenol O–H decreases with an increase in the bonded phenol O–H infrared absorption at 3550–3510 cm−1. The phenol conversion rate was reported to be strongly dependent (second- to sixth-order dependence) on phenol concentration [24,26], which is congruent with the stabilization of the transition state by additional phenol. Furthermore, it was reported that dilution in pentane [24] and dioxane [27] suppressed phenol alkylation as one would expect from the strong concentration dependence of the reaction.
The potential contribution of catalytic contribution by the reactor wall was not studied, but it was previously reported that there was little difference in phenol alkylation when conducted in either 304 stainless steel or in glass-lined vessels [24]. Additionally, when comparing phenol conversion at 315 °C with catalysts with surface areas >300 m2∙g−1 (Table 4) to that without a catalyst (Table 8), it is improbable that the extent of phenol conversion without a catalyst can be explained in terms of the limited surface area of the reactor wall, even if it was catalytically active.
The inhibition of phenol alkylation in the absence of a catalyst by pyridine is thought to be primarily due to the acid–base reaction between pyridine (Kb = 2.3 × 10⁻⁹) and phenol (Ka = 1 × 10⁻¹⁰), which will convert a fraction of the pyridine and phenol to the corresponding acid–base pair. In poorly solvating solutions, the clustering of phenol–pyridine acid–base pairs may work [28].
Several important conclusions can be drawn from the phenol alkylation of olefins in the absence of a catalyst. First, the reaction required only weak acidity. Phenol was sufficiently acidic to self-catalyze the alkylation reaction with olefins. Second, the olefin in the transition-state has carbocation character, but is not formed by protonation of the olefin. The carbocation character is a result of polarization through the action of more than one phenolic group. Third, a consequence of the geometry of olefin polarization by multiple phenolic groups is that ortho-alkylation is strongly favored.

4.2. Phenol Alkylation with Amorphous Silica–Alumina Catalysts

Brønsted acid-catalyzed phenol alkylation with olefins is a type of Friedel–Crafts alkylation, but it differs from aromatic hydrocarbon alkylation in some respects. Alkylation of aromatic hydrocarbons with olefins proceeds by protonation of the olefin by the catalyst, which is followed by a nucleophilic attack from the bulk fluid phase, i.e., an Eley–Rideal type of reaction [29]. Since both aromatics and olefins are nucleophiles, olefin oligomerization is an important side-reaction and, in industrial processes, the selectivity to alkylation is improved by operating at a high aromatic-to-olefin ratio [9]. Conversely, when the aromatic hydrocarbon is adsorbed on the acid catalyst, the aromatic is not protonated at typical alkylation reaction conditions, although it is reactive for ring protonation at more severe conditions.
The present study employed a 1:1 molar ratio of phenol and 1-hexene; yet, hexene oligomerization was negligible (Section 3.2). This was consistent with previous studies of phenol alkylation over a range of acid catalysts, which found that selectivity to oligomerization was low (<5%) or negligible [30,31,32,33,34,35]. The alkylation of phenolic compounds with very reactive olefins, such as isobutene, found a higher proportion of oligomerization [36], but even so, selectivity to oligomerization was low (<10%) compared to alkylation.
There are likely two contributing factors explaining these observations. The first is that phenol alkylation does not require protonation of the olefin by the catalyst to proceed, but this is a requirement for olefin oligomerization. The second is that phenol is a more polar molecular than olefins, and surface coverage of the polar catalyst surface by phenol is likely higher than the bulk fluid concentration, i.e., competitive adsorption.
Although these observations could explain the low oligomerization selectivity, they do not fully explain the high phenol conversion to alkyl phenols in combination with low oligomerization selectivity. To explain this, one should consider the reactivity of adsorbed phenol. There are multiple reaction pathways for phenols and olefins [37,38,39], and not all proceed by adsorption and protonation of the olefin. Unlike adsorbed aromatic hydrocarbons that are unreactive for alkylation by olefins at alkylation reaction conditions, adsorbed phenol appears to be reactive for alkylation. In this case, the reactions that are possible involve adsorbed olefins that can react with either phenol or olefins, but importantly, adsorbed phenol can react with olefins. This would offer a plausible explanation for the high phenol alkylation selectivity at high phenol conversion in equimolar feed mixtures, such as studied in this work.
Further support for this interpretation of the results is found the inhibitory effect of pyridine (compare Table 5 with Table 6 and Table 7). There was a noticeable increase in ortho-alkylation selectivity when pyridine inhibited the catalysis, although it did not reach the ortho-alkylation selectivity of the uncatalyzed reaction by the pathway, as shown in Figure 3. Pyridine decreased the availability of stronger Brønsted acid sites, and weaker acid sites were still able to provide additional polarization analogous to phenol in the bulk fluid (as shown in Figure 3), causing the observed increase in ortho-alkylation. Differently put, the inhibition of the acid catalyst by pyridine caused a proportionately lower reaction to proceed by protonation of the olefin, and a proportionately greater reaction to proceed by nucleophilic attack of the olefin on the adsorbed phenol.
Comparable observations can be found in the literature. For example, poisoning of Beta-zeolite by potassium exchange resulted in a decrease in phenol alkylation conversion at a constant temperature but an increase in ortho-alkylation selectivity [33]. Deprotonation of an industrial silica–alumina catalyst likewise resulted in a decrease in phenol conversion at a constant temperature but an increase in ortho-alkylation selectivity [40].
In conclusion, this study presented evidence to support that acid-catalyzed phenol alkylation took place by at least two pathways. The one pathway is typical of olefin–aromatic alkylation, which involves protonation of the olefin by the catalyst, followed by nucleophilic attack by phenol from the bulk fluid. The other pathway involves the adsorption of phenol on the acid catalyst, with polarization of the olefin, which is responsible for the nucleophilic attack.

4.3. Acid Catalyst Properties and Impact of Pyridine

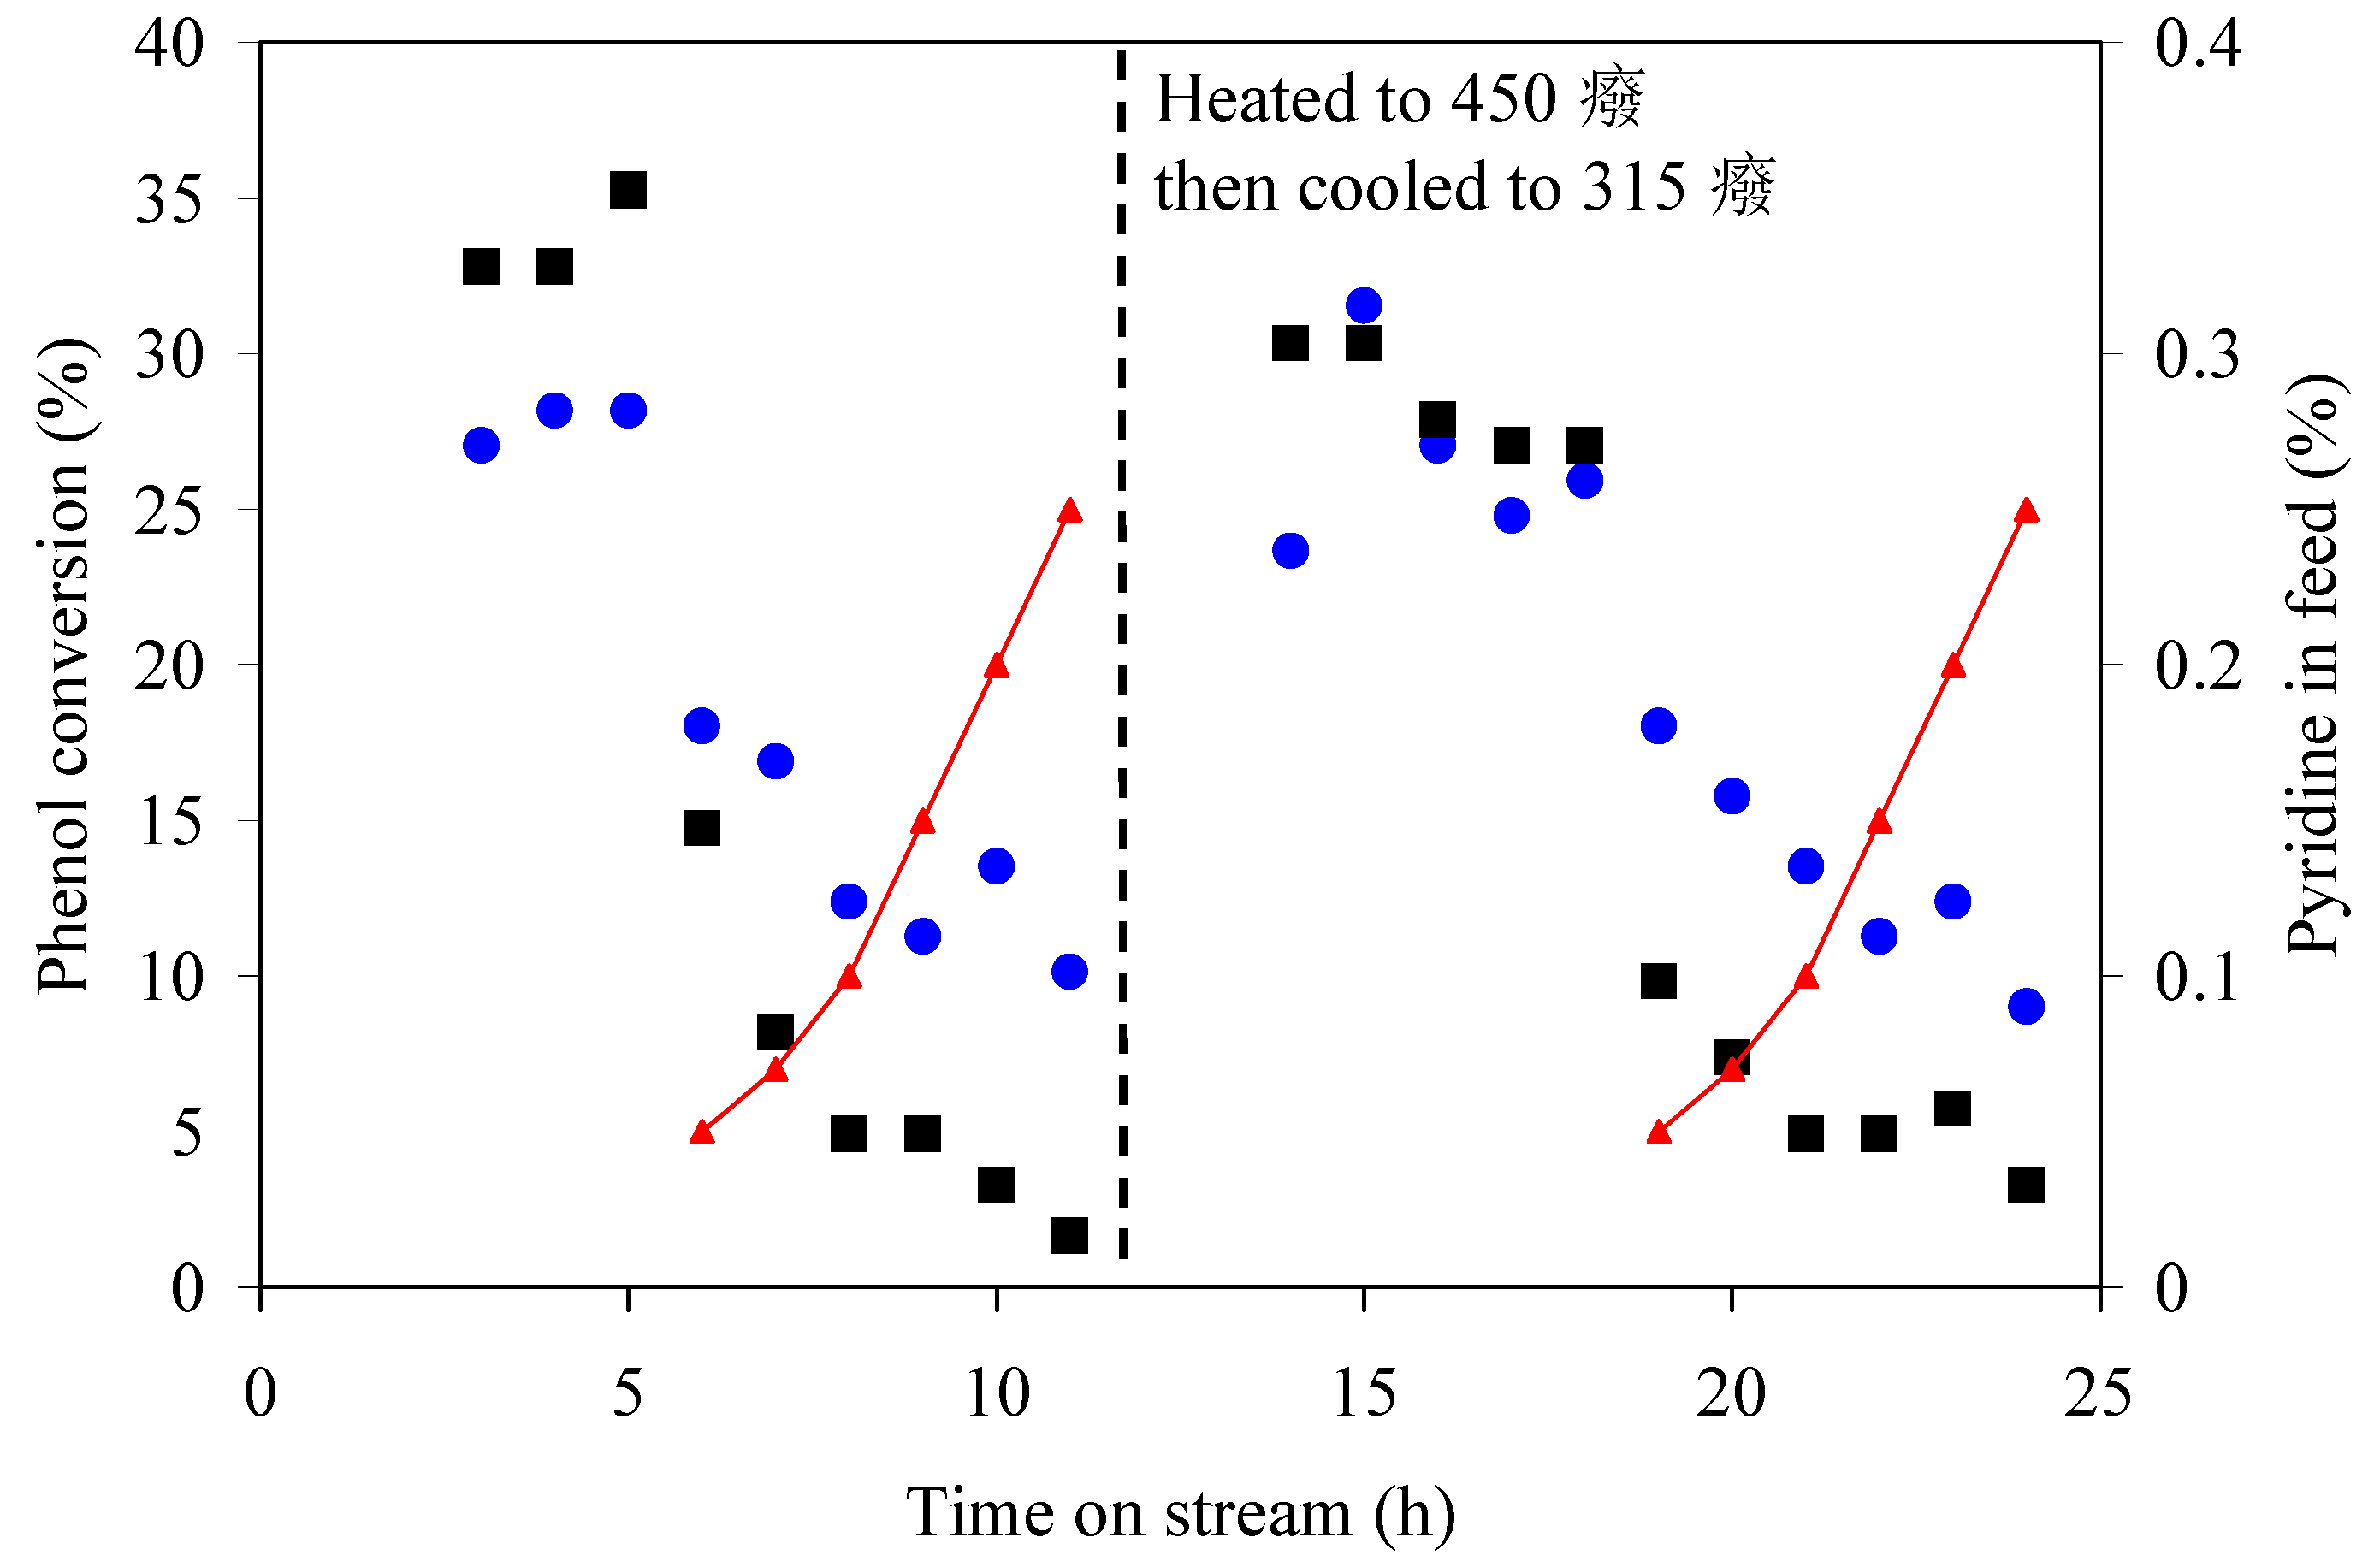
Pyridine inhibited conversion and there is a relationship between pyridine concentration in the feed and the extent of inhibition (Figure 2). At the same time, pyridine was not a catalyst poison and catalyst activity could be recovered by desorbing pyridine at a higher temperature, as one would expect from the TPD results (Table 2).
In a different study, it was found that some previously adsorbed pyridine could be removed from pyridine-treated silica–alumina catalysts by a clean feed at 100–250 °C [41]. Analogous findings were reported for processing coal liquids over hydrotreating catalysts when minerals from coal liquefaction were present in the feed as a second solid phase [42,43], which caused re-partitioning of the nitrogen bases between the catalyst, coal liquid, and minerals in the coal liquid.
Nitrogen-base partitioning between different phases is related mainly to phase equilibrium. In thermodynamic terms, the chemical potential of each nitrogen base must be equal in each phase at equilibrium, which provides a driving force for desorption and re-partitioning of nitrogen bases when another ‘clean’ phase is introduced to the system. Although the partitioning cause by phase equilibrium is affected by acid–base equilibrium, the driving force is different.
When it comes to acid–base equilibrium, which is related to the strength of the interaction of nitrogen bases and acid sites of the catalyst, no simple relationship was found. Some trends were noted (Section 3.2) between the acid site concentration, acid site strength, and Brønsted-to-Lewis acid ratio of the amorphous silica–alumina catalysts (Table 2 and Table 3) and phenol conversion in the absence and presence of pyridine (Table 4). However, there were exceptions, which indicated that the relationship between catalytic activity and inhibition of catalytic activity by pyridine was more complex than a simple single-site acid–base reaction.
To offer an explanation for this, it is worthwhile keeping in mind that an important reaction pathway involved adsorbed phenol and cooperative polarization of the attacking olefin by the catalyst (Section 4.2). Catalytic activity for such a reaction pathway is related to site pairs, analogous to the site pairs in catalysis by alumina [44]. If this explanation is correct, then acid catalyst characterization, as reported in Section 3.1, which did not consider site pairs, is insufficient to relate catalyst properties to catalytic activity.

4.4. Potential for Industrial Application

It was shown that pyridine, as a representative of the nitrogen bases in coal liquids, is not an acid catalyst poison, but that it inhibited acid-catalyzed conversion. The extent of inhibition reported in Table 4 and Figure 2 may seem severe but, considering that the evaluation was performed at high space velocity (WHSV 17–19 h−1), there is scope for increasing phenol conversion in practical applications.
This study employed a comparatively high temperature (315 °C) for phenol alkylation, which was selected to facilitate the thermal desorption of pyridine. The practical upper threshold was not determined. At 330 °C, the onset of dealkylation of alkylphenol was reported in the absence of a catalyst [24], but as the results in Table 8 show, there was a net increase in phenol conversion as the temperature was increased from 315 to 350 °C despite competition from dealkylation. In acid-catalyzed phenol alkylation, both alkylation and dealkylation would be suppressed by pyridine, but with the expectation that dealkylation would be suppressed more due to its dependence on protonation of the aromatic, which requires strong Brønsted acid sites.
It was pointed out that there are several reaction pathways for phenol alkylation and that phenol alkylation was less dependent on protonation of the olefin to form carbocation than the alkylation of aromatic hydrocarbons. The findings about pyridine inhibition of phenol alkylation can therefore not be extended to Friedel–Crafts alkylation of aromatic hydrocarbons with olefins without considering this aspect. It was noted that the phenol alkylation products formed in the presence of pyridine were not exclusively those from a polarized intermediate and at least some of the products were those formed by Brønsted acid-catalyzed alkylation. It is expected that the use of acid catalysts for the alkylation of aromatic hydrocarbons in the presence of nitrogen bases would be less efficient than phenol alkylation but it remains plausible.
Nevertheless, the results presented suggest that the proposed use of acid-catalyzed alkylation in conjunction with coal tar naphtha, as suggested in the Introduction, may be viable. It is a speculative claim because the scope of this study did not extend to coal tar naphtha. At the same time, it can be mentioned that hydrotreated coal tar naphtha with a low pyridine content could be successfully alkylated [45].
In terms of industrial applications, the primary benefits of olefin–aromatic and olefin–phenolic alkylation in feed materials containing nitrogen bases are in instances where the olefin content must be decreased without producing paraffins. This can be in a coal tar refinery context, where alkylation before hydrotreating would result in better octane number retention of the naphtha product. It can also be applied to other materials, such as cracked petroleum naphtha, to help reduce octane number loss resulting from hydrotreating.

5. Conclusions

(a)
Phenol is sufficiently acidic to self-catalyze alkylation with 1-hexene in the absence of a catalyst. At comparable conditions, acid-catalyzed conversion is about 4–9 times that of the self-catalyzed reaction.
(b)
Self-catalyzed phenol alkylation with 1-hexene had high ortho-alkylation selectivity. A plausible explanation was presented that involved the formation of a transition state where the olefin has a carbocation character, but that did not involve protonation of the olefin to form carbocation.
(c)
Pyridine inhibited the self-catalyzed alkylation of phenol with 1-hexene. The extent of the inhibition decreased with an increase in the temperature. The addition of 0.05 wt% pyridine caused an 80% inhibition at 220 °C, and this diminished to 40% at 350 °C. Directionally, the decrease in inhibition was consistent with the influence of temperature on the acid–base equilibrium.
(d)
Acid-catalyzed phenol alkylation of equimolar phenol and 1-hexene had low selectivity to olefin oligomerization. Phenol alkylation resulted mainly in the formation of alkyl phenyl ethers, alkyl phenol isomers, and multi-alkylated phenol.
(e)
Pyridine inhibited the acid-catalyzed alkylation of phenol and caused a change in selectivity to favor ortho-alkylation. The inhibitory effect of pyridine could be reversed by catalyst rejuvenation at an elevated temperature with pyridine-free feed. The extent of inhibition depended on the catalyst; the best-performing catalyst was Siral 30 (30% silica, 70% alumina), and 0.05 wt% pyridine caused around 35% inhibition of phenol conversion at 315 °C.
(f)
The experimental results could be explained as phenol alkylation taking place through two pathways in parallel. One pathway involves the protonation of the olefin by the catalyst, followed by a nucleophilic attack by phenol from the bulk fluid (typical Friedel–Crafts olefin–aromatic alkylation). The other pathway involves the adsorption of phenol on the acid catalyst, with polarization of the olefin, which is responsible for the nucleophilic attack.

Author Contributions

Conceptualization, A.d.K.; Methodology, Y.X. and A.d.K.; Validation, Y.X.; Formal Analysis, A.d.K.; Investigation, Y.X.; Resources, A.d.K.; Data Curation, A.d.K.; Writing—Original Draft, A.d.K.; Writing—Review and Editing, A.d.K.; Visualization, A.d.K.; Supervision, A.d.K.; Project Administration, A.d.K.; Funding Acquisition, A.d.K. All authors have read and agreed to the published version of the manuscript.

Funding

This research received funding from the Canadian Centre for Clean Coal/Carbon and Mineral Processing Technology.

Data Availability Statement

The original contributions presented in this study are included in this article. Further inquiries can be directed to the corresponding author.

Conflicts of Interest

The authors declare that they have no conflicts of interest.

References

  1. Loison, R.; Foch, P.; Boyer, A. Coke. Quality and Production, 2nd ed.; Butterworths: London, UK, 1989. [Google Scholar]
  2. Diez, M.A.; Garcia, R. Coal tar: A by-product in cokemaking and an essential raw material in carbochemistry. In New Trends in Coal Conversion. Combustion, Gasification, Emissions, and Coking; Suárez-Ruiz, I., Diez, M.A., Rubiera, F., Eds.; Woodhead Publishing: Duxford, UK, 2019; pp. 439–487. [Google Scholar]
  3. Granda, M.; Blanco, C.; Alvarez, P.; Patrick, J.W.; Menéndez, R. Chemicals from coal coking. Chem. Rev. 2014, 114, 1608–1636. [Google Scholar] [CrossRef] [PubMed]
  4. Higman, C.; Van der Burgt, M. Gasification, 2nd ed.; Elsevier: Amsterdam, The Netherland, 2008. [Google Scholar]
  5. De Klerk, A. Fischer–Tropsch Refining; Wiley-VCH: Weinheim, Germany, 2011. [Google Scholar]
  6. Whitehurst, D.D.; Mitchell, T.O.; Farcasiu, M. Coal Liquefaction. The Chemistry and Technology of Thermal Processes; Academic Press: New York, NY, USA, 1980. [Google Scholar]
  7. Mochida, I.; Okuma, O.; Yoon, S.-H. Chemicals from direct coal liquefaction. Chem. Rev. 2014, 114, 1637–1672. [Google Scholar] [CrossRef] [PubMed]
  8. Falbe, J. Chemical Feedstocks from Coal; Falbe, J., Ed.; Wiley-Interscience: New York, NY, USA, 1982. [Google Scholar]
  9. Mortier, J. Industrial Arene Chemistry. Markets, Technologies, Sustainable Processes and Case Studies of Aromatic Commodities (4 Volumes); Mortier, J., Ed.; Wiley-VCH: Weinheim, Germany, 2023. [Google Scholar]
  10. Girgis, M.J.; Gates, B.C. Reactivities, reaction networks, and kinetics in high-pressure catalytic hydroprocessing. Ind. Eng. Chem. Res. 1991, 30, 2021–2058. [Google Scholar] [CrossRef]
  11. Leckel, D.O. Catalytic hydroprocessing of coal-derived gasification residues to fuel blending stocks: Effect of reaction variable and catalyst on hydrodeoxygenation (HDO), hydrodenitrogenation (HDN), and hydrodesulfurization (HDS). Energy Fuels 2006, 20, 1761–1766. [Google Scholar] [CrossRef]
  12. Ni, H.; Xu, C.; Wang, R.; Guo, X.; Long, Y.; Ma, C.; Yan, L.; Liu, X.; Shi, Q. Composition and transformation of sulfur-, oxygen-, and nitrogen-containing compounds in the hydrotreating process of a low-temperature coal tar. Energy Fuels 2018, 32, 3077–3084. [Google Scholar] [CrossRef]
  13. ASTM International. Physical Constants of Hydrocarbon and Non-Hydrocarbon Compounds, 2nd ed.; (ASTM Data Series DS 4B); ASTM International: Philadelphia, PA, USA, 1991. [Google Scholar]
  14. Clough, H. Gasoline production from coal tar oils. Ind. Eng. Chem. 1957, 49, 673–678. [Google Scholar] [CrossRef]
  15. Nixon, A.C. Autoxidation and antioxidants of petroleum. In Autoxidation and Antioxidants. Vol. II; Lundberg, W.O., Ed.; Interscience: New York, NY, USA, 1962; pp. 695–856. [Google Scholar]
  16. Scott, G. Antioxidants: Chain breaking mechanisms. In Atmospheric Oxidation and Antioxidants. Vol. 1; Scott, G., Ed.; Elsevier: Amsterdam, The Netherland, 1993; pp. 121–160. [Google Scholar]
  17. Singerman, G.M. Gasoline extenders/octane improvers from coal liquids. Energy Progress 1982, 2, 100–106. [Google Scholar]
  18. Badia, J.H.; Ramírez, E.; Bringué, R.; Cunill, F.; Delgado, J. New octane booster molecules for modern gasoline composition. Energy Fuels 2021, 35, 10949–10997. [Google Scholar] [CrossRef]
  19. Trombley, G.; Toulson, E. Ignition delay time of a toluene reference fuel with substituted phenol additives. SAE Tech. Paper 2023. [Google Scholar] [CrossRef]
  20. Daniell, W.; Schubert, U.; Glöckler, R.; Meyer, A.; Noweck, K.; Knözinger, H. Enhanced surface acidity in mixed alumina-silicas: A low-temperature FTIR study. Appl. Catal. A 2000, 196, 247–260. [Google Scholar] [CrossRef]
  21. Hair, M.L. Infrared Spectroscopy in Surface Chemistry; Marcel Dekker: New York, NY, USA, 1967. [Google Scholar]
  22. Platon, A.; Thomson, W.J. Quantitative Lewis/Brønsted ratios using DRIFTS. Ind. Eng. Chem. Res. 2003, 42, 5988–5992. [Google Scholar] [CrossRef]
  23. McLafferty, F.W.; Tureček, F. Interpretation of Mass Spectra, 4th ed.; University Science Books: Mill Valley, CA, USA, 1993. [Google Scholar]
  24. Goldsmith, E.A.; Schlatter, M.J.; Toland, W.G. Uncatalyzed thermal ortho-alkylation of phenols. J. Org. Chem. 1958, 23, 1871–1876. [Google Scholar] [CrossRef]
  25. West, R. Hydrogen bonding of phenols to olefins. J. Am. Chem. Soc. 1959, 81, 1614–1617. [Google Scholar] [CrossRef]
  26. Hart, H.; Simons, J.H. The kinetics and mechanism of the uncatalyzed alkylation of phenol. J. Am. Chem. Soc. 1949, 71, 345–352. [Google Scholar] [CrossRef]
  27. Hart, H.; Cassis, F.A.; Bordeaux, J.J. Inhibition of phenol alkylations by ethers. Kinetic evidence for phenol-ether complexes. J. Am. Chem. Soc. 1954, 76, 1639–1641. [Google Scholar] [CrossRef]
  28. Wakisaka, A.; Yamamoto, Y.; Akiyama, Y.; Takeo, H.; Mizukami, F.; Sakaguchi, K. Solvation-controlled clustering of a phenol-pyridine acid-base pair. J. Chem. Soc. Faraday Trans. 1996, 92, 3339–3346. [Google Scholar] [CrossRef]
  29. Corma, A.; Martínez-Soria, V.; Schnoeveld, E. Alkylation of benzene with short-chain olefins over MCM-22 zeolite: Catalytic behaviour and kinetic mechanism. J. Catal. 2000, 192, 163–173. [Google Scholar] [CrossRef]
  30. Potolovskii, L.A.; Kukui, N.M.; Lipshtein, A.R.; Kotova, G.G.; Vasil’eva, V.N. Alkylation of phenol with oct-1-ene with an aluminosilicate catalyst. Petrol. Chem. USSR 1972, 12, 87–90. [Google Scholar] [CrossRef]
  31. Chakrabarti, A.; Sharma, M.M. Alkylation of phenol with cyclohexene catalysed by cationic ion-exchange resins and acid-treated clay: O- versus C-alkylation. React. Polym. 1992, 17, 331–340. [Google Scholar] [CrossRef]
  32. Wang, B.; Lee, C.W.; Cai, T.-X.; Park, S.-E. Identification and influence of acidity on alkylation of phenol with propylene over ZSM-5. Catal. Lett. 2001, 76, 219–224. [Google Scholar] [CrossRef]
  33. Wagholikar, S.; Mayadevi, S.; Sivasankan, S. Liquid phase alkylation of phenol with 1-octene over large pore zeolites. Appl. Catal. A 2006, 309, 106–114. [Google Scholar] [CrossRef]
  34. De Klerk, A.; Nel, R.J.J. Phenol alkylation with 1-octene on solid acid catalysts. Ind. Eng. Chem. Res. 2007, 46, 7066–7072. [Google Scholar] [CrossRef]
  35. Freire, M.A.; Mendes, D.T.S.L.; Freitas, L.S.; Beerthuis, R.; Amarante, S.F.; Ramos, A.L.D. Acid-catalyzed liquid-phase alkylation of phenol with branched and linear olefin isomers. Catal. Today 2017, 289, 192–203. [Google Scholar] [CrossRef]
  36. Yadav, G.D.; Thorat, T.S. Kinetics of alkylation of p-cresol with isobutylene catalysed by sulfated zirconia. Ind. Eng. Chem. Res. 1996, 35, 721–731. [Google Scholar] [CrossRef]
  37. Wilson, K.; Adams, D.J.; Rothenberg, G.; Clark, J.H. Comparative study of phenol alkylation mechanism using homogeneous and silica-supported boron trifluoride catalysts. J. Mol. Catal. A 2000, 159, 309–314. [Google Scholar] [CrossRef]
  38. Ma, Q.; Chakraborty, D.; Faglioni, F.; Muller, R.P.; Goddard, W.A.; Harris, T.; Campbell, C.; Tang, Y. Alkylation of Phenol: A mechanistic view. J. Phys. Chem. A 2006, 110, 2246–2252. [Google Scholar] [CrossRef]
  39. Zhao, Z.; Shi, H.; Wan, C.; Hu, M.Y.; Liu, Y.; Mei, D.; Camaioni, D.M.; Hu, J.Z.; Lercher, J.A. Mechanism of phenol alkylation in zeolite H-BEA using in situ solid-state NMR spectroscopy. J. Am. Chem. Soc. 2017, 136, 9178–9185. [Google Scholar] [CrossRef]
  40. Golubchenko, I.T.; Galich, P.N.; Khranovskaya, V.I.; Motornyi, V.G. Alkylation of phenol by n-decene-1 on deprotonized aluminosilicates. Petrol. Chem. USSR 1988, 28, 192–196. [Google Scholar] [CrossRef]
  41. Uzcátegui Barrios, G. Cracked Naphtha Reactivity and Its Influence on Acid Catalyst Deactivation. Ph.D. Thesis, University of Alberta, Edmonton, AB, Canada, 2022. [Google Scholar]
  42. Adkins, B.D.; Milburn, D.R.; Goodman, J.P.; Davis, B.H. Mechanism for coking of coal liquefaction catalysts involving basic nitrogen compounds, sodium and catalyst acid sites. Appl. Catal. 1988, 44, 199–222. [Google Scholar] [CrossRef]
  43. De Klerk, A. Lifetime contributions by Burtron H. Davis: Denitrogenation catalysis. Appl. Catal. A 2020, 599, 117546. [Google Scholar] [CrossRef]
  44. Peri, J.B. A model for the surface of γ-alumina. J. Phys. Chem. 1965, 69, 220–230. [Google Scholar] [CrossRef]
  45. Sakuneka, T.M.; Nel, R.J.J.; De Klerk, A. Benzene reduction by alkylation in a solid phosphoric acid catalyzed olefin oligomerization process. Ind. Eng. Chem. Res. 2008, 47, 7178–7183. [Google Scholar] [CrossRef]
Figure 1. Electron impact fragmentation of phenolic species used for identification.
Processes 13 00194 g001
Figure 2. Conversion of an equimolar phenol and 1-hexene mixture in a flow reactor over amorphous silica–alumina catalysts (Siral 30 ●, Siral 40 ■) at 315 °C, near atmospheric pressure, and WHSV of 17 h−1. Pyridine (▲) was added to the feed at concentrations in the range of 0.05–0.25%, as indicated.
Processes 13 00194 g002
Figure 3. Self-catalyzed phenol–olefin alkylation.
Processes 13 00194 g003
Table 1. Pore volume, surface area, and chemical composition of silica–alumina materials after calcination in air at 550 °C for 6 h.
CatalystComposition (wt%) aPore Volume (cm3∙g−1) bSurface Area (m2∙g−1)
SiO2Al2O3Hg PorosimetryBET c
Siral 53.596.41.21207323
Siral 108.191.90.99199391
Siral 2015.884.21.13204430
Siral 3023.276.71.40200483
Siral 4031.968.11.42264514
a Elemental composition by X-ray fluorescence spectrometry, only semi-quantitative. b Intrusion volume measured by Hg porosimetry. c Uncalcined material, Brunauer–Emmett–Teller (BET) surface area from catalyst supplier.
Table 2. Acid site concentration and acid strength of silica–alumina materials as determined by ammonia temperature-programmed desorption.
CatalystAcid Site Concentration (µmol∙g−1)Max. Desorption Temperature (°C)
TotalPeak 1Peak 2Peak 3Peak 1Peak 2Peak 3
Siral 581839432698203346455
Siral 1093849335392203354466
Siral 20808453246109199350448
Siral 301127452489186200333461
Siral 30 a1148493470185222388489
Siral 40820480170170201348413
a Pyridine temperature-programmed desorption.
Table 3. Lewis-to-Brønsted acid molar ratio of pyridine-treated silica–alumina materials determined by infrared spectrometry at different measurement temperatures.
CatalystLewis-to-Brønsted Acid Molar RatioBrønsted Acid Concentration (µmol∙g−1) a
25 °C300 °C400 °C
Siral 58.15.94.490
Siral 1014.611.63.360
Siral 204.95.32.6137
Siral 303.12.73.3275
Siral 403.82.22.4171
a Brønsted acid concentration calculated from NH3-TPD; no molar extinction coefficient applied.
Table 4. Batch reactor phenol alkylation with 1-hexene over amorphous silica–alumina catalysts at 315 °C and autogenous pressure for 1 h.
CatalystPhenol Conversion (wt%)
Clean Catalyst, Clean Feed aPyridine on Catalyst, Clean Feed aPyridine on Catalyst and in Feed a,b
Siral 5131110
Siral 1017119
Siral 20311010
Siral 30241612
Siral 402653
a Equimolar mixture of phenol and 1-hexene. b 0.05 wt% pyridine.
Table 5. Selectivity of phenolic products in batch reactor phenol alkylation with 1-hexene over amorphous silica–alumina catalysts at 315 °C and autogenous pressure for 1 h.
CatalystSelectivity to Phenolic Products (wt%)
Phenyl Etherso-Hexyl Phenolsm/p-Hexyl PhenolsMulti-Alkylated
Siral 5375913
Siral 10575713
Siral 204453218
Siral 304452625
Siral 40649422
Table 6. Selectivity of phenolic products in batch reactor phenol alkylation with 1-hexene over pyridine-treated amorphous silica–alumina catalysts at 315 °C and autogenous pressure for 1 h.
CatalystSelectivity to Phenolic Products (wt%)
Phenyl Etherso-Hexyl Phenolsm/p-Hexyl PhenolsMulti-Alkylated
Siral 558546
Siral 1048366
Siral 203711413
Siral 3067988
Siral 40480107
Table 7. Selectivity of phenolic products in batch reactor phenol alkylation with 1-hexene and 0.05 wt% pyridine over pyridine-treated amorphous silica–alumina catalysts at 315 °C and autogenous pressure for 1 h.
CatalystSelectivity to Phenolic Products (wt%)
Phenyl Etherso-Hexyl Phenolsm/p-Hexyl PhenolsMulti-Alkylated
Siral 588147
Siral 10108064
Siral 2047989
Siral 3058086
Siral 4058293
Table 8. Batch reactor uncatalyzed phenol alkylation with 1-hexene at the indicated temperatures and autogenous pressure for 1 h.
Temperature (°C)Phenol Conversion (wt%)Relative Decrease (%)
Clean Feed aPyridine in Feed a,b
2200.50.0885
2501.30.378
3153.41.750
3506.53.743
a Equimolar mixture of phenol and 1-hexene. b 0.05 wt% pyridine.
Table 9. Selectivity of phenolic products in batch reactor phenol alkylation with 1-hexene without the presence of a catalyst at 315 °C and autogenous pressure for 1 h.
DescriptionSelectivity to Phenolic Products (wt%)
Phenyl Etherso-Hexyl Phenolsm/p-Hexyl PhenolsMulti-Alkylated
no pyridine48682
with pyridine118513
Disclaimer/Publisher’s Note: The statements, opinions and data contained in all publications are solely those of the individual author(s) and contributor(s) and not of MDPI and/or the editor(s). MDPI and/or the editor(s) disclaim responsibility for any injury to people or property resulting from any ideas, methods, instructions or products referred to in the content.

