Article

Growth and Characterization of Myristic Acid Crystals Doped with Co and Cu and Microbiological Assays for Potential Antimicrobial Applications

by
Luiz A. Cohen Vieira
1,2,
João G. de Oliveira Neto
3,
Marinaldo V. de Souza Junior
3,
Adenilson O. dos Santos
3,
Telma F. Vieira Batista
4,
Sanclayton G. Carneiro Moreira
1,
Francisco F. de Sousa
1,* and
Waldomiro Paschoal, Jr.
1,5
1
Institute of Exact and Natural Sciences, Federal University of Para—UFPA, Belém 66075-110, Pará, Brazil
2
Federal Institute of Amapá—IFAP, Porto Grande 68997-000, Amapá, Brazil
3
Center for Social Sciences, Health, and Technology, Federal University of Maranhão—UFMA, Imperatriz 65900-410, Maranhão, Brazil
4
Federal Rural University of the Amazon—UFRA, Belém 66077-830, Pará, Brazil
5
Graduante Program in Mechanical Engineering (PPGEM), Federal University of Pará—UFPA, Belém 66075-110, Pará, Brazil
*
Author to whom correspondence should be addressed.
Processes 2025, 13(11), 3481; https://doi.org/10.3390/pr13113481
Submission received: 20 August 2025 / Revised: 22 October 2025 / Accepted: 23 October 2025 / Published: 29 October 2025

Abstract

In this study, pure myristic acid (MA) polycrystals and those doped with Co and Cu were synthesized and characterized to evaluate their structural features, thermal properties, and antimicrobial effects against the bacterium Xanthomonas citri. Scanning electron microscopy revealed that doping with Co and Cu altered the crystal surfaces. Specifically, pure MA polycrystals exhibited rougher and more porous surfaces, whereas Co and Cu doped MA polycrystals displayed more compact and less porous morphologies. Energy-dispersive X-ray spectroscopy confirmed the presence of Co and Cu in the samples. X-ray diffraction indicated that all samples crystallized in the same monoclinic structure; however, Co and Cu doping led to a slight decrease in unit cell volume and average crystallite size. Raman spectroscopy revealed changes in the vibrational bands of the crystalline lattice. Thermal analyses demonstrated that the addition of Co and Cu ions influenced the thermal stability of pure MA. In microbiological assays, all samples exhibited antimicrobial activity against X. citri. In particular, Co-doped MA polycrystals showed bactericidal properties at all tested concentrations, while pure MA polycrystals exhibited bacteriostatic action at lower concentrations (≤15.6 µg/mL) and bactericidal action at higher concentrations. Cu-doped MA polycrystals did not inhibit bacterial growth at lower concentrations (7.8 µg/mL) but were bactericidal at higher concentrations. These results demonstrated increased lethality against X. citri, particularly for Co-doped MA polycrystals, which exhibited the lowest LD50 value (the toxicological dose required to inhibit 50% of the tested population). Overall, these findings indicate that metal-doped MA polycrystals may be effective for future antimicrobial applications.

1. Introduction

Myristic acid (AM, C14:0) is a long-chain saturated fatty acid with well-known applications in the pharmaceutical, cosmetic, and biomedical industries, alongside relevance in energy storage and functional coatings [1,2,3,4,5,6]. In particular, derivatives of MA exhibit antifungal and bactericidal activity, primarily through the inhibition of essential enzymes and disruption of bacterial membranes [7,8,9]. Recent studies, for instance, have demonstrated that incorporating MA-based coatings into metals can reduce surface bacterial growth by up to 90% [10]. Despite this evidence, however, the potential of MA crystals as a functional solid matrix for antimicrobial applications remains largely unexplored.
One promising approach to enhance the biological activity of organic crystals involves metal ion doping, which modifies their physicochemical characteristics and may improve antimicrobial performance. Transition metal ions are known to interact with bacterial cells through multiple mechanisms, including membrane permeability disruption, protein inactivation, and nucleic acid damage [11,12]. Among these metal ions, Co and Cu ions are of particular interest. Specifically, Cu ions are widely recognized for generating reactive oxygen species, which induce oxidative stress and irreversible cellular damage [13,14]. Meanwhile, Co ions act as catalytic centers in redox reactions, thereby enhancing bactericidal efficiency through enzymatic disruption [15,16]. Furthermore, Co and Cu based nanomaterials exhibit strong antimicrobial effects, with inhibition rates exceeding 90% at micromolar concentrations against both Gram-negative and Gram-positive bacteria [13,15,17]. Collectively, their high surface-to-volume ratio, magnetic properties, and biocompatibility support their selection as dopants for MA crystals in this study.
Xanthomonas citri is the causal agent of citrus canker, a devastating disease that can reduce citrus production by over 30% in severely affected orchards [18]. The growing resistance of X. citri to conventional antibiotics, such as streptomycin, which often fails to control infections in the field [19], underscores the urgent need for alternative antimicrobial strategies. Accordingly, X. citri was selected as the model microorganism for evaluating the antibacterial efficacy of the synthesized MA crystals. Establishing a link between the structural modification of MA crystals and the inhibition of X. citri provides a meaningful contribution at the intersection of materials science and agricultural biotechnology.
Herein, MA polycrystals were synthesized in three formulations and compared: undoped (PMA) and doped with 10% Co (CoMA) or 10% Cu (CuMA). These samples were characterized using high-resolution scanning electron microscopy (SEM), energy-dispersive X-ray spectroscopy (EDS), X-ray diffraction (XRD), Raman spectroscopy, Fourier-transform infrared (FT-IR) spectroscopy, thermogravimetric analysis (TG), and differential thermal analysis (DTA). Microbiological assays against X. citri, a phytopathogenic bacterium of agricultural relevance, were performed to evaluate the antimicrobial potential of the synthesized materials. An analysis of the obtained micrographs, corroborated by EDS results, revealed that metal incorporation notably altered the morphology of the doped crystals. Raman spectroscopy further indicated modifications in the crystal lattice, while XRD revealed a reduction in lattice parameters. In particular, the Co-doped sample exhibited a lower LD50 (the toxicological dose required to inhibit 50% of the tested population) value than the undoped reference.

2. Experimental Procedures

2.1. Crystal Synthesis

CoMA crystals were synthesized using the slow evaporation method [20]. A solution of 0.45 g MA (C14H28O2, 99% purity, supplied by Sigma-Aldrich, St. Louis, MO, USA) and 0.05 g cobalt sulfate heptahydrate (CoSO4·7H2O, supplied by Sigma-Aldrich, St. Louis, MO, USA, pure) was prepared in 25 mL of chloroform and 5 mL of deionized water (pH 5). The reagents fully dissolved after 45 min of stirring at 308 K using a magnetic stirrer. The resulting solution was filtered and maintained at 305 K to facilitate crystal nucleation. Polycrystalline CoMA formed after 10 days. Similarly, CuMA polycrystals were synthesized using copper(II) chloride dihydrate (CuCl2·2H2O, supplied by Sigma-Aldrich, St. Louis, MO, USA, pure). For comparison, pure MA (PMA) polycrystals were synthesized by dissolving 0.50 g MA in 25 mL of chloroform, stirring for 45 min at pH 5 and 308 K, and then allowing slow evaporation at 305 K for 10 days.

2.2. X-Ray Powder Diffraction (XRPD) Analysis

XRPD patterns of the polycrystalline samples were acquired using a PANalytical Empyrean diffractometer (Malvern, England) with Cu Kα radiation (λ = 1.5418 Å), operating at 45 kV and 40 mA. Diffractograms were recorded at room temperature over a 2θ range of 5–40°, with a step size of 0.02° and a counting time of 2 s per step. The patterns were analyzed using Rietveld refinement in GSAS-II software (version 286c6d) [21]. Initial lattice parameters and atomic positions for refinement [4] were sourced from the CIF file (ZZZOEG03 738618) available in the Cambridge Crystallographic Data Center.

2.3. Raman Spectroscopy

Raman spectra were recorded under ambient conditions using a HORIBA Jobin Yvon T6400 triple spectrometer (Palaiseau, France) equipped with a liquid-nitrogen-cooled charge-coupled device detector. A spectral resolution of 2 cm−1 was achieved in triple-grating mode. An argon-ion laser (λ = 532 nm) served as the excitation source. The laser beam was focused onto the samples using an Olympus BX40 microscope fitted with a 20× objective (focal length = 20.5 mm, numerical aperture = 0.35).

2.4. Fourier-Transform Infrared (FT-IR) Spectroscopy

FT-IR spectra were acquired using a Bruker Vertex 70v spectrometer (Karlsruhe, Germany) across the spectral range of 40–3000 cm−1. A platinum attenuated total reflectance module (A225/Q) was employed in conjunction with a wide-range RT-DLa TGS detector (6 mm aperture). Spectra were recorded at a resolution of 4 cm−1 over 220 scans.

2.5. Morphological Characterization

The synthesized polycrystals were morphologically characterized using a high-resolution Tescan Mira field-emission gun SE microscope (Brno, Czech Republic) equipped with a four-lens electron optics column. Micrographs were captured at multiple sample regions using magnifications of 2000×, 5000×, and 10,000×. EDS was conducted using an Oxford X-Max-80 detector (80 mm2 active area; 500,000 cps count rate) at an accelerating voltage of 5 keV and a working distance of 15 mm.

2.6. Thermogravimetric-Differential Thermal Analysis (TG-DTA)

Simultaneous TG–DTA analyses were performed using a Shimadzu DTG-60 analyzer (Kyoto, Japan) at a nitrogen flow rate of 100 mL/min. Measurements were conducted on 4 mg samples over a temperature range of 298–1000 K at a heating rate of 10 K/min. Crystal morphology was assessed using a JEOL JSM-7100F SE microscope with samples mounted on aluminum stubs.

2.7. Microbiological Assay (Minimal Inhibitory Concentration, MIC Test)

The MIC test [19,22] was performed to evaluate the antimicrobial activity of the synthesized materials against X. citri. A liquid culture medium containing 10 g sucrose, 8 g casein hydrolysate, 4 g yeast extract, 2 g K2HPO4, and 0.3 g MgSO4·7H2O (pH 6.9) per liter of distilled water was prepared. The medium was autoclaved at 393.15 K (20 psi) for 20 min. For the solid medium, 4.5 g agar was added per 100 mL before autoclaving, and the mixture was poured into 90 × 15 mm Petri dishes [18].
Bacterial activation was achieved by culturing X. citri on agar plates at 303.15 K for 24 h. A loopful of bacteria was subsequently inoculated into 3 mL of liquid medium and incubated at 303.15 K for another 24 h. The culture was standardized to approximately 1.0 × 10⁸ CFU/mL (colony-forming units).
For serial dilution, 1 mg of each sample—PMA, CoMA, and CuMA—was dissolved in 100 µL of dimethyl sulfoxide in 5 mL microtubes and vortexed. Subsequently, 900 µL of sterilized medium was added to each tube to prepare the stock solution. Streptomycin sulfate (1 mg/mL in distilled water) served as the control antibiotic and was diluted to 5 µL/mL in the medium.
The assay was conducted in 96-well tissue culture test plates, with three replicates per treatment. Each well initially received 100 µL of the medium. Subsequently, 100 µL of the stock solution was added to the wells in the first column (well A). Serial dilutions were performed by transferring 100 µL of the solution from well A to well B, mixing thoroughly, and continuing this process through well G. Finally, from well G, 100 µL solution was discarded. Well H served as the positive control and contained only the medium. Finally, 5 µL of the bacterial suspension was added to each well, and the plates were incubated at 303.15 K for 24 h.
Antimicrobial activity was visualized using 2% 2,3,5-triphenyltetrazolium chloride (TTC). Following the addition of 20 µL of TTC to each well, the plates were incubated for 2 h. Wells lacking bacterial growth remained colorless, whereas those with bacterial growth turned red [19,22].
To differentiate bacteriostatic from bactericidal effects, solutions from wells that did not turn red were reinoculated onto agar plates and incubated at 308.15 K for 24 h. The absence of bacterial growth indicated bactericidal activity, whereas the presence of growth indicated bacteriostatic effects.
Statistical analysis of variance (ANOVA) was conducted using R software version 4.3.3 (2024) and was followed by Duncan’s multiple range test [23,24] for post hoc comparisons. The significance threshold was set at p ≤ 0.05, and data were grouped according to similarity through cluster analysis. Duncan’s test, widely used in laboratory analyses, was performed to determine which treatment means differed significantly after a significant ANOVA result.

3. Results and Discussion

3.1. Crystal Voids

In materials science, doping is widely adopted to tailor a material’s physical and chemical properties through the introduction of foreign atoms or ions into its structure [25]. Analyzing voids within the unit cell of a material is essential for evaluating its doping capacity, as such voids can be utilized to accommodate dopants that modify the base compound’s properties [26,27]. As depicted in Figure 1, the presence of voids in the crystal structure of MA supports detailed investigations of its doping feasibility.
The voids within the MA unit cell, with an area of 706.86 Å2 and a volume of 153.53 Å3, correspond to an experimental porosity of approximately 10%, which is comparable to the porosity reported for a dipeptide by Soldatov et al. [28]. This observation indicates a non-fully dense structure containing regions capable of accommodating additional atoms or molecules. Such voids may result from inefficient molecular packing [26,27]. These regions serve as ideal sites for dopant incorporation, including transition or alkali metals, which can impart distinct functional properties.
The doping potential of MA, identified through the above void analysis of its unit cell using CrystalExplorer [27], offers a promising route for developing materials with enhanced properties. A detailed understanding of these voids enables targeted doping, allowing for the introduction of specific ions to optimize desired material characteristics. Consequently, doping not only broadens the application scope of MA but also underscores the importance of structural analysis in materials engineering.

3.2. SEM and EDS Analyses

High-resolution SEM was employed to characterize the PMA, CoMA, and CuMA samples, revealing distinct structural features across the three compositions. To capture morphological patterns, multiple micrographs were acquired from various regions of each sample at magnifications of 2000×, 5000×, and 10,000×.
Figure 2a–c presents SEM micrographs of the PMA sample at varying magnifications, revealing a rough surface with few pores and a moderate number of well-defined, circular grain aggregates, with an average diameter of approximately 600 nm. Meanwhile, Figure 2d–f presents SEM micrographs of the CoMA sample at varying magnifications. The surface of the CoMA sample appears considerably more compact than that of the PMA sample, with fewer pores and a lower density of grain aggregates.
Figure 2g–i presents those of CuMA. As depicted, the surface of the CuMA sample appears more compact than that of PMA, exhibiting fewer pores and a reduced number of grain aggregates. However, the CuMA sample displays more grain aggregates than the CoMA sample.
Figure 3 presents the EDS spectra of the PMA (a), CoMA (b), and CuMA (c) samples. The spectra confirm the presence of C and O, originating from MA molecules, while Au and Pd arise from sputter coating applied during SEM sample preparation. Additionally, Figure 3b presents the EDS spectrum of the CoMA sample, which reveals the presence of Co introduced during synthesis, along with trace levels of residual S from the CoSO4·7H2O reagent. Figure 3c displays the EDS spectrum of the CuMA sample, revealing the presence of Cu, incorporated during synthesis, and trace levels of residual Cl from the CuCl2·2H2O reagent.

3.3. XRPD Analysis

Figure 4 presents the experimental XRPD patterns of the polycrystalline (a) PMA, (b) CoMA, and (c) CuMA samples. The red line represents the computed pattern obtained through Rietveld refinement at room temperature. Notably, all samples crystallize in a monoclinic structure with the space group P21/c. Each unit cell comprises four molecules. Rietveld refinement yields the following lattice parameters: for PMA, a = 31.701(5) Å, b = 4.957(1) Å, c = 9.470(5) Å, α = γ = 90°, β = 95.347(0)°, and V = 1481.8(4) Å3; for CoMA, a = 31.647(8) Å, b = 4.932(7) Å, c = 9.385(5) Å, α = γ = 90°, β = 94.284(0)°, and V = 1461.1(0) Å3; and for CuMA, a = 31.570(7) Å, b = 4.939(2) Å, c = 9.456(1) Å, α = γ = 90°, β = 95.422(0)°, and V = 1467.9(6) Å3. The lattice parameters for the PMA sample are consistent with those reported in the literature [4]. Unit cell volume reductions of approximately 1.4% and 1.0% are observed for CoMA and CuMA relative to PMA, respectively. The average crystallite size was estimated using the Scherrer equation [29,30], yielding values of 312.14 nm for PMA, 165.55 nm for CoMA, and 307.26 nm for CuMA—each notably smaller than the reference value of 675.14 nm reported in the literature (Table 1).

3.4. Raman and FT-IR Spectroscopy

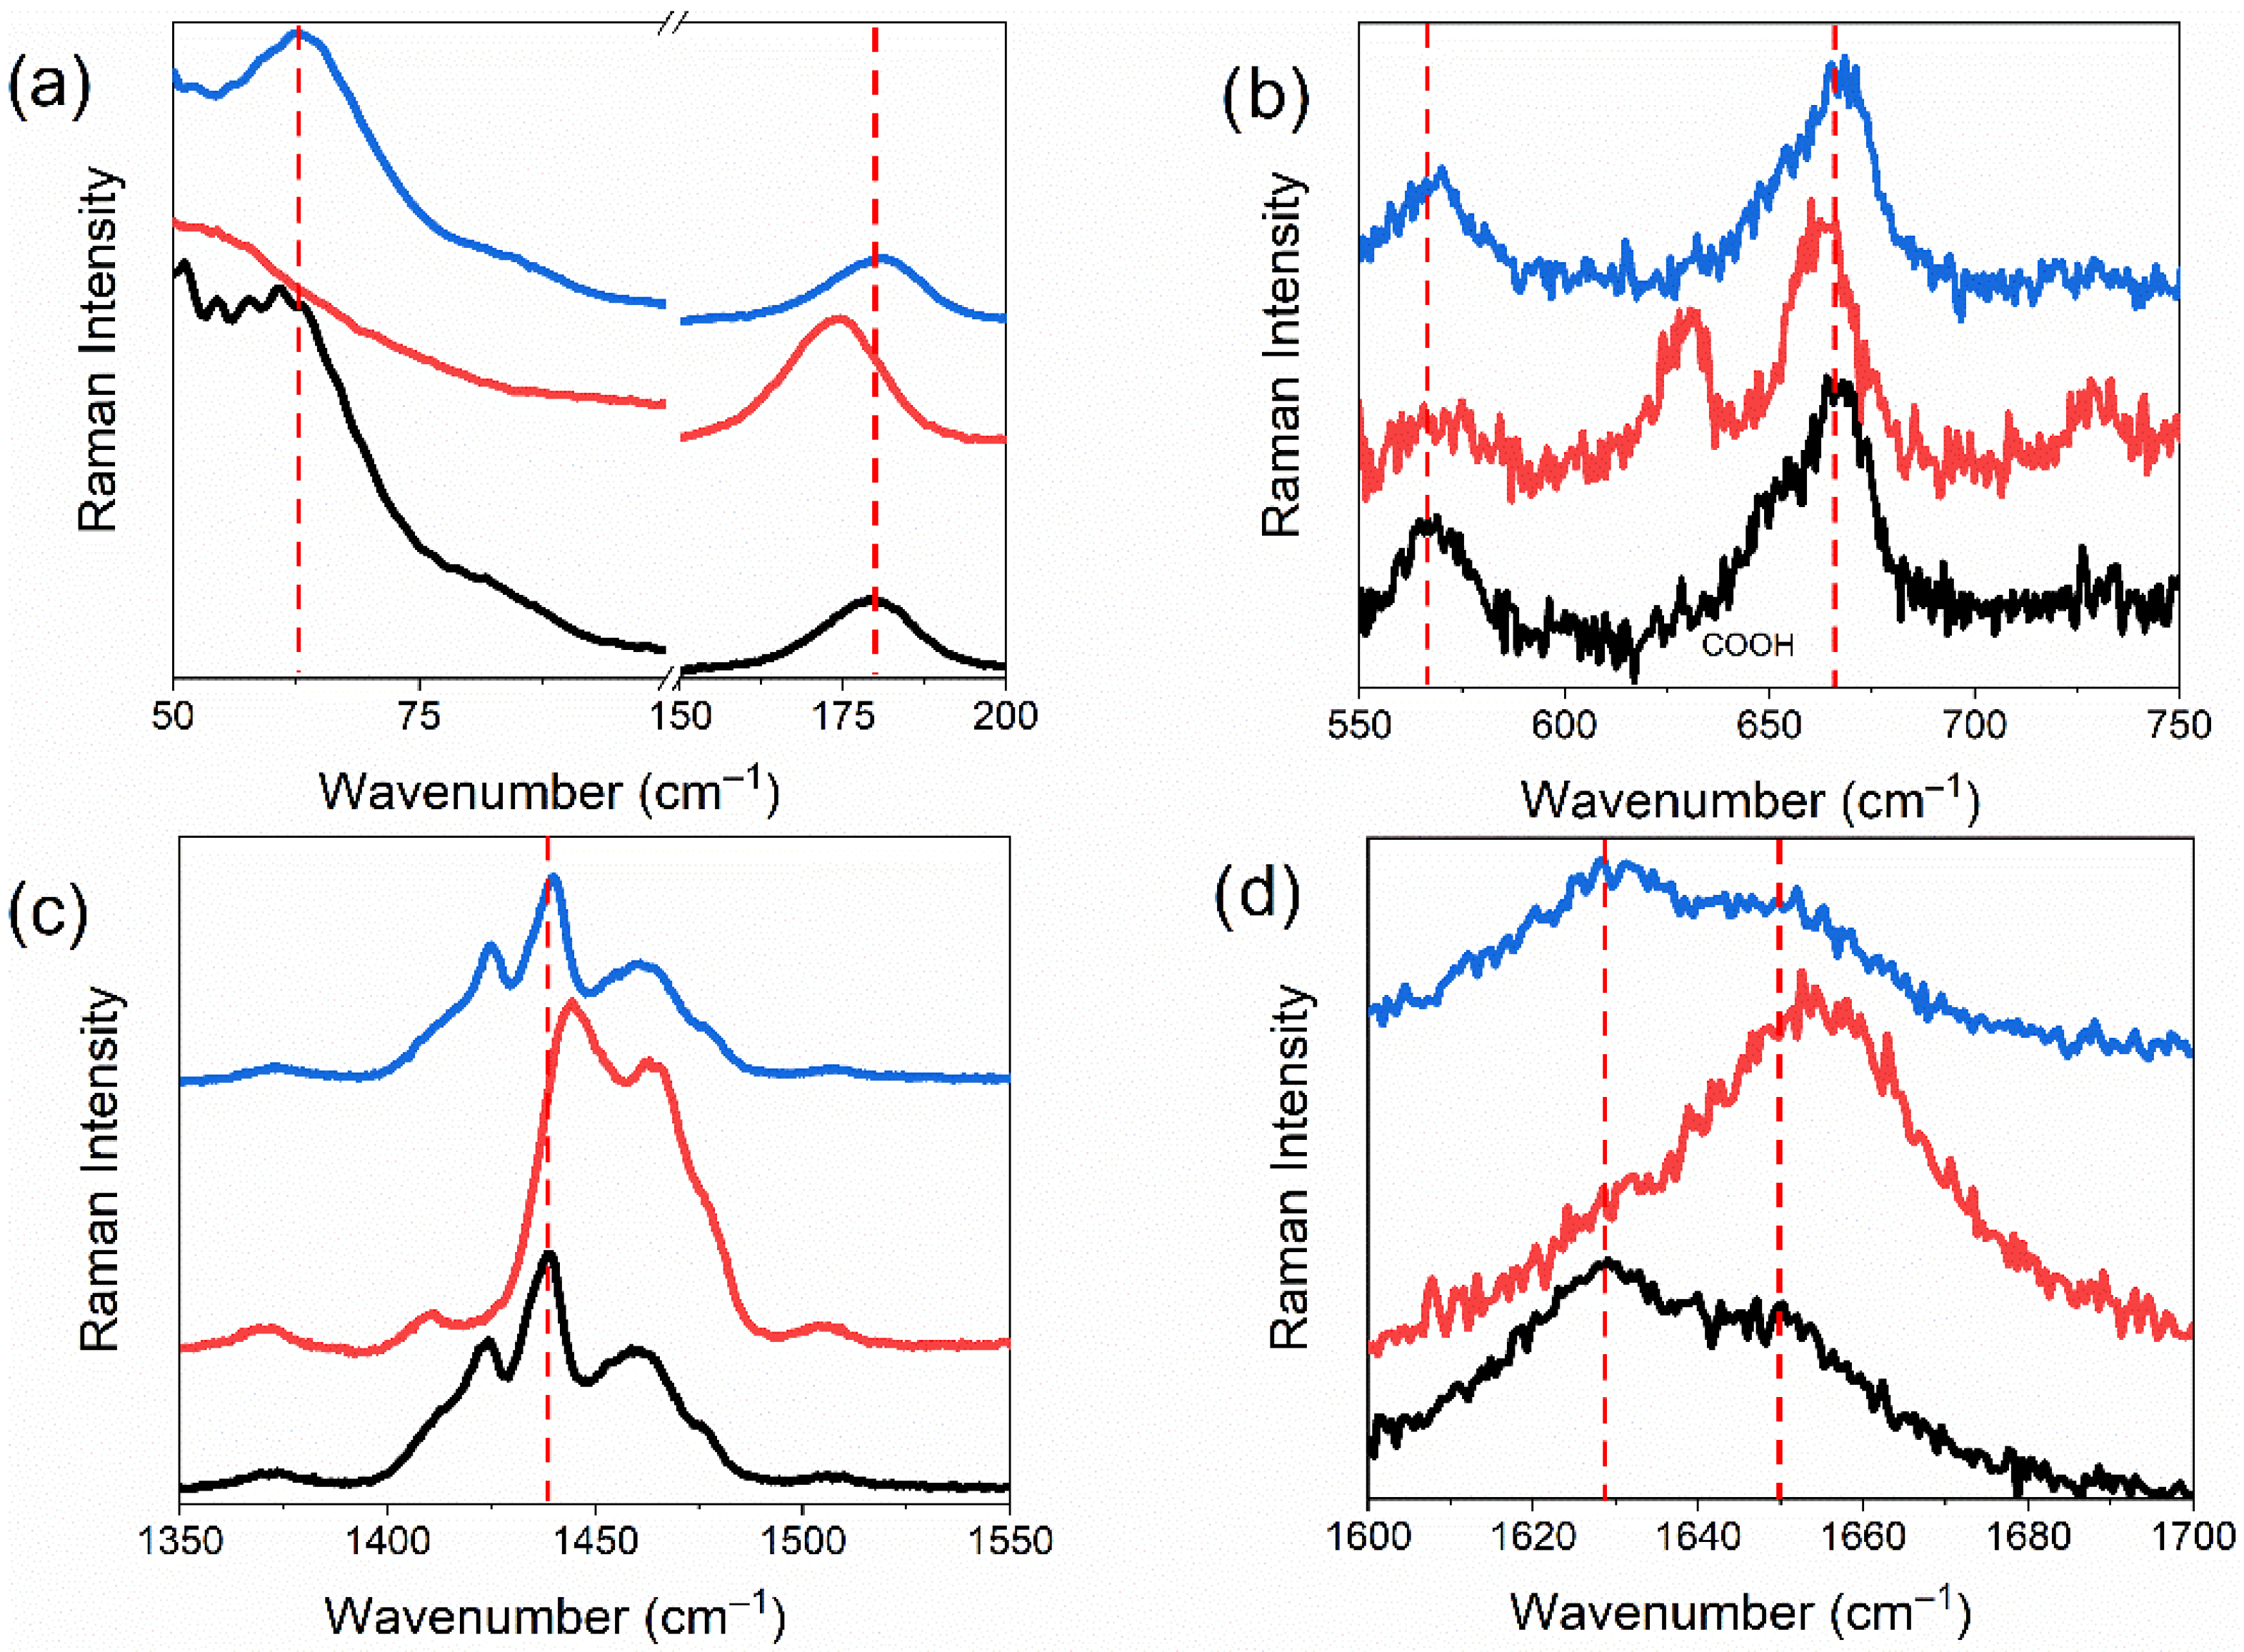
Figure 5 presents the Raman spectra of the PMA, CoMA, and CuMA samples in the spectral range of 50–1800 cm−1. The corresponding vibrational modes are listed in Table 2 [3,31]. Figure 6 highlights selected regions of the Raman spectra for detailed comparison. Specifically, Figure 6a displays the spectral region between 50 and 160 cm−1. The vibrational modes in this region are associated with lattice vibrations caused by the movement of large portions of the crystal lattice [3]. Within this region, distinct spectral changes are observed for the CoMA sample relative to PMA, potentially resulting from the incorporation of Co2+ ions. The CuMA spectrum similarly reflects the incorporation of Cu2+ ions into the crystal structure. The bands at 161 and 167 cm−1 are associated with carbon chain torsion (CCCC), whereas those at 181 and 187 cm−1 correspond to chain bending (CCC). In the CoMA spectrum, these bands exhibit notable shifts, reflecting the structural influence of the incorporated Co2+ ions. These spectral shifts arise from the interstitial incorporation of Co2+ and Cu2+ ions, which exert stress on the unit cell and alter hydrogen bonding interactions.
Figure 6b presents the spectral region of 550–750 cm−1. In this region, the bands at 571 and 584 cm−1 are assigned to CCC bending, the band at approximately 654 cm−1 corresponds to scissoring vibrations of the carboxyl group, the band at 671 cm−1 is attributed to chain torsion, and the band at 742 cm−1 is associated with CH2 rocking deformation, as reported in the literature [3].
Figure 6c presents the spectral range of 1350–1550 cm−1, where vibrations associated with CH2 group motion are observed. The bands at 1372, 1381, 1411, 1437, 1450, 1462, 1475, and 1507 cm−1 correspond to CH2 scissoring vibrations [3]. A shift in the bands of the CoMA polycrystal is again evident, suggesting an indirect influence of the Co2+ ion on the CH2 group.
Figure 6d presents the spectral range of 1600–1700 cm−1. The bands observed at approximately 1626 and 1649 cm−1 are attributed to carbonyl (C=O) stretching [3]. In this range, noticeable shifts in the vibrational bands of the CoMA sample indicate a pronounced change in stretching, driven by the influence of the metal ion.
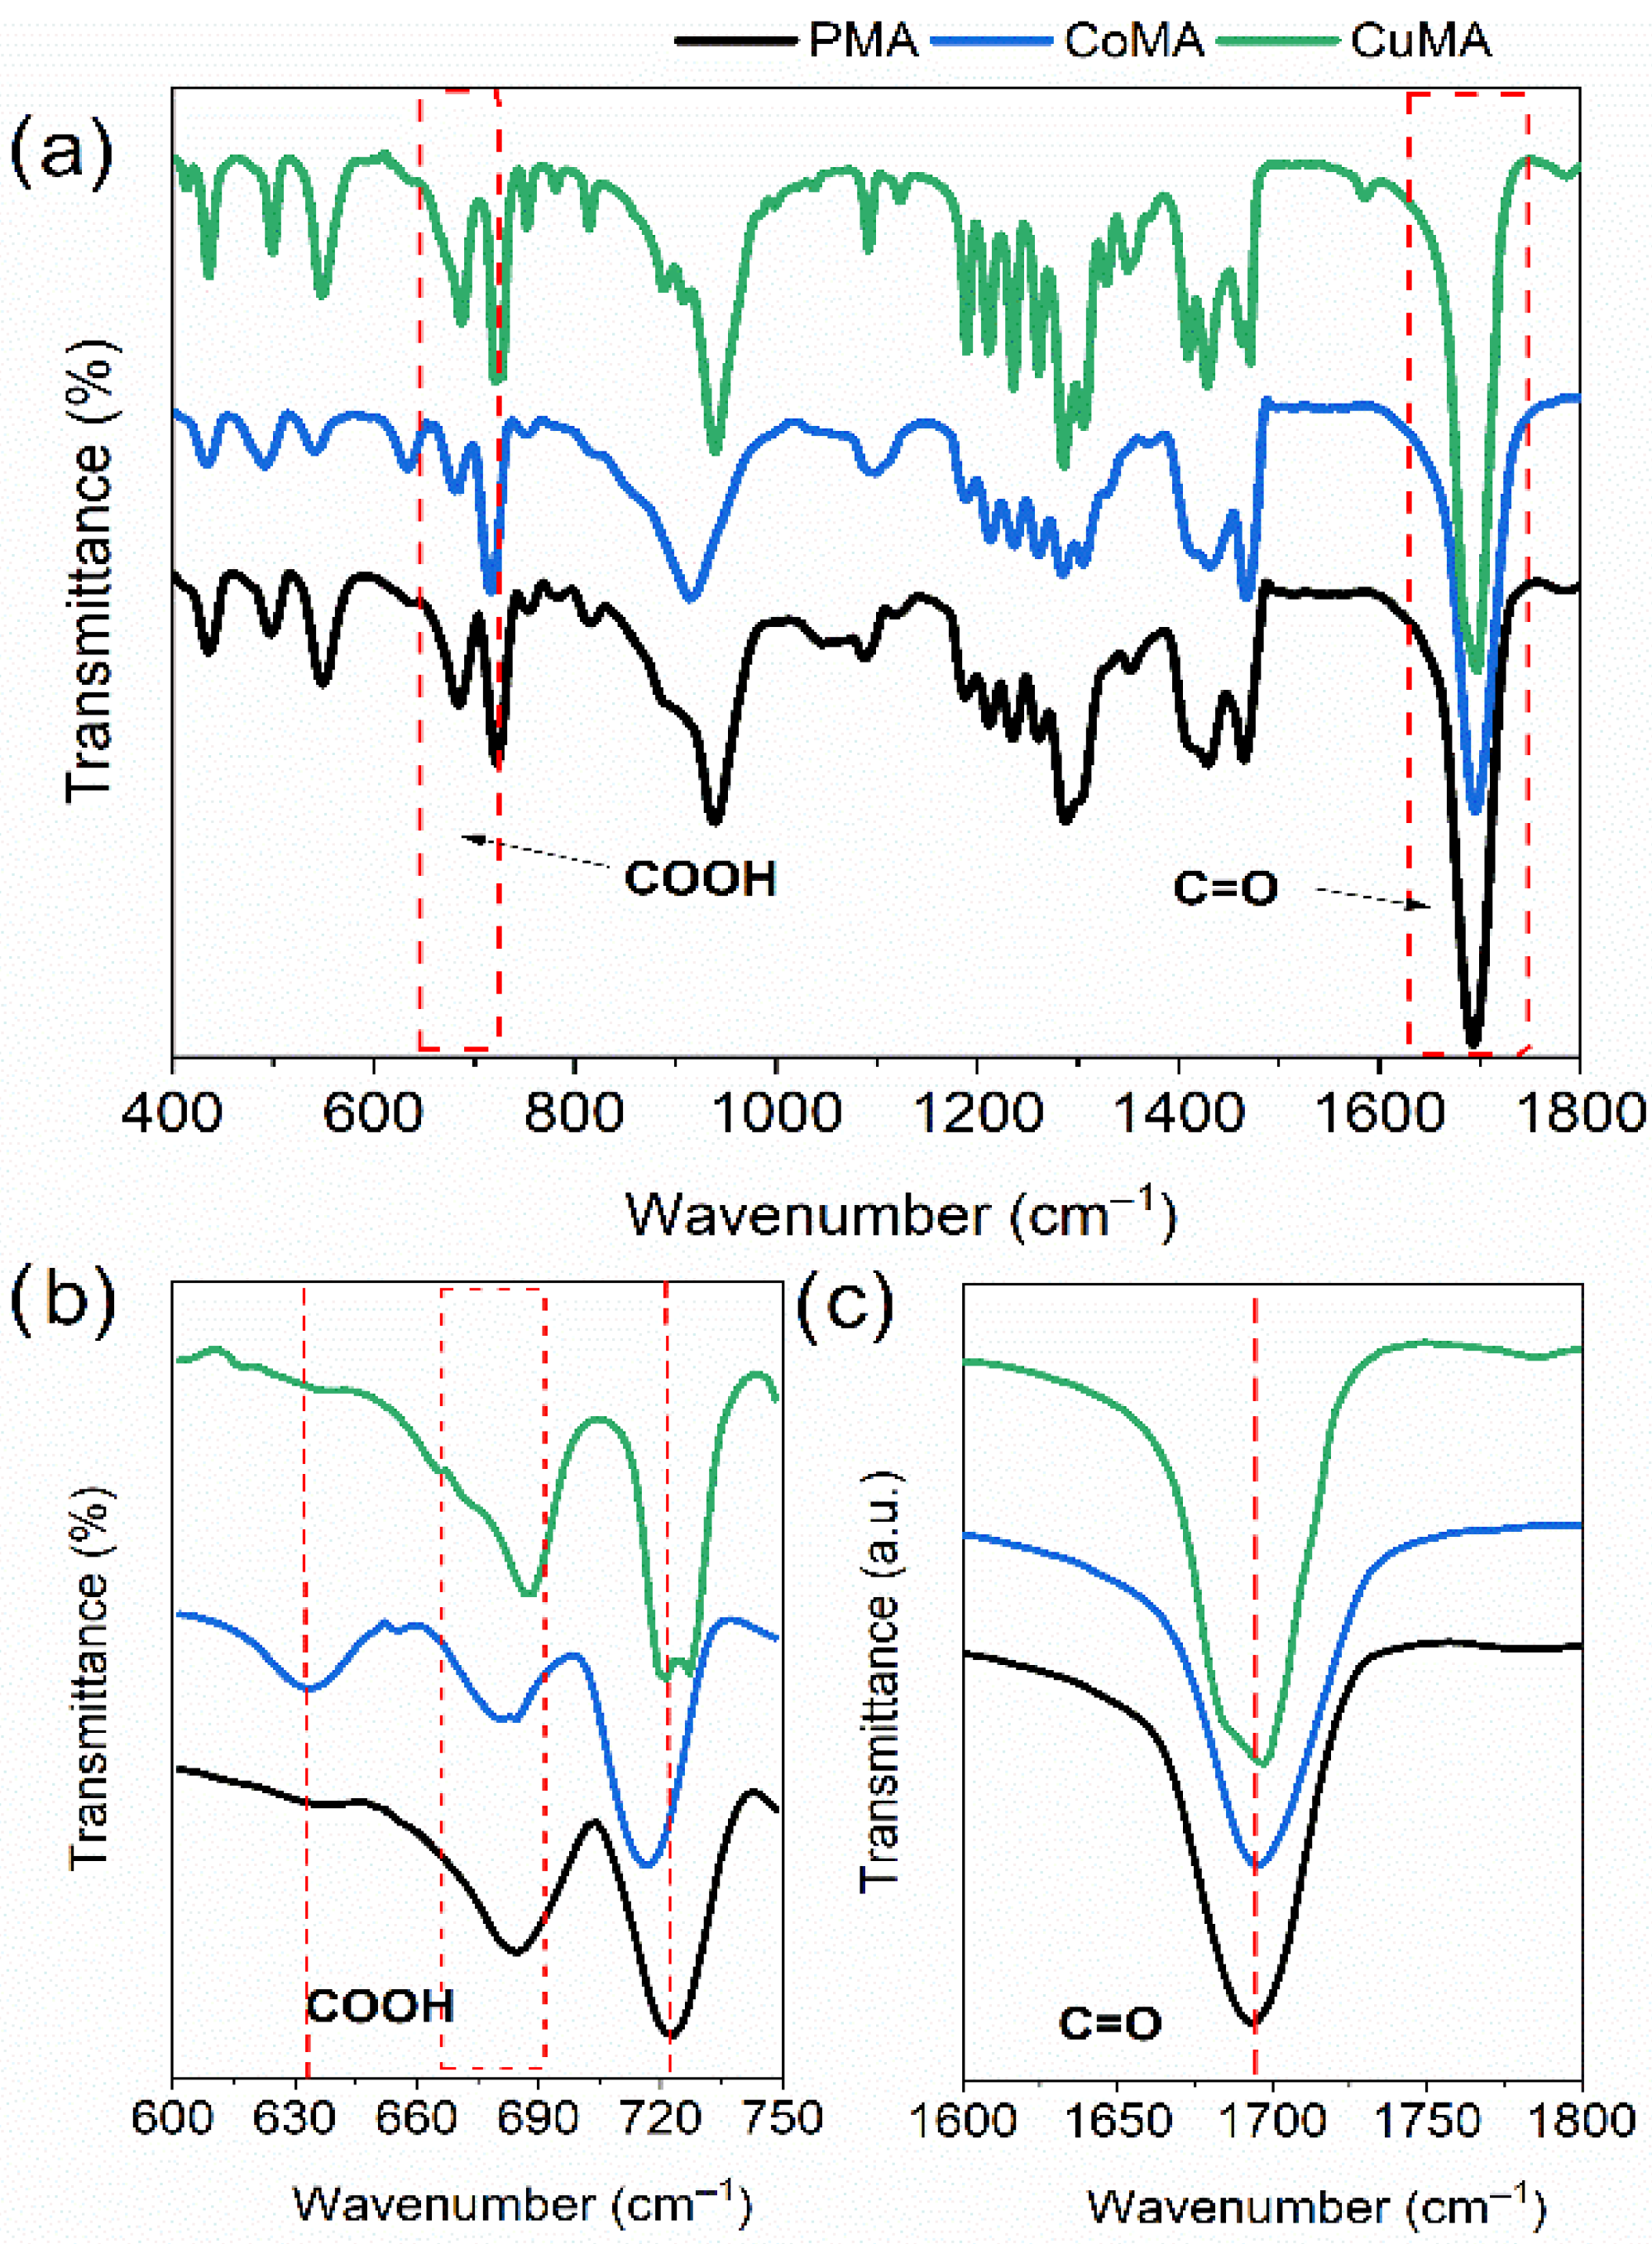
Figure 7a presents the FT-IR spectra of the PMA, CoMA, and CuMA samples across the range of 400–1800 cm−1. Figure 7b displays the spectral region between 600 and 750 cm−1. Shifts in the bands at 672 and 687 cm−1, attributed to carboxyl group scissoring vibrations, are noticed owing to the influence of Co2+ and Cu2+ ions. The bands at 720 and 728 cm−1 are assigned to carbon chain torsional modes.
Figure 7c displays the 1600–1800 cm−1 region, where the bands at 1678 and 1717 cm−1, assigned as carbonyl (C=O) stretching, exhibit shifts relative to the PMA sample. These spectral shifts reflect the incorporation of Co2+ and Cu2+ ions into the crystal structure.

3.5. TG and DTA Analyses

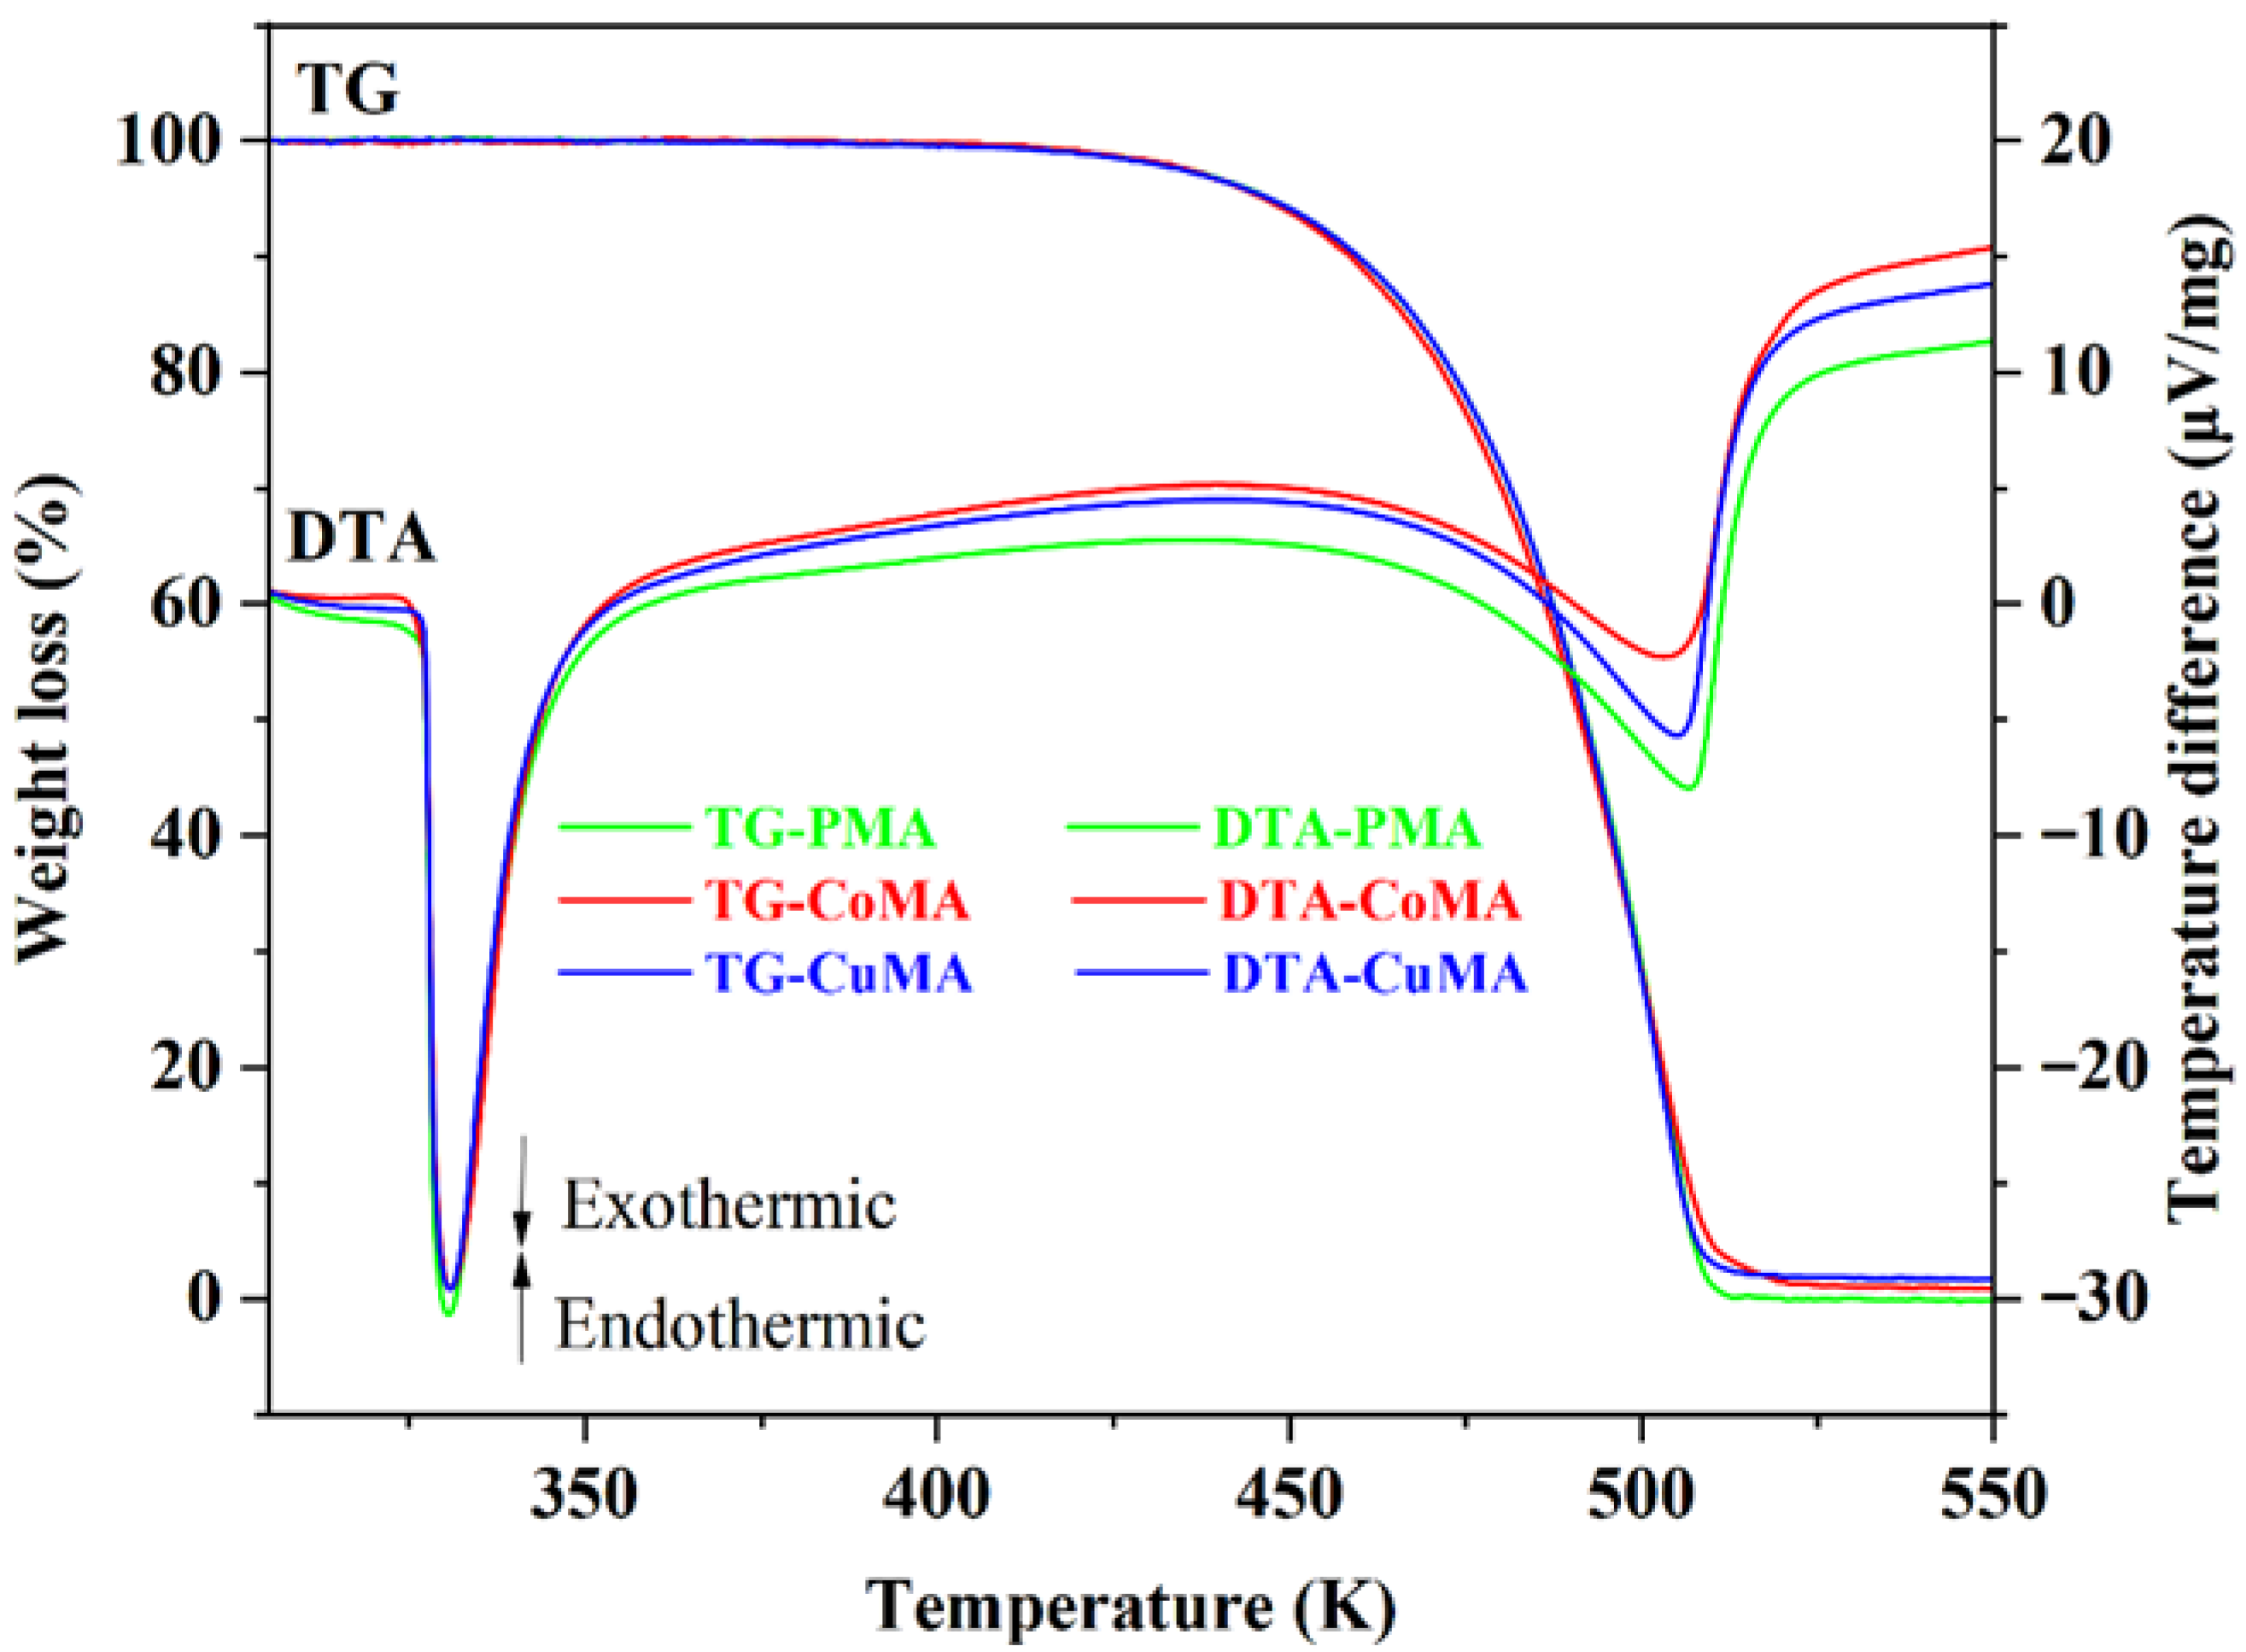
Figure 8 presents the TG and DTA curves of the PMA, CoMA, and CuMA samples, while Table 3 summarizes the corresponding thermal events observed during analysis. As depicted in Figure 8 (green line), the TG curve of PMA reveals a substantial mass loss between 480.3 K and 509.8 K (4 mg–100%), indicating that MA decomposes within this temperature range. The DTA curve displays an endothermic event at 331 K across all samples, which may correspond to a solid–liquid phase transition [32].
The incorporation of Co2+ and Cu2+ ions notably influences the onset (Tonset), midpoint (Tmidset), and endpoint (Tendset) temperatures of the thermal events. As depicted in Figure 9 (blue line), the CuMA sample exhibits a decomposition profile similar to that of PMA (3.92 mg–98%), with a Tonset of 484.9 K, suggesting that Cu exerts a milder influence on MA’s thermal stability. Figure 9 (red line), in contrast, indicates that CoMA decomposes between 477.4 K and 509.8 K (3.99 mg–99%), with a slightly lower Tonset than that of PMA, implying that Co may facilitate the onset of decomposition [33].
The above comparative analysis reveals that the addition of Co alters the thermal stability and decomposition behavior of MA. In contrast, Cu exerts a more moderate effect, maintaining thermal stability at a level comparable with that of pure MA.
These findings are crucial for understanding the interactions between MA and different metal ions and provide insights into how such additives can be used to fine-tune the material’s thermal properties. This knowledge is essential for developing materials with tailored thermal stability, especially for applications wherein heat resistance or controlled decomposition are essential [34,35].

3.6. Biological Assay

Microbial viability was calculated based on spectrophotometric readings (Thermo Scientific Multiskan Go Microplate Spectrophotometer) and expressed as the percentage of MIC at various sample concentrations, according to the following equation 1:
% M I C = 1   A c A 0 × 100
where Ac is the mean absorbance at each sample concentration (after subtracting the absorbance of the substance alone, without bacteria), and A0 is the mean absorbance of the microbial growth control (without the test substance). This value represents the percentage of microbial cells destroyed in the tested sample [36].
The MIC (%) results for antibacterial activity revealed that all samples, including PMA as well as those doped with the tested ions (CoMA and CuMA), demonstrated the ability to inhibit the growth of X. citri bacterial colonies. Most samples exhibited bactericidal activity, except—PMA at 15.6 µg/mL and 7.8 µg/mL, where the effect was bacteriostatic. For CuMA, the assay confirmed that no inhibitory effect was observed at the lowest tested concentration (7.8 µg/mL), while all other concentrations resulted in bacterial inhibition. All values of antimicrobial activity are given in Table 4.
Notably, the tested samples outperformed the antibiotic used in the control (streptomycin sulfate, Figure 10). This antibiotic exhibited no inhibitory action against the bacterium in the control, indicating that the organism was resistant to it.
One potential explanation for this resistance is a mutation in the rpsL gene, which encodes the ribosomal S12 protein. Mutations in this gene can prevent streptomycin from binding, thereby reducing or completely eliminating its efficacy and leading to the observed control failure. Furthermore, the administration of subinhibitory or excessive doses of antibiotics, as well as their indiscriminate use, can accelerate the development of antimicrobial resistance [37].

Statistical Analysis of the Microbiological Assay

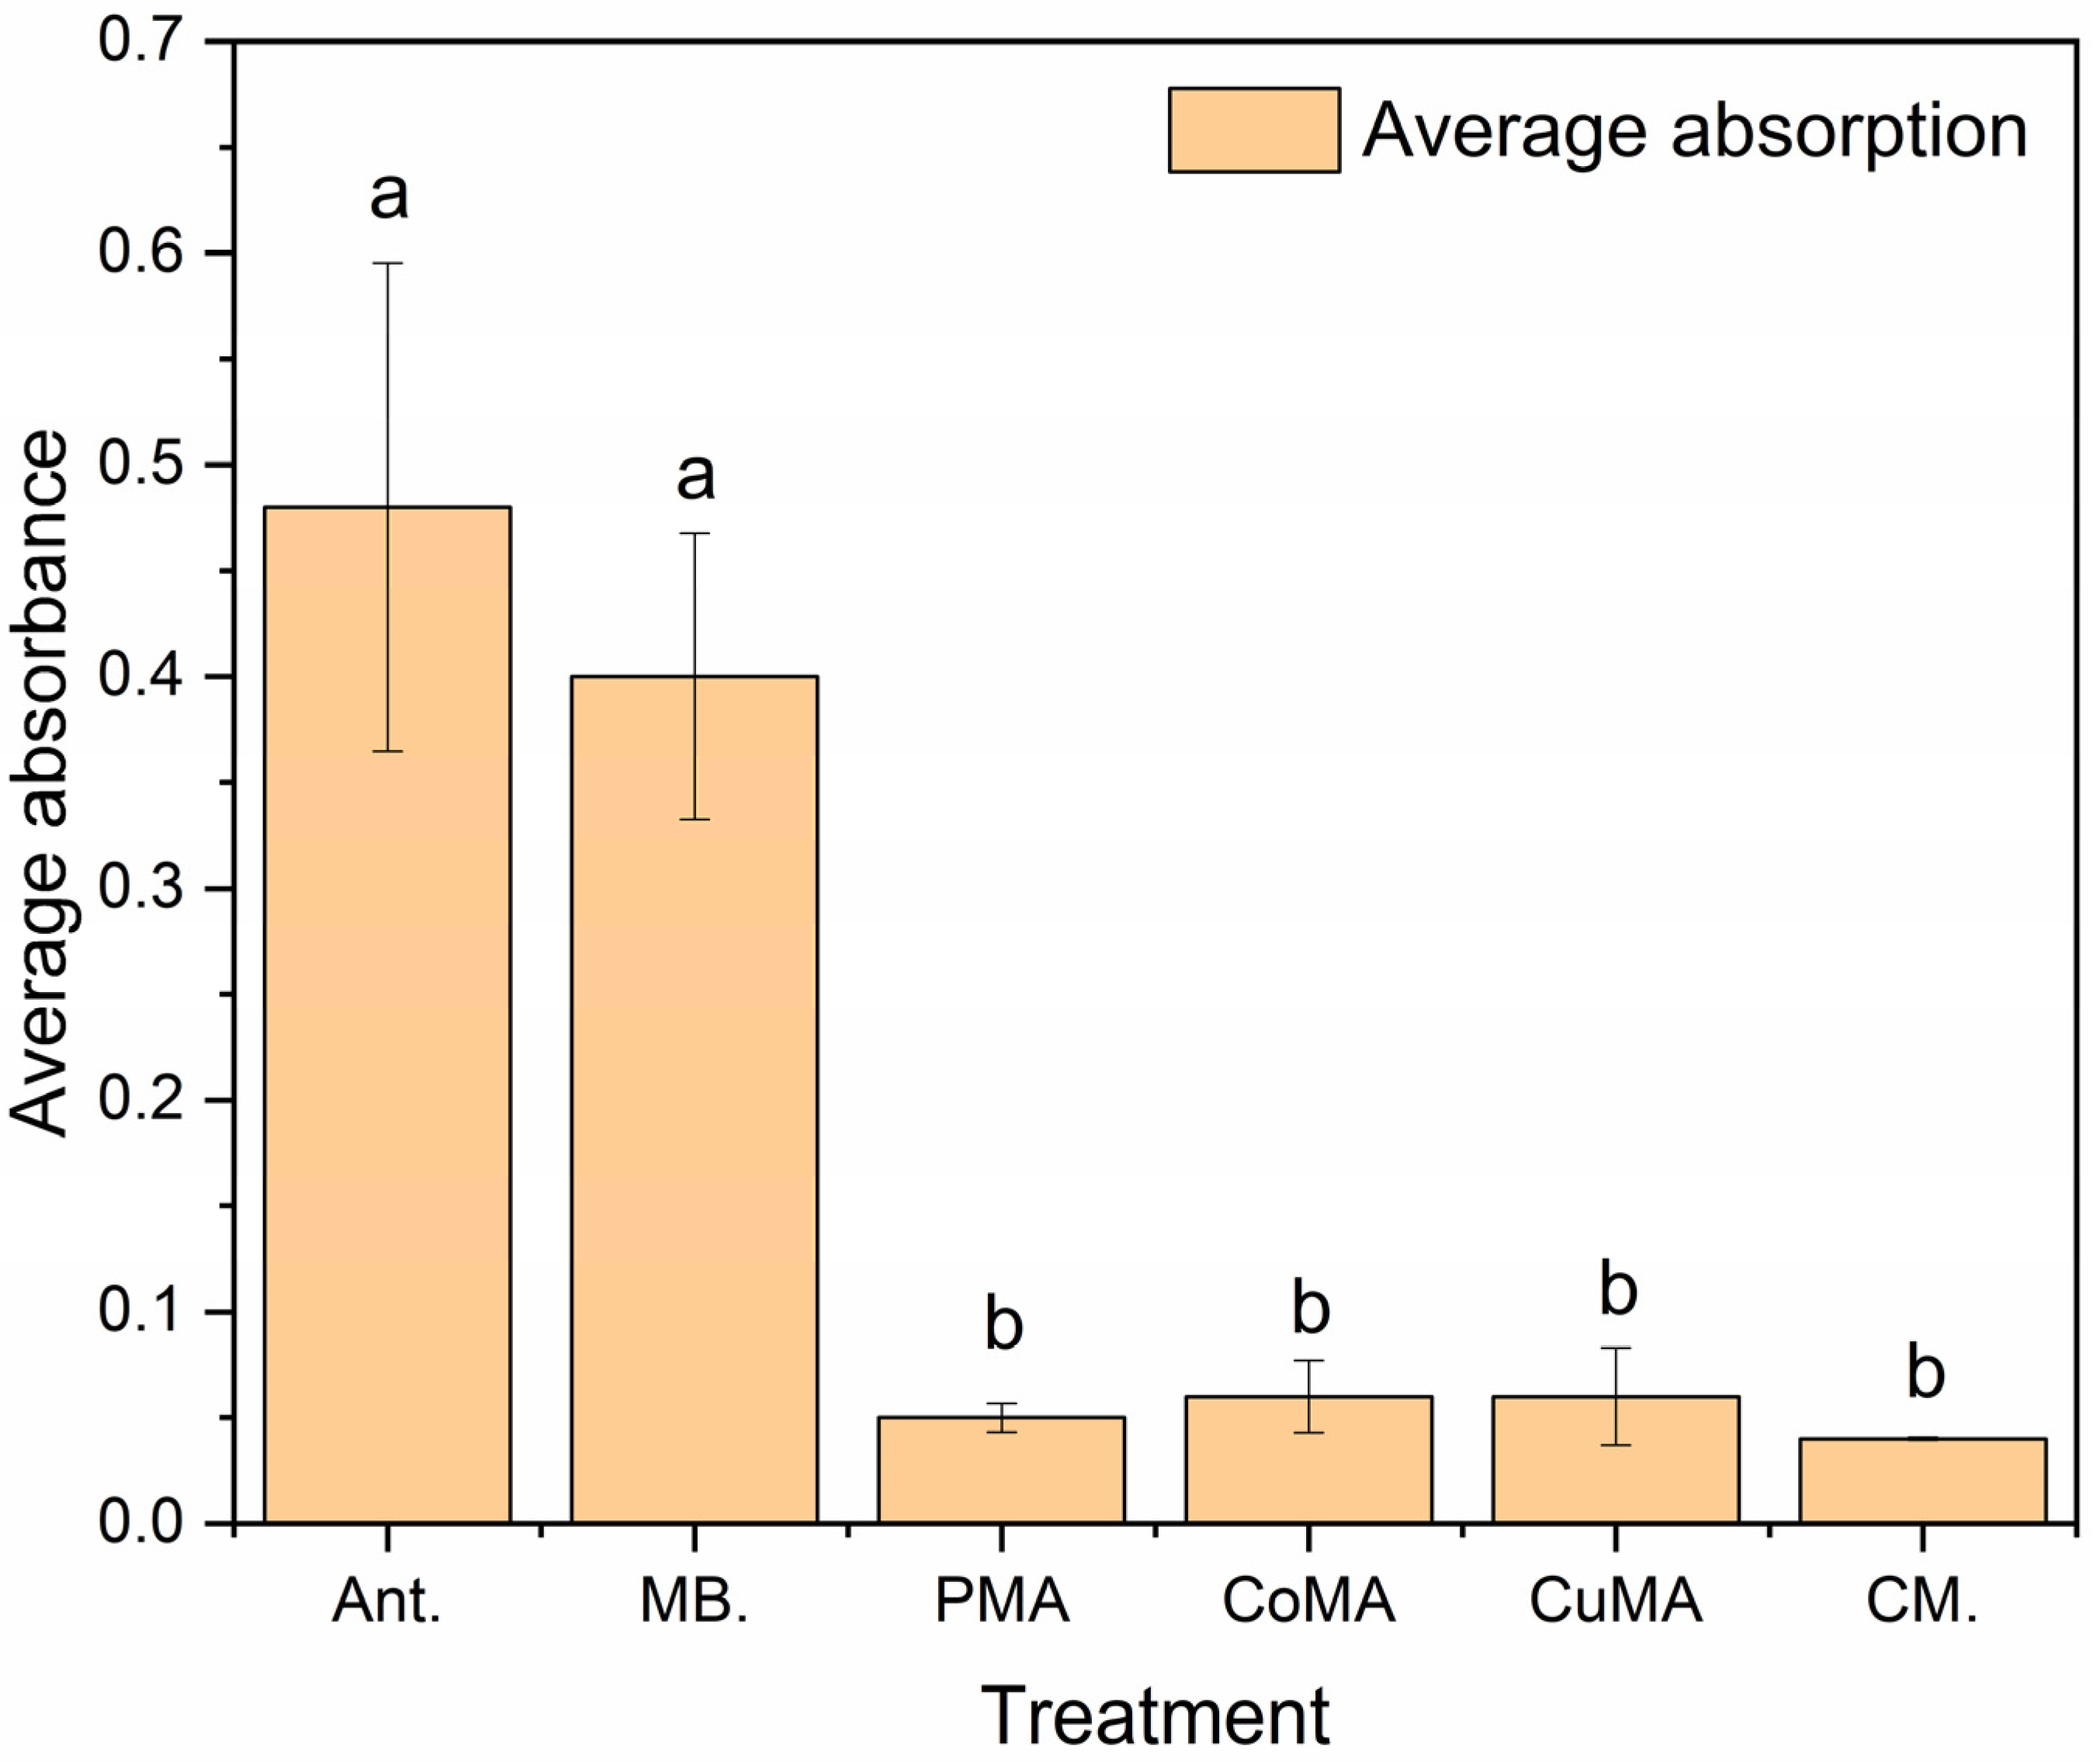
Figure 9 displays the mean absorbance values obtained from the ELISA assay for treatments conducted using both the culture medium and bacterial cells. The x-axis includes the tested antibiotic (Ant.), culture medium (MB), PMA, CoMA, CuMA, and culture medium alone (CM). The corresponding mean absorbance values were 0.48, 0.40, 0.05, 0.06, 0.06, and 0.04, respectively.
According to the statistical analysis, the Ant. and MB samples were grouped under “a”, indicating no statistically significant difference between their mean absorbance values. Meanwhile, the PMA, CoMA, CuMA, and CM samples were grouped under “b,” also indicating no significant differences among their means. However, a significant difference was observed between groups “a” and “b”, corroborating the ELISA assay results that indicated microbial growth in the Ant. and MB samples and microbial inhibition in the remaining treatment groups.
An additional notable finding is that X. citri exhibited resistance to the antibiotic control included in the assay. Further, the findings of Duncan’s test confirmed the antimicrobial activity of PMA, CoMA, and CuMA.
Metals are known to exert antimicrobial effects by damaging bacterial membranes, inducing oxidative stress, and disrupting key metabolic pathways. Fatty acids alter membrane permeability, and their antimicrobial efficacy can be enhanced through metal doping. This synergistic effect primarily occurs at the membrane interface, where it regulates metal ion influx and leads to increased cellular damage. Moreover, the controlled release of metal ions may prolong the antimicrobial effect [38,39].
The surface morphology of the investigated materials (Figure 2) appeared to influence antimicrobial activity (Figure 9). In particular, PMA and CuMA featured surfaces with pronounced roughness, visible pores, and a substantial number of grain aggregates, while CoMA displayed regions with sharp, protruding structures [40]. These morphological characteristics promoted greater antimicrobial activity by inhibiting bacterial growth, resulting in a notable difference in antimicrobial activity compared to the Ant. and MB treatments. In general, surface roughness and porosity increase the contact area with bacteria, enhancing physical interactions, facilitating the adsorption of bacterial biomolecules, and enabling direct contact with cellular membranes [41].
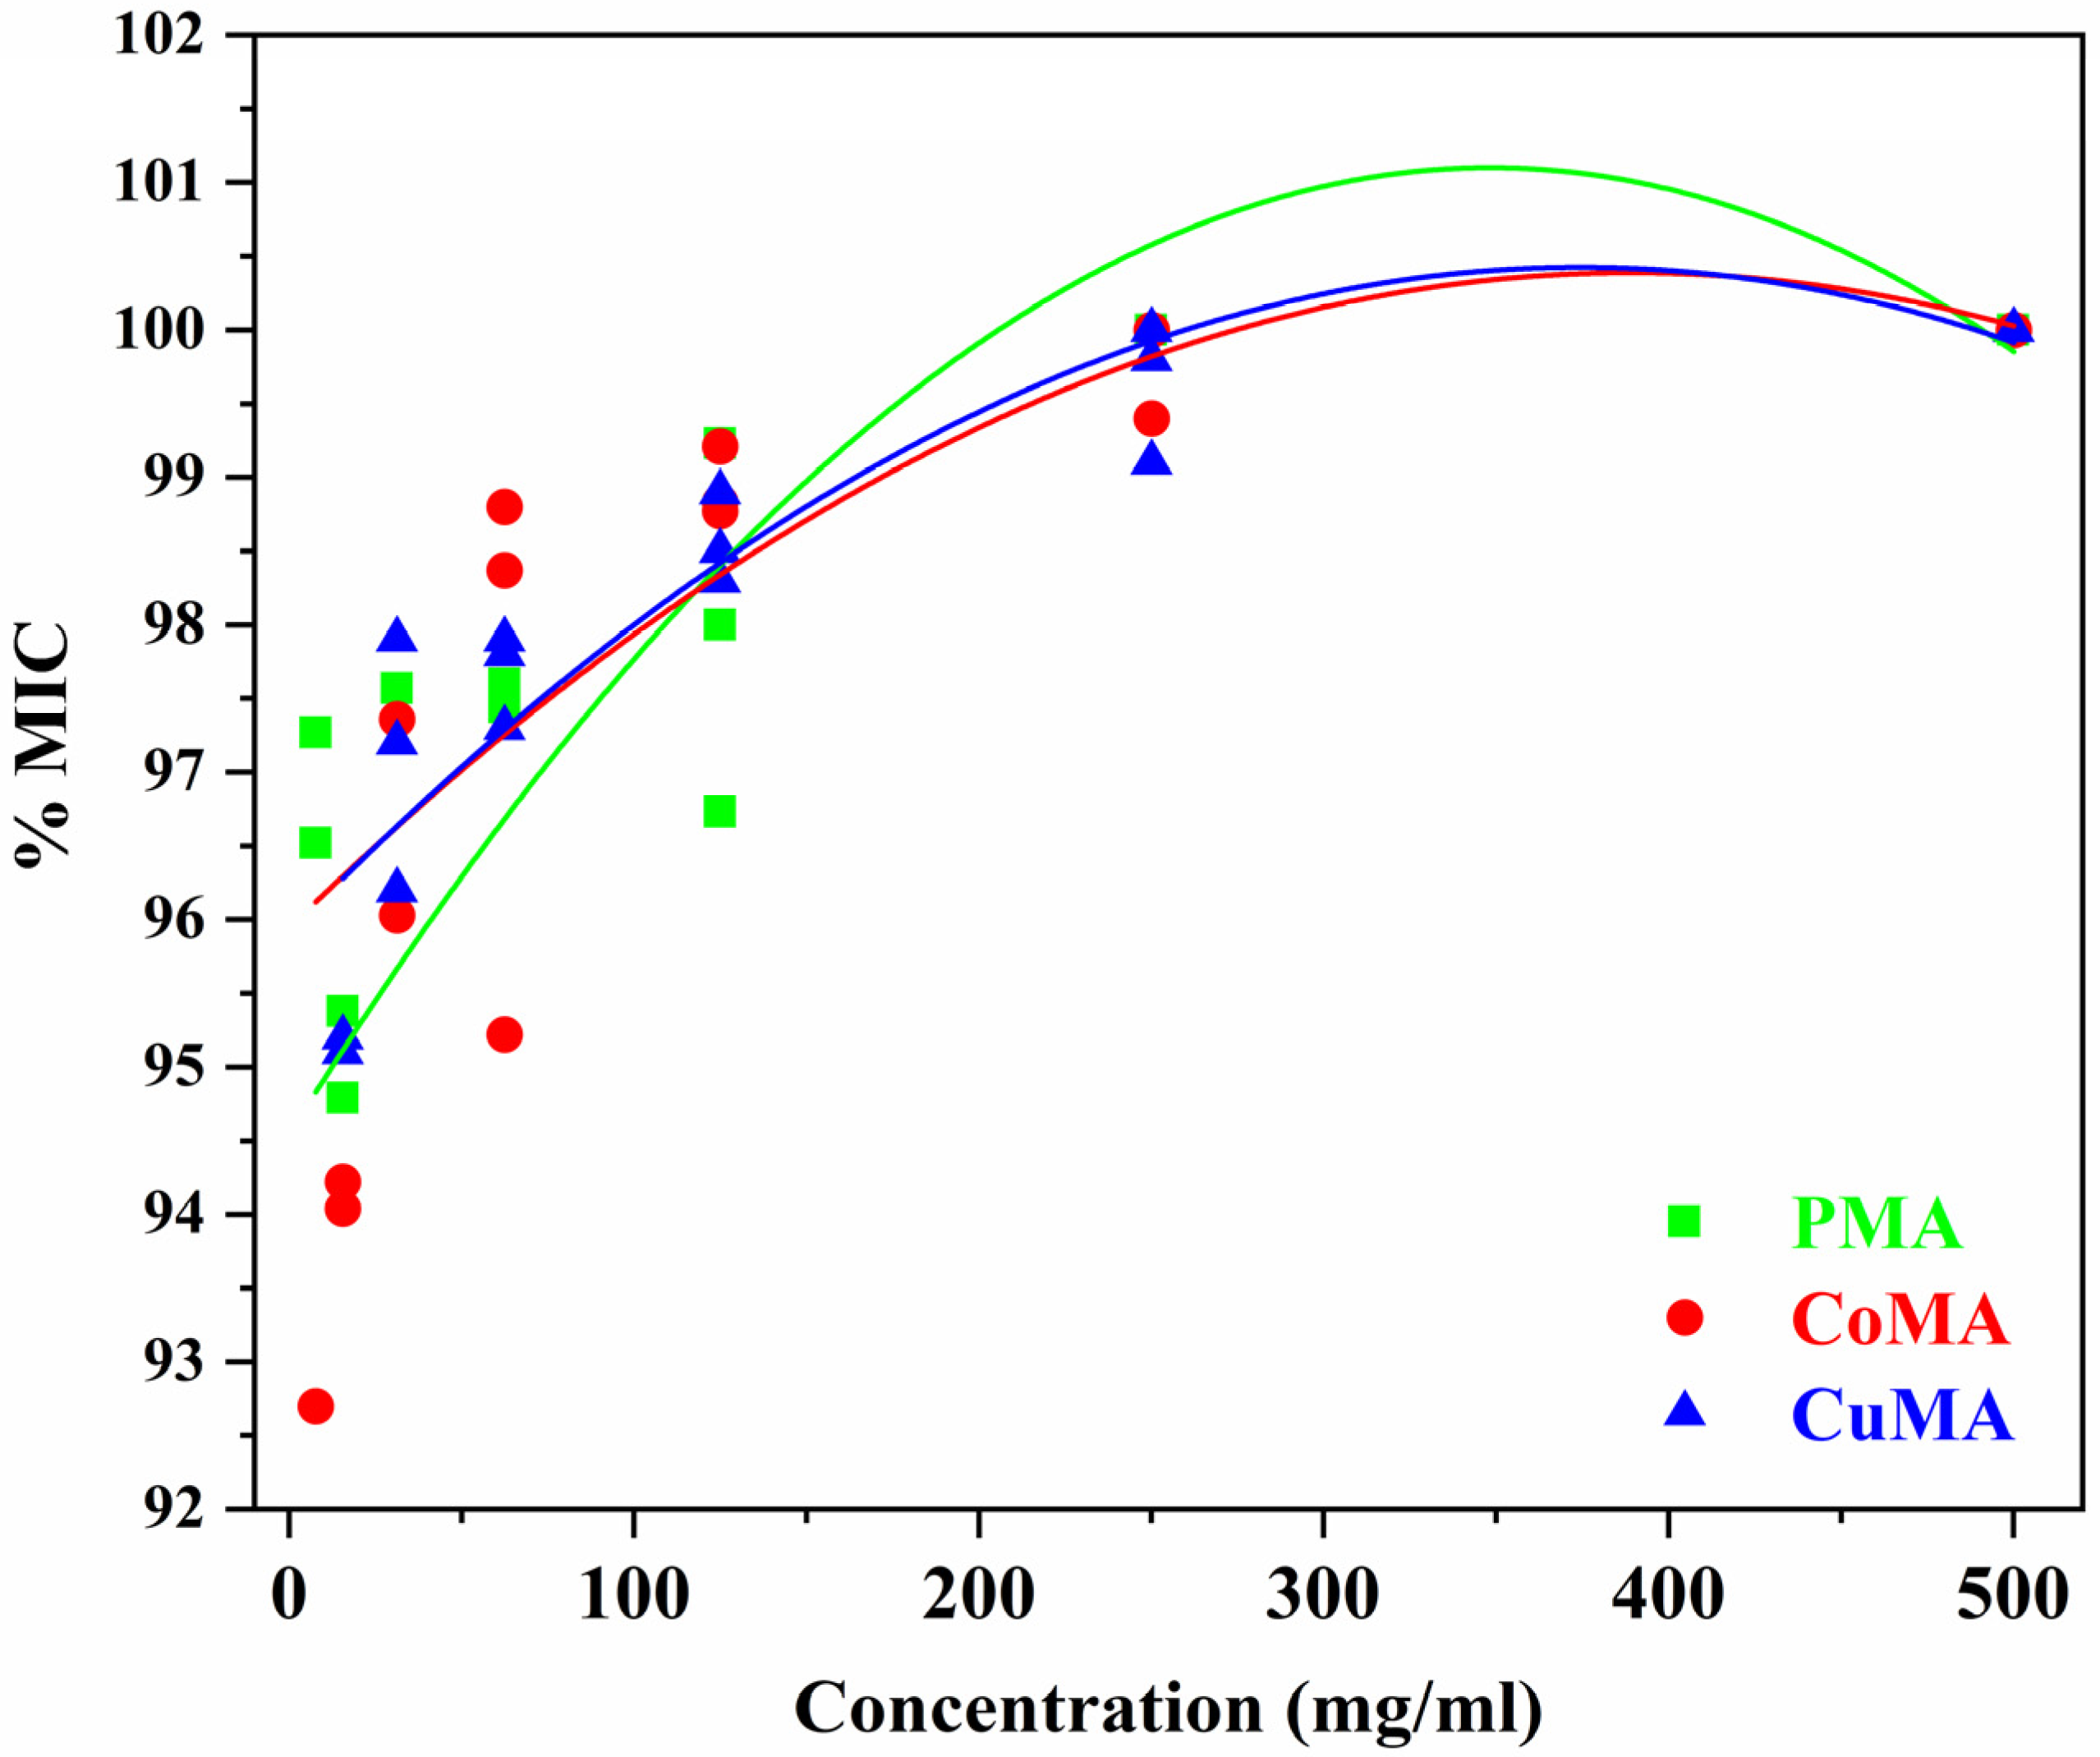
Beyond this, polynomial regression [42] was applied to model the nonlinear relationship between %MIC and sample concentration, yielding a coefficient of determination (R2) greater than 0.80 (Figure 10). This result indicates that at least 80% of the variation in %MIC can be explained by the model, suggesting a good fit. From the regression curves, the LD50 value (lethal dose 50%) [43], the toxicological dose required to inhibit 50% of the tested population, was also determined.
Given the parabolic distribution of the data points, a quadratic polynomial (y = ax2 + bx + c) was identified as the most suitable model, with x representing the independent variable and y the dependent variable. The following equations (2, 3, and 4) were derived:
y = −2.9 × 10−5 x2 + 0.02x + 95.9 (R2 = 0.81, LD50 = 75.3 µg/mL).
y = −3.2 × 10−5 x2 + 0.02x + 95.9 (R2 = 0.83, LD50 = 86.3 µg/mL).
y = −5.4 × 10−5 x2 + 0.04x + 94.5 (R2 = 0.81, LD50 = 73.0 µg/mL).
Although the quadratic polynomial effectively described the observed data, it may not reliably predict values beyond the tested range. Thus, more complex models should be investigated in future research.
The fitted model revealed a pronounced quadratic relationship between %MIC and sample concentration. Notably, an R2 > 0.80 indicates that over 80% of the variability in inhibition is explained by the fitted curve. Further, the downwardly concave parabolic shape indicates increasing inhibition up to a concentration of 250 µg/mL.

4. Conclusions

In this study, pure and Co- and Cu-doped MA polycrystals were synthesized, and the effects of metal doping on their physicochemical properties and antimicrobial activity against X. citri were evaluated. Doping with Co and Cu affected the crystallization process, leading to changes in morphology, porosity, and grain size. XRD analysis revealed that doping reduced the lattice parameters and unit cell volume of the polycrystals. The most pronounced reduction occurred in the CoMA sample, which exhibited a unit cell volume of 1461.10 Å3 and a crystallite size of 165 nm. In comparison, the PMA sample had a unit cell volume of 1481.84 Å3 and a crystallite size of 312.14 nm. These findings imply enhanced bactericidal activity, as both particle morphology and size directly influence microbial inhibition. Raman and FT-IR spectroscopic analyses supported these structural changes, suggesting that metal ions were incorporated into the crystal lattice, where they influenced hydrogen bonding and lattice vibrations. The incorporation of Co altered the thermal stability of MA by lowering its initial decomposition temperature, while Cu produced a more moderate effect, preserving stability comparable to that of the undoped compound. All tested samples, namely PMA, CoMA, and CuMA, effectively inhibited the growth of X. citri, outperforming the control antibiotic, streptomycin sulfate, to which the bacterium was resistant. Notably, among these samples, CoMA exhibited the strongest effect, achieving bactericidal action at all tested concentrations. It also presented the lowest LD50 value (73.0 µg/mL), suggesting that Co doping enhanced the bactericidal potency of the compound. Therefore, while Co and Cu doping did not alter the crystalline phase of MA, they did modify its structural characteristics and antimicrobial efficacy. In particular, CoMA emerged as the most promising formulation for future antimicrobial applications. Based on these findings, future research should investigate the mechanism of action of these compounds, broaden their microbiological scope, and assess their toxicity in mammalian cells. Additionally, efforts to optimize the synthesis by varying dopant concentrations and exploring alternative ions, such as Zn or Ag, may further enhance the material’s properties and antimicrobial activity.

Author Contributions

Conceptualization, L.A.C.V., M.V.d.S.J. and J.G.d.O.N.; Methodology, L.A.C.V., M.V.d.S.J. and J.G.d.O.N.; Software, L.A.C.V., M.V.d.S.J. and J.G.d.O.N.; Validation, A.O.d.S., T.F.V.B. and S.G.C.M.; Formal analysis, L.A.C.V., J.G.d.O.N. and M.V.d.S.J.; Investigation, L.A.C.V., M.V.d.S.J. and J.G.d.O.N.; Resources, L.A.C.V., M.V.d.S.J. and J.G.d.O.N.; Data curation, L.A.C.V., M.V.d.S.J. and J.G.d.O.N.; Writing—original draft, L.A.C.V., M.V.d.S.J., J.G.d.O.N. and F.F.d.S.; Writing—review and editing, L.A.C.V., F.F.d.S. and W.P.J.; Supervision, F.F.d.S. and W.P.J.; Project administration, F.F.d.S. and W.P.J.; Funding acquisition, F.F.d.S. and W.P.J. All authors have read and agreed to the published version of the manuscript.

Funding

Authors acknowledge financial support from Brazilian agencies CAPES, CNPQ, FINEP, and MCTIC. The author F.F.d.S gratefully acknowledge supporting from MCT/CNPQ (Grants #: 308789/2022-9).

Data Availability Statement

The original contributions presented in this study are included in the article. Further inquiries can be directed to the corresponding author.

Acknowledgments

The author L. Vieira gratefully acknowledge supporting from Federal Institute of Amapá—IFAP, Plant Protection Laboratory—LPP/UFRA, Postgraduate Program in Materials Science—PPGCM/UFMA and Postgraduate Program in Physics—PPGF/ICEN/UFPA. The author W. Paschoal Jr. gratefully acknowledge supporting from FACFIS/UFPA, PPGF/UFPA, ICEN/UFPA, PPGEM/UFPA, PROPESP/UFPA, PROEG/UFPA, NanoJovem-NanoAmazônia/PROEX/UFPA, PIBID/CAPES and FAPESPA. In addition, the authors acknowledge the use of the facilities at LMMiLiE/UFPA and LABNANO-AMAZON/UFPA.

Conflicts of Interest

The authors declare no conflicts of interest.

References

  1. Liu, X.; Wang, Y.; Wang, Y.; Cui, H.; Zhao, G.; Guo, Y.; Wen, J. Effect of myristic acid supplementation on triglyceride synthesis and related genes in the pectoral muscles of broiler chickens. Poult. Sci. 2024, 103, 104038. [Google Scholar] [CrossRef]
  2. Saraswathi, V.; Kumar, N.; Ai, W.; Gopal, T.; Bhatt, S.; Harris, E.N.; Talmon, G.A.; Desouza, C.V. Myristic acid supplementation aggravates high fat diet-induced adipose inflammation and systemic insulin resistance in mice. Biomolecules 2022, 12, 739. [Google Scholar] [CrossRef]
  3. Miranda, J.R.S.; de Castro, A.J.R.; da Silva Filho, J.G.; Freire, P.T.C.; Pinheiro, G.S.; Moreira, S.G.C.; Saraiva, G.D.; de Sousa, F.F. Phase transformation in the C form of myristic-acid crystals and DFT calculations. Spectrochim. Acta A Mol. Biomol. Spectrosc. 2019, 208, 97–108. [Google Scholar] [CrossRef] [PubMed]
  4. Moreno-Calvo, E.; Gbabode, G.; Cordobilla, R.; Calvet, T.; Cuevas-Diarte, M.À.; Negrier, P.; Mondieig, D. Competing intermolecular interactions in the high-temperature solid phases of even saturated carboxylic acids (C10H19O2H to C20H39O2H). Chem. A Eur. J. 2009, 15, 13141–13149. [Google Scholar] [CrossRef] [PubMed]
  5. Vandana, L.P.; Ramadoss, R. Herbal myristic acid blended with expanded graphite for thermal regulation in construction materials. J. Energy Storage 2023, 65, 107258. [Google Scholar] [CrossRef]
  6. Agarwal, P.; Svirskis, D.; Nieuwoudt, M.K. Thermodynamic and spectroscopic evaluation of the eutectic mixture of myristic acid and the local anaesthetics, bupivacaine and ropivacaine. RSC Pharm. 2024, 1, 296–304. [Google Scholar] [CrossRef]
  7. Javid, S.; Shanmugarajan, D.; Kumar, H.Y.; Arivuselvam, R.; Anjum, N.F.; Purohit, M.N.; Susil, A.; Harindranath, H.; Nilugal, K.C.; Nagojappa, N.B.S.; et al. Rational design, synthesis, analysis and antifungal activity of novel myristic acid derivatives as n-myristoyltransferase inhibitors. J. Mol. Struct. 2024, 1303, 137568. [Google Scholar] [CrossRef]
  8. Vijayarohini, P.; Kavitha, G.; Bangaru Sudarsan Alwar, S.; Mercy, A.S.C. Antimicrobial activity of selective transition metal co-ordination complexes of myristic acid. Mater. Today Proc. 2020, 33, 4198–4205. [Google Scholar] [CrossRef]
  9. Bashiri Rezaie, A.; Montazer, M.; Mahmoudi Rad, M. Facile fabrication of cytocompatible polyester fiber composite incorporated via photocatalytic nano copper ferrite/myristic-lauric fatty acids coating with antibacterial and hydrophobic performances. Mater. Sci. Eng. C Mater. Biol. Appl. 2019, 104, 109888. [Google Scholar] [CrossRef]
  10. Ling, L.; Cai, S.; Zuo, Y.; Meng, T.; Tian, H.; Bao, X.; Xu, G. Wettability transition of superhydrophobic myristic acid/dodecyl mercaptan/Cu@ZIF-8/HA coating modified magnesium alloy driven by visible light for antibacterial and osteogenic applications. Prog. Org. Coat. 2023, 184, 107828. [Google Scholar] [CrossRef]
  11. Habib, M.L.; Disha, S.A.; Sahadat Hossain, M.; Uddin, M.N.; Ahmed, S. Enhancement of antimicrobial properties by metals doping in nano-crystalline hydroxyapatite for efficient biomedical applications. Heliyon 2024, 10, e23845. [Google Scholar] [CrossRef]
  12. Godoy-Gallardo, M.; Eckhard, U.; Delgado, L.M.; de Roo Puente, Y.J.D.; Hoyos-Nogués, M.; Gil, F.J.; Perez, R.A. Antibacterial approaches in tissue engineering using metal ions and nanoparticles: From mechanisms to applications. Bioact. Mater. 2021, 6, 4470–4490. [Google Scholar] [CrossRef]
  13. Moroda, M.D.; Leta Deressa, T.; Tiwikrama, A.H.; Chala, T.F. Green synthesis of copper oxide nanoparticles using rosmarinus officinalis leaf extract and evaluation of its antimicrobial activity. Next Mater. 2025, 7, 100337. [Google Scholar] [CrossRef]
  14. Narayanan, R.; El-Sayed, M.A. Effect of catalysis on the stability of metallic nanoparticles: Suzuki reaction catalyzed by PVP-palladium nanoparticles. J. Am. Chem. Soc. 2003, 125, 8340–8347. [Google Scholar] [CrossRef]
  15. Ameen, F.; Majrashi, N. Recent trends in the use of cobalt ferrite nanoparticles as an antimicrobial agent for disability infections: A review. Inorg. Chem. Commun. 2023, 156, 111187. [Google Scholar] [CrossRef]
  16. Şahin, N.; Üstün, E.; Özdemir, İ.; Günal, S.; Özdemir, N.; Bülbül, H.; Gürbüz, N.; Özdemir, İ.; Sémeril, D. Antimicrobial activities of bis-(n-alkylbenzimidazole)-cobalt(II) and zinc(II) complexes. Inorg. Chem. Commun. 2023, 157, 111396. [Google Scholar] [CrossRef]
  17. Khan, R.T.; Rasool, S. Nanotechnology: A new strategy to combat bacterial infections and antibiotic resistant bacteria. In Nanotechnology and Human Health: Current Research and Future Trends; Elsevier: Amsterdam, The Netherlands, 2023; pp. 167–190. [Google Scholar] [CrossRef]
  18. Kado, C.I.; Heskett, M.G. Selective media for isolation of Agrobacterium, Corynebacterium, Erwinia, Pseudomonas, and Xanthomonas. Phytopathology 1970, 60, 969–976. [Google Scholar] [CrossRef] [PubMed]
  19. Duarte, M.C.T.; Figueira, G.M.; Sartoratto, A.; Rehder, V.L.G.; Delarmelina, C. Anti-candida activity of brazilian medicinal plants. J. Ethnopharmacol. 2005, 97, 305–311. [Google Scholar] [CrossRef]
  20. Abreu, D.C.; Filho, P.F.F.; Pinheiro, G.S.; Freire, P.T.C.; Moreira, S.G.C.; dos Santos, A.O.; de Sousa, F.F. Polymorphism at hexadecanoic-acid crystals investigated through structural and vibrational studies. Vib. Spectrosc. 2022, 121, 103402. [Google Scholar] [CrossRef]
  21. Toby, B.H.; Von Dreele, R.B. GSAS-II: The genesis of a modern open-source all purpose crystallography software package. Appl. Crystallogr. 2013, 46, 544–549. [Google Scholar] [CrossRef]
  22. Eloff, J.N. A sensitive and quick microplate method to determine the minimal inhibitory concentration of plant extracts for bacteria. Planta Med. 1998, 64, 711–713. [Google Scholar] [CrossRef]
  23. Kumari, M.; Sheoran, S.; Prakash, D.; Yadav, D.B.; Yadav, P.K.; Jat, M.K.; Ankit; Apurva. Long-term application of organic manures and chemical fertilizers improve the organic carbon and microbiological properties of soil under pearl millet-wheat cropping system in north-western india. Heliyon 2024, 10, e25333. [Google Scholar] [CrossRef]
  24. Bilen, M.V.; Uzun, P.; Yıldız, H.; Fındık, B.T. Evaluation of the effect of active essential oil components added to pickled-based marinade on beef stored under vacuum packaging: Insight into physicochemical and microbiological quality. Int. J. Food Microbiol. 2024, 418, 110733. [Google Scholar] [CrossRef]
  25. Agnoli, S.; Favaro, M. Doping graphene with boron: A review of synthesis methods, physicochemical characterization, and emerging applications. J. Mater. Chem. A Mater. 2016, 4, 5002–5025. [Google Scholar] [CrossRef]
  26. Turner, M.J.; McKinnon, J.J.; Jayatilaka, D.; Spackman, M.A. Visualisation and characterisation of voids in crystalline materials. CrystEngComm 2011, 13, 1804–1813. [Google Scholar] [CrossRef]
  27. Spackman, P.R.; Turner, M.J.; McKinnon, J.J.; Wolff, S.K.; Grimwood, D.J.; Jayatilaka, D.; Spackman, M.A. Crystalexplorer: A program for hirshfeld surface analysis, visualization and quantitative analysis of molecular crystals. Appl. Crystallogr. 2021, 54, 1006–1011. [Google Scholar] [CrossRef]
  28. Soldatov, D.V.; Moudrakovski, I.L.; Grachev, E.V.; Ripmeester, J.A. Micropores in crystalline dipeptides as seen from the crystal structure, He pycnometry, and 129Xe NMR spectroscopy. J. Am. Chem. Soc. 2006, 128, 6737–6744. [Google Scholar] [CrossRef] [PubMed]
  29. Pawar, S.M.; Patil, S.S.; Sonawane, K.D.; More, V.B.; Patil, P.S. Hydrothermally synthesized copper oxide nanoparticles: Rietveld analysis and antimicrobial studies. Surf. Interfaces 2024, 51, 104598. [Google Scholar] [CrossRef]
  30. Bin Mobarak, M.; Hossain, M.S.; Chowdhury, F.; Ahmed, S. Synthesis and characterization of CuO nanoparticles utilizing waste fish scale and exploitation of XRD peak profile analysis for approximating the structural parameters. Arab. J. Chem. 2022, 15, 104117. [Google Scholar] [CrossRef]
  31. Santos Souza, G.D.; Amado, A.M.; Teixeira, A.M.R.; Freire, P.T.C.; Saraiva, G.D.; Pinheiro, G.S.; Moreira, S.G.C.; De Sousa, F.F.; Nogueira, C.E.S. Low-temperature phase transition of dodecanoic acid crystals: A study using raman, powder x-ray diffraction, and density functional theory calculations. Cryst. Growth Des. 2019, 20, 281–290. [Google Scholar] [CrossRef]
  32. de Matos, F.C.; da Costa, M.C.; de Almeida Meirelles, A.J.; Batista, E.A.C. Binary solid–liquid equilibrium systems containing fatty acids, fatty alcohols and triolein by differential scanning calorimetry. Fluid. Phase Equilib. 2015, 404, 1–8. [Google Scholar] [CrossRef]
  33. Wigzell, F.A.; Jackson, S.D. The genesis of supported cobalt catalysts. Appl. Petrochem. Res. 2016, 7, 9–21. [Google Scholar] [CrossRef]
  34. Leong, K.Y.; Abdul Rahman, M.R.; Gurunathan, B.A. Nano-enhanced phase change materials: A review of thermo-physical properties, applications and challenges. J. Energy Storage 2019, 21, 18–31. [Google Scholar] [CrossRef]
  35. Freeman, T.B.; Foster, K.E.O.; Troxler, C.J.; Irvin, C.W.; Aday, A.; Boetcher, S.K.S.; Mahvi, A.; Smith, M.K.; Odukomaiya, A.; Freeman, T.B.; et al. Advanced materials and additive manufacturing for phase change thermal energy storage and management: A review. Adv. Energy Mater. 2023, 13, 2204208. [Google Scholar] [CrossRef]
  36. Gudiña, E.J.; Rocha, V.; Teixeira, J.A.; Rodrigues, L.R. Antimicrobial and antiadhesive properties of a biosurfactant isolated from lactobacillus paracasei ssp. paracasei A20. Lett. Appl. Microbiol. 2010, 50, 419–424. [Google Scholar] [CrossRef] [PubMed]
  37. Lingaraj, B.; Naik, M.K.; Ajithkumar, K.; Yenjerappa, S.T.; Pampanna, Y.; Kisan, B.; Muthusamy, A.; Murali, T.S. Molecular characterization and exploration of streptomycin resistance genes in Xanthomonas campestris pv. campestris isolates from diverse agro climatic regions of karnataka state, southern india. Eur. J. Plant Pathol. 1–11. [CrossRef]
  38. Silva, L.A.L.; Silva, A.A.L.; Rios, M.A.S.; Brito, M.P.; Araújo, A.R.; Silva, D.A.; Peña-Garcia, R.R.; Silva-Filho, E.C.; Magalhães, J.L.; Matos, J.M.E.; et al. Insights into the antimicrobial activity of hydrated cobaltmolybdate doped with copper. Molecules 2021, 26, 1267. [Google Scholar] [CrossRef] [PubMed]
  39. Panicker, S.; Mathew, A.; Dalvi, S.; Chattaraj, M. Medicinal properties of cobalt and copper nanoparticles synthesized using limonia acidissima leaf extract. Biotechnol. J. Int. 2024, 28, 36–45. [Google Scholar] [CrossRef]
  40. Lemire, J.A.; Harrison, J.J.; Turner, R.J. Antimicrobial activity of metals: Mechanisms, molecular targets and applications. Nat. Rev. Microbiol. 2013, 11, 371–384. [Google Scholar] [CrossRef]
  41. Kumar, R.; Umar, A.; Kumar, G.; Nalwa, H.S. Antimicrobial poperties of ZnO nanomaterials: A review. Ceram. Int. 2017, 43, 3940–3961. [Google Scholar] [CrossRef]
  42. Pu, Y.; Sun, L.; Wang, Y.; Qi, D.; Chen, D.; Liu, H.; Xu, D.; Deng, C.; Li, J. Modeling inhibitory activity of a novel antimicrobial peptide AMPNT-6 from bacillus subtilis against vibrio parahaemolyticus in shrimp under various environmental conditions. Food Control 2013, 33, 249–253. [Google Scholar] [CrossRef]
  43. Adamson, R.H. The acute lethal dose 50 (LD50) of caffeine in albino rats. Regul. Toxicol. Pharmacol. 2016, 80, 274–276. [Google Scholar] [CrossRef] [PubMed]
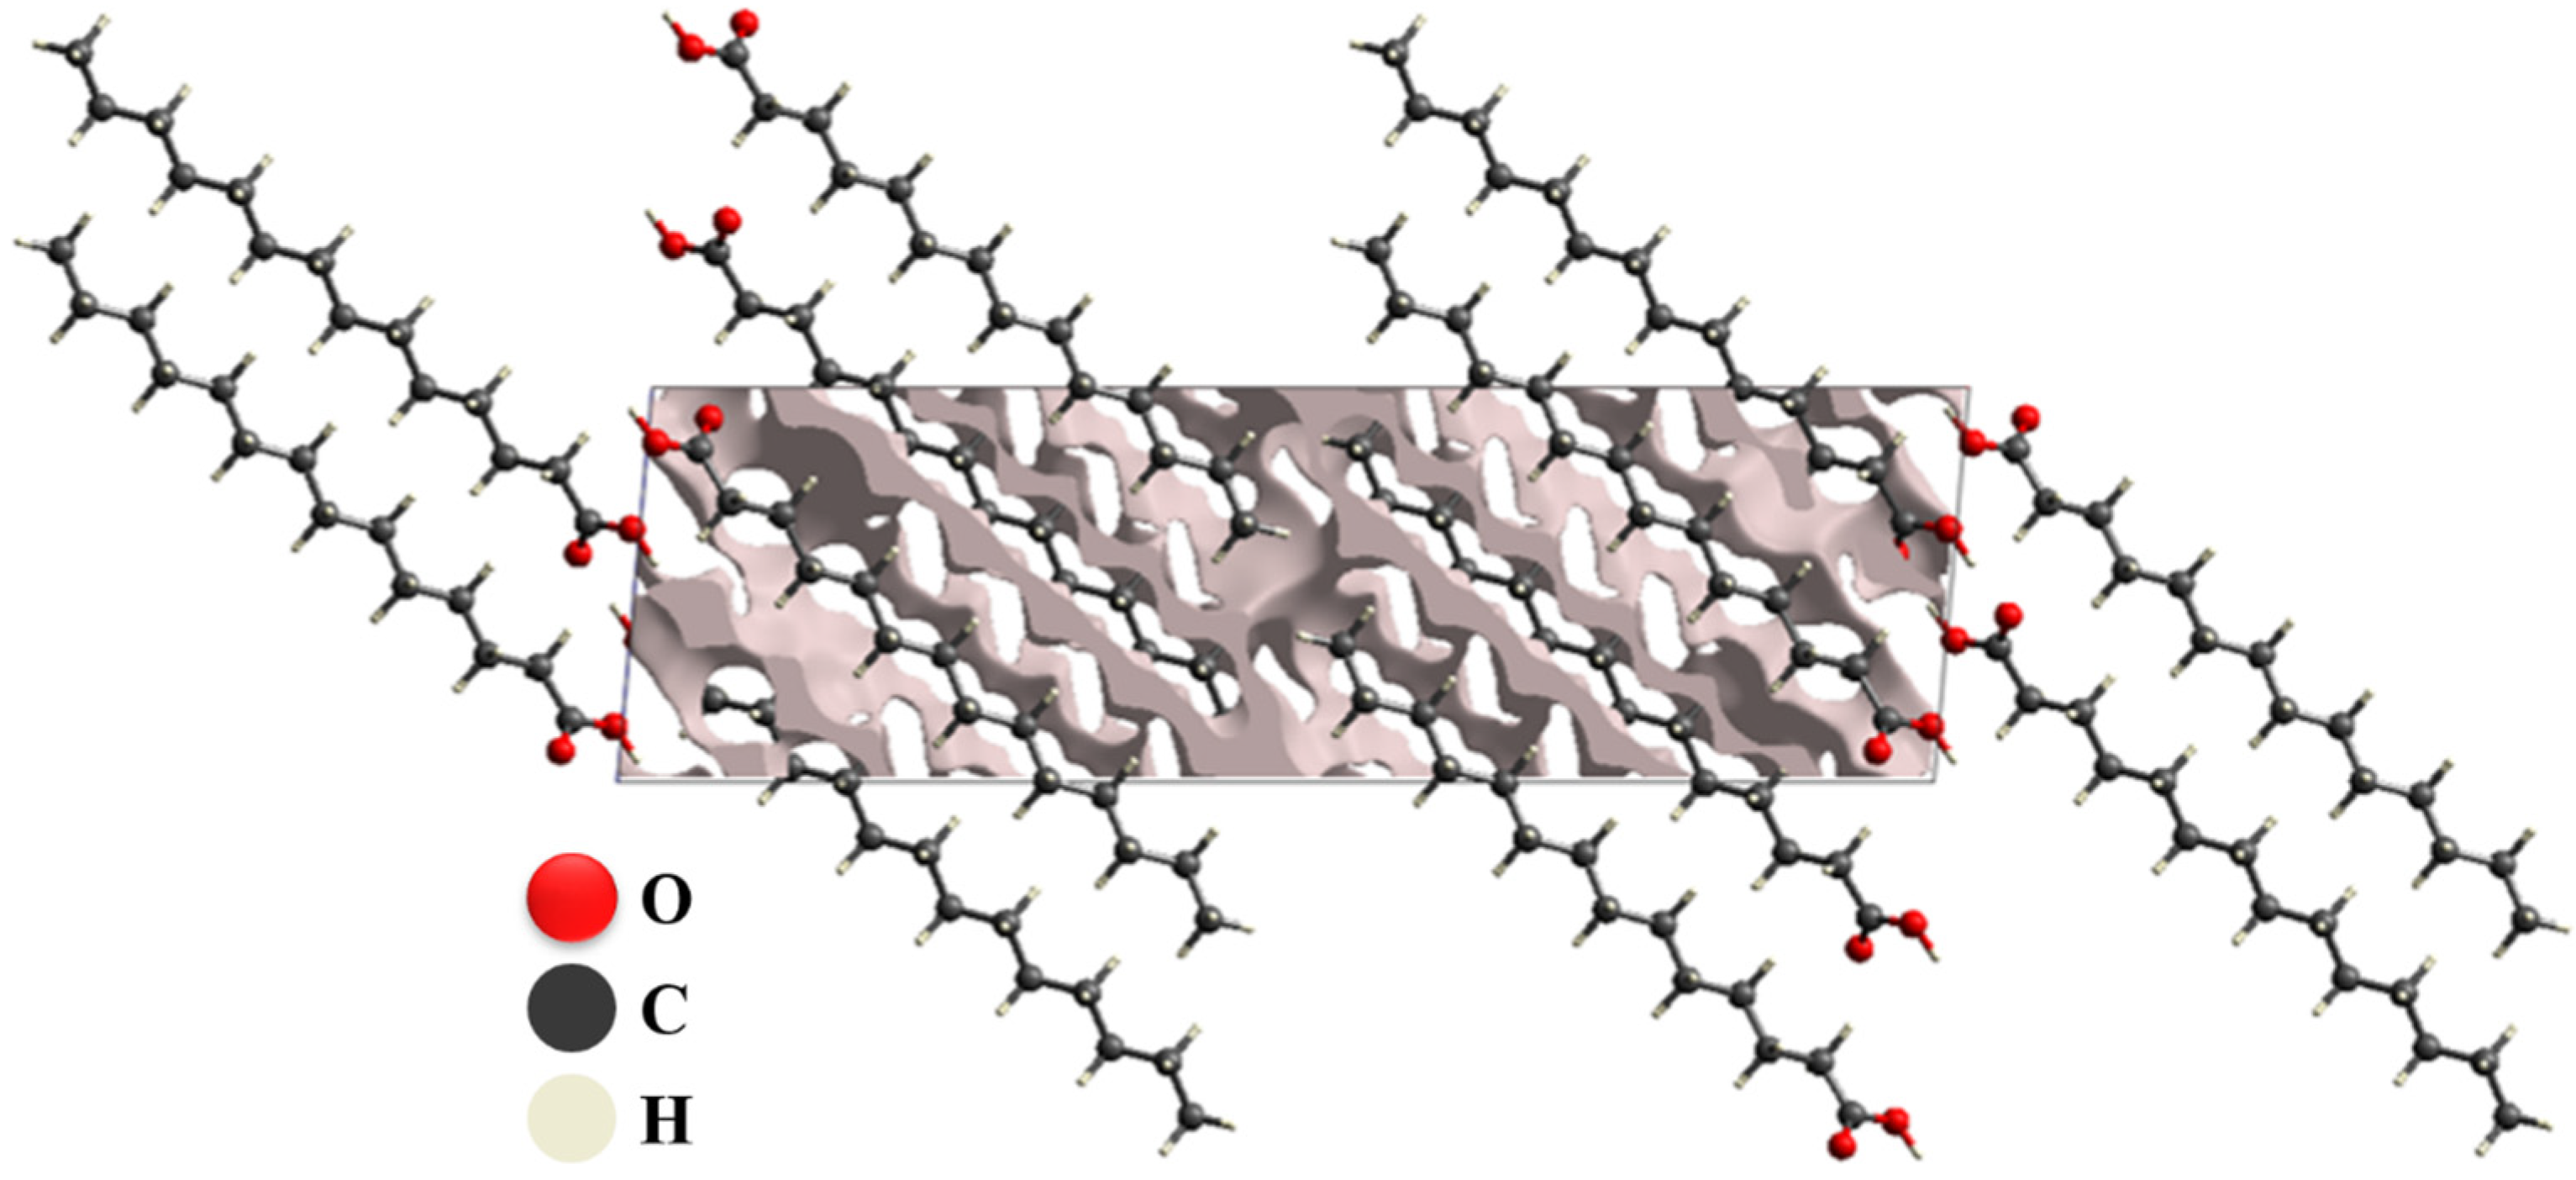
Figure 1. Visualization of void spaces in the MA crystal, generated using CrystalExplorer software (version 17.5).
Processes 13 03481 g001
Figure 2. SEM micrographs of PMA (ac), CoMA (df) and CuMA (gi) samples at magnifications of 2000×, 5000×, and 10,000×.
Processes 13 03481 g002
Figure 3. EDS spectra of the (a) PMA, (b) CoMA, and (c) CuMA samples.
Processes 13 03481 g003
Figure 4. XRPD patterns of (a) PMA, (b) CoMA, and (c) CuMA samples.
Processes 13 03481 g004
Figure 5. Raman spectra of PMA (black line), CoMA (red line), and CuMA (blue line) samples.
Processes 13 03481 g005
Figure 6. Raman spectra of PMA, CoMA, and CuMA in the different ranges: (a) 50–200 cm−1, (b) 550–750 cm−1, (c) 1350–1550 cm−1, and (d) 1600–1700 cm−1. For better interpretation: blue line is CuMA, red line is CoMA, and black line is PMA.
Processes 13 03481 g006
Figure 7. (a) FT-IR spectra of the PMA (black line), CoMA (blue line), and CuMA (green line) samples in the range of 400–1800 cm−1. (b) Enlarged spectral region highlighting the 600–750 cm−1 range. (c) Enlarged spectral region highlighting the 1600–1800 cm−1 range.
Processes 13 03481 g007
Figure 8. TG and DTA curves of (green line) PMA, (red line) CoMA, and (blue line) CuMA.
Processes 13 03481 g008
Figure 9. Mean absorbance values for treatment groups containing X. citri and the culture medium, including the antibiotic (Ant.), culture medium with bacteria (MB), PMA, CoMA, CuMA, and CM. Statistical grouping was determined by Duncan’s test at the 5% significance level. For better understanding: The letter “a” indicates that the samples grouped under that letter do not show a statistically significant difference; that is, their results are similar within the adopted confidence interval (p > 0.05). The letter “b” indicates that the samples in this group also do not differ significantly from each other, but present a statistically significant difference in relation to group “a” (p ≤ 0.05).
Processes 13 03481 g009
Figure 10. Polynomial regression curves showing the relationship between %MIC and concentration for (green line) PMA, (blue line) CuMA, and (red line) CoMA.
Processes 13 03481 g010
Table 1. Lattice parameters of PMA, CoMA, and CuMA samples obtained from Rietveld refinement, compared with literature values [4].
CIF [4]PMACoMACuMA
a (Å)31.628(2)31.701(5)31.647(8)31.570(7)
b (Å)4.966(9)4.957(1)4.932(7)4.939(2)
c (Å)9.492(2)9.470(5)9.385(5)9.456(1)
α°90.000(0)90.000(0)90.000(0)90.000(0)
β°95.105(7)95.347(0)94.284(0)95.422(0)
γ°90.000(0)90.000(0)90.000(0)90.000(0)
Volume (Å)31485.251481.841461.101467.96
Crystallite (nm)675.14312.14165.55307.26
C. StructureMonoclinicMonoclinicMonoclinicMonoclinic
Space groupP21/cP21/cP21/cP21/c
Table 2. Raman and FT-IR vibrational modes. Adapted from [3,31].
Raman-Active Modes IR-Active Modes
(cm−1) Assignments(cm−1) Assignments
50 XX600 XX
161 τ(CCCC)(60)672 sc(C14O2)(61)
167 τ(CCCC)(65)687 sc(C14O2)(61)
181 δ(CCC)(78)720 τ(C13C14O15H)(80)
187 δ(CCC)(78)728 τ(C13C14O15H)(80)
200 XX750 XX
550 XX1600 XX
571 δ(CCC)(64)1678 ν(C=O)(83)
584 δ(CCC)(64)1717 ν(C=O)(83)
654 sc(C14O2)(61)1800 XX
671 τ(HO15C14C13)(80)
742 ρ(CH2)(60)
750 XX
1350 XX
1372 wag(C1H3)(84)
1381 XX
1411 sc(C13H2)(88)
1437 sc(CH2)(69)
1450 sc(CH2)(73)
1462 sc(CH2)(55)
1475 sc(CH2)(64)
1507 sc(CH2)(71)
1550 XX
1600 XX
1626 ν(C=O)(83)
1649 ν(C=O)(83)
1700 XX
ν = stretching; δ = bending; sc = scissoring; ρ = rocking; wag = wagging; τ = torsion.
Table 3. Thermal events observed in the TG and DTA analyses of the samples.
TGDTA
Tonset (K)Tmidset (K)Tendset (K)Weight Loss (mg)T (K)
PMA480.3492.2509.84.00331
CoMA477.4491.3509.83.99
CuMA484.9492.2508.53.92
Table 4. Antimicrobial activity of PMA, CoMA, and CuMA samples against X. citri.
SamplesInhibitory Activity
Concentrations
ABCDEFG
500 µg/mL250 µg/mL125 µg/mL62.5 µg/mL31.3 µg/mL15.6 µg/mL7.8 µg/mL
PMA*********
CoMA*******
CuMA******N
(*) Bactericidal activity (**) Bacteriostatic activity (N) No Inhibitory activity.
Disclaimer/Publisher’s Note: The statements, opinions and data contained in all publications are solely those of the individual author(s) and contributor(s) and not of MDPI and/or the editor(s). MDPI and/or the editor(s) disclaim responsibility for any injury to people or property resulting from any ideas, methods, instructions or products referred to in the content.